Article

Study on the Dynamic Characteristics of a Wind Turbine Tower Based on Wind Tunnel Experiments

1
Guangdong Energy Group Science and Technology Research Institute Co., Ltd., Guangzhou 510630, China
2
State Key Laboratory of Bridge Safety and Resilience, Hunan University, Changsha 410082, China
3
Key Laboratory for Wind and Bridge Engineering, Hunan University, Changsha 410082, China
*
Author to whom correspondence should be addressed.
Energies 2024, 17(16), 4080; https://doi.org/10.3390/en17164080
Submission received: 1 July 2024 / Revised: 3 August 2024 / Accepted: 10 August 2024 / Published: 16 August 2024
(This article belongs to the Section A3: Wind, Wave and Tidal Energy)

Abstract

:
This study aims to comprehensively investigate the dynamic characteristics of the tower of a scaled wind turbine model through wind tunnel tests. A model was scaled from the NREL 5 MW prototype wind turbine with a geometric scale ratio of 1/75, based on the similarity rules in thrust coefficient and dynamic characteristics. A series of wind tunnel tests were carried out on the scaled wind turbine model under different operating conditions and parked conditions with different yaw angles, and the modal parameters of the scaled model were identified by the stochastic subspace identification method and rotor stop tests. It was found that the vibration response of the tower in the fore–aft direction achieved its maximum value when the yaw angle was 90° with feathered blades, while the tower vibration response in the side–side direction was relatively severe with the yaw angle ranging from 10° to 50°. These observations are found to be well aligned with the aerodynamic characteristics of the airfoil. Moreover, the experimental results indicate that the scaled wind turbine model can reflect the vibration responses of its full-scale counterpart in the fore–aft direction. The natural frequencies and mode shapes of the scaled model can be accurately identified by different methods, but the identified damping ratios are relatively scattered.

1. Introduction

To address global warming and mitigate the crisis of non-renewable fossil fuels, there has been an increase in the demand for renewable energy sources. Wind energy, as a clean and renewable energy source, has witnessed a rapid development in the last two decades [1]. The Global Wind Report 2023 [2] released by the Global Wind Energy Council predicts that global onshore wind installations will exceed 100 GW for the first time by 2024. In addition, the twenty-eighth United Nations Climate Change Conference proposed the goal of controlling global warming within 1.5 °C of pre-industrial levels. To achieve this goal, the wind power industry must triple its annual growth, from 117 GW in 2023 to at least 320 GW in 2030. At present, constructing wind turbines with taller towers and larger rotors is recognized as one of the most feasible ways to increase the power output and economic efficiency [3]. However, large wind turbines are more susceptible to severe structural vibrations in harsh weather conditions [4,5,6]. In this situation, it is urgent to accurately obtain the dynamic characteristics of wind turbine structures so that their vibration responses and structural reliability can be better predicted. Dynamic characteristics of wind turbines can be obtained by numerical simulations, scaled-model experiments, and full-scale measurements.
Numerical simulations are effective in obtaining the dynamic responses of wind turbines due to their low cost and repeatability. Numerous studies have investigated wind turbine dynamic responses by both simplified and fully coupled numerical models. In conventional simplified wind turbine models, the blades and nacelles are normally reduced to a concentrated mass at the top of the tower, with the wind loads on the rotor similarly applied to the tower top. For instance, Banerjee et al. [7] developed a simplified model with a lumped mass at the top representing the rotor–nacelle assembly (RNA), and investigated the impact of blade–tower coupling on the structural responses of wind turbines. Zhu et al. [8] conducted a modal analysis for a wind turbine tower, and studied the dynamic responses of this tower under wind and seismic loads using a simplified model. Chen et al. [9] developed an simplification method for operating wind turbines through the linearization of aerodynamic loads on the rotor and lumping the RNA mass at the tower top. They further extended this simplification method by modal reduction techniques to conduct fast-fatigue life predictions of offshore wind turbines [10]. Fully coupled models, on the other hand, consider the geometry, mass, and stiffness of the blades. Many researchers used fully coupled models to study wind turbine dynamic responses. For example, Yan et al. [11] established a detailed numerical model to study the dynamic responses and buckling of a 10 MW monopile wind turbine. Shi et al. [12] used Abaqus to create a complex 3D finite element model of the NREL 5 MW wind turbine, incorporating rotor rotation, drivetrain, pitch, servo control, and other factors, to analyze the dynamic responses under combined wind and wave loads as well as seismic loads. Han et al. [13], based on the beam theory, coupled an unsteady aerodynamic model with a wind turbine dynamic model to calculate the dynamic responses of wind turbines under typhoon conditions. While numerical simulation methods, based on certain assumptions and simplifications, can quickly compute structural responses under various conditions, the simulated results may differ from those in real-world scenarios. Therefore, numerical simulation results typically require validation through on-site measurements or scaled model experiments to ensure their reliability.
Wind tunnel experiments are essential for studying wind-induced instability, dynamic response characteristics and the aeroelastic coupling effects of wind turbines [14,15,16]. Many scholars have analyzed the aerodynamic performance and dynamic responses of individual components of wind turbines through wind tunnel experiments. Noda and Ishihara [17] conducted wind tunnel experiments to measure the average wind force and peak pressure acting on the nacelles of wind turbines. Lu et al. [18] developed a scaled aeroelastic model of a wind turbine blade and used it to study the dynamic performance and flutter blade using wind tunnel experiments. Similarly, Gao et al. [19] conducted wind tunnel experiments to investigate the aeroelastic responses of a flexible wind turbine blade under different wind conditions. Mu et al. [20] utilized a recirculating-type icing wind tunnel to investigate the dynamic response characteristics of wind turbine blades under surface icing conditions. Fontecha et al. [21] utilized wind tunnel experiments to determine aerodynamic damping in the downwind direction of a wind turbine tower, taking into account Reynolds number effects, and quantified their impact on wind turbine fatigue life. Kim [22] investigated the impact of polygonal tower cross-sections on the aeroelastic and aerodynamic characteristics of wind turbines through a series of wind tunnel experiments. In practice, the components of the whole wind turbine structure are coupled with each other. To study the overall characteristics of wind turbines, wind tunnel tests of the whole scaled wind turbine model should be conducted.
To comprehensively consider the rotor rotation of a wind turbine in operation and the coupling effects between the blades and the tower, wind tunnel tests using scaled models of entire wind turbines are widely used to test the vibration responses of wind turbines. Bottasso et al. [23] designed a novel wind turbine aeroelastically scaled model, which is characterized by active individual pitch and torque control. The model has been used for conducting a few non-standard experiments, considering the effect of open- and closed-loop control. Martin et al. [24] designed a scaled floating wind turbine model with a geometric scale ratio of 1:50, and experimentally studied the overall motion responses of offshore floating wind turbines. Yang et al. [25] designed a geometrically similar and thrust-optimized scaled wind turbine model, investigating the wake characteristics of the scaled wind turbine model through wind tunnel experiments. Abdelkader et al. [26] conducted boundary-layer wind tunnel tests on a scaled-down model of the 5 MW wind turbine and examined the wind loads experienced by the turbine in shutdown conditions. They compared the wind tunnel test results of the tower base loads with calculations from FAST. Tian et al. [27] conducted a comprehensive experimental study in an atmospheric boundary-layer wind tunnel to analyze the dynamic wind load characteristics acting on a wind turbine model. Verelst et al. [28] investigated the dynamic response characteristics of the wind turbine free-yawing state through wind tunnel experiments. Frederik et al. [29] studied the potential of a dynamic induction control approach through the wind tunnel experiments of a scaled wind turbine model. Nanos et al. [30] designed a scaled wind turbine model to experimentally investigate wake and wind farm control in a boundary-layer wind tunnel, and compared the predicted wake characteristics of a numerical model with the results from the wind tunnel experiment. To date, the wind tunnel experiments on the scaled models of wind turbines have only focused on the analysis of wind turbines in a specific operating condition, without systematically analyzing the dynamic responses and dynamic characteristics of scaled wind turbine models under different operating conditions.
Investigating wind turbine dynamic characteristics using full-scale tests is challenging, partly due to the uncontrollable environment and difficulties of collecting monitoring data. By conducting wind tunnel experiments, the dynamic characteristics of scaled wind turbine models can be studied in a controlled condition. In this study, a comprehensive investigation of the dynamic responses and dynamic characteristics of the tower of a scaled wind turbine model will be performed, using detailed data analysis and modal identification. This paper is structured as follows: Section 2 describes the design and fabrication processes of the scaled wind turbine model with a geometric scale ratio of 1/75. The similarity of the basic dynamic characteristics and aerodynamic performance are validated. Section 3 analyzes the dynamic response characteristics of the wind turbine scaled model under various operating conditions based on wind tunnel experiments. Additionally, the dynamic responses of the scaled model are compared with the simulated responses of the NREL 5 MW prototype wind turbine using OpenFAST [31]. Section 4 conducts an analysis of the modal parameter results identified by the stochastic subspace identification (SSI) method and the “rotor stop” test. Section 5 concludes this paper with several key points.

2. Design of Scaled Wind Turbine Model

2.1. Similarity Criteria
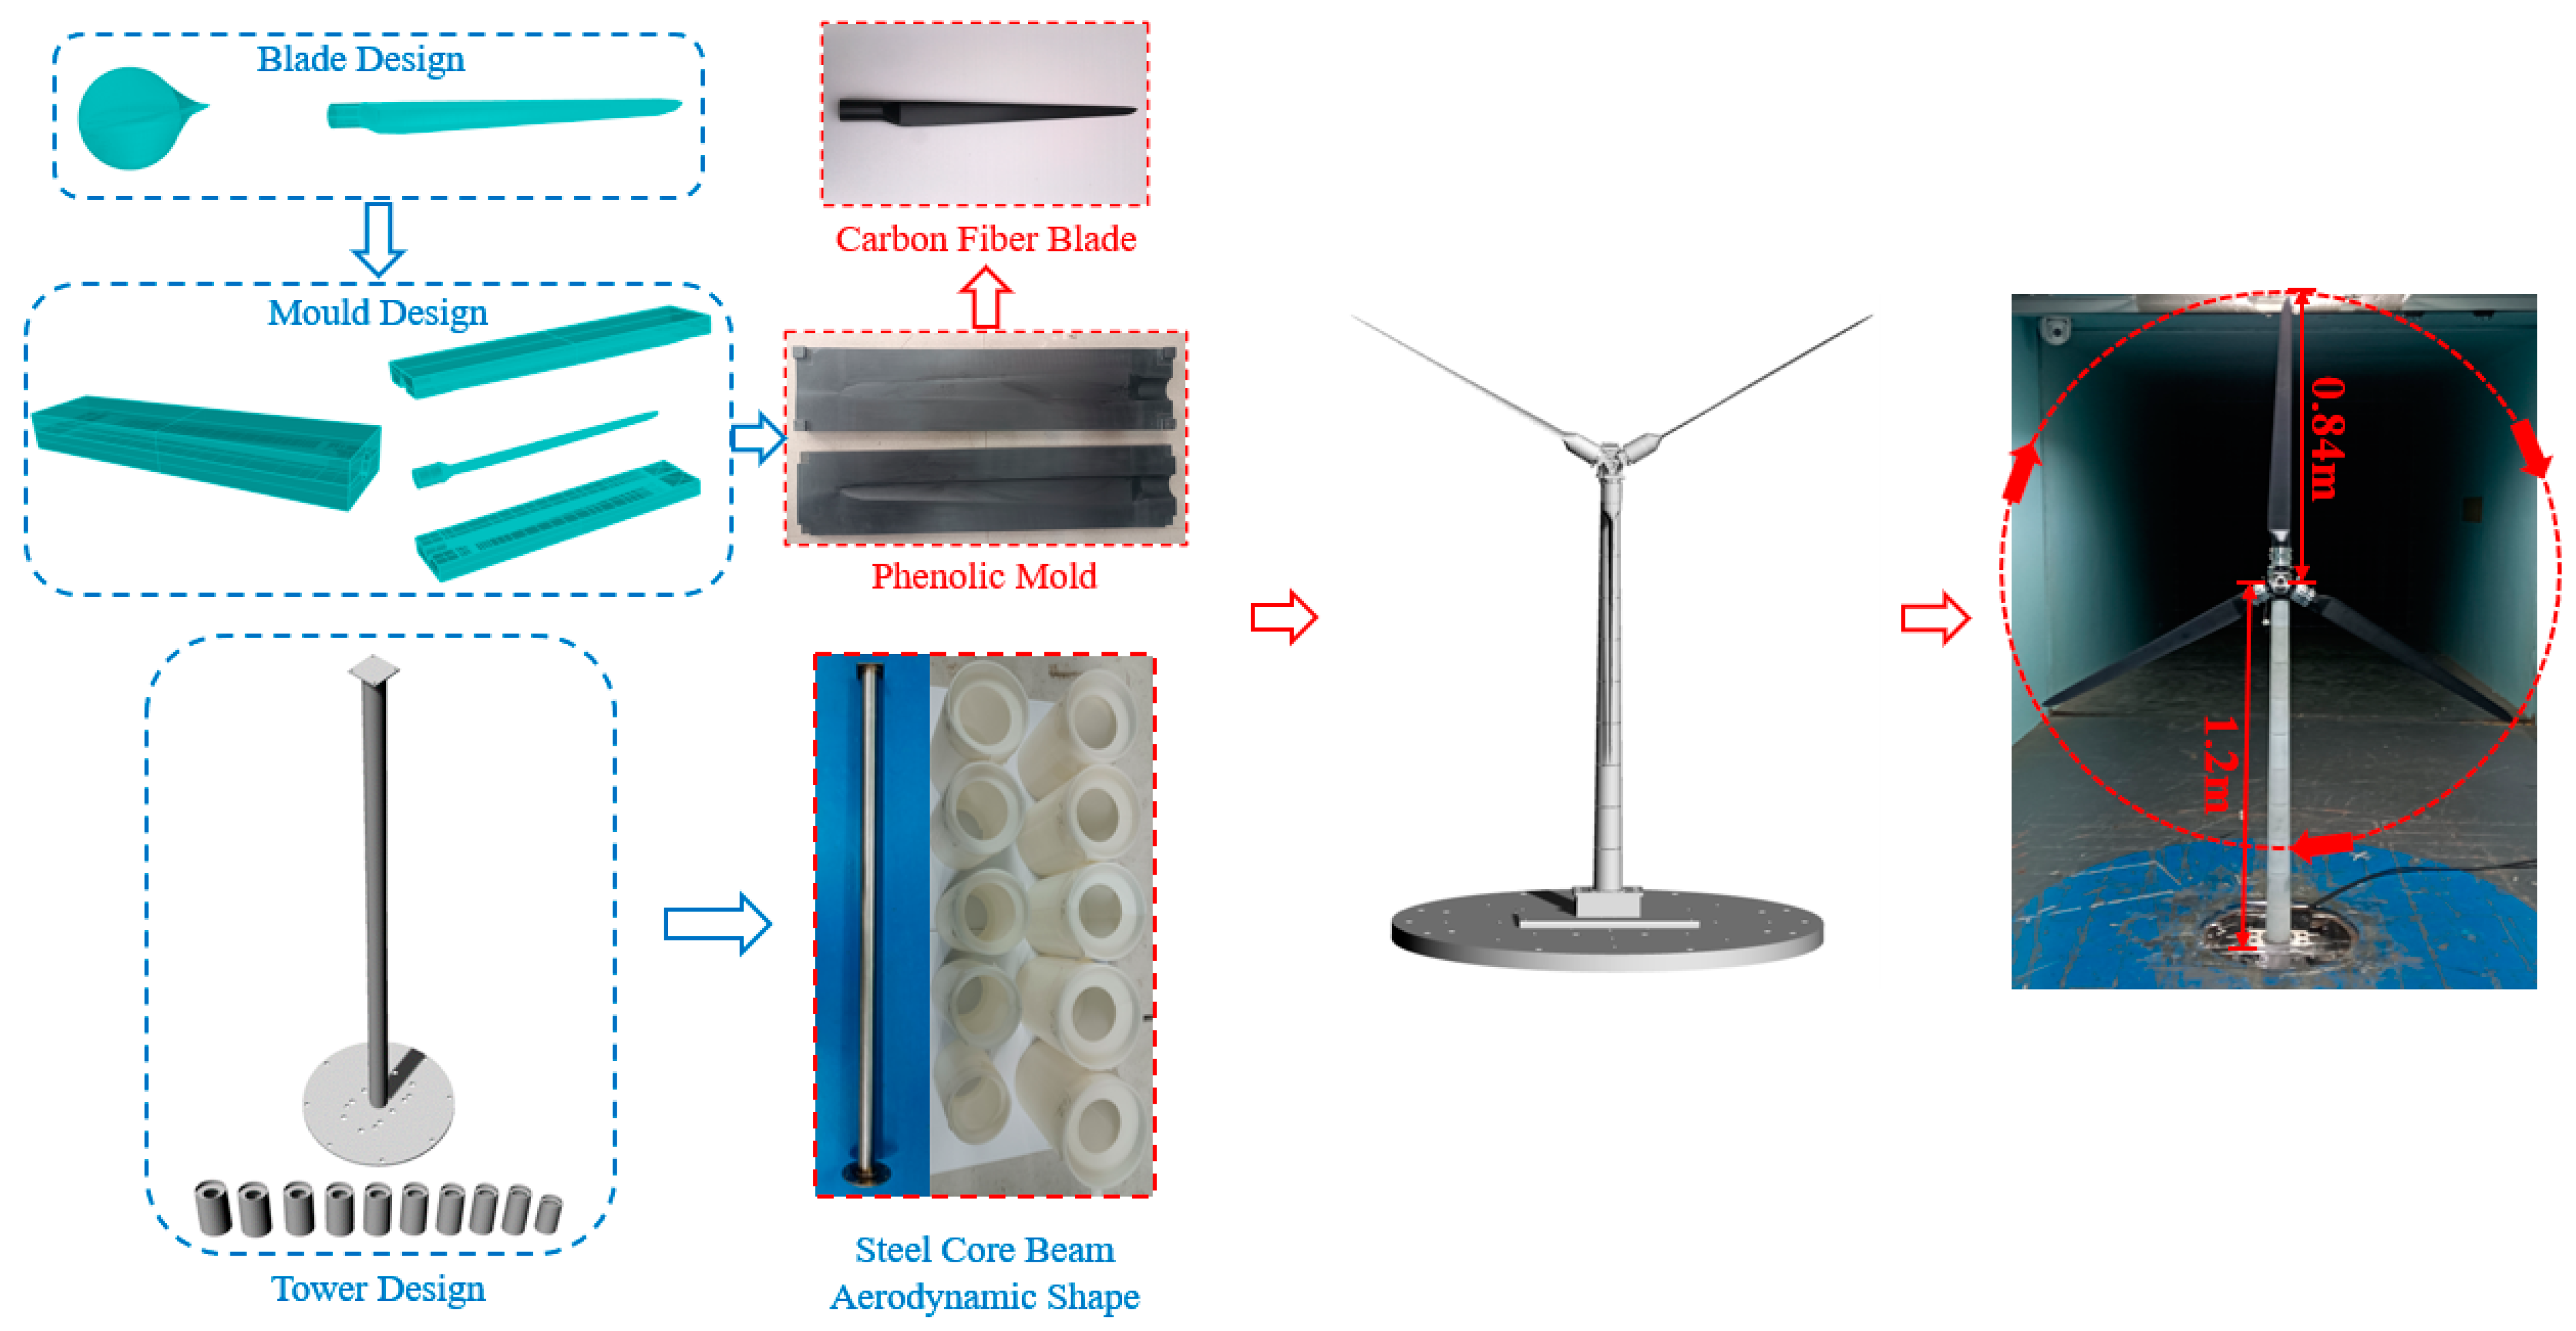
The determination of design parameters of the scaled model for wind tunnel tests typically involves a consideration of several dimensionless parameters, such as the Reynolds number, Froude number, Strouhal number, Cauchy number, etc. These parameters can be determined based on dimensional analysis according to the geometric scale ratio. However, it is challenging for the scaled model to simultaneously satisfy all similarity rules [23]. In this study, the scaled model is based on the structural and aerodynamic properties of the NREL 5 MW onshore wind turbine. Considering the minor influence of gravity on the aerodynamic performance of the scaled wind turbine model, the Froude similarity rule is not strictly satisfied during its design. Among them, the Reynolds number and Strouhal number are defined as:
R e = V 0 D μ
S t = f D V 0
where D is the characteristic length, V 0 is the flow velocity, μ is the viscosity of the fluid, and f is the characteristic frequency.
Additionally, maintaining the same tip speed ratio (TSR) ensures the similarity rule associated with the Strouhal number [32] is met.
T S R = ω R V 0
where V 0 is the wind speed, ω is the rotation angular velocity, and R is the radius of the rotor of a wind turbine.
To ensure that the blockage ratio of the scaled wind turbine model in the wind tunnel test is less than 10% [33], the tests for the wind turbine in the parked condition were conducted in the first test section of the HD-2 wind tunnel laboratory at Hunan University. This test section measures 17 m in length, 3 m in width, and 2.5 m in height. The tests for the wind turbine in the operating condition were carried out in the second test section, which measures 15 m in length, 5.5 m in width, and 4.4 m in height, as shown in Figure 1. Based on the cross-sectional dimensions of the wind tunnel test section, the geometric scale ratio of the scaled wind turbine model in this paper is chosen as 1/n, n = 75. The wind speed ratio for the wind tunnel test is selected as 1/m, m = 3.5. Other physical quantities are determined through dimensional analysis based on the geometric scale ratio and wind speed ratio. Table 1 presents some of the design parameters of the scaled wind turbine model.
In operational conditions, the aerodynamic performance of wind turbine blades is closely related to the Reynolds number. Due to constraints typically imposed by scale ratios in wind tunnel experiments, the Reynolds numbers of most scaled wind turbine models are generally Re ≈ 104. Research by McTavish et al. [34] has shown that, at Reynolds numbers of around Re ≈ 104, the thrust coefficient of a geometrically-scaled rotor may drop, and the lift and drag coefficients and stall characteristics of thick airfoils in wind turbines are highly sensitive. However, thick airfoils in geometrically scaled models perform poorly under such low Reynolds number flow conditions, leading to decreased aerodynamic performance [35]. To address the scale effect caused by Reynolds number differences, Martin et al. [24] suggested that ensuring similarity in thrust coefficients between the scaled model and the prototype wind turbine is the most effective method for reducing the impact of Reynolds number differences. Ensuring geometric similarity in terms of blade chord length and twist angle [36], along with selecting low Reynolds number airfoils [37,38,39,40] for the redesigned scaled blades, can guarantee similarity in thrust coefficients. The widespread adoption of this method has significantly promoted the development of wind tunnel testing techniques [32]. The low-Reynolds airfoil could provide a better aerodynamic performance under low-Reynolds conditions. In this paper, the SD7032 airfoil was selected to design the thrust-matched blade model, which was same as the design of the blade model in the wind tunnel test at Politecnico di Milano [40]. In addition, as mentioned before, considering the uncontrollability of blade stiffness, standard airfoils were used to design the blade model from blade root to tip, neglecting the stiffness requirements and only ensuring the aerodynamic thrust matched the prototype.

2.2. Design Process

The selection of the materials of the blade scale model and the mold are the key to ensure the aerodynamic performance of the blade and the similarity of mass and stiffness. In this study, lightweight and high-strength carbon fiber cloth epoxy resin composites were chosen for fabricating the scaled blade model, with phenolic resin selected for mold production. To determine the number of layers of carbon fiber cloth during the fabrication of the scaled blade model, this study utilized ANSYS to establish a blade scaled model with its root fixed. Shell91 was employed to simulate the carbon fiber cloth epoxy resin composite material, ensuring consistent thickness throughout the entire scaled blade model. Along the length direction of the blade, 50 sections were equidistantly divided, and each section was divided into 78 subsections along the circumferential direction. The density of the carbon fiber cloth epoxy resin composite material was taken as 1.8 × 10⁻³ g/mm3, with an elastic modulus of 50 GPa and a Poisson’s ratio of 0.3. Iterative modal analysis of the scaled blade model was conducted using ANSYS, from which the optimal number of layers for the carbon fiber cloth was found to be two. At this configuration, the calculated mass of the scaled blade model was 160 g, with a first flapwise natural frequency of 16.37 Hz. The ANSYS model and the first flapwise mode shape of the scaled blade model are depicted in Figure 2. He et al. [32] suggested that the rotation of scaled wind turbine model blades can be realized by using servo motors with an active control mode to drive the blades. This allows for the precise adjustment of the tip speed ratio and ensures flow similarity. In this study, a servo motor with a rated output power of 200 W and a 1:5 reducer was employed as the driving device. Moreover, a pitch angle adjuster was employed to achieve pitch variation and yaw control of the wind turbine. The tower of the wind turbine aeroelastic scaled model was composed of a seamless stainless-steel core beam and 3D-printed aerodynamic shape. The design and fabrication processes of the wind turbine aeroelastic scaled model are illustrated in Figure 3.

2.3. Measurement System Configuration

To determine the vibration response of the scaled wind turbine model under different conditions, accelerometers were placed in the fore–aft (FA) and side–side (SS) directions at four elevations on the tower of the scaled model to measure tower dynamic responses. Additionally, laser displacement gauges were installed at the top of the tower in the FA and SS directions to measure the displacement response. The wind speed for each test condition was measured by an anemometer fixed 5 m in front of the model, as shown in Figure 4.

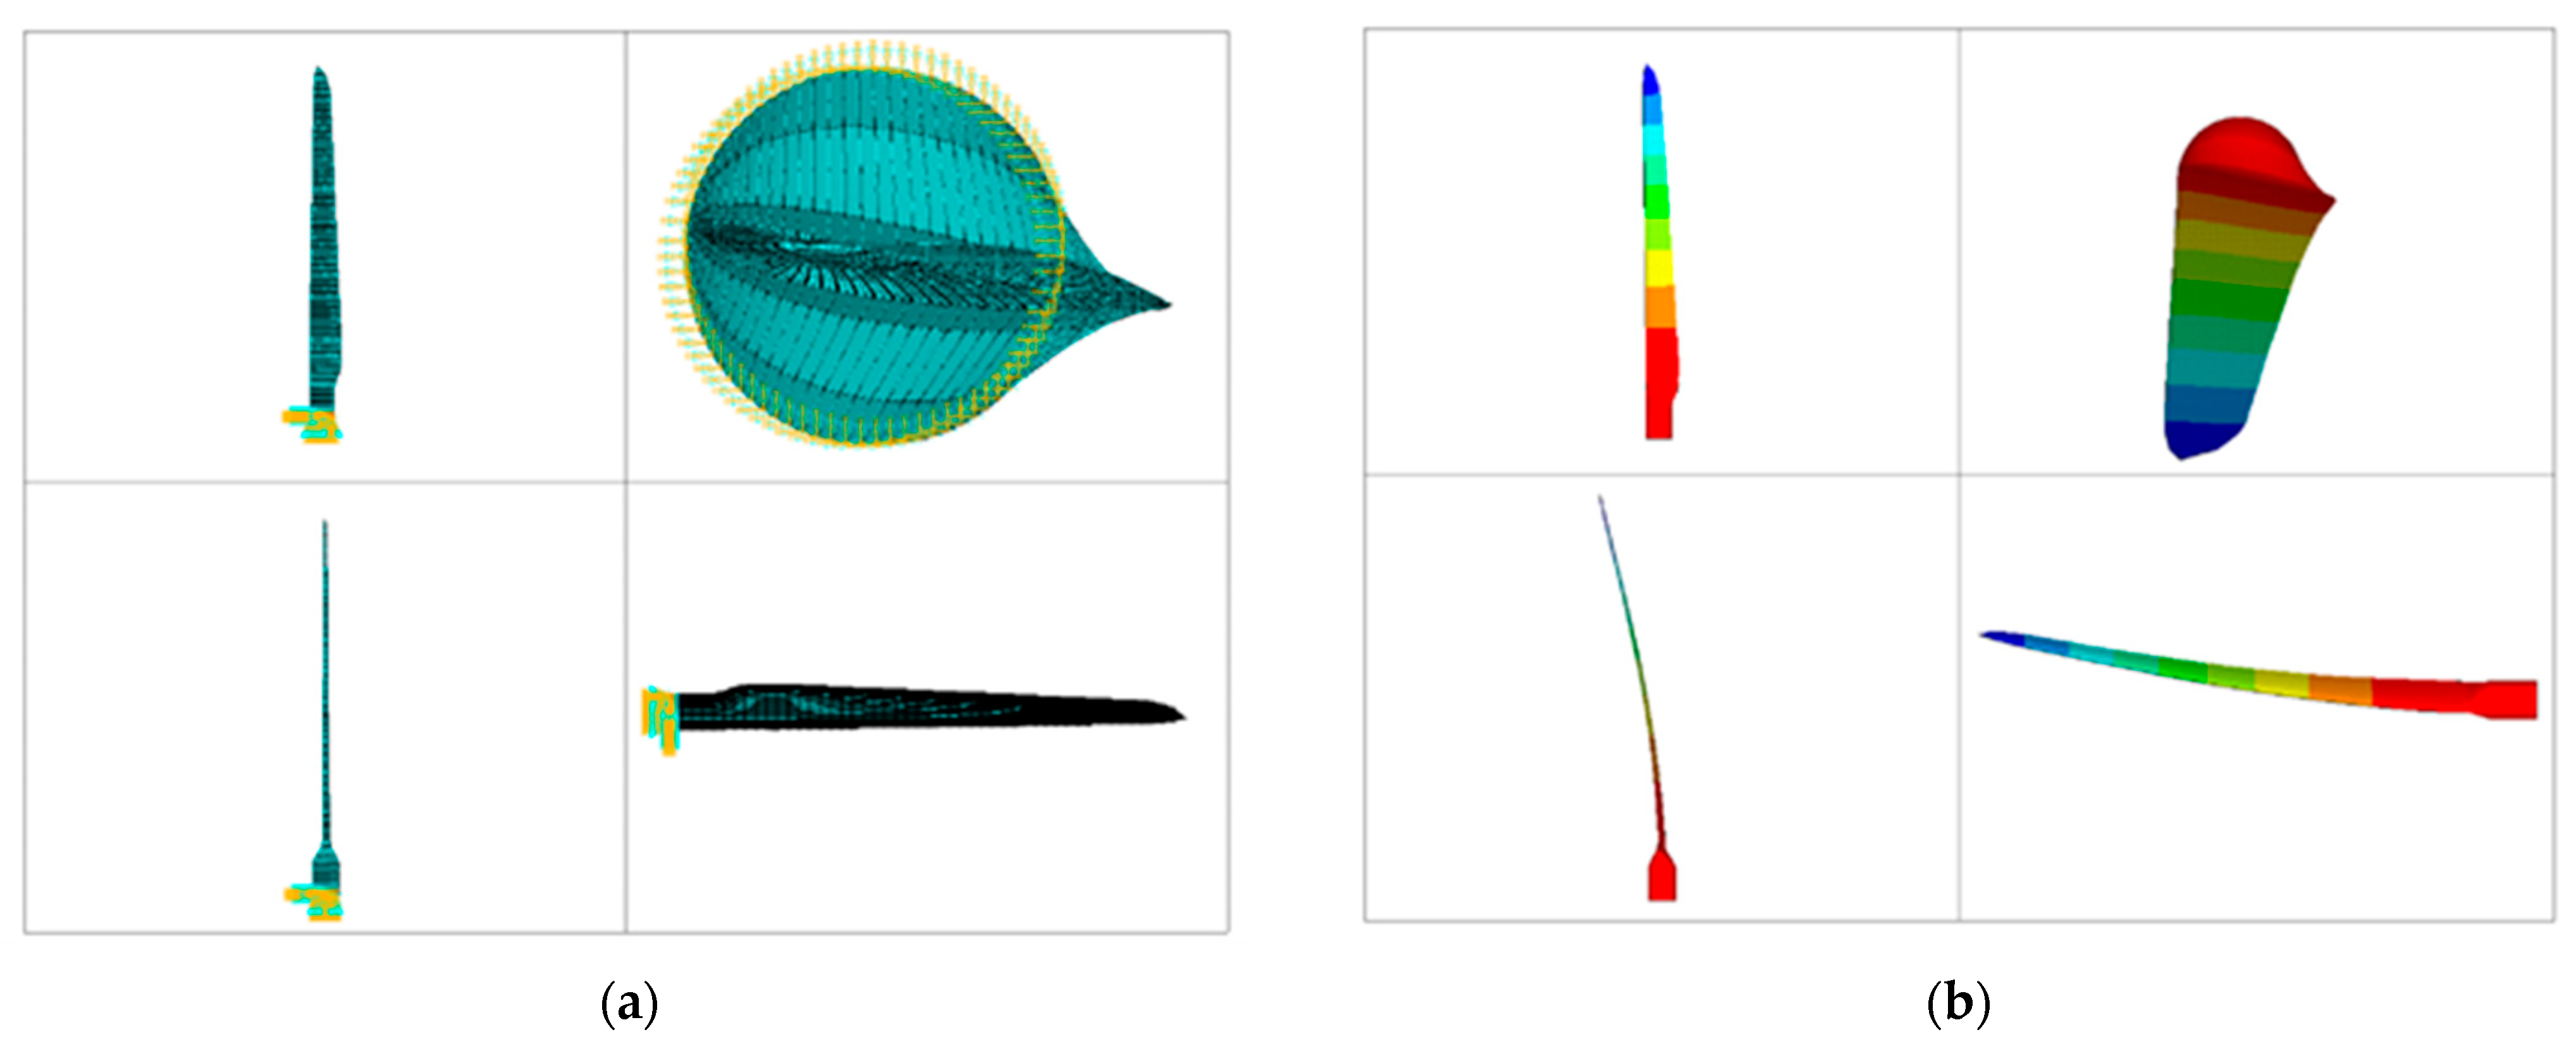
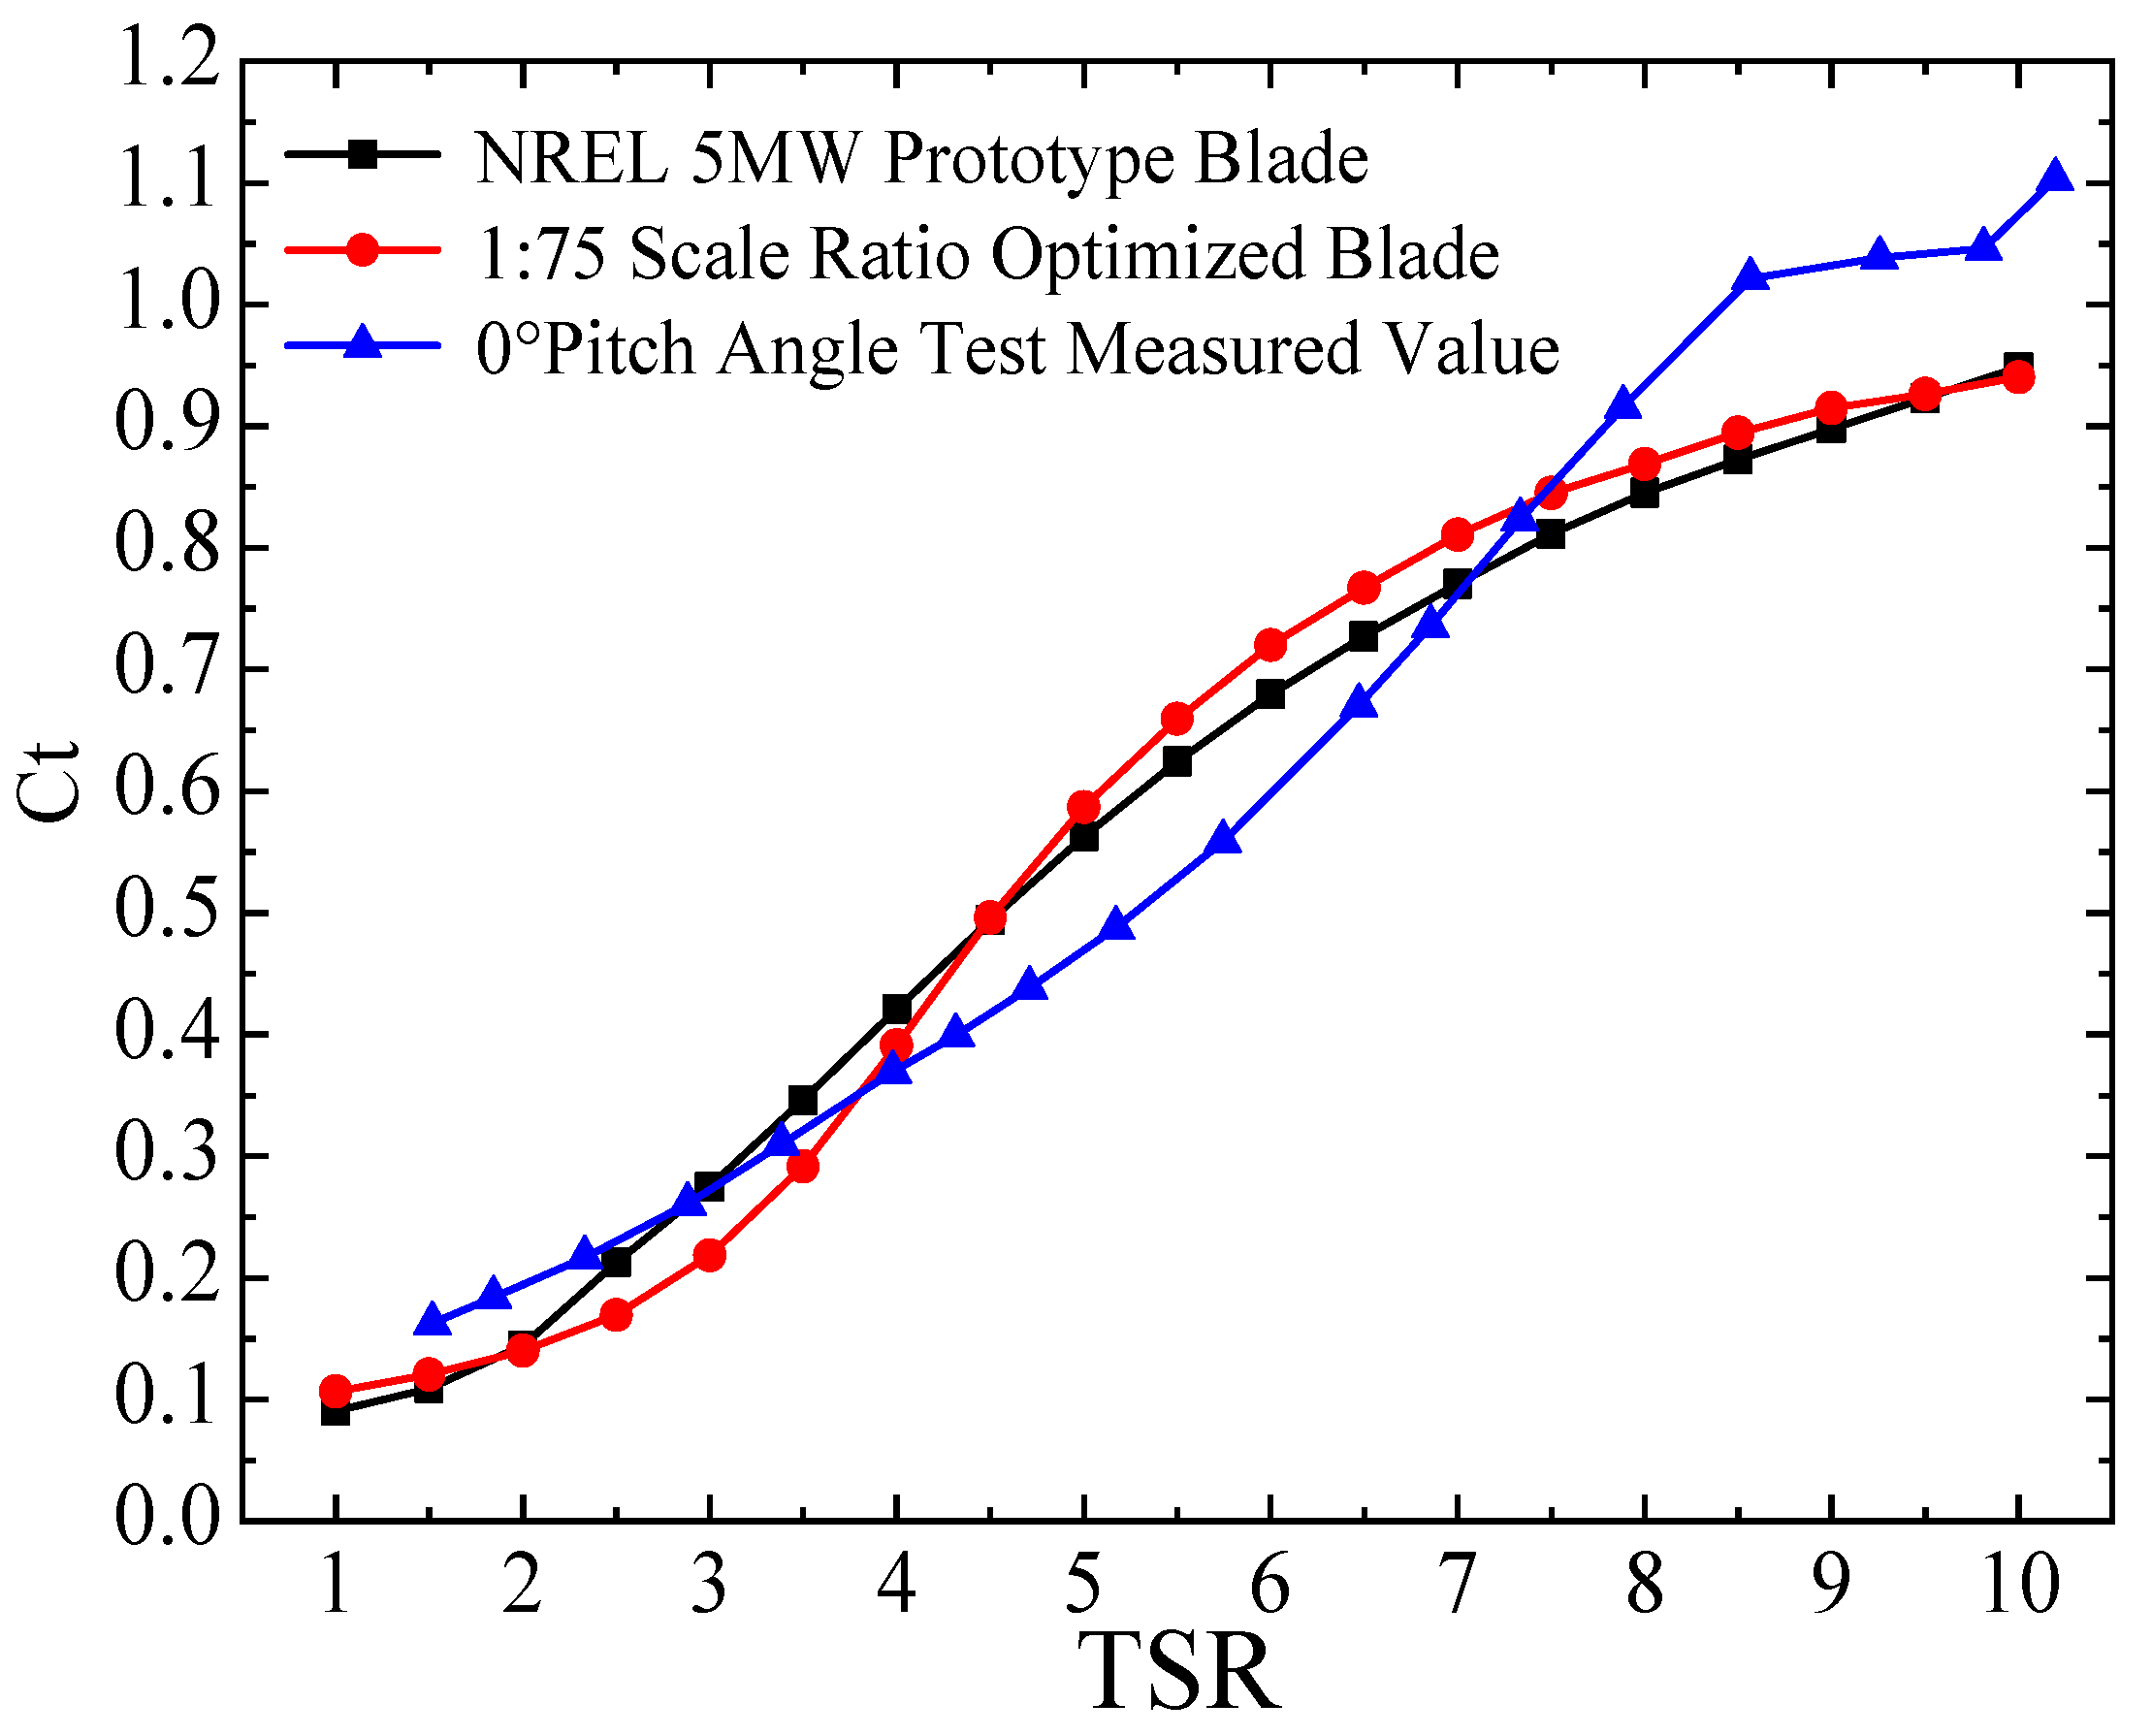
2.4. Dynamic and Aerodynamic Performance Verification

To validate the rationality of the aeroelastic scaled wind turbine model designed in this paper, the dynamic characteristics were first tested. When the scaled wind turbine model was not under the wind action, impact hammers were used to excite the top of the tower in both the FA and SS directions separately. After the excitation, the acceleration free decay response signals were collected. Five free decay excitation tests were conducted for each direction, and the average frequency and damping ratio of the identified values were calculated. The time histories of the free decay acceleration responses at the top of the scaled wind turbine model are shown in Figure 5a. The measured first natural frequency of the scaled wind turbine model in the FA direction is 6.5 Hz, with an error of 6% compared to the design value, and the measured structural damping ratio is 0.83%. In the SS direction, the first natural frequency is 7.2 Hz, with an error of 7% compared to the design value, and the structural damping ratio is 0.99%. The free decay response of the blade flapwise direction was also measured by accelerometers with the blade root fixed, as shown in Figure 5b. The natural frequency of first flapwise mode of the blade scaled model is 15.11 Hz, with an error of 3.7% compared to the design value. From the free decay acceleration responses at different measurement points, the normalized mode shapes were identified and compared to the analytical mode shapes, as shown in Figure 6. The mode shape for the first tower FA bending mode of the scaled model agrees well with that of the tower of the NREL 5 MW prototype wind turbine. These test results demonstrate that the scaled wind turbine model designed and fabricated in this study meets the requirements for dynamic similarity in wind tunnel experiments.
To verify the aerodynamic performance of the scaled wind turbine model, a six-component force balance with a measurement value up to 500 N was used to measure the thrust. The force balance was fixed at the bottom of the scaled wind turbine model. When the wind turbine rotor is rotating and at a medium wind speed, the wind load acting on the tower only accounts for a small proportion of the total wind loads on the scaled wind turbine model. Thus, the thrust measured by the force balance can be approximately considered equal to the thrust experienced by the rotor. At a blade pitch angle of 0°, the thrust coefficients measured in wind tunnel tests and calculated by Qblade v0.963 software [41] for the NREL 5 MW prototype and scaled model are shown in Figure 7. The thrust coefficient results from wind tunnel tests are close to those from the simulations, indicating that the aerodynamic performance of the scaled wind turbine model in this study is similar to that of the prototype wind turbine.

3. Analysis of Dynamic Responses under Operational and Parked Conditions

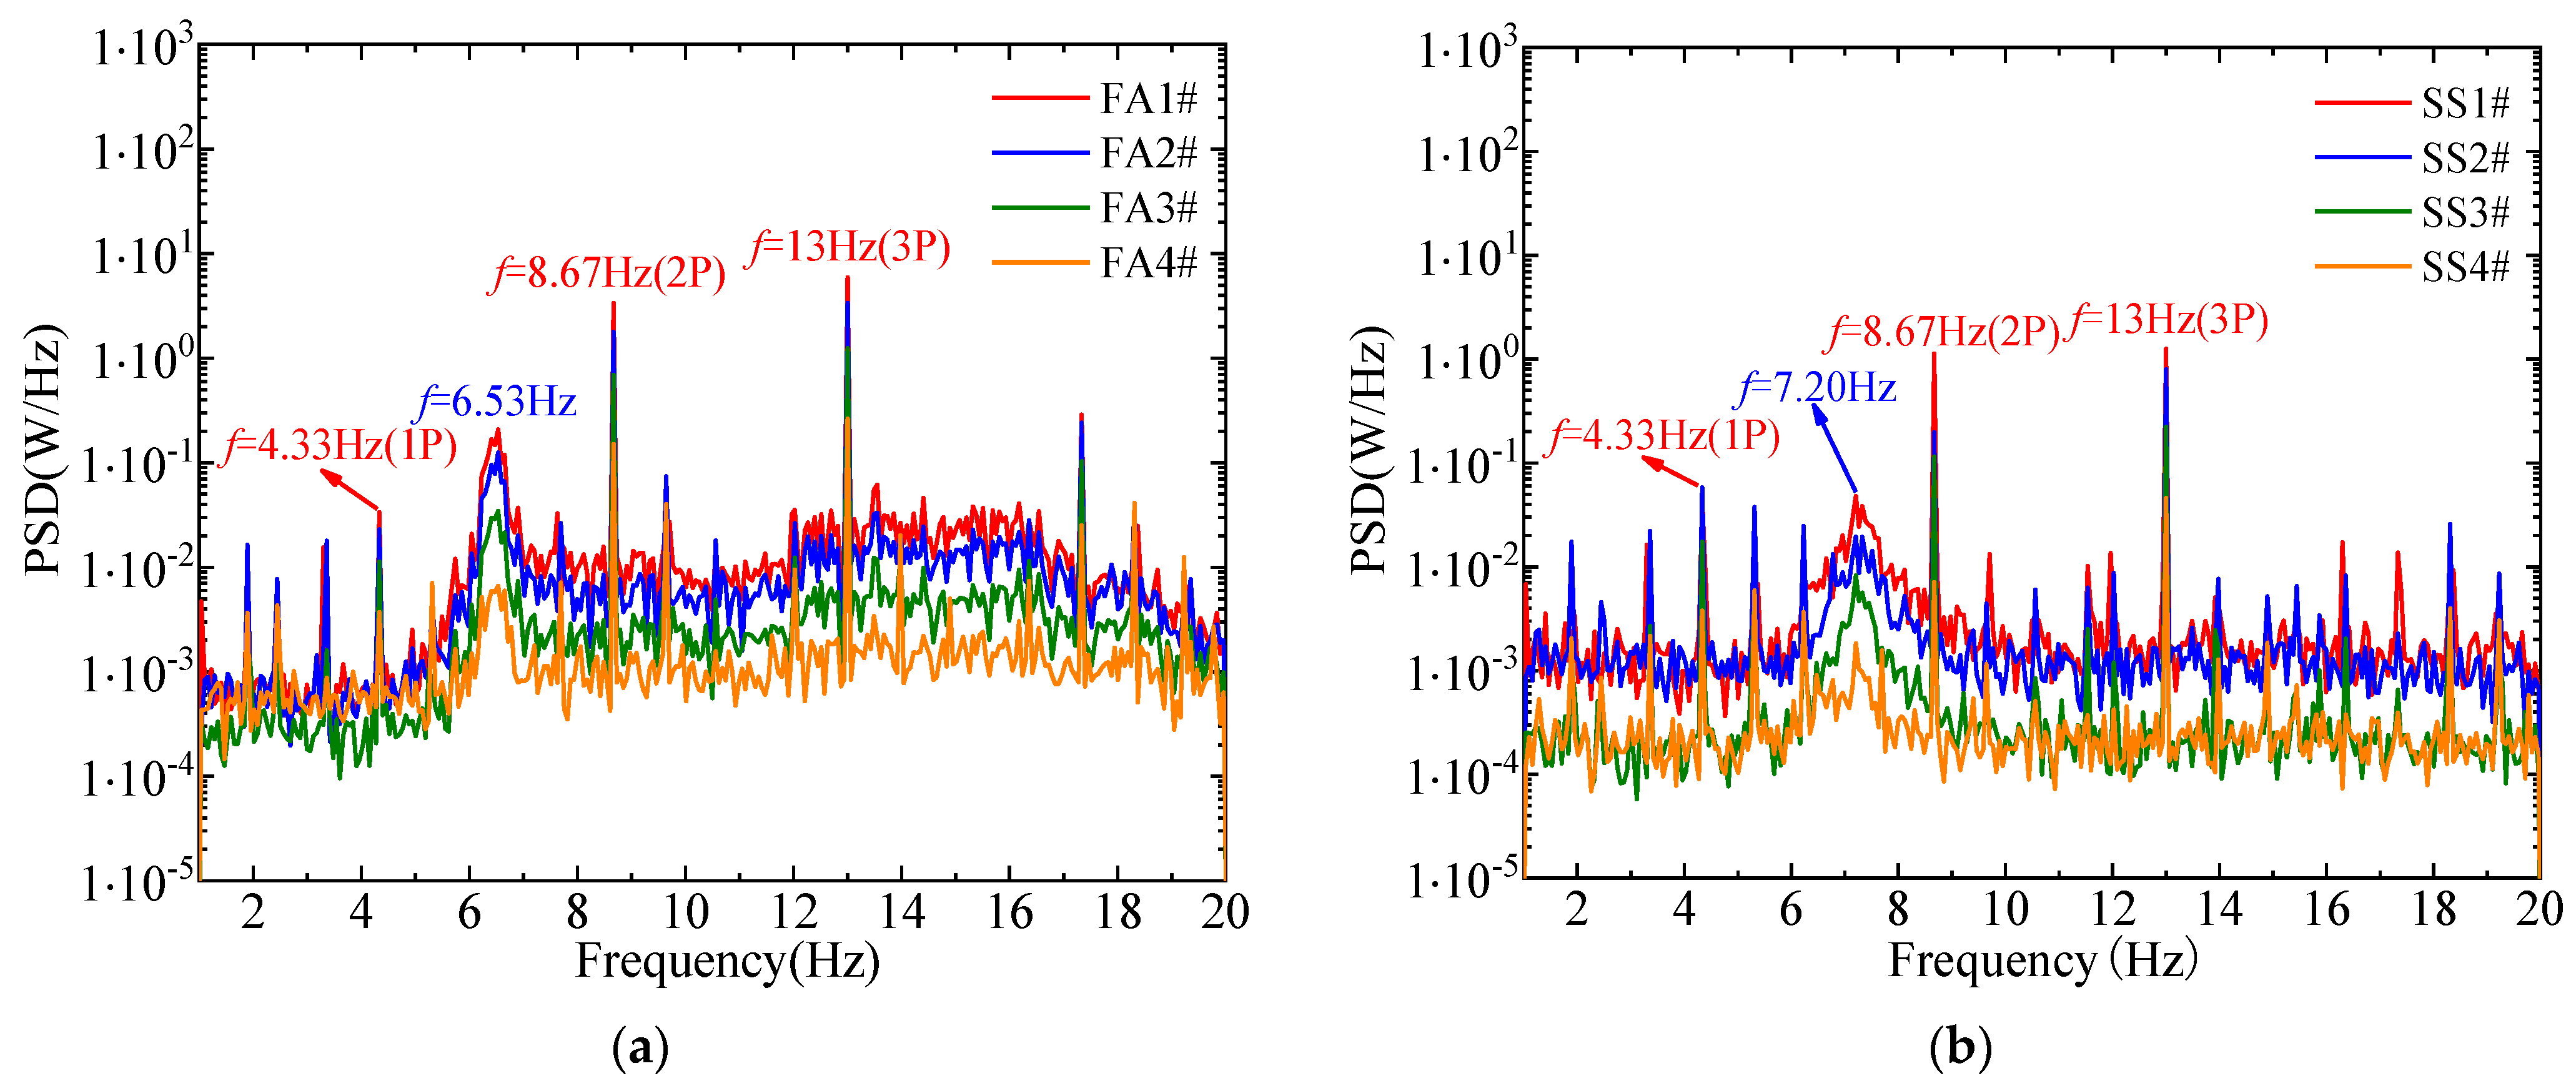
3.1. Dynamic Responses under Operating Conditions

The wind tunnel test conditions for the operational state of the scaled wind turbine model were determined based on similarity relationships, as shown in Table 2. According to the geometric similarity, the scaled model rotor needs to rotate much faster than the prototype to maintain the frequency ratio. The high rotor rotation speed of the scaled model may cause a significant blockage effect if the wind tunnel section is not large enough. To avoid the influence of wind tunnel blockage on the test results, the experiments were conducted in the second test section of the HD-2 wind tunnel laboratory at Hunan University. Throughout the experiments, the pitch angle was kept constant at 0°. For horizontal-axis three-blade wind turbines during operation, the rotation of the rotor induces harmonic excitations, such as 1P and 3P frequencies, on the tower. The rotor rotation speed was set at 260 rpm, and the mean wind speed was set at 3.45 m/s, corresponding to the rated operating condition of the NREL 5 MW wind turbine prototype. At this condition, the rotational frequency of the rotor was 4.33 Hz. The acceleration responses at the top of the tower in the FA and SS directions are depicted in Figure 8. Power spectral analysis of the acceleration responses at various points on the tower is illustrated in Figure 9. It is evident from the time domain analysis that the acceleration amplitude in the FA direction at the top of the tower is much greater than that in the SS direction. The power spectral analysis reveals that the rotation of the wind turbine rotor induces harmonic excitations at multiples of the rotor’s rotational frequency (1P, 2P, 3P, etc.). Thus, it can be inferred that this scaled model effectively captures the typical dynamic characteristics of wind turbine tower vibrations in the operational condition, including the presence of harmonics induced by rotor rotation. The root mean square values of the acceleration responses at various measurement points of the scaled wind turbine model under all operating conditions are compared, as shown in Figure 10. In this study, it can be observed that the rotational motion of the wind turbine rotor induces significant 2P harmonic excitations. This phenomenon is particularly evident when the rotor speed is 190 rpm, where a 2P harmonic resonance at the frequency of 6.33 Hz occurs near the first natural frequency in the FA direction, resulting in an increase in vibration amplitude. Similarly, at a rotor speed of 220 rpm, the 2P harmonic resonance at the frequency of 7.33 Hz occurs near the first natural frequency in the SS direction, leading to a similar increase in vibration amplitude due to resonance.

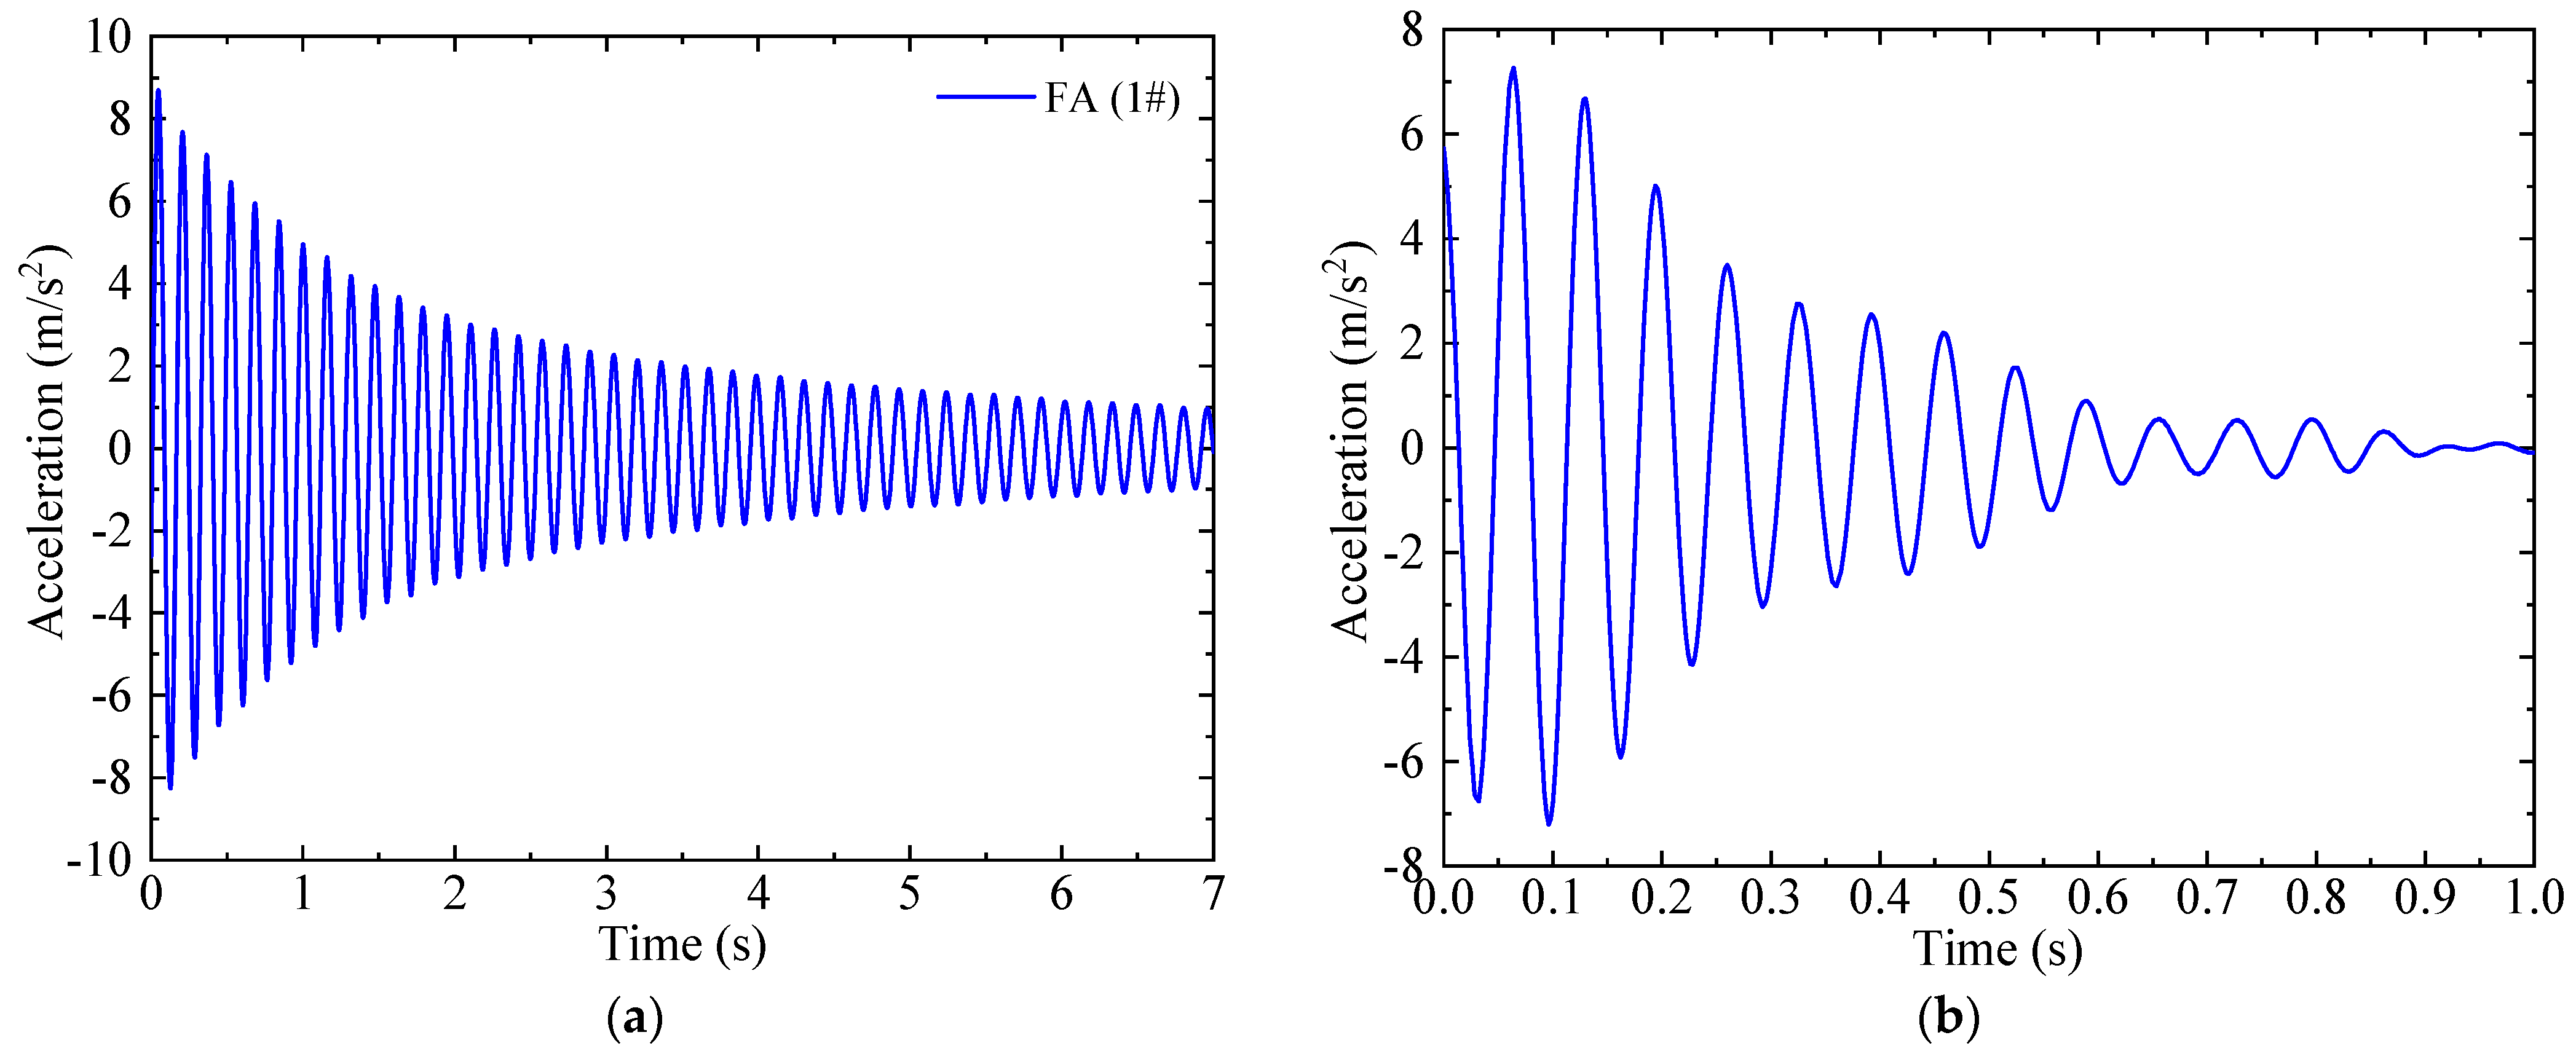
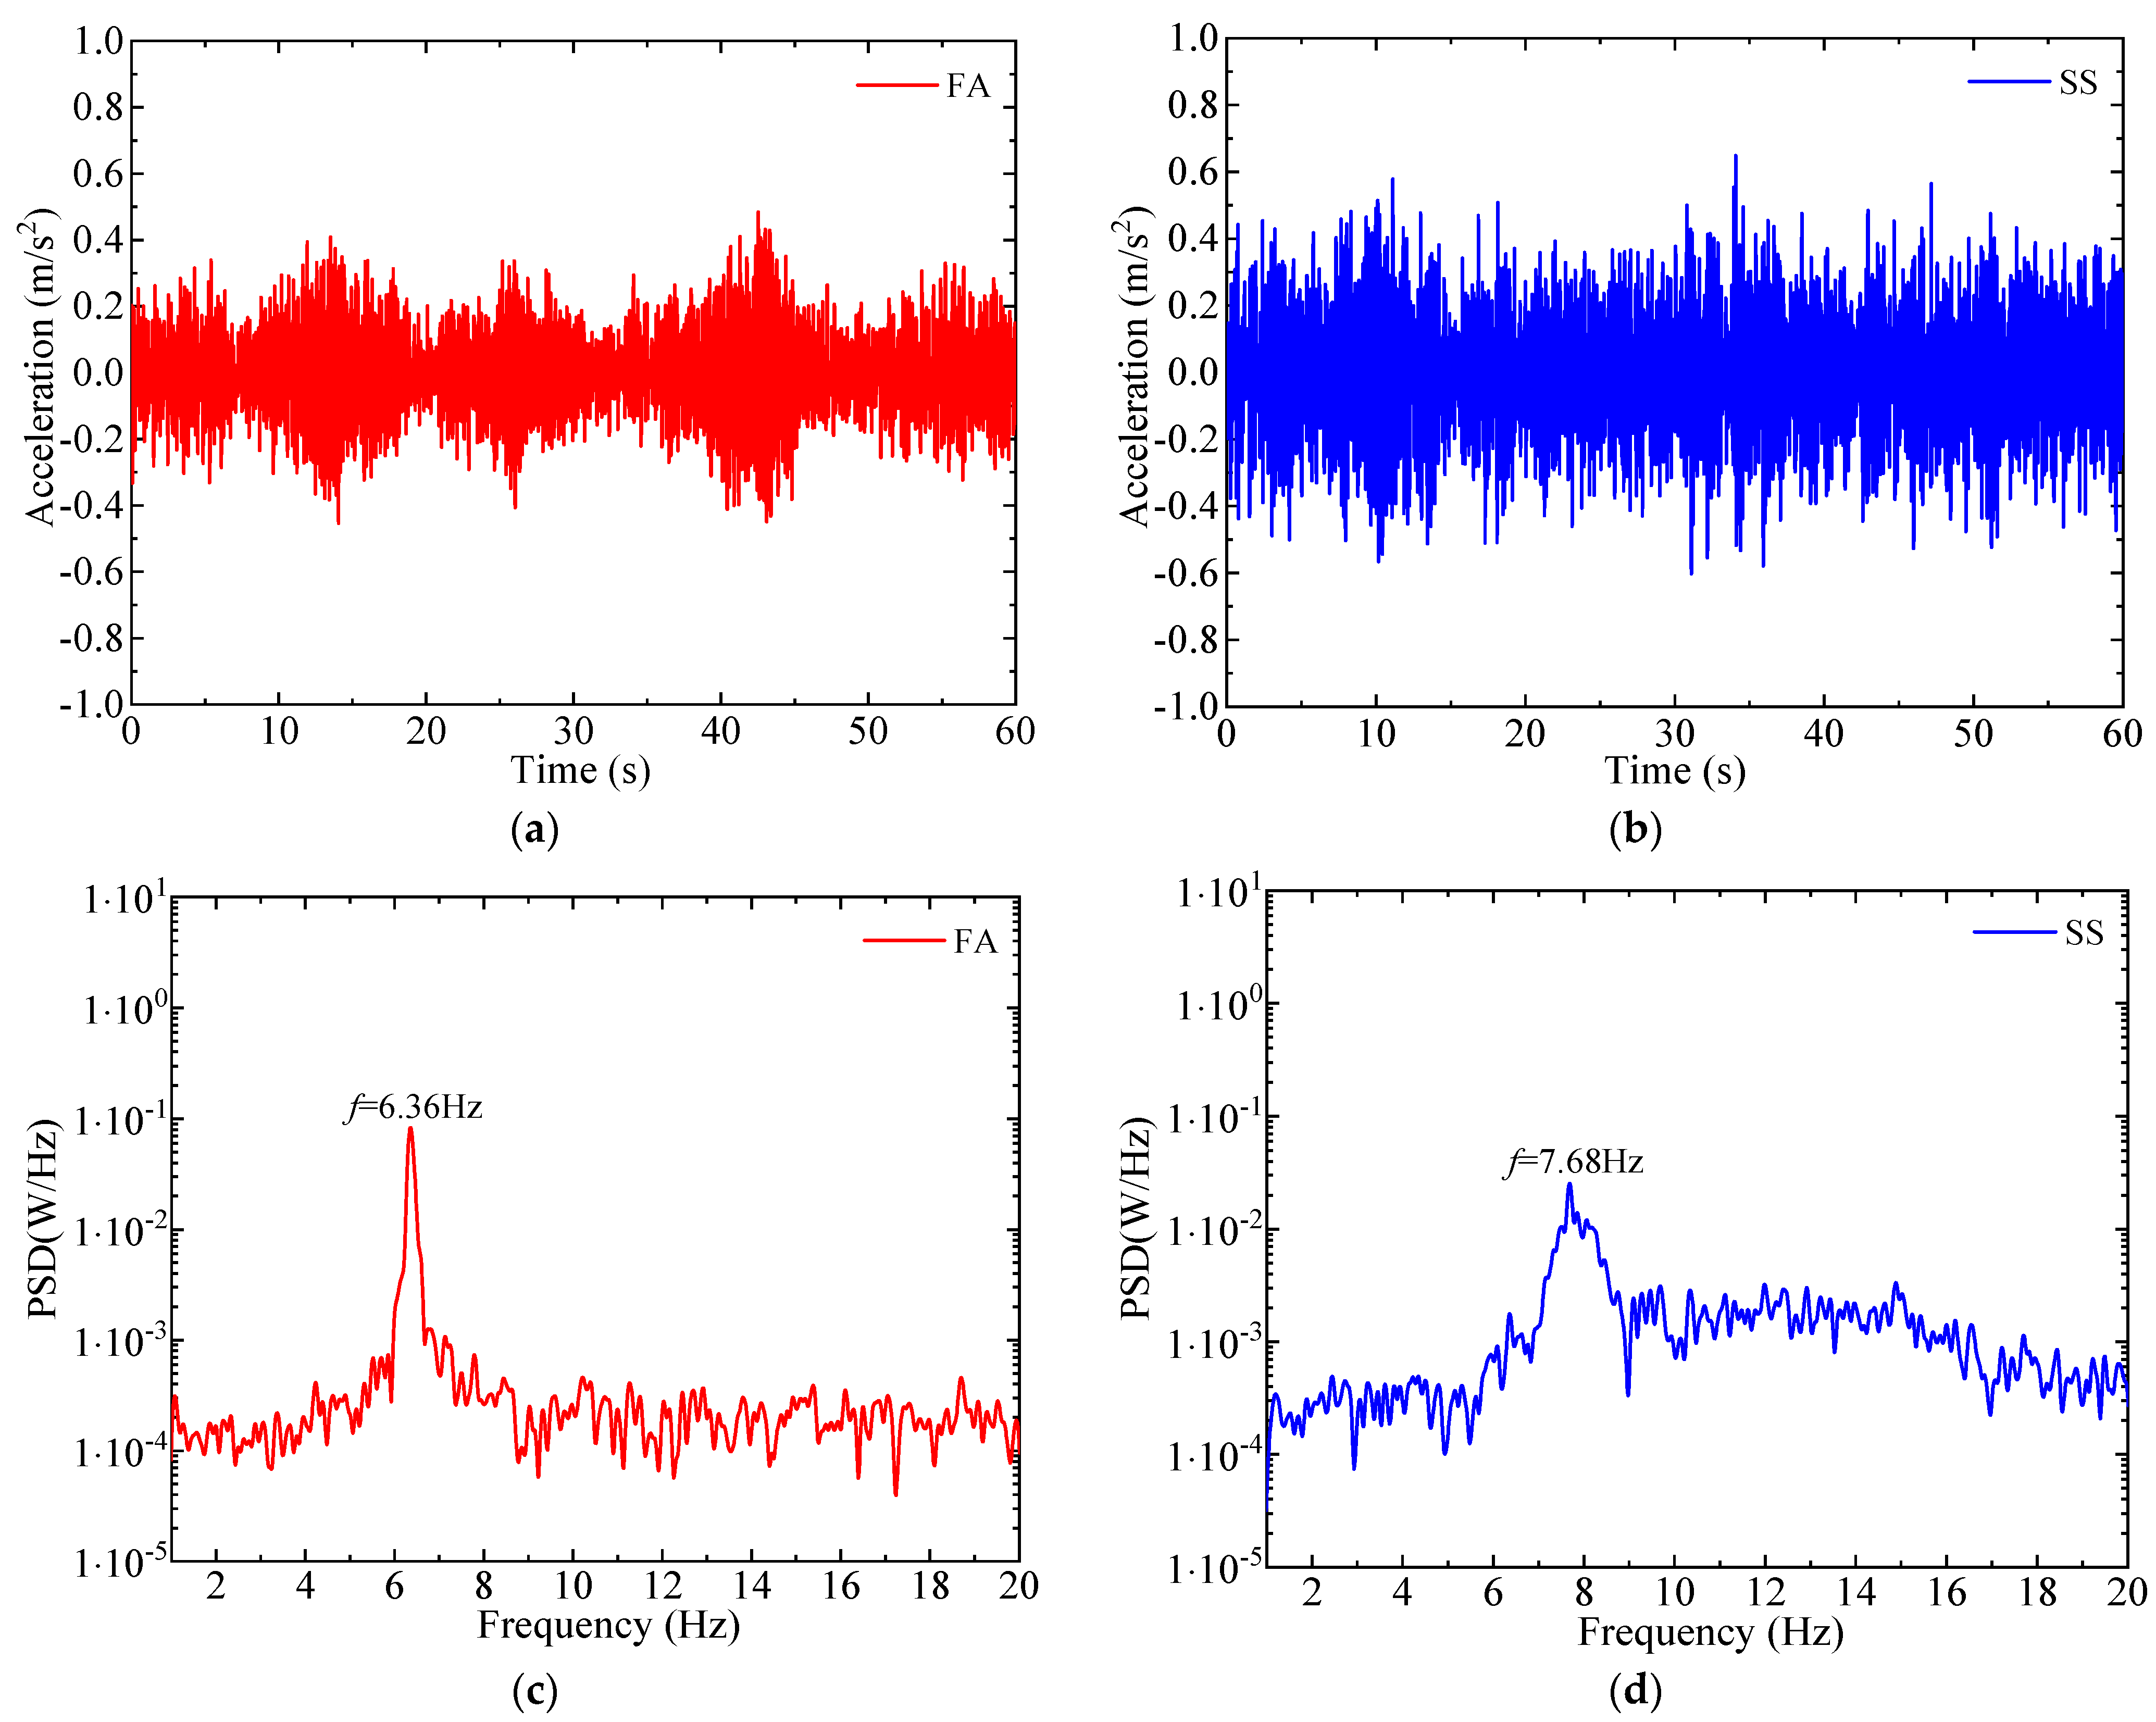
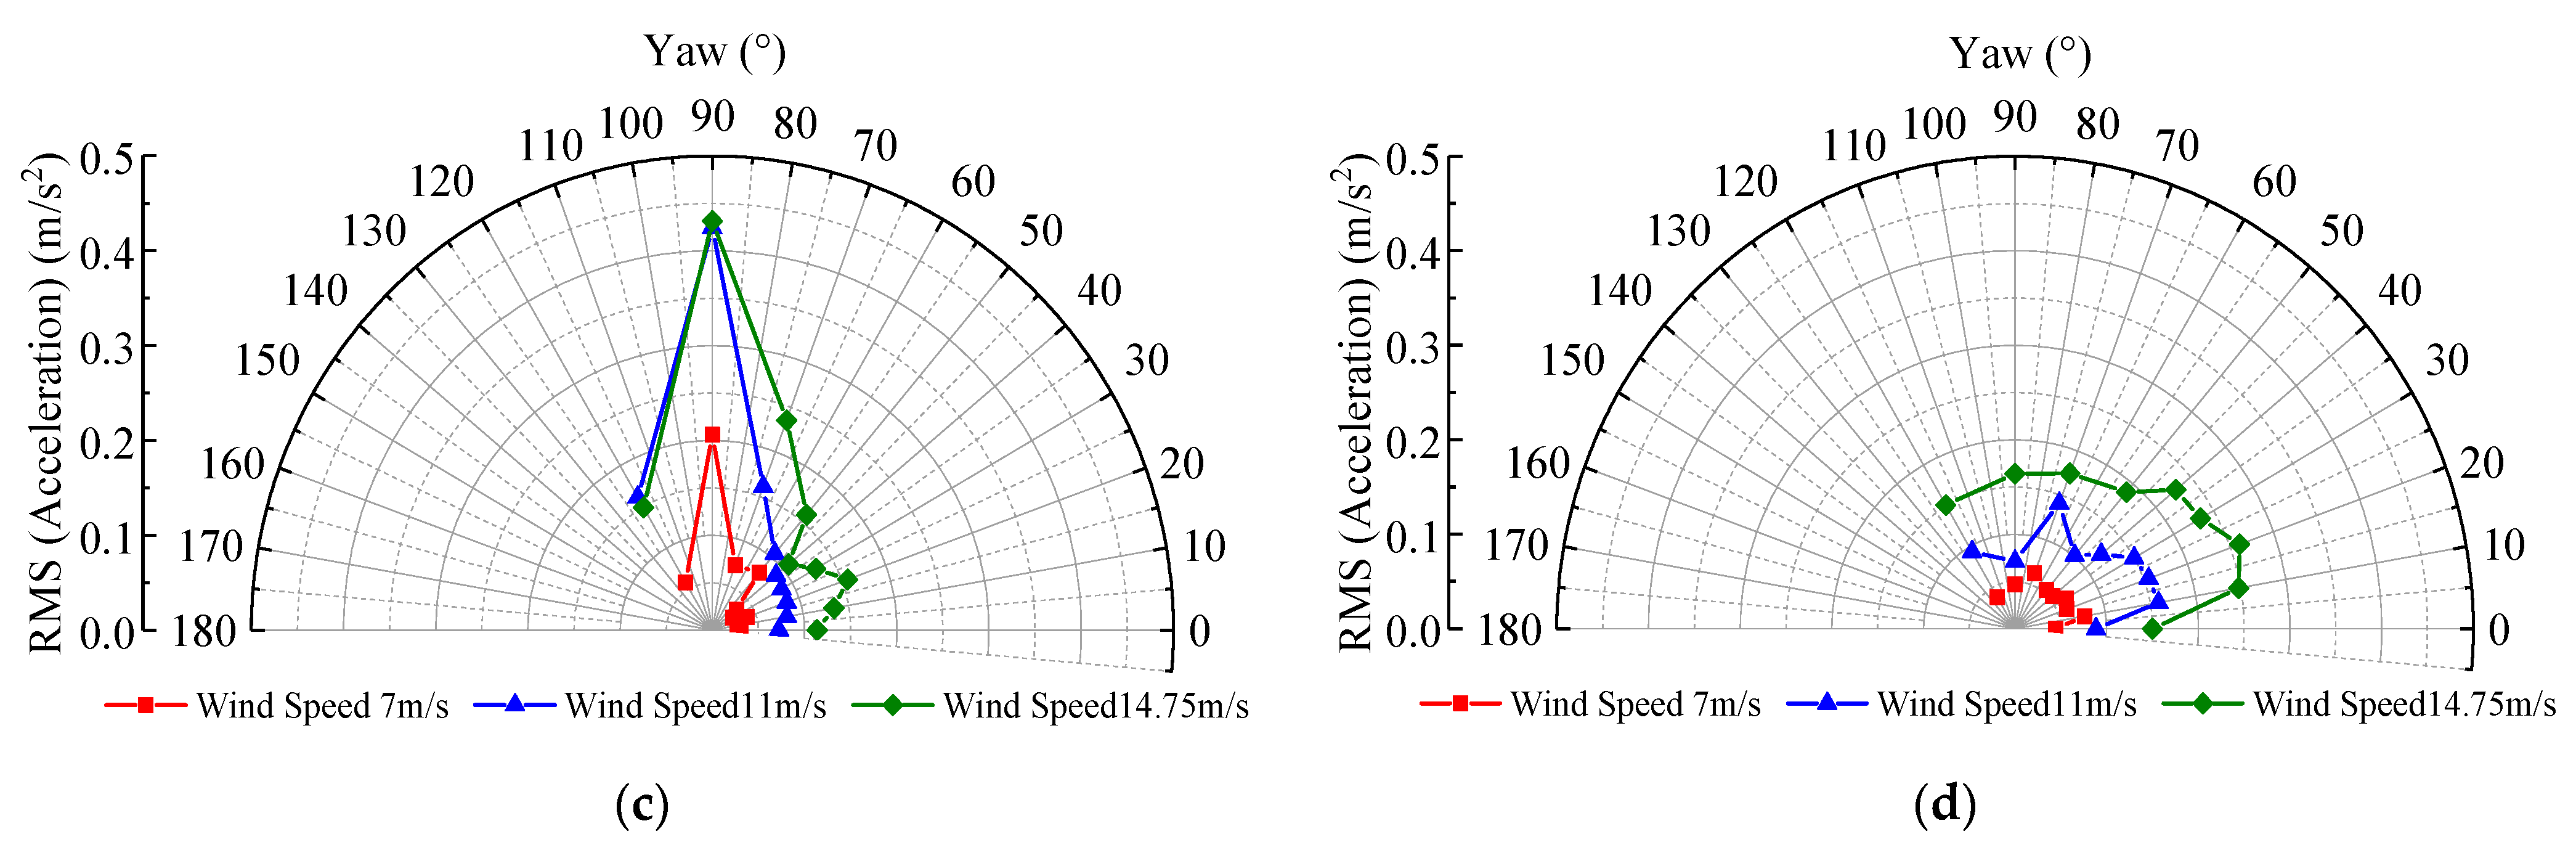
3.2. Dynamic Responses under Parked Conditions

When the wind turbine is in the parked state, the blades are feathered with a pitch angle of 90°. During the wind tunnel test, the yaw angles and wind speeds ranged from 0° to 120° and from 1 to 17 m/s, respectively, and the acceleration responses were collected in both the FA and SS directions at the top of the tower under all conditions. Among them, the acceleration response time history at the top of the tower and power spectral analysis under the condition of a yaw angle of 0° and a wind speed of 16.52 m/s are shown in Figure 11. It shows that the acceleration amplitude in the SS direction is slightly larger than that in the FA direction in this condition. Due to the blades being feathered at the pitch angle of 90°, the first natural frequency decreases by 2% in the FA direction, while in the SS direction, the first natural frequency increases by 7%. The root mean square values of the acceleration responses in the FA and SS directions at the top of the tower under different yaw angle conditions during the parked state are illustrated in Figure 12a–d. As the wind speed increases under different yaw angle conditions, the tower vibration response gradually increases. In yaw angle conditions ranging from 0° to 50°, the root mean square values of the SS direction acceleration response at the tower top are slightly greater than those in the FA direction. Additionally, the acceleration response in the FA direction remains relatively consistent across different yaw angle conditions. The root mean square values of the FA-direction acceleration response reach their maximum at the yaw angle of 90°, while those of the SS-direction acceleration response are relatively higher when the yaw angle ranges from 10° to 50° and reach their maximum at the yaw angle of 20°. To further explore the aforementioned vibration phenomena, the lift and drag coefficients of the airfoil were calculated for the angles of attack in the range of −180° to 180°, as shown in Figure 13. The SD7032 airfoil exhibits the maximum drag coefficient at an angle of attack of 90°, thus causing the maximum acceleration response in the FA (drag) direction at a yaw angle of 90°. Similarly, the relatively large lift coefficient of the SD7032 airfoil associated with the angle of attack ranging from 10° to 50° explains the relatively high acceleration response in the SS (lift) direction within the yaw angle range from 10° to 50°.

3.3. Comparison of Responses from Wind Tunnel Tests and Simulations

It is valuable to check if the measured responses from wind tunnel experiments on a scaled model can reflect the vibration responses of a full-scale prototype. For this purpose, the differences between the vibration responses of the scaled wind turbine model and the simulated responses of the 5 MW prototype by OpenFAST are compared. OpenFAST is an open source aero-servo-hydro-elastic wind turbine simulation software based on multi-body dynamics, the finite element method, modal superposition method, and other methods. The aerodynamic load of the wind turbine is based on the improved blade element momentum (BEM) theory, and a variety of engineering corrections are introduced to ensure the accuracy of the dynamic response analysis. In the comparison, the rotor rotation speed of the scaled wind turbine model was set to 90 rpm and three pitch angles, 0°, 4°, and 8°, were selected. In the wind tunnel test, the wind field was set to be uniform, and the displacement responses of the tower top of the scaled model in the FA and SS directions from wind tunnel tests are converted to the corresponding displacement responses, which are comparable to those of the prototype tower. In OpenFAST, the rotor rotation speed and wind speed were selected according to the rotor rotation speed ratio and wind speed ratio. The converted wind tunnel test results are compared with the simulated displacement responses by OpenFAST, as shown in Figure 14. For different pitch angles, the converted tower-top displacement in the FA direction from the wind tunnel tests consistently grows when the wind speed increases, which matches the trend of the simulated results by OpenFAST. Also, the converted displacement amplitude is generally close to that from the OpenFAST simulations. In addition, it can be clearly seen that the wind tunnel test results are higher compared to the simulated results when the wind speed is low, but the test results decline with a higher wind speed. The turbulence intensity of the wind field during the wind tunnel test at a low wind speed is relatively large, so the test results in the FA direction are significantly higher than the displacement responses obtained by the OpenFAST simulations. At relatively high wind speeds, the influence of blockage on the wind tunnel test can be one explanation for the lower response amplitude obtained experimentally. However, the average error between the test results and the simulated displacement responses in the FA direction is within 15%. However, there is a significant discrepancy between the wind tunnel test results and the OpenFAST simulation results for the tower-top displacement in the SS direction. This discrepancy arises because the scaled wind turbine model in this study was designed on the basis of the similarity in thrust coefficient only, without ensuring similarity in the torque coefficient. In addition, the high turbulence of the wind at a low wind speed, the measurement error of the displacement sensor, and the fluctuation in the wind wheel speed will affect the wind tunnel test results. As a result, the scaled wind turbine model is unable to accurately reflect the vibration response in the SS direction.

4. Modal Parameter Identification of the Wind Turbine Scaled Model

Modal parameters are important indicators for the dynamic characteristics of wind turbine systems. To study the modal parameters of the scaled wind turbine model, modal identification techniques should be employed. Three identification methods, the identification method based on rotor stop tests, the classic SSI method, and the modified SSI method, were used to identify the modal parameters of the scaled model.

4.1. Identification Methods

In practical engineering, rotor stop tests are frequently employed to facilitate the identification of modal parameters [42,43] for parked wind turbines. In this method, a sudden brake is applied to stop rotor rotation for an operating wind turbine, and a decay response of the wind turbine tower structure can be generated and then used as the input signal for system identification. Afterwards, the eigen-system realization algorithm (ERA) method [44] is used to analyze the tower’s decay responses and calculate modal parameters.
The SSI method is usually used in the literature to obtain the modal parameters of operating wind turbines [45]. The SSI method is a technique based on the state-space model of random systems. The formulation of the classic SSI method can be found in Ref. [46].
The classic SSI method requires that the excitation should be a white noise. However, when a wind turbine is in operation, its structural responses include harmonics related to the rotation of the rotor (caused by excitations such as 1P and 3P). These harmonics typically have high energy proportions. When the frequency of these harmonics approaches the natural frequency, there can be significant errors in identifying modal parameters [47,48,49]. To address the challenge of harmonic interference, Dai et al. [50] made modifications to the classic SSI method by introducing an additional signal into the measured vibration response and disrupting the operational mode shapes corresponding to harmonic excitations. This modified identification method is effective in obtaining modal parameters of wind turbines and is therefore used in the following subsection for comparison.

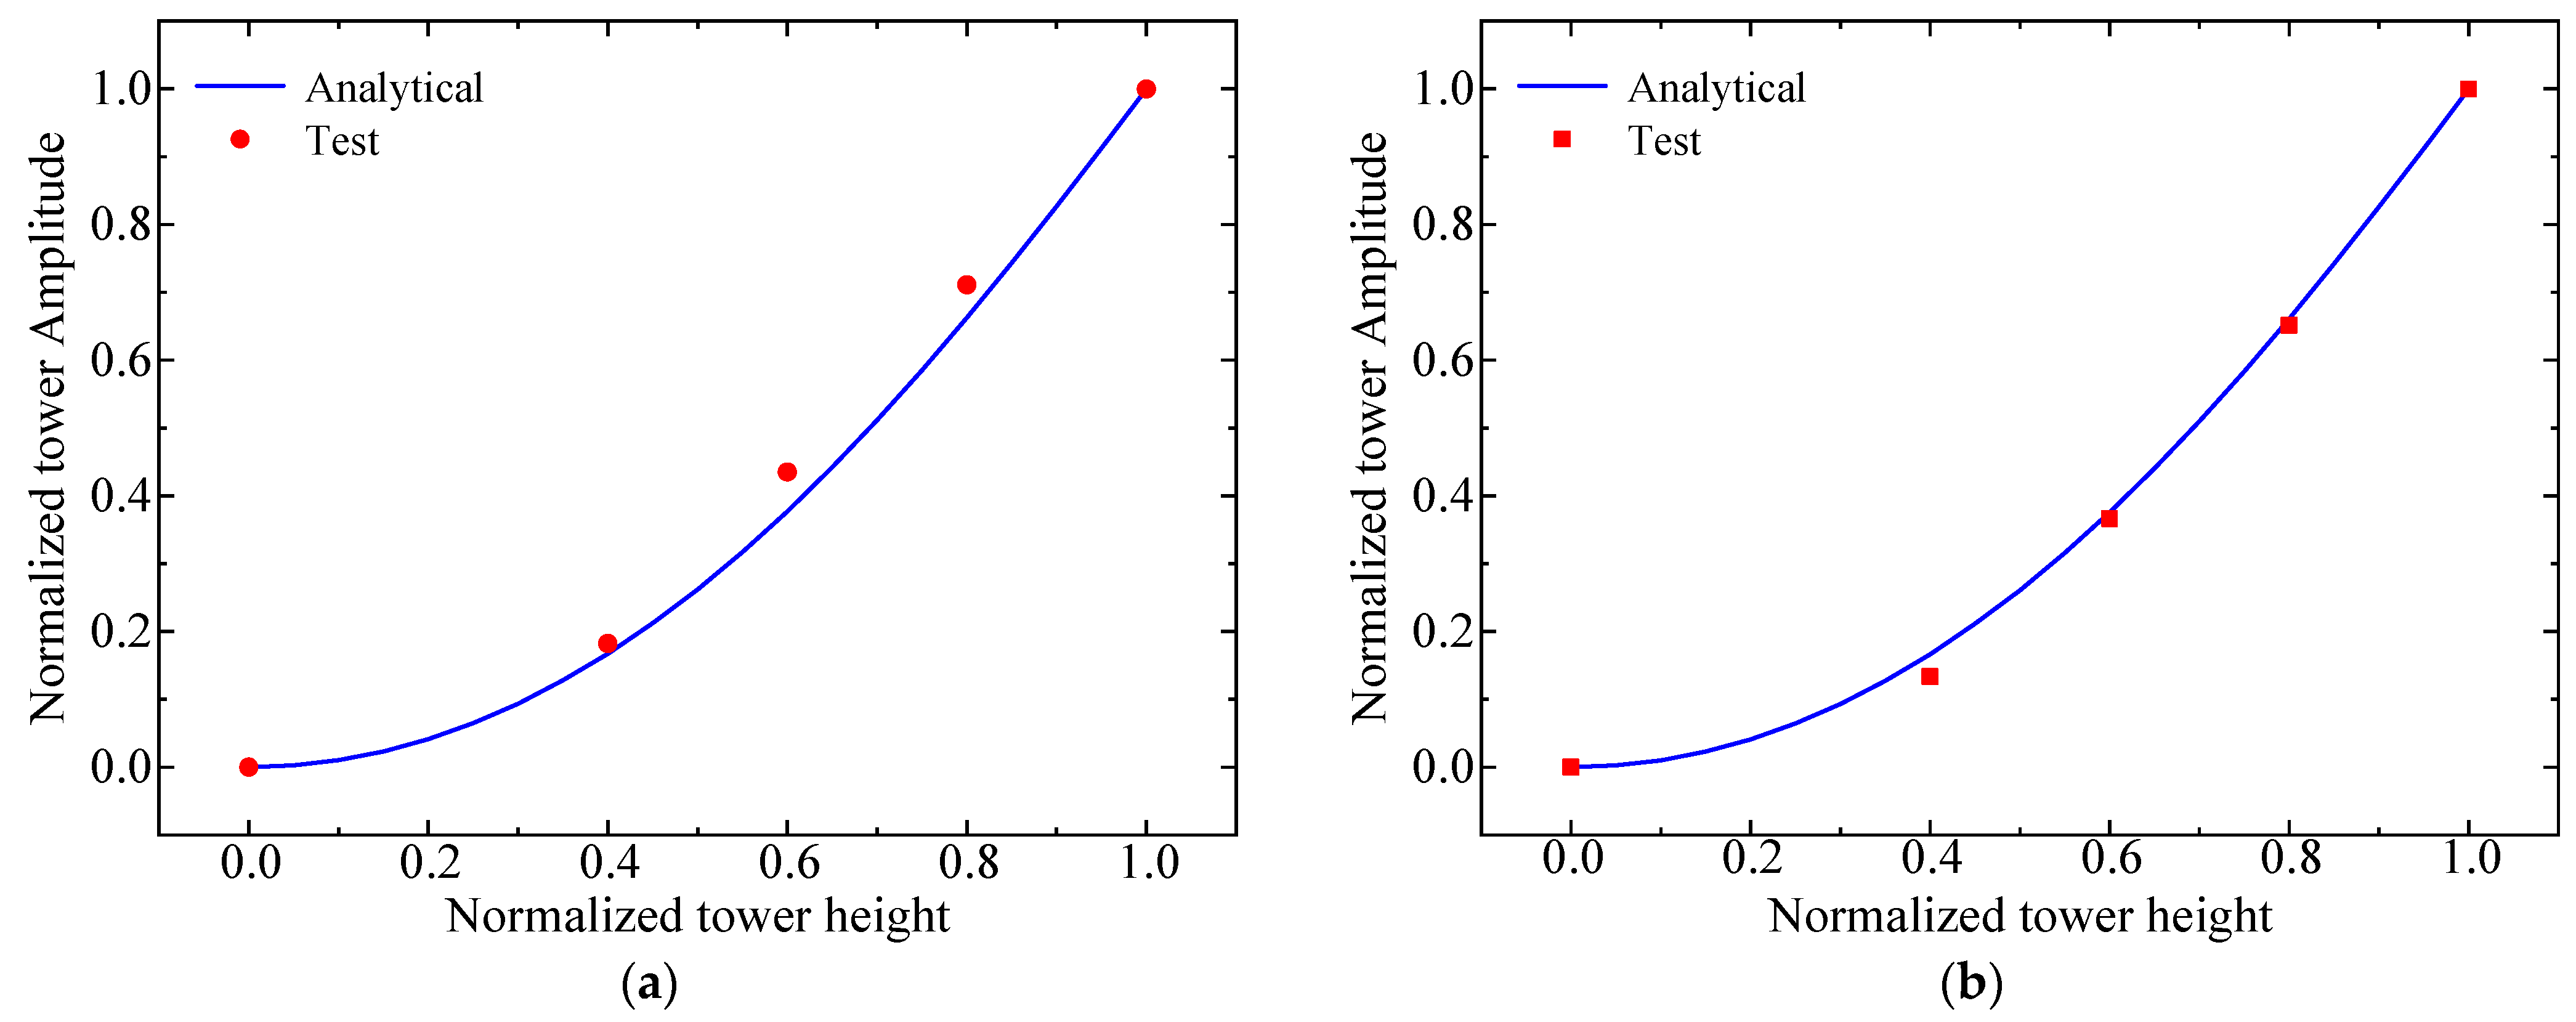
4.2. Comparison of Modal Parameter Identification Results

First, a series of rotor stop tests were conducted separately for each of the normal operating conditions as shown in Table 2, maintaining a constant wind speed in wind tunnel experiments. Specifically, under the condition with a rotor rotation speed of 260 rpm and a wind speed of 4.5 m/s, the acceleration response time histories of the measurement point at the tower top were collected, which is depicted in Figure 15. The power spectral analysis of acceleration responses at various measurement points on the tower is illustrated in Figure 16. Following a sudden rotor stop, the acceleration in the tower FA direction exhibits a “beating” decay pattern, while the acceleration in the SS direction experiences a decaying pattern close to a free decay. The power spectra of acceleration responses at various measurement points all contain the natural frequencies in both FA and SS directions. From the power spectral analysis, the natural frequencies of the low modes of the scaled wind turbine tower can be obtained. Moreover, the power spectrum of the FA-direction acceleration response includes the frequency component at the first-order natural frequency in the blade flapwise direction of 14.71 Hz.
For different mean wind speeds, the identification method based on rotor stop tests was used to identify the modal parameters of the scaled wind turbine model in the parked condition. The classic SSI method and the modified SSI method proposed by Dai et al. [50] were used to identify the modal parameters of a scaled wind turbine model in the operational condition. The natural frequencies, damping ratios, and mode shapes identified by these different identification methods are illustrated in Figure 17, Figure 18, and Figure 19 respectively. Each identification method accurately determines the natural frequencies of the scaled wind turbine model. The damping ratio identified in the FA direction by the identification method based on rotor stop tests is slightly higher than the structural damping ratio, whereas the damping ratio identified in the SS direction is notably lower. From the acceleration responses presented in Figure 15 and Figure 16, it can be seen that the vibration decays contain the contributions from the first tower bending modes in the FA and SS directions simultaneously and contribution from the blade mode, making the vibration not pure and thus reducing the reliability of identified damping values. On the other hand, both the classic and modified SSI methods yield damping ratios that greatly exceed the structural damping ratio probably due to the presence of aerodynamic damping and the inherent limit to the damping identification of these two SSI methods. The damping ratios identified by both the classic and modified SSI methods are close but scattered. Generally, we can conclude that the presented three identification methods can accurately identify first-order mode shapes, with the first-order mode shape identified through the rotor stop test in the FA direction having a slightly larger error. But these methods all perform much worse in identifying damping ratios.

5. Conclusions

In this paper, a scaled model of a wind turbine is designed. Through wind tunnel experiments, the scaled model’s dynamic characteristics and vibration response characteristics under typical operating conditions are compared and analyzed, and the modal parameters are identified using the SSI method and the identification method based on rotor stop. The main conclusions of this study are as follows:
(1)
A thrust-equivalent scaled wind turbine model designed with a low-Reynolds-number SD7032 airfoil can generally meet the requirements for similarity in dynamic characteristics and aerodynamic performance.
(2)
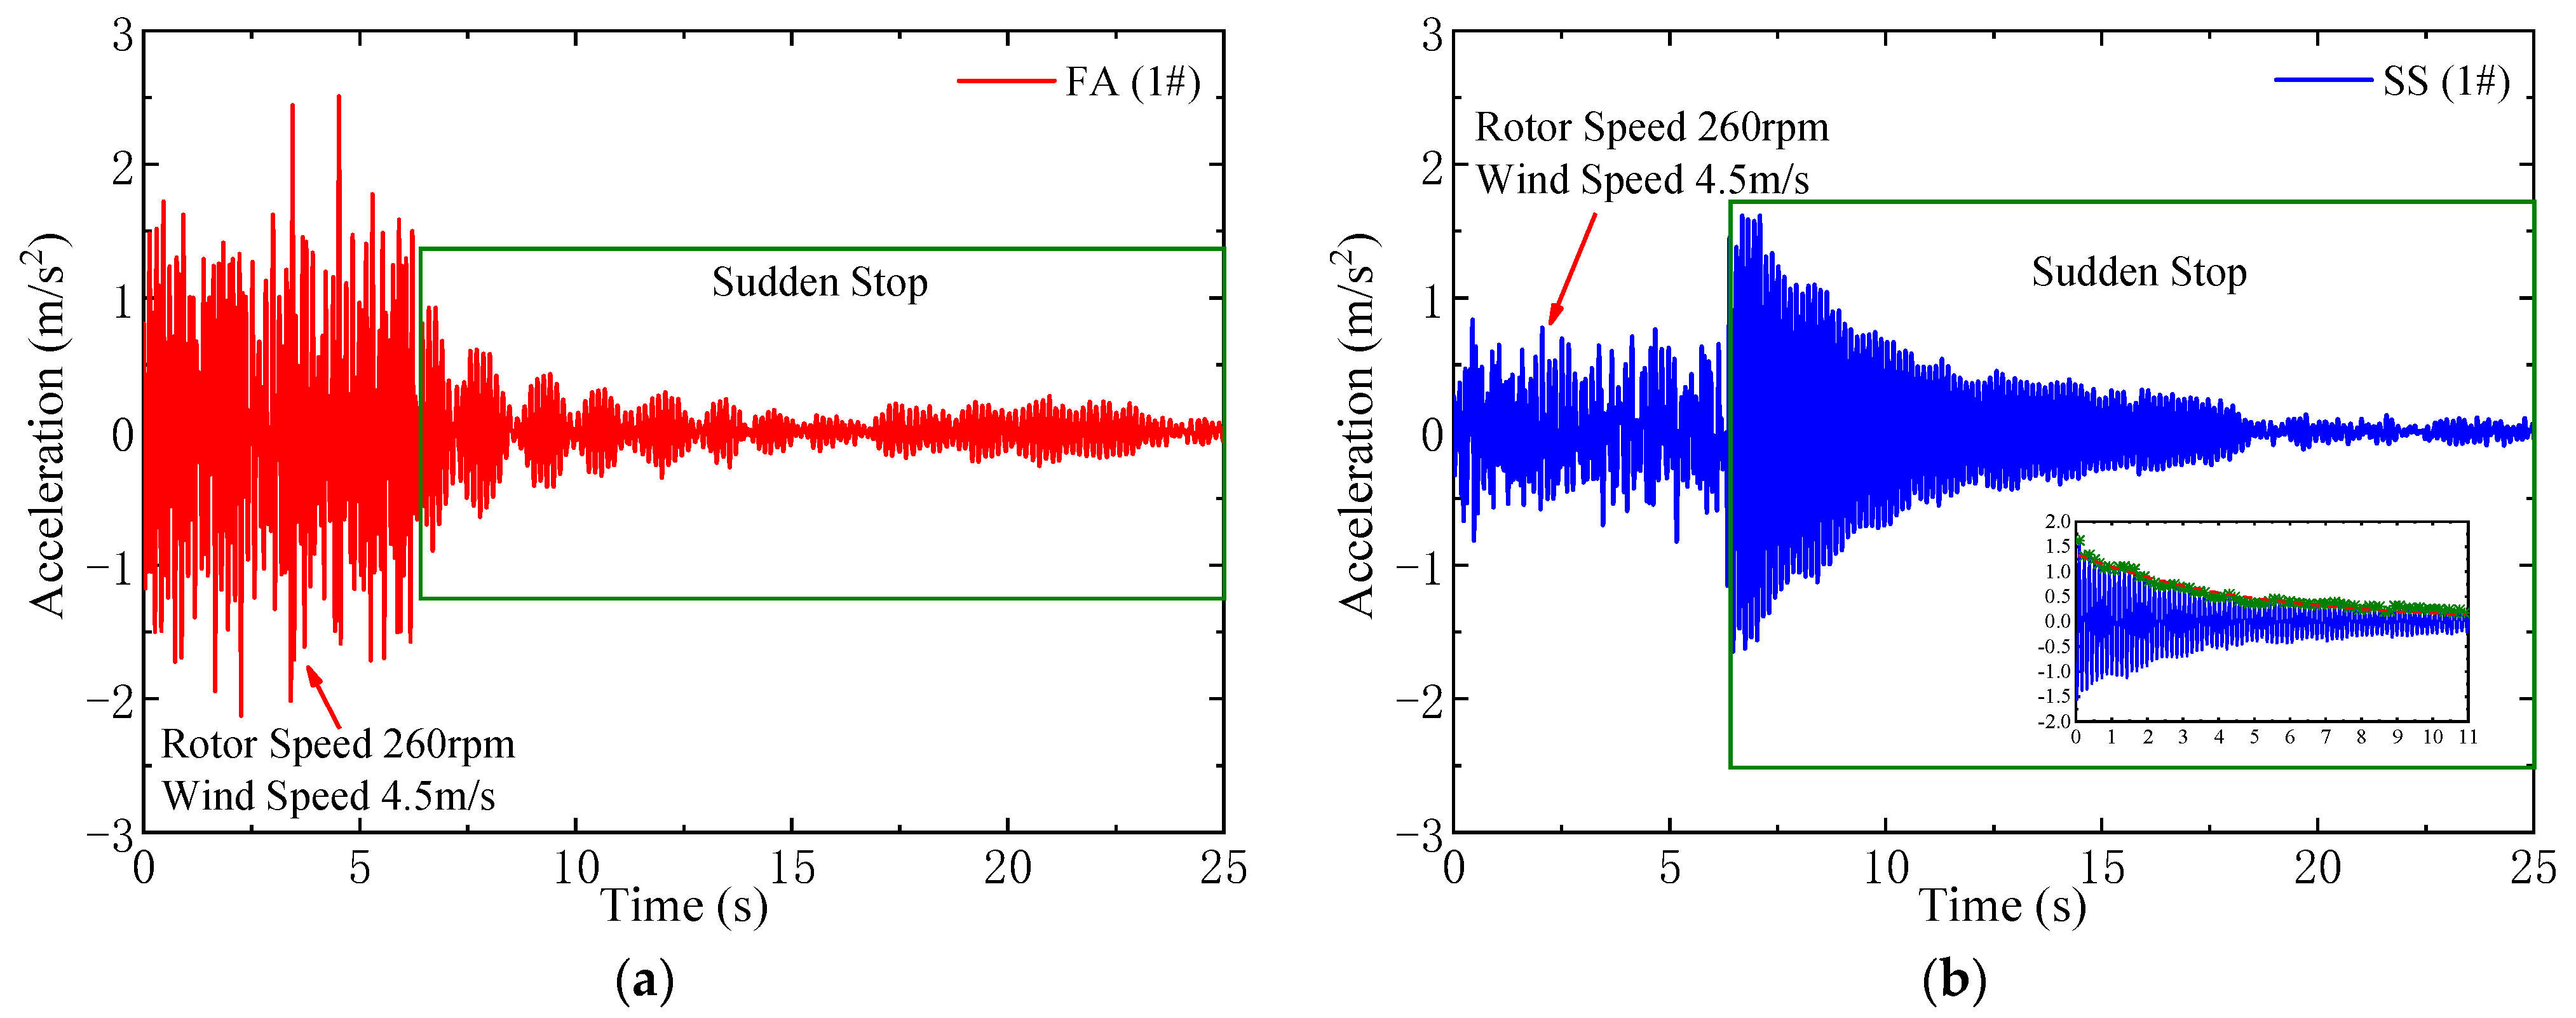
The scaled wind turbine model driven by a motor can simulate harmonic excitations induced by the rotation of the wind turbine rotor during operation. However, the harmonics at twice the rotor rotation frequency are more pronounced.
(3)
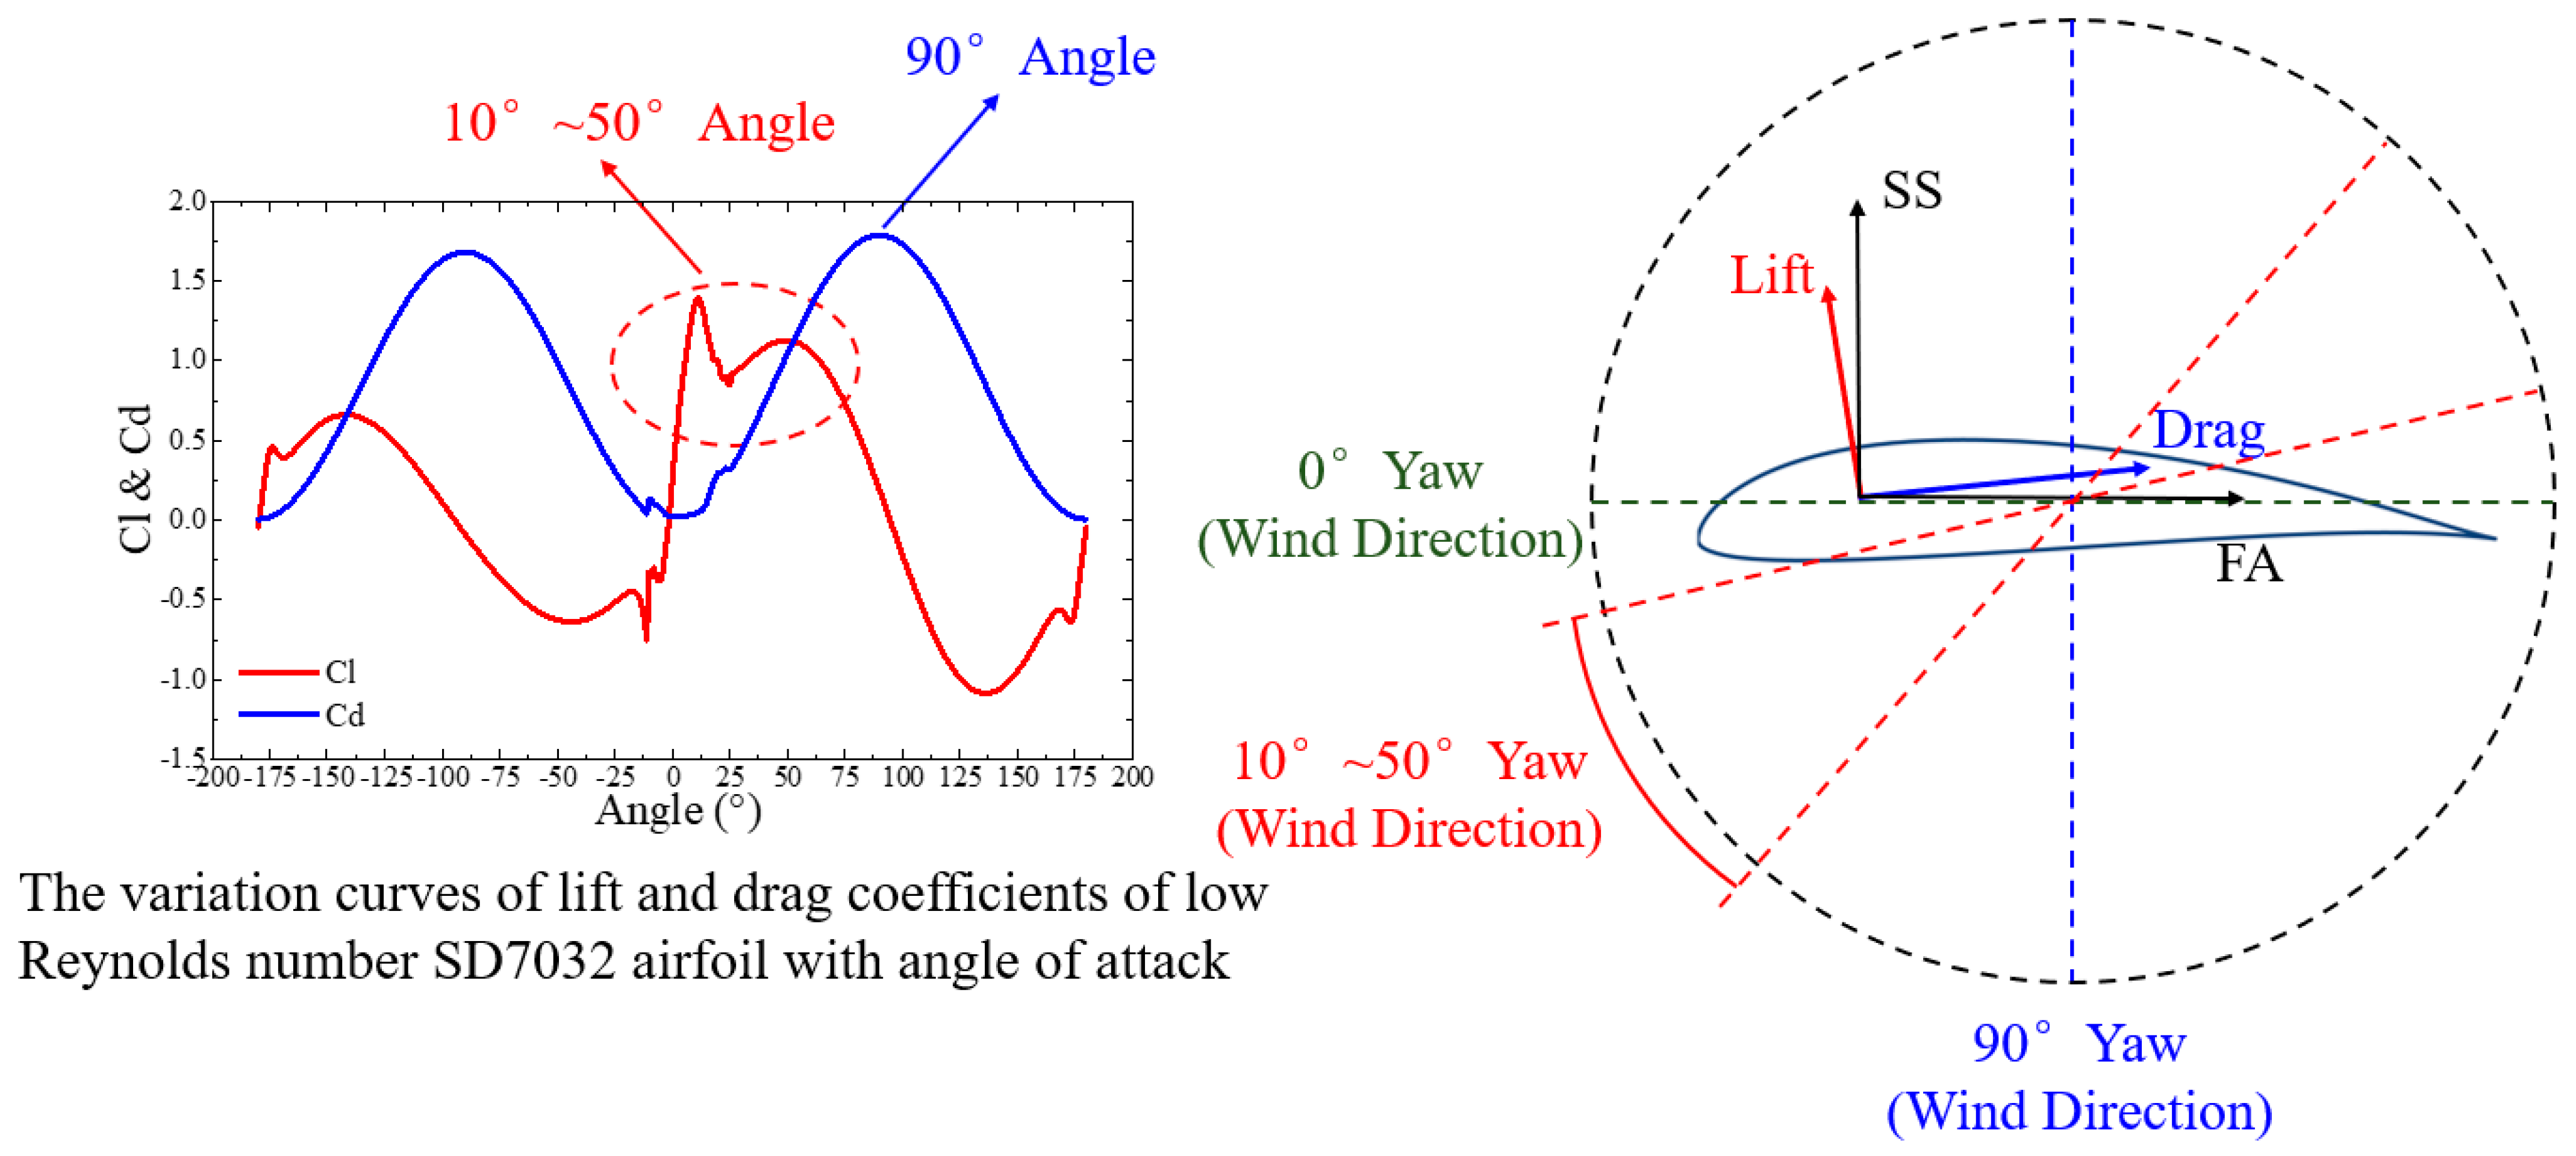
In the case of a feathered blade, when the yaw angle is 90°, the vibration amplitude of the tower in the FA direction is the largest. Within the yaw angle ranges from 10° to 50°, the vibration response of the tower in the SS direction is relatively severe. This phenomenon aligns with the variation trends of lift and drag coefficients of the low-Reynolds-number SD7032 airfoil with regard to angles of attack.
(4)
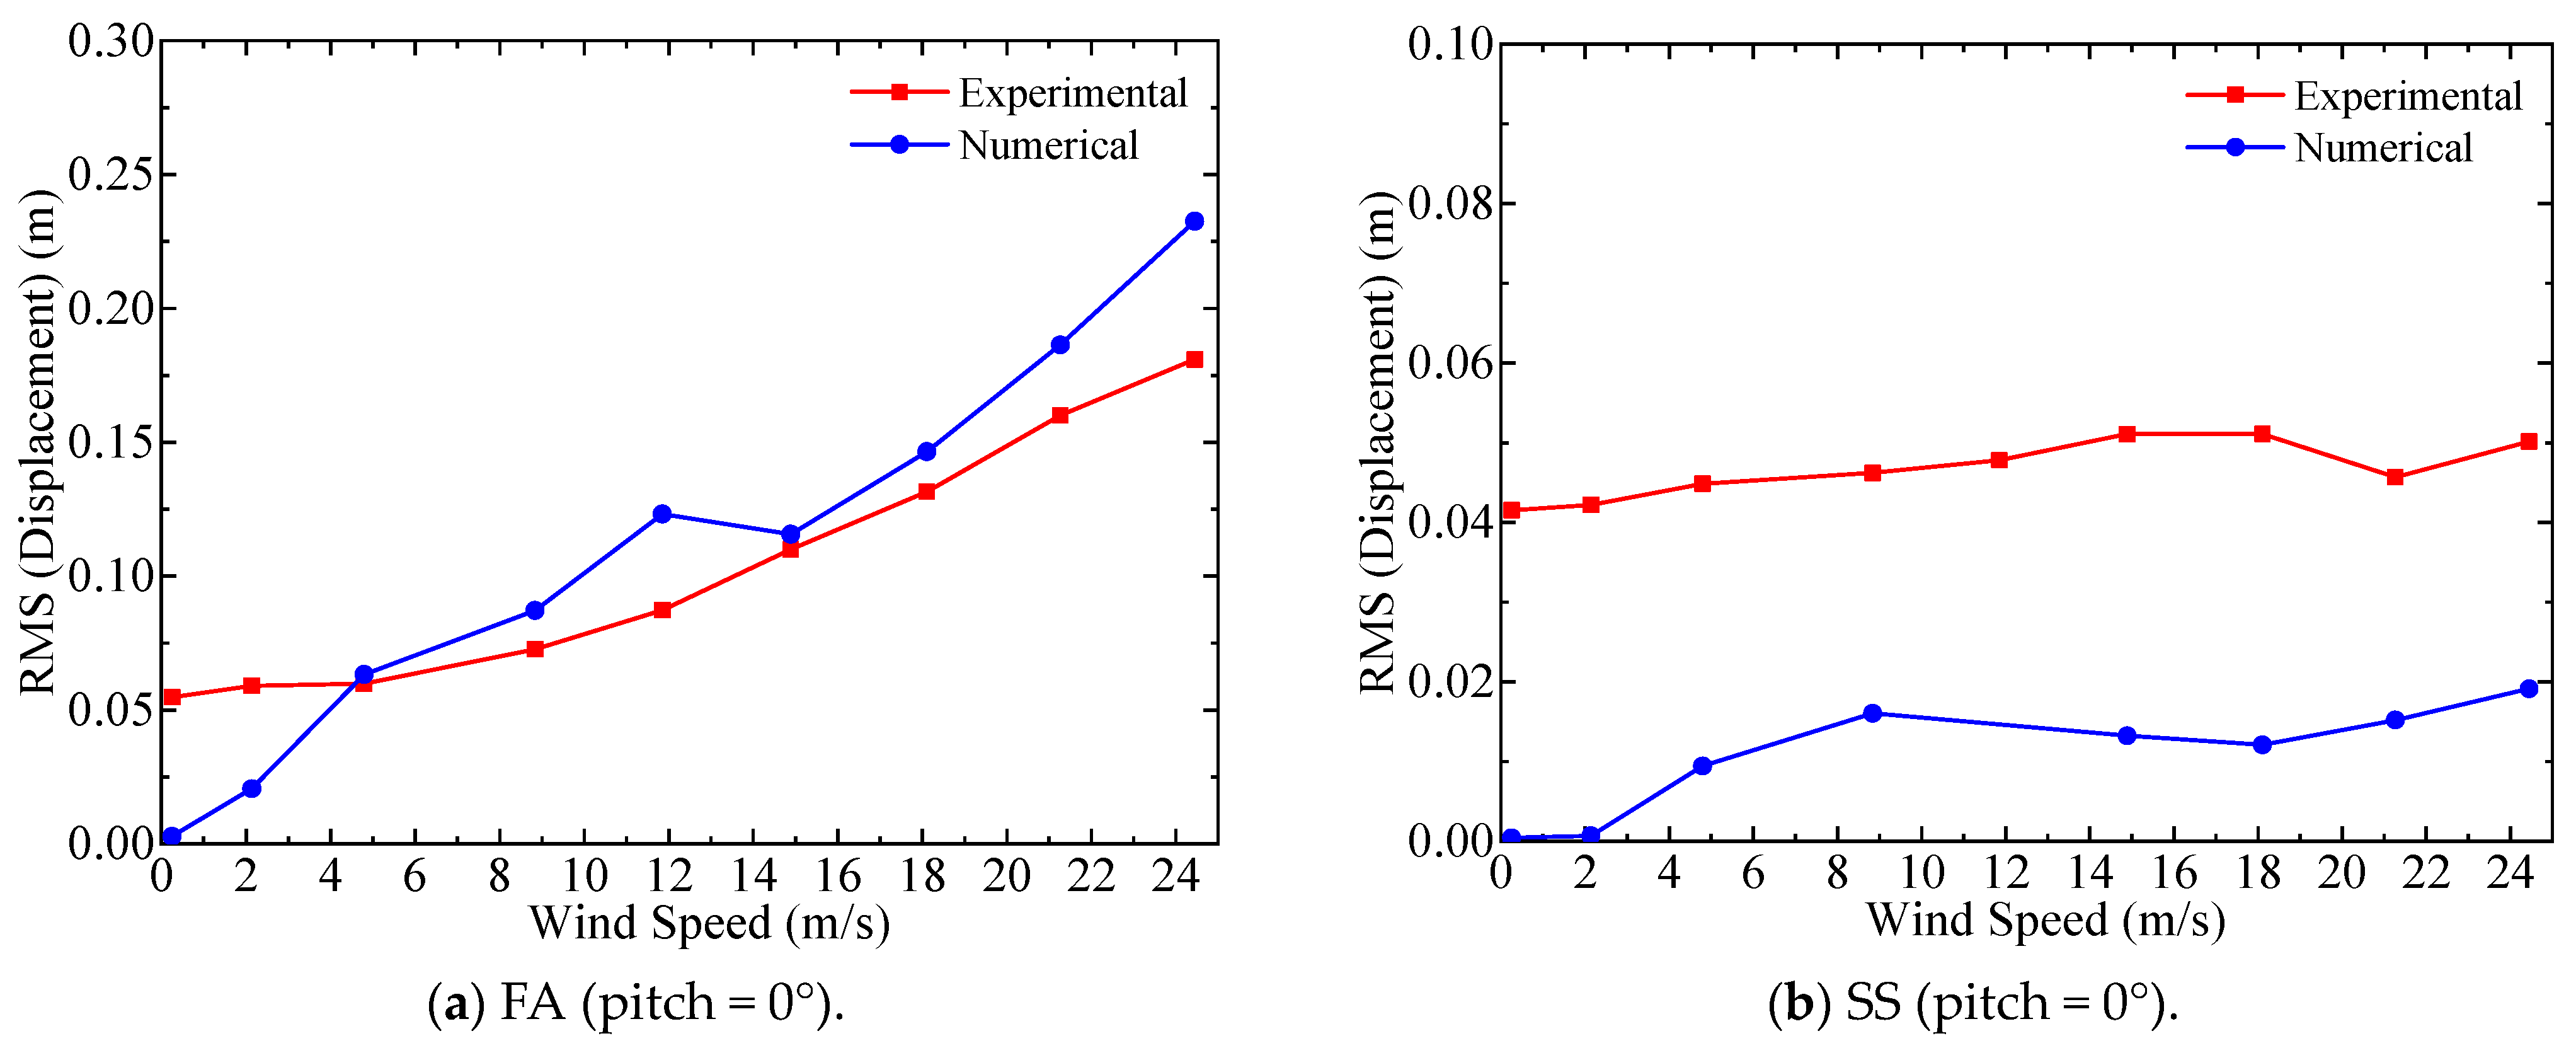
The design of the scaled model employs the similarity rule in dynamic characteristics and thrust equivalence, so the FA displacement amplitude of the scaled model can reflect that of the prototype wind turbine. However, due to the neglect of torque coefficient equivalence in the design, there is a significant discrepancy in the displacement amplitude in the SS direction compared to the prototype wind turbine.
(5)
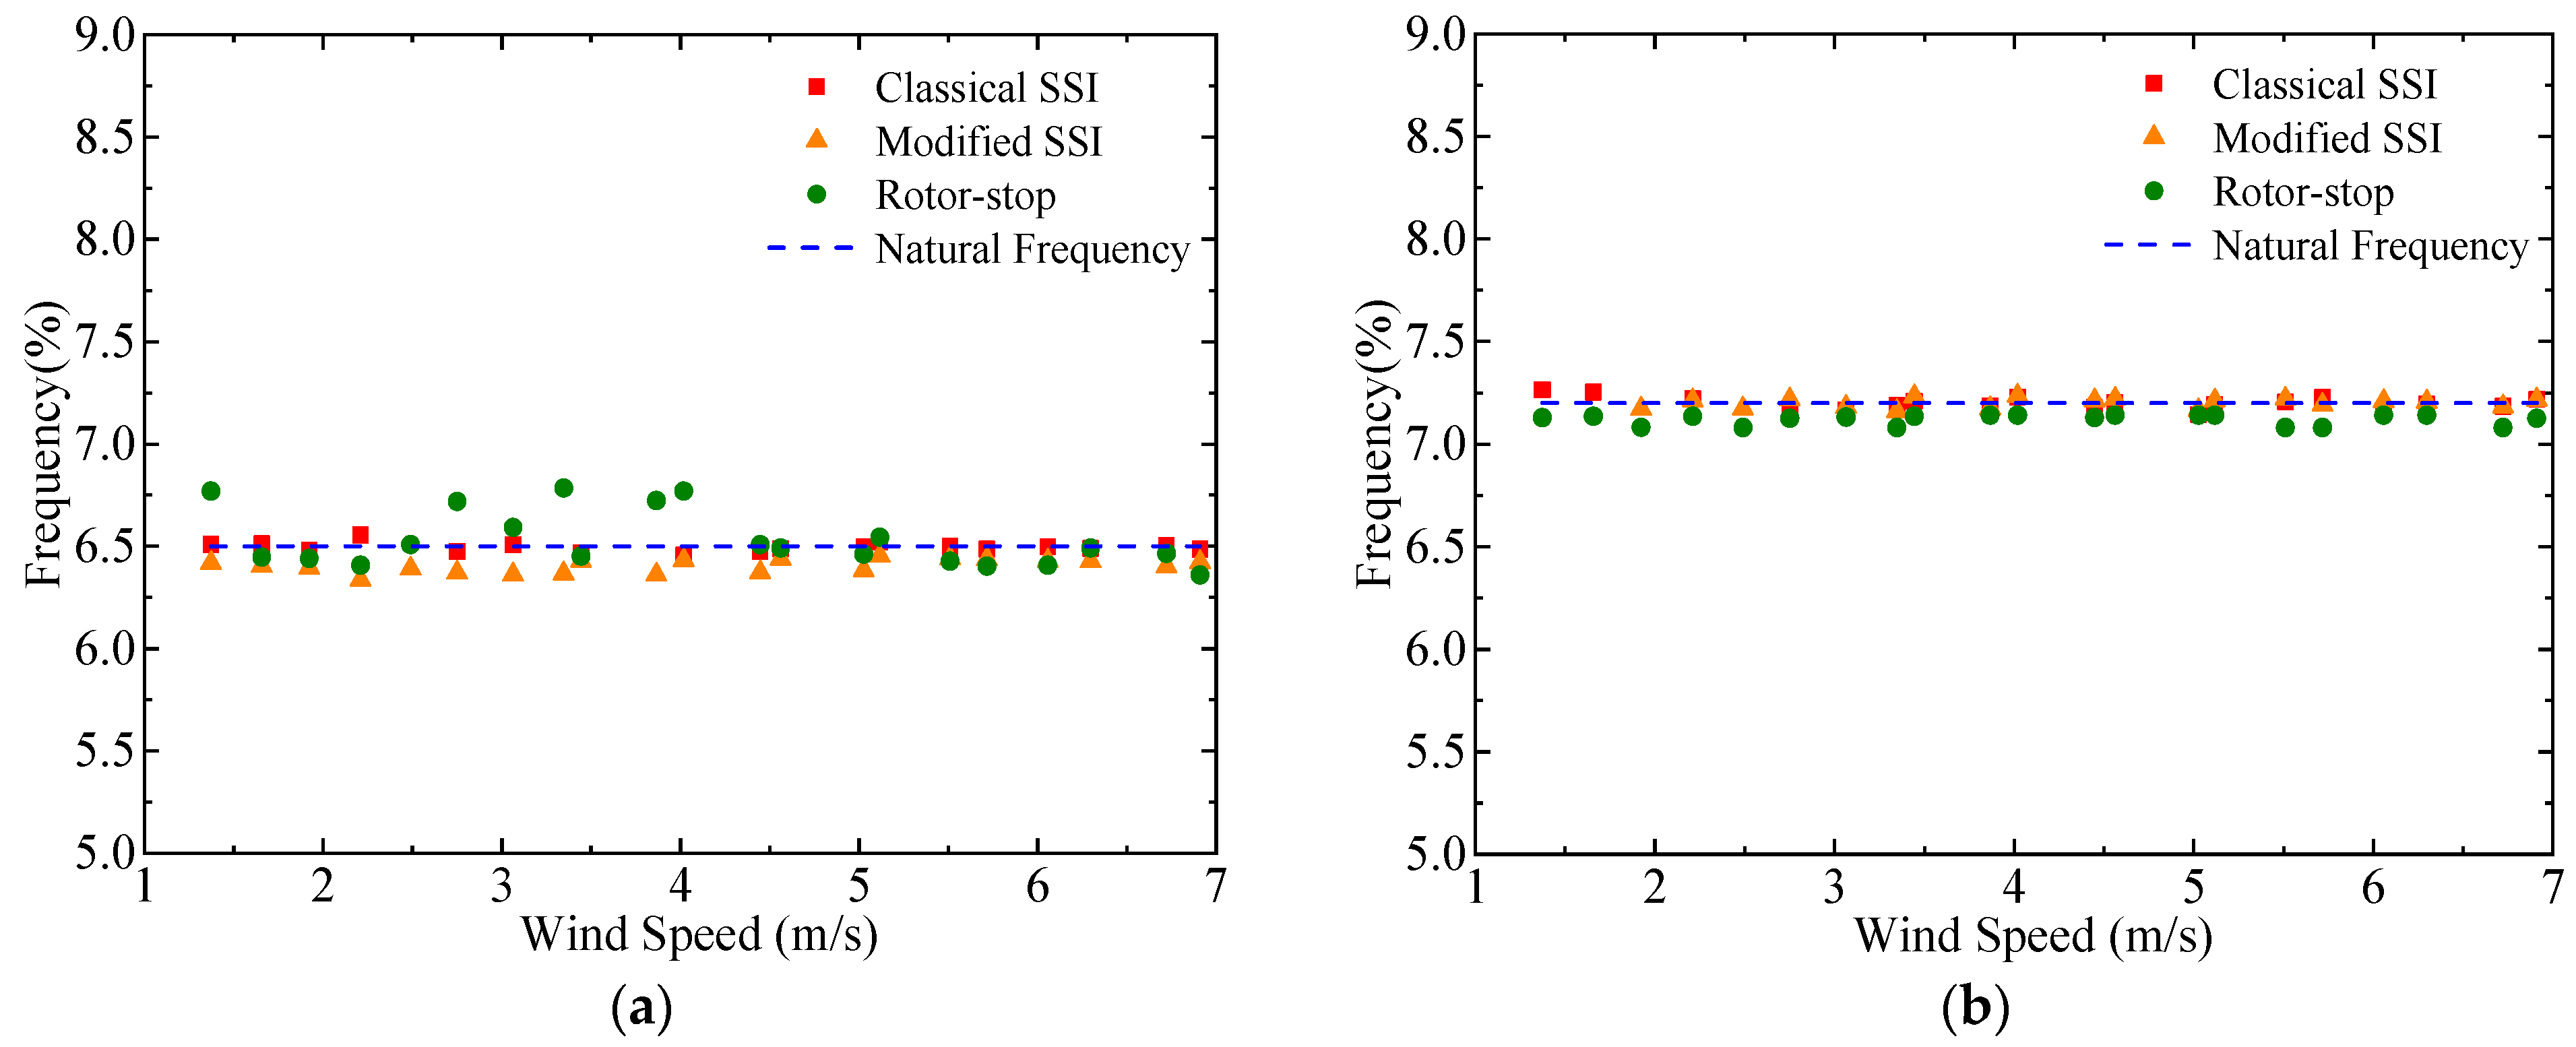
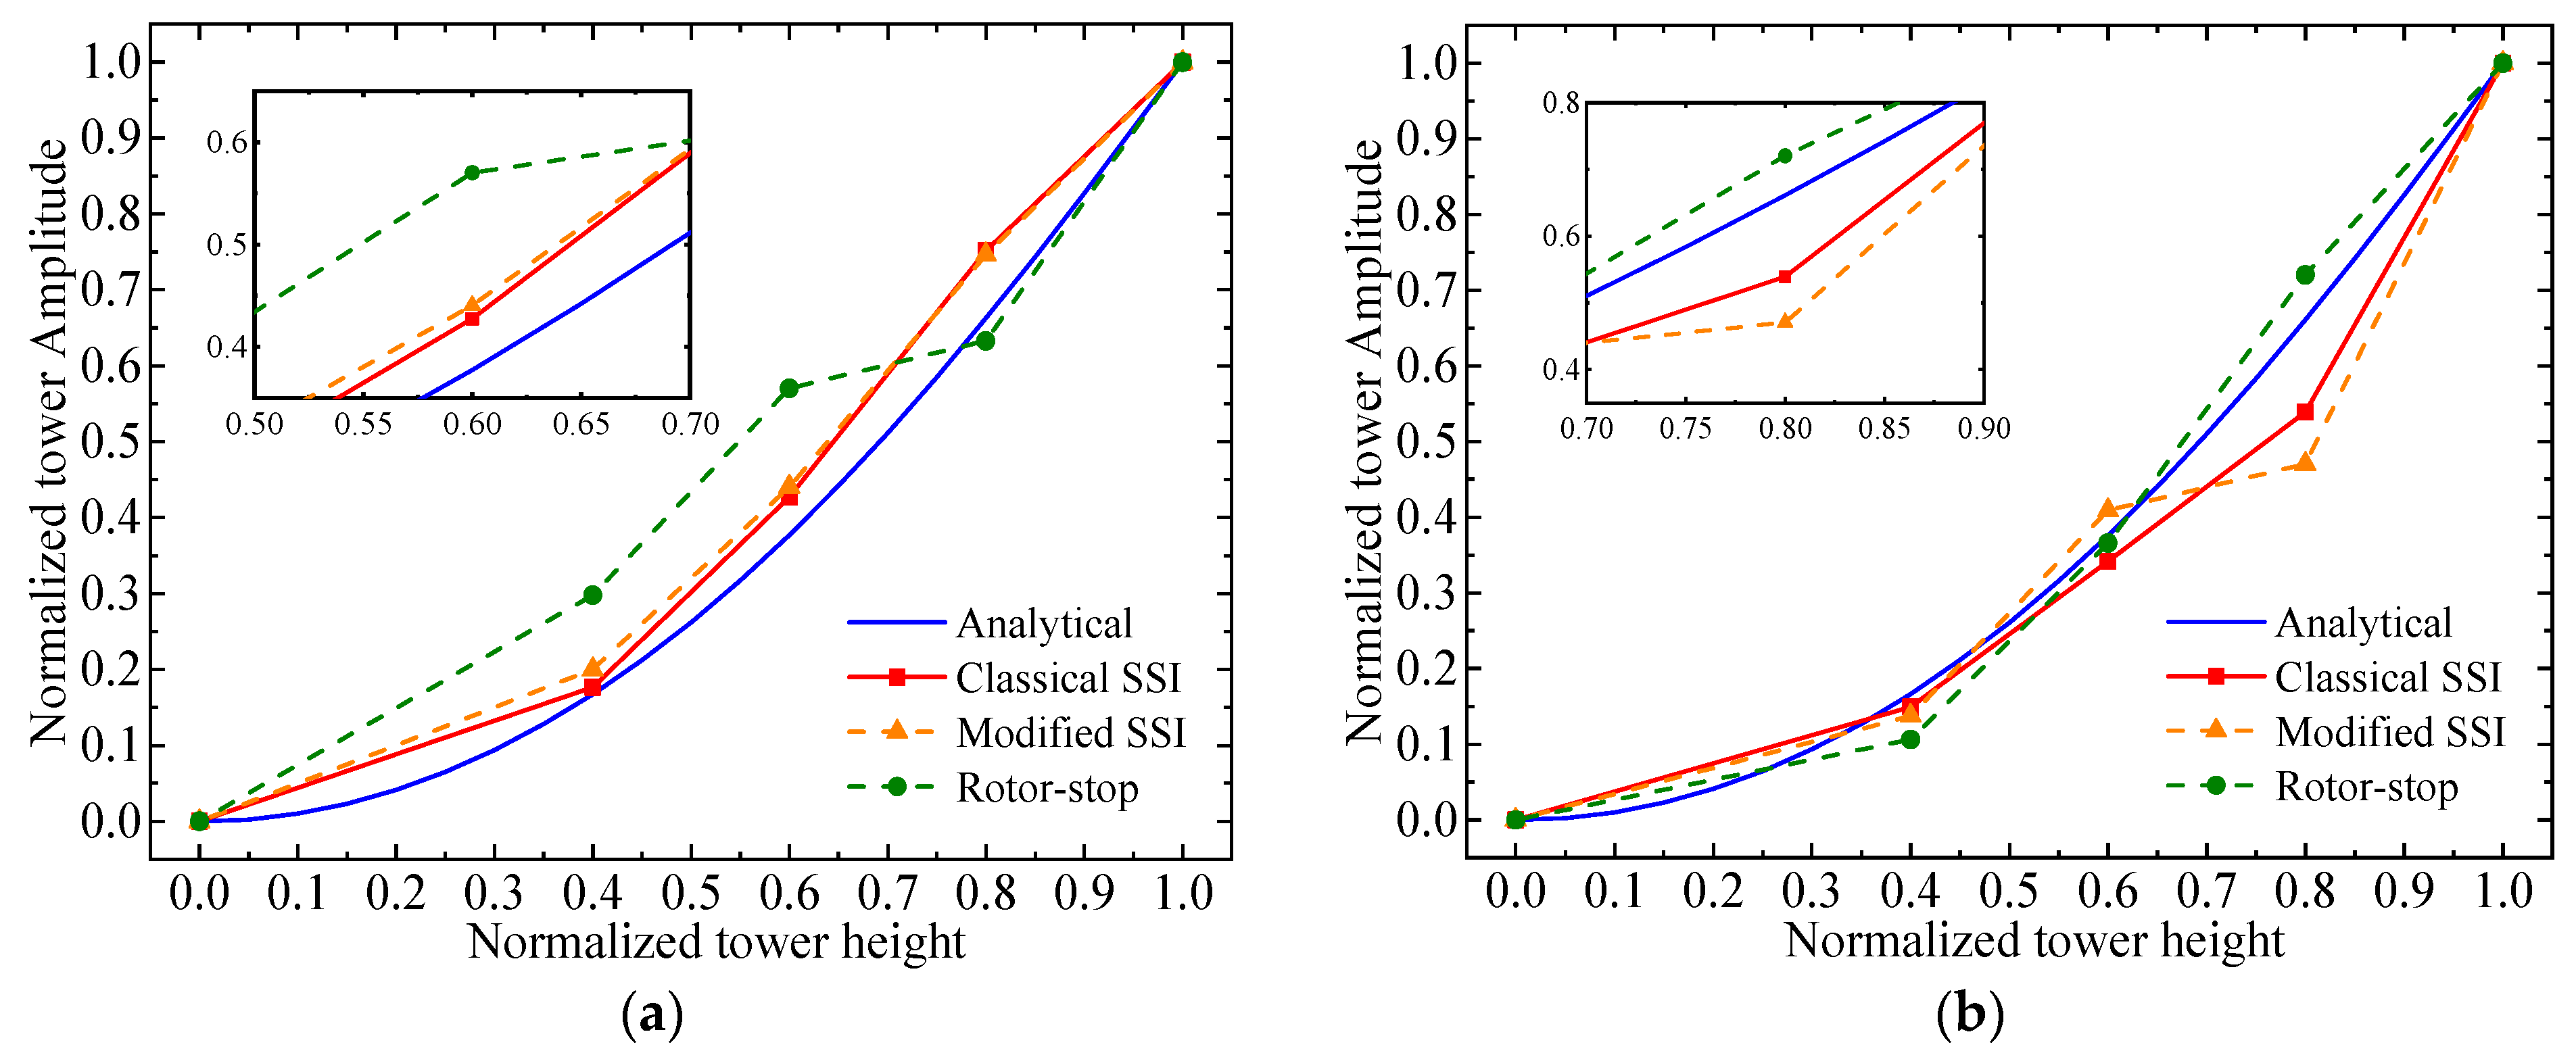
The identification method based on rotor stop tests and the SSI methods can accurately identify the natural frequencies of the scaled wind turbine model. The modal damping identified during the operational condition is scattered, which is higher than structural damping due to the inclusion of aerodynamic damping. The identification errors for mode shapes are relatively small.

Author Contributions

Conceptualization, C.C.; Formal analysis, Z.W.; Funding acquisition, X.H. and C.C.; Investigation, Y.Y., M.R. and Z.W.; Methodology, Y.Y., C.Y. and C.C.; Resources, M.R.; Supervision, C.C.; Validation, C.Y.; Writing—original draft, Y.Y. and C.Y.; Writing—review and editing, X.H. and C.C. All authors have read and agreed to the published version of the manuscript.

Funding

This research was funded by the Key-Area Research and Development Program of Guangdong Province (Grant No. 2022B0101100001), the National Natural Science Foundation of China (No. 52108280), the Natural Science Foundation of Hunan Province (No. 2023JJ70001), and the National Science Fund for Distinguished Young Scholars (No. 52025082).

Data Availability Statement

The data used in this paper is unavailable due to privacy restriction.

Conflicts of Interest

Authors Yong Yao, Chi Yu and Mumin Rao were employed by the company Guangdong Energy Group Science and Technology Research Institute Co., Ltd. The remaining authors declare that the research was conducted in the absence of any commercial or financial relationships that could be construed as a potential conflict of interest.

References

  1. Farina, A.; Anctil, A. Material consumption and environmental impact of wind turbines in the USA and globally. Resour. Conserv. Recycl. 2022, 176, 105938. [Google Scholar] [CrossRef]
  2. GWEC. Global Offshore Wind Report 2023; GWEC: Lisbon, Portugal, 2023. [Google Scholar]
  3. Rodrigues, S.; Restrepo, C.; Kontos, E.; Teixeira Pinto, R.; Bauer, P.; Global Wind Energy Council. Trends of offshore wind projects. Renew. Sustain. Energy Rev. 2015, 49, 1114–1135. [Google Scholar] [CrossRef]
  4. Chen, X.; Li, C.; Xu, J. Failure investigation on a coastal wind farm damaged by super typhoon: A forensic engineering study. J. Wind Eng. Ind. Aerodyn. 2015, 147, 132–142. [Google Scholar] [CrossRef]
  5. Ma, Y.; Martinez-Vazquez, P.; Baniotopoulos, C. Wind turbine tower collapse cases: A historical overview. Proc. Inst. Civ. Eng.—Struct. Build. 2019, 172, 547–555. [Google Scholar] [CrossRef]
  6. Hawbecker, P.; Basu, S.; Manuel, L. Realistic simulations of the July 1, 2011 severe wind event over the Buffalo Ridge Wind Farm. Wind Energy 2017, 20, 1803–1822. [Google Scholar] [CrossRef]
  7. Banerjee, A.; Chakraborty, T.; Matsagar, V.; Achmus, M. Dynamic analysis of an offshore wind turbine under random wind and wave excitation with soil-structure interaction and blade tower coupling. Soil. Dyn. Earthq. Eng. 2019, 125, 105699. [Google Scholar] [CrossRef]
  8. Zhu, H.; Li, D.; Xu, J. Dynamic analysis and optimization of a wind turbine tower subject to wind and earthquake loads. Struct. Des. Tall Spec. Build. 2022, 31, e1971. [Google Scholar] [CrossRef]
  9. Chen, C.; Duffour, P.; Fromme, P. Modelling wind turbine tower-rotor interaction through an aerodynamic damping matrix. J. Sound. Vib. 2020, 489, 115667. [Google Scholar] [CrossRef]
  10. Chen, C.; Duffour, P.; Fromme, P.; Hua, X. Numerically efficient fatigue life prediction of offshore wind turbines using aerodynamic decoupling. Renew. Energy 2021, 178, 1421–1434. [Google Scholar] [CrossRef]
  11. Yan, Y.; Li, C.; Li, Z. Buckling analysis of a 10 MW offshore wind turbine subjected to wind-wave-earthquake loadings. Ocean Eng. 2021, 236, 109452. [Google Scholar] [CrossRef]
  12. Shi, S.; Zhai, E.; Xu, C.; Iqbal, K.; Sun, Y.; Wang, S. Influence of pile-soil interaction on dynamic properties and response of offshore wind turbine with monopile foundation in sand site. Appl. Ocean Res. 2022, 126, 103279. [Google Scholar] [CrossRef]
  13. Han, R.; Wang, L.; Wang, T.; Gao, Z.; Wu, J. Study of Dynamic Response Characteristics of the Wind Turbine Based on Measured Power Spectrum in the Eyewall Region of Typhoons. NATO Adv. Sci. Inst. Ser. E Appl. Sci. 2019, 9, 2392. [Google Scholar] [CrossRef]
  14. Hulskamp, A.W.; van Wingerden, J.W.; Barlas, T.; Champliaud, H.; van Kuik, G.A.M.; Bersee, H.E.N.; Verhaegen, M. Design of a scaled wind turbine with a smart rotor for dynamic load control experiments. Wind Energy 2011, 14, 339–354. [Google Scholar] [CrossRef]
  15. Sauder, H.S.; Sarkar, P.P. Real-time prediction of aeroelastic loads of wind turbine blades in gusty and turbulent wind using an improved load model. Eng. Struct. 2017, 147, 103–113. [Google Scholar] [CrossRef]
  16. Hu, H.; Yang, Z.; Sarkar, P. Dynamic wind loads and wake characteristics of a wind turbine model in an atmospheric boundary layer wind. Exp. Fluids 2012, 52, 1277–1294. [Google Scholar] [CrossRef]
  17. Noda, H.; Ishihara, T. Wind tunnel test on mean wind forces and peak pressures acting on wind turbine nacelles. Wind Energy 2014, 17, 1–17. [Google Scholar] [CrossRef]
  18. Lu, M.-M.; Ke, S.-T.; Wu, H.-X.; Gao, M.-E.; Tian, W.-X.; Wang, H. A novel forecasting method of flutter critical wind speed for the 15 MW wind turbine blade based on aeroelastic wind tunnel test. J. Wind Eng. Ind. Aerodyn. 2022, 230, 105195. [Google Scholar] [CrossRef]
  19. Gao, R.; Yang, J.; Yang, H.; Wang, X. Wind-tunnel experimental study on aeroelastic response of flexible wind turbine blades under different wind conditions. Renew. Energy 2023, 219, 119539. [Google Scholar] [CrossRef]
  20. Ma, Y.; Chen, C.; Fan, T.; Lu, H.; Fang, J. An innovative aerodynamic design methodology of wind turbine blade models for wind tunnel real-time hybrid tests based on genetic algorithm. Ocean Eng. 2022, 257, 111724. [Google Scholar] [CrossRef]
  21. Fontecha, R.; Kemper, F.; Feldmann, M.; Witter, S.; Schelenz, R. Along-Wind Aerodynamic Damping of Wind Turbine Towers: Determination by Wind Tunnel Tests and Impact on Tower Lifetime. Energies 2022, 15, 1984. [Google Scholar] [CrossRef]
  22. Kim, Y.C. Aeroelastic and Aerodynamic Tests of Wind Turbine with Various Polygonal Towers. NATO Adv. Sci. Inst. Ser. E Appl. Sci. 2021, 11, 11740. [Google Scholar] [CrossRef]
  23. Bottasso, C.L.; Campagnolo, F.; Petrović, V. Wind tunnel testing of scaled wind turbine models: Beyond aerodynamics. J. Wind Eng. Ind. Aerodyn. 2014, 127, 11–28. [Google Scholar] [CrossRef]
  24. Martin, H.R.; Kimball, R.W.; Viselli, A.M.; Goupee, A.J. Methodology for Wind/Wave Basin Testing of Floating Offshore Wind Turbines. J. Offshore Mech. Arct. Eng. 2014, 136, 020905. [Google Scholar] [CrossRef]
  25. Yang, W.; Yu, M.; Yan, B.; Huang, G.; Yang, Q.; Zhang, S.; Hong, T.; Zhou, X.; Deng, X. Wind Tunnel Tests of Wake Characteristics for a Scaled Wind Turbine Model Based on Dynamic Similarity. Energies 2022, 15, 6165. [Google Scholar] [CrossRef]
  26. Abdelkader, A.; Aly, A.M.; Rezaee, M.; Bitsuamlak, G.T.; El Naggar, M.H. On the evaluation of wind loads for wind turbines’ foundation design: Experimental and numerical investigations. Struct. Des. Tall Spec. Build. 2017, 26, e1362. [Google Scholar] [CrossRef]
  27. Tian, W.; Ozbay, A.; Hu, H. A wind tunnel study of wind loads on a model wind turbine in atmospheric boundary layer winds. J. Fluids Struct. 2019, 85, 17–26. [Google Scholar] [CrossRef]
  28. Verelst, D.R.S.; Larsen, T.J.; van Wingerden, J.W. Wind tunnel tests of a free yawing downwind wind turbine. J. Phys. Conf. Ser. 2014, 555, 012103. [Google Scholar] [CrossRef]
  29. Frederik, J.A.; Weber, R.; Cacciola, S.; Campagnolo, F.; Croce, A.; Bottasso, C.; van Wingerden, J.-W. Periodic dynamic induction control of wind farms: Proving the potential in simulations and wind tunnel experiments. Wind Energy Sci. Discuss. 2019, 1–18. [Google Scholar] [CrossRef]
  30. Nanos, E.M.; Bottasso, C.L.; Campagnolo, F.; Mühle, F.; Letizia, S.; Iungo, G.V.; Rotea, M.A. Design, steady performance and wake characterization of a scaled wind turbine with pitch, torque and yaw actuation. Wind Energy Sci. 2022, 7, 1263–1287. [Google Scholar] [CrossRef]
  31. National Renewable Energy Laboratory (NREL). OpenFAST Documentation—Release v2.3.0. 2020. Available online: https://readthedocs.org/projects/mas-openfast-fork/downloads/pdf/latest/ (accessed on 2 April 2020).
  32. He, R.; Sun, H.; Gao, X.; Yang, H. Wind tunnel tests for wind turbines: A state-of-the-art review. Renew. Sustain. Energy Rev. 2022, 166, 112675. [Google Scholar] [CrossRef]
  33. Krogstad, P.-Å.; Eriksen, P.E. “Blind test” calculations of the performance and wake development for a model wind turbine. Renew. Energy 2013, 50, 325–333. [Google Scholar] [CrossRef]
  34. McTavish, S.; Feszty, D.; Nitzsche, F. Evaluating Reynolds number effects in small-scale wind turbine experiments. J. Wind Eng. Ind. Aerodyn. 2013, 120, 81–90. [Google Scholar] [CrossRef]
  35. McTavish, S.; Feszty, D.; Nitzsche, F. An experimental and computational assessment of blockage effects on wind turbine wake development. Wind Energy 2014, 17, 1515–1529. [Google Scholar] [CrossRef]
  36. Treuren, V.; Kenneth, W. Small-Scale Wind Turbine Testing in Wind Tunnels Under Low Reynolds Number Conditions. J. Energy Res. Technol. 2015, 137, 051208. [Google Scholar] [CrossRef]
  37. de Ridder, E.-J.; Otto, W.; Zondervan, G.-J.; Huijs, F.; Vaz, G. Development of a scaled-down floating wind turbine for offshore basin testing. In International Conference on Offshore Mechanics and Arctic Engineering; American Society of Mechanical Engineers: New York, NY, USA, 2014; p. V09AT09A027. [Google Scholar]
  38. Fowler, M.J.; Kimball, R.W.; Thomas, D.A.; Goupee, A.J. Design and Testing of Scale Model Wind Turbines for Use in Wind/Wave Basin Model Tests of Floating Offshore Wind Turbines. In Proceedings of the ASME 2013 32nd International Conference on Ocean, Offshore and Arctic Engineering, Nantes, France, 9–14 June 2013; p. V008T09A004. [Google Scholar]
  39. Wen, B.; Tian, X.; Dong, X.; Li, Z.; Peng, Z.; Zhang, W.; Wei, K. Design approaches of performance-scaled rotor for wave basin model tests of floating wind turbines. Renew. Energy 2020, 148, 573–584. [Google Scholar] [CrossRef]
  40. Bayati, I.; Belloli, M.; Bernini, L.; Zasso, A. Aerodynamic design methodology for wind tunnel tests of wind turbine rotors. J. Wind Eng. Ind. Aerodyn. 2017, 167, 217–227. [Google Scholar] [CrossRef]
  41. Marten, D.; Wendler, J. QBlade Short Manual. 2018. Available online: https://www.researchgate.net/profile/David-Marten/publication/281279669_QBlade_Short_Manual_v08/links/55dedad208ae79830bb59604/QBlade-Short-Manual-v08.pdf (accessed on 27 August 2015).
  42. Damgaard, M.; Ibsen, L.; Andersen, L.; Andersen, J. Cross-wind modal properties of offshore wind turbines identified by full scale testing. J. Wind Eng. Ind. Aerodyn. 2013, 116, 94–108. [Google Scholar] [CrossRef]
  43. Shirzadeh, R.; Devriendt, C.; Bidakhvidi, M.; Guillaume, P. Experimental and computational damping estimation of an offshore wind turbine on a monopile foundation. J. Wind Eng. Ind. Aerodyn. 2013, 120, 96–106. [Google Scholar] [CrossRef]
  44. Caicedo, J.M.; Dyke Shirley, J.; Johnson Erik, A. Natural Excitation Technique and Eigensystem Realization Algorithm for Phase I of the IASC-ASCE Benchmark Problem: Simulated Data. J. Eng. Mech. 2004, 130, 49–60. [Google Scholar] [CrossRef]
  45. Bajrić, A.; Høgsberg, J.; Rüdinger, F. Evaluation of damping estimates by automated Operational Modal Analysis for offshore wind turbine tower vibrations. Renew. Energy 2018, 116, 153–163. [Google Scholar] [CrossRef]
  46. Brincker, R.; Ventura, C.E. Introduction to Operational Modal Analysis; John Wiley & Sons: Oxford, UK, 2015. [Google Scholar]
  47. Zahid, F.B.; Ong, Z.C.; Khoo, S.Y. A review of operational modal analysis techniques for in-service modal identification. J. Brazil Soc. Mech. Sci. Eng. 2020, 42, 398. [Google Scholar] [CrossRef]
  48. Ozbek, M.; Meng, F.; Rixen, D.J. Challenges in testing and monitoring the in-operation vibration characteristics of wind turbines. Mech. Syst. Signal Process 2013, 41, 649–666. [Google Scholar] [CrossRef]
  49. Xiao, F.; Tian, C.; Wait, I.; Yang, Z.; Still, B.; Chen, G.S. Condition monitoring and vibration analysis of wind turbine. Adv. Mech. Eng. 2020, 12, 168781402091378. [Google Scholar] [CrossRef]
  50. Dai, K.; Wang, Y.; Huang, Y.; Zhu, W.; Xu, Y. Development of a modified stochastic subspace identification method for rapid structural assessment of in-service utility-scale wind turbine towers. Wind Energy 2017, 20, 1687–1710. [Google Scholar] [CrossRef]
Figure 1. HD-2 wind tunnel at Hunan University.
Energies 17 04080 g001
Figure 2. ANSYS model (a) and the first flapwise mode shape (b) of the scaled blade.
Energies 17 04080 g002
Figure 3. Design and fabrication process diagram of the scaled wind turbine model.
Energies 17 04080 g003
Figure 4. Sensor layout for the scaled wind turbine model.
Energies 17 04080 g004
Figure 5. Analysis of the free decay response of the tower of the scaled wind turbine model (a) and the blade scaled model (b).
Energies 17 04080 g005
Figure 6. Results of the first-mode modal vibration testing for the scaled model tower of the wind turbine in both FA (a) and SS (b) directions.
Energies 17 04080 g006
Figure 7. Results of thrust coefficient measurement in wind tunnel experiments at a 0° pitch angle.
Energies 17 04080 g007
Figure 8. Tower-top acceleration response in the FA and SS directions (a) and acceleration responses at various measurement points on the tower (b) under rated operating conditions.
Energies 17 04080 g008
Figure 9. Power spectral analysis of the acceleration responses in the FA (a) and SS (b) directions at various measurement points on the tower under rated operating conditions.
Energies 17 04080 g009
Figure 10. Comparison of root mean square values of acceleration responses in the FA (a) and SS (b) directions at different measurement points under various operating conditions.
Energies 17 04080 g010
Figure 11. The response and power spectral analysis of the acceleration in the FA (a,c) and SS (b,d) directions at the 1# measurement point on the tower top under parked conditions.
Energies 17 04080 g011
Figure 12. The comparison of root mean square values of acceleration responses in FA (a,c) and SS (b,d) directions at measurement point 1# on the tower top under different yaw angle conditions during the parked state.
Energies 17 04080 g012aEnergies 17 04080 g012b
Figure 13. Force analysis of the blade scaled model sections under different yaw angle conditions during the parked state.
Energies 17 04080 g013
Figure 14. Comparison between the converted tower displacement from the wind tunnel test and the simulated displacement from OpenFAST (FA (a) and SS (b) directions for the 0° pitch-angle condition, FA (c) and SS (d) directions for the 4° pitch angle condition, and FA (e) and SS (f) directions for the 8° pitch angle condition).
Energies 17 04080 g014aEnergies 17 04080 g014b
Figure 15. Acceleration response time histories of tower-top measurement point 1# in the FA (a) and SS (b) directions in the rotor stop test (wind speed of 4.5 m/s and rotor speed of 260 rpm).
Energies 17 04080 g015
Figure 16. Power spectral analysis of acceleration responses in the FA (a) and SS (b) directions at various measurement points on the tower in the rotor stop test (wind speed of 4.5 m/s and rotor speed of 260 rpm).
Energies 17 04080 g016
Figure 17. Identified natural frequencies of the first FA (a) and SS (b) modes using different identification methods.
Energies 17 04080 g017
Figure 18. Identified damping ratios of the first FA (a) and SS (b) modes using different identification methods.
Energies 17 04080 g018
Figure 19. Identified mode shapes of the first FA (a) and SS (b) modes using different identification methods.
Energies 17 04080 g019
Table 1. Design parameters of the scaled wind turbine model.
ParameterFull-Scale NREL 5 MWSimilarity RatioAeroelastic Model
Blade Length (m)61.51/n0.820
Hub Radius (m)1.51/n0.020
Tower Height (m)87.61/n1.168
Hub Height (m)901/n1.200
Rotor Mass and Nacelle Mass:Tower Mass1:1-1:1
First-Order Natural Frequency of the Tower in the FA Direction (Hz)0.324n/m6.943
First-Order Natural Frequency of the Tower in the SS Direction (Hz)0.312n/m6.686
First-Order Natural Frequency of Blade Flapwise (Hz)0.68n/m14.57
Rated Rotor Speed (rpm)12.1n/m259
Rated Wind Speed (m/s)11.41/m3.26
Table 2. Wind tunnel test conditions for the operational state of the aeroelastic scaled model of the wind turbine.
ConditionWind Speed (m/s)Rotor Speed (rpm)ConditionWind Speed (m/s)Rotor Speed (rpm)
11.3716052.49220
21.6617062.75240
31.9218073.06255
42.2119083.35~6.91260
Disclaimer/Publisher’s Note: The statements, opinions and data contained in all publications are solely those of the individual author(s) and contributor(s) and not of MDPI and/or the editor(s). MDPI and/or the editor(s) disclaim responsibility for any injury to people or property resulting from any ideas, methods, instructions or products referred to in the content.

