
Thermodynamic Model for Cold-Phase Influence on Light Vehicles’ Fuel Consumption


Abstract
1. Introduction
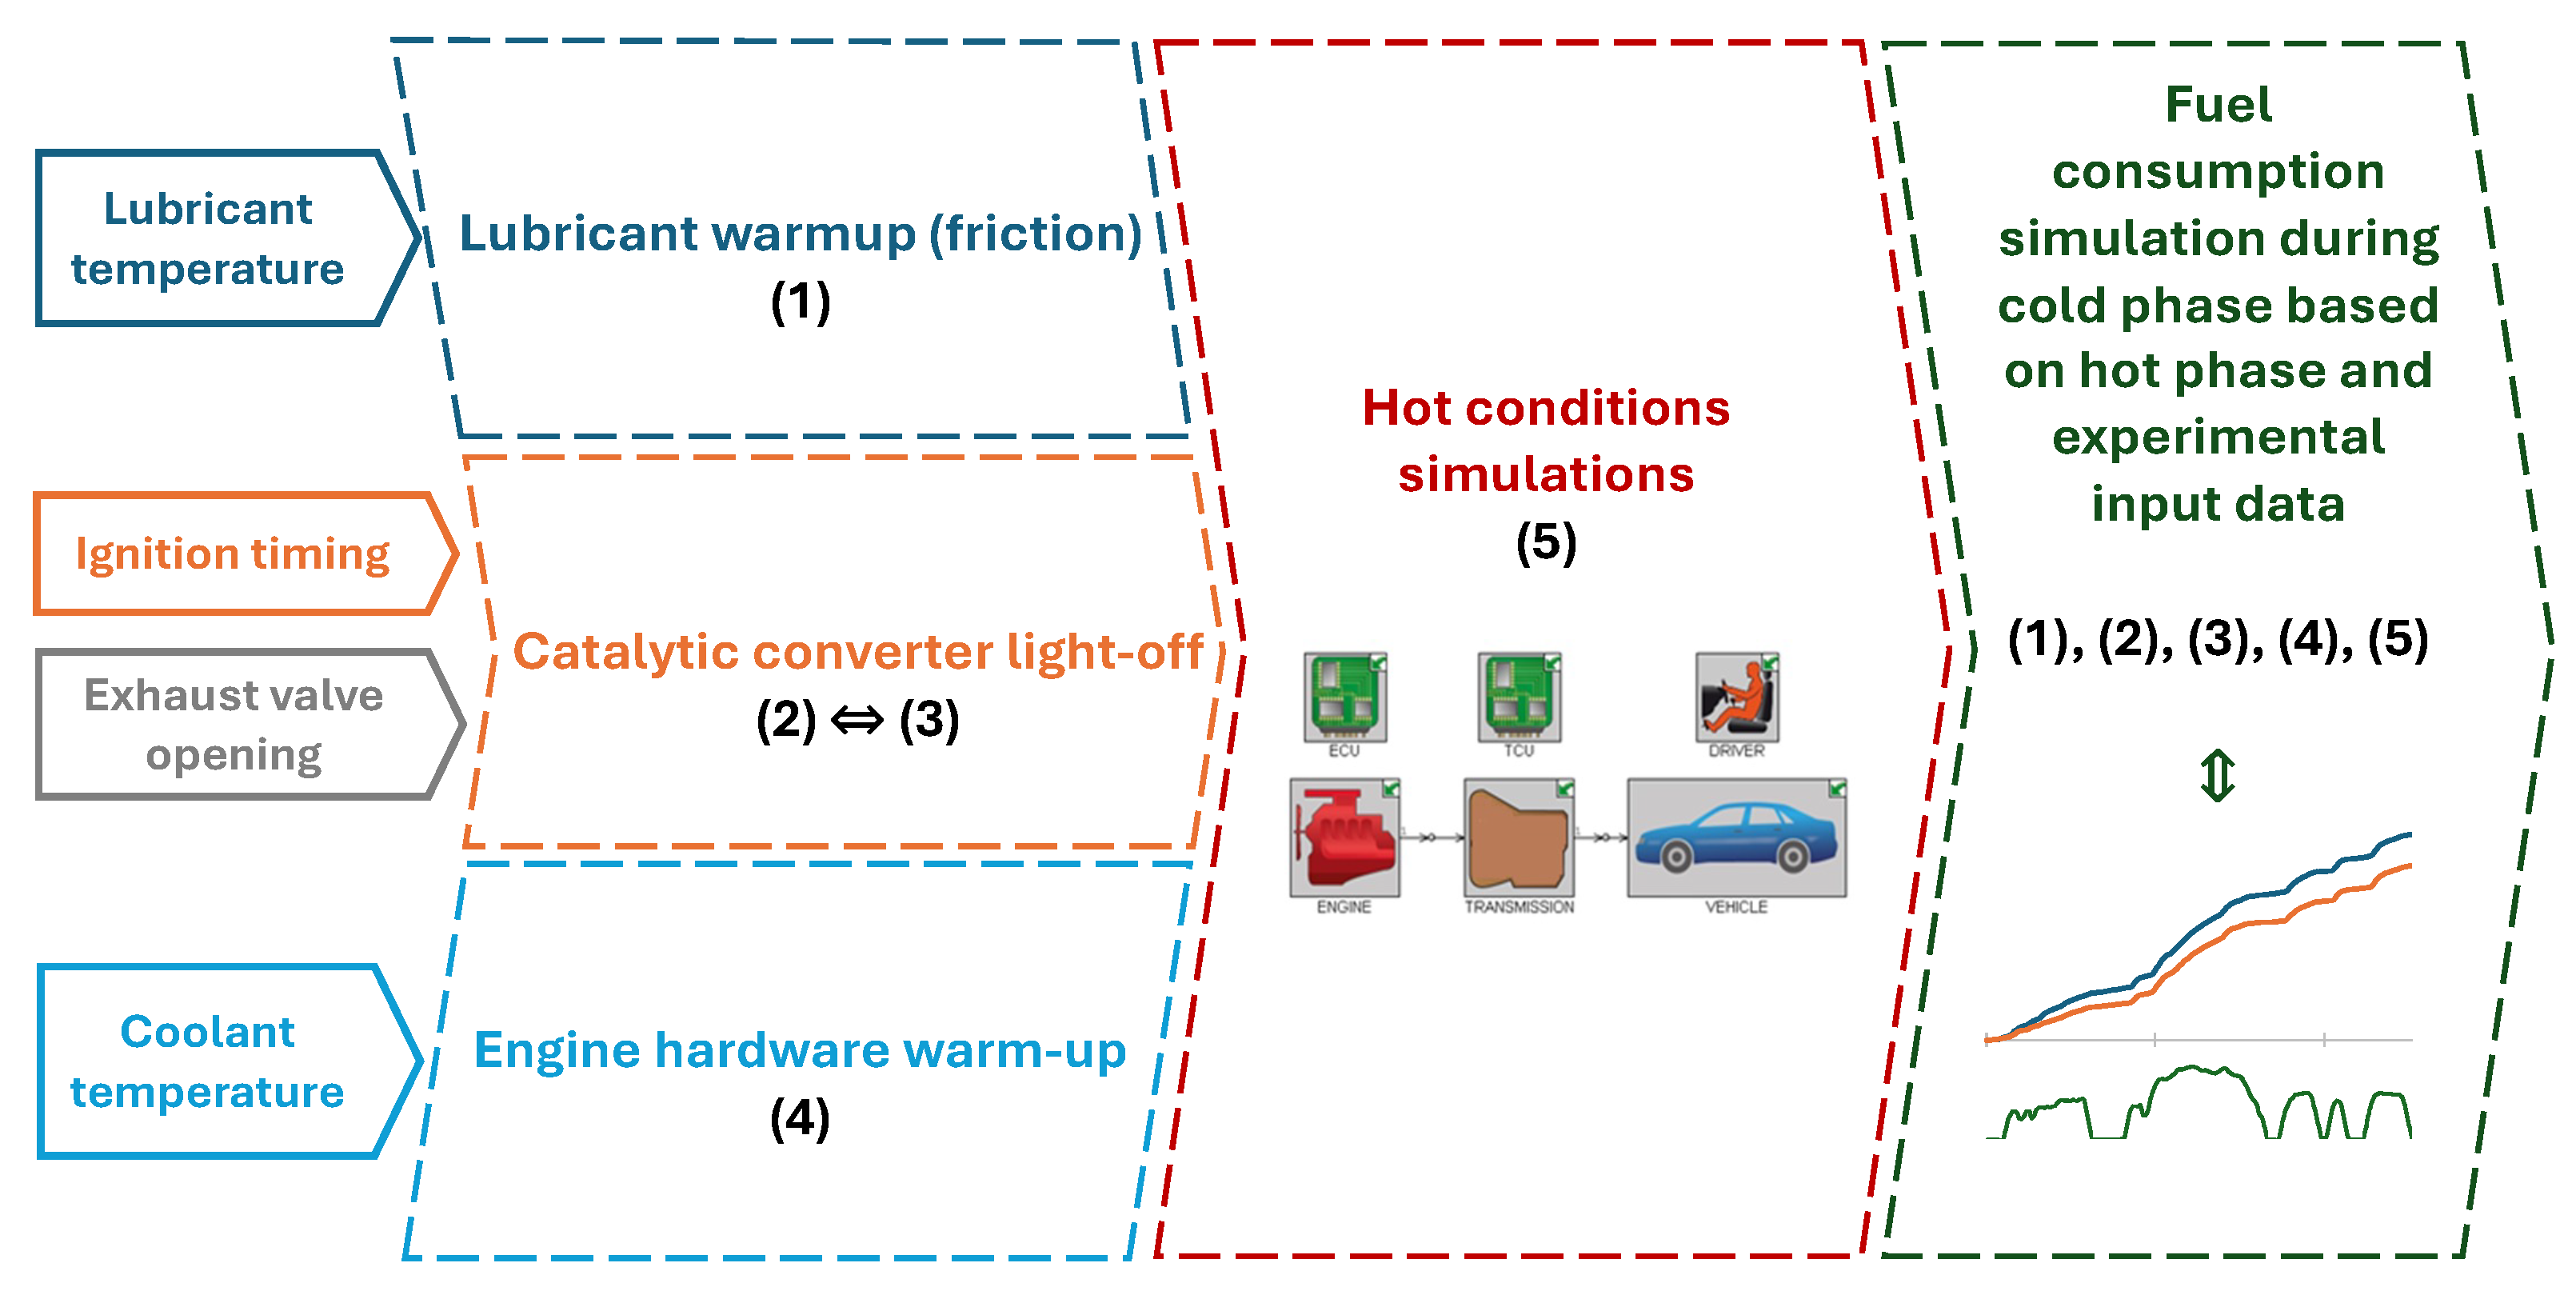
2. Methods
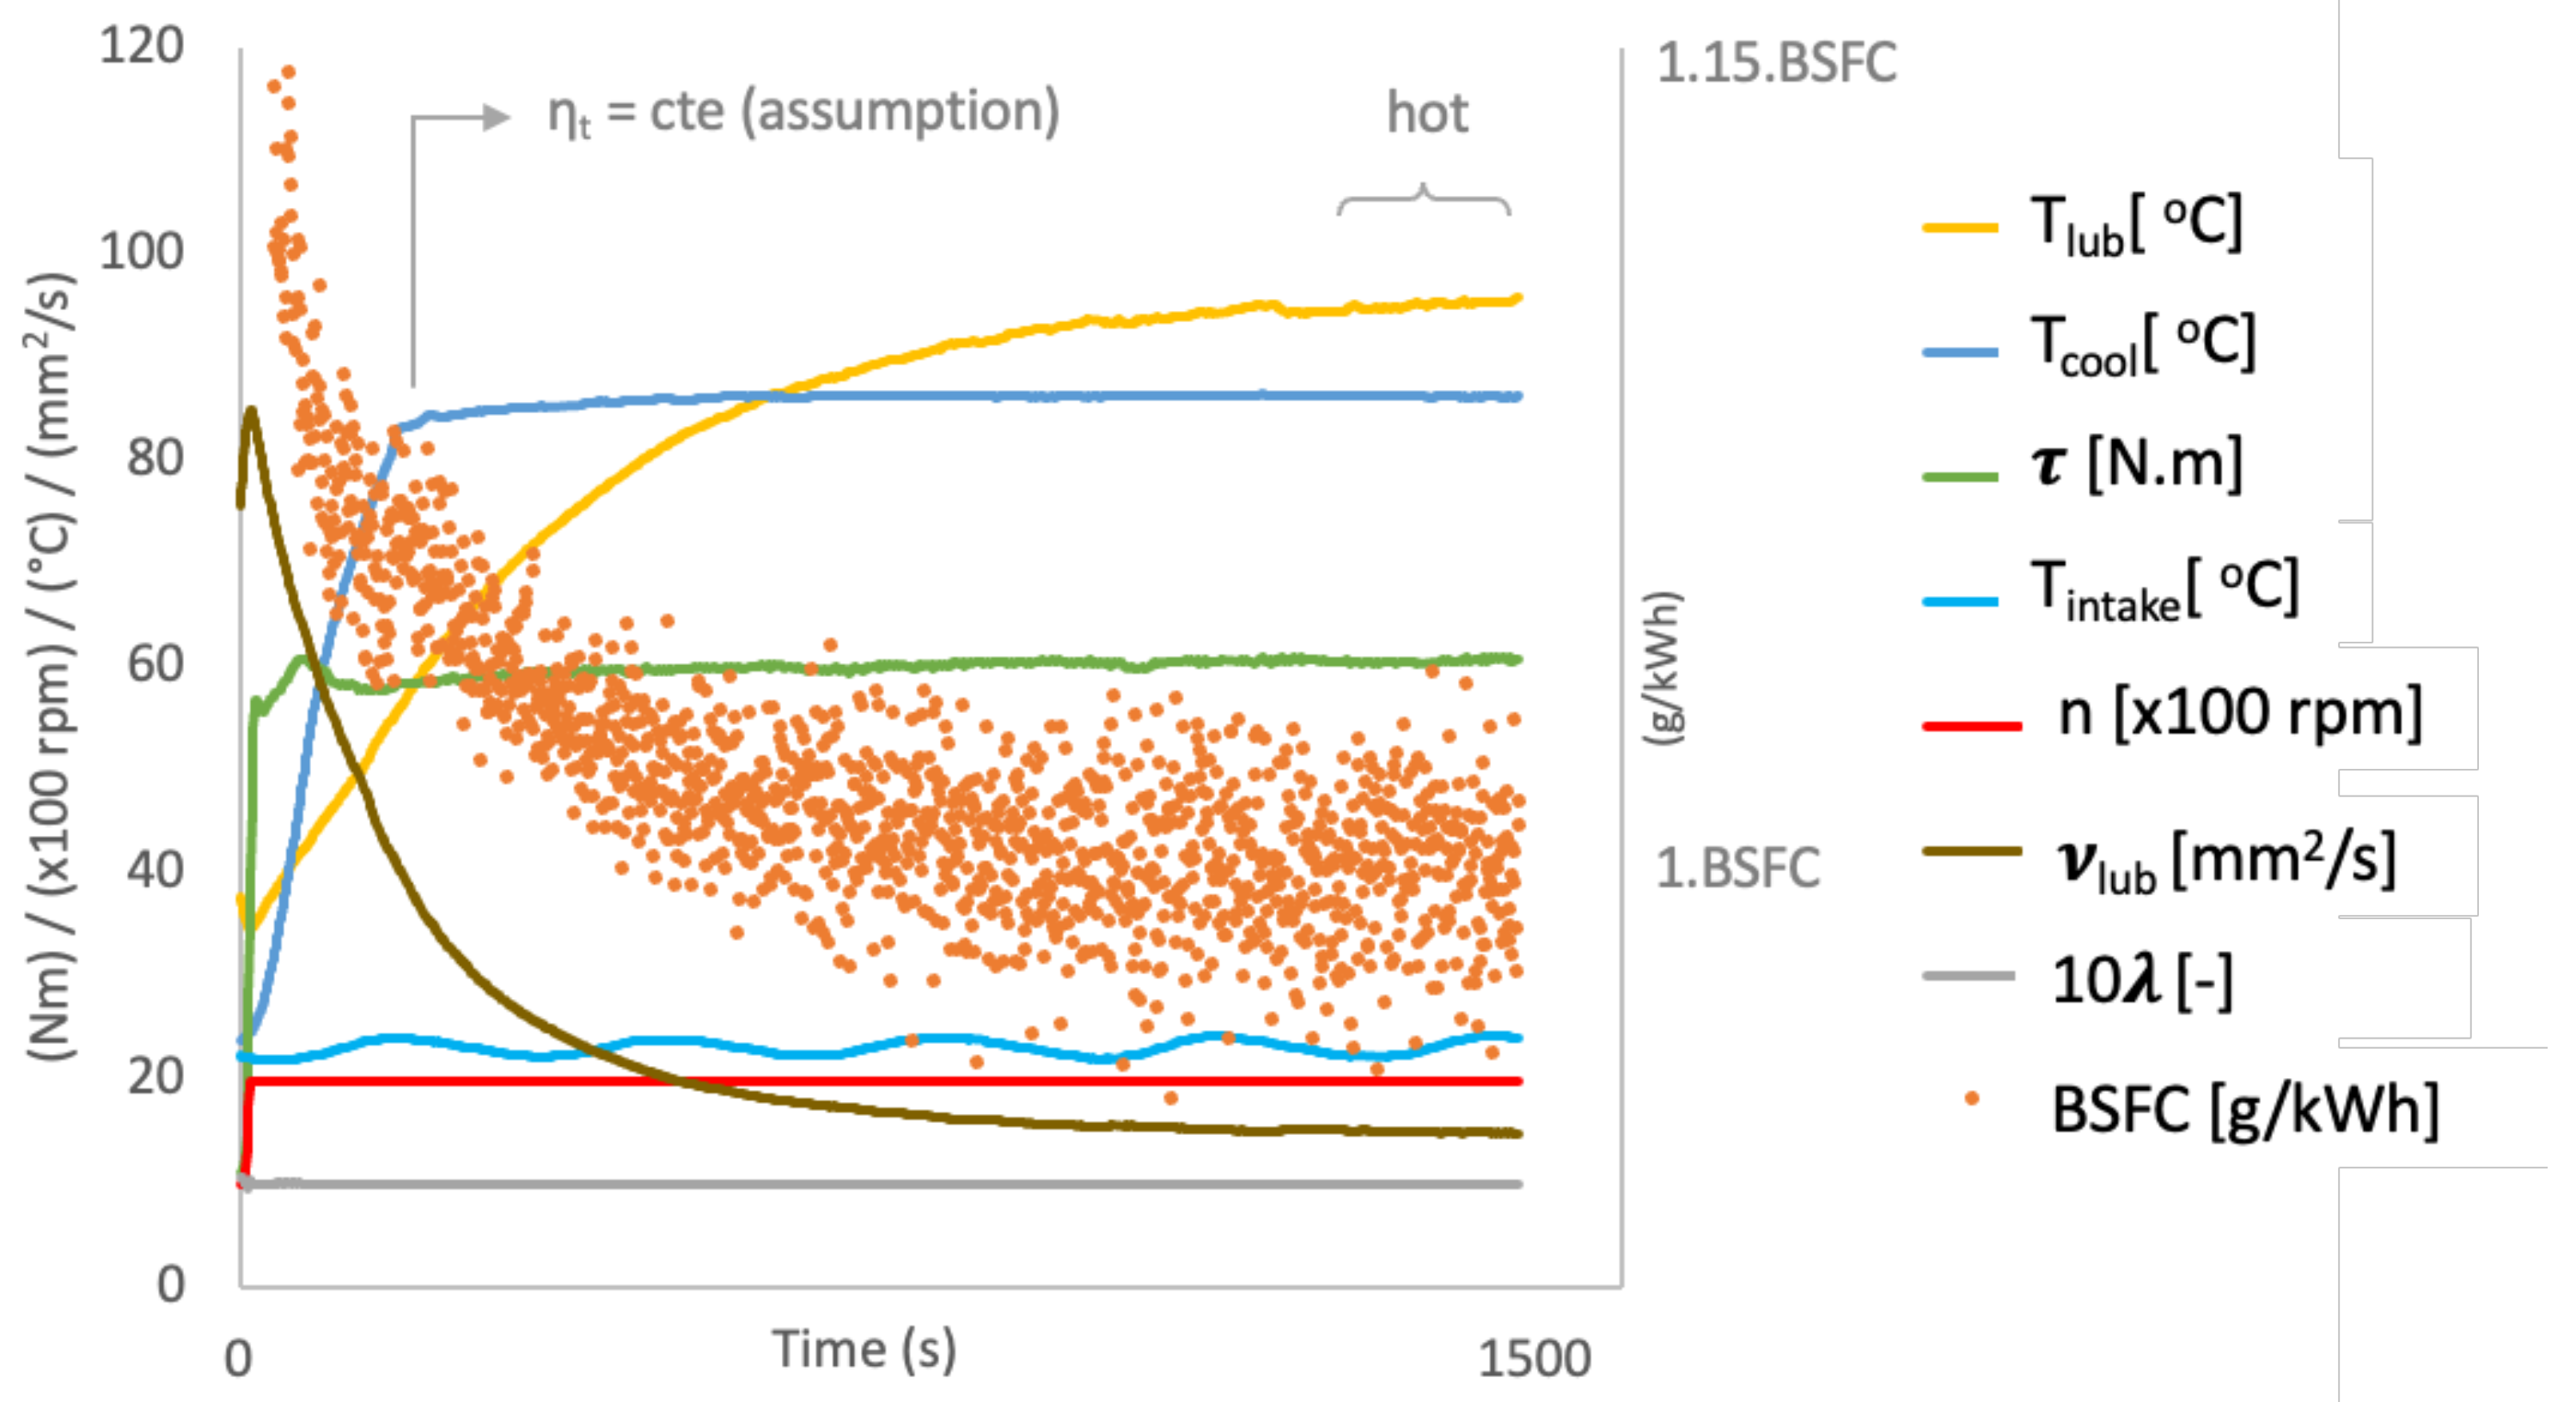
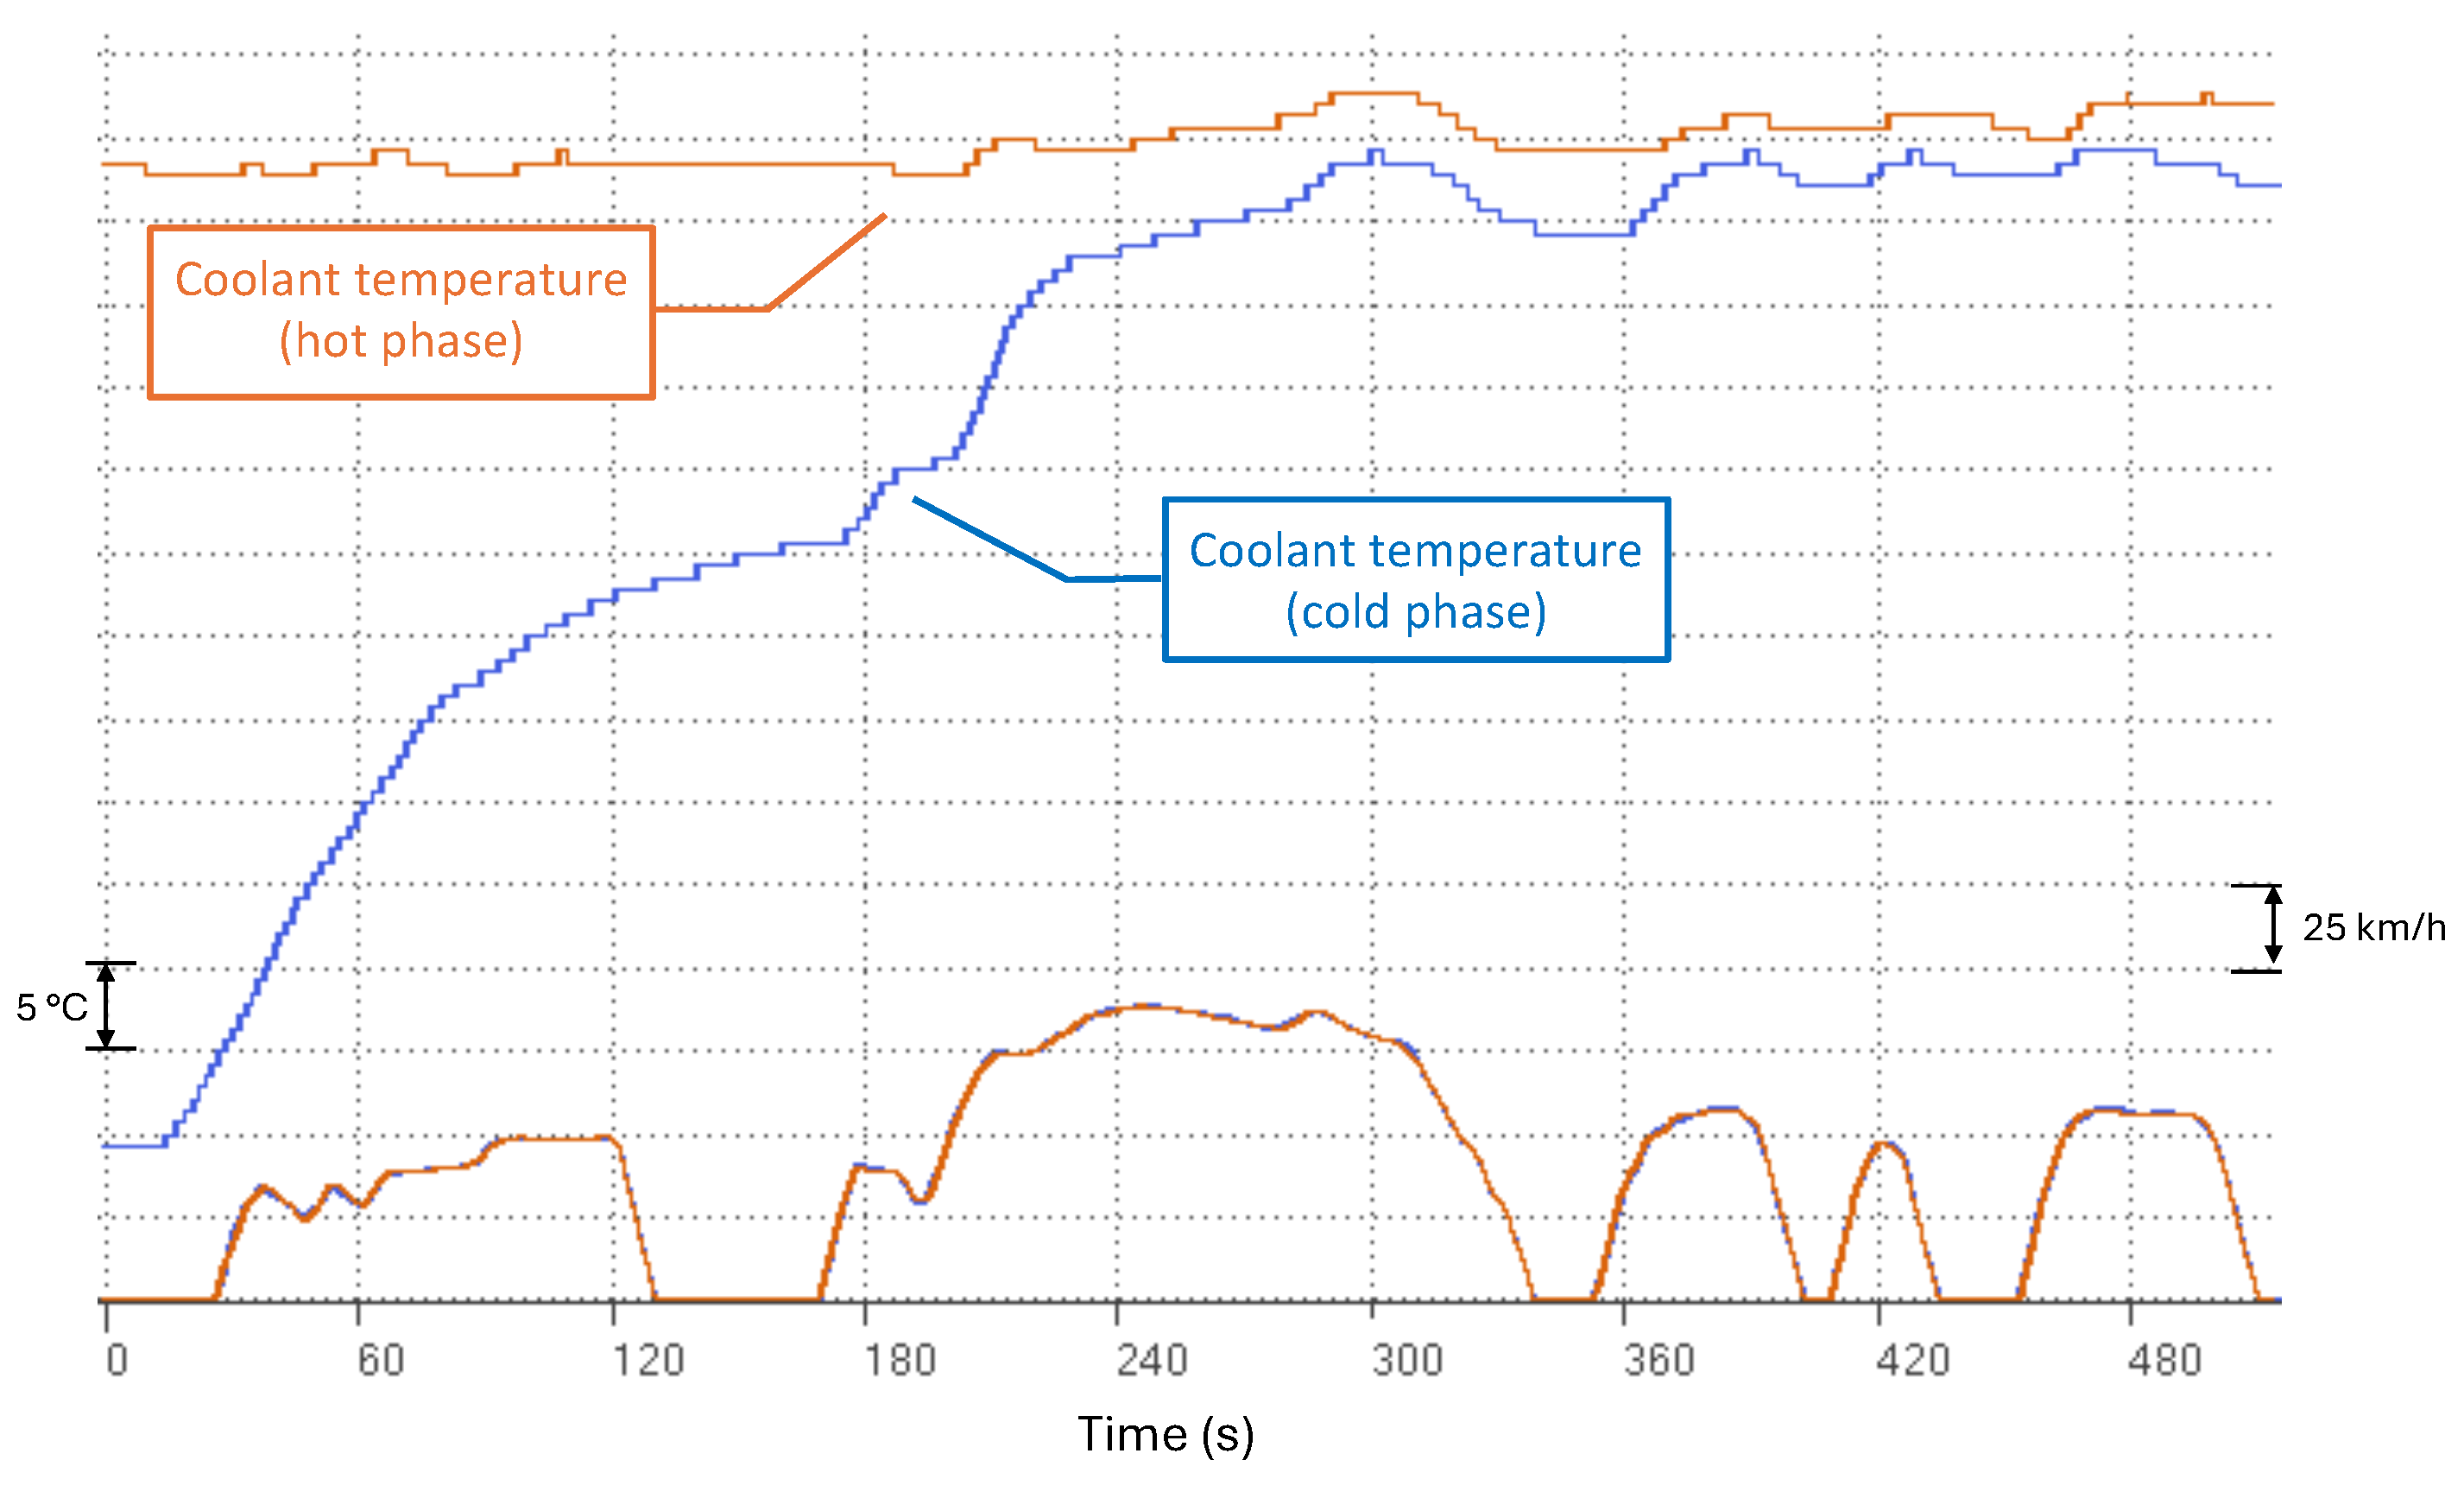
2.1. Hot-Phase Simulation and Experimental Mathematical Model Correlation
- Engine-specific fuel consumption mapped in dynamometer in steady-state conditions.
- Full-load engine curve.
- Engine idle speed.
- Fuel cut-off strategy.
- Torque demand as function of gas pedal position.
- Transmission efficiency maps.
- Dynamic torque converter curves.
- Torque converter lock-up according to transmission control unity (TCU) maps.
- Measured gear shifting.
- Measured vehicle speed profile.
- Engine mapping uncertainty.
- Vehicle production variability.
- Vehicle testing variability.
- Dynamic transient maneuvers.
- Engine torque reserve applied specifically in vehicle.
- Auxiliary load difference between dynamometer and vehicle (e.g., alternator).
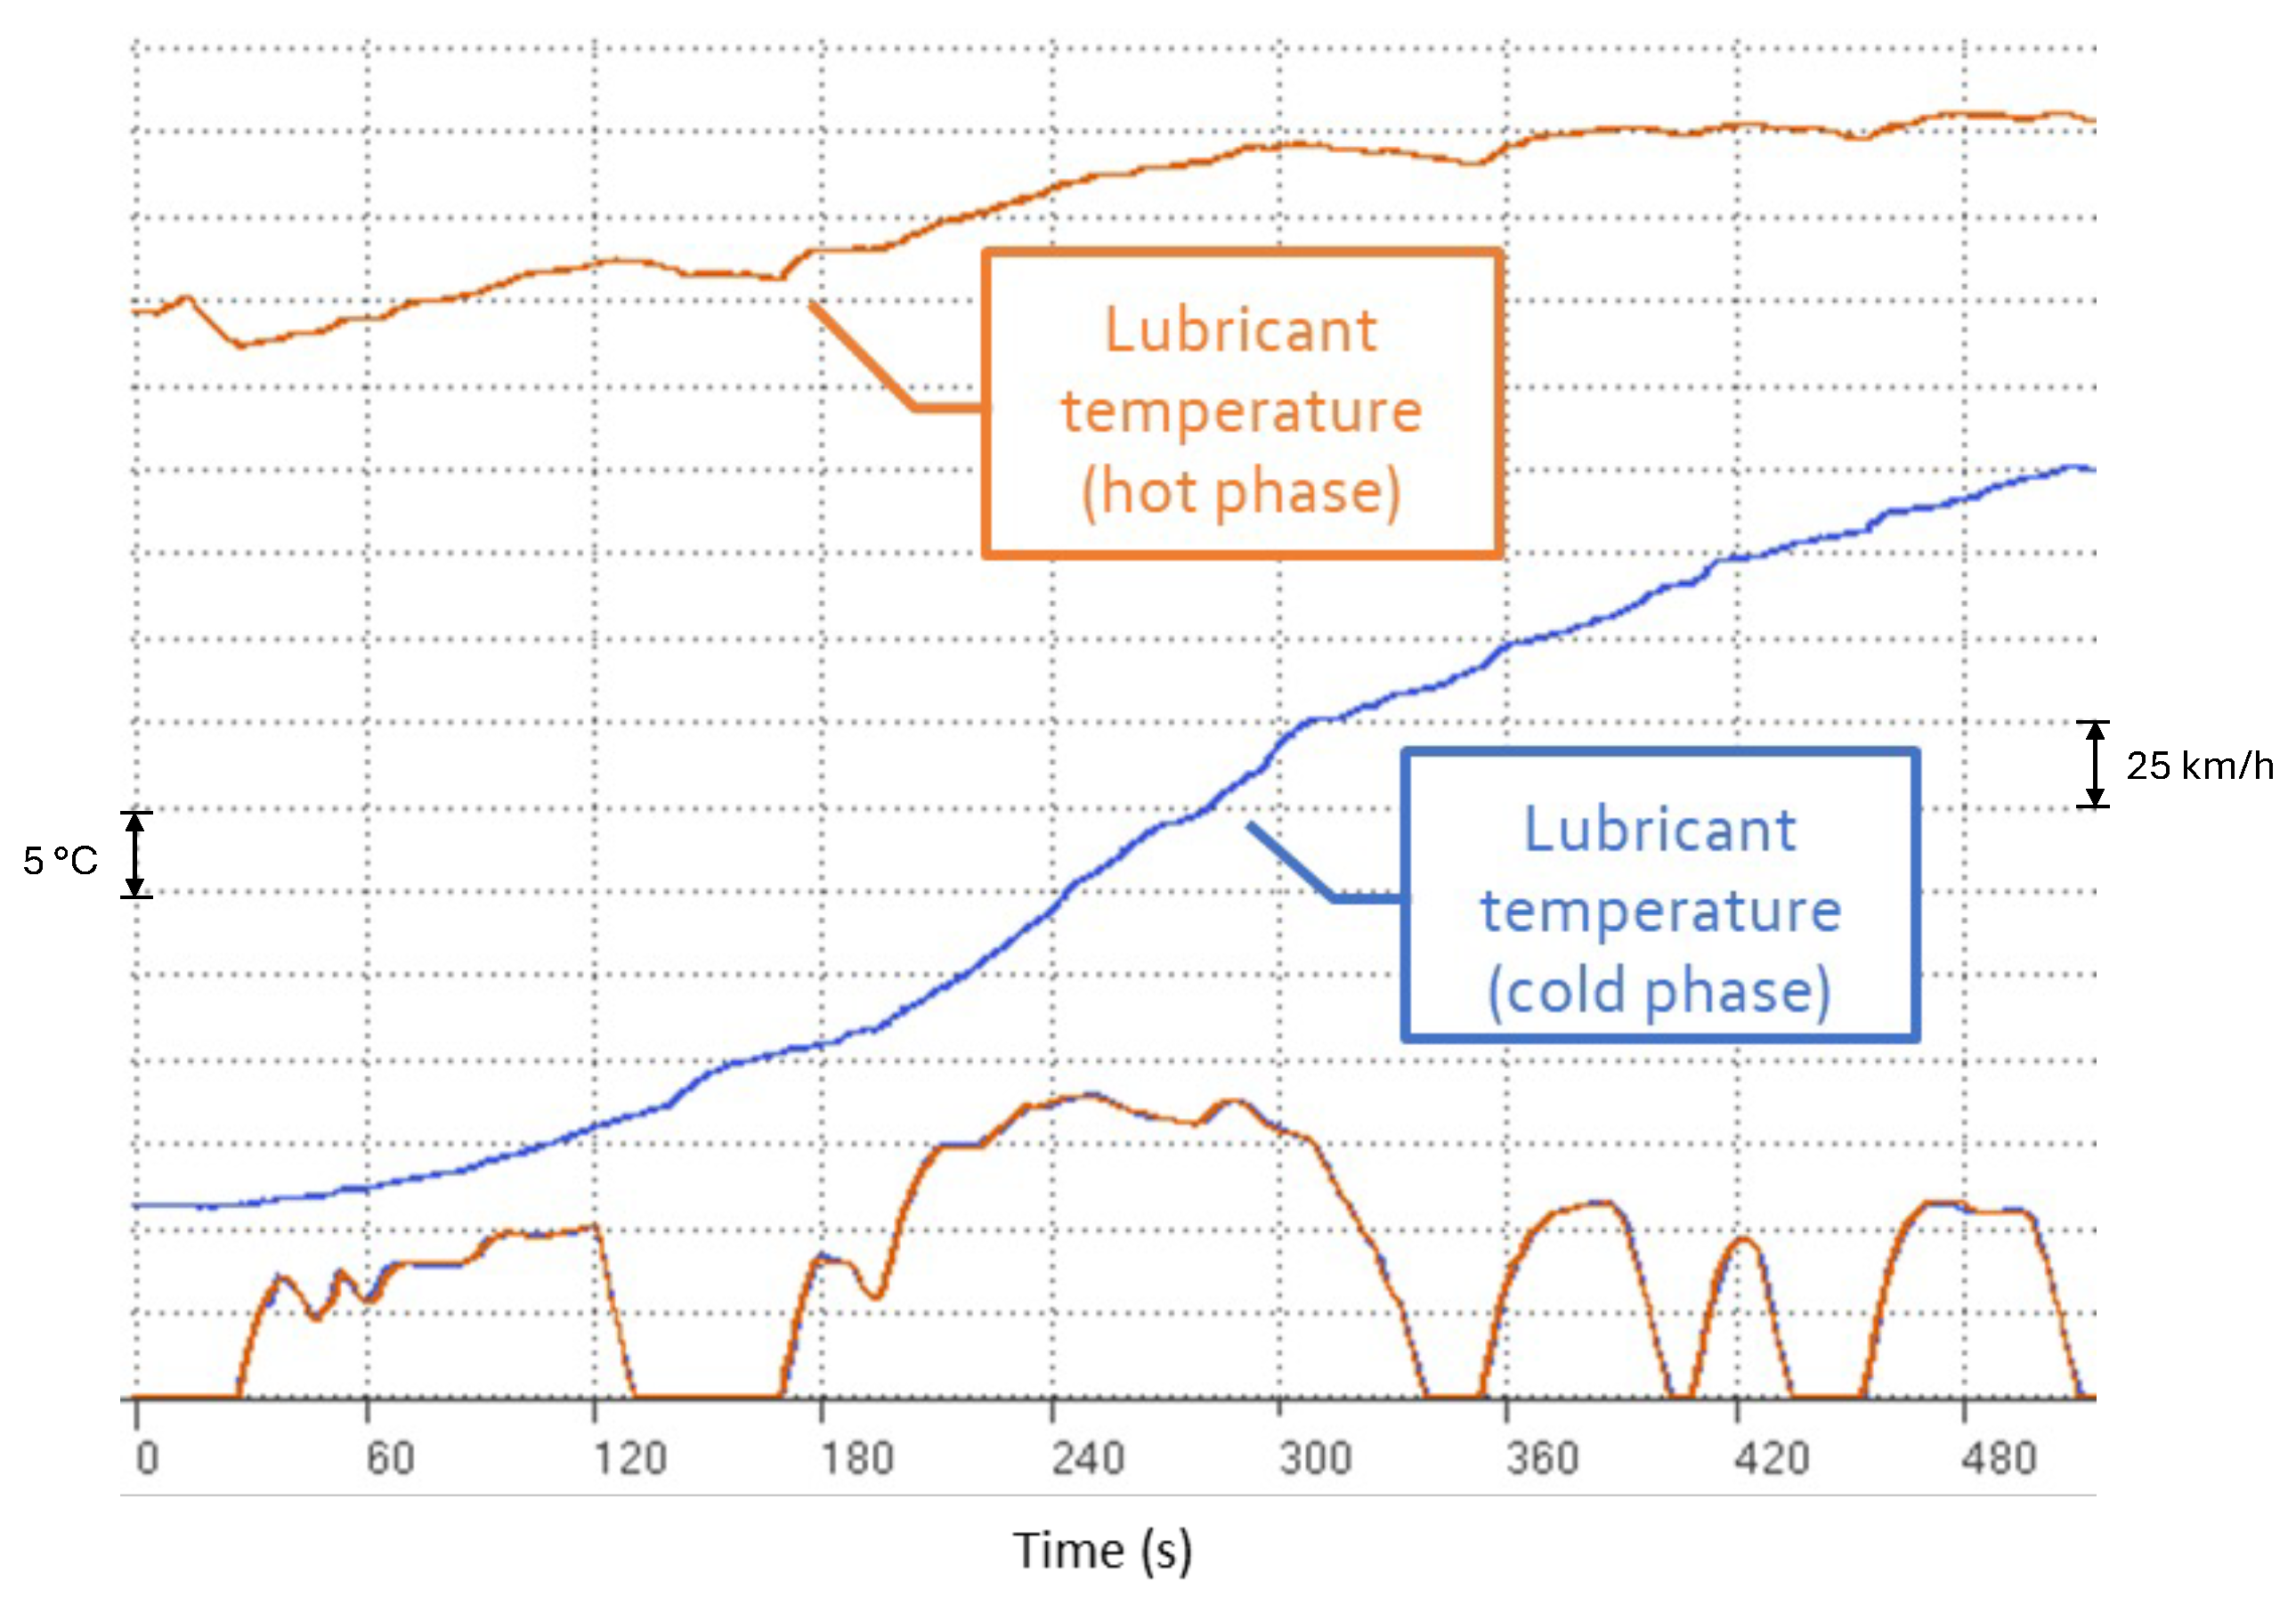
2.2. Lubricant Temperature Effect
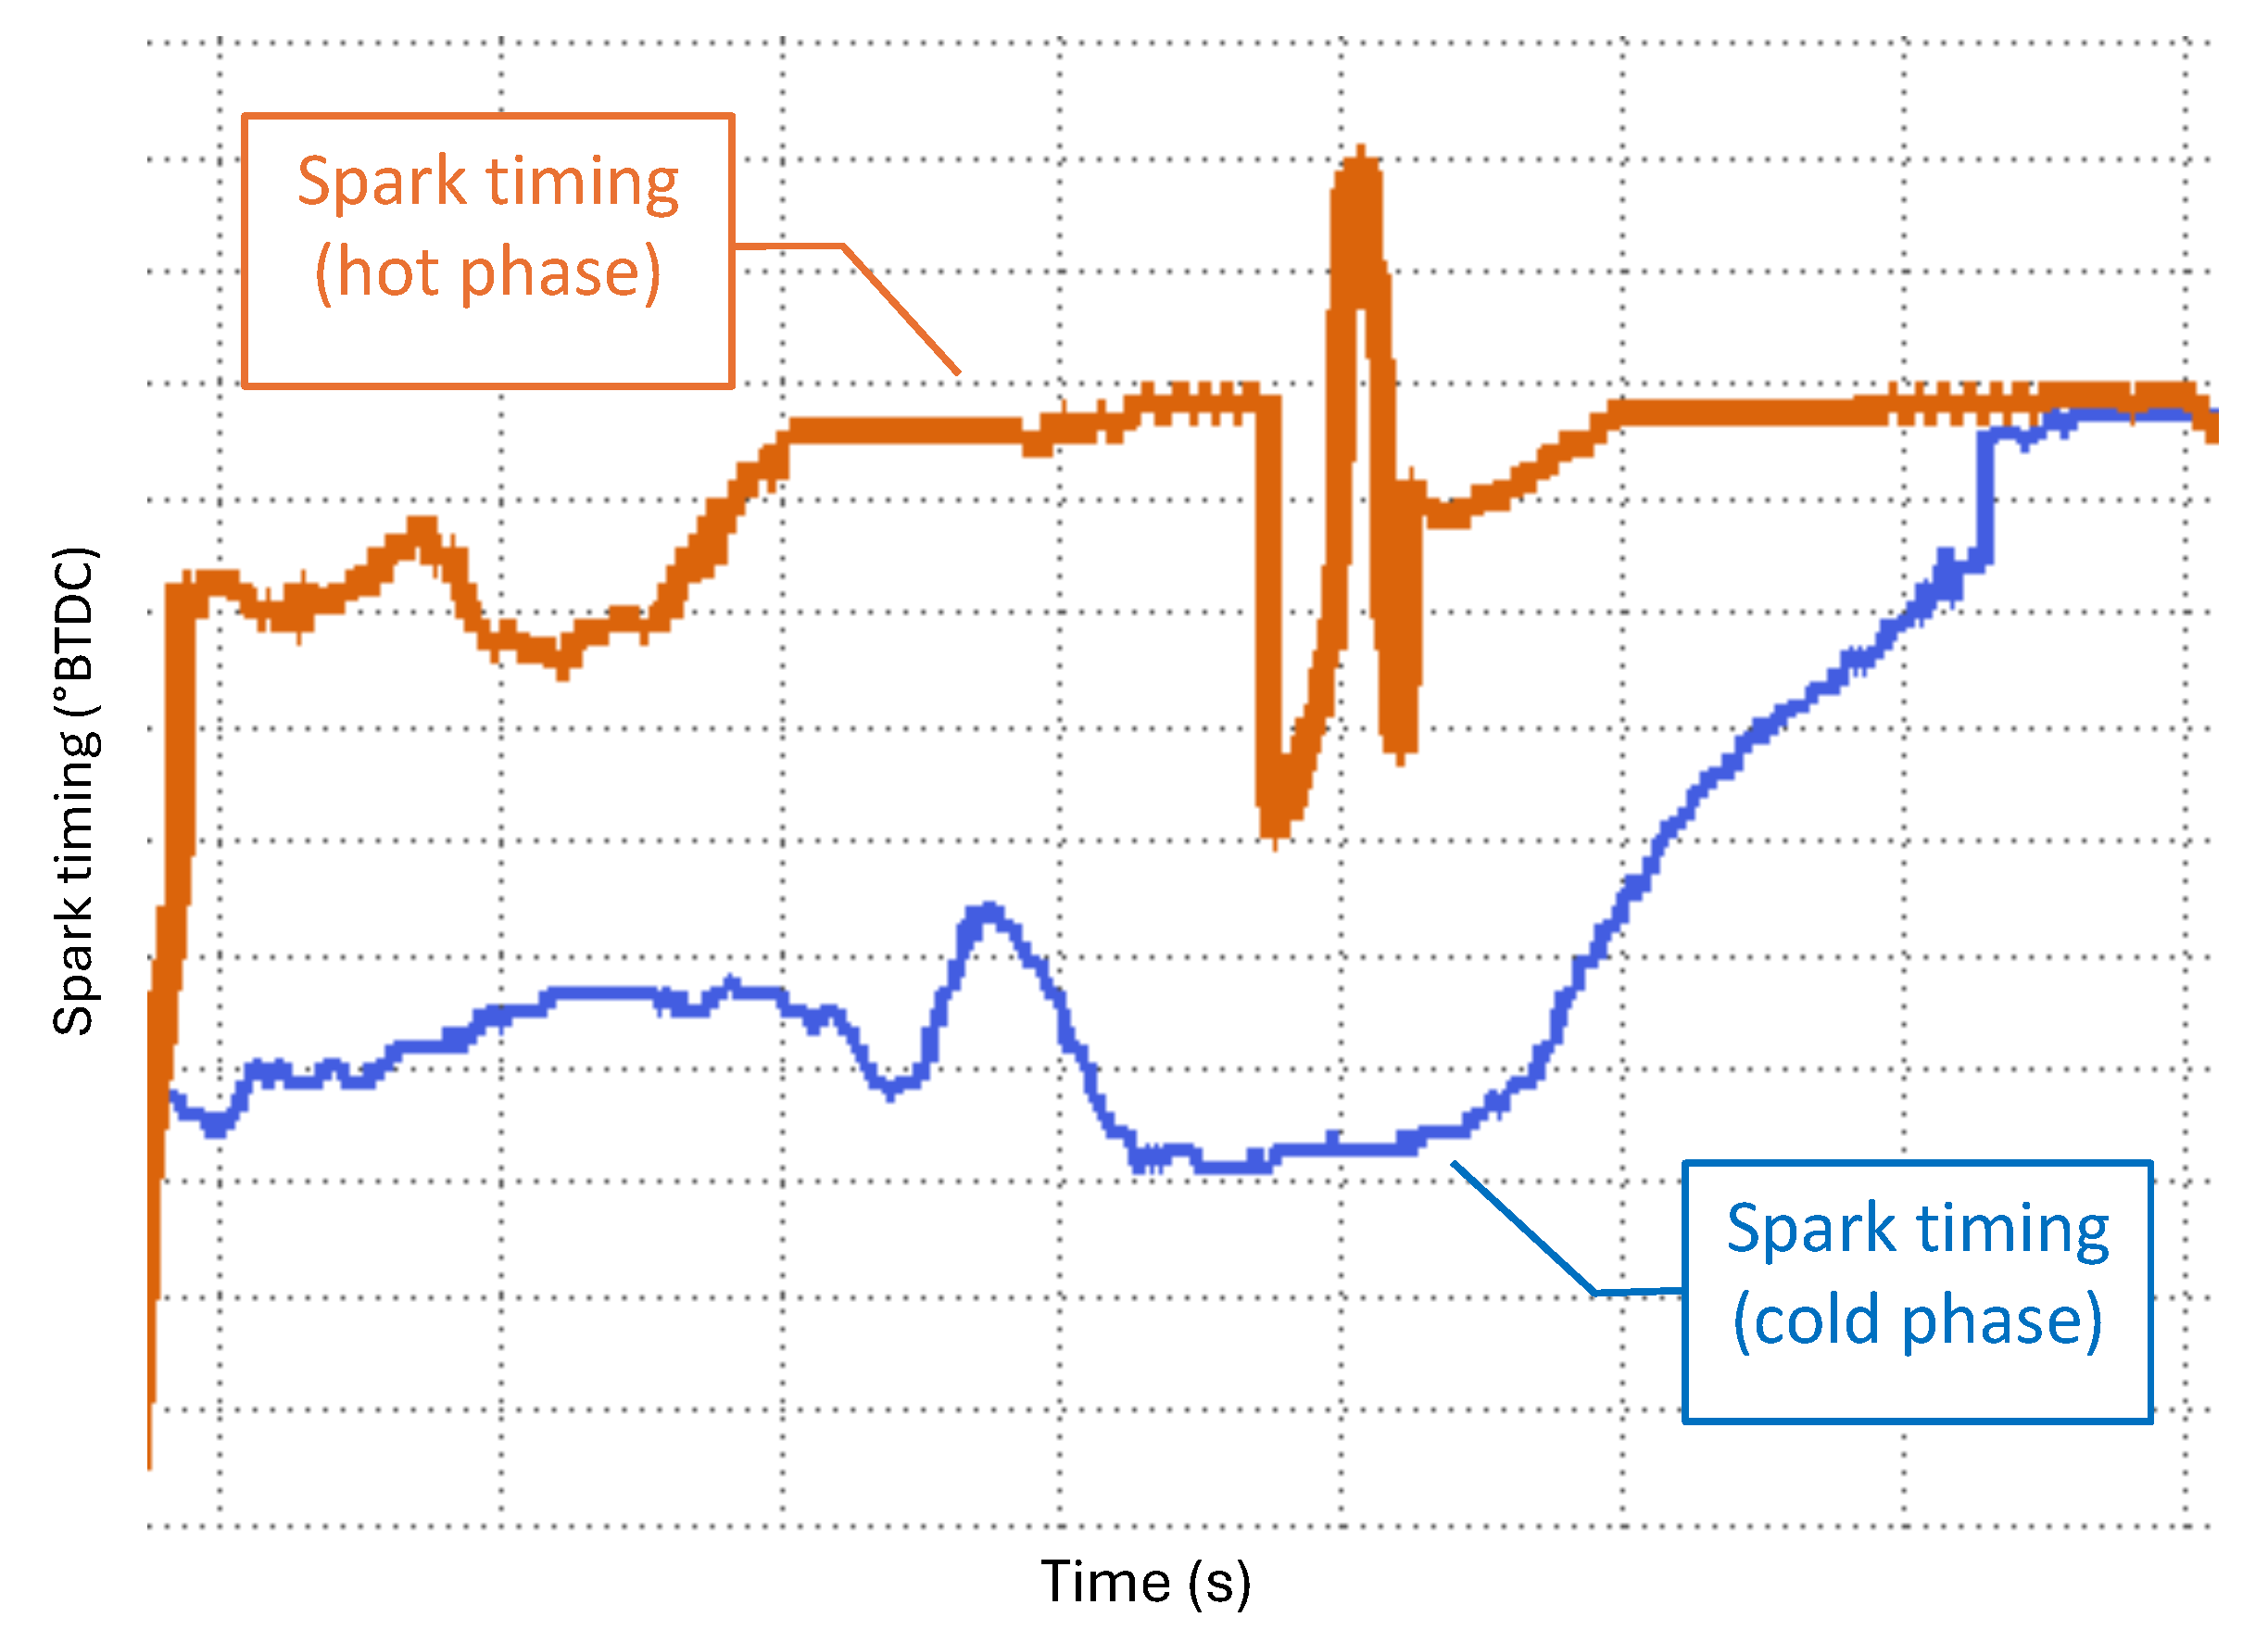
2.3. Catalyst Heating to Anticipate Light-Off
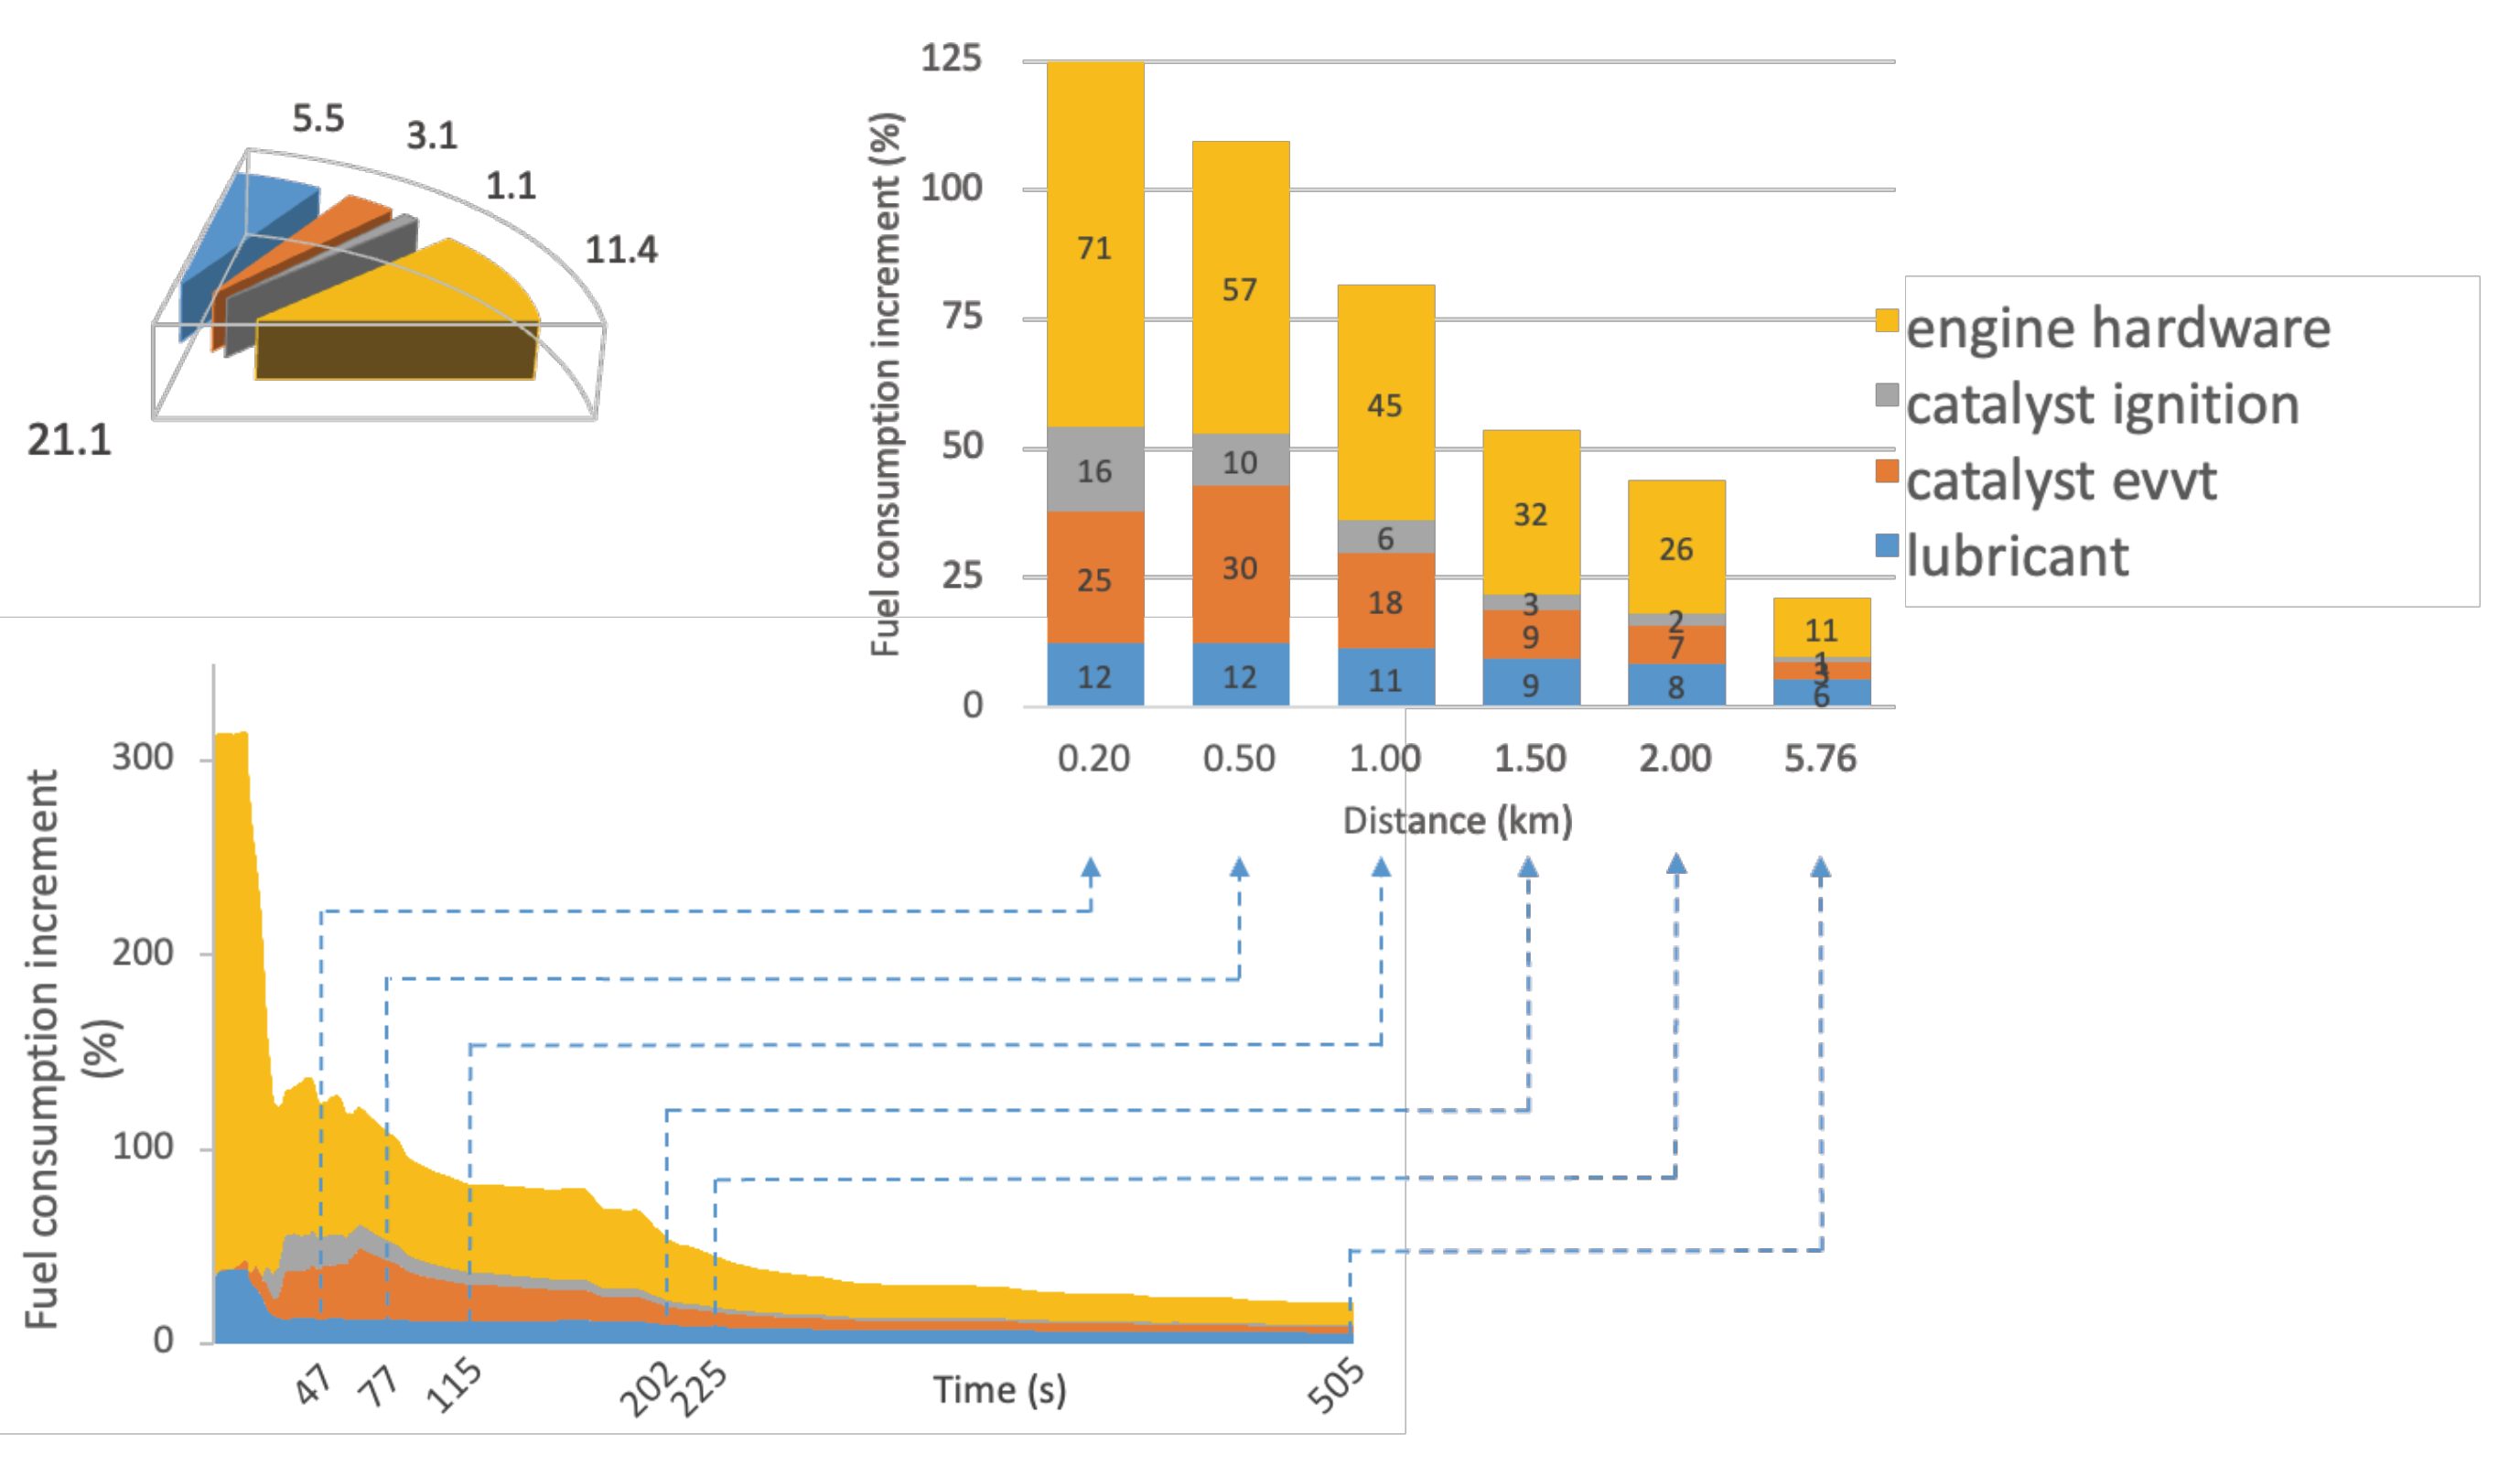
2.4. Engine Hardware Heating
3. Results and Discussions
4. Concluding Remarks
Author Contributions
Funding
Data Availability Statement
Conflicts of Interest
Nomenclature
| Engine fuel consumption increase from early exhaust valve opening | |
| Engine fuel consumption impact factor from catalyst heating strategy | |
| Additional friction torque of cold engine lubricant [Nm] | |
| Engine global engine efficiency reduction as function of spark retardation [-] | |
| Catalyst heating strategies [-] | |
| Mass flow rate of fuel [kg/s] | |
| Engine effective power [kW] | |
| Engine friction power [kW] | |
| Engine-indicated power [kW] | |
| Global efficiency [-] | |
| Mechanical efficiency [-] | |
| Thermal efficiency [-] | |
| Relative air–fuel ratio [-] | |
| Kinematic viscosity [m2/s] | |
| Effective torque [Nm] | |
| Engine coolant outlet temperature [°C] | |
| Engine coolant inlet temperature [°C] | |
| Engine intake air temperature [°C] | |
| Lubricant temperature [°C] | |
| BSFC | Brake-specific fuel consumption [g/kWh] |
| Cold | Cold phase; 1st phase of EPA75 test cycle |
| E22 | Brazilian reference gasoline with 22% of anhydrous ethanol by volume |
| FMEP | Friction mean effective pressure |
| Hot | Hot phase; 3rd phase of EPA75 test cycle |
| k | Constants of adjustment |
| LHV | Lower heating value [MJ/kg] |
| MBT | Maximum brake torque [Nm] |
| n | Engine speed [rpm] |
| T | Temperature [°C, K] |
| TCU | Transmission control unity |
| Vd | Engine volumetric displacement [m3] |
| °ABDC | Crankshaft angle after bottom dead center [°] |
| °BBDC | Crankshaft angle before bottom dead center [°] |
References
- Feliciano, H.N.F.; Rovai, F.F.; Mady, C.E.K. Energy, Exergy, and Emissions Analyses of Internal Combustion Engines and Battery Electric Vehicles for the Brazilian Energy Mix. Energies 2023, 16, 6320. [Google Scholar] [CrossRef]
- Rovai, F.F.; da Cal Seixas, S.R.; Mady, C.E.K. Regional energy policies for electrifying car fleets. Energy 2023, 278, 127908. [Google Scholar] [CrossRef]
- Tabrizi, M.K.; Bonalumi, D.; Lozza, G.G. Analyzing the global warming potential of the production and utilization of lithium-ion batteries with nickel-manganese-cobalt cathode chemistries in European Gigafactories. Energy 2024, 288, 129622. [Google Scholar] [CrossRef]
- Sacchi, R.; Bauer, C.; Cox, B.; Mutel, C. When, where and how can the electrification of passenger cars reduce greenhouse gas emissions? Renew. Sustain. Energy Rev. 2022, 162, 112475. [Google Scholar] [CrossRef]
- Shchurov, N.I.; Dedov, S.I.; Malozyomov, B.V.; Shtang, A.A.; Martyushev, N.V.; Klyuev, R.V.; Andriashin, S.N. Degradation of lithium-ion batteries in an electric transport complex. Energies 2021, 14, 8072. [Google Scholar] [CrossRef]
- Kaarlela, T.; Villagrossi, E.; Rastegarpanah, A.; San-Miguel-Tello, A.; Pitkäaho, T. Robotised disassembly of electric vehicle batteries: A systematic literature review. J. Manuf. Syst. 2024, 74, 901–921. [Google Scholar] [CrossRef]
- Dahham, R.Y.; Wei, H.; Pan, J. Improving thermal efficiency of internal combustion engines: Recent progress and remaining challenges. Energies 2022, 15, 6222. [Google Scholar] [CrossRef]
- Mabit, S.L. Vehicle type choice under the influence of a tax reform and rising fuel prices. Transp. Res. Part A Policy Pract. 2014, 64, 32–42. [Google Scholar] [CrossRef]
- Mosquim, R.F.; Mady, C.E.K. Performance and efficiency trade-offs in Brazilian passenger vehicle fleet. Energies 2022, 15, 5416. [Google Scholar] [CrossRef]
- Mosquim, R.F.; Collaço, F.M.d.A.; Mady, C.E.K. Toward a Direct CO2 Tax for the Brazilian LDV Fleet. Energies 2024, 17, 2467. [Google Scholar] [CrossRef]
- Greene, D.L.; Sims, C.B.; Muratori, M. Two trillion gallons: Fuel savings from fuel economy improvements to US light-duty vehicles, 1975–2018. Energy Policy 2020, 142, 111517. [Google Scholar] [CrossRef]
- Hu, Y.; Sun, Y.; Zhang, Q.; Ma, Q. Experimental analysis on the combustion performance of aftertreatment diesel burner under cold start and warm-up conditions. Appl. Therm. Eng. 2024, 253, 123783. [Google Scholar] [CrossRef]
- Xu, M.; Jiang, P.; Zhong, W.; Liu, X.; Cao, L.; Wang, Q. An optical investigation on the effects of split-injection on hydrogenated catalytic biodiesel/gasoline dual-fuel engine under cold start conditions. Appl. Therm. Eng. 2024, 236, 121707. [Google Scholar] [CrossRef]
- Guilherme, R.; Cressoni, F.; Costoya, A.; Cordeiro, M. Choosing the Best Fuel for Flex Fuel Cars Daily Use; Technical Report, SAE Technical Paper; SAE: Warrendale, PA, USA, 2011. [Google Scholar]
- FTP. EPA Federal Test Procedure (FTP). Available online: https://www.epa.gov/emission-standards-reference-guide/epa-federal-test-procedure-ftp (accessed on 27 April 2023).
- ABNT. Brazilian National Standards Organization (ABNT)-NBR16567-Light Self-Propelled Road Vehicles: Measuring Fuel Consumption; ABNT: Rio de Janeiro, Brazil, 2016. [Google Scholar]
- ABNT. Brazilian National Standards Organization (ABNT)-NBR6601-Light Motor Vehicles: Determination of Hydrocarbons, Carbon Monoxide, Nitrogen Oxides, Carbon Dioxide and Particulate Matter in Exhaust Gas; ABNT: Rio de Janeiro, Brazil, 2021. [Google Scholar]
- Roberts, A.; Brooks, R.; Shipway, P. Internal combustion engine cold-start efficiency: A review of the problem, causes and potential solutions. Energy Convers. Manag. 2014, 82, 327–350. [Google Scholar] [CrossRef]
- Ye, Z.; Mohamadian, H. Model predictive control on wall wetting effect using Markov Chain Monte Carlo. In Proceedings of the 2013 IEEE Latin-America Conference on Communications, Santiago, Chile, 24–26 November 2013; IEEE: Piscataway, NJ, USA, 2013; pp. 1–6. [Google Scholar]
- Heywood, J.B. Combustion Engine Fundamentals; McGraw-Hill Education: New York, NY, USA, 2018. [Google Scholar]
- Reif, K. Gasoline Engine Management; Springer: Berlin/Heidelberg, Germany, 2015. [Google Scholar]
- Inovar-Auto. Law No. 12715: Incentive Program for Technological Innovation and Densification of the Automotive Vehicle Production Chain; Inovar-Auto: Taiobeiras, Brazil, 2012. [Google Scholar]
- Inovar-Auto. Law No. 13755: Rota 2030-Program—Mobility and Logistics; Inovar-Auto: Taiobeiras, Brazil, 2018. [Google Scholar]
- de Salvo Junior, O.; de Souza, M.T.S.; de Almeida, F.G.V. Implementation of new technologies for reducing fuel consumption of automobiles in Brazil according to the Brazilian Vehicle Labelling Programme. Energy 2021, 233, 121132. [Google Scholar] [CrossRef]
- Mosquim, R.F.; Mady, C.E.K. Design, performance trends, and exergy efficiency of the Brazilian passenger vehicle fleet: 1970–2020. J. Clean. Prod. 2021, 290, 125788. [Google Scholar] [CrossRef]
- CONAMA. National Environment Council (CONAMA)-Resolution No. 492: Establishes the PROCONVE L7 and PROCONVE L8 Phases of Requirements of the Air Pollution Control Program from Engine Vehicles; CONAMA: Kindsbach, Germany, 2018. [Google Scholar]
- Robinson, J.W.; Zhou, Y.; Bhattacharya, P.; Erck, R.; Qu, J.; Bays, J.T.; Cosimbescu, L. Probing the molecular design of hyper-branched aryl polyesters towards lubricant applications. Sci. Rep. 2016, 6, 18624. [Google Scholar] [CrossRef] [PubMed]
- Universal Technical Institute. What Is a Catalytic Converter and What Does It Do? Universal Technical Institute: Houston, TX, USA, 2024. [Google Scholar]
- Manual Globo De Automovel. Sistemas do carro e serviços de emergência; Editora Rio Gráfica; Mole: Umberleigh, UK, 1988. [Google Scholar]
- Shayler, P.J.; Leong, D.K.; Murphy, M. Contributions to Engine Friction During Cold, Low Speed Running and the Dependence on Oil Viscosity; SAE Transactions: Warrendale, PA, USA, 2005; pp. 1191–1201. [Google Scholar]
- Taylor, R.I. Tribology and energy efficiency: From molecules to lubricated contacts to complete machines. Faraday Discuss. 2012, 156, 361–382. [Google Scholar] [CrossRef] [PubMed]
- Ministry of Environment (MMA). Air Pollution Control Program from Motor Vehicles: Proconve/Promot. Environment Collection. Guidelines Series—Environmental Management No. 3. 2011. Available online: https://www.ibama.gov.br/phocadownload/veiculosautomotores/manual%20proconve%20promot_english.pdf (accessed on 9 October 2023).
- Bejan, A. Convection Heat Transfer; John Wiley & Sons: Hoboken, NJ, USA, 2013. [Google Scholar]
- National Institute of Meteorology. INMETRO: Ordinance No. 391. Conformity Assessment Regulation for Labeling of Light Passenger Vehicles with Otto Cycle Engines; National Institute of Meteorology: Silver Spring, MD, USA, 2008. [Google Scholar]
- Fusco Rovai, F.; Milanez Júnior, C.U.; Cawsey, P.E. Blow-By Vapour Impact on Flexible Fuel Applications. In Proceedings of the Internal Combustion Engine Division Spring Technical Conference, Chicago, IL, USA, 27–30 April 2008; Volume 48132, pp. 141–147. [Google Scholar]
- Engler-Pinto, C.M.; de Nadai, L.; Martins, E. Analysis of Oil Sump Contamination with Ethanol in Flex Fuel Engines after Crank and Warm-Up; Technical Report, SAE Technical Paper; SAE: Warrendale, PA, USA, 2009. [Google Scholar]
- Guilherme, R.; Franchi, R. Oil Mass Contamination Model for Otto Ethanol Fueled Engines; Technical Report, SAE Technical Paper; SAE: Warrendale, PA, USA, 2011. [Google Scholar]
- Zhao, F.; Harrington, D.L.; Lai, M.C. Automotive Gasoline Direct-Injection Engines; SAE International: Warrendale, PA, USA, 2002. [Google Scholar]


| 1st Phase (Cold) | Increase in Fuel Consumption (%) | 3rd Phase (Hot) | |
|---|---|---|---|
| Measurement (bag) | 1.209 | - | 1.0 |
| Hot simulation | 0.977 | - | 0.979 |
| Hot simulation adjustment | 0.999 | - | 1.0 |
| Lubricant temperature | 1.054 | 5.5 | - |
| Catalyst ignition | 1.085 | 8.6 | - |
| Catalyst evvt | 1.095 | 9.7 | - |
| Engine hardware | 1.209 | 21.1 | - |
Disclaimer/Publisher’s Note: The statements, opinions and data contained in all publications are solely those of the individual author(s) and contributor(s) and not of MDPI and/or the editor(s). MDPI and/or the editor(s) disclaim responsibility for any injury to people or property resulting from any ideas, methods, instructions or products referred to in the content. |
© 2024 by the authors. Licensee MDPI, Basel, Switzerland. This article is an open access article distributed under the terms and conditions of the Creative Commons Attribution (CC BY) license (https://creativecommons.org/licenses/by/4.0/).
Share and Cite
Rovai, F.F.; Mady, C.E.K. Thermodynamic Model for Cold-Phase Influence on Light Vehicles’ Fuel Consumption. Energies 2024, 17, 4093. https://doi.org/10.3390/en17164093
Rovai FF, Mady CEK. Thermodynamic Model for Cold-Phase Influence on Light Vehicles’ Fuel Consumption. Energies. 2024; 17(16):4093. https://doi.org/10.3390/en17164093
Chicago/Turabian StyleRovai, Fernando Fusco, and Carlos Eduardo Keutenedjian Mady. 2024. "Thermodynamic Model for Cold-Phase Influence on Light Vehicles’ Fuel Consumption" Energies 17, no. 16: 4093. https://doi.org/10.3390/en17164093
APA StyleRovai, F. F., & Mady, C. E. K. (2024). Thermodynamic Model for Cold-Phase Influence on Light Vehicles’ Fuel Consumption. Energies, 17(16), 4093. https://doi.org/10.3390/en17164093