Article

The Economics of Electric Vehicles with Application to Electricity Grids

by
G. Cornelis van Kooten
1,2,* and
Tracy E. Stobbe
2
1
Department of Economics, University of Victoria, Victoria, BC V8W 2Y2, Canada
2
School of Business, Trinity Western University, Langley, BC V2Y 1Y1, Canada
*
Author to whom correspondence should be addressed.
Energies 2024, 17(16), 4109; https://doi.org/10.3390/en17164109 (registering DOI)
Submission received: 23 July 2024 / Revised: 12 August 2024 / Accepted: 15 August 2024 / Published: 19 August 2024
(This article belongs to the Section E: Electric Vehicles)

Abstract

:
Governments around the world promote the purchase of electric vehicles (EVs) as part of their climate change strategy, with many committing to EV-only sales of new passenger vehicles by 2035 and complete use of EVs by 2045 (California) or 2050 (e.g., Canada, EU). Rebates (purchase subsidies) are offered to consumers to promote uptake of EVs, and growth in their uptake has been quite strong, although EVs remain a small proportion of registered vehicles. In this study, we first analyze the economics of EV subsidies and then use Canadian electrical generation capacity, EV efficiency data, and distances driven, along with Monte Carlo simulation, to project the increased demands that greater numbers of EVs will place on an electrical grid. We find that the current grid’s capacity will not be adequate to power the anticipated growth in EVs, and major new power plants or hydroelectric dams will need to be constructed. The analysis suggests that Canada might need to build 17 new hydroelectric facilities or 14 additional gas plants, as there is likely to be much resistance to new hydroelectric projects.

1. Introduction

Electric vehicles (EVs) are projected to take over the passenger vehicle market within a decade. At present, 16 countries, including Canada, Japan, and the UK, have a policy mandating that 100% of new vehicle sales must be EVs by 2035 or earlier (Jaeger, 2023). Some countries already see that a significant proportion of their new vehicles sales are EVs, including Norway (with 80% of sales in 2022), Iceland (41%), Sweden (32%), the Netherlands (24%), and China (22%). China is the world’s largest car market and witnessed 4.4 million EVs sold in 2022 (compared to 3 million in the rest of the world combined).
In Canada, battery electric vehicles (BEV) and plug-in hybrid electric vehicles (PHEV)—the types considered to be EVs—represent a small proportion of total vehicles at present, at 1.4% of passenger vehicles in 2022 [1]. EVs have grown rapidly, including by 40% between Q3 of 2022 and Q3 of 2023. At that time, 1 in 8 new cars sold was an EV, and 1 in 5 new cars in the provinces of British Columbia (BC) and Quebec [2].
This growth in global EV markets has resulted from a shift in consumer preferences supported by government policies mandating and incentivizing EV purchases and production. On the consumer side, governments have offered rebates to lower the purchase price of an EV and other financial benefits such as the waiving or lowering of registration fees, road tolls, parking fees, and ferry costs, which reduce the total cost of EV ownership [3]. On the producer side, governments have mandates in place but also offer auto manufacturers and battery makers direct production subsidies and indirect subsidies for research and development and infrastructure [4]. The current study examines the economics of public polices to increase purchases of EVs, demonstrating that consumer subsidies ‘force’ governments to subsidize the supply side as well.
One concern on the supply side relates to the availability of adequate electricity—the impact of additional EVs on power generation. From environmental reviews for new projects to renewable energy targets and regulating prices billed to citizens for energy, government plays a decisive role in energy markets. In BC, for instance, the building of the latest hydroelectric dam took five years to meet the government’s process for approval (from 2010 to 2015) [5]. Though BC Hydro had originally intended for the project to be operational by 2020 [6], it came online in 2024 and will not be fully operational till 2025 (BC Hydro, 2023); it has also been a source of significant controversy with environmental and indigenous groups. Given the immensity of an undertaking like building a new dam, it is essential that planning for future energy needs is realistic. Thus, a second focus of this study is to project energy needs from growth in EVs at a federal and provincial level. The main purpose is to demonstrate that a simple policy of subsidizing EVs can be more complex than perhaps anticipated by policy makers.
We begin in the next section with a theoretical economic analysis focused on the consumer subsidy, demonstrating that the consumer subsidy requires various supply-side subsidies. Our application is to Canada, although the results apply more broadly to other jurisdictions. Thus, in Section 3, we examine EV data in Canada, showing trends and discussing the current set of monetary and non-monetary incentives facing drivers. In the same section, we also analyze electrical usage of EVs and the demands they will impose on Canada’s electrical grid in the future, demonstrating that significant additional electricity generating capacity will need to be built. Section 4 provides some conclusions.

2. Economic Effects of Electric Vehicles

The decision to buy an EV or the equivalent automobile with an internal combustion engine (ICE) is multifaceted, involving a combination of technical, economic, environmental, social, and policy factors [7,8,9,10]. It is influenced, for example, by the purchase price, anticipated energy costs, maintenance and insurance costs, convenience of charging, ‘range anxiety’, environmental awareness, and other government policies (such as rebates, ability to use high-occupancy vehicle lanes). The purchase price for EVs remains higher than ICEs at present, although government policies related to tailpipe emissions are expected to change this in the next five years [11]. Considering the key factors of purchase price, fuel costs, and maintenance costs, one analysis found that owning an EV, with a rebate, was cheaper than a close ICE substitute [12] (Clean Energy Canada analyzed a 2022 Hyundai Kona versus Kona EV, assuming 20,000 km per year over eight years. The EV purchase price is CAD 45,851 while the ICE version is CAD 26,044. The study factored in the national average EV rebate and assumed home charging with electric power at 13.9 cents per kWh, and CAD 1.45-per-litre gas price (the average from April 2021 to March 2022). The ICE’s total cost of ownership was CAD 60,210, while the cost of the EV came to CAD 49,699. This study did not account for the resale value of either vehicle after eight years.); other studies provide a different perspective [13,14,15].
In Canada, recent empirical research by Xia [16] examined factors affecting EV purchases in 22 different cities. The study found that five major factors determined whether Canadian buyers purchase an EV: per capita income, the price of gasoline, the availability of charging stations, the subsidy or actual price difference between the EV and its ICE alternative, and weather factors (e.g., how cold it gets). After per capita income, the price of gasoline and rebates were found to be the most important factors, followed somewhat closely by the likelihood of very cold temperatures at the sales location and more distantly by the availability of charging stations. All five factors were statistically significant determinants of EV purchases. Consumer preferences for EVs, such as attitudes to the environment and perceptions about climate change, were not included in the study.
In Canada, as elsewhere, there are consumer subsidies for the purchase of an EV available both federally and by some provinces—the two most generous rebates are found in British Columbia (BC) and Quebec (QC). At present, the federal subsidy is up to CAD 5000, while BC offers up to CAD 4000 in additional subsidy (depending on income) and QC offers up to CAD 8000 (depending on vehicle) [17]. Like many other jurisdictions (e.g., California), there are also mandates that require all passenger vehicles sold by 2035 to be electric, with sales of heavy-duty vehicles to be all electric by 2040.

2.1. Direct Effects

The direct effects of consumer subsidies and production mandates, both of which reduce the purchase price of EVs, are examined with the aid of Figure 1. The figure shows the supply (S) and demand (D) curves for electric vehicles. Equilibrium occurs at point e, where the price for an electric vehicle is P* and the number sold is given by Q*. If the government provides a per-unit subsidy to consumers of amount P* − PS, the effective price facing the consumer is PS, thereby leading to an increase in demand to QS. The supply price (marginal cost of production) to produce QS EVs is given by c. Thus, to avoid the shortfall between demand and supply, given by QSQ*, producers will also need to be subsidized. In essence, the required subsidy will be much larger than anticipated: consumers will receive an anticipated subsidy given by the area bounded by P*PSba, but producers will require a subsidy given by cP*ad.
In practice, the subsidy provided to manufacturers takes a variety of different forms. Some companies have been provided carbon offset credits that they can sell in carbon markets or directly to producers of ICEs. The sale of carbon offset credits to other automobile manufacturers facilitated the success of Tesla, for example. Other EV producers were provided subsidies to establish manufacturing facilities or develop battery production. Both consumer and producer subsidies will need to be increased if the demand for EVs shifts to the right due to changes in consumer tastes that favor electric vehicles. If the per-unit subsidy remains fixed, the cost to the treasury will need to increase as more units are sold. Further, it is likely that governments will also need to subsidize investments in electricity generation.
Now consider the case of a mandate without subsidies. In Figure 1, suppose the mandate requires sales of QS. Again, the price paid by consumers is PS while producers incur a per-unit production cost c; now there is no cost to the treasury. The cost to producers is now given by area cPSbd, with area P*PSbe constituting a transfer of income from producers to consumers, cP*ae is a loss in producer surplus, and ebd is a deadweight loss to society. Without subsidies, producers would not cover their investment costs and, in the long run, tend to leave the sector.

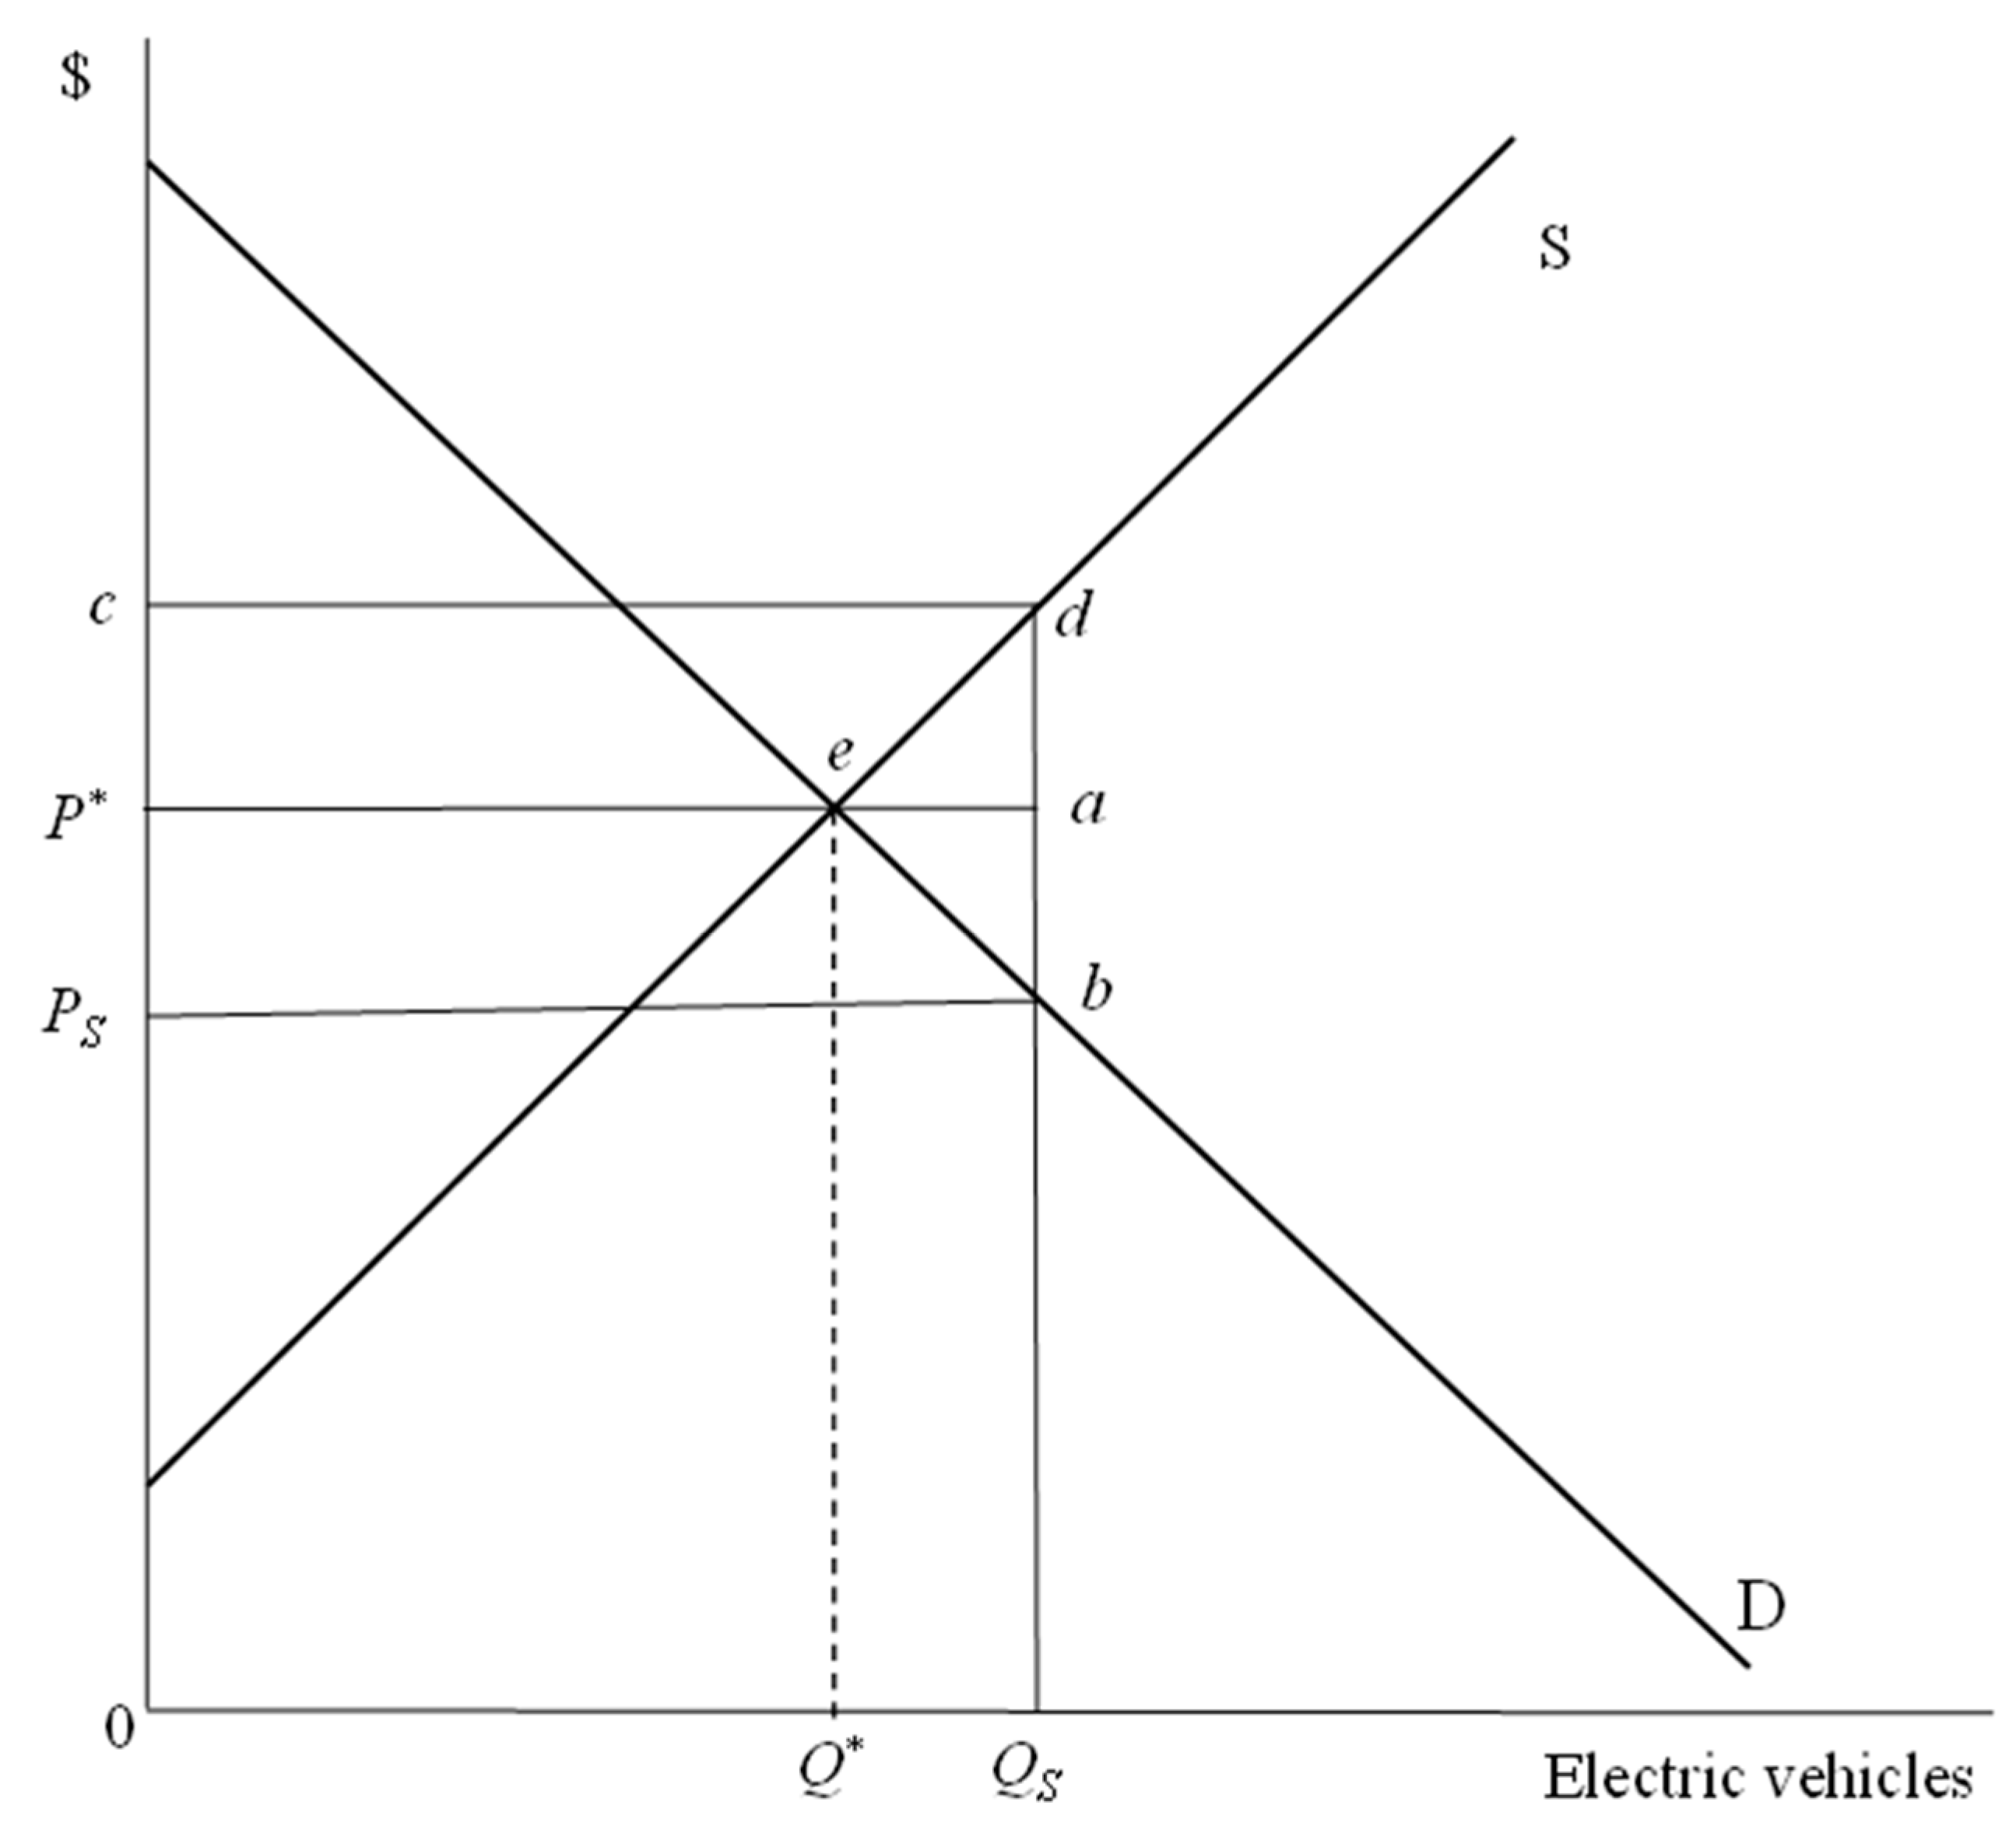
2.2. Indirect Economic Effects

In addition to the direct effects, economic theory helps identify potential indirect effects, one of which is the impact of added demand for electricity on energy markets (considered below). EV subsidies and mandates affect economic surpluses in other markets. Fuel taxes, including a carbon tax, are charged on every litre of gasoline or diesel sold. In BC, between April 2023 and April 2024, taxes totaled 41.31 cents/L for drivers in the Metro Vancouver area [18]. These taxes are levied with the stated intention of enhancing and maintaining transportation infrastructure and to pay for some of the costs of public transportation.
Fuel taxes incentivize people to drive less and rely more on public transportation, thereby reducing congestion as well as CO2 emissions. The driver of an electric vehicle does not pay fuel taxes, and EV drivers in some jurisdictions (e.g., Metro Vancouver) benefit from unrestricted access to high-occupancy vehicle lanes (HOVs). Overall, economic theory predicts that these incentives, which reduce the marginal cost of driving, increase driving distances and congestion, and reduce reliance on public transportation and other forms of transport, including walking and cycling. Thus, government policies related to EVs negate other policies (such as fuel taxes) that attempt to address the problem of congestion and may lead to faster deterioration of road infrastructure due to an increasing number of heavier battery-powered vehicles [19].
Loss of such revenues is a concern in California, which is looking to replace the fuel tax with a tax on distance driven [20]. In British Columbia, funds available for investments in public transit are down by nearly CAD 50 million because of reduced revenues from fuel taxes. In the future, drivers will face a mileage charge regardless of fuel type, although one could conceivably relate the charge to the weight of the vehicle if revenues are meant to maintain roadway infrastructure. In that case, the charge would constitute a negative incentive for driving an EV.
EVs are promoted because of their environmental benefits, particularly because they reduce CO2 emissions [2]. However, because EV batteries and other components require increased mining of cobalt, copper, rare earth minerals, and other metals, a full life-cycle analysis of the environmental impacts would be required to determine the externality effects; see [21], [22] (p. 649), [23,24]. Any conclusion, however, depends crucially on the energy source used to generate electricity, a topic discussed in the next section.
Canada does not currently produce electric vehicles, although there are several start-up companies. Nonetheless, because of EV imports, mainly from China, the production of automobiles produced in Canada has decreased markedly. Production in 2022 is down by 35.9% compared to pre-pandemic (2019) production and is down 47% since 2013. Undoubtedly, much of this decline can be explained by the concepts of creative destruction (old technologies and methods being replaced by new) and globalization (lower costs in other countries mean it is cheaper to trade than produce a good domestically). However, it is still salient to consider the effects of EV subsidies on this industry and the jobs lost. Unemployment insurance (EI), public assistance (welfare), and job-retraining programs are paid for through taxes. Although automobile manufacturers are encouraged to switch from ICEs to EVs, the analysis in Figure 1 indicates that they may require subsidies to make the switch. In addition, EV production requires fewer workers [25]. These considerations constitute income redistributions as opposed to lost economic surpluses.

2.3. Electric Vehicle and Electricity Grids

Electric vehicles will have an impact on power generation. As of July 2024, there were some 407 different models of electric vehicles that consumers could potentially purchase now or in the future, although the database described below consists of 299 EV models. Data are available regarding battery capacity, associated energy efficiency and range, and vehicle towing weight, although we focus on energy efficiency; the data are summarized in Table 1. Much of the EV vehicle performance information is provided by the EV manufacturers, based primarily on tests performed under perfect conditions or on computer models. In practice, batteries may not perform to the same levels indicated by the manufacturer; for example, batteries should not generally be recharged in temperatures below freezing, while battery performance falls quickly when temperatures are below −30 °C and declines somewhat as batteries age. While these drawbacks are cited in various places, there is currently not enough information to indicate how performance is affected over time and under various weather conditions.
Now consider California, which is a global leader in policies to bring about an energy transition. The State’s primary objective is to achieve carbon neutrality by 2045, initially by focusing on reducing CO2 emissions from electricity generation. Senate Bill 100 (2018), known as the 100 Percent Clean Energy Act, set an intermediate goal requiring 60% of electricity consumed in the State to come from renewable sources by 2030 and 100% by 2045 [26].
In 2022, California’s electricity demand had risen to 224.77 terawatt hours (TWh) and there were approximately 31 million passenger vehicles in the state, which were driven an average of 22,000 km annually. Assuming EV batteries have an average energy efficiency of 200 Wh/km (see Table 1), each EV would require 4.40 MWh of electricity annually. If all vehicles are to be electric by 2045, this would add 136,400 GWh (136.4 TWh) to the California electrical load each year—a 60.7% increase in the electrical load compared to 2022. Although this only represents an annual increase of 2.1%, it ignores the potential growth in electrical load due to economic growth, demand from data centers and artificial intelligence, and policies to eliminate fossil fuel and nuclear energy sources of generation.
In 2022, Canada produced 658.9 TWh of electricity but consumed only 577.7 TWh, with the difference exported to the U.S. Fossil fuels accounted for 17.6% of generation, and Canada aims to be carbon neutral by 2050. There were 26.3 million passenger vehicles of all fuel types registered in 2022. To achieve carbon neutrality, and assuming no growth in the number of passenger vehicles in 2050 and that Canadians drive an average of 16,000 km annually, electricity demand will increase by 84.2 TWh, or 14.6% of consumption. However, Canada’s population is forecast to increase from 40.1 million in 2022 to between 45.7 (14.0% increase) and 61.6 million (53.6%) by 2050 [27]. Suppose that vehicle numbers increase by 25% by 2050 and all fossil fuel generation is eliminated. It will then be necessary for Canada to increase its power generation annually by 105.2 TWh to meet EV demand plus 84.2 TWh to cover lost fossil fuel production, or a total of 189.4 TWh. This translates into a 1% annual increase in power demand over and above any other sources of growth due to increased population, construction of data centers, artificial intelligence requirements, and so on. While this is likely doable, we will explore this in more detail in the next section.

3. Results: An Application to Canada

3.1. Electric Vehicle Registrations vs. Total Registrations

In this section, we examine the demand and impact that electric vehicles have on Canada nationally and on its provincial power grids. Data on total annual registrations of all vehicles and electric vehicles are provided for 2017 through 2022 in Table 2 for all of Canada and the largest four provinces—British Columbia, Alberta, Ontario, and Quebec. Electric vehicle registrations grew in each jurisdiction by more than 45% per annum, while growth in total vehicle fleets was much slower, growing by only 0.2% per year in Alberta but as high as 1.6% annually in Ontario. Compared to ICE vehicles, EVs are still quite a small proportion of all vehicles on the road at any given time. In 2022 (the last year for which information is available), BEVs plus PHEVs constituted 1.3% of Canadian vehicles (Table 2); in BC and Quebec, they constituted 2.5% of all vehicles, but in Alberta (0.3%) and Ontario (0.9%), less than 1%.
Quarterly data on new registrations by quarter are available for the period Q1 2017 through Q1 2024. In Figure 2, we plot the ratio of new registrations of electric vehicles to total new vehicle registrations as percentages, but quarterly data on new registrations are not available for Alberta. Between 2017 and 2024, total registrations of BEVs plus PHEVs rose significantly in all jurisdictions, although they declined in some jurisdictions beginning Q3 2023. Adoption of electric vehicles increased most in BC, followed by Quebec, with these provinces producing more than 85% of their electricity requirements from hydro sources. The most likely explanations for the greater uptake of EVs in BC are the lower prices of electricity, generally higher gasoline prices, and milder temperatures compared to other jurisdictions (Xia, 2024). Temperatures in many interior regions (e.g., Prairie Provinces, northern Ontario, and Quebec) are well below 0C during winter months.
Several studies have examined the impacts that EVs would impose on electricity grids. For example, a study commissioned by Natural Resources Canada [30] found that, based on federal EV targets, an additional 156.5 TWh of electricity would be required annually by 2050, which constitutes 22.6% of electricity consumed nationally in 2020. Kintner-Meyer et al. [31] determined that the Pacific Northwest’s electricity grid, which relies primarily on hydroelectricity, could perhaps handle the conversion of 10–15% of existing passenger vehicles to electricity without major additions to generating infrastructure.
Next, we explore the effects that EV adoption will have on electrical systems across Canada and its largest provinces. In addition to determining the electricity required by EVs, there is the problem of what the ‘ultimate’ energy source might look like—whether it is a renewable source or not. We begin by considering possible sources of energy for generating the power required by EVs. In doing so, we assume that the existing grid will be at capacity in the future because of population growth, added demand for power from data centers, and so on.

3.2. Potential Energy Sources

With its vast water supply, Canada has plentiful hydroelectric generation capacity, with 54% of total installed capacity attributed to hydraulic sources (Table 3). This does not, however, imply that some 54% of the actual power generated in Canada comes from hydro. It depends on the relationship between capacity and generation—on the capacity factors (CF) of the various generating sources. For example, hydropower is essentially generated in two ways. First, run-of-river power is non-dispatchable—it must be used as it is generated or else it will need to be ‘discarded’ (simply not generated or dispatched). The capacity to generate run-of-river electricity at any point in time depends on the rate of flow of the river. In contrast, storage hydroelectric capacity is determined by the capacity of the generating units and the height of the water and volume of water in the reservoir behind the dam, which will fluctuate from one season and year to another. However, the available power in this case is dispatchable—controllable by the system operator.
Canada also has significant energy production capabilities coming from gas, wind, and nuclear sources. In 2020, Canada had about 74.2% of its installed capacity coming from hydro, nuclear, wind, and solar sources, all of which are considered green energy sources. Most of Canada’s energy, or 61.9% of total energy, came from hydro in 2020; 12.5% came from oil and gas, primarily from provinces and territories that lack the geography required for hydraulics and from remote communities. Although only Ontario and New Brunswick have nuclear energy capacity, it accounted for 13.3% of Canada’s electricity production in 2020. Overall, some 82.5% of the country’s electricity production came from green sources in 2020.
Because our purpose is to investigate the potential demand that EVs pose for electricity grids in Canada, we provide background information on electricity supply and electric vehicles in Canada and four largest provinces in Table 4. The latest generation data are available for 2022, which we break down by source. (Unlike generation data, asset capacity data at the national level are available only for 2020 as indicated in Table 3.) The electricity generating categories are broken down as follows:
  • Renewables include solar, wind, biomass, biofuels, and municipal solid waste sources.
  • Hydro refers to run-of-river hydro, ‘storage hydro’ (hydraulics with large reservoir), wave, and tidal sources.
  • Natural gas and oil refer to natural gas, biogas, oil, and diesel sources.
  • Coal refers to coke and coal.
  • Nuclear simply refers to nuclear power generation.

3.3. Monte Carlo Simulation

As the number of electric vehicles increases, the demand for electricity to recharge their batteries will increase accordingly. To date, there is little evidence to indicate that power demand by BEVs and PHEVs is a problem for the electricity grid—the current provincial grids appear to have sufficient capacity to handle the recharging requirements of EVs. This observation is corroborated by federal data, which indicates that, at least prior to 2021, electricity energy use amounts to about 0.4 percent of secondary energy use for passenger transportation.
To get a better notion of the potential upper and lower bounds of future power needs for electric vehicles, we employ Monte Carlo simulation about the battery efficiency (Wh/km), the distances driven in each jurisdiction (km), and the number of EVs likely on the road at the time of net zero emissions. To do so, we employ triangular distributions. The triangular distribution requires a minimum value (the lowest value the variable might take), a maximum value, and a most likely value (or mode). This will give us a better understanding of what the additional load requirements will be with the added component of randomness and is more realistic for a real-life outcome.
For this simulation, we use a battery efficiency distribution that has a midpoint efficiency of 187 Wh/km, a minimum of 139 Wh/km, and a maximum of 286 Wh/km (see Table 2). The distribution is assumed to be the same for each jurisdiction.
The numbers of vehicles that have been registered by selected jurisdiction over the period 2017–2022 are provided in Table 2. It is unlikely that these numbers will represent the actual numbers of EVs on the road in the next decade or when Net Zero is to be met (2050). Therefore, we choose as our midpoints of the triangular distributions the vehicle total in 2022 and assume that they could vary from 75% (failure to meet targets) to 125% (due to population growth). That is, the respective minimum and maximum values of the EVs on the road in the next decade are assumed to be between 0.75 and 1.25 of the total vehicles in 2022.
We do not have data on the distribution for km driven in each jurisdiction, so we use the mean km driven in each jurisdiction as the midpoint of the triangular distribution. For each jurisdiction, the minimum and maximum values of the triangular distribution are taken to be 90% and 120% of this value, respectively, with the latter representing a lower marginal cost of driving.
Then, for each of the four jurisdictions discussed above, we carry out the following. In each of 10,000 iterations, a random value is chosen from each of three triangular distributions—battery efficiency, number of vehicles, and distance driven by an average vehicle—with the numbers multiplied to obtain one ‘estimate’ of the added power required by the added EVs. The R code used in the analysis is provided in the Appendix A.

3.4. Discussion: Impact on Electricity Grids

The results from 10,000 such estimates are provided in Table 5 for increased hourly and annual power requirements. What are the implications for generating capacity in each jurisdiction? First, consider what would be required if all the added demand were to be met by combined-cycle gas turbine (CCGT) baseload assets or hydropower. Consider a new hydropower facility recently completed in northern British Columbia. According to BC Hydro, it has a capacity of 1100 megawatts and would generate about 5100 gigawatt hours (GWh) of energy each year, resulting in a capacity factor of 53%. For Canada, the load coming from EVs in the next several decades would require the construction of perhaps 17 such hydro facilities, with three of those to be built in BC, two in Alberta, seven in Ontario, and four in Quebec. Due to environmental regulations, construction of even a single dam of that size is highly unlikely by 2050 unless planning begins immediately. It is more likely that the added generating capacity would come from natural gas sources. In that case, it would be necessary to build 14 large gas plants of 750 MW capacity or greater in Canada, with two in BC, two in Alberta, five in Ontario, and three in Quebec.
If EV demand for power is to come from renewable sources, wind is the most likely option. Assuming a capacity of 3.5 MW per turbine and average wind capacity factor of 25%, the requirements are provided in the bottom three rows of Table 5. For BC, 1555 large wind turbines will need to be built within the next few years. However, given the unreliability of wind energy, it will also be necessary to build CCGT, hydropower, and/or utility-scale battery storage capacity as backup. In general, backup requirements amount to some 80% to 90% of installed wind capacity; however, because backup capacity cannot pay for itself, as it does not deliver enough power during the year, it needs to be subsidized, thereby adding to system costs [35,36,37].
Finally, if we consider a scenario with even greater uptake of EVs, the numbers of hydroelectric dams, gas plants, and wind turbines required to meet the extra demand for electricity would need to be increased accordingly. We represent this scenario by examining the electricity required exceeds the mean power required (first row of Table 5) by two standard deviations (which represents 95% of the probability under the normal probability density function created by the simulation.) The number of hydroelectric dams, power plants, and wind turbines would need to be significantly increased by some 35 to 45 percent based on the results in Table 5.

4. Conclusions

Given the commitment of so many governments to phase out ICE sales by 2035 or sooner, EV popularity and production will continue to grow. More than 25 new models were introduced in 2023 alone, with now some 53 EV manufacturers of more than 400 models. This paper briefly examined the economics of EV subsidies on the consumer and producer side, noting that consumer rebates must be accompanied by producer subsidies. One aspect of producer subsidies relates to investment in additional power generating capacity, some of which must necessarily be subsidized [35,36]. Our results suggest that power generation will need to be increased, on average, by 10% (Quebec) and 25% (Ontario), depending upon the jurisdiction, although it could be substantially greater. If the realized increase is two standard deviations greater, the needed increase in generation might be 21% for Canada as a whole but as much at 34% for Ontario, ceteris paribus.
The incentives created by current policies on EVs—including purchase price rebates as well as other perks like single-passenger use of HOV lanes—undoubtedly contribute to EV uptake and popularity. But when one considers the effects on congestion, new sources of pollution (e.g., tire wear, battery disposal), and global environmental externalities from metal mining, the environmental case for EVs is weakened considerably. Further research on the economic aspects of these nonmarket impacts and their implication for electricity grids is required.
There are many hurdles that remain to be overcome in switching to a completely electric vehicle fleet to meet stated environmental goals. The fuel source will be a big consideration as jurisdictions will need to increase their electricity production capabilities from green sources, which are primarily wind and solar. Further research is required to determine the hourly load profile attributable to electric vehicles and how those additional hourly load requirements will be met. To what extent can intermittent wind and solar power be deployed to meet the added load [37,38]?
New hydroelectric dams are possible in much of Canada and would have low CO2 emissions but, as elsewhere in developed countries, face immense challenges to their timely deployment. Unless jurisdictions permit expansion of natural gas capacity to meet the needs of EVs, long delays in planning and construction of hydro (or even nuclear) facilities will necessarily pose a severe challenge to eventual achievement of carbon neutrality.
Clearly, the real-world situation is not as easy as merely replacing current ICE vehicles with EVs, and there will be many obstacles on the path of electrifying passenger vehicles and light-duty trucks.

Author Contributions

Conceptualization, G.C.v.K.; methodology, G.C.v.K.; software, G.C.v.K.; validation, G.C.v.K. and T.E.S.; formal analysis, G.C.v.K.; writing—original draft preparation, G.C.v.K. and T.E.S.; writing—review and editing, T.E.S. and G.C.v.K. All authors have read and agreed to the published version of the manuscript.

Funding

This research received no external funding.

Data Availability Statement

The code for sampling from a triangular distribution was written in R using the method discussed in the article on ‘Triangular distributions’ (‘Generating random variates’) found at https://en.wikipedia.org/wiki/Triangular_distributioninformation (accessed on 20 July 2024). R code found in Appendix A.

Acknowledgments

The authors wish to thank Elmira Aliakbari, senior economist with the Fraser Institute, and Tom Tiedje, former Dean of Engineering at the University of Victoria, for helpful comments and suggestions.

Conflicts of Interest

The authors declare no conflicts of interest.

Appendix A. R File Used in Monte Carlo Analysis

  • library(extraDistr) #Load this library
  • # To obtain random variates from a triangular distribution use:
  • # rtriang(n, a = −1, b = 1, c = (a + b)/2)
  • # a, b and c are minimum, maximum, and midpoint (mode, average, most likely)
  • # of the distribution and n is the number of observations (iterations).
  • set.seed(6) # Set random number seed to duplicate results if desired
  • iter <- 10000 # Number of iterations
  • jurisdiction <- c(‘Canada’, ‘British columbia’, ‘Alberta’, ‘Ontario’, ‘Quebec’)
  • # Number of vehicles by jurisdiction plus average, min and max
  • vehicles <- c(26302526, 3615356, 3519123, 9429566, 6007063)
  • avAuto <- vehicles
  • minAuto <- 0.75*vehicles
  • maxAuto <- 1.25*vehicles
  • # Distance traveled by vehicles in jurisdiction (km)
  • avDistance <- c(15200, 15600, 13100, 16000, 14300)
  • minDistance <- 0.9*avDistance
  • maxDistance <- 1.2*avDistance
  • # Battery efficiency energy (Wh/km)
  • BatEfficiency <- rtriang(iter, 150.0, 295.0, 199.3)
  • Region <- rep(0, 5); ElecMean<-Region; ElecStDev<-Region
  • HydroPlants <- Region; GasPlants <- Region; Hrly <- Region
  • turbines <- Region; turbcap <- Region
  • for (i in 1:length(jurisdiction)){
  •   Region[i] <- jurisdiction[i]
  •   Number <- rtriang(iter, minAuto[i], maxAuto[i], avAuto[i])
  •   Distance <- rtriang(iter, minDistance[i], maxDistance[i], avDistance[i])
  •   Watts <- 0.000001*Number*Distance*BatEfficiency # MWh/8760
  •   ElecMean[i] <- mean(Watts) # GWh per year or MW per hour
  •   ElecStDev[i] <- sd(Watts) # Standard deviation
  •   HydroPlants[i] <- (ElecMean[i])/5100000
  •   GasPlants[i] <- (ElecMean[i])/5913000
  •   Hrly[i] <- ElecMean[i]/8760
  •   turbcap[i] <- 4*Hrly[i]
  •   turbines[i] <- (ElecMean[i])/7665
  • }
  • Info <- c(‘Item’, ‘Mean’, ‘Standard Deviation’)
  • Output <- data.frame(rbind(jurisdiction, ElecMean, ElecStDev), row.names = Info)
  • print(Output)

References

  1. Table: 23-10-0308-01; Vehicle Registrations, by Type of Vehicles and Fuel Type. Statistics Canada: Ottawa, ON, Canada, 2023. Available online: https://www150.statcan.gc.ca/t1/tbl1/en/tv.action?pid=2310030801 (accessed on 19 July 2024).
  2. Government of Canada. Clean Energy Regulations. Available online: https://www.canada.ca/en/services/environment/weather/climatechange/climate-plan/clean-electricity-regulation.html (accessed on 19 July 2024).
  3. Jaeger, J. These Countries Are Adopting Electric Vehicles the Fastest; World Resources Institute: Washington, DC, USA, 14 September 2023; Available online: https://www.wri.org/insights/countries-adopting-electric-vehicles-fastest (accessed on 4 April 2024).
  4. Giswold, J.; Dong, M. Costing Support for EV Battery Manufacturing; Office of the Parliamentary Budget Officer: Ottawa, ON, Canada, 17 November 2023; 16p. Available online: https://distribution-a617274656661637473.pbo-dpb.ca/eaafeb418199ab141962f0b62dae824e9ab2efa95e5baddd1fb5ad774a3fe984 (accessed on 15 August 2024).
  5. BC Hydro. Press Release: Statement from BC Hydro on Site C Project. Available online: https://www.sitecproject.com/site-c-statement (accessed on 4 April 2024).
  6. BC Hydro. Site C Clean Energy Project. Available online: http://www.bchydro.com/planning_regulatory/site_c.html (accessed on 4 April 2024).
  7. He, S.; Luo, Y.S.; Sun, K. Factors affecting electric vehicle adoption intention: The impact of objective, perceived, and prospective charger accessibility. J. Transp. Land Use 2022, 15, 779–801. [Google Scholar] [CrossRef]
  8. Kim, S.Y.; Kang, M.J. A Study on the Factors Influencing the Purchase of Electric Vehicles. Intern. J. Internet Broad Comm. 2022, 14, 194–200. [Google Scholar]
  9. Machado, P.G.; Teixeira, A.C.R.; dos Santos, E.M.; Mouette, D. Electric vehicles adoption: A systematic review (2016–2020). WIREs Energy Environ. 2023, 12, e477. [Google Scholar] [CrossRef]
  10. Pang, J.; Ye, J.; Zhang, X. Factors influencing users’ willingness to use new energy vehicles. PLoS ONE 2023, 18, e0285815. [Google Scholar] [CrossRef] [PubMed]
  11. The Coming Electricity Crisis. The Coming Electricity Crisis. Available online: https://www.wsj.com/articles/electric-grid-crisis-biden-administration-climate-policy-energy-artificial-intelligence-cfc10b68 (accessed on 4 April 2024).
  12. CEC (Clean Energy Canada). The True Cost. Available online: https://cleanenergycanada.org/wp-content/uploads/2022/03/Report_TheTrueCost.pdf (accessed on 4 April 2024).
  13. Haynes, T. Electric Cars Losing Their Value Twice as fast as Petrol Alternatives. The Telegraph. Available online: https://www.telegraph.co.uk/money/consumer-affairs/electric-car-price-fall-second-hand-tesla-bmw/ (accessed on 10 May 2023).
  14. Mills, M.P. Mines, Minerals, and “Green” Energy: A Reality Check; Report; Manhattan Institute for Policy Research: New York, NY, USA, 2020; p. 20. Available online: https://manhattan.institute/article/mines-minerals-and-green-energy-a-reality-check (accessed on 6 March 2024).
  15. Mills, M.P. Electric Vehicle Illusions, Eye on the News. City J. 8 May 2023. Available online: https://www.city-journal.org/article/electric-vehicles-and-carbon-emissions?mc_cid=dd20b2f5be&mc_eid=3e8db95649 (accessed on 10 May 2023).
  16. Xia, C. Exploring the Determinants of Electric Vehicle Adoption in Canada: A Multi-City Study. Unpublished Master’s Thesis, Department of Economics, University of Victoria, Victoria, BC, Canada, 2024. [Google Scholar]
  17. CAA (Canadian Automobile Association). Electric Vehicles. 2024. Available online: https://www.caa.ca/sustainability/electric-vehicles/ (accessed on 4 April 2024).
  18. Government of British Columbia. Motor Fuel Tax and Carbon Tax Rates on Fuels and Substances. Available online: https://www2.gov.bc.ca/gov/content/taxes/sales-taxes/motor-fuel-carbon-tax/publications/motor-fuel-tax-and-carbon-tax-rates (accessed on 4 April 2024).
  19. Pittman, M. Electric Vehicles and the Impact on Infrastructure. Forbes, 29 December 2022. Available online: https://www.forbes.com/sites/forbestechcouncil/2022/12/29/electric-vehicles-and-the-impact-on-infrastructure/?sh=61fe76e1835d (accessed on 6 March 2024).
  20. Hayes, B. Caltrans Pilot Program Tests Replacing Gas Tax with Charging per Mile Driven. ABC EyeWitness News. 2024. Available online: https://abc7.com/post/caltrans-to-test-california-road-charge-for-miles-driven-instead-of-gas-tax/14828291/ (accessed on 9 July 2024).
  21. IEA (International Energy Agency). The Role of Critical Minerals in Clean Energy Transitions. In World Energy Outlook Special Report; IEA: Paris, France, 2021; p. 283. Available online: https://www.iea.org/reports/the-role-of-critical-minerals-in-clean-energy-transitions (accessed on 10 May 2024).
  22. Michaux, S.P. Assessment of the Extra Capacity Required of Alternative Energy Electrical Power Systems to Completely Replace Fossil Fuels. GTK Report; Geological Survey of Finland: Espoo, Finland, 2021; p. 985. Available online: https://www.gtk.fi/en/research/ (accessed on 8 April 2024).
  23. World Nuclear Association. Mineral Requirements for Electricity Generation. 2021. Available online: https://www.world-nuclear.org/information-library/energy-and-the-environment/mineral-requirements-for-electricity-generation.aspx (accessed on 10 May 2023).
  24. Kara, S. Cobalt Red. How the Blood of the Congo Powers our Lives; St. Martin’s Press: New York, NY, USA, 2022. [Google Scholar]
  25. Charette, R.N. How EVs Are Reshaping Labor Markets. IEEE Spectr. 2023. Available online: https://spectrum.ieee.org/the-ev-transition-explained-2658797703 (accessed on 6 March 2024).
  26. California State Senate. SB 100, 100% Clean Energy. Available online: https://focus.senate.ca.gov/sb100/faqs (accessed on 9 July 2024).
  27. Table 17-10-0057-01; Projected Population, by Projection Scenario, Age and Gender, as of July 1 (x 1000). Statistics Canada: Ottawa, ON, Canada, 2024. [CrossRef]
  28. Table 20-10-0024-01; New Motor Vehicle Registrations, Quarterly. Statistics Canada: Ottawa, ON, Canada, 2024. [CrossRef]
  29. Table 20-10-0001-01; New Motor Vehicle Sales. Statistics Canada: Ottawa, ON, Canada. [CrossRef]
  30. Natural Resources Canada. ICF Grid Readiness Report. Available online: https://natural-resources.canada.ca/energy-efficiency/transportation-alternative-fuels/resource-library/3489 (accessed on 14 March 2024).
  31. Kintner-Meyer, M.; Davis, S.; Sridhar, S.; Bhatnagar, D.; Mahserejian, S.; Ghosal, M. Electric Vehicles at Scale–Phase I Analysis: High EV Adoption Impacts on the Western U.S. Power Grid. In PNNL Report 29894; Prepared for the U.S. Department of Energy under Contract DE-AC05-76RL01830; Pacific Northwest National Laboratory: Richland, WA, USA, 2020; 124p. [Google Scholar]
  32. Canada Energy Regulator. Available online: https://www.cer-rec.gc.ca/en/data-analysis/canada-energy-future/2021electricity/ (accessed on 8 March 2024).
  33. Table 25-10-0021-01; Electric Power, Electric Utilities and Industry, Annual Supply and Disposition. Statistics Canada: Ottawa, ON, Canada, 2024. [CrossRef]
  34. Natural Resources Canada. Canadian Vehicle Survey. 2010. Available online: https://oee.nrcan.gc.ca/publications/statistics/cvs08/chapter2.cfm?attr=0 (accessed on 6 March 2024).
  35. van Kooten, G.C. The Economics of Wind Power. Ann. Rev. Res. Econ. 2016, 8, 181–205. [Google Scholar] [CrossRef]
  36. Duan, J.; van Kooten, G.C.; Xuan Liu, X. Renewable Electricity Grids, Battery Storage and Missing Money. Res. Conserv. Recycl. 2020, 161, 105001. [Google Scholar] [CrossRef]
  37. van Kooten, G.C.; Withey, P.; Duan, J. How big a Battery? Renew. Energy 2020, 146, 196–204. [Google Scholar] [CrossRef]
  38. van Kooten, G.C.; Mokhtarzadeh, F. Optimal Investment in Electric Generating Capacity under Climate Policy. J. Environ. Manag. 2019, 232, 66–72. [Google Scholar] [CrossRef] [PubMed]
Figure 1. Subsidies from a shift in demand for EVs.
Energies 17 04109 g001
Figure 2. Growth in new registrations of electric vehicles to total vehicle registrations, various jurisdictions (%). Source: Authors using data from [1,28,29].
Energies 17 04109 g002
Table 1. Summary statistics of available electric vehicle models: battery capacity and energy, and vehicle range and weight.
StatisticCapacity (kWh)Energy (Wh/km) 1Range (km)Weight (kg)
Mean70.2199.3357.51226.5
Maximum123.0295.0685.02500.0
Minimum16.7150.095.0300.0
Median71.0192.0365.01000.0
Observations299299299188
1 Data provided at source provides slightly different data as more models were added: the latest data (March 2024) give an average of 287 with minimum of 139 for a Tesla Model 3, and maximum of 286 for a Mercedes-Benz EQV300 Long. In our data (July 2023), the energy efficiency range of Tesla vehicles is 151–209 Wh/km. Source: https://ev-database.org.
Table 2. Vehicles registered in Canada and four major provinces, by all fuel types and plug-in electric vehicles 1.
CanadaBCAlbertaOntarioQuebec
YearAll Fuel TypesBEV & PHEVAll Fuel TypesBEV & PHEVAll Fuel TypesBEV & PHEVAll Fuel TypesBEV & PHEVAll Fuel TypesBEV & PHEV
201724,618,83143,8073,268,65588873,480,26313498,711,24113,5475,575,51818,876
201825,043,04476,4313,327,92914,9403,530,02119968,875,29626,2525,706,34431,780
201925,426,285126,5633,381,70729,0233,583,68532249,036,98137,2945,801,50354,880
202025,744,196180,7293,369,26645,0163,549,36246019,335,11246,2535,913,74581,507
202126,223,871249,2453,512,19665,6473,554,59267659,456,31760,3695,987,358110,903
202226,302,526346,5343,615,35691,8293,519,12310,4689,429,56687,2996,007,063147,321
Annual increase1.33%51.23%2.04%59.53%0.22%50.65%1.60%45.16%1.50%50.82%
PHEV as % of EVs40.9%27.7%42.3%43.2%46.4%
1 EVs consist of battery EVs (BEV) and plug-in hybrid EVs (PHEV). Source: [1,28].
Table 3. Electricity capacity and generation by source, Canada, 2020 (Percent).
CapacityGeneration
Coal 6.03%4.99%
Natural Gas15.25%11.93%
Oil2.45%0.56%
Hydro54.97%61.87%
Nuclear9.01%13.37%
Wind8.92%5.67%
Solar1.85%0.36%
Biomass1.53%1.24%
TOTAL100.0%100.0%
Level148.9 GW624 TWh
Source: [32].
Table 4. Electricity availability and electric vehicle requirements, 2022.
JurisdictionDomestic Electricity Supply
(MWh) 1
Average Distance Driven
(km/year) 2
Average Energy per EV Annually
(kWh) 3
Total Energy Use by EVs in Jurisdiction
(MWh) 4
% of Electricity Use in Jurisdiction
Canada578,273,57715,20030301,545,4680.27%
Alberta79,531,37915,6003030n.a.n.a.
BC67,053,70413,1002611314,2330.47%
Ontario135,308,94316,0003189476,3570.35%
Quebec210,693,63414,3002850571,1870.27%
1 Source: [33]. 2 Source: [28,34]. 3 Source: [29] and https://ev-database.org. 4 Source: Authors’ calculations; n.a. = not available
Table 5. Hourly and annual estimated increase in energy from electric vehicles and potential increase in generating capacities required, selected jurisdictions.
ItemCanadaBCAlbertaOntarioQuebec
Annual increase (GWh)
Mean88,787.712,543.210,245.433,558.019,071.9
Standard deviation 16,177.42313.81882.16258.53488.4
Hourly increase (MW)
Mean10,135.61431.91169.63830.82177.2
Proportional increase15.4%15.8%15.3%24.8%9.1%
Potential hydro facilities needed 2
Based on mean increase 173274
95% guarantee 1244395
Potential number of 750-MW capacity gas plants needed 3
Based on mean increase 153264
95% guarantee 1213385
Wind power capacity and required turbines (3.5 MW cap)
Capacity (MW) 40,5425727467815,3238709
Number of turbines 11,5841636133743782488
95% guarantee 1 15,8052240182860113398
1 Represents a worst-case scenario where actual requirements are 2 SD higher than the mean. 2 Forecasted annual increase divided by 5100 GWh projected annual output (see text). 3 Annual increases divided by 5913 GWh assuming 750 MW-capacity plant operates 8760 h at 90% capacity. Source: Authors’ calculations.
Disclaimer/Publisher’s Note: The statements, opinions and data contained in all publications are solely those of the individual author(s) and contributor(s) and not of MDPI and/or the editor(s). MDPI and/or the editor(s) disclaim responsibility for any injury to people or property resulting from any ideas, methods, instructions or products referred to in the content.

