Article

Research on the Configuration of a 100% Green Electricity Supplied Zero-Carbon Integrated Energy Station

1
School of Electrical and Power Engineering, Hohai University, Jiangning District, Nanjing 211106, China
2
Jiangsu Engineering Consulting Center Co., Ltd., Gulou District, Nanjing 210011, China
*
Author to whom correspondence should be addressed.
Energies 2024, 17(16), 4111; https://doi.org/10.3390/en17164111 (registering DOI)
Submission received: 14 July 2024 / Revised: 10 August 2024 / Accepted: 14 August 2024 / Published: 19 August 2024
(This article belongs to the Section A: Sustainable Energy)

Abstract

:
In the context of rapid growth in renewable energy installations and increasingly severe consumption issues, this paper designs a 100% green electricity supplied zero-carbon integrated energy station. It aims to analyze its configuration focusing on the following three core features: zero carbon emissions, 100% green electricity supply, and a centralized–distributed system structure. It discusses equipment selection and provides models for configuring upstream green electricity resources, power generation, energy storage, transformer, and energy conversion. The study examines the synergy between lithium-ion battery storage and modular molten salt thermal storage, along with the virtual energy storage characteristics formed by thermal load inertia, supported by mathematical models. Based on the data from a green electricity system in an Eastern Chinese city and typical load profiles, the paper validates a specific configuration for a 100% green electricity supplied zero-carbon integrated energy station, confirming model accuracy and calculating the required scale of upstream green electricity resources. It proves that establishing an electro-thermal storage synergy system is crucial for addressing the significant fluctuations in renewable energy output. It also argues that leveraging thermal load inertia to create virtual storage can reduce the investment in energy storage system construction.

1. Introduction

The extensive use of fossil fuels over the past century has led to the emission of greenhouse gases, exacerbating global climate warming and causing significant real and potential impacts on human living conditions. Reducing greenhouse gas emissions is urgent and is a powerful driver for the global transition to low-carbon energy. Currently, countries are adopting measures to achieve low-carbon and sustainable energy consumption patterns, such as carbon capture and storage technologies, the development of renewable energy (RE), and the establishment of integrated energy systems [1]. An integrated energy system typically consists of various energy networks like the power grid and natural gas network, coupled through integrated energy stations (IESs). IESs can coordinate and integrate different forms of energy (such as electricity, heat, and gas) in production, conversion, storage, and utilization to improve energy efficiency, reduce resource consumption, and minimize environmental pollution thus achieving sustainable energy development and secure energy supply.
As the main center of an integrated energy system, the optimal configuration of IESs is a focal point among many research topics. A simple IES may include only one or two energy conversion facilities, such as combined heat and power (CHP) and gas turbines [2]. In contrast, a complex IES may encompass various energy conversion and storage facilities, resembling a small multi-energy system that includes renewable and other energy types [3]. A typical optimal configuration involves coupling thermal and electrical systems using energy conversion devices like CHP units and heat pumps to enhance overall energy efficiency [4].
Energy decarbonization has been recognized as a crucial measure for addressing the challenge of global climate change [5]. S. Wang et al. proposed the concept of an energy hub (EH), providing a new approach to energy system integration modeling, which is widely used in the optimal operation of multi-energy systems [6]. Scholars have developed various hybrid energy systems based on EH, such as electric–gas, electric–heat, electric–heat–cold, and electric–heat–gas systems [7,8,9,10,11]. L. Li et al. suggested converting electrical energy to natural gas under a sufficient power supply, strengthening the cooperation between power and gas systems, reducing carbon combustion dependence, and enhancing the utilization of renewable energy and the overall system’s economic efficiency [7]. Meanwhile, X. Zhang et al. proposed a synergistic framework involving P2G, CCS, and renewable energy generation systems for renewable gas production and CO2 emission reduction [8]. To reduce carbon emissions from integrated energy systems, D.J. Olsen et al. discussed four different low-carbon design frameworks for optimizing and planning IESs [9]. Hanbin Diao et al. emphasized that energy storage is the link of IES, and the allocation of electricity/heat/cooling multi-energy storage is an important research content in integrated energy system planning. They proposed a coordinated optimal allocation of energy storage in a regional integrated energy system considering the diversity of multi-energy storage [10]. Yufeng Xiong et al. proposed a low-carbon park IES framework with hydrogen energy storage as the conversion hub of various energy forms. Based on analyzing the electricity–heat–gas characteristics of the hydrogen energy storage unit, they established a multi-energy combined storage and supply model, verified the feasibility of reducing energy supply cost and carbon emission of park IESs by configuring hydrogen energy storage, and pointed out its typical application scenarios [11].
The emerging Energy Internet is a typical Cyber–Physical System (CPS), which is built on IESs and combined with internet technologies to achieve the deep integration of information and physical systems [12]. X. Lu et al. proposed a coordinated planning method for integrated demand response, considering flexible loads, electric vehicles, and energy storage [13]. X. Liu et al. proposed an alternative optimization model and solution method for IES planning and operation, balancing the interests of multiple agents [14].
The carbon emission intensity of IESs is also a key focus among researchers. Y. Cheng et al. proposed a bi-level expansion planning model considering carbon emission constraints, which can plan multi-energy networks and IESs synchronously by using a carbon emission flow model and can allocate carbon emission quotas [15]. Y. Cheng et al. analyzed the optimal planning of two IESs with high renewable energy penetration under different carbon reduction scenarios [16]. E. Pursiheimo studied integrated energy systems equipped with carbon capture and storage (CCS) systems, power-to-gas (PtG), and gas-fired units to reduce carbon emissions and increase renewable energy penetration [17]. Junjie Hu et al. developed carbon intensity and carbon reduction models for power grids, shared energy storage, and integrated energy system nodes, demonstrating that shared energy storage stations providing services to various integrated energy systems are more environmentally friendly and cost-effective compared to planning storage individually for each system [18]. J. Wang et al. highlighted the combination of combined heat and power (CHP) plants with distributed renewable energy stations (RESSs) to promote the low-carbon development of district heating systems (DHSs) [19].
These studies on IESs have laid the foundation for subsequent work, but some aspects warrant further in-depth research and discussion, including the following: 1. It is assumed that the original energy system will act as a backup to supply power to the load in emergencies, meaning that IES is not fully exposed to the high volatility of a high proportion of renewable energy systems. 2. It is assumed that the original energy system is accommodating towards IESs. In reality, IESs segment the original energy market and profits from it, without demonstrating a strong willingness for deep cooperation with the original energy system, effectively becoming a competitor to the original energy system.
Currently, academia has begun researching 100% renewable energy systems. Studies by Zhong J. et al. indicate that Sweden’s electricity production system can achieve 100% renewable energy by tripling the existing wind power capacity combined with the current hydropower [20]. Kroposki B et al. examined the energy structures of countries like Iceland and Norway, which have high proportions of renewable energy in their grids, and concluded that wind and solar photovoltaic (PV) systems will contribute to achieving 100% renewable grids in other regions [21]. Child M et al. used the LUT Energy System Transition model to simulate the transition pathways for Europe to achieve 100% renewable energy (RE) by 2050 [22]. The main points of contention in these studies include the following: 1. Although the feasibility of a 100% renewable energy system is verified on a macro level, there is insufficient discussion on specific implementation plans. 2. The energy systems mainly rely on controllable renewable energy sources like hydropower and geothermal, which are strongly resource-dependent and do not directly address the high volatility of rapidly growing wind and PV penetration. 3. Energy forms like natural gas, recycled CO2, and biomass are introduced; while cleaner than coal and oil, they are not entirely zero carbon. 4. Many studies focus on the electricity system, with insufficient analysis of the thermal system and other aspects.
With the rapid increase in the installed capacity of renewable energies such as solar PV and wind power, effectively managing the volatility of these sources has become increasingly important [23], and the challenge of integrating green electricity is growing more severe. There is an urgent need in the academic community to study scenarios with high, or even complete, renewable energy supply. Moreover, multi-energy systems are crucial to reduce the temporal, spatial, and functional mismatch between sustainable energy supply and demand in the energy transition [24].
Based on this, the paper designs a 100% green electricity supplied zero-carbon IES to meet user energy demands in a 100% green electricity, zero-carbon environment. Section 2 explains the core characteristics of the studied IES, and Section 3 introduces the equipment selection and configuration model. Computational analysis of the proposed model is provided in Section 4 based on actual data from a green electricity system and typical loads in a city in Eastern China. Section 5 summarizes the research conclusions and discusses the findings. This study demonstrates that constructing well-configured integrated energy stations is a feasible way to achieve a 100% green electricity supply system. It proves that establishing an electro-thermal storage synergy system is crucial for addressing the significant fluctuations in renewable energy output. It also argues that leveraging thermal load inertia to create virtual storage can reduce the investment in energy storage system construction.

2. Core Characteristics of the Studied IES

Zero-carbon emissions, a 100% green electricity supply, and a centralized–distributed system are the three core characteristics of the IES studied in this paper.

2.1. Integrated Energy Station (IES)

The IES serves as a bridge for directing energy flows from the supply side to the demand side. It acts as a participant in the energy system and supports the realization of energy value. Its core function is to advance and scale up energy conversion activities, efficiently transforming energy before it reaches end users. Based on the underlying needs of users, it provides the required types and amounts of energy, thus facilitating the absorption of upstream power generation. To achieve this, the IES possesses capabilities such as energy consumption, production, storage, conversion, and distribution. This study focuses on dispersed users who lack efficient and economical energy conversion methods, including residential, agricultural, small commercial clusters, and small industrial loads. These users have diverse energy demands, including electricity, mechanical energy, heat, and light.
The IES studied in this paper typically prioritizes producing electricity and heat (including cooling) for several reasons. Firstly, electricity can be quickly and efficiently converted into other forms of energy at user load terminals. Secondly, heat often constitutes more than 60% of the energy use in structures, significantly impacting human activities. Thirdly, electricity and heat complement each other well; electricity responds rapidly and precisely to demand, compensating for heat’s slower adjustment in certain applications. Heat offers thermal inertia and flexibility in load demand, easing the scheduling pressure for constant electricity supply–demand balance.
Finally, to ensure high-efficiency operation, the optimized configuration of the IES studied in this paper follows the principles of minimizing energy conversion, prioritizing early-stage energy conversion, and ensuring precise matching at the terminal.

2.2. Zero Carbon Emissions

The zero-carbon emissions characteristic of the IES studied in this paper is reflected in two aspects. Firstly, the energy received from upstream sources is zero-carbon renewable energy, meaning that both the production and conversion of upstream energy do not emit carbon dioxide. Secondly, the IES does not emit carbon dioxide during internal energy production, storage, conversion, or external energy distribution processes.

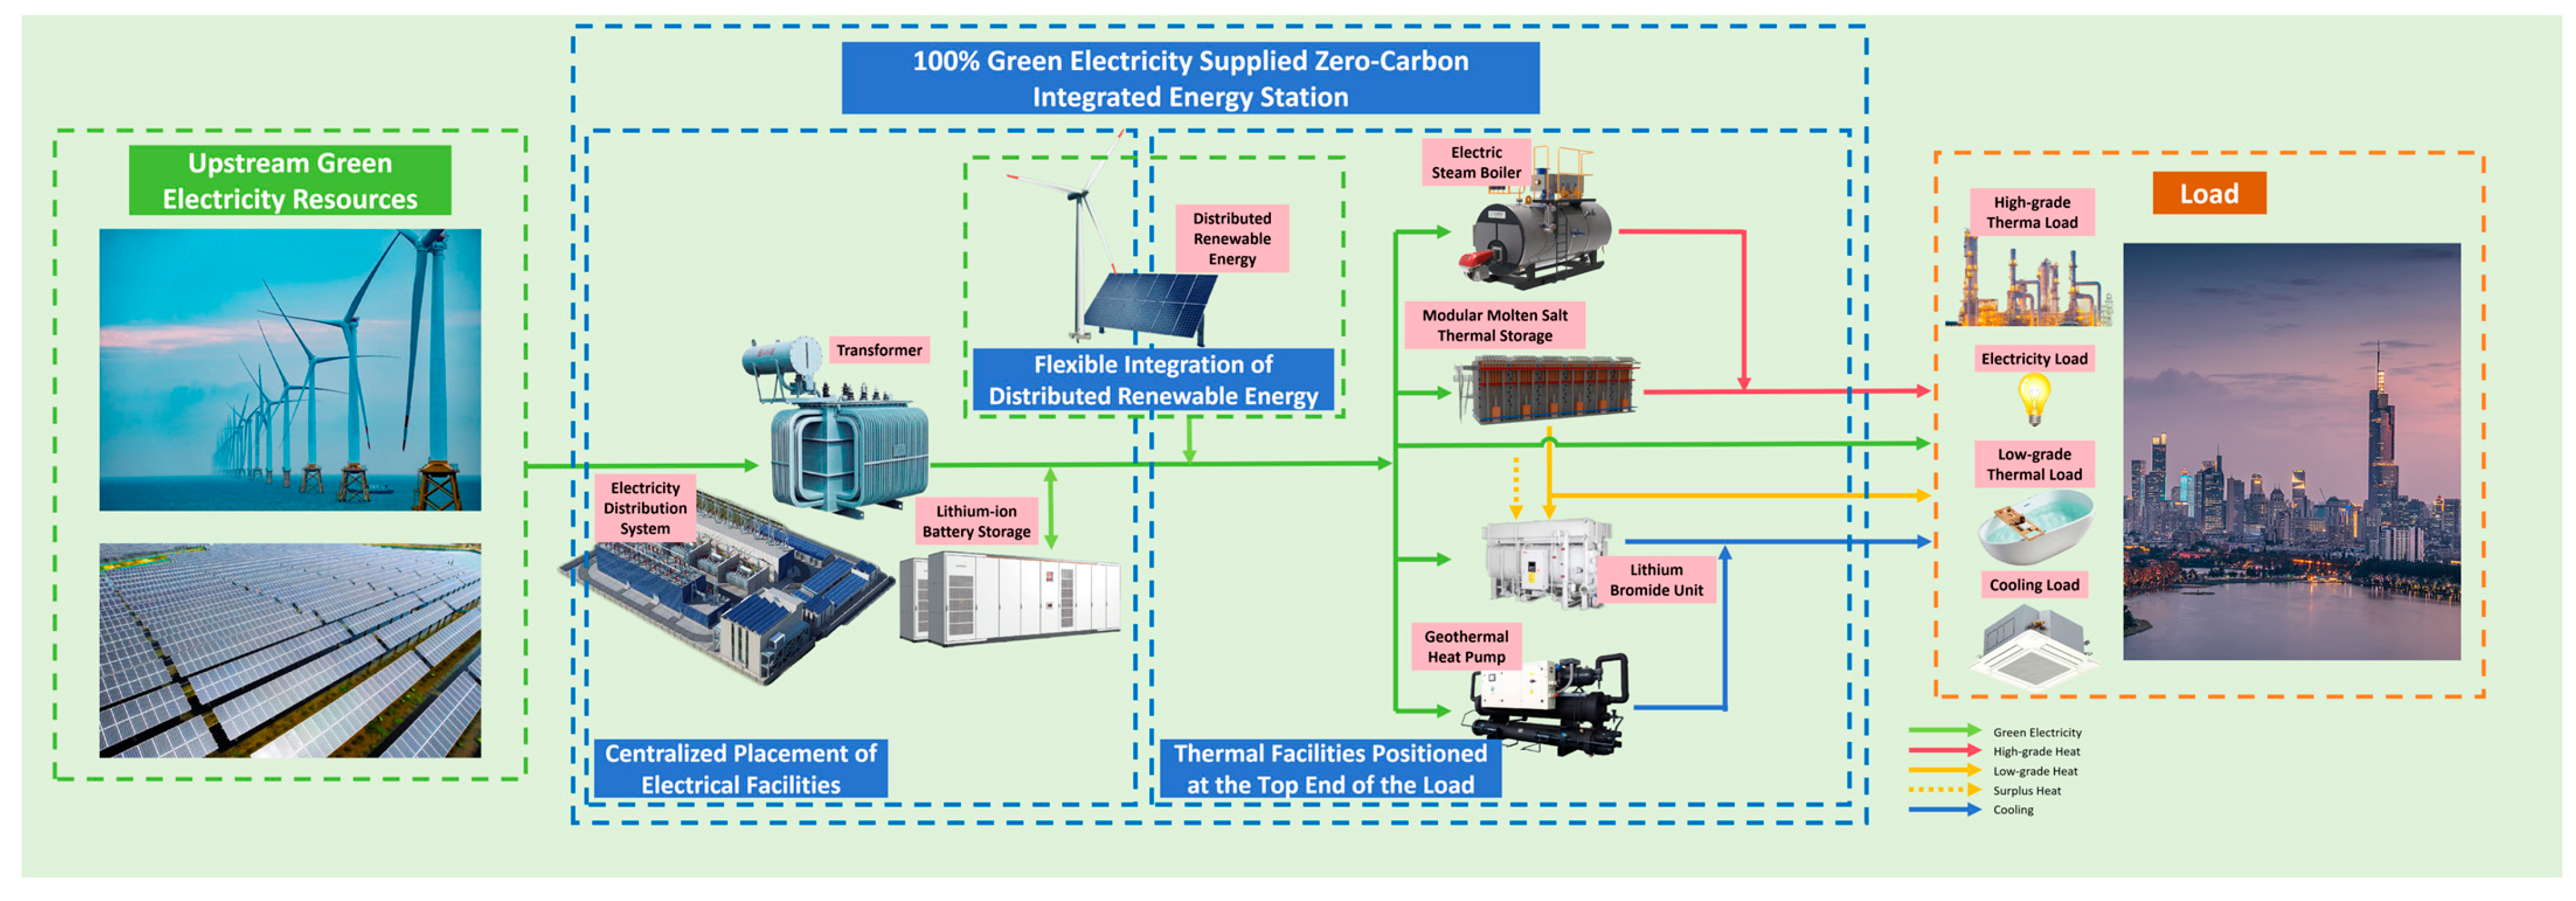
2.3. 100% Green Electricity Supply

With the rapid growth in the installed capacity and proportion of renewable energy, the pressure for its consumption is continuously increasing, necessitating the exploration of specific solutions for supplying energy to load centers entirely from renewable sources, particularly 100% green electricity. In this study, the IES only accepts 100% green electricity for energy supply and meets the comprehensive energy demands of the load through optimized configuration while maximizing the consumption of upstream green electricity.
Traditional IES relies on highly controllable fossil energy sources, which can quickly adjust energy output according to load variations and have strong load-tracking capabilities. In contrast, a 100% green electricity supplied IES faces greater challenges in configuration and operation, because the energy sources, such as wind and photovoltaic power, are zero-carbon renewable energies. Most renewable energies depend highly on natural resources for their output, which, although predictable, are less controllable and have weaker load-tracking capabilities. Based on this characteristic, the IES studied in this paper needs to consider the construction of energy storage facilities to enhance the stability of energy input.

2.4. Centralized–Distributed System

In this study, the IES is not confined to a fixed boundary but rather adapts to the characteristics of electricity and heat—forming a hybrid centralized–distributed system. Green electricity is the sole input and core energy source for the IES. To be utilized by the energy load, it requires centralized voltage reduction. Additionally, to facilitate the efficient and convenient circulation of electricity within the entire coverage area of the IES, the substations and electricity storage facilities should be centrally arranged.
The transmission of heat generally relies on mediums such as water or steam, which involve high network construction costs and are highly sensitive to distance in terms of transmission efficiency. Moreover, heat conversion, storage, and distribution facilities need to reach a certain scale to ensure high efficiency. Small-scale facilities placed at load terminals suffer from high operational losses and cannot ensure energy efficiency. Therefore, in this study, heat-related facilities are placed at the top end of a group of loads (such as residential areas, commercial complexes, or industrial parks), creating a form that lies between centralized and distributed.
The integration of green electricity production facilities, such as distributed solar photovoltaic (PV) and wind power, is highly efficient. These facilities can be connected at any point within the coverage area of the IES, provided land and connection conditions are met.
Overall, the equipment in the IES in this study is both centralized and distributed, forming a hybrid system that combines the advantages of both centralized and distributed approaches, ensuring high efficiency and flexibility in energy supply.
The system topology diagram of a 100% green electricity supplied zero-carbon integrated energy station is shown in Figure 1.

3. Optimization Configuration Research

3.1. Equipment Selection

A 100% green electricity supply environment imposes higher requirements on the selection of core equipment for the IES. The chosen equipment must accurately respond to demand while offering optimal performance. Another key focus is ensuring the efficient use of both equipment and energy, minimizing energy losses.

3.1.1. Substation Equipment

The upstream green electricity is input in high-voltage form. This high-voltage electricity is converted to the required voltage levels for the load side through substation equipment. Additionally, various energy production, conversion, and storage devices generally need to operate at lower voltage levels. Currently, large-scale green electricity is predominantly in the form of alternating current (AC). Therefore, this study configures AC transformers as substation equipment.

3.1.2. Power Generation Equipment

The optional zero-carbon power generation equipment includes distributed wind power, distributed solar PV, geothermal power, small hydropower, etc. Considering factors such as construction cost, conditions, and technological maturity, the most mainstream forms currently are distributed wind power and distributed solar PV.
Distributed wind power has longer annual operating hours and the capability to generate electricity during overcast weather and at night, providing strong output support. Distributed solar PV is easy to install and has minimal impact on the surrounding environment. The construction of these facilities is influenced by factors such as land availability, planning constraints, sunlight exposure, and wind conditions within the IES’s area of influence, necessitating comprehensive consideration.
It is important to note that upstream green electricity resources and the IES operate in the same region with similar natural conditions. Choosing the same type of equipment may lead to frequency synchronization issues during peak and off-peak periods. Additionally, one of the core functions of the IES studied in this paper is to consume upstream green electricity. Therefore, to avoid impacting the station’s operational role, generation equipment is selectively installed in areas with favorable construction and access conditions, such as idle rooftops, without specific capacity requirements.

3.1.3. Energy Conversion Equipment

To meet the various energy demands of users, the energy conversion equipment primarily includes green electricity to high-grade heat conversion equipment, green electricity to low-grade heat conversion equipment, green electricity to cooling conversion equipment, and low-grade heat to cooling conversion equipment.
Green electricity to high-grade heat exists in the following two forms: one relies on steam as a medium, where the conversion equipment principle involves using electric heaters to heat water to produce steam that meets the required parameters, with electric boilers representing such equipment. The other form involves direct conversion from electricity, including electromagnetic heating equipment and resistance heating equipment. This study will use electric boilers as the green electricity to high-grade heat conversion equipment.
The best equipment for converting green electricity to low-grade heat and cooling is undoubtedly heat pump equipment. By consuming a certain amount of electricity, these systems “transfer” the consumed energy several times in the form of low-grade heating or cooling from resources such as the ground, air, and water, concentrating the energy to enhance its utility. The main types of heat pump equipment include ground-source heat pumps, water-source heat pumps, and air-source heat pumps, all of which can supply cooling and domestic hot water simultaneously during summer.
Considering system efficiency, land (water body) resource requirements, and economic factors, this study uses ground-source heat pumps as the primary equipment for converting green electricity to low-grade heating and cooling. Large ground-source heat pumps can achieve a heating coefficient of performance (COP) of over 5 and a cooling energy efficiency ratio (EER) of over 6.1. Compared to small terminal heat pump equipment, such as air conditioners, ground-source heat pumps have 50% to 70% higher heating efficiency and 40% to 50% higher cooling efficiency. By deploying large ground-source heat pump equipment at the peak load end and providing a centralized energy supply to users, energy utilization efficiency can be significantly improved.
In summer, the refrigerant in the ground-source heat pump releases heat in the condenser. By recovering and utilizing this heat, the system can output low-grade heat while providing cooling. For a full heat recovery system, the heat recovery ratio can reach 70%. Due to the long cooling period and high cooling demand in summer, the recovered heat can sufficiently cover the low-grade heat demand of the load in most cases.
During summer, the demand for cooling is high. Additional green electricity to cooling conversion equipment should be considered to further support the cooling capacity of the ground-source heat pump during peak cooling demand. The main equipment includes mechanical chiller units and absorption chillers. Mechanical chiller units have higher cooling efficiency, with a cooling EER of over five, whereas the most advanced triple-effect absorption chillers have a maximum cooling EER of two. From the perspective of cooling efficiency, chiller units have an advantage. Absorption chillers use input energy sources such as hot water, steam, and gas, which can fully utilize waste heat resources to produce cooling. The surplus of high-grade thermal energy after use can effectively serve as partial input for absorption chillers. Any shortfall can be supplemented by extracting low-grade thermal energy from thermal storage facilities. Based on this waste heat cascading utilization operating mode, the overall cooling efficiency of absorption chillers can be significantly improved.
Therefore, this study employs absorption chillers as a supplementary cooling supply during summer. Since there is no need to centrally supply cooling below 0 °C, lithium bromide solution, which is more efficient and easier to maintain, is chosen as the cooling medium for the absorption chillers.
Converting heat to electricity requires the configuration of steam turbine generator sets. However, given the limited load scale of the integrated energy station, small-capacity steam turbine generator sets have lower efficiency, higher losses, and difficulties in efficiently utilizing the waste heat. Therefore, this study does not consider configuring such equipment.

3.1.4. Energy Storage Equipment

Energy storage equipment includes electrical energy storage and thermal storage.
Currently, the applicable electrical energy storage solutions include lithium-ion battery storage, compressed air energy storage, flow battery storage, flywheel storage, etc. [25,26]. Extensive comparisons of these solutions have been conducted by the academic and engineering communities. Thus, this study does not delve deeply into these comparisons. Instead, it selects lithium-ion battery storage, which offers high energy density, good flexibility, economic efficiency, and mature technology, as the preferred electrical energy storage solution.
Currently, applicable thermal storage solutions include sensible heat storage, latent heat storage, molten salt thermal storage, thermochemical storage, etc. [27,28]. Extensive comparisons of these solutions have also been conducted by the academic and engineering communities. Thus, this study does not delve deeply into these comparisons either. Instead, it selects modular molten salt thermal storage as the preferred solution due to its economic efficiency, wide temperature regulation range, good heat conduction and circulation performance, and flexible system configuration [29]. In combination with lithium bromide absorption chillers, this thermal storage system will also have the capability to store cooling energy.
A comparison of the core technical parameters of two recently completed lithium-ion battery storage systems and modular molten salt thermal storage systems in China is shown in Table 1.
Based on the table above, it is evident that lithium-ion battery storage has strong charge and discharge capabilities but comes with higher construction costs and lower energy density. In contrast, modular molten salt thermal storage has lower construction costs, higher energy density, and significantly lower land resource requirements compared to lithium-ion battery storage, although its charge and discharge capabilities are less than those of lithium-ion battery storage.
Based on these characteristics, the two types of energy storage facilities serve different purposes as follows: electricity storage facilities prioritize power reserves, with energy storage as a secondary function. In the case of energy supply–demand imbalances, they promptly utilize their rapid regulation capabilities to mitigate power fluctuations. Thermal storage facilities prioritize energy storage, with power reserves as a secondary function. During prolonged energy deficits, they leverage their low cost of storage and thermal inertia to address energy shortfalls. Electricity storage facilities can be strategically located at the core positions of IESs to complement multiple thermal storage facilities, whereas thermal storage facilities are more suitable for placement at the top end of a group of loads. In this mode, electricity storage and thermal storage facilities can form complementary support characteristics, thereby establishing an electro-thermal storage synergy system.

3.2. Configuration Model

3.2.1. Upstream Green Electricity Resources Configuration Model

The IES studied in this paper derives all its energy from upstream green electricity resources, with only a small portion generated by self-built power generation equipment. To ensure a smooth energy supply to users, substantial-scale energy storage facilities need to be constructed, supplemented by the inertia of thermal loads over short cycles.
Energy storage facilities act as energy throughput devices capable of altering the temporal characteristics of energy but do not generate energy themselves. Relying on energy storage facilities shifts the control of the energy supply–demand system from balancing power at specific time intervals to balancing energy over time periods. Therefore, over the supply period, the energy provided by upstream green electricity resources must cover the entire load energy demand of the IES. For any energy balance period of duration T , we have the following equation:
0 T P U d t + 0 T P c g d t = 0 T L e + L h h e + L h l e + L c e d t
0 T P U d t + 0 T P c g d t = 0 T L d t
where P U is the green electricity power required from upstream, P c g is the power generated by the IES’s power generation facilities, L e is the power consumption of electrical loads, L h h e is the power consumption of high-grade thermal loads, L h l e is the power consumption of low-grade thermal loads, L c e is the power consumption of cooling loads, and L is the total power consumption of all loads.
The equation can be rewritten as follows:
P U ¯ + P c g ¯ × T = L e ¯ + L h h e ¯ + L h l e ¯ + L c e ¯ × T
P U ¯ + P c g ¯ = L e ¯ + L h h e ¯ + L h l e ¯ + L c e ¯ = L ¯
where P U ¯ , P c g ¯ , L e ¯ , L h h e ¯ , L h l e ¯ , L c e ¯ , L ¯ are the average of P U , P c g , L e , L h h e , L h l e , L c e , and L over the energy balance period.
Since the installed capacity of self-built power generation facilities is relatively small, P c g ¯ can be ignored. Therefore, the following equation is formed:
P U ¯ = L e ¯ + L h h e ¯ + L h l e ¯ + L c e ¯ = L ¯
Assume I U 1 ¯ is the average green electricity output from 1 MW of upstream green electricity resources over the energy balance period, multiplied by a factor n , if we have Equation (6) for any period:
n × I U 1 ¯ P U ¯ = L ¯
Then, the configuration of the upstream green electricity resources is n MW as shown in Figure 2.
Furthermore, we can derive the relationship function of n with respect to T :
n = ρ · e σ T
where ρ and σ are the constant parameters.

3.2.2. Power Generation Equipment Configuration Model

Based on the previous analysis, self-built power generation equipment serves only as a supplement to upstream green electricity resources, constructed only in areas within the station that have favorable construction and access conditions, such as unused rooftops. There are no specific requirements for its capacity. The installed capacity of the power generation equipment I C G can be expressed as follows:
I C G = f S , A C C ,
where S is spatial factors, A C C is factors related to access conditions, and f is a function related to factors S , A C C , etc.

3.2.3. Energy Storage Equipment Configuration Model

The configuration of energy storage equipment involves two aspects as follows: power configuration and capacity configuration. This paper first comprehensively studies the configuration issues of energy storage facilities and then deducts the energy storage on the green electricity resources side to determine the energy storage configuration for the IES.
  • Overall Configuration of Energy Storage Facilities
Without considering energy storage intervention, at a certain moment, there may be a gap between the power output of upstream green electricity resources n × I U 1 and the total load demand L , gap is represented by P as follows:
P = n × I U 1 L a , b
Based on the previous analysis, the installed upstream green electricity resources have a surplus for supplying the load. Therefore, the energy storage facilities do not need to aim to fully absorb the upstream output with their charging power but should aim to meet the load demand with their discharging power. Hence, the total power of the energy storage system I S is as follows:
I S = a
Due to the inclusion of energy storage facilities, the following formula holds true for any energy balance period:
0 T n   ×   I U 1 d t 0 T L d t
Analyzing the period where the energy production of upstream green electricity resources equals load demand, denoted as t e q + T period, to determine the capacity of energy storage facilities.
Based on Figure 3, curve n × I U 1 and curve L must have at least one intersection point. Taking into account possible connections between energy storage discharge intervals before and after the current period, the total capacity of the energy storage system is represented by the following equation:
C S 2 × ε × t e q t e q + T n × I U 1 L d t
The more intersection points there are, the smaller the coefficient ε becomes. When there is only one intersection point, ε = 1 / 2 . Considering the uncertainty in the number of intersection points, let ε = 1 / 2 , and we have the following:
C S = t e q t e q + T n × I U 1 L d t
2.
Virtual Energy Storage Configuration Formed by Thermal Load Inertia
Thermal load has thermal inertia, meaning that a change in energy supply at a given moment does not immediately affect the user experience. As long as the energy supply meets user demand within the inertia time around moment t , the user experience remains unaffected. The inertia time for thermal load is generally short, typically measured in minutes. To simplify the model, this study assumes that the inertia time is consistent and constant at any given moment. The model is formulated as follows:
t t 1 t + t 1 P h h e d t = t t 1 t + t 1 L h h e d t t t 2 t + t 2 P h l e d t = t t 2 t + t 2 L h l e d t t t 3 t + t 3 P c e d t = t t 3 t + t 3 L c e d t
where P h h e is the electrical power supplied to high-grade thermal loads, P h l e is the electrical power supplied to low-grade thermal loads, P c e is the electrical power supplied to cooling loads, t 1 is half of the inertia time of high-grade thermal loads, t 2 is half of the inertia time of low-grade thermal loads, and t 3 is half of the inertia time of cooling loads.
This is consistent with the characteristics of energy storage, meaning that leveraging the inertia of thermal loads can form a virtual energy storage.
When completely disconnecting the thermal load, the discharging capability of the virtual energy storage equals the electrical power consumed by the thermal load. By adjusting the flow rate of the energy-carrying medium, the charging capability of the virtual energy storage can be controlled. However, the carrying capacity of the energy-carrying medium must also be considered. This study sets the charging capability of the virtual energy storage to be equal to its discharging capability. Therefore, the power I V S of the virtual energy storage is as follows:
I V S = L h h e + L h l e + L c e
Due to the significant proportion of thermal loads in the total load, the power I V S of the virtual energy storage is substantial. The power adjustment speed of the virtual energy storage is equivalent to that of electrical power adjustment, ensuring rapid response and high adjustment precision.
Due to the short inertia time of virtual energy storage, typically measured in minutes, its capacity is very small. Therefore, its impact on the overall capacity configuration of energy storage facilities can be negligible.
The main role of virtual energy storage is to mitigate these short-term spikes caused by fluctuations in renewable energy, characterized by high instantaneous peak power and short duration. This function helps smooth out these spikes, reducing the total power configuration required for energy storage systems and lowering overall configuration costs. After smoothing out these spikes, the total power I S * of the energy storage system is as follows:
I S * = a *
The comparison of the total power of the energy storage system, with and without considering virtual energy storage, is shown in Figure 4.
3.
Energy Storage Configuration for the IES
Energy storage configuration for upstream green electricity resources generally follows relevant policy requirements in China. In this study, the upstream energy storage configuration is coordinated with the upstream green energy resource configuration and is considered known. Therefore, the energy storage configuration is as follows:
I C S = I S * I U S = I S * α × n
C C S = C S C U S = C S α × β × n
where I C S is the energy storage power of the IES, I U S is the energy storage power paired with upstream green electricity resources, C C S is the energy storage capacity of the IES, C U S is the energy storage capacity paired with upstream green electricity resources, α is the ratio of the energy storage power paired with upstream green electricity resources to the installed capacity, as mandated by policy, and β is the duration coefficient for energy storage paired with upstream green electricity resources as per policy.
4.
Lithium-ion Battery Storage and Modular Molten Salt Thermal Storage Configuration for the IES
Based on the analysis from earlier, lithium-ion battery storage tends to favor power output, while modular molten salt thermal storage leans towards energy output. Therefore, let us set the following:
C C S E = γ × I C S E
C C S H = δ × I C S H
where C C S E is the lithium-ion battery storage capacity, I C S E is the lithium-ion battery storage power, C C S H is the modular molten salt thermal storage capacity, I C S H is the modular molten salt thermal storage power, γ is the duration coefficient of the lithium-ion battery storage, and δ is the duration coefficient of the modular molten salt thermal storage.
In the IES designed in this paper, stored electricity can be converted into heat through equipment, while stored heat cannot supply electricity. Considering extreme scenarios such as night-time without wind and upstream energy storage being depleted after prolonged output, upstream green electricity resources may completely fail to supply the IES. Therefore, the power and capacity of lithium-ion battery storage should meet the following conditions:
I C S E m a x L e
C C S E t e q t e q + T L e d t
In practical engineering, the system efficiency and charge/discharge depth limits of storage facilities can impact capacity configuration. The adjusted lithium-ion battery storage capacity C C S E * and modular molten salt thermal storage capacity C C S H * for the IES can be as follows:
C C S E * = C C S E η C S E
C C S H * = C C S H η C S H
where η C S E and η C S H represent the products of the system’s overall efficiency and the charge/discharge depth limits for the lithium-ion battery storage and modular molten salt thermal storage, respectively.
According to the following formulas, the power and capacity configuration of lithium-ion battery storage and modular molten salt thermal storage can be calculated:
I C S E + I C S H = I C S C C S E + C C S H = C C S C C S E = γ × I C S E C C S H = δ × I C S H I C S E m a x L e C C S E t e q t e q + T L e d t C C S E * = C C S E η C S E C C S H * = C C S H η C S H

3.2.4. Substation Equipment Configuration Model

Substation equipment must consider the impact of energy storage charging and discharging power while meeting load demands. Based on the previous analysis, when upstream output is greater than or equal to the load demand, the energy storage system is in charging mode. The power P C T through substation equipment is as follows:
P C T = m a x m i n a * , P I U S , 0 + L L
When the upstream output is less than the load demand, the energy storage system is in discharging mode. The power P C T through substation equipment is as follows:
P C T = n × I U 1 + m i n P , I U S L
The configuration of substation equipment I C T needs to meet maximum operating conditions as in the following equation:
I C T = m a x L + I C S

3.2.5. Energy Conversion Equipment Configuration Model

The green electricity to high-grade heat conversion equipment chosen in this paper is electric boilers, which are installed to meet the high-grade thermal demand. Due to the electric boiler’s heating efficiency being close to one, and considering a centralized–distributed layout supplemented with effective insulation measures where pipeline heat loss can be ignored, the installed capacity of the electric boiler I C B can be represented as follows:
I C B = m a x L h h
The selected green electricity technology in this article is the ground-source heat pumps for the conversion of low-grade heating and cooling energy. In winter, considering the load without cooling demand (refrigerators included in the electrical load), the installed capacity of ground source heat pumps in winter I C P W needs to meet the demand for low-grade thermal demand L h l as follows:
I C P W = m a x L h l / C O P
In summer, ground-source heat pumps can utilize heat recovery technology to recover heat removed from buildings and convert it into hot water thus possessing the ability to supply both cooling and domestic hot water simultaneously. Considering that the cooling demand in summer is much higher than the demand for low-grade heat, this article does not consider the need for additional low-grade heat conversion equipment in summer. The installed capacity of ground source heat pumps in summer I C P S needs to meet the cooling demand L c as follows:
I C P S = m a x L c / E E R
In summary, the installed capacity of the ground source heat pump I C P should be the following:
I C P = m a x I C P W , I C P S
In extreme cases, the installed capacity of the lithium bromide absorption chillers (measured in cooling capacity) as a supplement to the ground source heat pumps’ cooling output in summer should be as follows:
I C C = L c I C S E m a x L e × E E R

4. Case Study

4.1. Case Background and Parameters

In a city in Eastern China, a certain load cluster includes residential loads, commercial and industrial loads, and a small amount of industrial loads. The average annual load is approximately 62.10 MW (with heat and cooling converted to electrical energy based on the energy conversion efficiency of the IES proposed in this paper). The load situation in 2020 is shown in Figure 5:
The trends of daily peak load and daily electricity consumption are similar. Further analysis of the monthly load electricity consumption reveals that the peaks mainly occur in summer and winter, with the highest peak in August. The detailed results are shown in Figure 6:
The city’s power grid structure is robust, ensuring effective integration of green energy resources. Renewable energy completed in 2020 mainly includes 583.3 MW of wind power and 1037 MW of photovoltaics. The comprehensive power generation situation in 2020 is illustrated in Figure 7:
It can be seen that the output of upstream green electricity resources is highly volatile. Further analysis of the monthly energy production is shown in Figure 8:
It can be seen that the energy production is mainly concentrated in the spring months of March, April, and May. However, during the peak load demand seasons of summer and winter, the energy production capacity is relatively weak. The mismatch is highly significant as shown in Figure 9.
Given that the primary task of the IES is to meet load demands, this study conducts an in-depth analysis using data from July to August, when load demand is high, but energy production is weak. In July and August, the output volatility of upstream green electricity resources is extremely significant as shown in Figure 10. Further analysis reveals that the output remains low for a substantial portion of time, with the output being less than 10% of the installed capacity 45.97% of the time and less than 2% of the installed capacity 10.61% of the time.
With all loads converted to electrical loads, the average load for July and August is 75.77 MW. The detailed breakdown is shown in Table 2 (low-grade thermal demand is covered by waste heat and cooling heat recovery and is omitted):

4.2. Results Analysis

4.2.1. Upstream Green Electricity Resources Configuration

According to the varying duration of energy balance period, the configuration of upstream green electricity resources and their corresponding energy utilization rates are shown in Table 3 and Figure 11:
The configuration of upstream green electricity resources is greatly influenced by the energy balance period duration. When the duration is 0, meaning no energy storage is configured, no matter how abundant the front-end Green Electricity resources are, they cannot meet the scaled energy demands of the load. As the balance period duration increases, the configuration of upstream green electricity resources decreases exponentially. Through data fitting, the function of n with respect to T can be determined to be the following:
n 60971.1 · e 0.0908 T
When the balance period duration is 24 h, the configuration of upstream green electricity resources is 1286 MW, and the energy utilization rate is 42.37%. As the balance period increases further, the rate of decrease in the configuration of upstream green electricity resources slows down significantly. Considering that the photovoltaic generation period duration is also 24 h, this paper uses 24 h as the balance period duration for subsequent analysis.

4.2.2. Energy Storage Configuration

According to the case data, I S = a = 134.36   M W . a appears at 20:00 on 16 August. Study P within one hour before and after the appearance of a . At 19:00, P = 117.08   M W ; at 21:00, P = 109.65   M W . Comparing with other data within the study range, it is found that P fluctuates the most during this time period, possibly indicating a spike. By utilizing the virtual energy storage characteristics of thermal loads, the mean value method is used to handle the spike, we have I S * = a * = 120.36   M W . After spike removal, the total power of the energy storage facilities was reduced by 10.42%, which can effectively lower the investment in energy storage power facilities.
On 28 August, the upstream energy production matches the load consumption almost perfectly as shown in Figure 12a. Based on the previous analysis, the total capacity of the energy storage system is calculated using the data from 28 August as shown in Figure 12b.
Figure 12. (a) Daily upstream energy production and load consumption curves of July and August; (b) Real-time upstream power output and load curves of 28 August.
Energies 17 04111 g012
C S = 0 T n × I U 1 L d t = 1556.71   M W h
α = 1.5 % ,   β = 2   h , so we have:
I U S = α × n = 1.5 % × 1286 = 19.29   M W C U S = α × β × n = 2 × 19.29 = 38.58   M W h
The overall configuration of the IES’s energy storage is as follows:
I C S = I S * I U S = 120.36 19.29 = 101.07   M W C C S = C S C U S = 1556.71 38.58 = 1518.13   M W h
Assuming a storage duration of 24 h for modular molten salt thermal storage, which equals the energy balance period, and evaluating durations of 1 h, 2 h, 4 h, 6 h, and 8 h for lithium-ion battery thermal storage, the analysis proceeds in Figure 13:
According to the following load data:
m a x L e = 31.12   M W t e q t e q + T L e d t = 372.15   M W h
Based on the data in Table 4, it is determined that lithium-ion battery storage should be configured for 7 h. The energy storage configuration for the IES is as follows:
I C S E = 53.39   MW C C S E = 373.74   MWh I C S H = 47.68   MW C C S H = 1144.38   MWh
Based on the characteristics of the mainstream lithium-ion battery storage and modular molten salt thermal storage, where the system’s overall efficiency is 93% and 98%, respectively, and the charge/discharge depth limit is 90% for both, we have the following:
η C S E = 0.84 η C S H = 0.88 C C S E * = 444.93   MWh C C S H * = 1300.43   MWh

4.2.3. Substation Equipment Configuration

Based on the analysis in Section 3.2.4 and combining the case data, the transformer equipment configuration for the comprehensive energy station is as follows:
I C T = m a x L + I C S = 139.60 + 101.07 = 240.67   M V A

4.2.4. Energy Conversion Equipment Configuration

Based on the analysis in Section 3.2.5 and combining the case data, we can determine the following configuration for the energy conversion equipment.
Electric Boiler Installation is as follows:
I C B = m a x L h h = 50.26   M W
Ground Source Heat Pump Installation is as follows:
I C P = m a x I C P W , I C P S = 58.23   M W
Lithium Bromide Absorption Chiller Installation (measured by cooling capacity) is as follows:
I C C = L c I C S E m a x L e × E E R = 219.29   M W

5. Discussion

  • This paper presents mathematical models for configuring upstream green electricity resources, power generation equipment, energy storage equipment, substation equipment, and energy conversion equipment for a 100% green electricity supplied zero-carbon integrated energy station, from both power and energy perspectives. The models are validated through case studies.
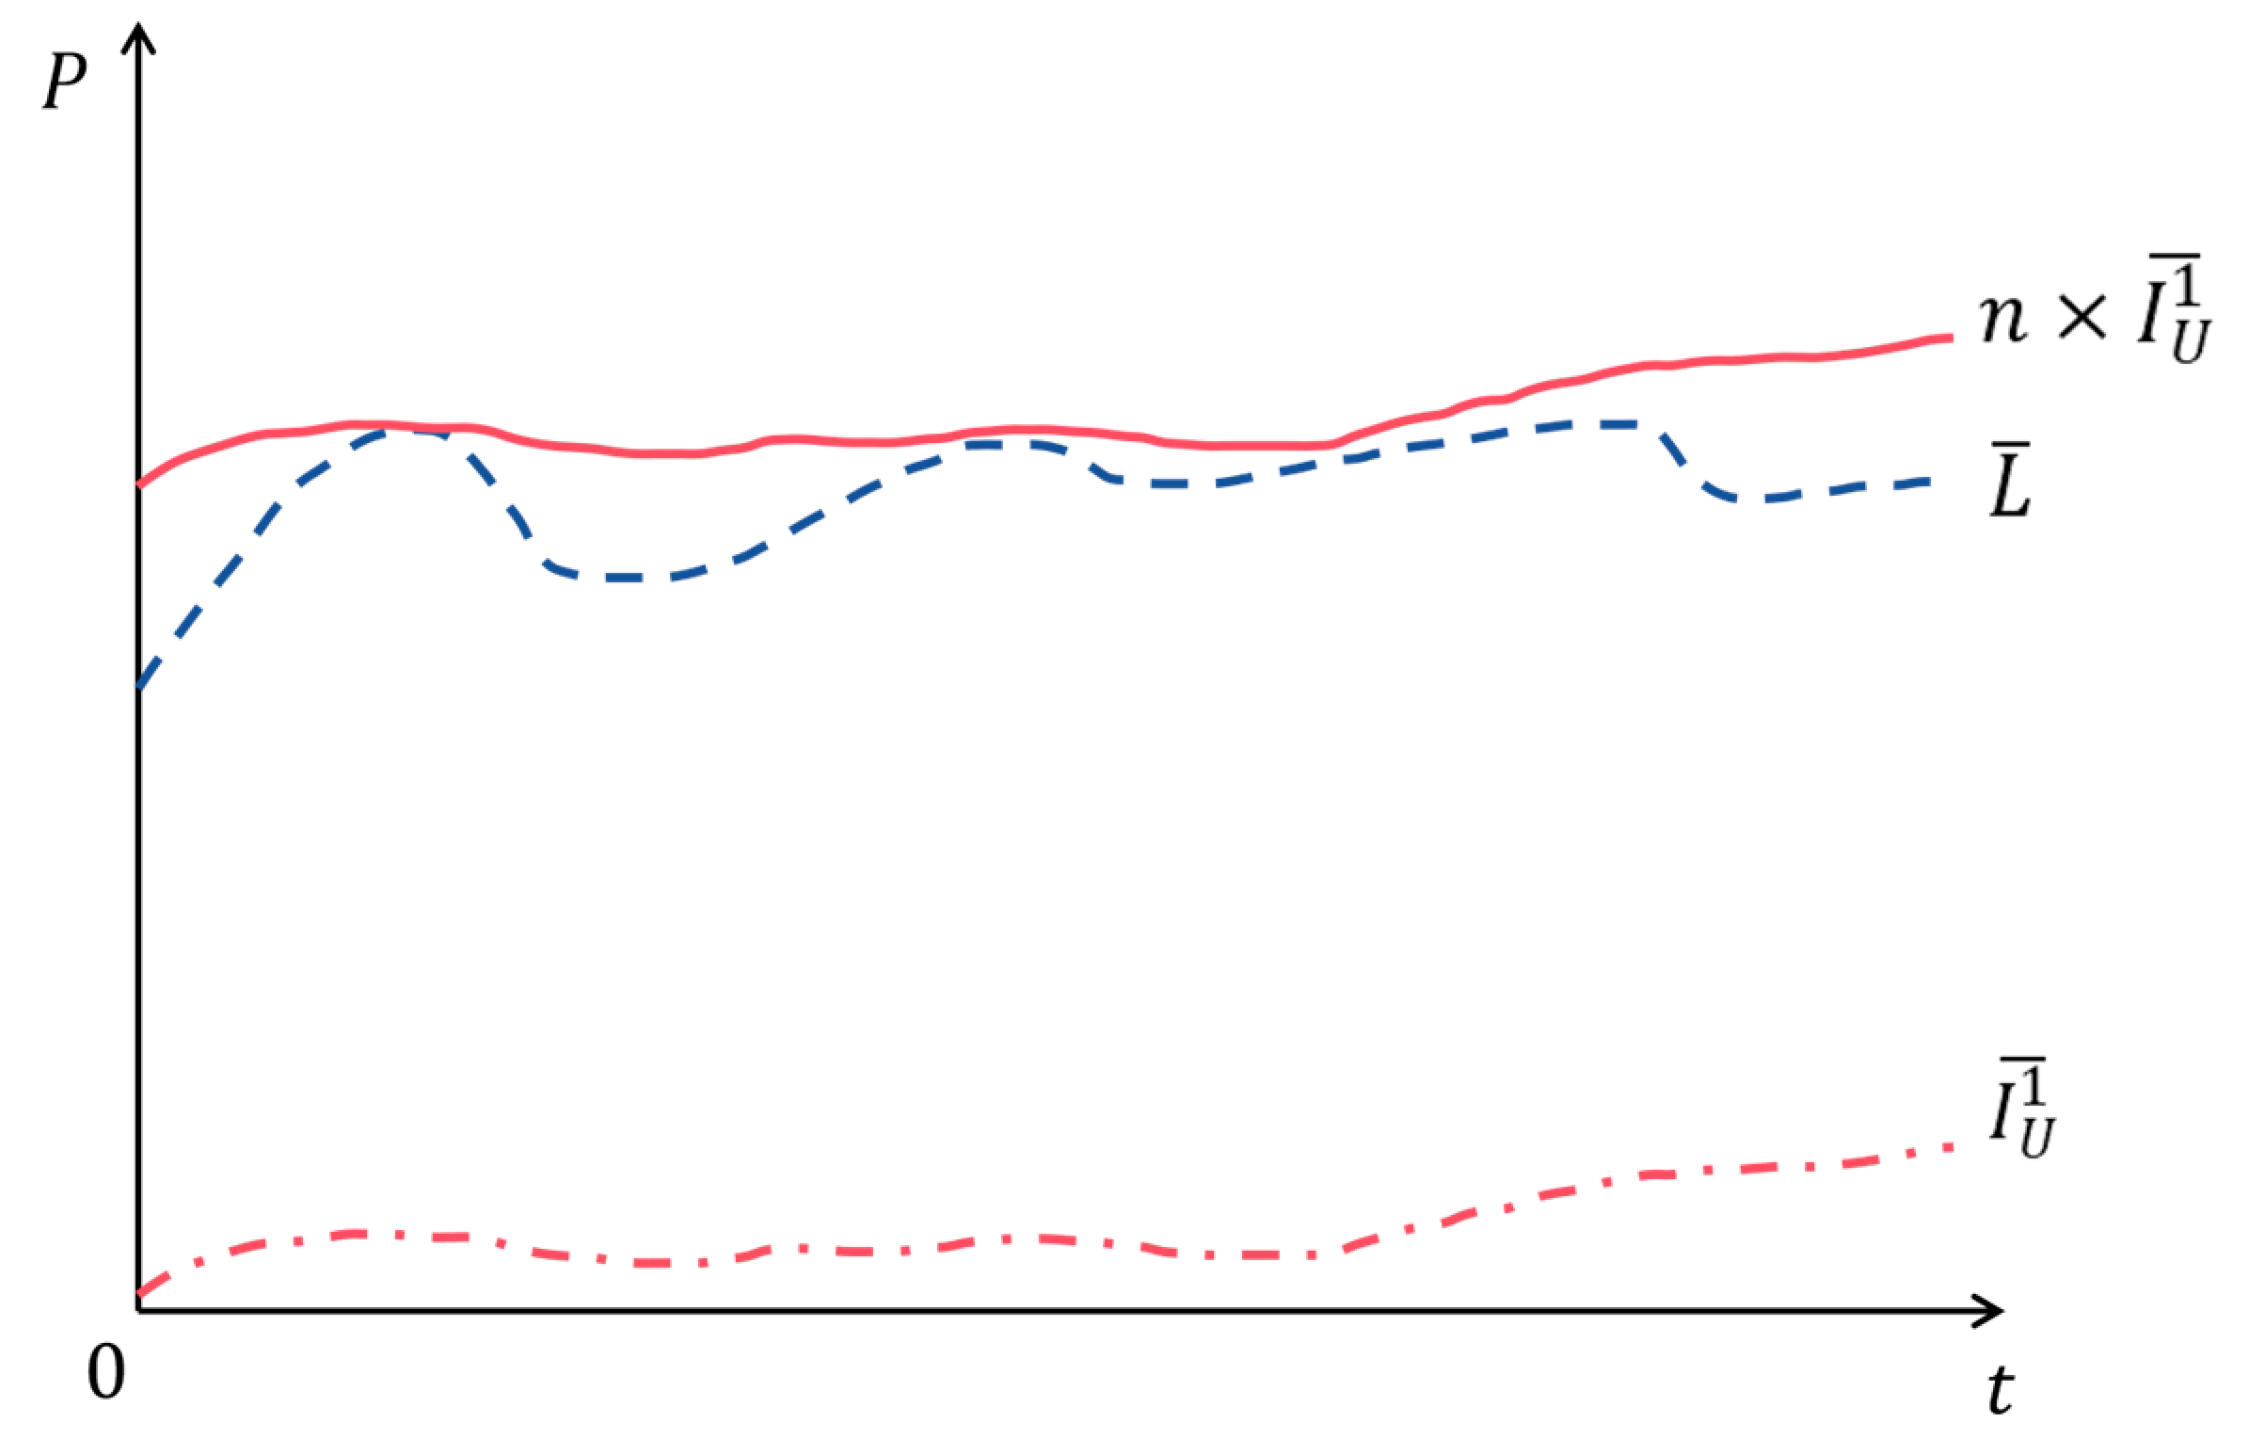
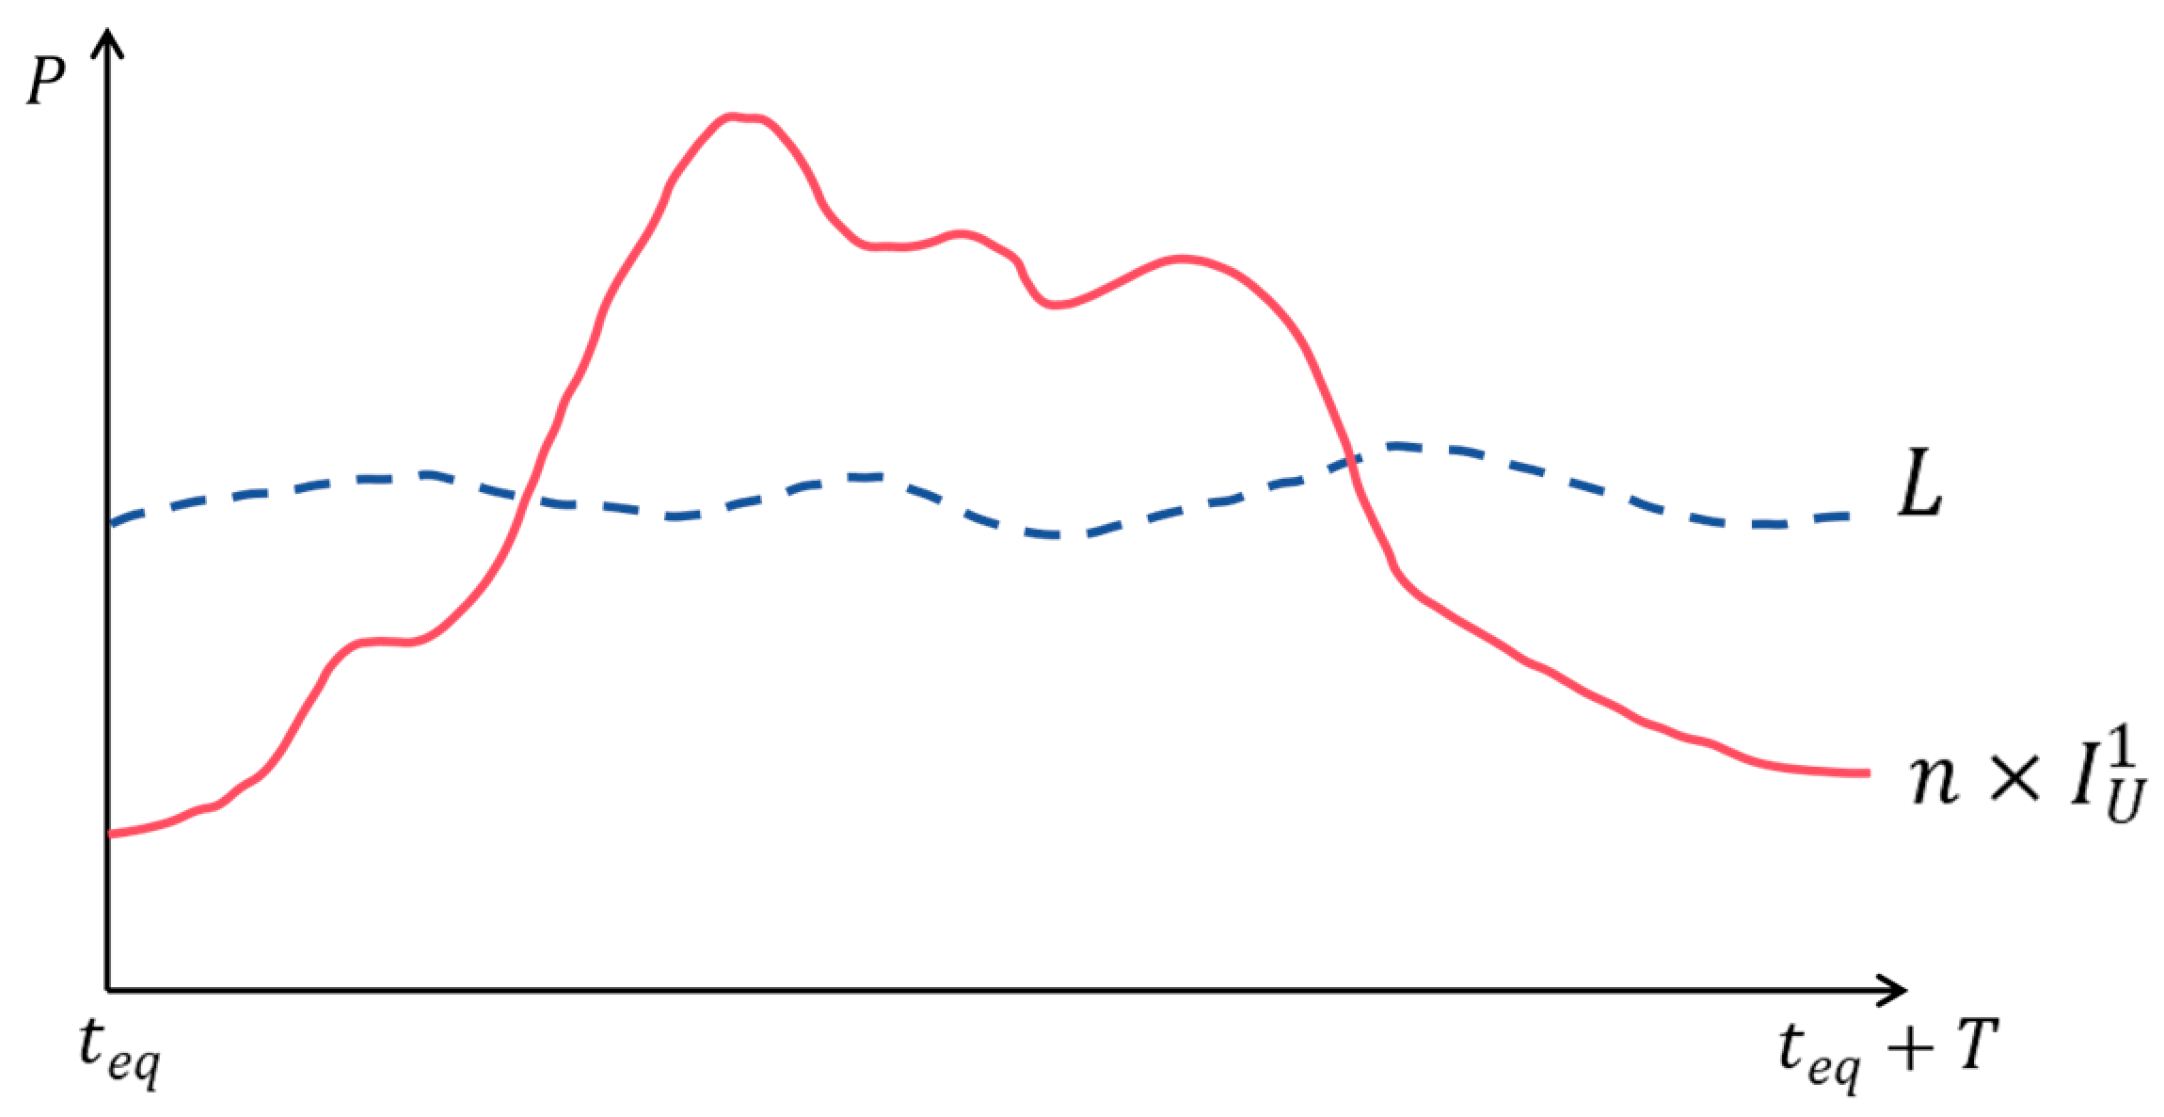
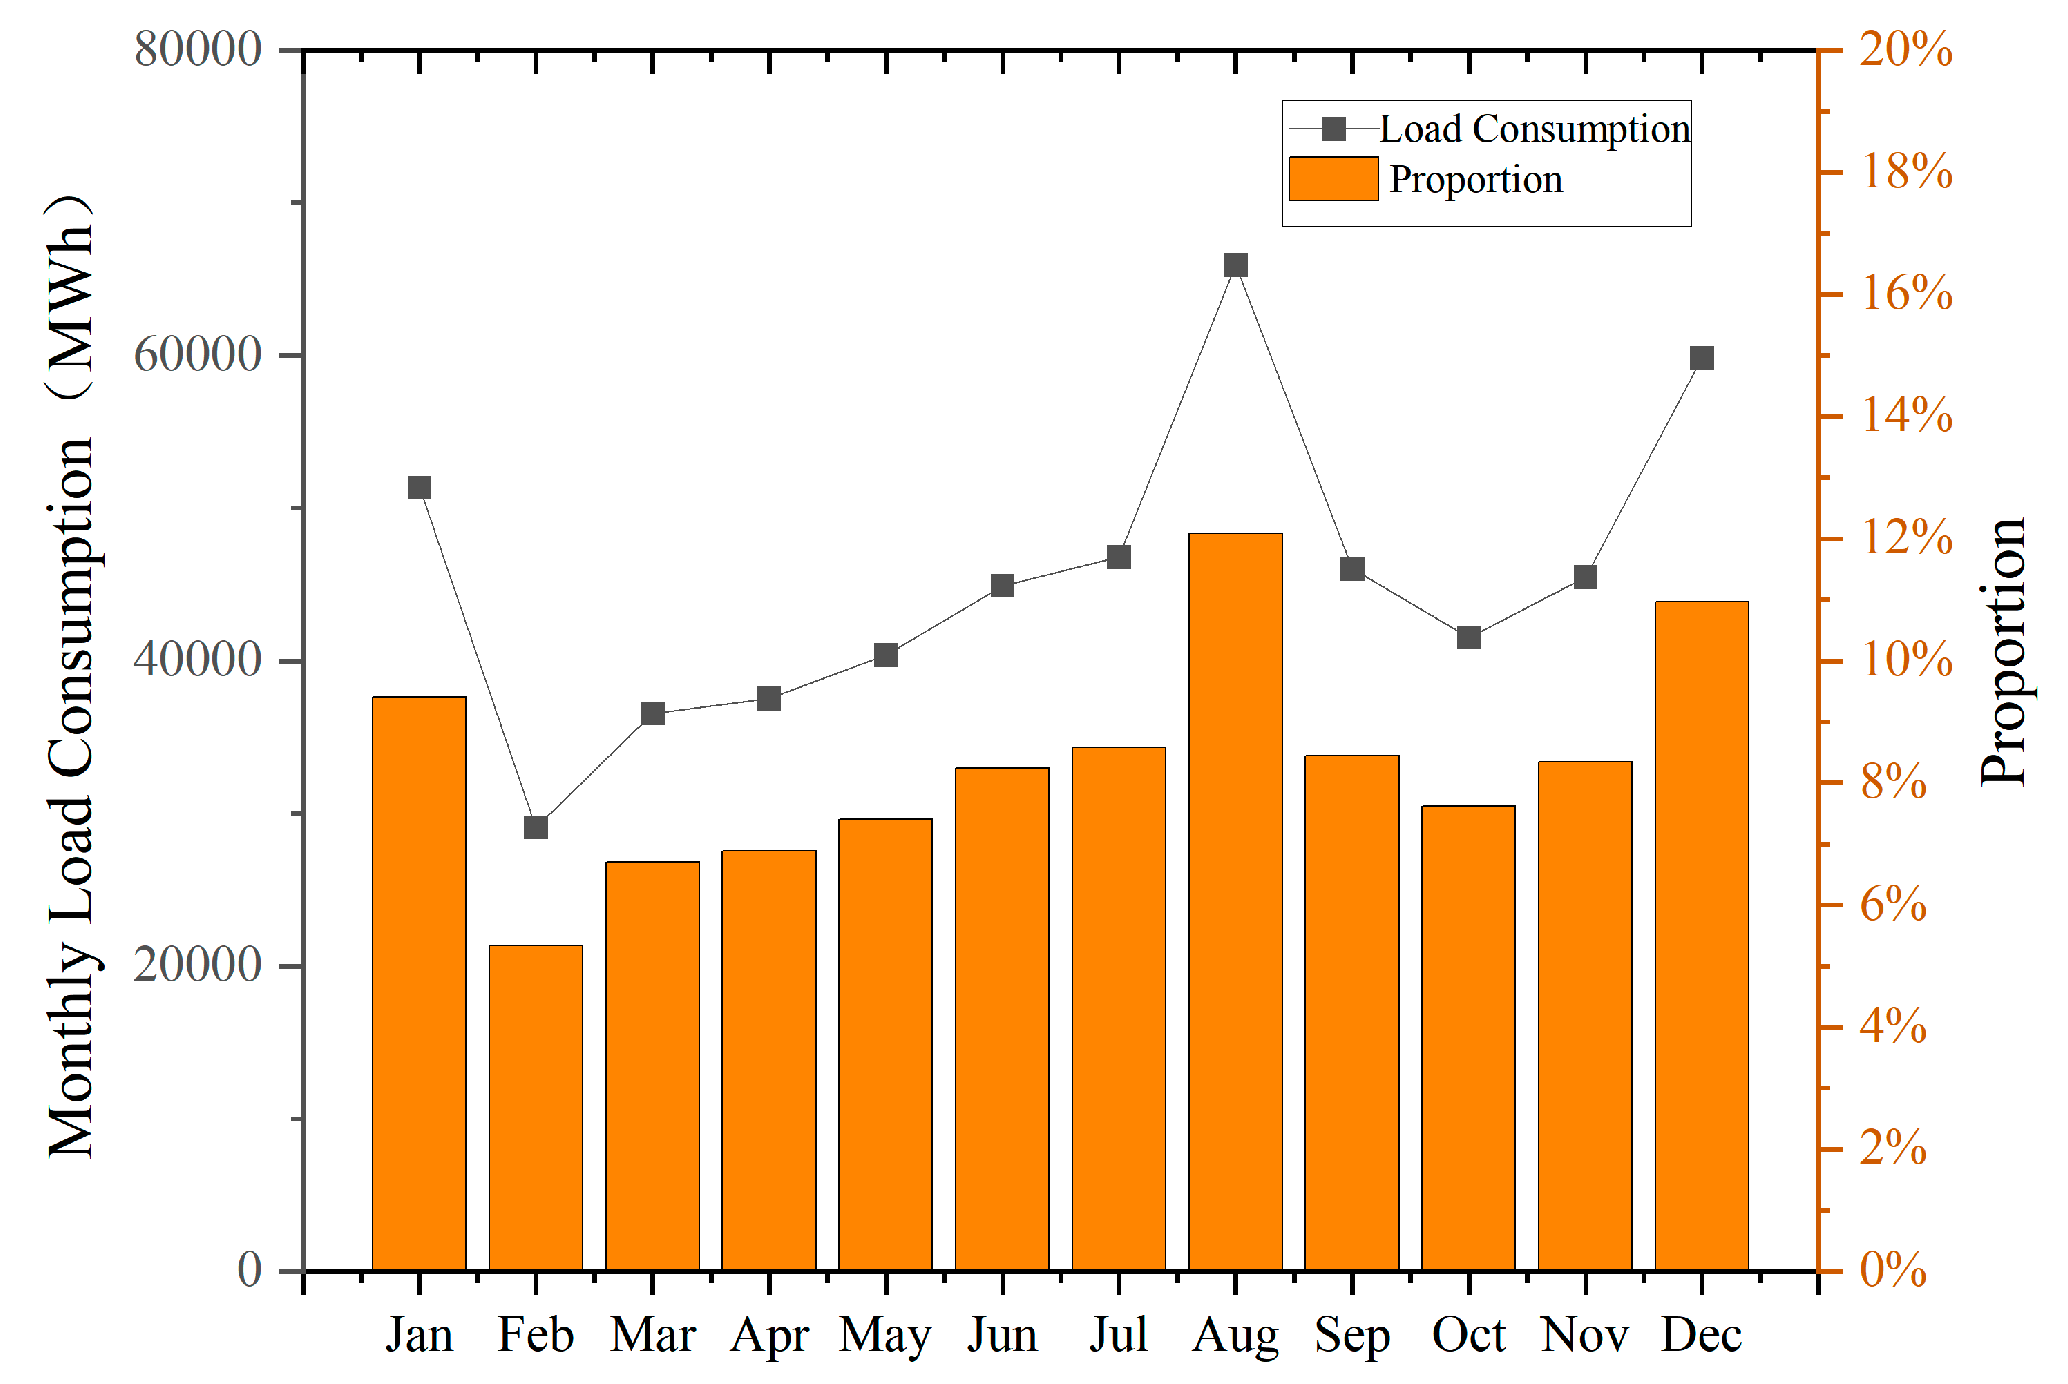
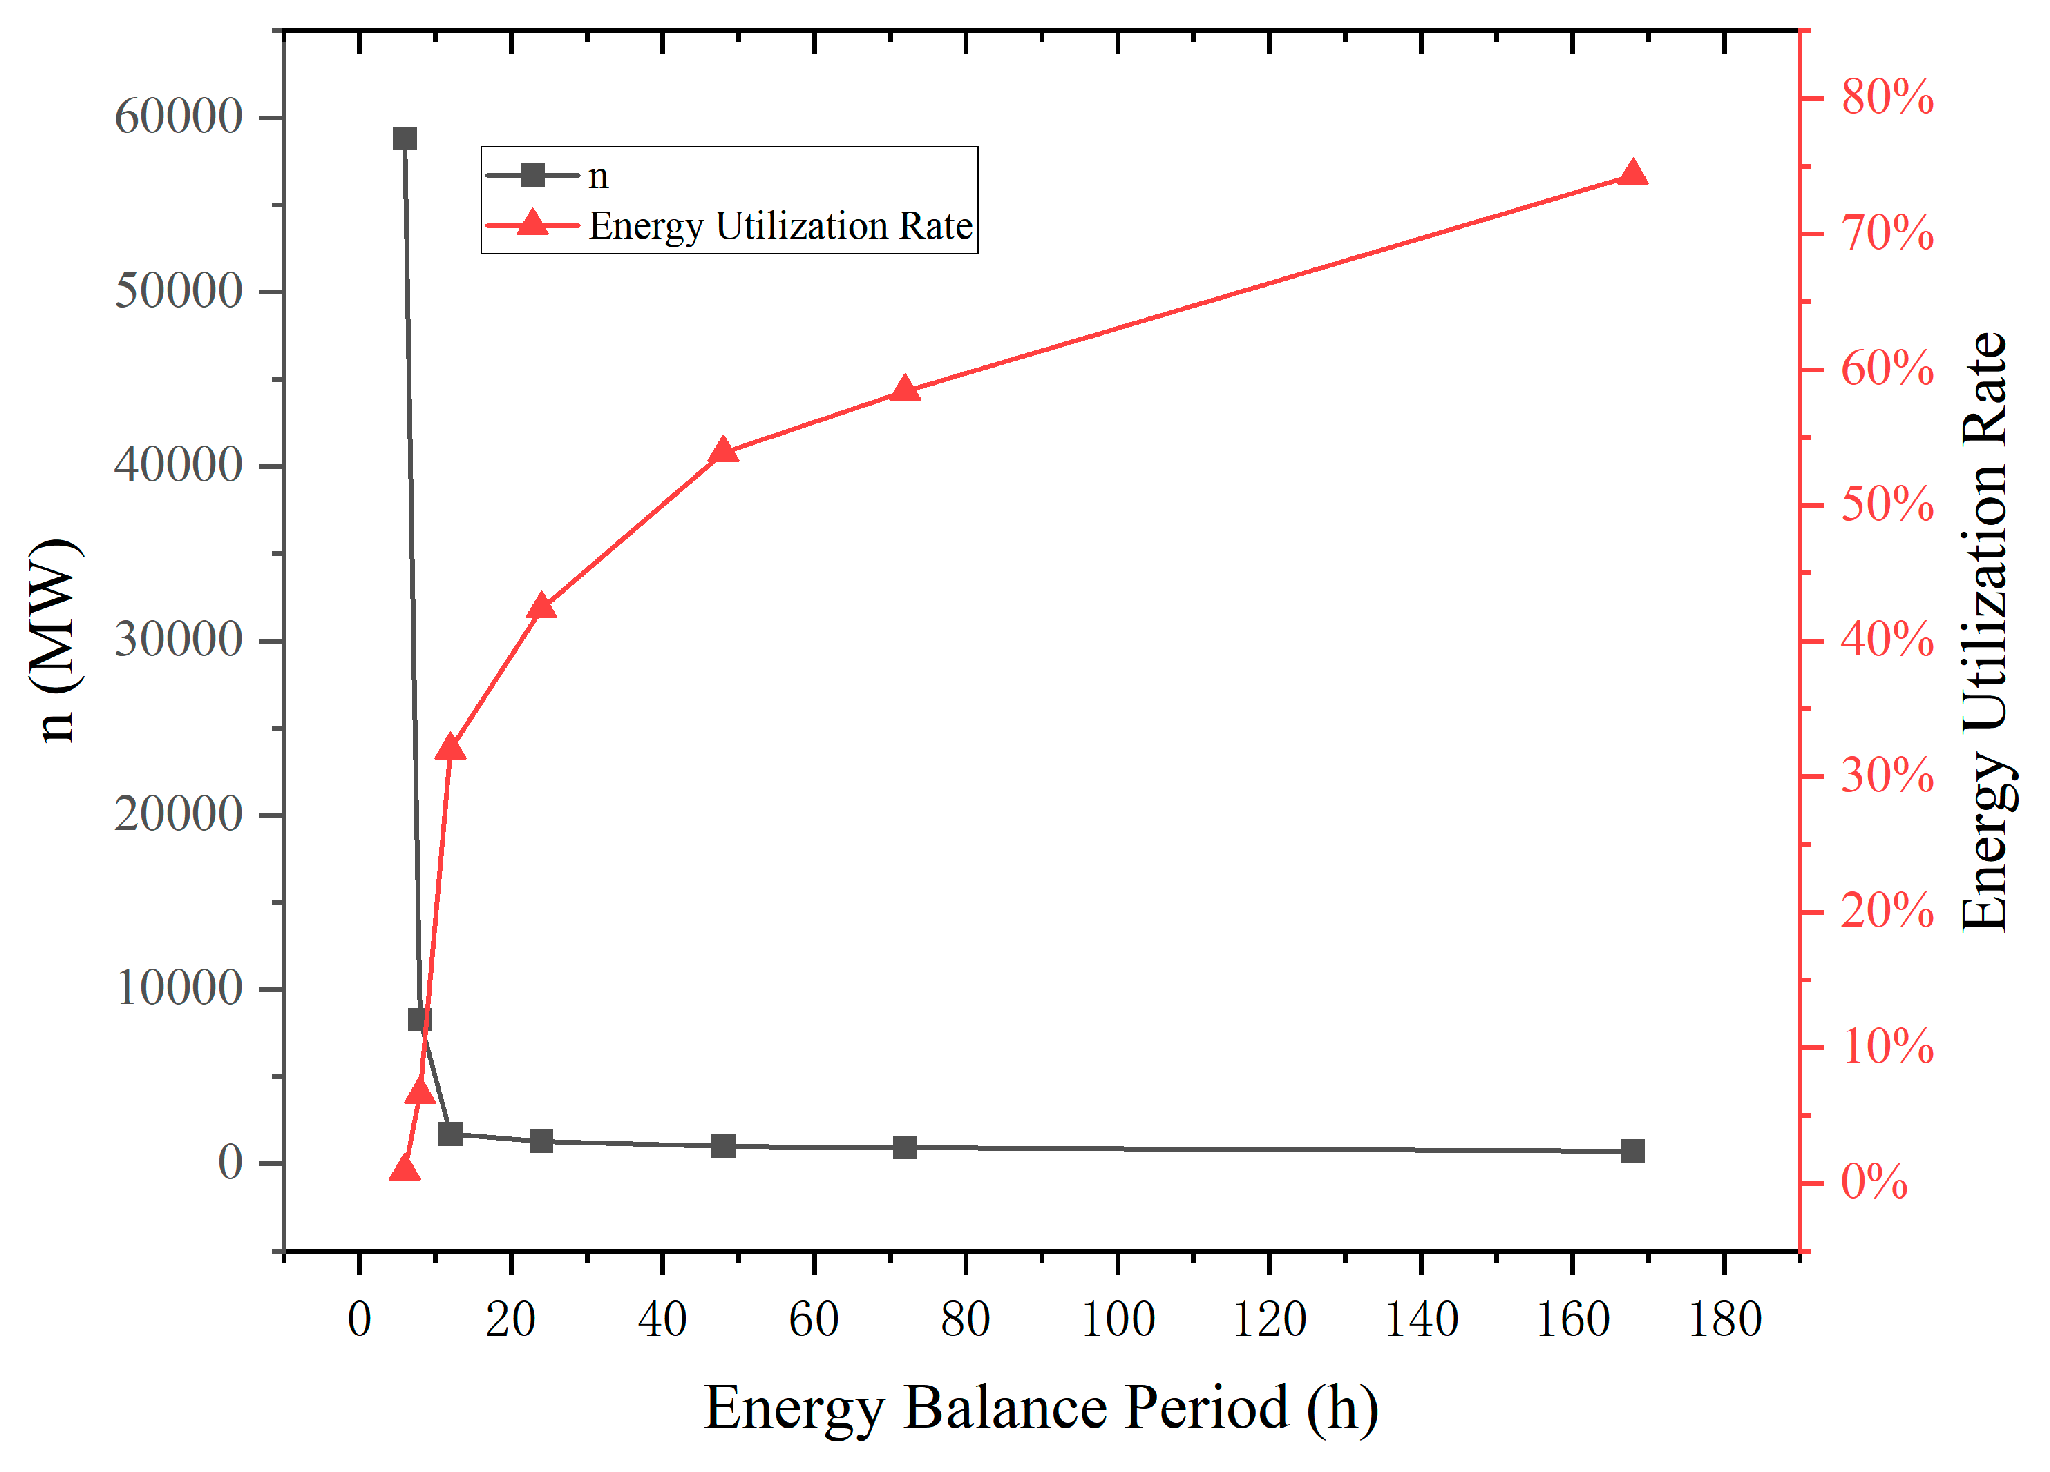
  • Through case analysis, it was found that while fully relying on green electricity can achieve zero-carbon energy use, the lack of controllable supportive energy requires an upstream green electricity resource configuration that is exceptionally large relative to the load. In the case study of this research, the capacity of upstream green electricity resources is nearly 17 times the average load of the IES during peak demand periods (July and August). From an energy utilization perspective, the load of the IES utilized 42.37% of the upstream green electricity resources’ generation, which is a reasonable value. This not only verifies the model’s rationality but also raises new requirements for subsequent research on the rational utilization of upstream green electricity resources.
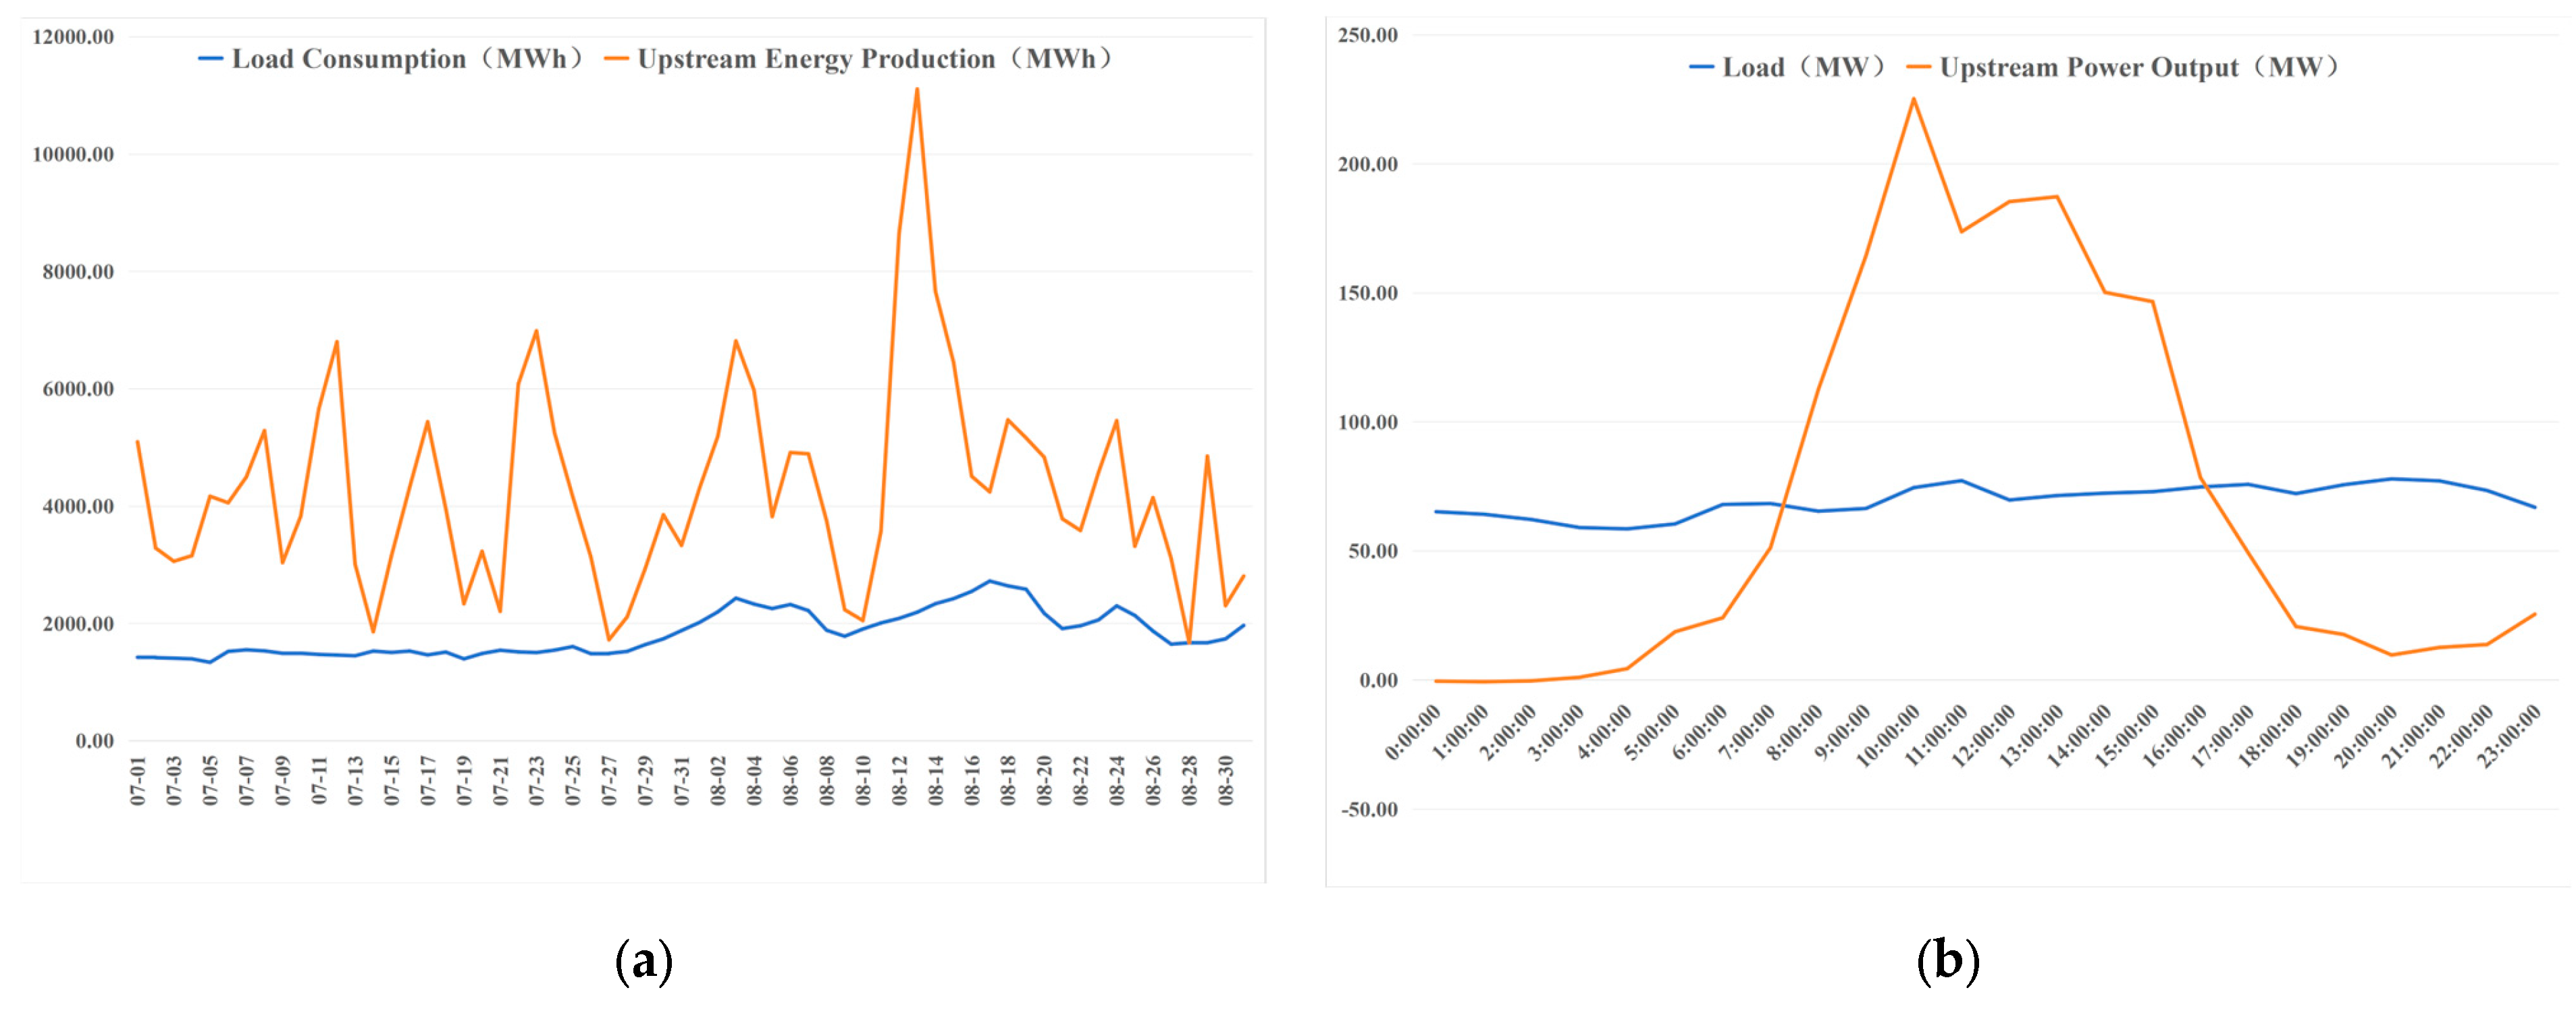
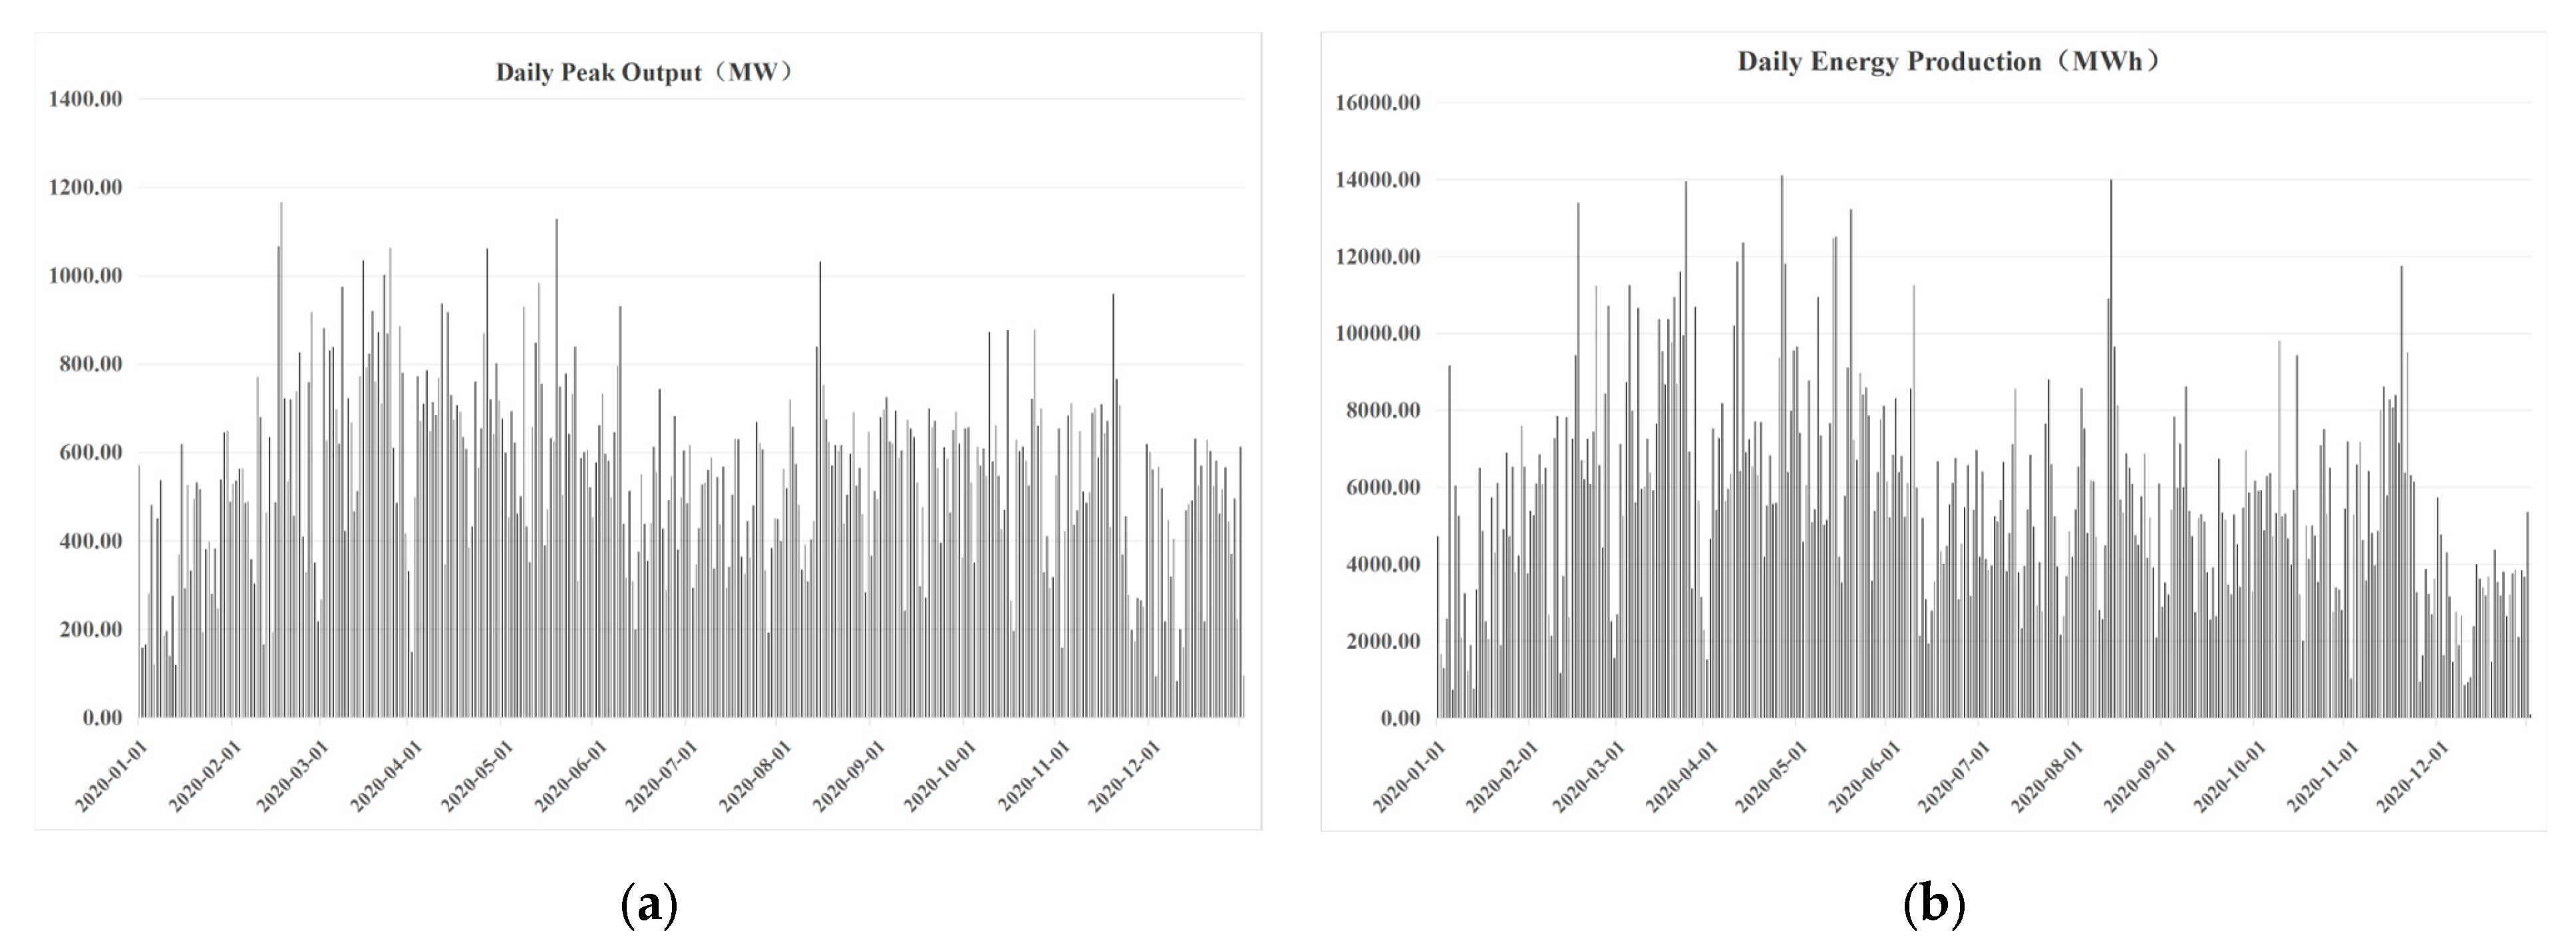
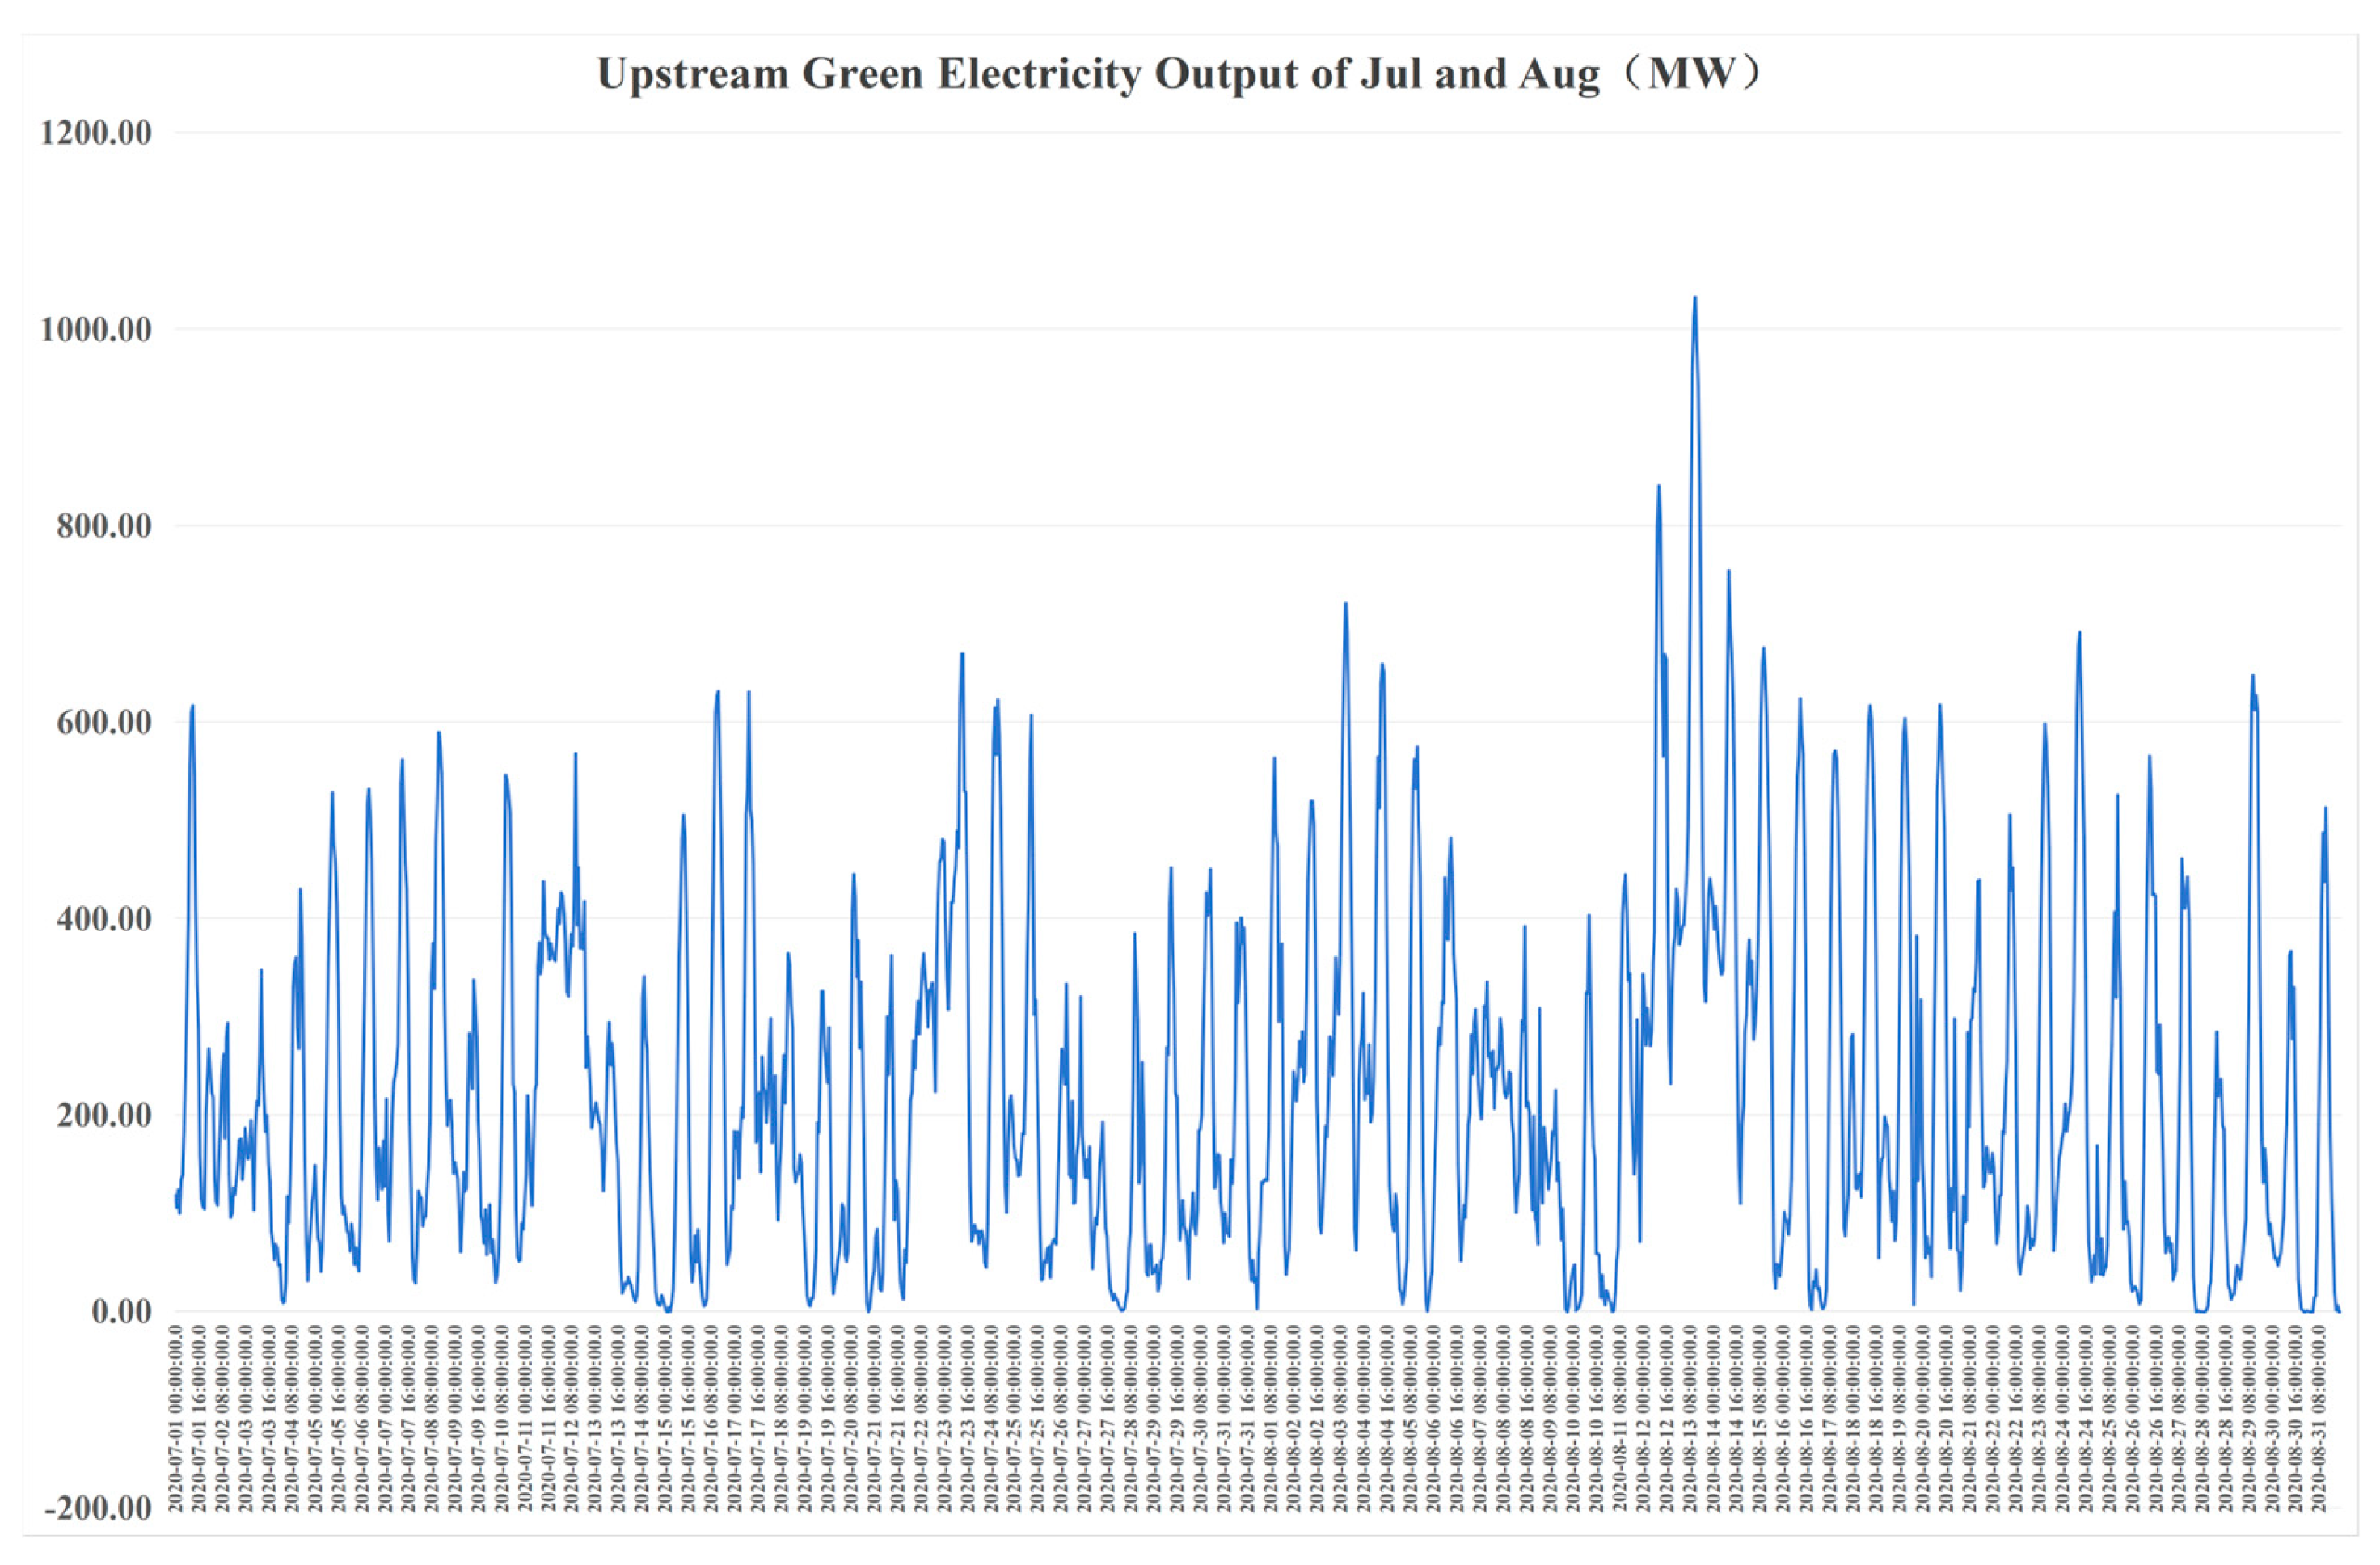
  • This study quantitatively describes the significant volatility of green electricity sources such as wind and solar power. The upstream green electricity base in this study is configured with 583.3 MW of wind power and 1037 MW of solar power, covering a total area of approximately 10,000 square kilometers. With a robust grid structure, it already has the conditions for regional green electricity interconnection and complementarity. Despite these favorable conditions, the overall output of the green electricity base remains highly unstable. Specifically, during the peak load months of July and August, the output was below 10% of the installed capacity for 45.97% of the time and below 2% for 10.61% of the time. Such significant fluctuations in output are highly detrimental to meeting load demands, necessitating further in-depth research and extensive engineering practice to find reasonable solutions.
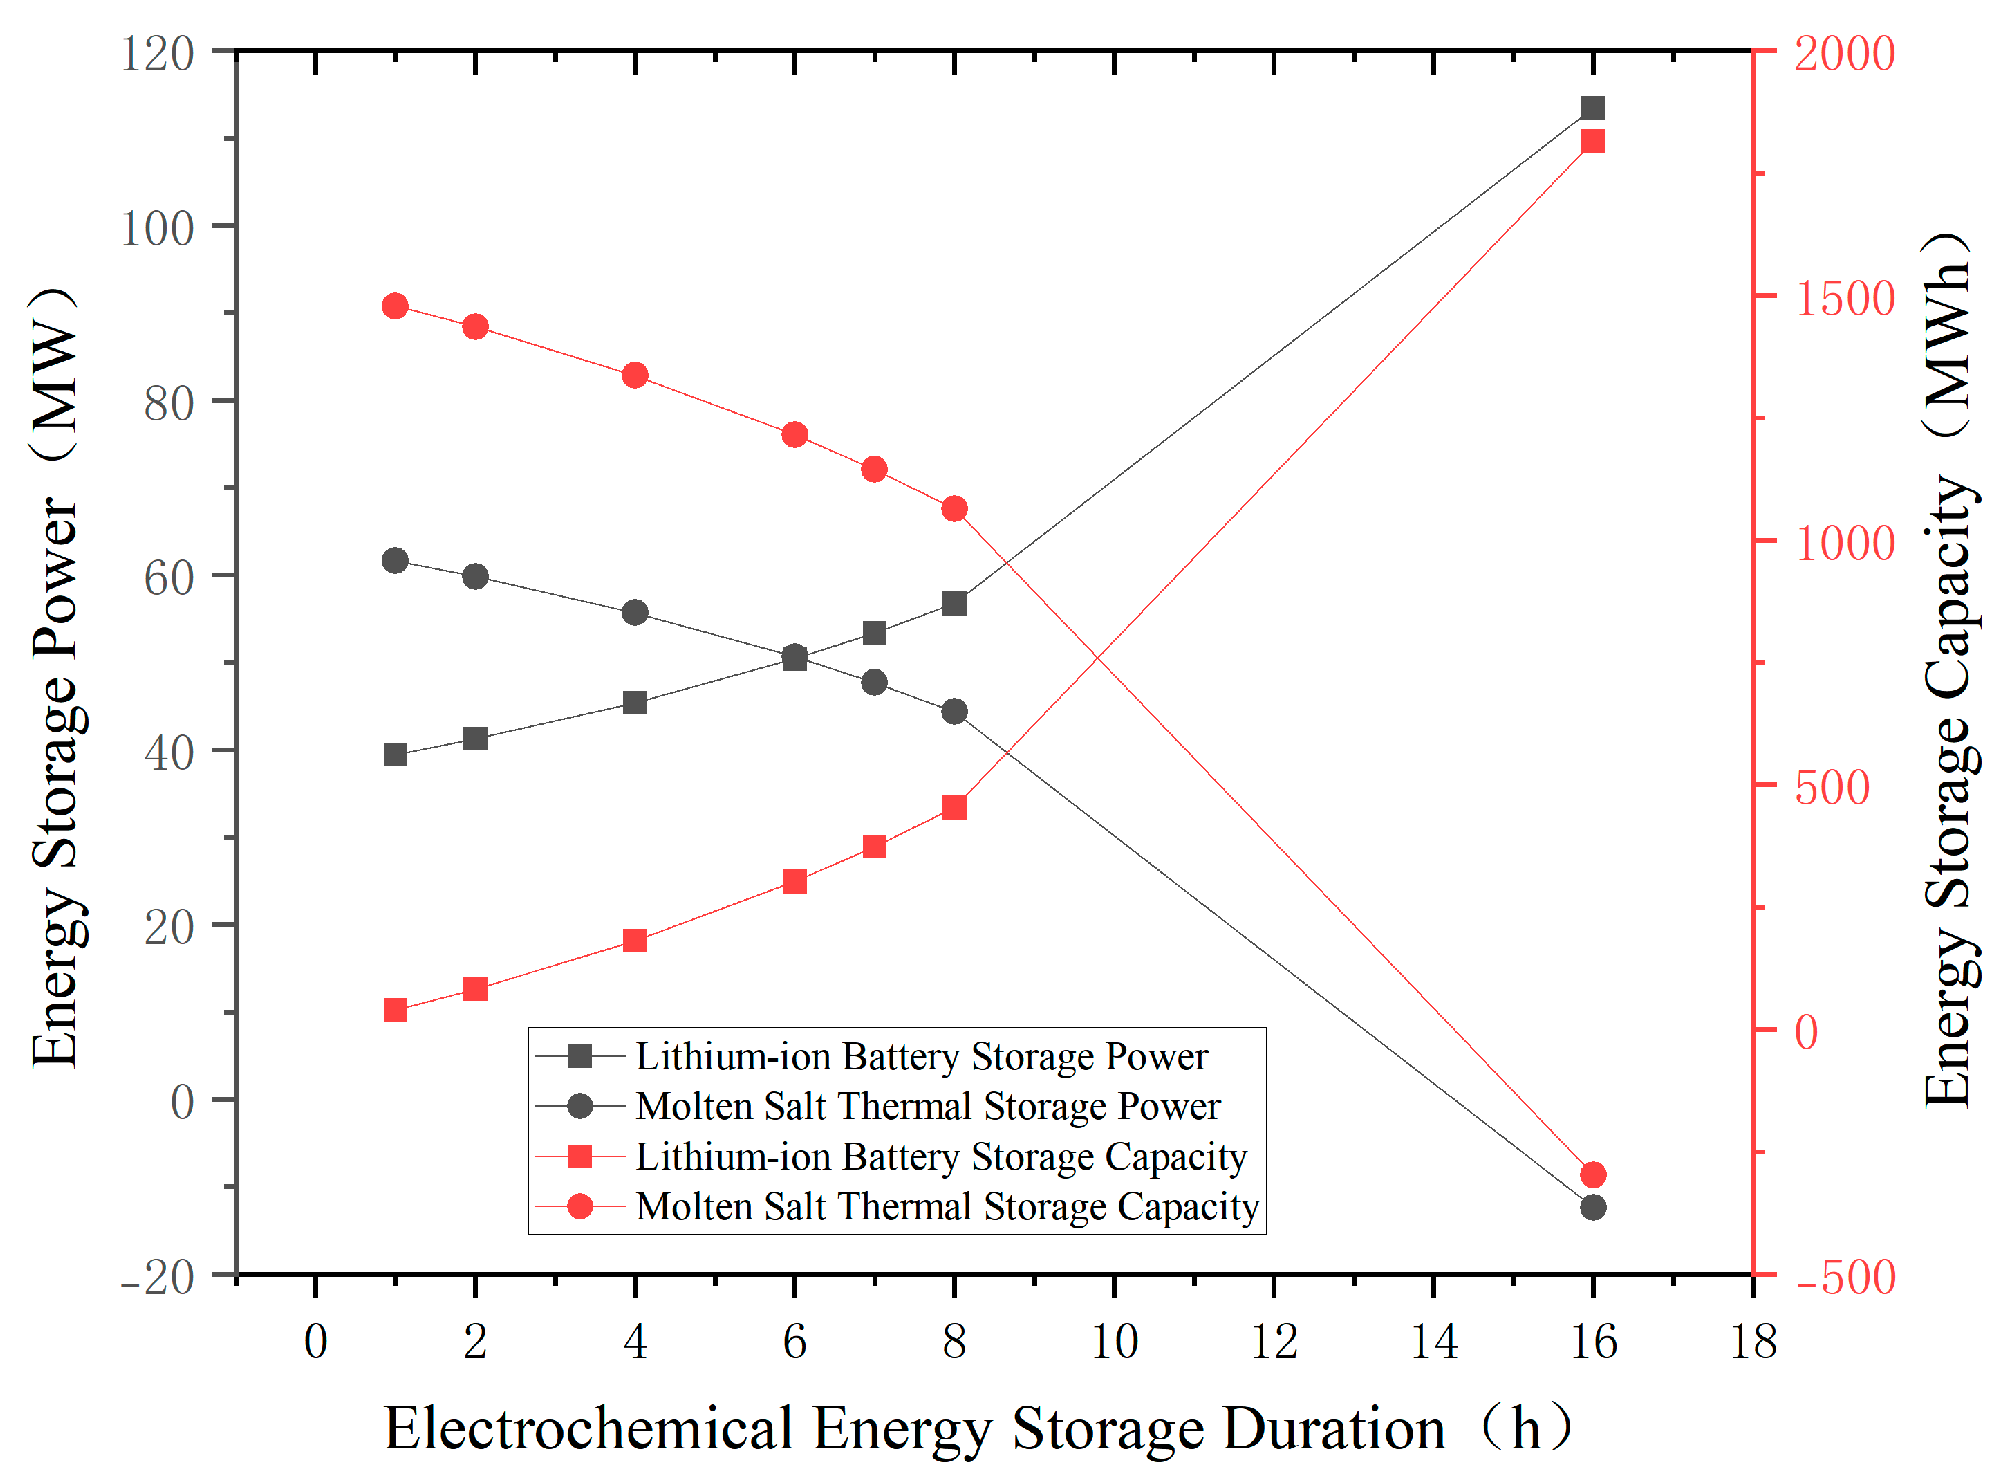
  • This study demonstrates that energy storage is the key technology for mitigating the uncertainties in upstream green electricity output. The rapid power regulation capabilities of lithium-ion battery storage, along with the flexible capacity and thermal synergy features of modular molten salt thermal storage, form a supportive electro-thermal energy storage system. This system enhances the overall controllability of upstream green electricity resources, effectively supporting load energy demands. Based on the proposed configuration model, the case study system requires the installation of 53.39 MW/444.93 MWh of lithium-ion battery storage and 47.68 MW/1300.43 MWh of modular molten salt thermal storage. The relatively large power and capacity configurations in relation to the load scale indicate the need for further optimization in future research.
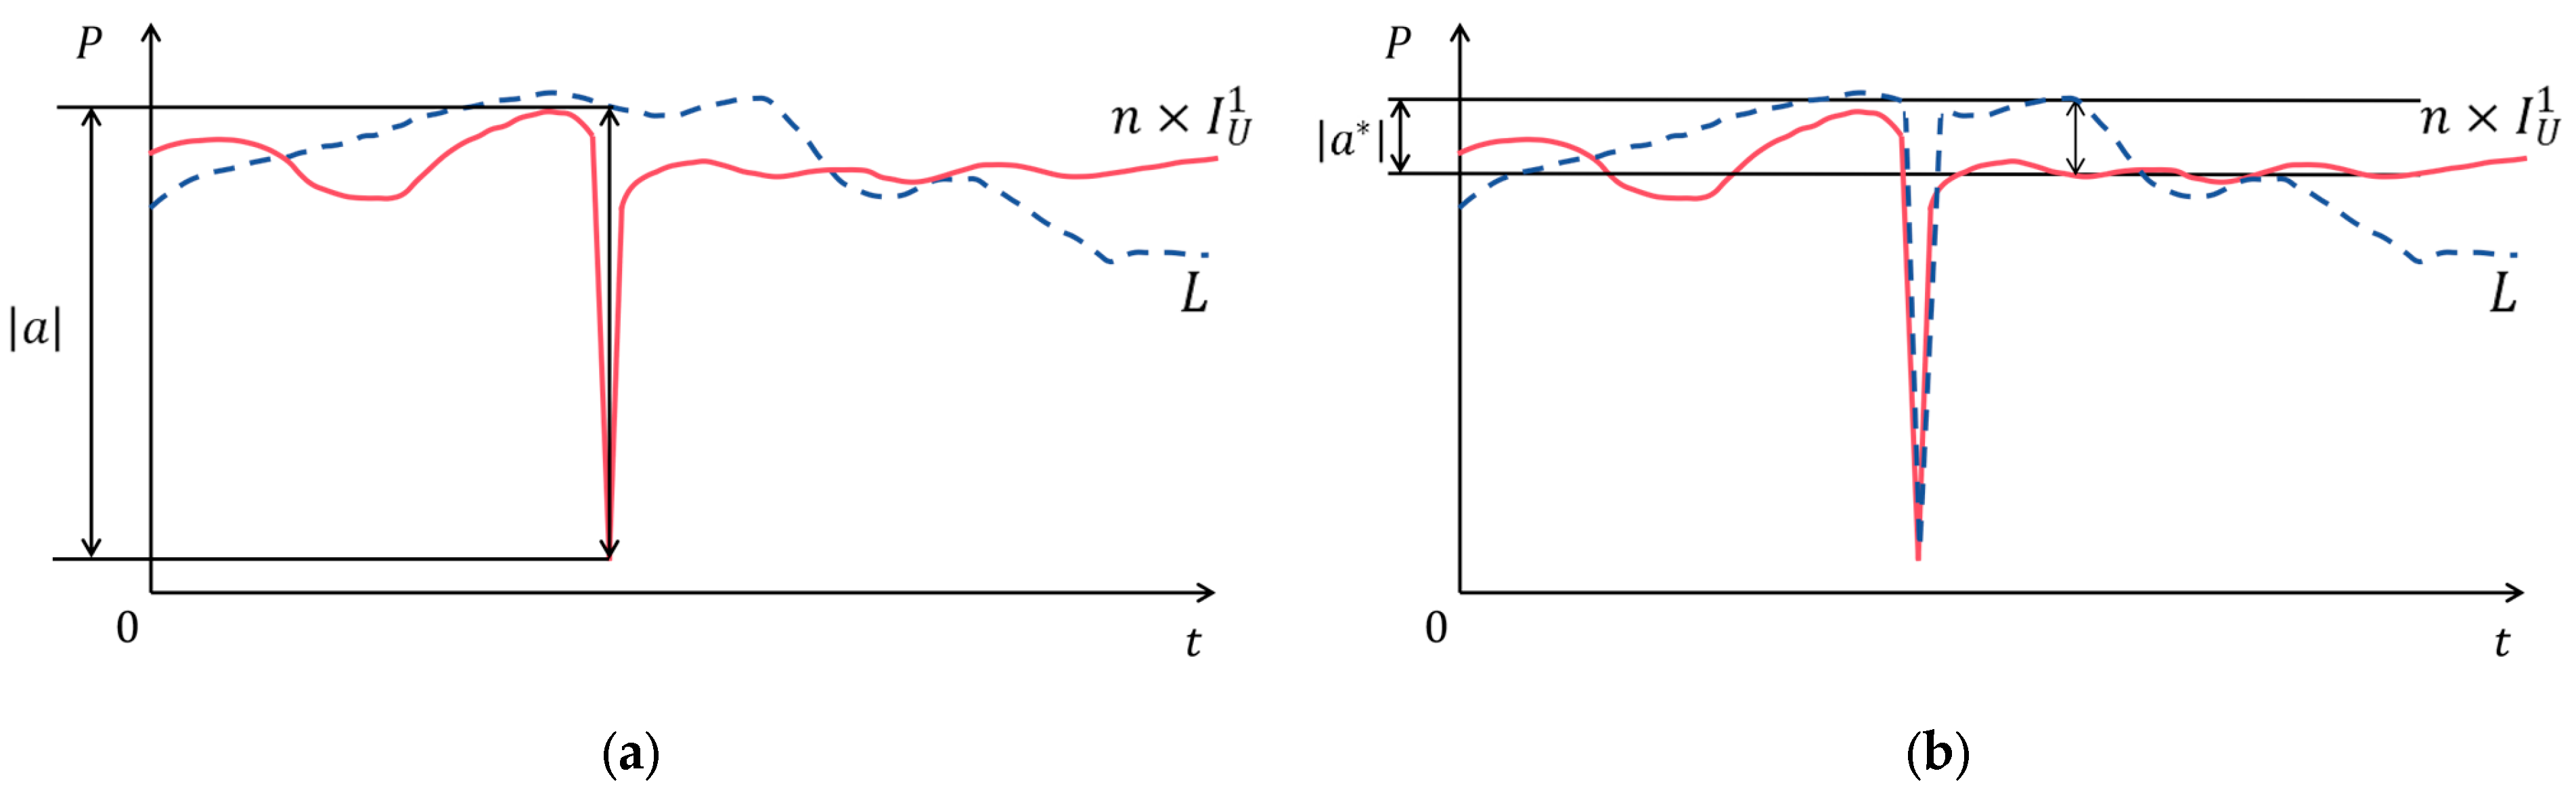
  • This study preliminarily explores the characteristics of virtual energy storage based on thermal load inertia. It finds that the energy imbalance caused by renewable energy fluctuations exhibits characteristics of short-term peak spikes with high power and short duration, similar to the virtual energy storage properties of thermal loads. Effectively utilizing virtual energy storage of thermal loads can mitigate peak spikes in power, thereby reducing the total power configuration of energy storage systems and lowering configuration costs. Using the averaging method in this study, the total power of energy storage facilities can be reduced by 10.42%. Future research will focus on further exploring thermal load virtual energy storage.

Author Contributions

Conceptualization, J.X. and X.C.; methodology, X.C. and J.X.; validation, H.H. and L.G.; formal analysis, J.X. and K.Y.; investigation, L.G. and B.W.; resources, J.X. and Y.Q.; data curation, J.X. and Y.Q.; writing—original draft preparation, J.X.; writing—review and editing, K.Y., L.G. and J.X.; visualization, J.X.; supervision, X.C.; project administration, K.Y. and H.H.; funding acquisition, K.Y. and H.H. All authors have read and agreed to the published version of the manuscript.

Funding

This research was funded by National Natural Science Foundation of China, No. U22B20112 and The Carbon Emission Peak and Carbon Neutrality Innovative Science Foundation of Jiangsu Province “The key research and demonstration projects of future low-carbon emission buildings”, No. BE2022606.

Data Availability Statement

The data presented in this study were collected from the experimental investigation by the first author.

Conflicts of Interest

Authors Jieyu Xie and Yuelong Qu were employed by the Jiangsu Engineering Consulting Center Co., Ltd. The remaining authors declare that the research was conducted in the absence of any commercial or financial relationships that could be construed as a potential conflict of interest.

References

  1. Wang, D.; Zhi, Y.Q.; Jia, H.J.; Hou, K.; Zhang, S.X.; Du, W.; Wang, X.D.; Fan, M.H. Optimal scheduling strategy of district integrated heat and power system with wind power and multiple energy stations considering thermal inertia of buildings under different heating regulation modes. Appl. Energy 2019, 240, 341–358. [Google Scholar] [CrossRef]
  2. Ma, T.; Wu, J.; Hao, L.; Lee, W.-J.; Yan, H.; Li, D. The optimal structure planning and energy management strategies of smart multi energy systems. Energy 2018, 160, 122–141. [Google Scholar] [CrossRef]
  3. Xie, S.; Hu, Z.; Wang, J.; Chen, Y. The optimal planning of smart multi-energy systems incorporating transportation, natural gas and active distribution networks. Appl. Energy 2020, 269, 115006. [Google Scholar] [CrossRef]
  4. Yuman, Z.; Xuezhi, L.; Zheng, Y.; Peichao, Z. Decomposition-coordination based optimization for PV-BESS-CHP integrated energy systems. Trans. China Electrotech. Soc. 2020, 35, 2372–2386. [Google Scholar]
  5. Chen, X. Green and low-carbon energy-use. Innov. Energy 2024, 1, 100003. [Google Scholar] [CrossRef]
  6. Wang, S.; Wang, X.; Wang, S.; Wang, D. Bi-directional long short-term memory method based on attention mechanism and rolling update for short-term load forecasting. Int. J. Electr. Power Energy Syst. 2019, 109, 470–479. [Google Scholar] [CrossRef]
  7. Li, L.; Yu, S.; Mu, H.; Li, H. Optimization and evaluation of CCHP systems considering incentive policies under different operation strategies. Energy 2018, 162, 825–840. [Google Scholar] [CrossRef]
  8. Zhang, X.; Shahidehpour, M.; Alabdulwahab, A.; Abusorrah, A. Optimal expansion planning of energy hub with multiple energy infrastructures. IEEE Trans. Smart Grid 2015, 6, 2302–2311. [Google Scholar] [CrossRef]
  9. Olsen, D.J.; Zhang, N.; Kang, C.; Ortega-Vazquez, M.A.; Kirschen, D.S. Planning low-carbon campus energy hubs. IEEE Trans. Power Syst. 2018, 34, 1895–1907. [Google Scholar] [CrossRef]
  10. Hanbin, D.; Peiqiang, L.; Xiaoxiu, L.; Xiaolong, L.; Xinran, L. Coordinated optimal allocation of energy storage in regional integrated energy system considering the diversity of multi-energy storage. Trans. China Electrotech. Soc. 2021, 36, 151–165. [Google Scholar]
  11. Yufeng, X.; Laijun, C.; Tianwen, Z.; Mei, S.; Shengwei, M. Optimal configuration of hydrogen energy storage in low-carbon park integrated energy system considering electricity-heat-gas coupling characteristics. Electr. Power Autom. Equip. 2021, 41, 31–38. [Google Scholar]
  12. Yu, X.; Xu, X.; Chen, S.; Wu, J.; Jia, H. A brief review to integrated energy system and energy internet. Diangong Jishu Xuebao Trans. China Electrotech. Soc. 2016, 31, 1–13. [Google Scholar]
  13. Lu, X.; Wang, J.; Liu, G.; Du, W.; Yang, D. Station-and-network–coordinated planning of integrated energy system considering integrated demand response. Glob. Energy Interconnect. 2021, 4, 39–47. [Google Scholar] [CrossRef]
  14. Liu, X. Energy station and distribution network collaborative planning of integrated energy system based on operation optimization and demand response. Int. J. Energy Res. 2020, 44, 4888–4909. [Google Scholar] [CrossRef]
  15. Cheng, Y.; Zhang, N.; Lu, Z.; Kang, C. Planning multiple energy systems toward low-carbon society: A decentralized approach. IEEE Trans. Smart Grid 2018, 10, 4859–4869. [Google Scholar] [CrossRef]
  16. Cheng, Y.; Zhang, N.; Kirschen, D.S.; Huang, W.; Kang, C. Planning multiple energy systems for low-carbon districts with high penetration of renewable energy: An empirical study in China. Appl. Energy 2020, 261, 114390. [Google Scholar] [CrossRef]
  17. Pursiheimo, E.; Holttinen, H.; Koljonen, T. Path toward 100% renewable energy future and feasibility of power-to-gas technology in Nordic countries. IET Renew. Power Gener. 2017, 11, 1695–1706. [Google Scholar] [CrossRef]
  18. Hu, J.; Wang, Y.; Dong, L. Low carbon-oriented planning of shared energy storage station for multiple integrated energy systems considering energy-carbon flow and carbon emission reduction. Energy 2024, 290, 130139. [Google Scholar] [CrossRef]
  19. Wang, J.; Jin, Y.; Zheng, J.; Xue, P.; Sun, C. Optimal quantity, location and capacity allocation of the additional renewable energy stations in a large-scale district heating system and comprehensive case analyses. Energy Convers. Manag. 2023, 284, 116975. [Google Scholar] [CrossRef]
  20. Zhong, J.; Bollen, M.; Rönnberg, S. Towards a 100% renewable energy electricity generation system in Sweden. Renew. Energy 2021, 171, 812–824. [Google Scholar] [CrossRef]
  21. Kroposki, B.; Johnson, B.; Zhang, Y.; Gevorgian, V.; Denholm, P.; Hodge, B.-M.; Hannegan, B. Achieving a 100% renewable grid: Operating electric power systems with extremely high levels of variable renewable energy. IEEE Power Energy Mag. 2017, 15, 61–73. [Google Scholar] [CrossRef]
  22. Child, M.; Kemfert, C.; Bogdanov, D.; Breyer, C. Flexible electricity generation, grid exchange and storage for the transition to a 100% renewable energy system in Europe. Renew. Energy 2019, 139, 80–101. [Google Scholar] [CrossRef]
  23. Ponnaganti, P.; Bak-Jensen, B.; Wæhrens, B.V.; Asmussen, J. Assessment of energy arbitrage using energy storage systems: A wind park’s perspective. Energies 2021, 14, 4718. [Google Scholar] [CrossRef]
  24. van der Roest, E.; Beernink, S.; Hartog, N.; van der Hoek, J.P.; Bloemendal, M. Towards sustainable heat supply with decentralized multi-energy systems by integration of subsurface seasonal heat storage. Energies 2021, 14, 7958. [Google Scholar] [CrossRef]
  25. Hameer, S.; van Niekerk, J.L. A review of large-scale electrical energy storage. Int. J. Energy Res. 2015, 39, 1179–1195. [Google Scholar] [CrossRef]
  26. Gür, T.M. Review of electrical energy storage technologies, materials and systems: Challenges and prospects for large-scale grid storage. Energy Environ. Sci. 2018, 11, 2696–2767. [Google Scholar] [CrossRef]
  27. Alva, G.; Lin, Y.; Fang, G. An overview of thermal energy storage systems. Energy 2018, 144, 341–378. [Google Scholar] [CrossRef]
  28. Sarbu, I.; Sebarchievici, C. A comprehensive review of thermal energy storage. Sustainability 2018, 10, 191. [Google Scholar] [CrossRef]
  29. Hoivik, N.; Greiner, C.; Barragan, J.; Iniesta, A.C.; Skeie, G.; Bergan, P.; Blanco-Rodriguez, P.; Calvet, N. Long-term performance results of concrete-based modular thermal energy storage system. J. Energy Storage 2019, 24, 100735. [Google Scholar] [CrossRef]
Figure 1. System topology diagram of a 100% green electricity supplied zero-carbon integrated energy station.
Energies 17 04111 g001
Figure 2. The configuration of the upstream green electricity resources.
Energies 17 04111 g002
Figure 3. The power curves of the period where the energy production equals load demand.
Energies 17 04111 g003
Figure 4. (a) Total power of the energy storage system without smoothing out spikes; (b) Total power of the energy storage system after smoothing out spikes with the help of virtual energy storage.
Energies 17 04111 g004
Figure 5. (a) Daily peak load; (b) Daily load consumption.
Energies 17 04111 g005
Figure 6. Monthly load consumption and proportion.
Energies 17 04111 g006
Figure 7. (a) Daily peak output; (b) Daily energy production.
Energies 17 04111 g007
Figure 8. Monthly energy production and proportion.
Energies 17 04111 g008
Figure 9. The mismatch between energy production and load consumption.
Energies 17 04111 g009
Figure 10. Upstream green electricity output of July and August.
Energies 17 04111 g010
Figure 11. The impact of energy balance period duration on upstream green electricity resources configuration.
Energies 17 04111 g011
Figure 13. The impact of lithium-ion battery storage duration on the electro-thermal storage synergy system.
Energies 17 04111 g013
Table 1. Comparison of core parameters between lithium-ion battery storage and modular molten salt thermal storage.
TechnologyLithium-Ion Battery StorageModular Molten Salt Thermal Storage
Unit Cost (yuan/Wh)1.30.53
Unit Volume Capacity (MWh/m3)0.0780.183
Unit Area Capacity (MWh/m2)0.0050.339
Charging Capacity0.5 c0.25 c
Discharging Capacity0.5 p0.25 p
Note: 1. The lithium-ion battery storage system is compared at a scale of 50 MW/100 MWh, while the modular molten salt thermal storage system is at 61 MW/244 MWh; 2. Unit volume capacity is based on modules for both, with lithium-ion battery storage using containers and molten salt thermal storage using thermal storage modules; 3. Unit area capacity is based on the total facility footprint.
Table 2. Average load of July and August.
Energy TypeActual Load (MW)ProportionConversion FactorConverted to Electrical Load (MW)Proportion
High-grade heat24.5510.48%0.927.28 36.00%
cooling192.7882.31%6.131.60 41.71%
Electricity16.89 7.21%116.89 22.29%
Total234.22 75.77
Table 3. The impact of energy balance period duration on upstream green electricity resources Configuration.
Energy Balance Period (h)n (MW)Energy Utilization Rate
00
658,8130.93%
882696.59%
12170531.96%
24128642.37%
48101153.89%
7293358.40%
16873374.33%
Table 4. The impact of lithium-ion battery storage duration on the electro-thermal storage synergy system.
Duration of Lithium-Ion Battery Storage (h)Lithium-Ion Battery Storage Power (MW)Lithium-Ion Battery Storage Capacity (MWh)Modular Molten Salt Thermal Storage Power (MW)Modular Molten Salt Thermal Storage Capacity (MWh)
139.4639.4661.611478.66
241.2682.5159.821435.61
445.38181.5355.691336.59
650.43302.5550.651215.57
753.39373.7447.681144.38
856.73453.8344.351064.3
16113.461815.32−12.38−297.19
Disclaimer/Publisher’s Note: The statements, opinions and data contained in all publications are solely those of the individual author(s) and contributor(s) and not of MDPI and/or the editor(s). MDPI and/or the editor(s) disclaim responsibility for any injury to people or property resulting from any ideas, methods, instructions or products referred to in the content.

