Article

Diagnostic and Performance Analysis of a Water Electrolyzer by Magnetic Field Measurements

1
Université de Franche-Comté, FEMTO-ST Institute, FCLAB, UTBM, CNRS, 90000 Belfort, France
2
Université de Franche-Comté, Institut Universitaire de France (IUF), FEMTO-ST Institute, FCLAB, UTBM, CNRS, 90000 Belfort, France
*
Authors to whom correspondence should be addressed.
Energies 2024, 17(16), 4135; https://doi.org/10.3390/en17164135
Submission received: 15 July 2024 / Revised: 12 August 2024 / Accepted: 14 August 2024 / Published: 20 August 2024
(This article belongs to the Section F: Electrical Engineering)

Abstract

:
The distribution of the magnetic field generated by an electromagnetic device can provide insights into their operational condition. This paper focuses on diagnosing electrolyzers through magneto-tomography, a method which involves mapping the magnetic field generated by electrical devices. Since current density and magnetic field are directly linked, this study can characterize the normal and abnormal operation of an electrolyzer. To achieve this, a two-dimensional (2-D) Biot–Savart model in polar coordinates is developed. To validate this model for electrolyzer diagnostics, an experimental setup was established to replicate the electrolyzer operation. The purely analytical model was successfully validated, with the average difference between the analytical results and experimental measurements established. The model validation is performed by comparing the experimental data to the theoretical results, and it is observed that the difference does not exceed 5%.

1. Introduction

Hydrogen energy offers interesting prospects as it is perceived as potential energy carrier for applications in heavy transportation and for industries and processes that are hard to electrify [1,2]. From a sustainability and environmental perspective, polymer exchange membrane (PEM) water electrolysis has been regarded as one of the most promising methods for highly efficient hydrogen production from renewable energy sources. It generates only oxygen as a by-product and does not emit any carbon emissions [3].
The precise estimation of the technical characteristic of an energetic system such as an electrolyzer is a key point prior to its utilization, integration and commercialization. An accurate model is necessary for this purpose. Several state-of-the-art reviews have already been published in the literature, listing the various existing methods for modeling the electrolyzer’s operation. These include reviews providing a general overview [4], employing a bond graph approach [5], focusing on control and control-oriented approaches [6], and emphasizing characterization [7,8].
The estimation of performance also plays a key role in its development. Performance can be modeled [9], or the electrochemical efficiency can be calculated [10], and validated through experimental measurements [11]. The modeling, degradation studies, failure diagnosis and the faulty operating management of electrolyzers are listed in [12].
Several factors, such as temperature [13,14], reactant humidity, non-uniform gas production, and the configuration of the flow field, combined with the characteristics of the membrane electrode assembly (MEA), could potentially lead to a non-uniform current density distribution [14]. The performance of an electrolyzer is affected when the current distribution is non-uniform. The current density is a parameter particularly studied in the literature [13,14,15].
Often, in order to make a diagnosis of an electrolyzer, in situ measurements are used [16]. However, these approaches suffer from drawbacks such as invasiveness, the lack of flexibility, and an unclear understanding of their impact on the measured current density distribution. An estimation of the degradations is necessary to study the durability of an electrolyzer [17,18].
The proposed method is straightforward, adaptable, and non-invasive. Magneto-tomography, which involves measuring the magnetic field distribution around an electromagnetic device, offers an effective way to assess the health of an electrolyzer. Hauer et al. (2005) [19] were the pioneers in applying this technique to fuel cell (FC) analysis. Over the past twenty years, extensive research has been dedicated to evaluating the condition of FCs through magnetic field measurements. Notably, Plait and Dubas (2022) provided a comprehensive review of FC diagnostics using magneto-tomography [20]. The Biot–Savart law is used in estimating the health of FCs with this method [19,21,22,23,24,25], and the varying-network magnetic circuit [24], the heuristic search method [26,27], or the multi-layer method [20,28] are also employed.
Concerning the last method, the authors presented an innovant purely analytical model, which has also been experimentally validated [28]. Recently, Plait et al. (2020) [29] established a magnetic field analyzer device to enhance diagnostic performance, followed by the development of a more adaptable and efficient version [30].
Contrary to FCs, which have a rectangular shape, electrolyzers often have a circular shape, as described in Figure 1 [11]. Consequently, the geometry, model equations, and coordinates differ from those of FCs.
In this paper, a magnetostatic model in polar coordinates, based on the Biot–Savart law, is developed for electrolyzer analysis and validated through experimental measurements. The inverse model enables the estimation of current density distribution inside the electrolyzer by knowing the magnetic field distribution. Section 2 presents the model, providing mathematical details of Biot–Savart law for the considered geometry. The analytical model is based on the formal solution of magnetostatic equations in polar coordinates. Here, the magneto-tomographic study is performed on an electrolyzer to diagnose its health state. The analytical model is validated through experimental measurements conducted on an electrolyzer emulator; it is presented in Section 3. The emulator, consisting of aluminum segments and various switches, simulates the behavior of an electrolyzer with different types and locations of failures, reflecting the corresponding current density distribution. A micro-Hall effect sensor, positioned at regular intervals around the device, measures the magnetic field generated by the electrolyzer. In the final section, the results from the analytical model are compared with the experimental data, and the current density map is reconstructed. The close agreement between the model’s predictions and experimental results confirms the model’s accuracy in diagnosing and locating potential defects. Additionally, the model’s capabilities and promising outcomes open the door to numerous future possibilities.

2. 2-D Biot–Savart Model

2.1. Water Electrolyzer to Hydrogen Production

The active plate of an electrolyzer stack, composed of titanium and MEA as shown in Figure 1, comprises a central area (i.e., the electrochemically active region) and an outer inactive section (i.e., the seal). The central active region can be divided into N s e g segments.
In polar coordinates, the connection between the current density J = 0 ; 0 ;   J z and magnetic field H = H r ; H θ ; 0 is described by Ampere’s circuital law:
C H · d l = S J · d S
By considering a single infinitely thin and infinitely long wire, (1) this leads to the conclusion that the magnetic field, H, is dependent on the distance from the wire’s center, r, and current I in the wire, as expressed by
H · 2 π r = J z · S = I
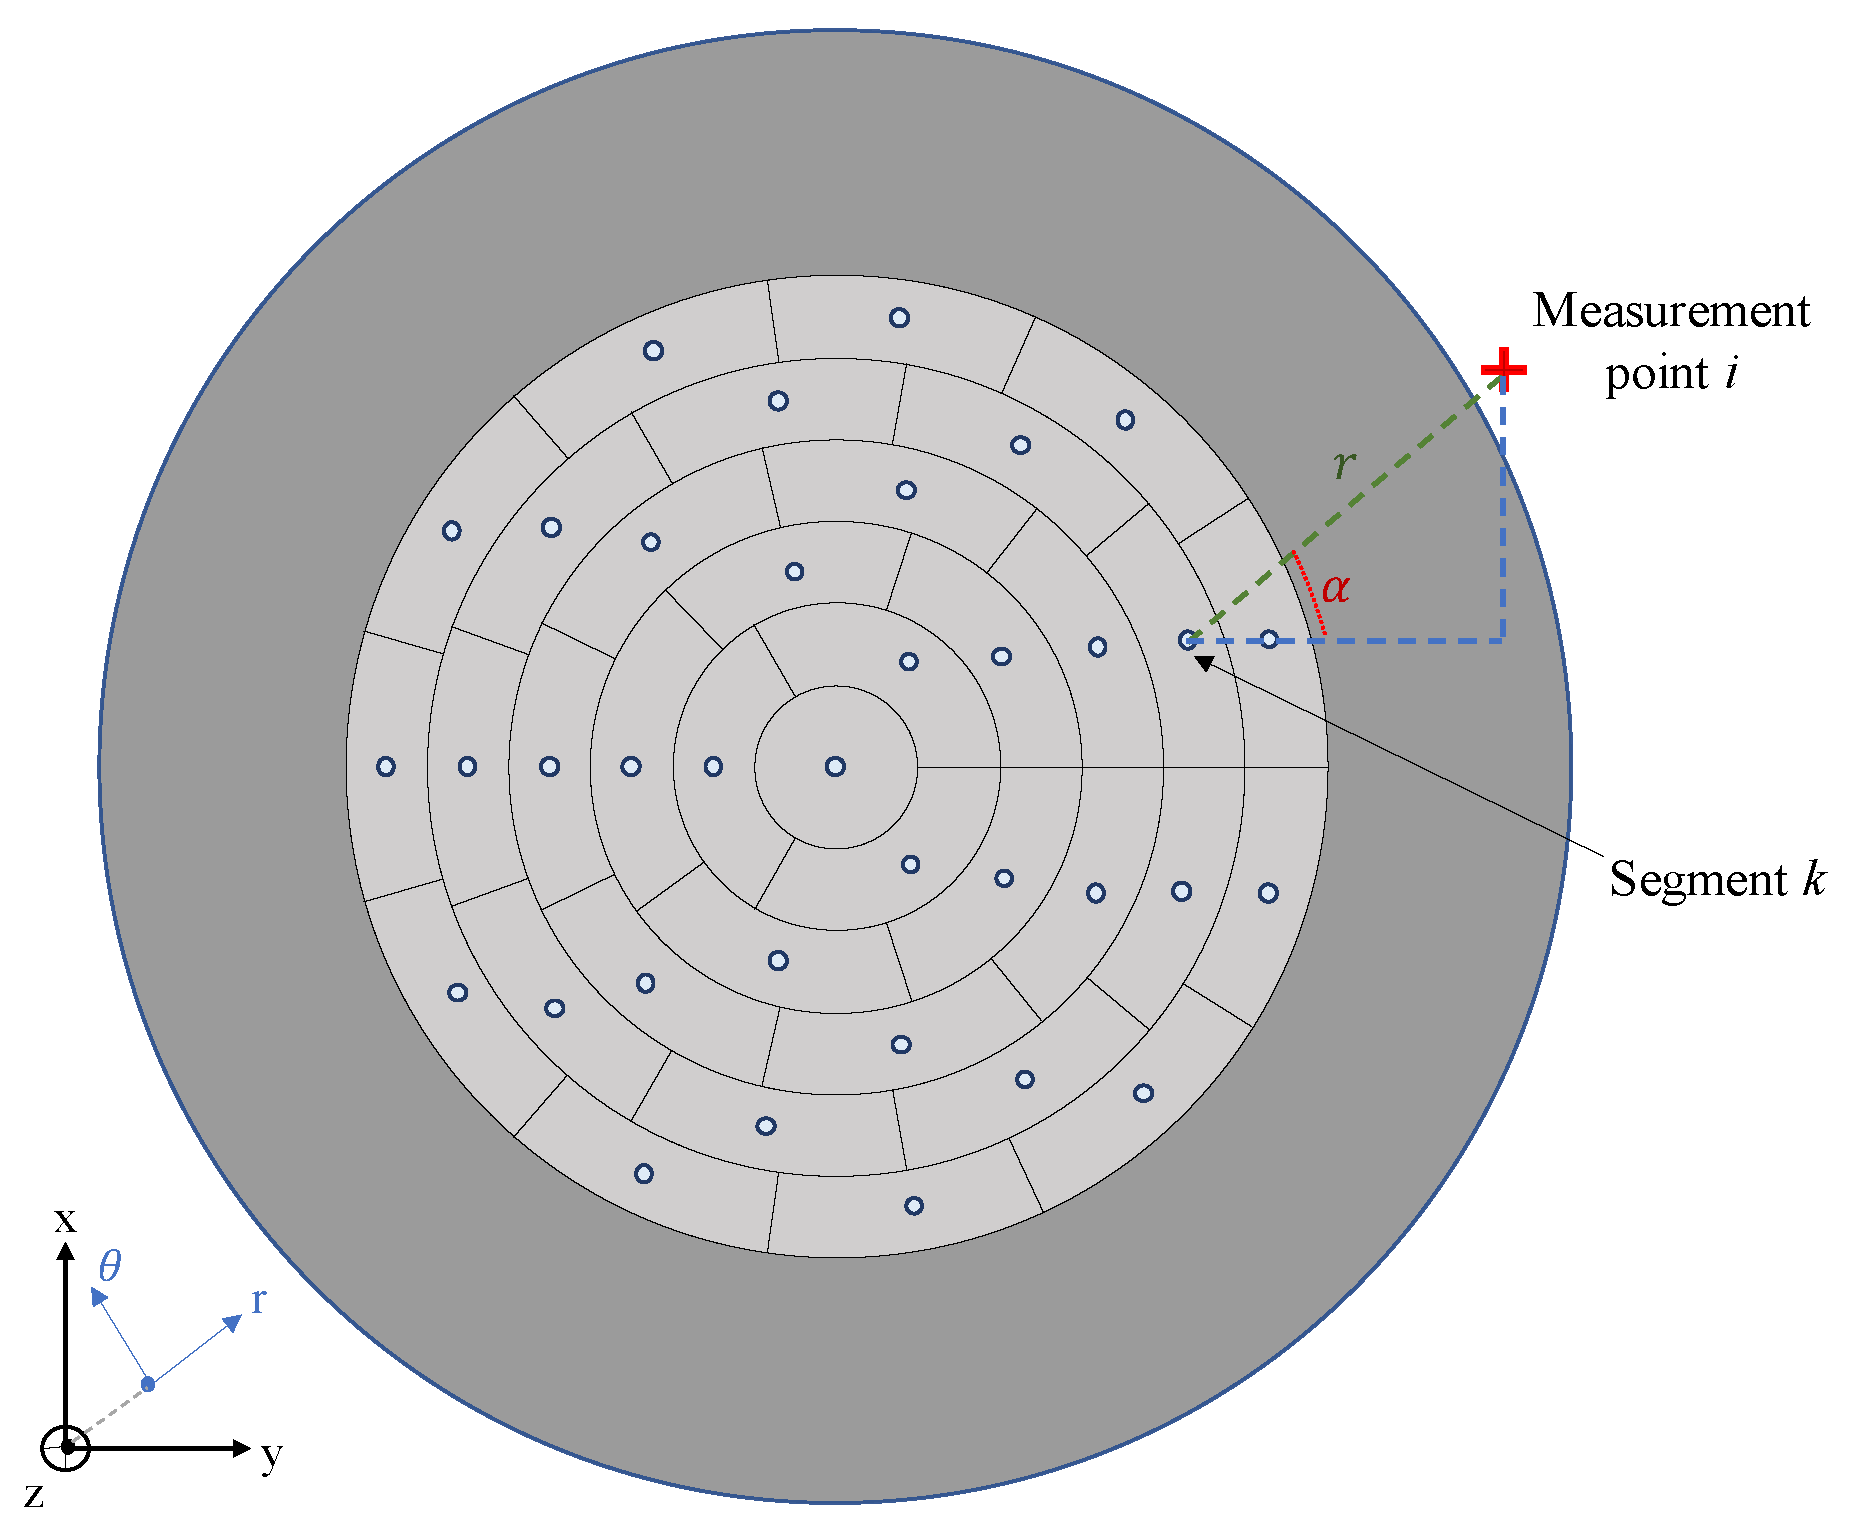
In the case of distributed volume currents, such as those encountered in electrolyzers, the magnetic field outside the cell can be determined by superposing the magnetic fields generated by discrete currents. Figure 2 illustrates the division of a cell surface into a total of 36 segments of same surface, each segment having an unspecified current flowing through its geometric center. The choice of these 36 elements is based on the shape of the total and central elements. The central element must not be too small, so a compromise was made with a unit radius of 1 cm, resulting in an active surface area of approximately 3.14 cm2 (equal to all segments). The cumulative sum of these 36 currents corresponds to the total imposed current. Our objective in this context is to deduce the 36 unknown currents solely from the magnetic flux data measured outside the stack.
It is necessary to measure the magnetic field at regular intervals, specifically to measure both the radial component, H r , and the tangential component, H θ . The calculation of magnetic field components at measurement points i relies on the function of unknown currents Ik with k N * ,   N s e g . Hence, the various components are given by
H r , i k = I k 2 π r · s i n α β
H θ , i k = I k 2 π r · c o s α β
H r , i = k N s e g H r , i k
H θ , i = k N s e g H θ , i k
The relation between magnetic field and the undisclosed currents is expressed by (2), albeit with H and I treated as data vectors, and the array of coefficients that connects these two variables is presented as a matrix.
To summarize this problem, given the current density distribution within the electrolyzer, the magnetic field distribution around it can be accurately estimated. Conversely, by solving the inverse problem through matrix inversion, the current density distribution can be determined from the magnetic field measurements.
However, the nature of the problem results in an ill-conditioned matrix. A simple matrix inversion would lead to significant errors for the unknown currents, I, if the measurement data of H r and H θ are not mathematically precise, which is always the case with experimental measurements. Initially, the straightforward matrix inversion would yield entirely inconsistent current results as soon as there are uncertainties in the H r and H θ measurements.
Consequently, matrix regularization becomes necessary [19]. Tikhonov’s regularization could be applied to extract information about the currents from the equation system [31]. Through regularization, achieving an exact determination of the current distribution is not feasible, but it provides a coherent approximation and valuable results.

2.2. Considered Electrolyzer Stack Geometry

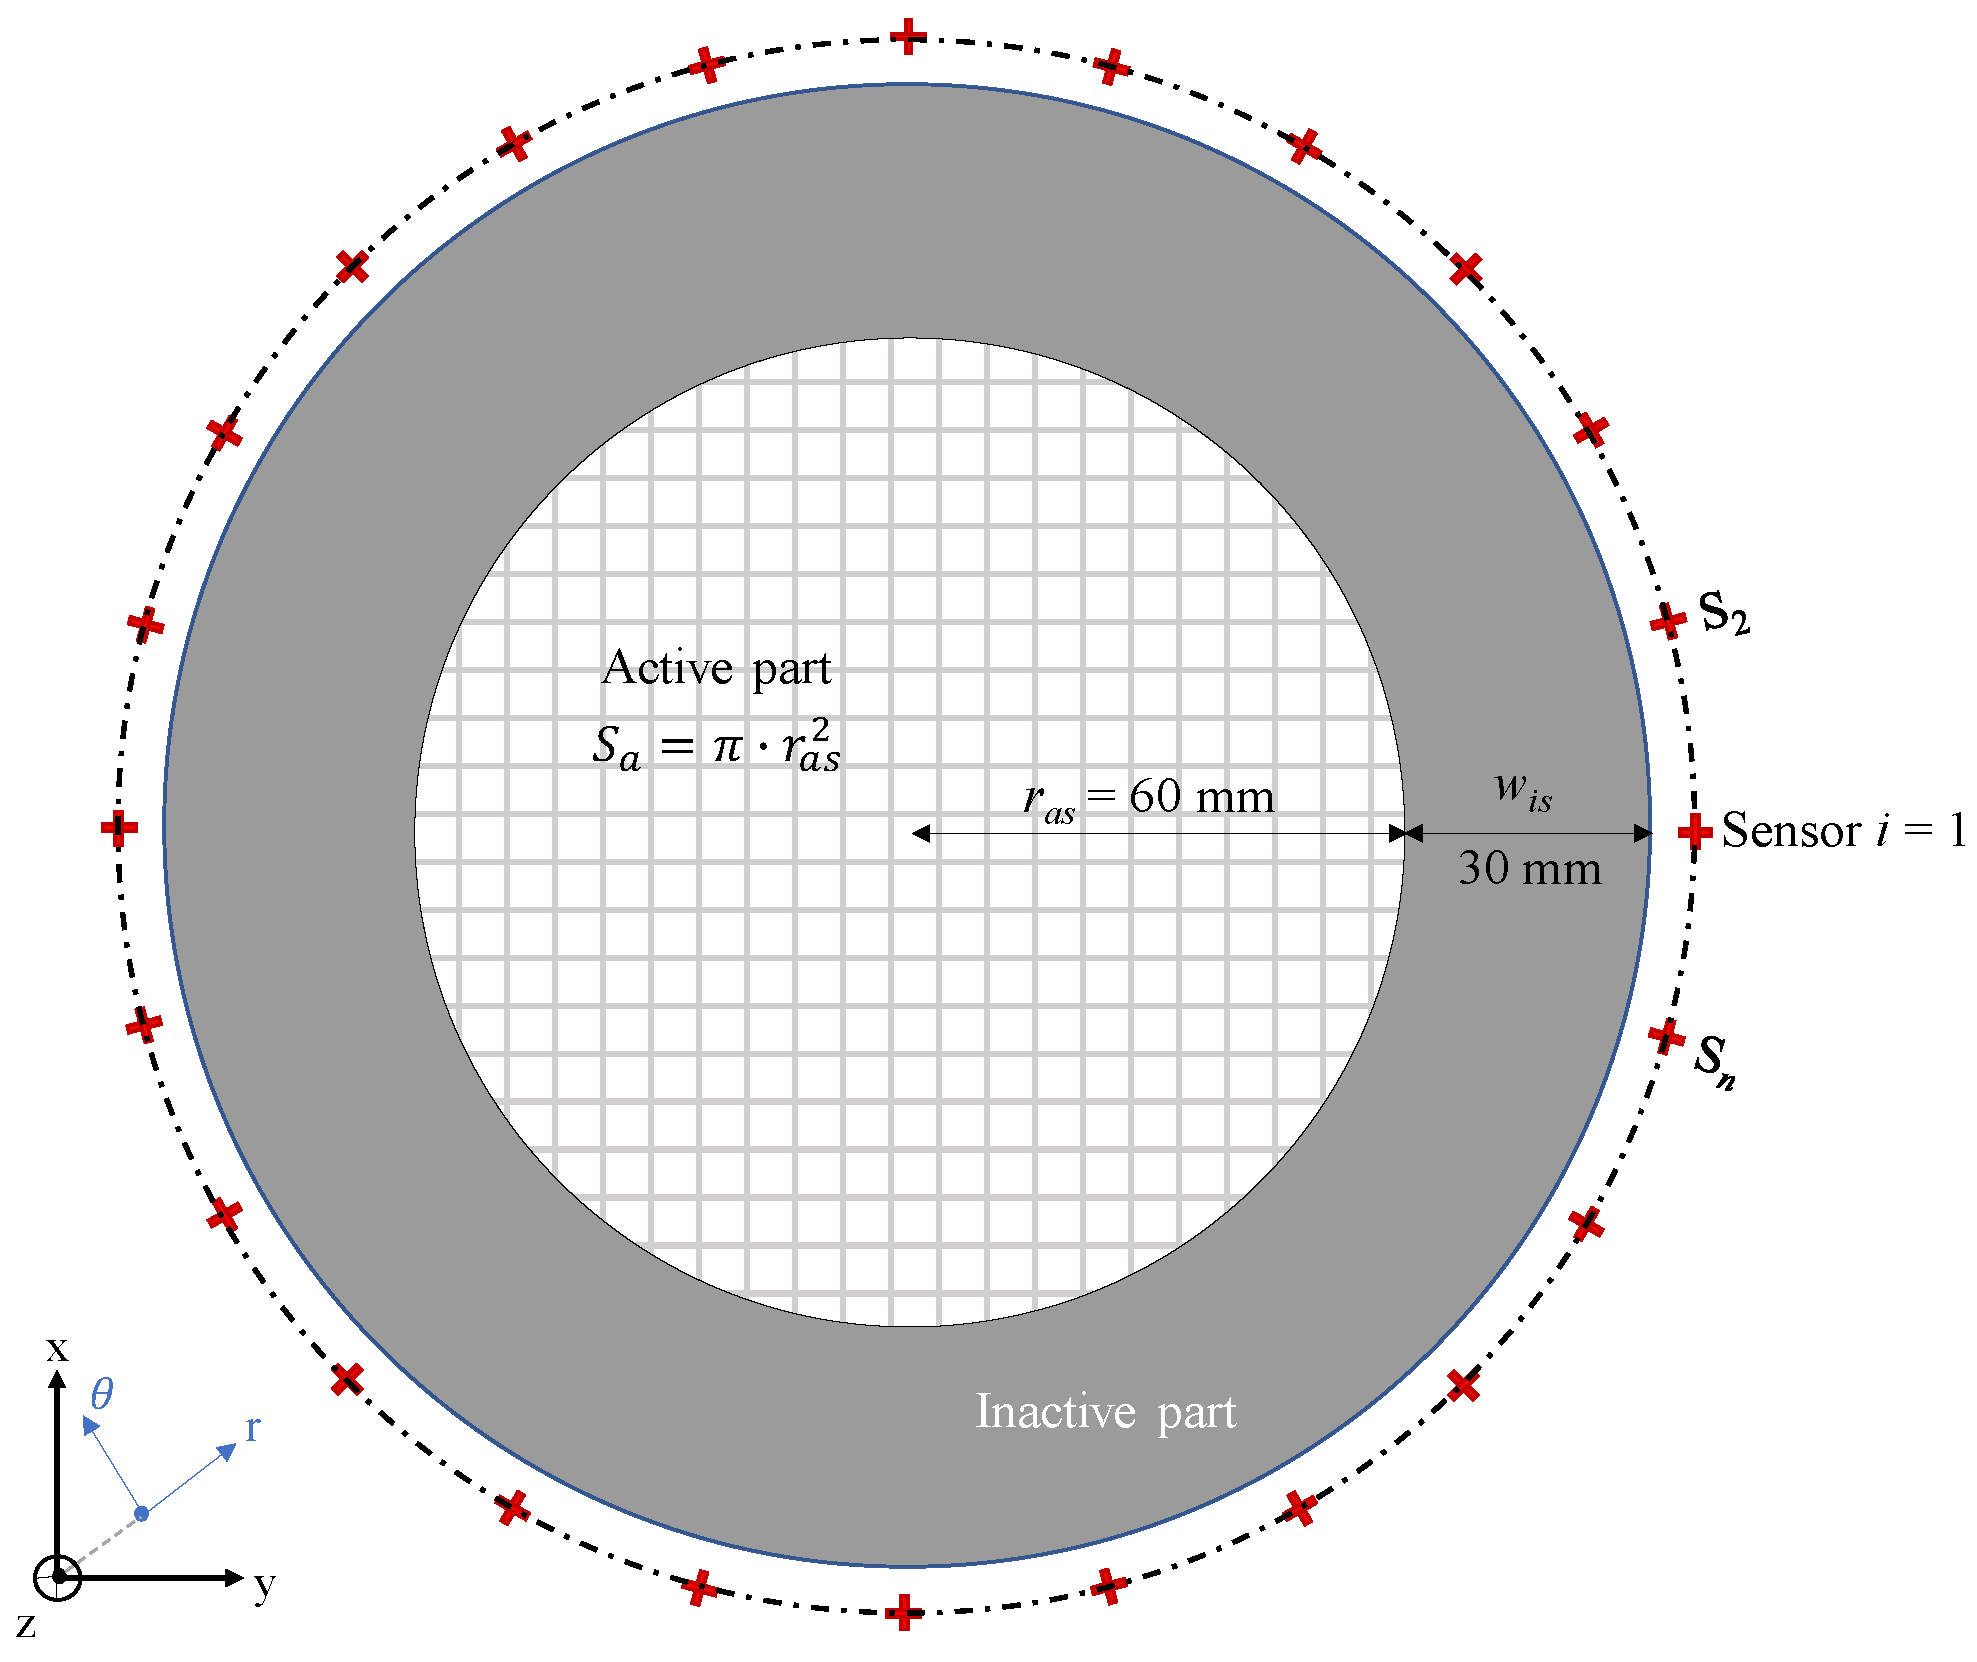
A conventional electrolyzer stack is analyzed, operating with a constant current I e l of 226.2 A and featuring an active cell area S a of 113.1 cm2, resulting in an average current density of 2 A/cm2 (FUEL CELL Store or QuinTech products as example). The simplified cross-sectional geometry at the level of a single cell is illustrated in Figure 3, with the active region shown as a shaded surface. The current density is assumed to be perpendicular to the cells, remaining constant along the stack axis.
The stack is divided into 36 segments, N s e g = 36 , as depicted in Figure 2, with each segment maintaining an identical cross-sectional area. The magnetic field measurements are taken using micro-Hall effect sensors, with Figure 3 indicating N p o s positions, potentially corresponding to 24 sensor locations (viz., S 1 to S n with n = 24 ) arranged every 15° around the considered electrolyzer. The choice of 24 sensors was made to achieve significant discretization, which could directly impact the quality of the current density reconstruction.
To measure the maximum amplitude of the produced magnetic field and reduce the impact of perturbing magnetic fields (from other devices or elements that distort the magnetic field distribution), it is necessary to place them as close as possible to the electrolyzer.
However, the different sensors are placed in a support, and a compromise is made considering a distance of 5 mm between the contour of the electrolyzer and the magnetic field center measurement.

3. Experimental Validation

An experimental setup is developed to assess the capacity and efficiency of the 2-D Biot-Savart model in polar coordinates. This bench simulates the operation of an electrolyzer, particularly in terms of current density under typical operating conditions.

3.1. Electrolyzer Emulator

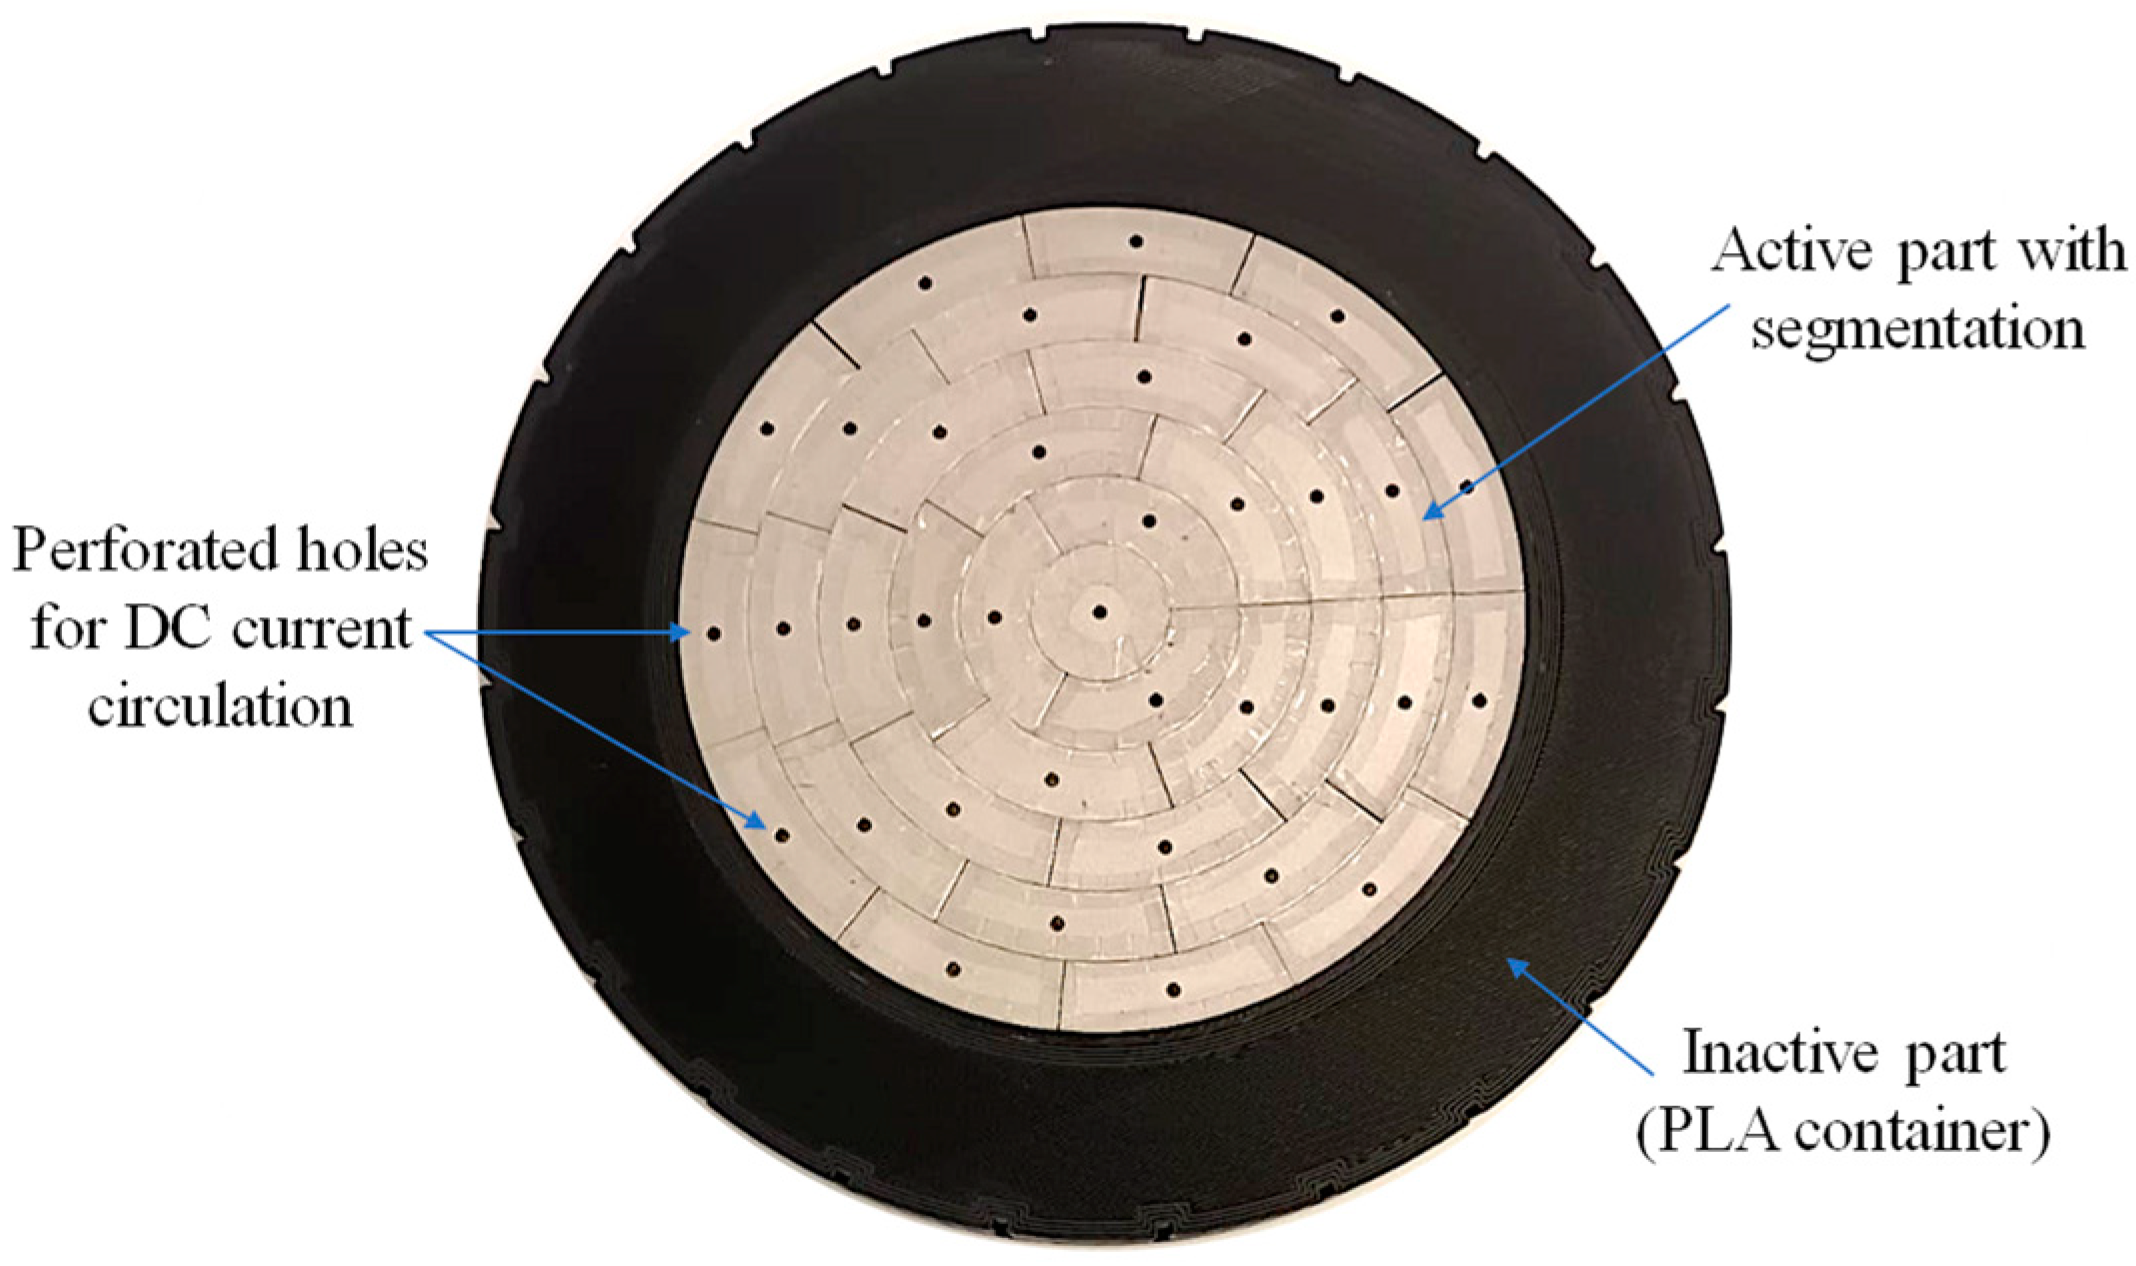
The active part is composed of multiple segments of the same cross-section, which are isolated from each other by a Kapton of 0.02 mm. The complete disposition of the segments permits us to obtain a total active surface with a circular form. Every segment is pierced but not holed in order to introduce a banana plug and reproduce current density distributions. Consequently, the conductive segments are supplied by DC currents. A picture of the developed experimental magnetic electrolyzer emulator (an essential element of the bench) is shown in Figure 4. The central active region is encircled by a non-magnetic area with a width of 3 cm (black frame in Figure 4), fabricated using a 3-D print in polylactic acid (PLA).

3.2. Magnetic Field Measurement Support

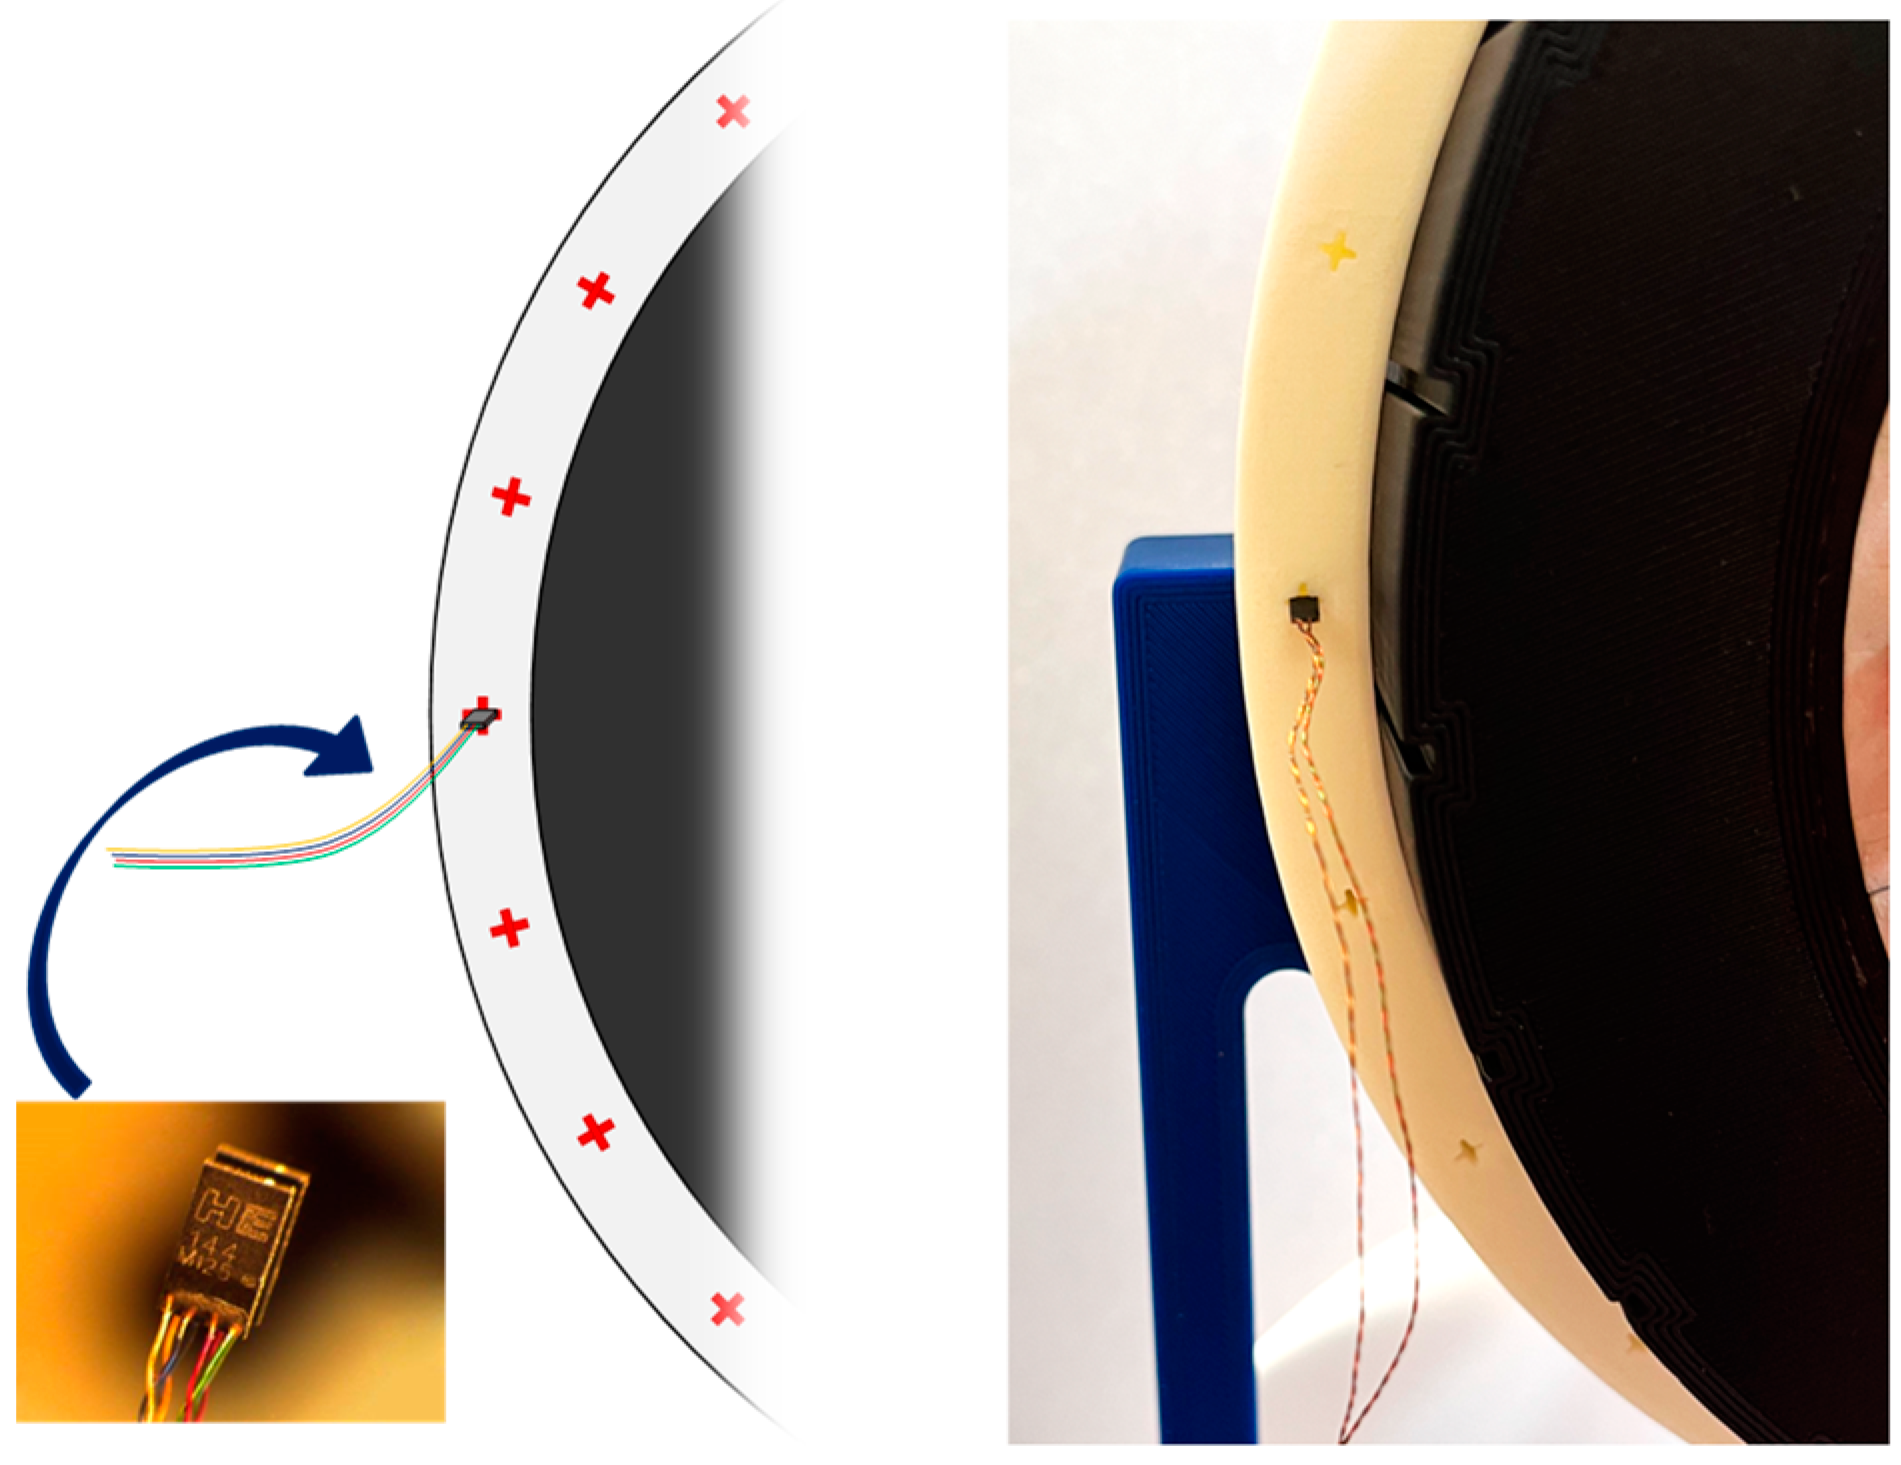
One of the primary objectives is to measure the magnetic field produced by the electrolyzer emulator in relation to the current injected into the conductive segments. To facilitate this, a non-magnetic support, 3-D printed in white PLA (as shown in Figure 5), is used for mounting the micro-Hall effect sensors. Both the radial H r and tangential H θ components of the magnetic field are measured at consistent intervals around the electrolyzer emulator.
For this application, the HE214T micro-Hall effect sensors (Asensor Technology AB®, Bålsta, Suède [32]), illustrated in Figure 5, are employed. These sensors offer a significant advantage due to their slim profile, measuring just 0.5 mm in thickness. They also feature a broad magnetic field range, with minimal linearity error (0.1%), high sensitivity, and low noise. The micro-Hall effect sensor is equipped with four pins: two for supplying a 2 mA DC current to the probe and two for measuring the Hall voltage, which is then used to determine the magnetic field strength.

3.3. Experimental Measurements on Complete Emulator

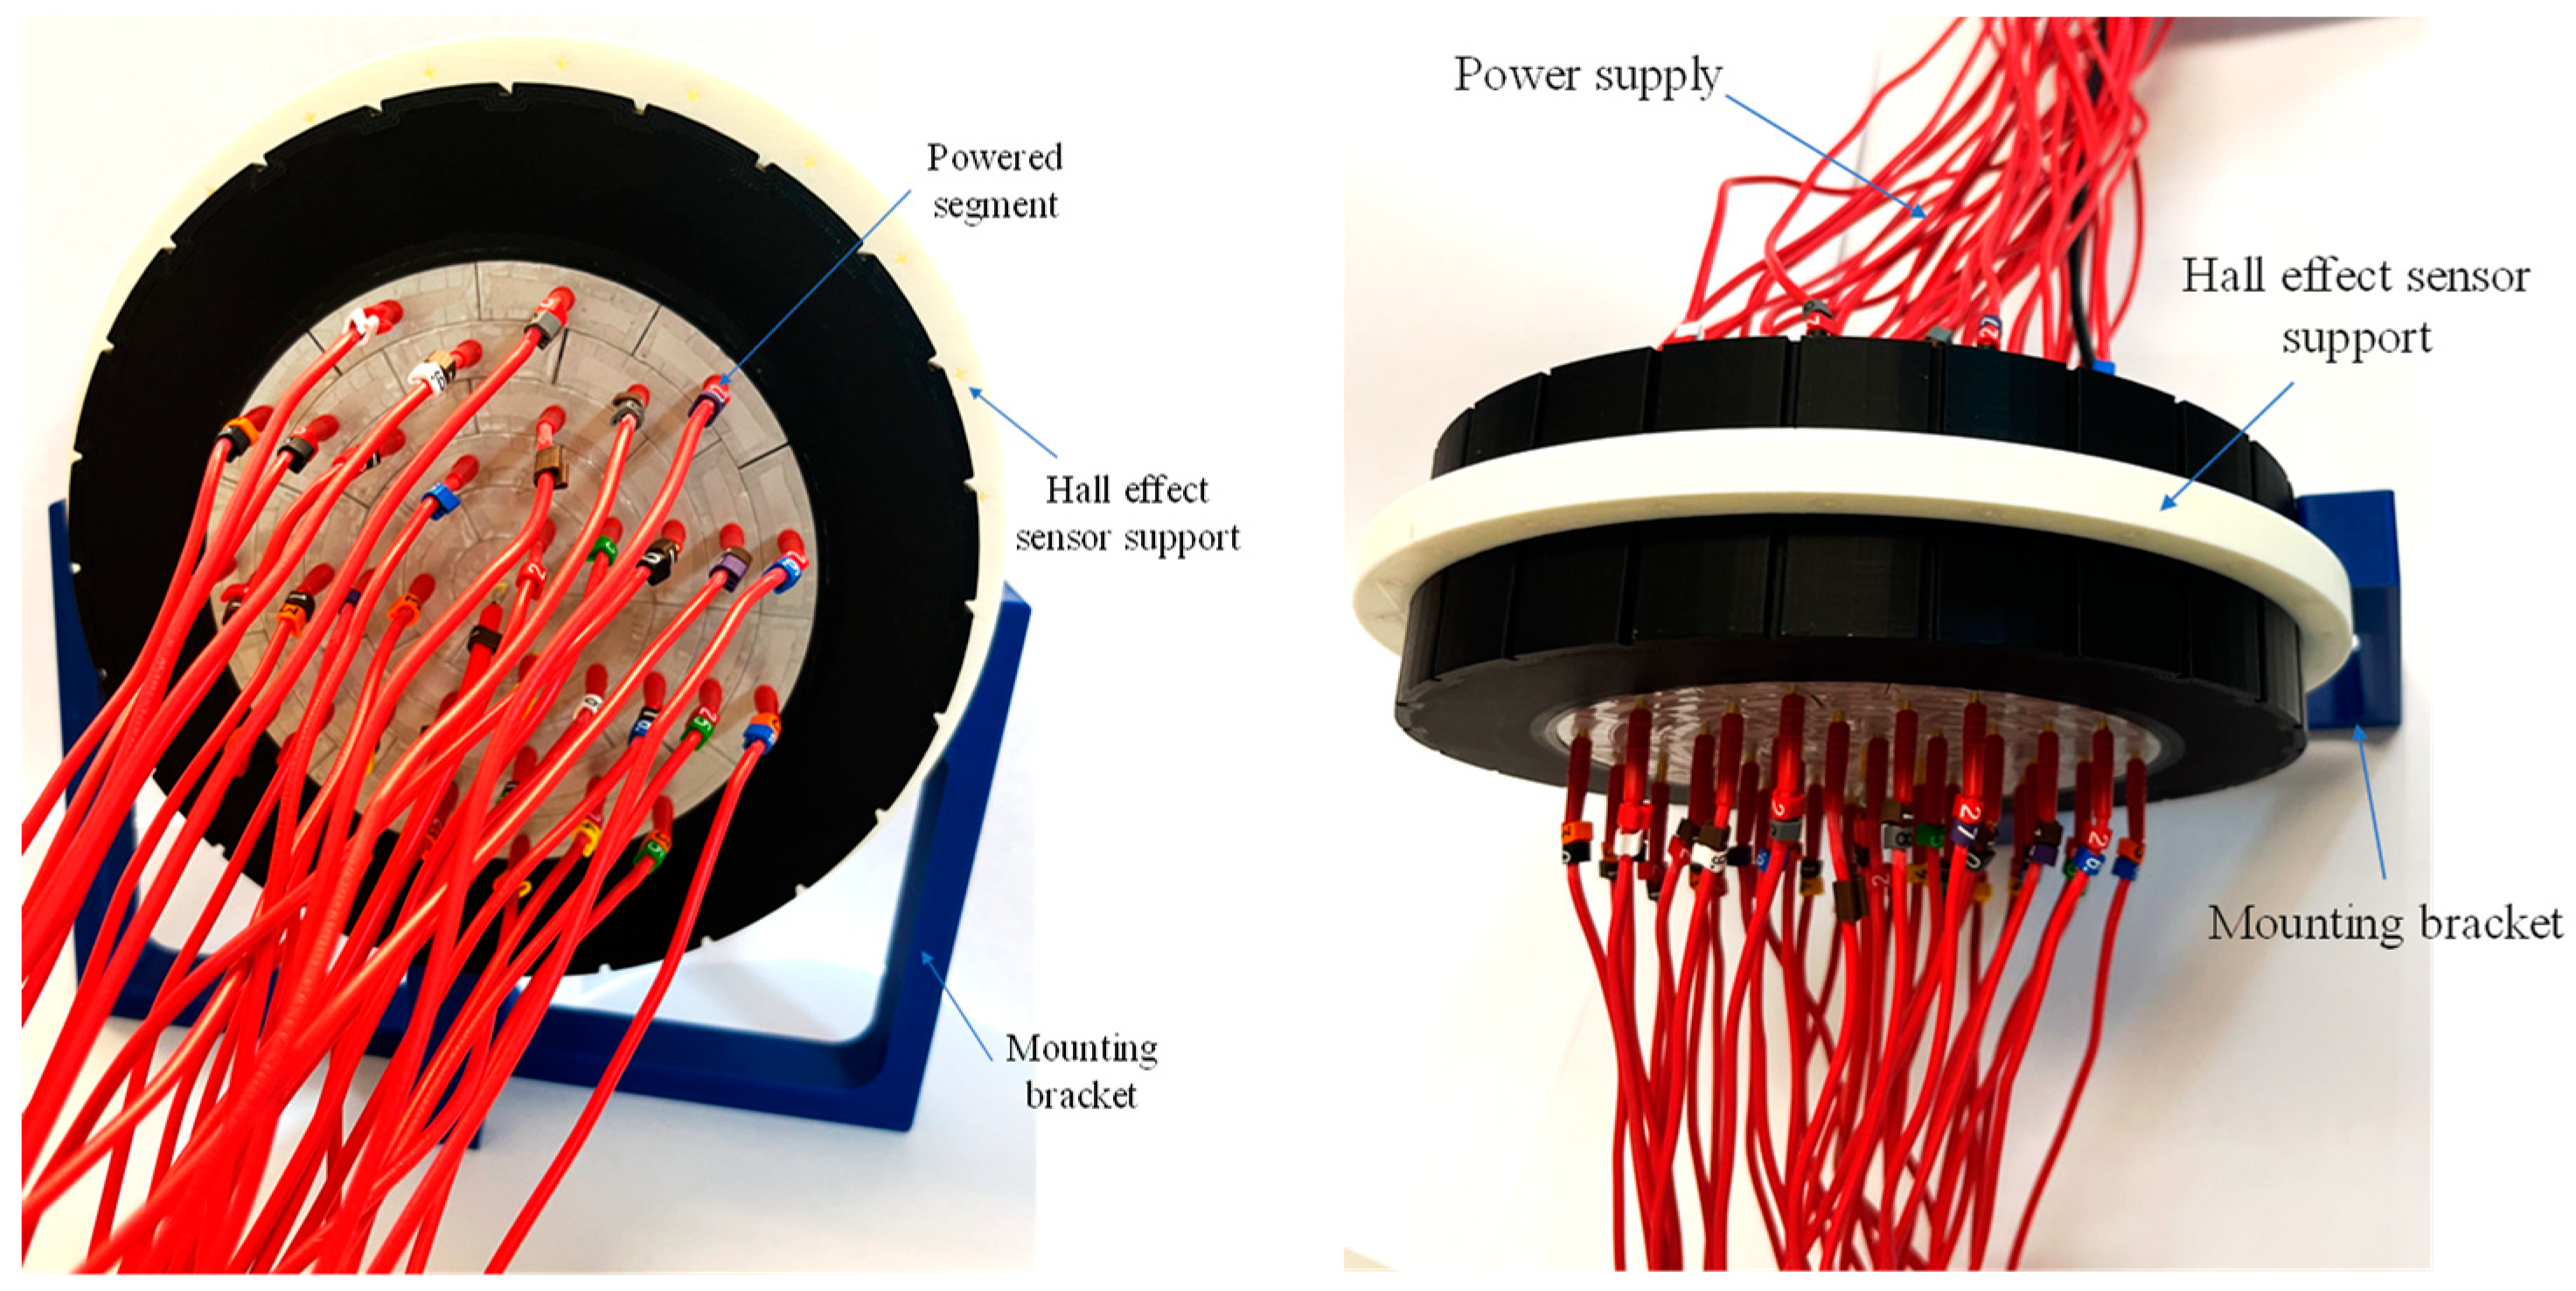
In order to supply the conductive segments, the wires with the same current density are connected on each side of the emulator in series, as seen in Figure 6. The total current, I e l , is preserved at 226.2 A since with a total active surface S a of 113.1 cm2, a homogenous current density of 2 A/cm2 in normal mode is desired.
Different operating modes can be emulated, including both normal and abnormal conditions. When an abnormal operation reduces the total active area, it leads to a non-uniform current density distribution within the electrolyzer emulator. The different segments of the active part of the electrolyzer emulator, can be supplied with different current amplitudes. The partial current supply to one or more elements, along with their positioning, will directly affect the magnetic field distribution around the electrolyzer emulator.

4. Results, Validation and Discussion

4.1. Magnetic Field Estimation Knowing Current Density Distribution

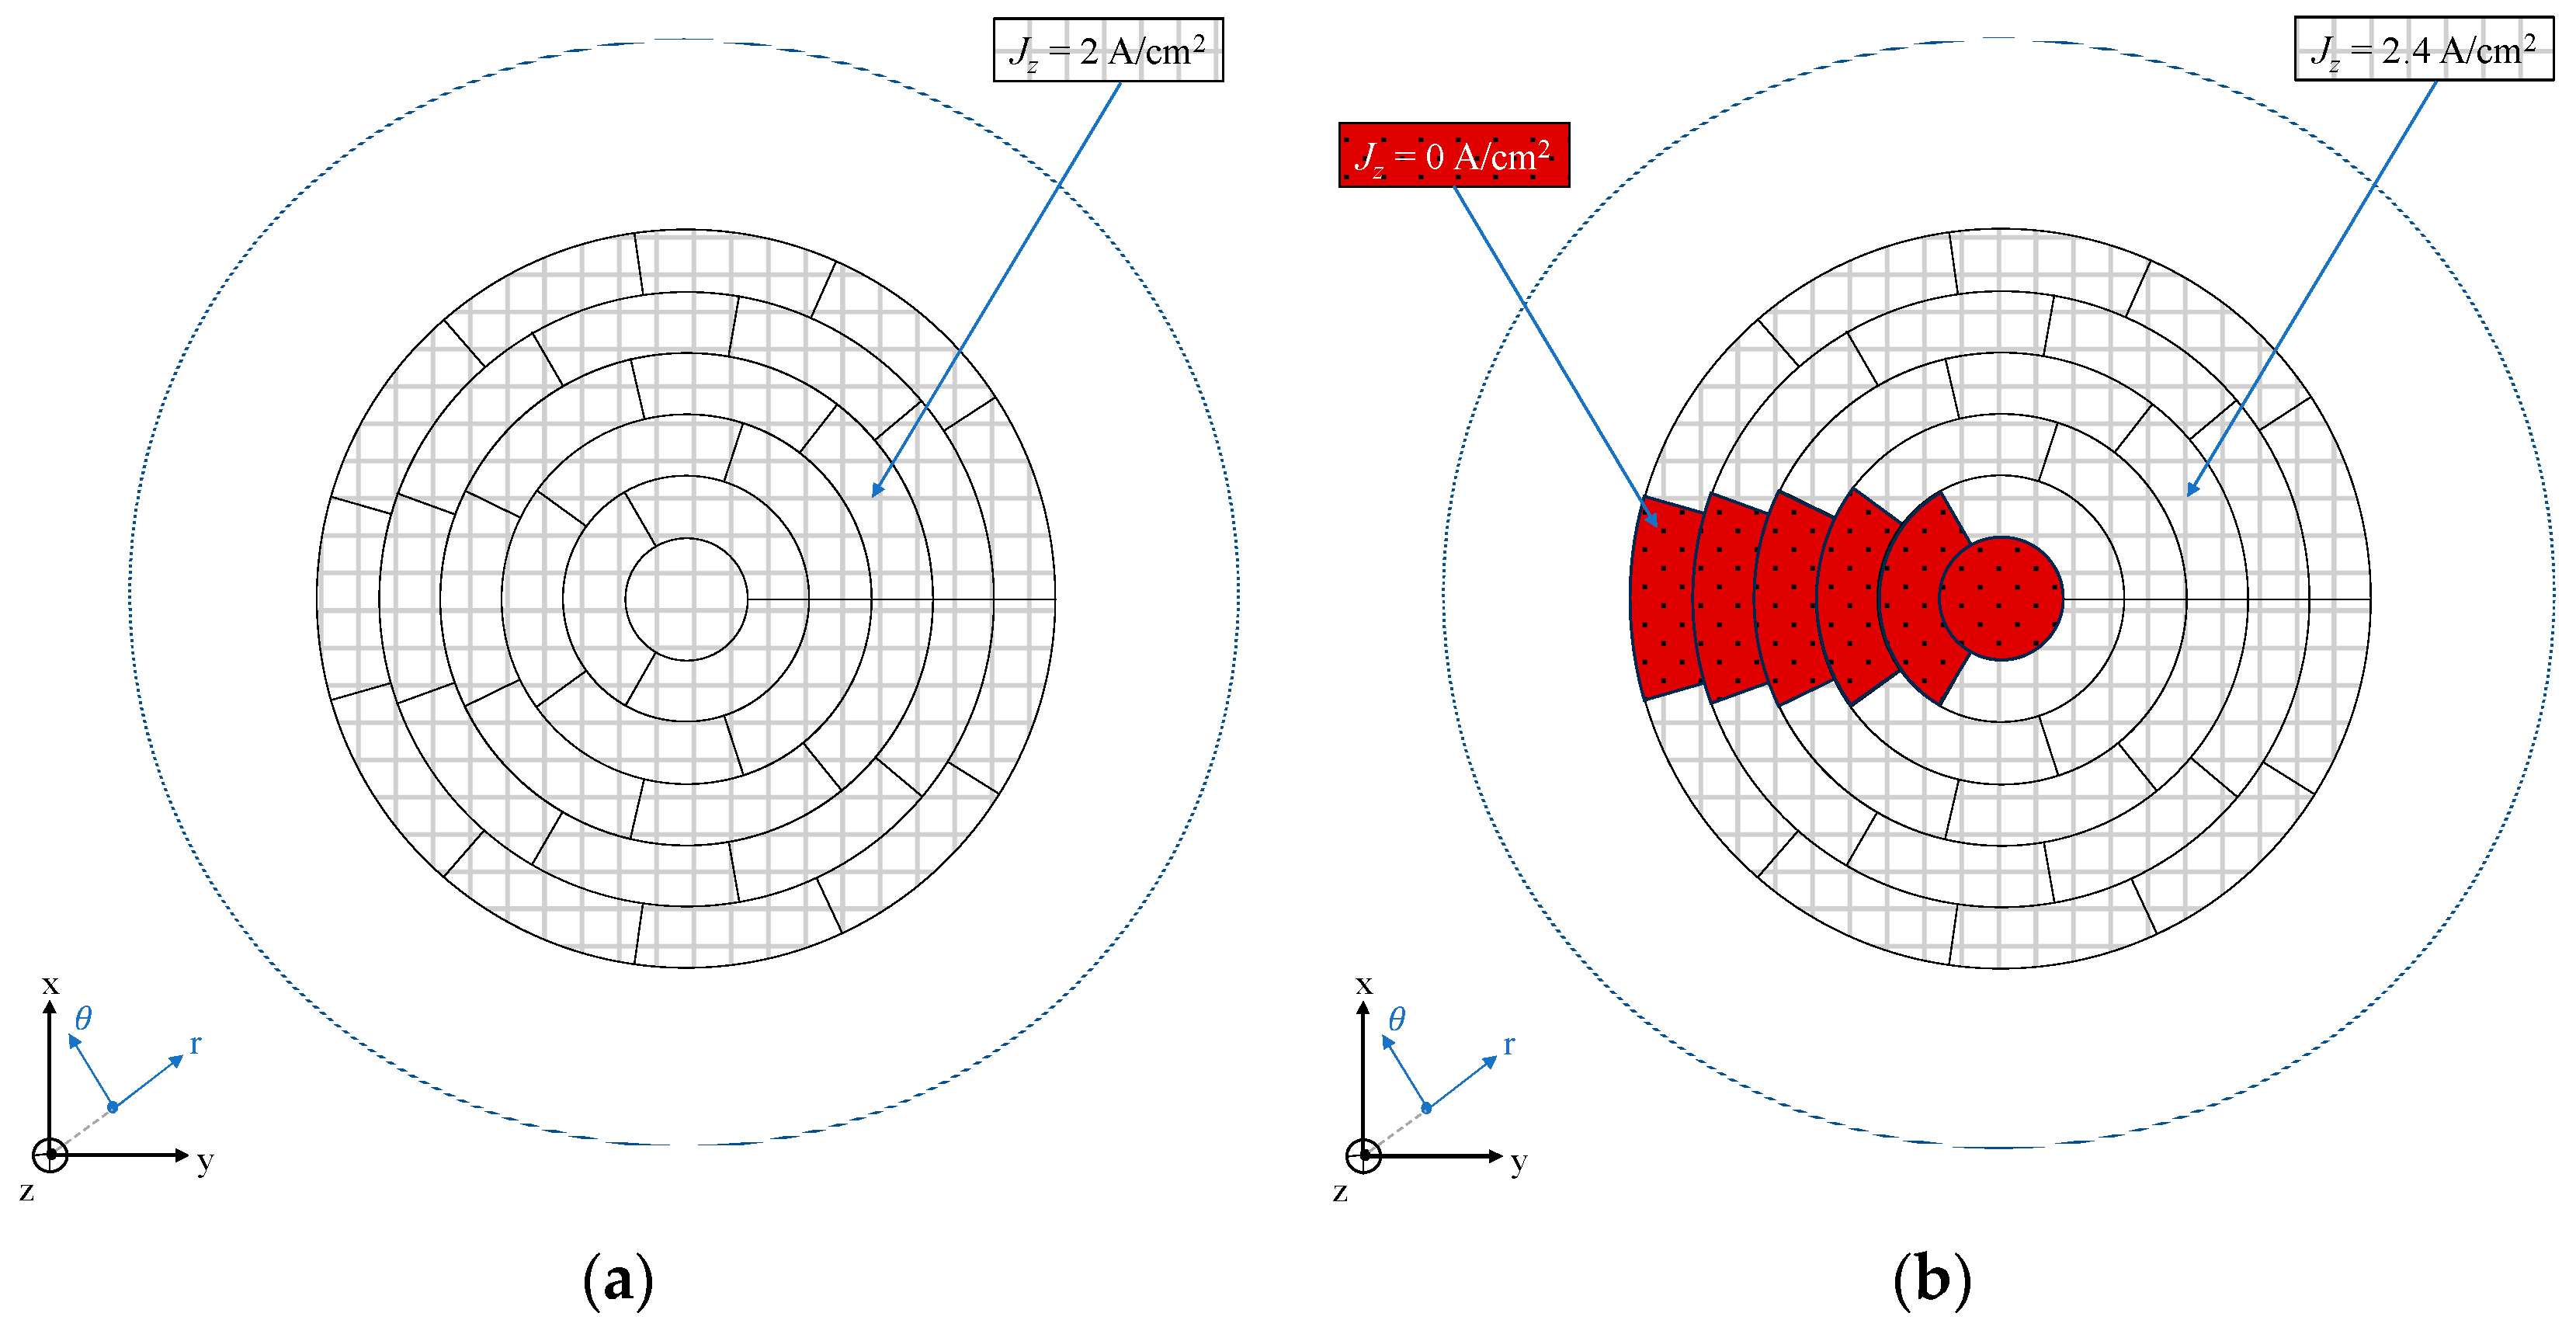
In this section, experimental measurements are contrasted with theoretical predictions, with particular emphasis on the magnetic field waveform surrounding the electrolyzer. The initial comparison is conducted for a healthy electrolyzer exhibiting a uniform current density Jz of 2 A/cm2, as depicted in in Figure 7a. A variation in the current implies a proportional variation in current density, which in turn implies a proportional variation in the magnetic field. However, a high current density distribution will increase the magnetic field, making the measurements more consistent and reducing measurement errors. This is why we chose a mean current density of 2 A/cm2. For a homogenous current density distribution, a current I c s of 6.28 A is distributed in each conductive segment since the surface of each conductive segment is 3.14 cm2. For an heterogenous distribution, a failure is applied with a defective area of a sixteenth of the total active part (17.7%), as shown by the red cross in Figure 7b. In this example failure case, the current density of the harmed part is zero, and that for the rest of the electrolyzer is adapted. Maintaining a constant total current I e l of 226.2 A, for the considered failure, the current density of the active part Jz is 2.4 A/cm2.
The main issues creating significant differences in current density in an electrolyzer are related to electrode corrosion and degradation, an uneven distribution of the electrolyte, and cooling defects. Electrode corrosion and material degradation increase local resistance, leading to substantial variations in current density. An uneven distribution of the electrolyte, due to poor circulation or contamination, creates zones of variable conductivity, also affecting current distribution. Additionally, cooling problems can cause hot spots, which locally increase resistance and disrupt current distribution.
Overall, a current density defect results in a decrease in the magnetic field near the damaged zone and an increase moving away from it. Good accuracy between the experimental measurements and analytical results will allow the validation of the 2-D analytical model for both normal and abnormal electrolyzer operations.
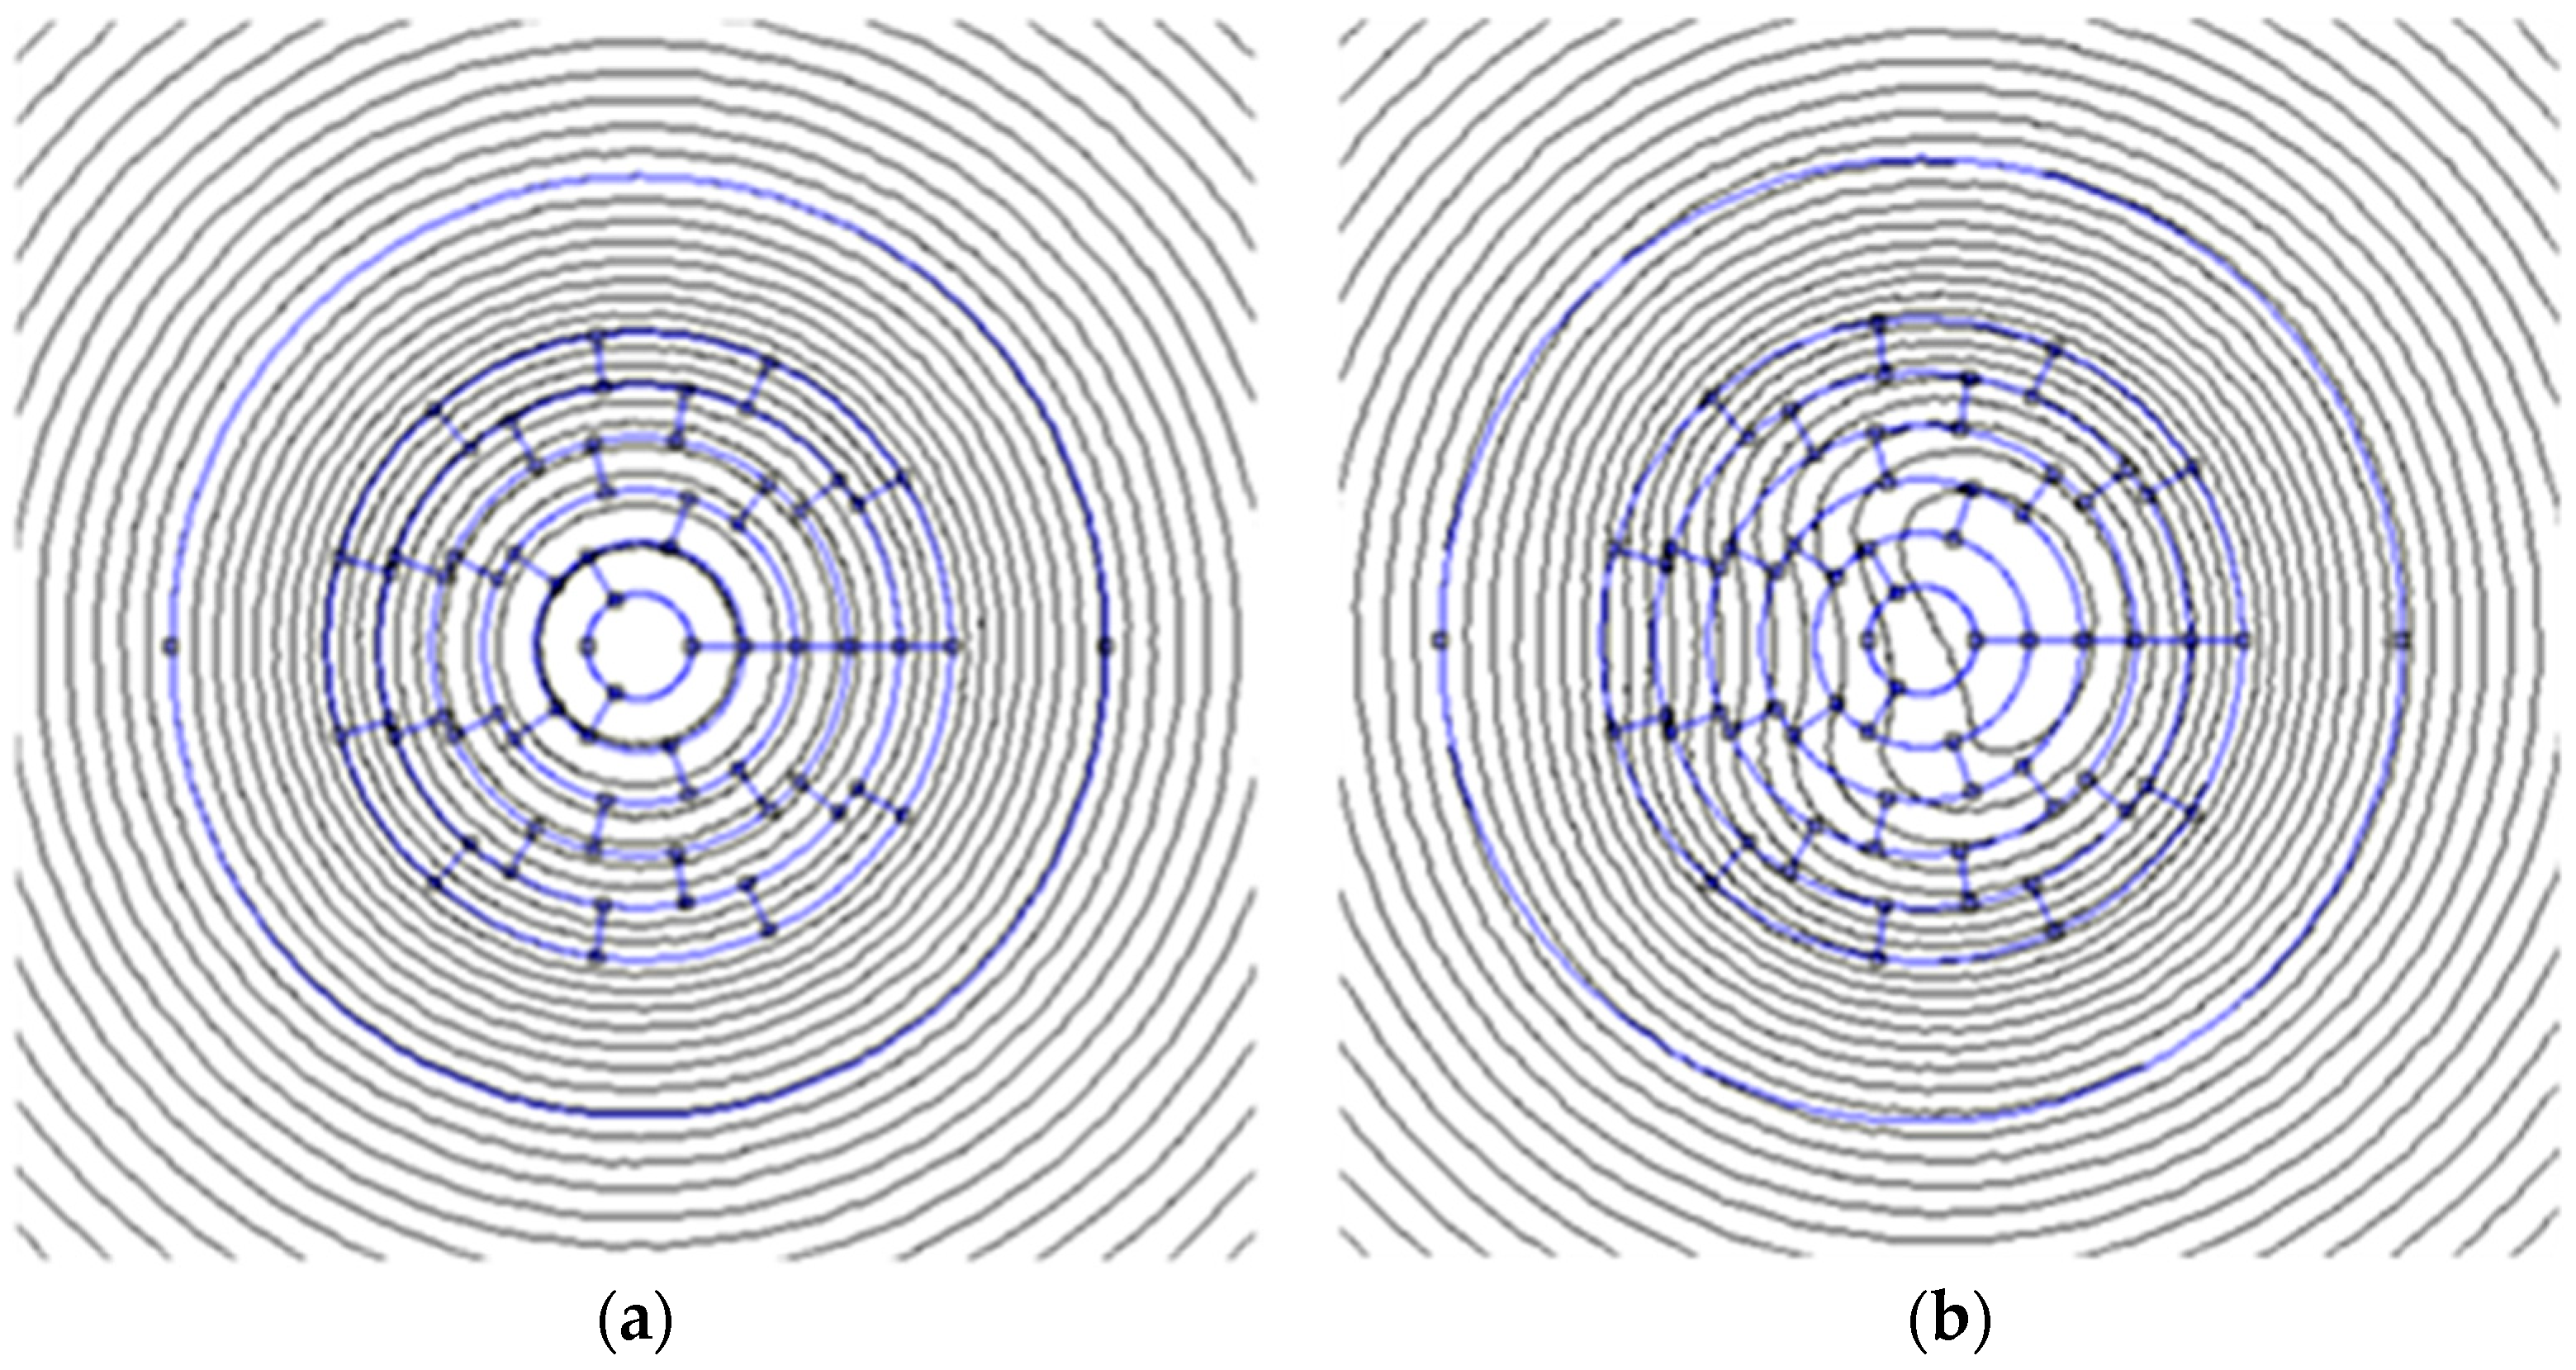
For a complete validation of the analytical model, a numerical model has been developed on FEMM software (version 4.2). The discretized modeling is the same as displayed in Figure 7. The results of the magnetic field equipotential lines are plotted in Figure 8a for an electrolyzer with a homogenous current density of 2 A/cm2. As exposed by the perfect circular equipotential lines of the healthy electrolyzer, the tangential component of the magnetic field is constant on all of the defined path. Inversely, the radial component is null on all of the path.
In Figure 8b, the equipotential lines of the electrolyzer are depicted, showing a failure affecting one-sixteenth of its surface area, as illustrated in Figure 7b. A distortion of the circular equipotential lines, as observed earlier, is evident. Particularly in the central regions of the electrolyzer, the equipotential lines exhibit a bean-like shape, which perfectly aligns with the representation of the fault being examined. Such a deformation is characteristic of a device experiencing non-uniform current densities.
In this section, we compare the analytical results with both experimental and numerical data. Various operating conditions, including normal and abnormal scenarios, are illustrated in Figure 7. Magnetic field components, specifically radial H r and tangential H θ were recorded at 15° intervals, resulting in 24 experimental measurement points around the electrolyzer emulator, as depicted in Figure 3.
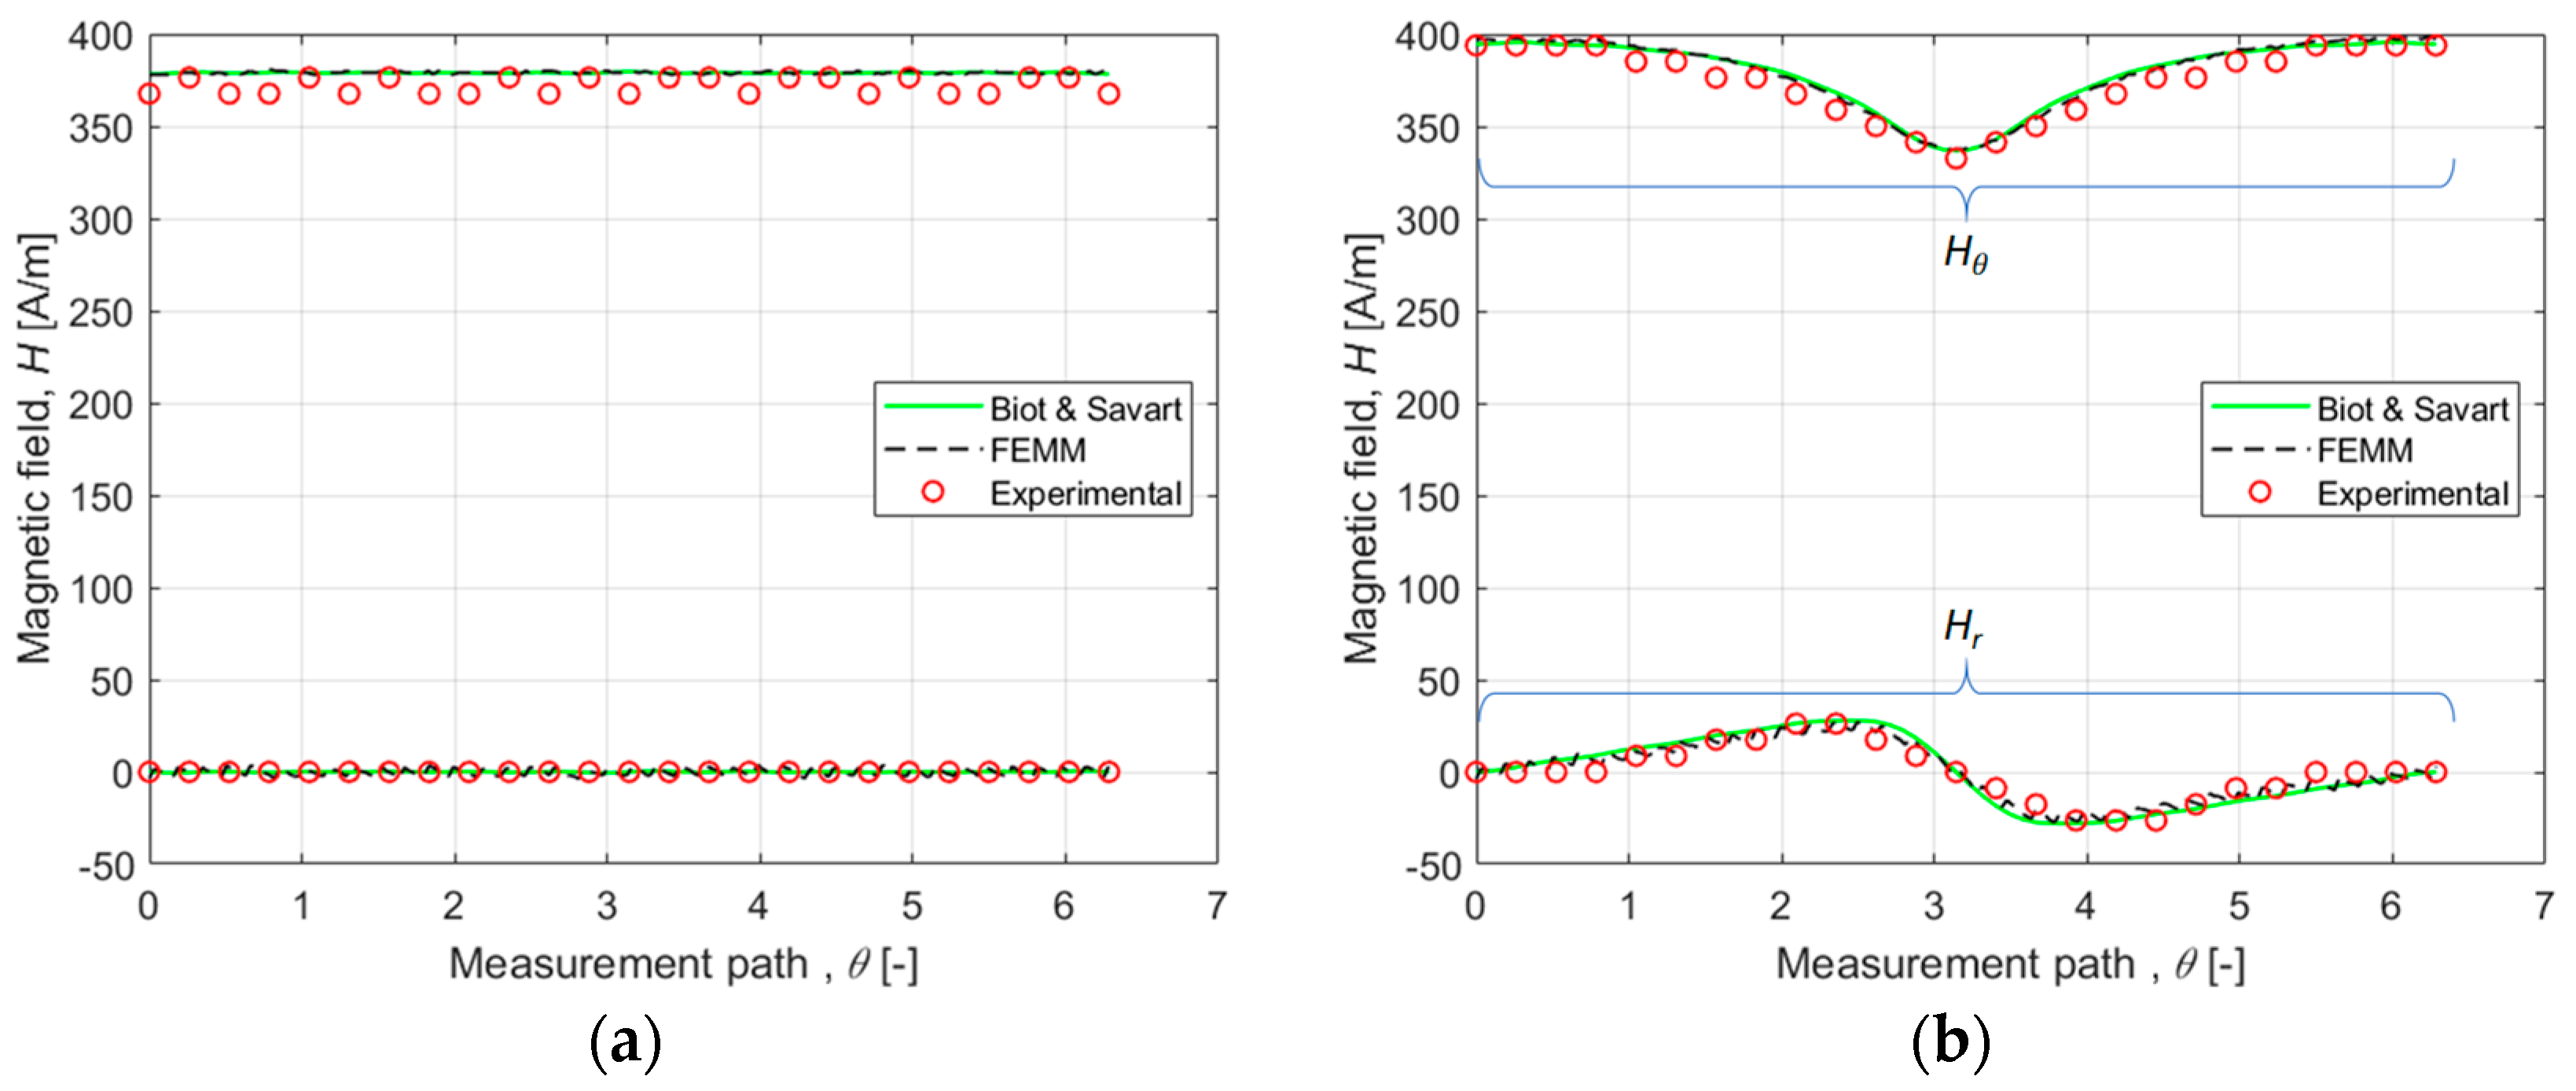
The experimentally obtained magnetic field values exhibit some discrepancies due to experimental uncertainties; however, the overall trend is consistent, with deviations not exceeding 10 A/m. The waveforms for H r and H θ are presented for the same measurement path shown in Figure 9. Figure 9a displays the results for a healthy electrolyzer, while Figure 9b illustrates the impact of a defect located at the left side of the electrolyzer.
Overall, the analytical model’s effectiveness is confirmed by the strong agreement observed between the experimental measurements, numerical studies, and analytical predictions. In the case of a faulty electrolyzer, variations in the magnetic field will signal the presence of a defect. For instance, when 17.7% of the electrolyzer’s total area has no current density (i.e., the current density in the affected area is zero), the sensors located near the fault (around θ = π ), are most affected due to their proximity. Conversely, sensors situated farther from the fault show an increase in magnetic field strength compared to a fault-free condition. This occurs because the total current remains at 226.2 A, which results in a higher current density on the remaining active surface. Overall, the difference between the theoretically estimated magnetic field and the experimentally measured one does not exceed 5%.

4.2. Current Density Distribution Estimation

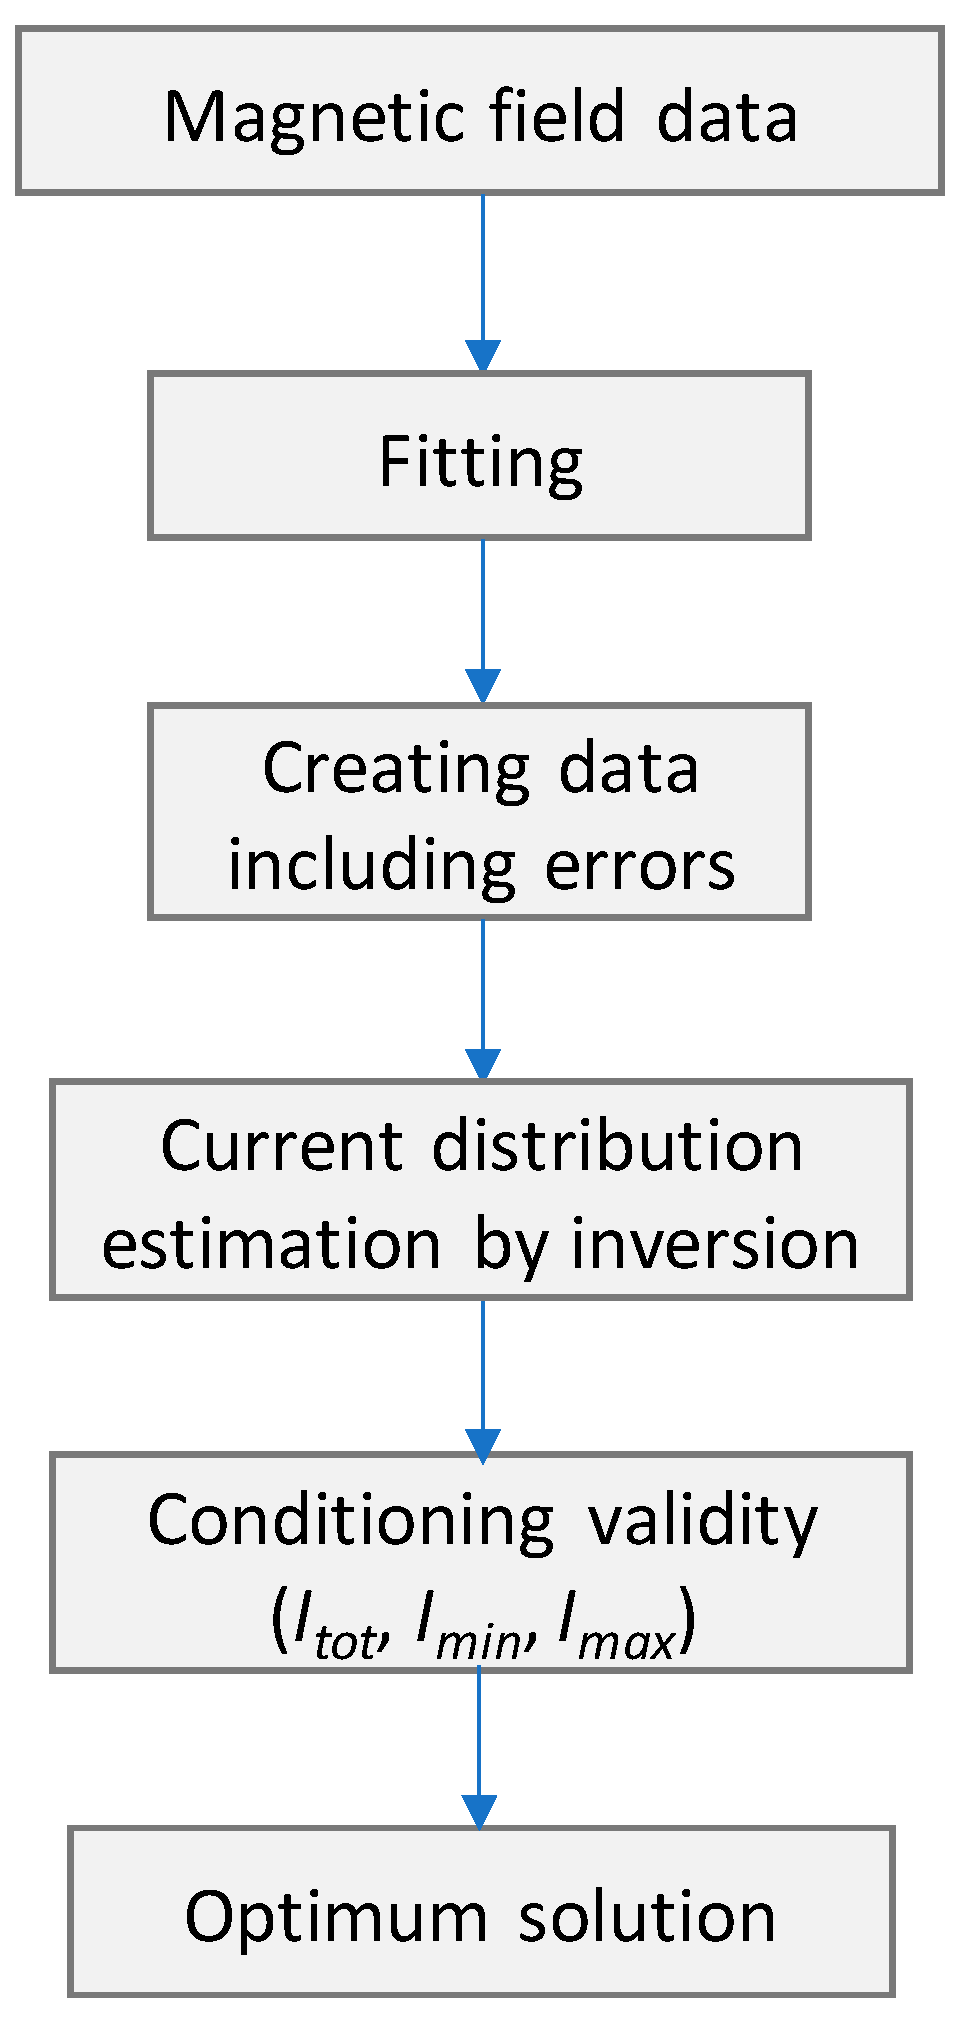
As indicated in Section 2 on the 2-D Biot–Savart model, it is feasible to reconstruct the current density distribution by analyzing the magnetic field generated around the electrolyzer. This requires addressing the inverse problem, which entails employing an algorithm to minimize errors and reconstruct the current density flowing within the electrolyzer. The algorithm involves several steps for data manipulation, as illustrated in Figure 10. These steps are meticulously designed to facilitate the accurate reconstruction of the current density distribution based on the magnetic field data obtained from the electrolyzer.
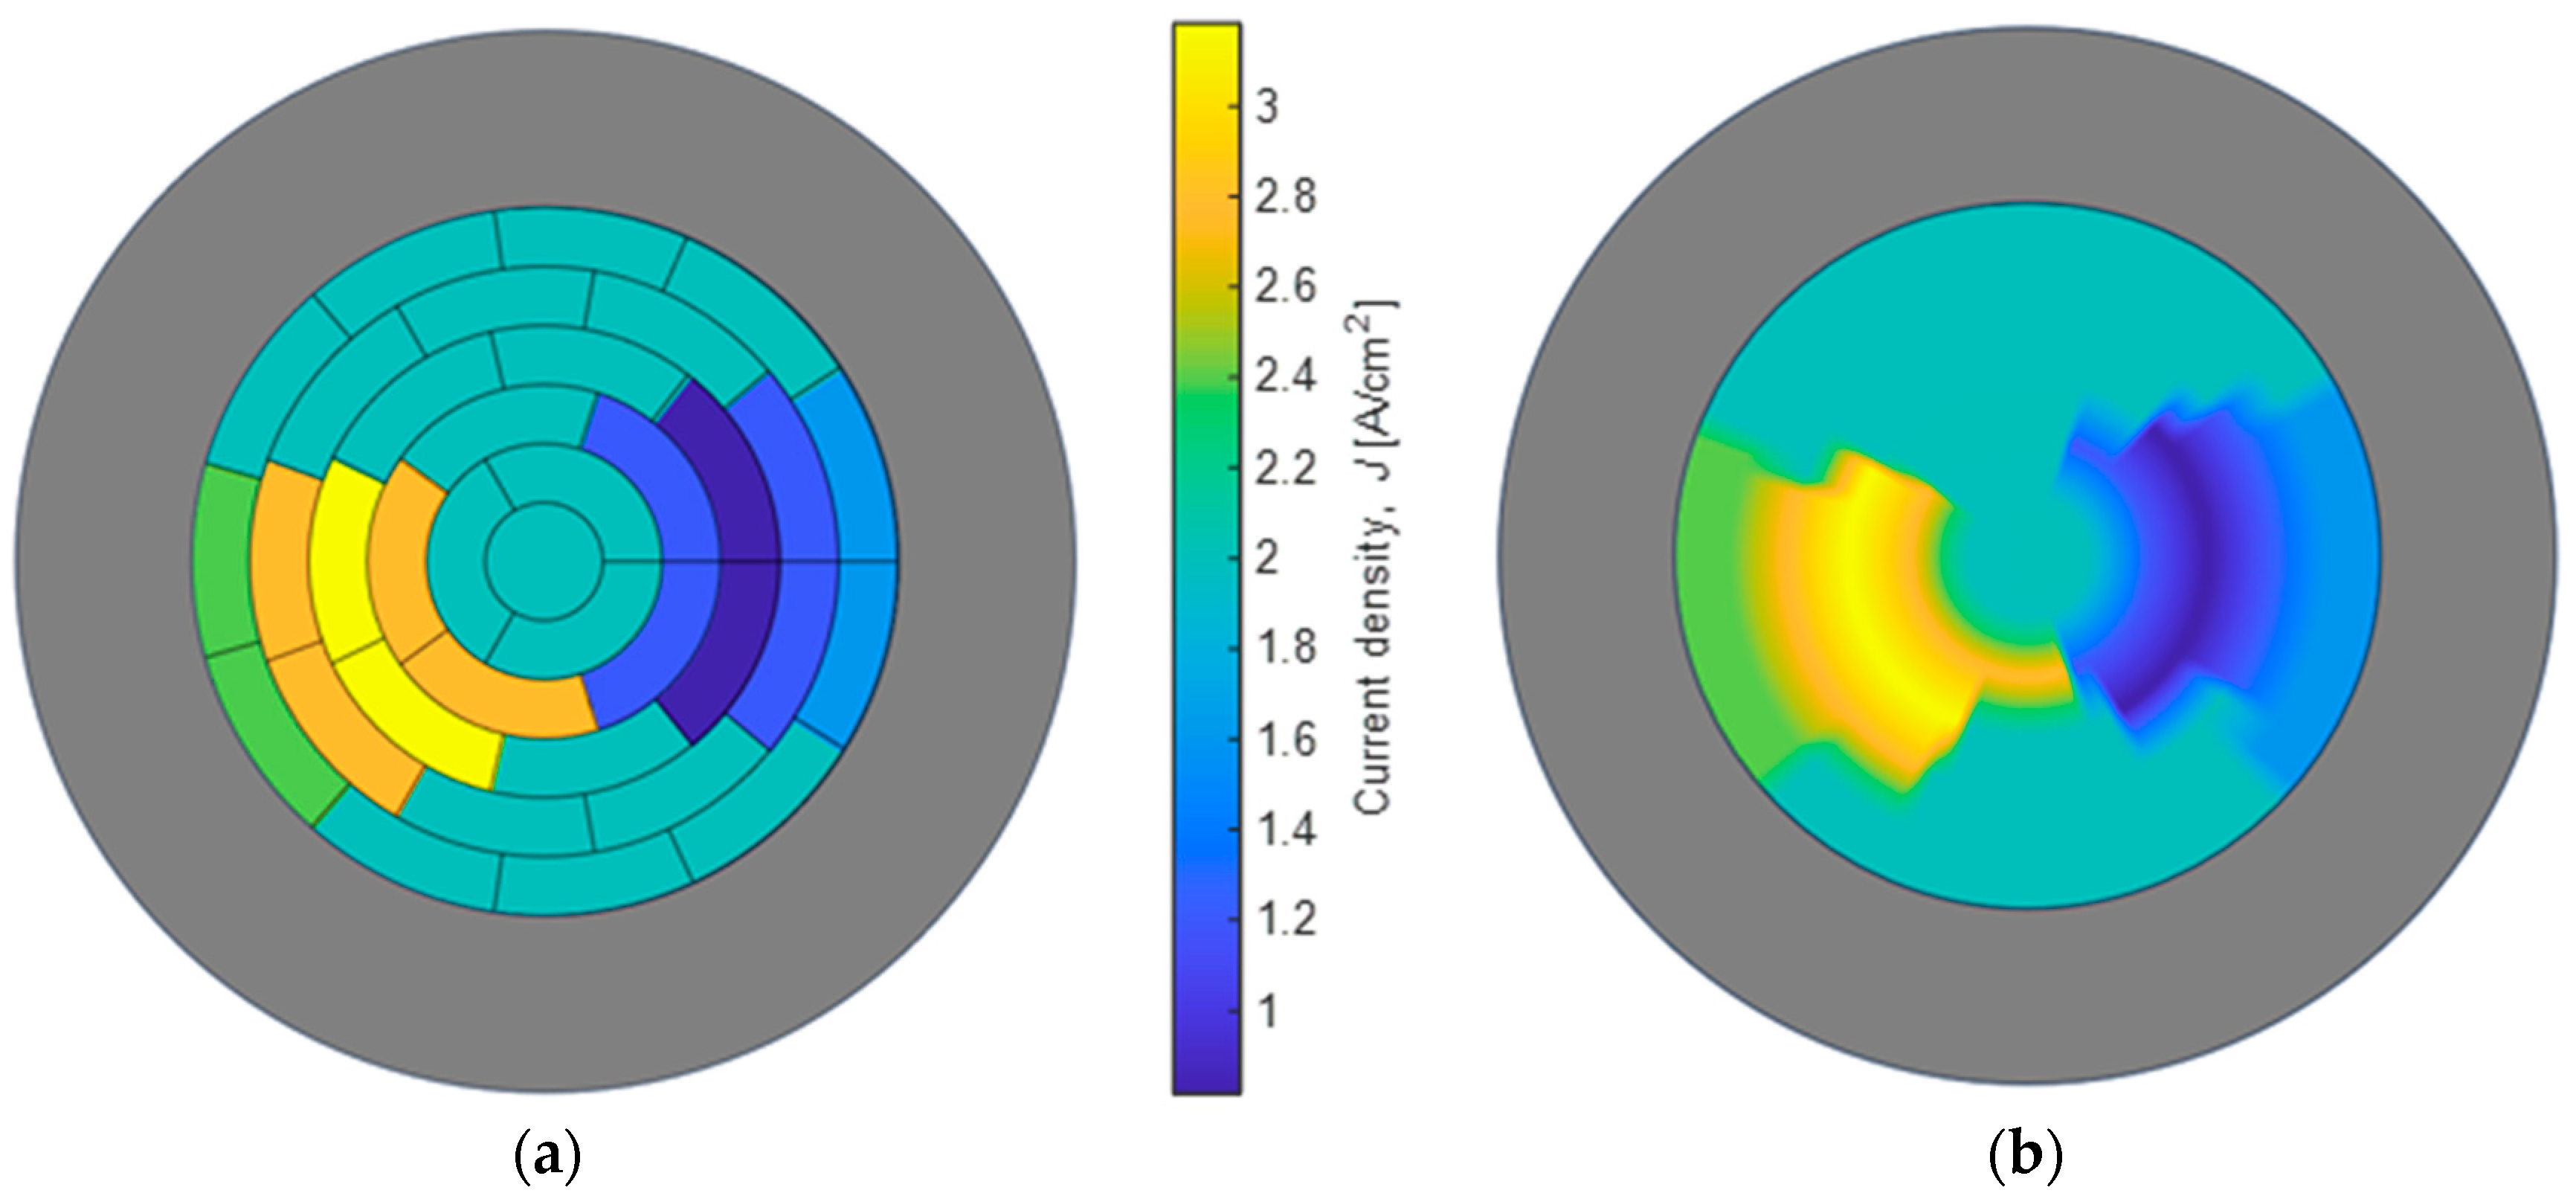
Different cases are studied in this section. A correlation can be observed between the extent of surface defects and the maximum difference in the magnetic field since a correlation is established between the magnetic field generated and the current density distribution. The results of the current profile are associated with the experimental magnetic field measurements and the current density distribution based on the reconstruction using the magnetic field.
Two examples are presented. The first one (see Figure 11) presents a current density distribution superior to the normal on the left side and a corresponding inferior distribution of the current density in the lateral direction. Evidently, the global current is constant and corresponds to 226 A. So, the magnetic field is the lowest at proximities on the right side (around θ = 0   o r   2 π ), and it is the highest at proximities on the left side (around θ = π ).
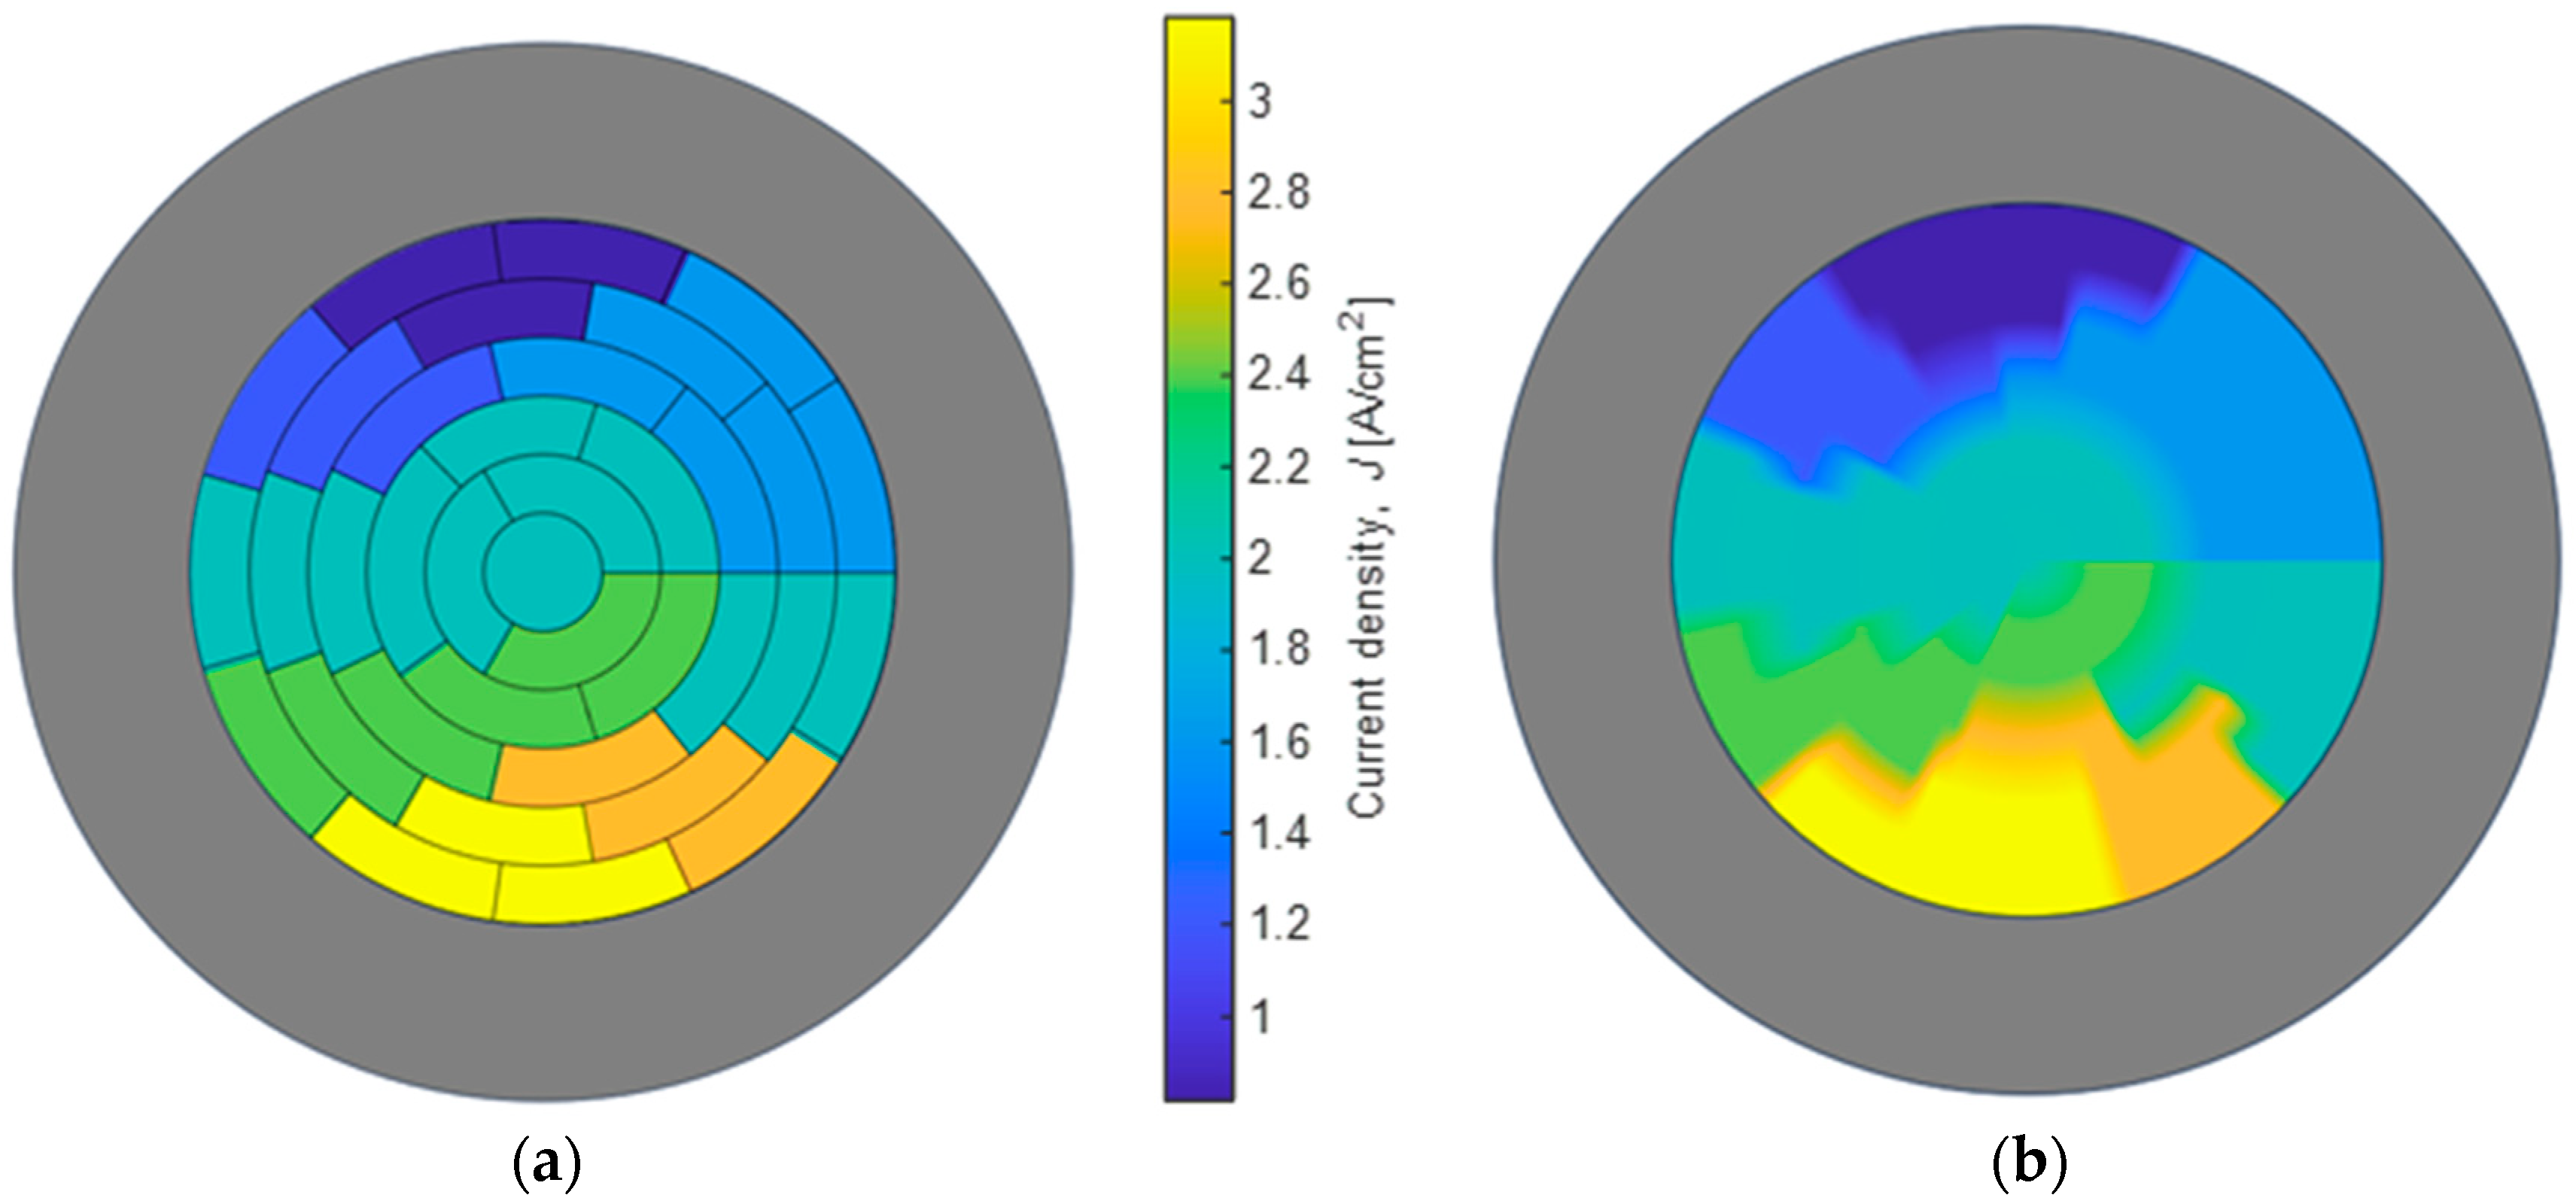
The second one is an inhomogeneous distribution of the current density with an important variation. This distribution is realized in order to estimate the capabilities and performances of the model. Figure 12 shows the results and particularly the reconstructed current density distribution.
The reconstruction appears to be a correct estimation of the current density distribution. In both cases, the tendency of each segment is validated. The problem is solved and the obtained solution is compared to the initial currents. Both distributions present good agreement, even if a difference appears on the amplitude of the punctual current density.
Magneto-tomography emerges as a compelling method for achieving precise diagnostic assessments of electrolyzers. This technique involves using magnetic fields to generate detailed images of the internal structure and functioning of the electrolyzer. By employing advanced imaging technologies, such as magnetic resonance imaging, magneto-tomography enables a thorough examination of the electrolyzer’s components and processes. This approach facilitates the identification of any anomalies or inefficiencies within the electrolyzer, thereby contributing to the improvement in its performance and overall operational effectiveness.

5. Conclusions

In this paper, an original and advanced method to detect a fault, to estimate the current density distribution and to determine the magnetic field of an electrolyzer is presented. Magneto-tomography permits us to diagnose an electrolyzer with a non-invasive method. The experimental setup for creating an electrolyzer emulator is detailed, and the analytical results are compared with experimental measurements to validate the model and method. The validation is confirmed with an average difference of about 7% between the applied and recalculated current density distribution.
The good accuracy demonstrates the potential of magneto-tomography for electrolyzer diagnosis. Compared to conventional approaches, magneto-tomography offers the advantage of being a non-invasive method and of having no feedback influence on the analyzed device and consequently on the measured current density mapping.
The computation time for the analytical model is just a few seconds, consistently shorter than that of finite-element analysis. Besides the advantage of a reduced computation time, the analytical model offers the additional benefit of being invertible, unlike numerical methods. Clearly, creating a fast and efficient model is a crucial initial step in the project. Looking ahead, another opportunity is to develop a quasi-three-dimensional model to account for the effects of the third dimension on the results or again to increase the capacity and accuracy of the method. Furthermore, measurements on a real electrolyzer stack are under realisation. Finally, by ensuring a more uniform current distribution, the efficiency and stability of hydrogen production could be improved, potentially leading to increased output and reduced energy consumption. This presents an exciting opportunity for further exploration and development, which could have significant implications for the future of hydrogen production technologies.

Author Contributions

Conceptualization, A.P. and F.D.; methodology, A.P. and F.D.; software, A.P. and F.D.; validation, A.P. and F.D.; formal analysis, A.P.; resources, A.P.; writing—original draft preparation, A.P.; writing—review and editing, A.P., F.D., D.B. and D.H.; project administration, A.P.; funding acquisition, A.P., F.D. and D.B. All authors have read and agreed to the published version of the manuscript.

Funding

This work was supported by the EIPHI Graduate School (contract ANR-17-EURE-0002) and the Region Bourgogne Franche-Comté.

Data Availability Statement

The original contributions presented in the study are included in the article, further inquiries can be directed to the corresponding authors.

Conflicts of Interest

The authors declare no conflicts of interest.

References

  1. Liu, W.; Zuo, H.; Wang, J.; Xue, Q.; Ren, B.; Yang, F. The production and application of hydrogen in steel industry. Int. J. Hydrogen Energy 2021, 46, 10548–10569. [Google Scholar] [CrossRef]
  2. Oliveira, A.M.; Beswick, R.R.; Yan, Y. A green hydrogen economy for a renewable energy society. Curr. Opin. Chem. Eng. 2021, 33, 100701. [Google Scholar] [CrossRef]
  3. Kumar, S.S.; Himabindu, V. Hydrogen production by PEM water electrolysis—A review. Mater. Sci. Energy Technol. 2019, 2, 442–454. [Google Scholar] [CrossRef]
  4. Falcão, D.; Pinto, A. A review on PEM electrolyzer modelling: Guidelines for beginners. J. Clean. Prod. 2020, 261, 121184. [Google Scholar] [CrossRef]
  5. Olivier, P.; Bourasseau, C.; Bouamama, B. Dynamic and multiphysic PEM electrolysis system modelling: A bond graph approach. Int. J. Hydrogen Energy 2017, 42, 14872–14904. [Google Scholar] [CrossRef]
  6. Majumdar, A.; Haas, M.; Elliot, I.; Nazari, S. Control and control-oriented modeling of PEM water electrolyzers: A review. Int. J. Hydrogen Energy 2023, 48, 30621–30641. [Google Scholar] [CrossRef]
  7. van der Merwe, J.; Uren, K.; van Schoor, G.; Bessarabov, D. Characterisation tools development for PEM electrolysers. Int. J. Hydrogen Energy 2014, 39, 14212–14221. [Google Scholar] [CrossRef]
  8. Martinson, C.; van Schoor, G.; Uren, K.; Bessarabov, D. Characterisation of a PEM electrolyser using the current interrupt method. Int. J. Hydrogen Energy 2014, 39, 20865–20878. [Google Scholar] [CrossRef]
  9. Han, B.; Steen, S.M., III; Mo, J.; Zhang, F.Y. Electrochemical performance modeling of a proton exchange membrane electrolyzer cell for hydrogen energy. Int. J. Hydrogen Energy 2015, 40, 7006–7016. [Google Scholar] [CrossRef]
  10. Zhang, H.; Su, S.; Lin, G.; Chen, J. Efficiency Calculation and Configuration Design of a PEM Electrolyzer System for Hydrogen Production. Int. J. Electrochem. Sci. 2012, 7, 4143–4157. [Google Scholar] [CrossRef]
  11. Selamet, F.; Becerikli, F.; Mat, M.D.; Kaplan, Y. Development and testing of a highly efficient proton exchange membrane (PEM) electrolyzer stack. Int. J. Hydrogen Energy 2011, 36, 11480–11487. [Google Scholar] [CrossRef]
  12. Guilbert, D.; Papakonstantinou, G. Modeling, Degradation Study, Failures Diagnosis and Faulty Operating Management of Electrolyzers. Membranes 2022, 12, 1195. [Google Scholar] [CrossRef] [PubMed]
  13. Immerz, C.; Schweins, M.; Trinke, P.; Bensmann, B.; Paidar, M.; Bystroň, T.; Bouzek, K.; Hanke-Rauschenbach, R. Experimental characterization of inhomogeneity in current density and temperature distribution along a single-channel PEM water electrolysis cell. Electrochim. Acta 2018, 260, 582–588. [Google Scholar] [CrossRef]
  14. Lee, J.K.; Lee, C.; Fahy, K.F.; Zhao, B.; LaManna, J.M.; Baltic, E.; Jacobson, D.L.; Hussey, D.S.; Bazylak, A. Critical Current Density as a Performance Indicator for Gas-Evolving Electrochemical Devices. Cell Rep. Phys. Sci. 2020, 1, 100147. [Google Scholar] [CrossRef]
  15. Maier, M.; Smith, K.; Dodwell, J.; Hinds, G.; Shearing, P.; Brett, D. Mass transport in PEM water electrolysers: A review. Int. J. Hydrogen Energy 2022, 47, 30–56. [Google Scholar] [CrossRef]
  16. Dedigama, I.; Angeli, P.; Ayers, K.; Robinson, J.; Shearing, P.; Tsaoulidis, D.; Brett, D. In situ diagnostic techniques for characterisation of polymer electrolyte membrane water electrolysers—Flow visualisation and electrochemical impedance spectroscopy. Int. J. Hydrogen Energy 2014, 39, 4468–4482. [Google Scholar] [CrossRef]
  17. Tomić, A.Z.; Pivac, I.; Barbir, F. A review of testing procedures for proton exchange membrane electrolyzer degradation. J. Power Sources 2023, 557, 232569. [Google Scholar] [CrossRef]
  18. Lu, X.; Du, B.; Zhou, S.; Zhu, W.; Li, Y.; Yang, Y.; Xie, C.; Zhao, B.; Zhang, L.; Song, J.; et al. Optimization of power allocation for wind-hydrogen system multi-stack PEM water electrolyzer considering degradation conditions. Int. J. Hydrogen Energy 2023, 48, 5850–5872. [Google Scholar] [CrossRef]
  19. Hauer, K.-H.; Potthast, R.; Wüster, T.; Stolten, D. Magnetotomography—A new method for analysing fuel cell performance and quality. J. Power Sources 2005, 143, 67–74. [Google Scholar] [CrossRef]
  20. Plait, A.; Dubas, F. A 2D Multi-Layer Model to Study the External Magnetic Field Generated by a Polymer Exchange Membrane Fuel Cell. Mathematics 2022, 10, 3883. [Google Scholar] [CrossRef]
  21. Lustfeld, H.; Reißel, M.; Schmidt, U.; Steffen, B. Reconstruction of Electric Currents in a Fuel Cell by Magnetic Field Measurements. J. Fuel Cell Sci. Technol. 2009, 6, 021012. [Google Scholar] [CrossRef]
  22. Nasu, T.; Matsushita, Y.; Okano, J.; Okajima, K. Study of Current Distribution in PEMFC Stack Using Magnetic Sensor Probe. J. Int. Counc. Electr. Eng. 2012, 2, 391–396. [Google Scholar] [CrossRef]
  23. Le Ny, M.; Chadebec, O.; Cauffet, G.; Dedulle, J.-M.; Bultel, Y.; Rosini, S.; Fourneron, Y.; Kuo-Peng, P. Current Distribution Identification in Fuel Cell Stacks From External Magnetic Field Measurements. IEEE Trans. Magn. 2013, 49, 1925–1928. [Google Scholar] [CrossRef]
  24. Ifrek, L.; Chadebec, O.; Rosini, S.; Cauffet, G.; Bultel, Y.; Bannwarth, B. Fault Identification on a Fuel Cell by 3-D Current Density Reconstruction From External Magnetic Field Measurements. IEEE Trans. Magn. 2019, 55, 1–5. [Google Scholar] [CrossRef]
  25. Akimoto, Y.; Shibata, M.; Tsuzuki, Y.; Okajima, K.; Suzuki, S.-N. In-situ on-board evaluation and control of proton exchange membrane fuel cells using magnetic sensors. Appl. Energy 2023, 351, 121873. [Google Scholar] [CrossRef]
  26. Katou, T.; Gotoh, Y.; Takahashi, N.; Izumi, M. Measurement technique of distribution of power generation current using static magnetic field around polymer electrolyte fuel cell by 3D inverse problem FEM. Mater. Trans. 2012, 53, 279–284. [Google Scholar] [CrossRef]
  27. Yamanashi, R.; Gotoh, Y.; Izumi, M.; Nara, T. Evaluation of generation current inside membrane electrode assembly in polymer electrolyte fuel cell using static magnetic field around fuel cell. ECS Trans. 2015, 65, 219–226. [Google Scholar] [CrossRef]
  28. Plait, A.; Dubas, F. Experimental validation of a purely analytical model dedicated to fuel cell diagnosis. Int. J. Hydrogen Energy 2024, 67, 888–897. [Google Scholar] [CrossRef]
  29. Plait, A.; Giurgea, S.; Hissel, D.; Espanet, C. New magnetic field analyzer device dedicated for polymer electrolyte fuel cells noninvasive diagnostic. Int. J. Hydrogen Energy 2020, 45, 14071–14082. [Google Scholar] [CrossRef]
  30. Plait, A.; Dubas, F. Improvement of fuel cell diagnosis by magneto-tomography with magnetic field concentration. In Proceedings of the 11th International Conference on Computation in Electromagnetics (CEM2023), Cannes, France, 11–14 April 2023. [Google Scholar]
  31. Tikhonov, A.N. Solution of incorrectly formulated problems and the regularization method. Sov. Math. Dokl. 1963, 4, 1035–1038, English translation: Dokl. Akad. Nauk. SSSR 1963, 151, 501–504. [Google Scholar]
  32. Asensor Technology AB. Linear High Precision Analog Hall Sensors. Available online: https://www.asensor.eu (accessed on 8 November 2022).
Figure 1. Electrolyzer schematic representation [11].
Energies 17 04135 g001
Figure 2. Electrolyzer cell discretization and measurement.
Energies 17 04135 g002
Figure 3. Global 2-D plan electrolyzer integrating micro-Hall effect sensor positions.
Energies 17 04135 g003
Figure 4. General layout of the magnetic analyzer configuration.
Energies 17 04135 g004
Figure 5. Micro-Hall effect sensor placed in the white support with regular slots.
Energies 17 04135 g005
Figure 6. Electrolyzer emulator and magnetic measurement support ((left): front view and (right): top view).
Energies 17 04135 g006
Figure 7. State of the bipolar plate representation for (a) a healthy electrolyzer and (b) an electrolyzer failure of a sixteenth.
Energies 17 04135 g007
Figure 8. Magnetostatic modeling on FEMM software and equipotential lines of (a) a healthy electrolyzer and (b) an electrolyzer failure of a sixteenth.
Energies 17 04135 g008
Figure 9. Comparison of the magnetic field for (a) healthy electrolyzer and (b) failing electrolyzer.
Energies 17 04135 g009
Figure 10. Algorithm for determining the current density distribution.
Energies 17 04135 g010
Figure 11. Results obtained on the electrolyzer emulator with (a) current profile and (b) reconstructed distribution.
Energies 17 04135 g011
Figure 12. Results obtained on the electrolyzer emulator with (a) current profile and (b) reconstructed distribution.
Energies 17 04135 g012
Disclaimer/Publisher’s Note: The statements, opinions and data contained in all publications are solely those of the individual author(s) and contributor(s) and not of MDPI and/or the editor(s). MDPI and/or the editor(s) disclaim responsibility for any injury to people or property resulting from any ideas, methods, instructions or products referred to in the content.