Article

Analysis of the Restoration of Distribution Substations: A Case Study of the Central–Western Division of Mexico

by
Carlos Sánchez-Ixta
1,2,
Juan Rodrigo Vázquez-Abarca
1,
Luis Bernardo López-Sosa
3,* and
Iman Golpour
4
1
División Centro Occidente, Distribución, Comisión Federal de Electricidad, Calzada Ventura Puente No. 1653, Colonia Electricistas, Morelia C.P. 58290, Michoacán, Mexico
2
Maestría en Ciencias para la Ingeniería Energética, Posgrados, Universidad Tecnológica de la Construcción, Nicolás Ballesteros 1200, Ciudad Industrial 4a Etapa, Morelia C.P. 58200, Michoacán, Mexico
3
Dirección Académica, Universidad Intercultural Indígena de Michoacán, Carretera Pátzcuaro-Huecorio Km 3, Pátzcuaro C.P. 61614, Michoacán, Mexico
4
Department of Energy Engineering, National Distance Education University—UNED, C/Juan del Rosal 12, 28040 Madrid, Spain
*
Author to whom correspondence should be addressed.
Energies 2024, 17(16), 4154; https://doi.org/10.3390/en17164154
Submission received: 18 July 2024 / Revised: 15 August 2024 / Accepted: 19 August 2024 / Published: 21 August 2024
(This article belongs to the Section F2: Distributed Energy System)

Abstract

:
The studies on strategies for improving restoration times in electrical distribution systems are extensive. They have theoretically explored the application of mathematical models, the implementation of remotely controlled systems, and the use of digital simulators. This research aims to connect conceptual studies and the implementation of improvements and impact assessment in electrical distribution systems in developing countries, where distribution technologies vary widely, by employing a comprehensive methodology. The proposed research examines the restoration times for faults in substations within general distribution networks in the central–western region of Mexico. The study comprises these stages: (a) diagnosing the electrical supply, demand, and infrastructure; (b) analyzing the electrical restoration time and the restoration index of the substations; and (c) providing recommendations and implementing pilot tests for improvements in the identified critical substations. The results revealed 12 analysis zones, including 120 distribution substations, 150 power transformers, and 751 medium voltage circuits. Among the substations, 73% have ring connections, 15% have TAP connections, and 12% have radial connections. Additionally, 27% of the substations rely on only a single distribution line. The study identified areas with significant challenges in restoring electricity supply, particularly focusing on power transformers: 32 transformers with permanent power line failures requiring load transfer via medium voltage; 67 transformers requiring optimized restoration maneuvers due to specific characteristics; and 4 areas with opportunities to enhance the reliability of the power supply through remote-controlled link systems. The analysis resulted in the installation of 145 remote link systems, which improved restoration rates by over 40%. This approach is expected to be replicated throughout Mexico to identify improvements needed in the national distribution system.

1. Introduction

The reliability of electrical systems is a critical factor in ensuring the continuous and safe supply of electricity to users. The system average interruption duration index (SAIDI) plays a vital role in assessing and improving the quality of electrical service [1,2,3]. This index provides quantifiable measures on the frequency and duration of power interruptions, enabling utilities to identify areas for improvement and optimize their operations [4,5,6]. The effective implementation of these key performance indicators in the management of electrical systems enables energy companies to monitor and improve the reliability of supply while ensuring compliance with international regulations and standards that require minimum levels of electrical service quality. For instance, regulators in numerous countries use SAIDI as a key parameter to evaluate utility performance, set tariffs, and establish incentive or penalty policies [7,8].
Moreover, transparency and effective communication of these indices to consumers are essential for maintaining public confidence in the electricity system. Energy providers that consistently disclose their performance indicators and actively work to enhance SAIDI demonstrate a strong commitment to service quality and customer satisfaction. This transparency also facilitates comparisons among different service providers and encourages competition, ultimately leading to improvements in the overall quality of electricity supply [9].
SAIDI is a crucial indicator for assessing the reliability of electrical distribution networks worldwide. Research has shown that SAIDI values vary significantly across regions, reflecting diverse challenges and infrastructure capabilities. In the United States, the Energy Information Administration (EIA) reported that in 2019, the average interruption duration per customer was nearly five hours, indicating a significant need for improvements in the electric grid to enhance reliability and customer satisfaction [10]. In Africa, a World Bank study highlighted the variability in SAIDI values among different countries, emphasizing disparities in infrastructure and the urgent need for investment in more reliable electrical systems [11]. The study found that transmission companies in some African nations reported SAIDI values exceeding 20 h per year, with extreme cases reaching up to 150 h, reflecting significant challenges in maintaining a continuous electricity supply [11]. In contrast, in Europe, the 7th CEER-ECRB Benchmarking Report on the Quality of Electricity and Gas Supply 2022 indicated that countries like Switzerland and Finland reported annual average SAIDI values of around 10 min, while most other European Union countries had values often below one hour per year, thanks to their advanced grid technologies and efficient maintenance practices [12]. This stark contrast with other regions underscores the importance of technological advancements and proactive maintenance in achieving shorter interruption durations. In Latin America, the recent annual average SAIDI per user is approximately 25 h [13], with notable variations between urban and rural areas and differences across countries in the region. These findings emphasize the need for region-specific strategies and investments in network infrastructure to improve SAIDI values globally. The alternatives for reducing SAIDI are varied, ranging from identifying technological improvements in distribution services [14], developing mathematical models to identify supply failures [15] promptly, and incorporating renewable energy sources to enhance service efficiency [16]. Ongoing research and international collaboration are essential for developing innovative solutions that can improve the reliability and efficiency of electrical distribution networks worldwide.
Quality indicators such as SAIDI are crucial for evaluating and improving the reliability of electrical systems, particularly in delivering electricity to users. These indicators depend on various components within electrical energy distribution systems [17,18]. From distribution buses and circuits to switches and power transformers, each component plays a vital role in maintaining the uninterrupted delivery of electrical services. When any of these components fail, electrical systems must have contingency plans ready to swiftly restore the electricity supply [19]. Consequently, ensuring a reliable electricity supply requires the proper functioning of all components and the availability of effective and efficient alternatives for service restoration.
Several strategies have been proposed to shorten restoration times, including the use of specialized algorithms [20,21], the integration of smart city initiatives [22,23], and advanced solutions such as utilizing electric vehicles [24]. These approaches improve the efficiency of restoring electrical service. In this context, analyzing distribution problems is vital for maintaining service quality. Ongoing monitoring of distribution networks, power transformers, substations, and switches is key to effectively addressing unexpected interruptions in electrical service [25].
Power transformers are critical to the quality of distribution systems and have been extensively studied over the years [26]. The failure rate is a crucial reliability metric for power transformers, with failures typically classified into two types: repairable random failures and non-repairable aging failures [27,28]. Random failures, which are influenced by various factors such as weather conditions and interactions with local vegetation and wildlife, are relatively common [29]. Aging failures, on the other hand, develop gradually due to stress factors like oil leakage, overloads, and prolonged unbalanced loads. This uncertainty, along with the time-dependent nature, contributes to variability in aging-related failure rates [27,30].
Distribution systems are vital for delivering electric power to all users [31]. Failures in these systems are common [32,33] and are often associated with incidents involving objects that interfere with the transmission network. Addressing these failures necessitates a range of improvement strategies, meticulously planned to swiftly restore electric service.
It is important to recognize that various factors in each country affect the time required to restore power systems following an incident. These factors include geographical regions prone to natural phenomena [34], the state of existing infrastructure [35], and the management systems employed by different suppliers [36,37]. Consequently, proposing a universal solution for improving all energy supply systems in a cost-effective and replicable manner is impractical, given the significant variations in conditions across countries and energy service providers.
Given the diverse conditions in electrical energy distribution systems and the rising incidence of failures in Mexico, it is essential to develop strategies to address the underlying issues causing these problems. While improving communication throughout the distribution system, reducing restoration times, and optimizing service to enhance quality indicators are important steps [38], it is equally essential to ensure the efficient operation of tasks performed by users in both the private and public sectors who depend on electrical energy.
In the literature, various studies have been reported on strategies to improve power restoration times in various distribution networks [39,40]. The use of mathematical models [41], the implementation of remotely controlled systems [42], the deployment of software and remotely controlled switching devices [43], and digital simulators [44] are strategies that have been undertaken in recent years to enhance service quality and improve quality indicators such as SAIDI. However, integrating comprehensive processes that materialize proposals from research and implementing improvement initiatives in power distribution systems is complex. It is often challenging to articulate diagnostics and process databases from power service providers to identify faults in distribution networks. Identifying areas for improvement, implementing defined strategies, and effectively monitoring the impacts of these actions is not always feasible. In these cases, a collaborative approach involving multidisciplinary teams and multisectoral strategies is required. This approach should include electricity service providers, distribution specialists, and adequate financial resources to implement and sustain improvements. Additionally, it must maintain an endogenous perspective, monitoring distribution systems both before and after the implementation of strategies. In this regard, this research aims to bridge the gap between theoretical research and practical application by employing a comprehensive methodology to implement improvements and measure their impact in the electrical distribution systems of developing countries, where distribution technologies vary widely.
This study aims to establish standardized restoration times for transformer bank trips at substations in the central–western division of Mexico. It involves evaluating the performance of control center operators based on fault types, identifying improvement opportunities in distribution areas across various substations and circuits to enhance emergency response, and proposing strategies for improving the national electric power distribution system. Additionally, the research seeks to pilot these improvement strategies and assess their potential for replication across Mexico.

2. Methodology

This study was conducted in collaboration with the Divisional Control Centre (DCC) of the Federal Electricity Commission (FEC). The FEC is organized into several regional divisions, including the central–western division of Mexico (CWD), which provides service users across three states of the republic. The analysis focused on these states and was carried out using the methodology outlined in Figure 1.
The methodology comprises the following components:
(a)
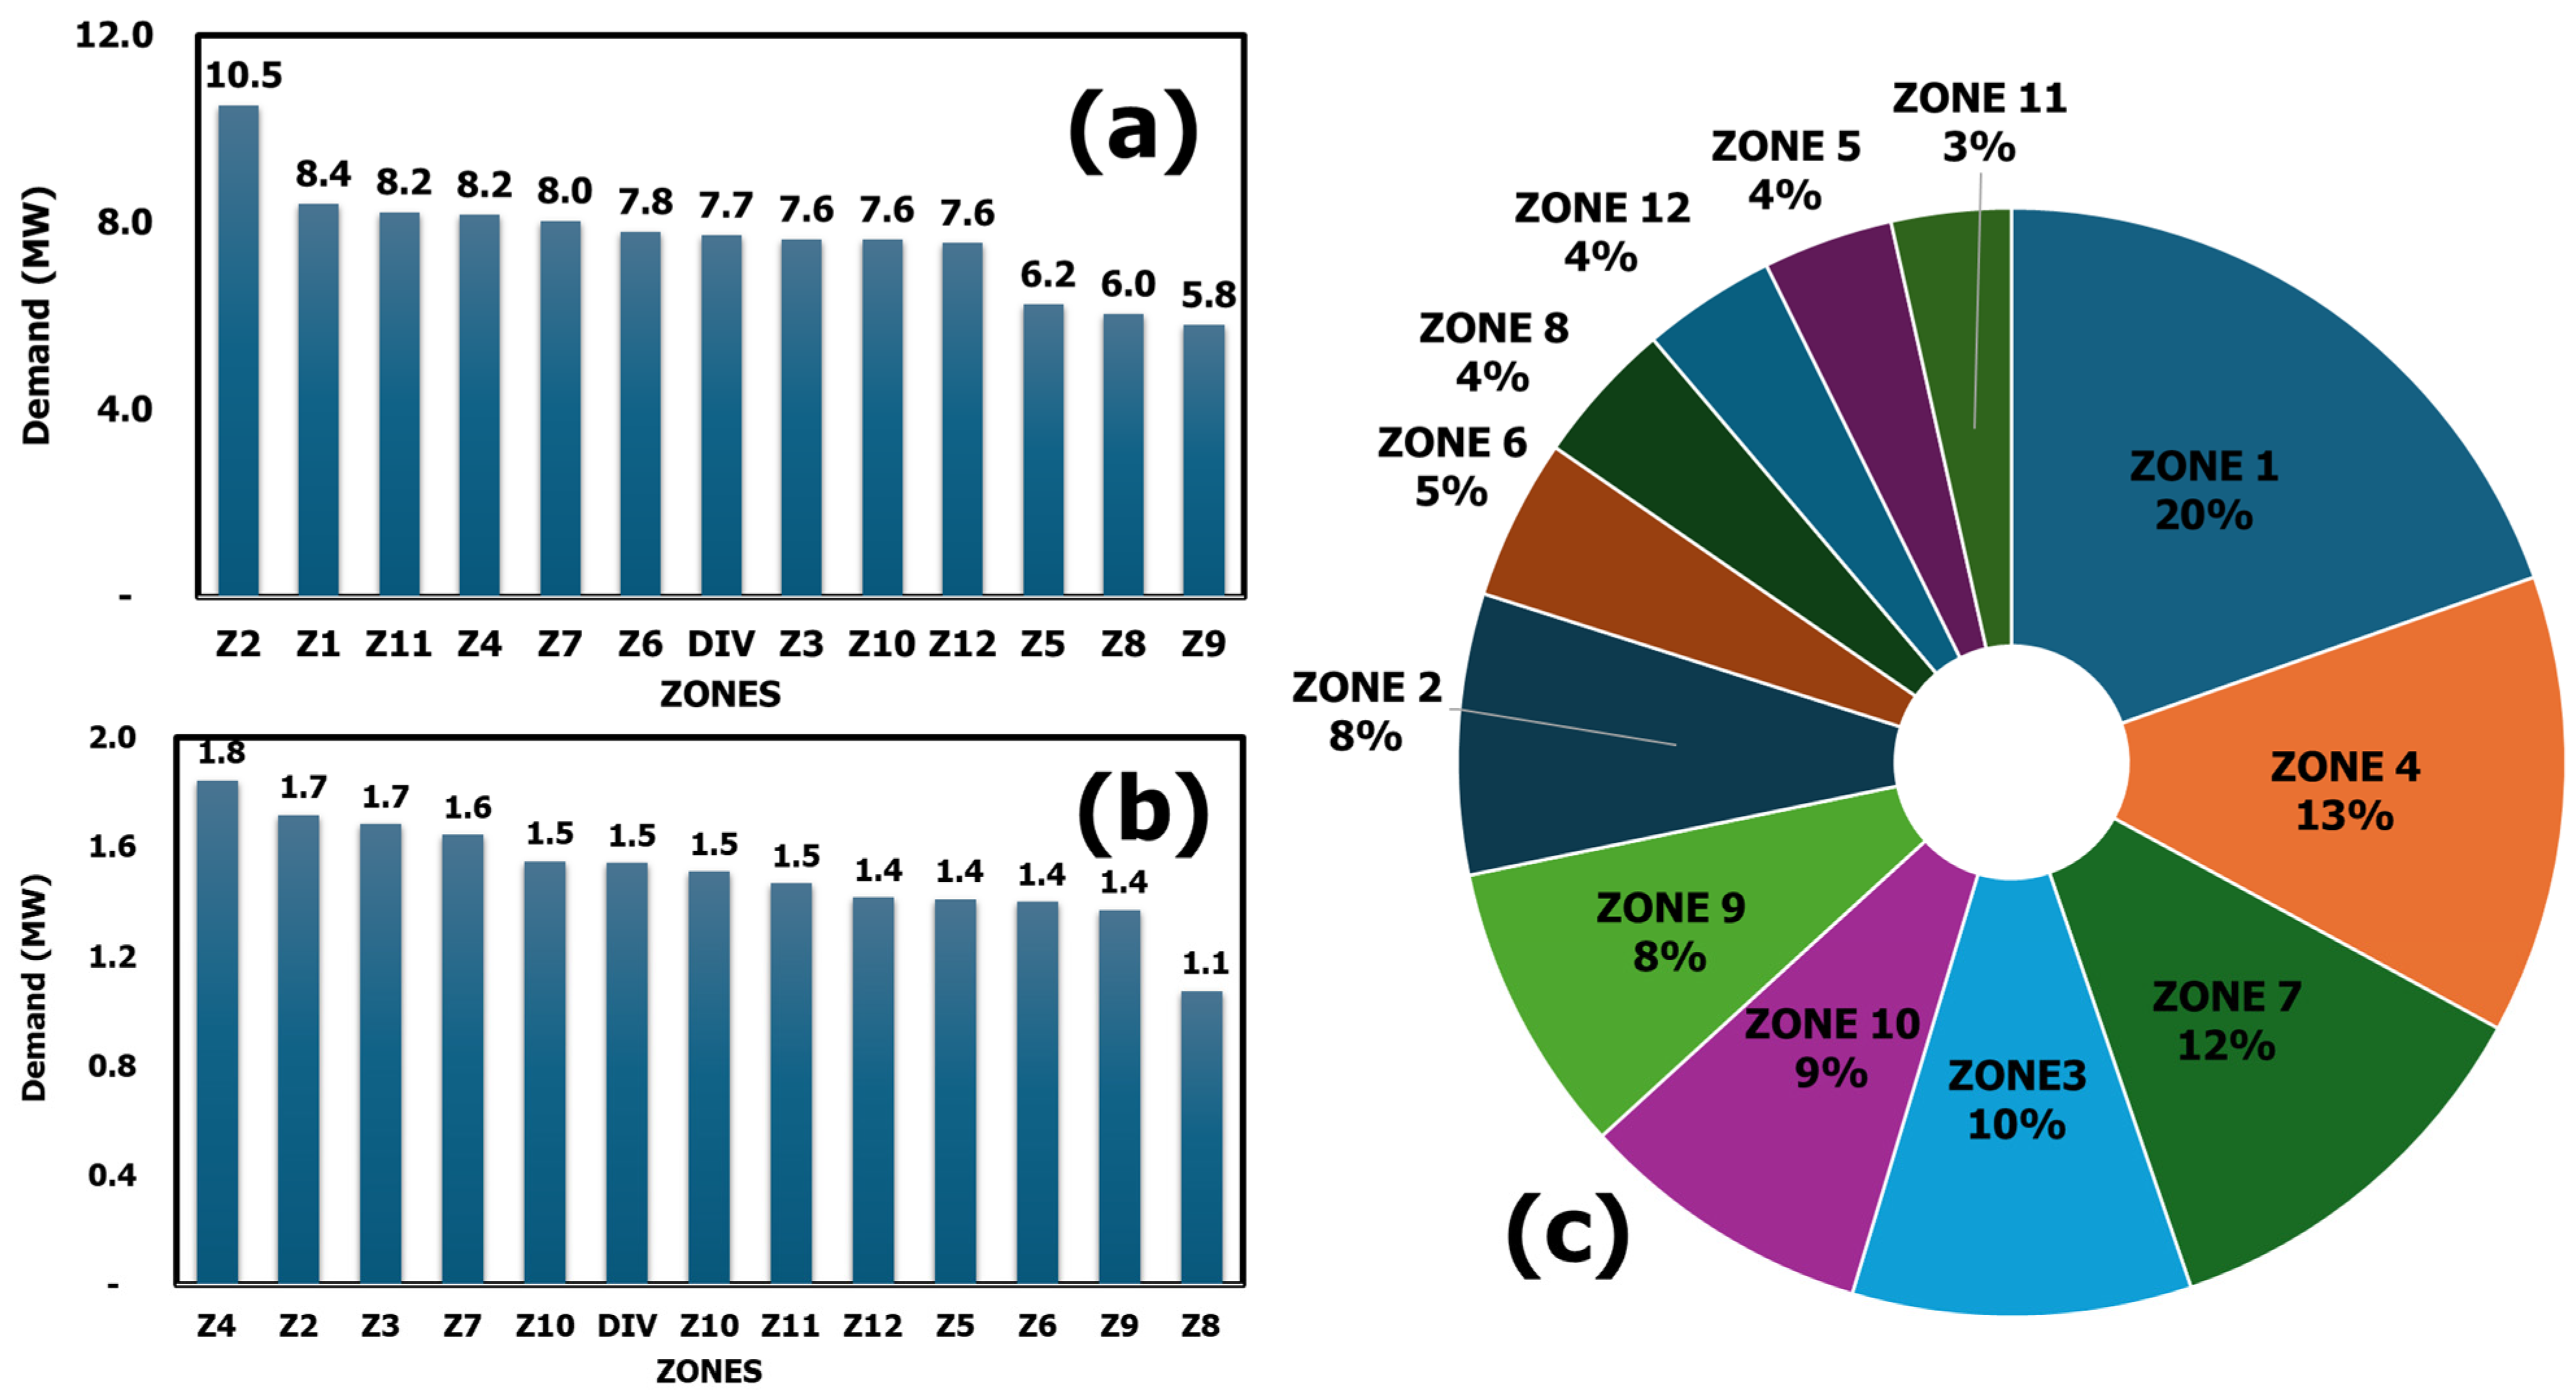
A comprehensive assessment of the existing infrastructure in the central–western division was performed. This included using the FEC inventory to identify all substations, transformers, and circuits within the CWD. Distribution zones were also established, with data collected on the number of users in each zone and their respective energy requirements.
(b)
To estimate restoration times for faults occurring in the substations of the general distribution networks (GDN), two primary scenarios were considered:
  • Scenario 1: Restoration time following a primary protection operation failure, which makes the power transformer unavailable until it undergoes inspection for faults (transformer failure).
  • Scenario 2: Restoration time in the event of a bus failure during the operation of the power transformer’s low-side switch, causing the low-side bus to become unavailable (distribution bus failure). In this scenario, minimizing downtime and promptly restoring service is crucial.
These scenarios were grouped to cover the majority of faults that could occur in a distribution substation, allowing for operational segmentation to analyze the estimated load restoration times, as illustrated in Figure 1b.
Based on these scenarios, specific variables were defined to develop an algorithm for estimating the restoration time of the power transformer (RTS), considering the high- and low-voltage topology of the substations. Equation (1) describes the calculation of RTS. These variables were determined using historical data on substation failures from the past five years, provided by the FEC DCC. Specifically, the key variables include the maneuver time based on the number of circuits (TNC) and the restoration time according to the circuit topology (TCT):
  • TNC: This variable considers the number of circuits connected to the power transformer and determines the baseline time required for remote-control testing maneuvers on the de-energized distribution bus, as well as the analysis of current alarms. This average time is derived from the analysis of substation faults over the past five years, categorized into three types as outlined in Table 1. Each type is visually depicted in Figure 1c.
  • TCT: This variable considers the topology of each circuit in the network, including the number and type of connections supporting the affected loads. It also incorporates data on the frequency of substation failures over the past five years to calculate the average time required for operators to perform restoration maneuvers. These maneuvers may involve using remote-controlled equipment or manual disconnection tools with assistance from field staff. As a result, this variable is classified into four categories, as detailed in Table 2.
The estimation of RTS is derived from the previously mentioned variables, with a specific time determined for each circuit. The total substation restoration time is calculated by summing these times for all circuits, as outlined in Equation (1). This information proves invaluable in scenarios involving substation failures, providing insight into the minimum duration required for restoration.
RTS = TNC + TCT
To calculate the restoration level index (IR) of the power transformers in the distribution substations, three variables are considered. Each variable is weighted based on the overall restoration index for each power transformer:
-
CCB: This variable accounts for the number of circuits in the power transformer, categorized into three classes (Table 3).
-
TS: This variable considers the topology of the substation within the national transmission network (NTN), as detailed in Table 4.
-
RTS: This variable assesses the restoration time of each substation, based on the duration of international indicators like SAIDI, categorized as shown in Table 5.
Based on these criteria, the IR index is calculated using Equation (2). This index evaluates the restoration complexity of each substation, with a maximum weight of 10 assigned to the most challenging substations. These are the substations that require detailed analysis to reduce their complexity through upgrades and reconfigurations of network equipment. Substations with a weight of 4 are indicative of faster restoration processes.
IR = CCB + TS + RTS
(c)
The RTS and IR parameters were applied to all identified substations in the CWD. The data were analyzed and categorized into three groups: substations with transformers experiencing persistent faults, substations where maneuver enhancements were implemented, and substations identified with significant opportunities for integrating remote-controlled technologies.
Lastly, the SAIDI for the last four years was comparatively estimated using Equation (3) [31]:
S A I D I = i = 1 n t i u i N
where ti represents the duration of each interruption, ui denotes the number of users affected by each interruption, n stands for the number of interruptions, and N represents the number of users in the electrical system at the end of the period, if applicable.
The data presented in Table 1, Table 2, Table 3, Table 4 and Table 5 must be sourced from semi-annual technical reports that are part of the analysis of the performance of the distribution networks of the central–western division and the electricity service provider in Mexico. Strategically, this data was integrated to effectively analyze the indices and restoration times using the specified algorithms.

3. Results and Discussion

3.1. Diagnosis of Infrastructure and Demand

Based on the assessment conducted by the DCC, an analysis of the central–western Division (CWD) was carried out, covering 12 zones and identifying 120 distribution substations, 150 power transformers, and 751 medium-voltage circuits. Among all substations analyzed, 73% are equipped with ring connections, 15% with TAP connections, and 12% with radial connections; 27% of the substations rely on a single distribution line. Regarding the circuits, 47% of the analyzed zones have more than six circuits, 37% have between one and four circuits, and 15% have five or six circuits on average. Each substation typically has an average of five circuits. Table 6 provides a detailed zone-wise analysis for the entire CWD. This division serves a total of 2,505,485 users across three states of the Mexican Republic, averaging 16,703 users per substation and 3336 users per circuit. The average demand is 7.7 MW per substation and 1.5 MW per circuit. The average demand per substation for each zone is shown in Figure 2a, while the average demand per circuit per zone is illustrated in Figure 2b. Figure 2c depicts the percentage of total demand for the CWD across different zones.
This analysis provides insights into the distribution of users and electricity demand, which are essential for assessing the potential impact of unforeseen events, such as power supply failures, on users. The results indicate that Zones 1, 2, and 11 have the highest average demand per substation, suggesting that a failure in these areas would lead to significant disruptions in energy supply. Conversely, the number of consumers per zone reflects the scale of the potential impact. A simultaneous failure of substations in Zones 1, 3, and 4 would affect over one million users, nearly half of the total users in the CWD. Understanding the distribution, size, and operational dynamics of each substation and zone is crucial for promptly responding to any incident that may disrupt the supply of electrical energy.

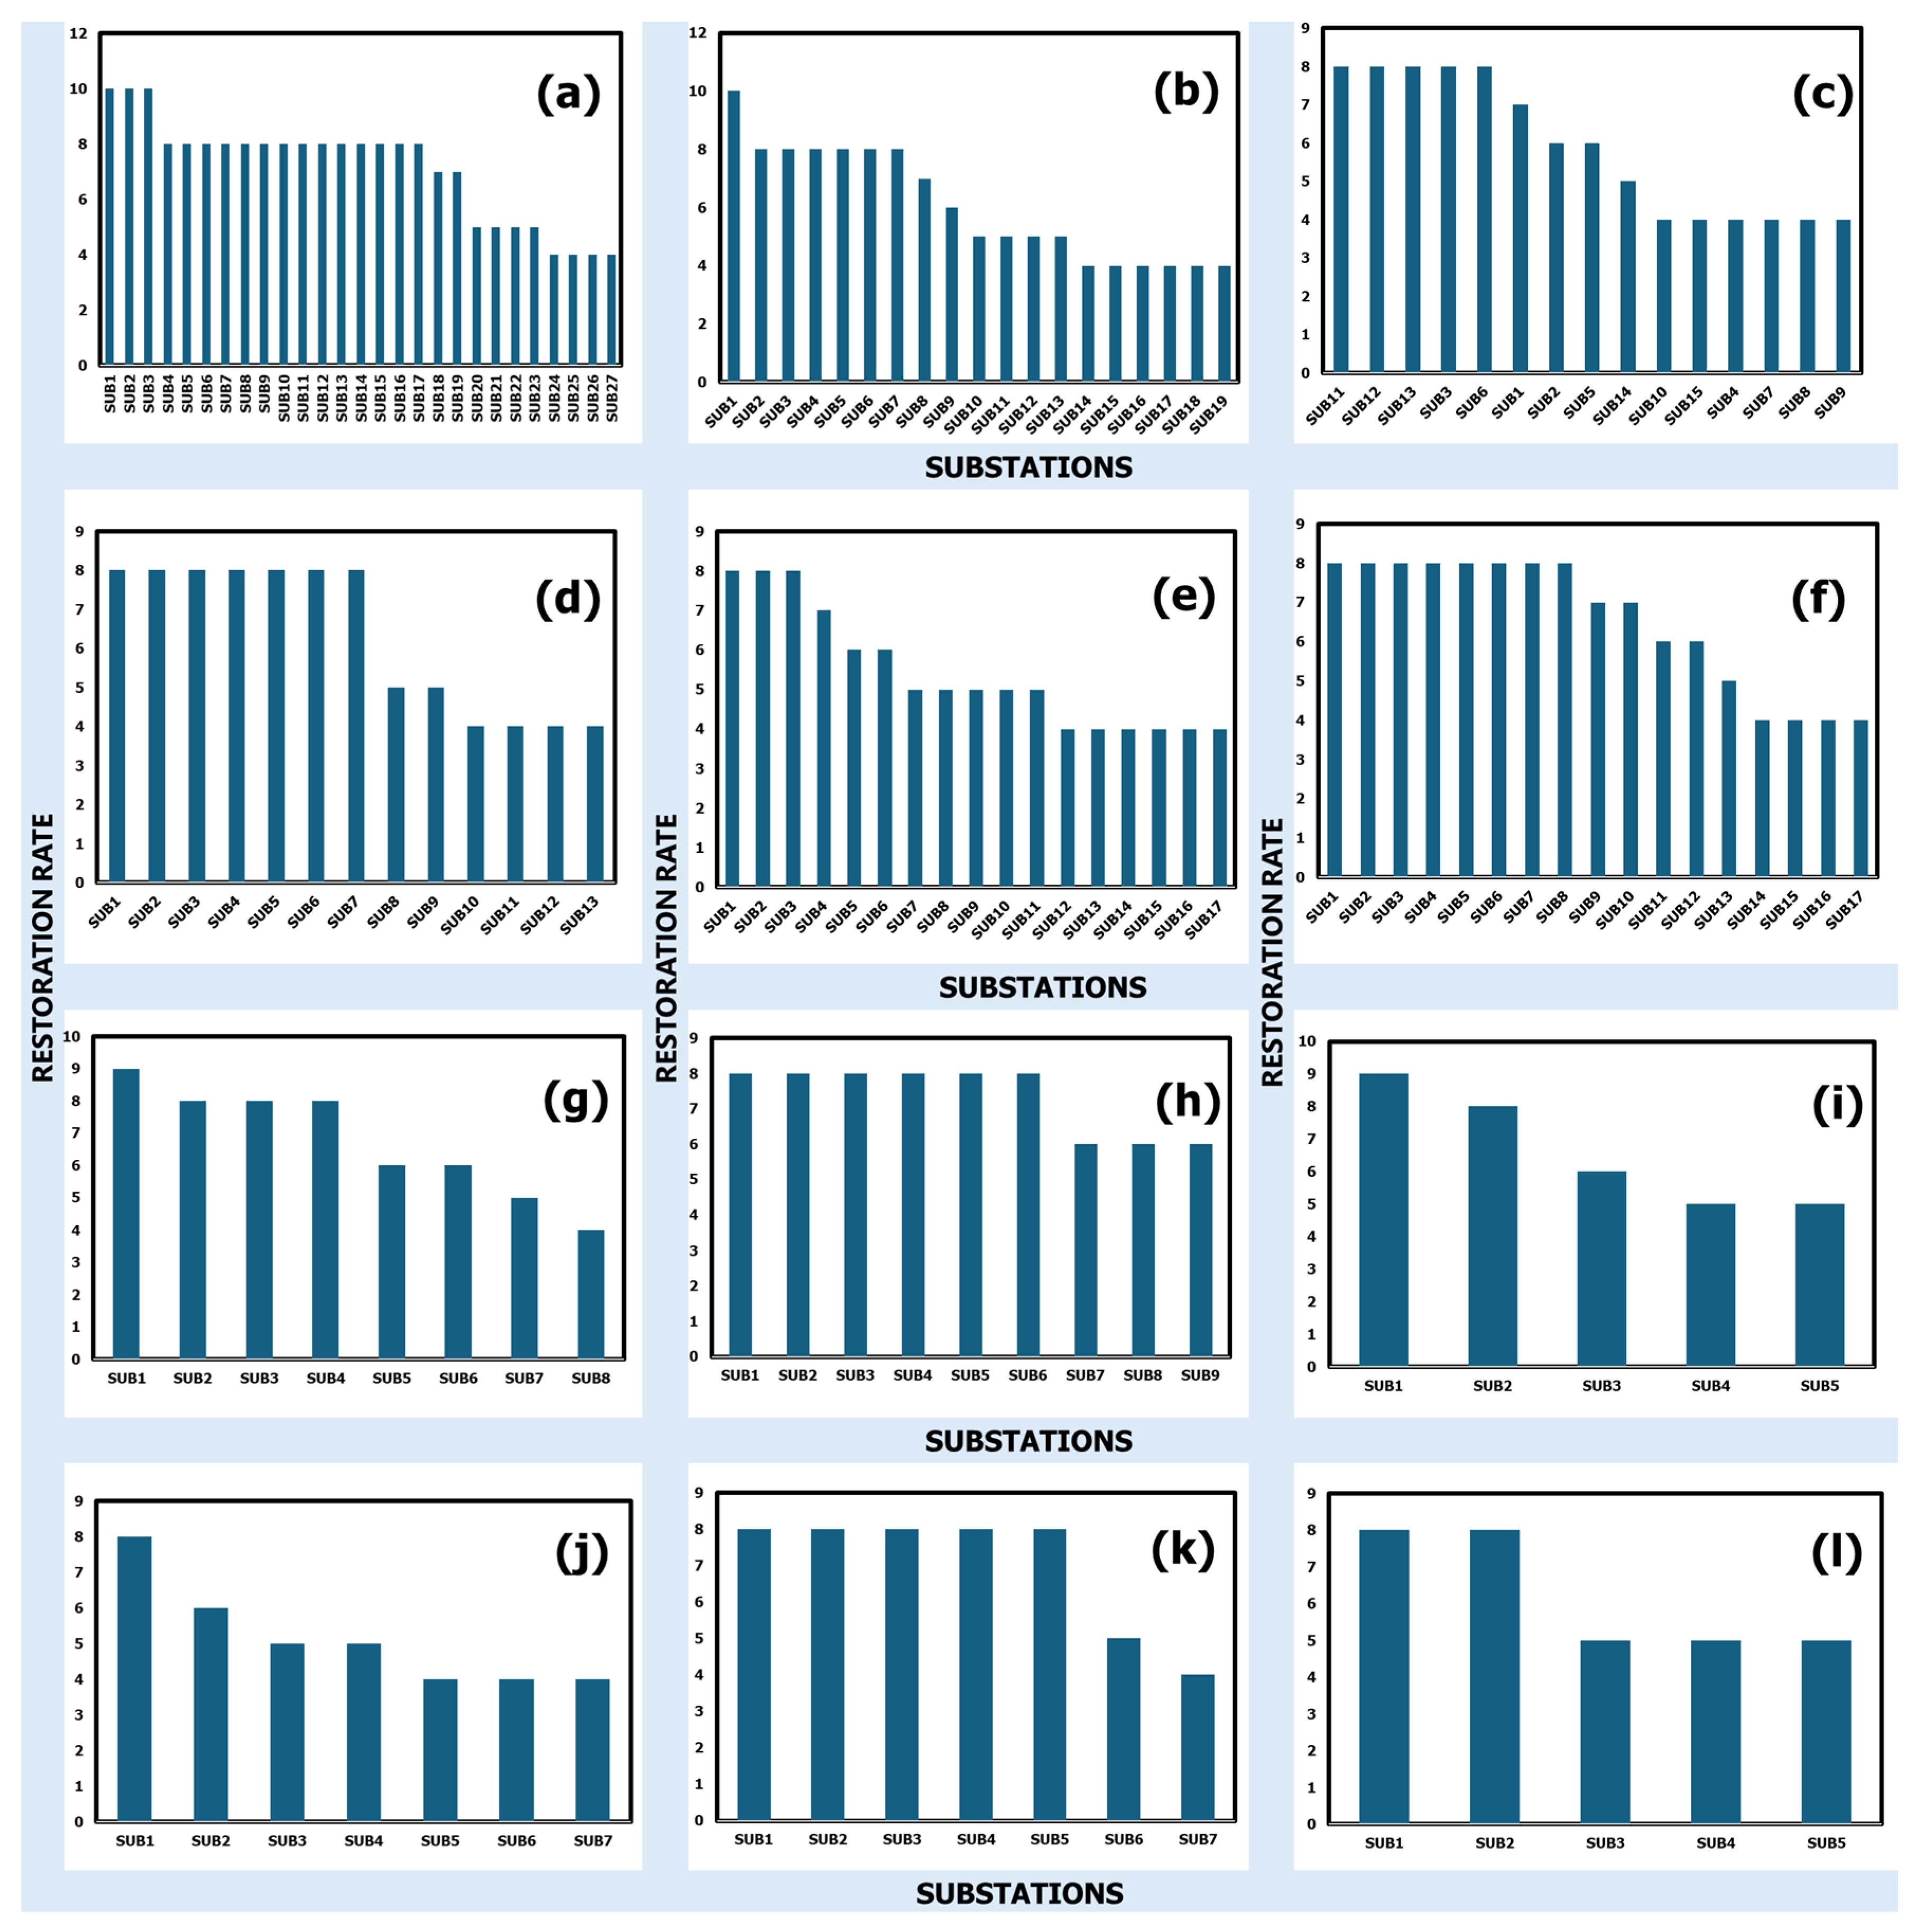
3.2. Estimation of Restoration Rate and Time

Supplementary Materials S1 provides detailed analyses by circuit, configuration, typology, and case studies for each substation and zone. Figure 3 shows the restoration rate results by zone and power transformer, derived from Equation (2). This numerical value of the restoration rate offers a straightforward and illustrative method for identifying which zones and substations require improvements.
It is worth noting that the CWD serves 118 municipalities in western Mexico. Notably, Zones 1, 3, and 4 have the highest user counts across multiple substations, with over 50% of their substations exhibiting a high restoration index (greater than seven), identifying them as critical areas concerning restoration times (see Figure 3). Moreover, Zone 10, despite having fewer users, exhibits notably high restoration rates, indicating significant concerns regarding restoration efficiency.
The analysis of different zones reveals variations in restoration indices and times. Each zone features substations with distinct characteristics, highlighting areas for improvement. Notably, a restoration index of 4 indicates a substation with excellent infrastructure within the distribution network. Under optimal conditions, such a substation would have minimal impact on SAIDI in the event of a power transformer interruption. For higher ratings, substations with scores ranging from 5 to 7 need a detailed analysis of their distribution network topology and the development of necessary tools for their operators. Conversely, substations with ratings above 7 require significant investment in infrastructure and the development of appropriate tools in physical distribution systems.
It is important to highlight that the algorithms used to estimate restoration times and rates consider various aspects of each substation and the analyzed areas. These include maneuver times, circuit types, remote-controlled links, connection topology, and their impact on international quality indicators such as SAIDI. Alongside the analyzed indicators, these factors help identify areas for improvement within each substation and provide tailored recommendations based on their unique characteristics.
Table 7 presents a comprehensive overview of data from all CWD areas related to the analysis of power restoration times and rates. The main findings include:
  • 32 CWD substations: These substations frequently experience permanent faults in their distribution lines and require load transfer via medium voltage. They are typically equipped with TAP or radial connection lines.
  • 67 CWD substations (IR > 7): These substations must improve their restoration maneuvers to enhance service quality and implement improvement projects to reduce their high restoration index as soon as possible.
  • 4 CWD substations: These substations urgently need an analysis to improve their energy supply reliability. Specifically, the implementation of remote linking systems is crucial for achieving more efficient restoration times and rates.
This study has identified the facilities with the greatest potential for improvement and those that pose the most significant challenges for restoration. As a result, guidelines are being developed to address these issues, with a focus on maintenance and integrating these guidelines into the distribution simulator. This approach will be used to train personnel from the DCC and the studied areas within the CWD.
The results of this proposal have been presented to the relevant management area within the Divisional Control Centre (DCC) of the central–western division of Mexico under the FEC. It has been determined that in 2023, an investment will be made in 145 remotely controlled network devices. This investment aims to enhance the performance of substations with the highest restoration rates, thereby improving international indicators, particularly SAIDI, in the event of power transformer failures.
Based on the findings of this research and the implementation of new remote-controlled equipment, SAIDI improvements were achieved in 2023 regarding power supply failures caused by power transformer bank trips, with more than a 40% improvement in load restoration in the event of a failure (Figure 4). These results can be historically compared with the performance of this indicator over the past three years.
Strategies for improving electrical distribution services are diverse, progressive, and continuously evolving. Some studies have proposed a methodology to reduce SAIDI values, allowing for the rapid localization of faults, isolating the damaged network element, and restoring supply to as many users as possible. These methods consider the unique characteristics of mountainous networks and utilize specialized software [15]. Additionally, algorithms for intelligent service restoration have been proposed to optimize the operation of meshed medium-voltage networks after primary substation failures [40]. Software has also been explored to enhance distribution networks and reduce SAIDI [39]. Other projects have incorporated remotely controlled equipment in the electrical network, utilizing algorithms designed to expedite fault resolution, minimize undelivered energy, lower SAIDI, and reduce both the frequency and duration of voltage drops [42].
In this context, the present proposal builds on some of these mentioned experiences but is based on a diagnostic analysis of the existing infrastructure and frequent faults in the general distribution network by substations and areas of interest in the central–western region of Mexico. The strategy involves deploying a higher number of remotely controlled devices at the critical substations with the highest incidence of supply failures. These devices are installed along the circuit path and at connection points to enhance restoration times. This approach has successfully minimized downtime, updated the infrastructure, and established a model for improving other critical areas experiencing failures in the central–western region and the rest of Mexico. While this emergent strategy has demonstrated a reduction in SAIDI following the implementation of remote-controlled systems, it is limited by economic resources and the specific characteristics of the distribution systems in each area. Additionally, effective implementation requires a thorough diagnostic to optimize the placement of these systems in critical areas with prolonged restoration times. Therefore, it cannot be generalized as an optimized functional proposal for all regions of Mexico until each area’s unique situation is assessed.
The economic impacts of disruptions in power distribution are also significant. In Mexico, domestic electricity rates range from $0.026 to $0.093 USD/kWh as of August 2024. Considering a simplified case of low consumption, with an average price of $0.067 USD/kWh for the residential sector, and according to the average annual energy demand [45,46], a cost rate of $0.0004 USD/minute (3260 kWh/year per capita) is considered [47]. Considering an average of 20,000 users per substation, there is an impact of slightly over $8 USD/minute during power supply failures in one of the sectors with the lowest consumption, with extremely low demand ranges. This estimate excludes commercial and industrial users, as well as the considerable losses experienced by the healthcare, government, food, and education sectors. A remotely controlled system costs about $25,000 USD and offers a return on investment equivalent to around 30 min of service interruption across approximately 100 substations. Therefore, an estimation of socioeconomic impacts would highlight the urgent need to reduce service failures, underscoring the scenario that incentivizes improvements in electrical distribution systems.

3.3. Concluding Remarks

Restoration times in distribution systems are influenced by various factors, including the duration required to obtain fault information, process and analyze that information, repair the faults, and re-establish the connection [36]. Although specific algorithms [48,49] and specialized equipment [50] can improve these processes, the complexity of distribution systems and the variability in fault conditions make it difficult to generalize solutions for reducing restoration times. These variables differ by country, reflecting disparities in infrastructure and economic resources for addressing faults.
This research focused on the characteristics of substations within the CWD areas of Mexico, identifying challenges and opportunities for reducing downtime in restoring electricity services. This analysis is critical, as it provides a detailed overview of the unique infrastructure and management processes in electricity distribution, aiming to optimize service quality and improve international quality indicators such as SAIDI. While this study did not directly estimate SAIDI, it is closely related to the estimation of the time to restore service (RTS).
Furthermore, this research is pioneering within Mexico, requiring substantial documentary support and leveraging the expertise of the FEC across various regional perspectives. The proposals for systematizing and managing identified improvements also necessitate institutional backing from the government to facilitate dissemination across other regions in Mexico, presenting a compelling opportunity.
This study has opened avenues for future work, including:
  • Operations handbook: The methodology and management processes outlined in this study can be incorporated into a guidance document aimed at addressing the identified challenges within the FEC framework. This handbook would serve as a repository of procedures based on the proposed improvements. Additionally, establishing a national atlas of restoration times and indices would support the development of a comprehensive national improvement program, organized by division, zone, and substation. This initiative seeks to enhance the overall reliability and efficiency of the electrical distribution network throughout the country.
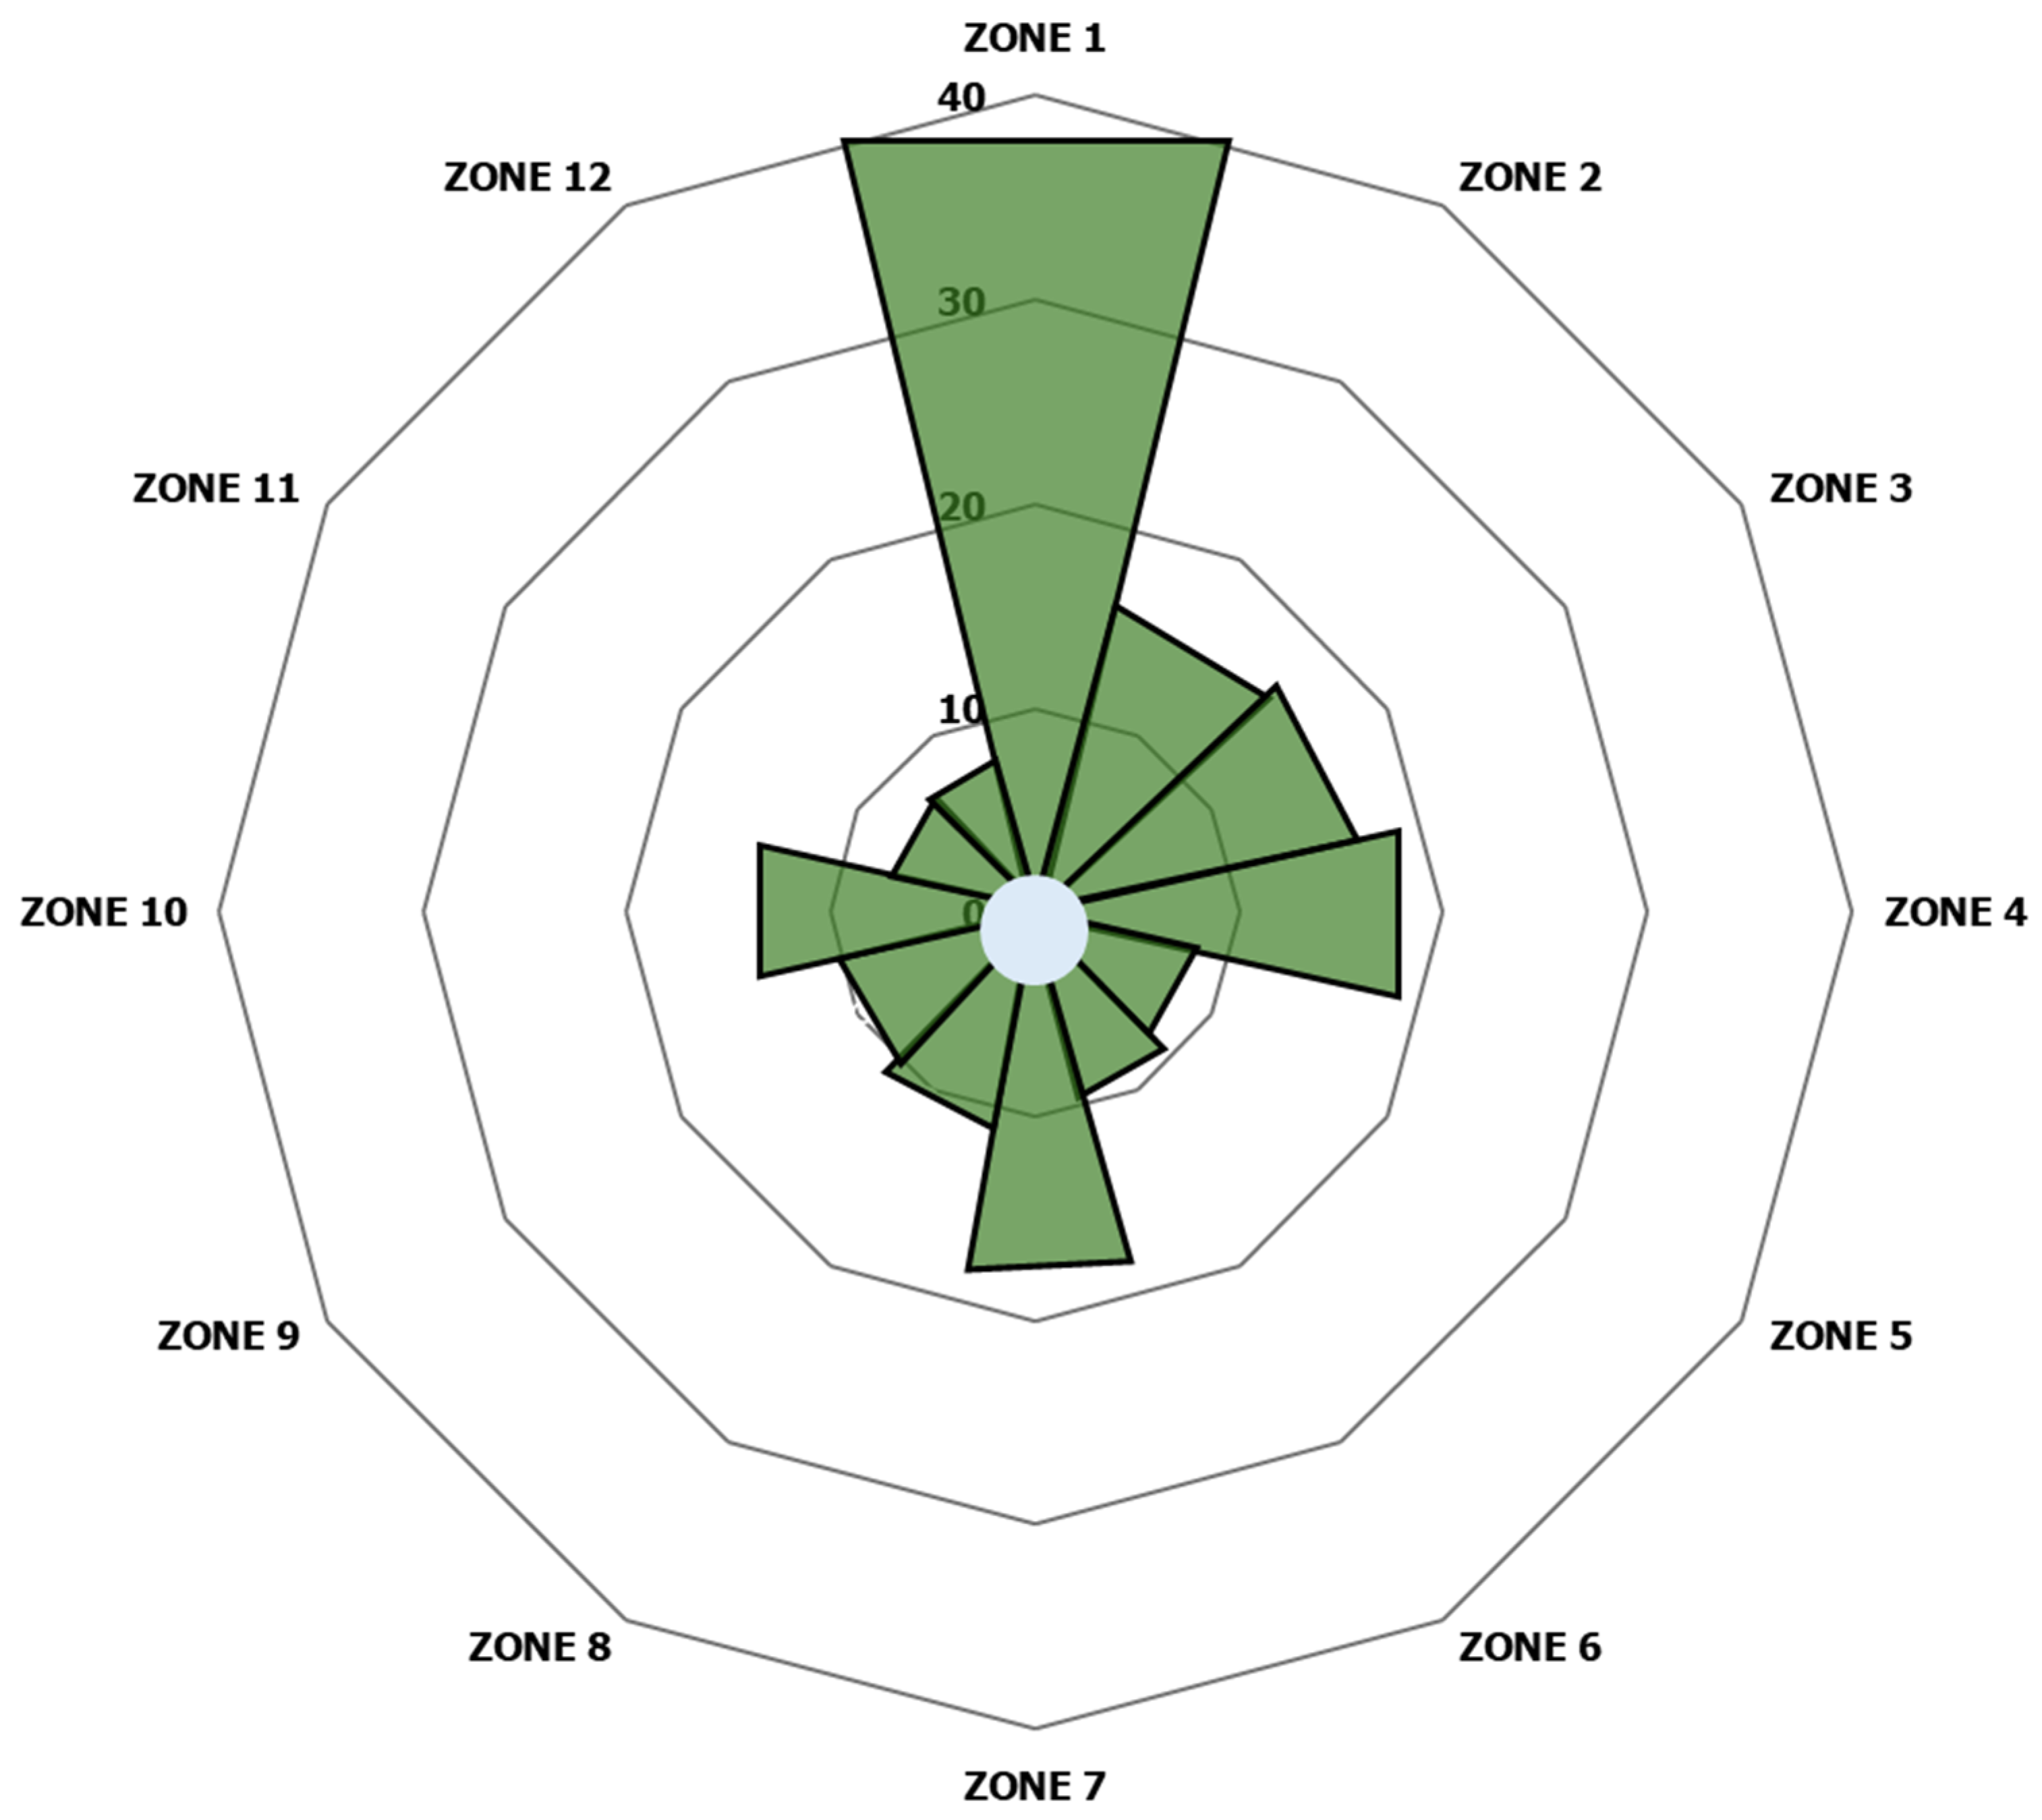
  • Modernization of general distribution networks (GDN): This type of analysis supports improvement plans for enhancing distribution infrastructure by identifying critical needs through priority indices such as substations with the highest IR and the largest number of users. For instance, a simple priority index (PI) could be formulated for each zone with IR values exceeding 8. This index would aggregate the number of substations per zone ( S E I R ) and incorporate the percentage of users within the entire division as an absolute value ( P I = S E I R + %Zone). The resulting numerical value highlights areas requiring priority attention, with larger values indicating substations serving more users (see Figure 5). The implementation of 145 remote units was carried out according to this structured methodology.
  • Improved reliability: An area with adequate infrastructure and stringent maintenance protocols ensures reliable electricity supply conditions for users. Implementing the recommendations from this study could greatly improve the reliability of transmission networks across any region.
  • Evaluation and simulator: The FEC operates a simulator that models the functions and components of the entire national electrical system. This simulator plays a crucial role in the ongoing training and skill enhancement of both current and new personnel, and supporting their career development and advancement. This simulator could optimize the management of processes during periods of restoration and could be expanded to incorporate new areas, such as algorithms and data processing for all departments across Mexico. This expansion would include training scenarios aimed at managing supply failures in various regions, substations, and power transformers nationwide. Additionally, it could integrate tools for analyzing the economic and environmental impacts of restoration times, aligning with international standards for the quality of electrical energy services.

4. Conclusions

Based on the findings presented, this research has identified significant opportunities to improve the reliability and efficiency of electrical distribution networks in the central–western division of Mexico. The study identified 12 zones including 120 distribution substations, 150 power transformers, and 751 medium-voltage circuits. Notably, 27% of the substations rely on a single distribution line.
Three critical zones (Zones 1, 3, and 4) were identified as having the highest average demand per substation, potentially affecting over one million users in the event of simultaneous failures. Specifically, 32 substations require load transfer via medium voltage due to permanent faults, and 67 substations need optimized restoration maneuvers to improve their high restoration indices.
Following the diagnosis of the analyzed zones, the implementation of 145 remote-controlled link systems was recommended and executed, resulting in an improvement of restoration rates by more than 40%, significantly enhancing the system average interruption duration index (SAIDI) for 2023. This demonstrates the effectiveness of the proposed approach, which can be systematically applied throughout Mexico to effectively address and reduce outage durations.
Future works should focus on developing a comprehensive national atlas of restoration times and indices and modernizing the general distribution networks. Establishing a national priority index for substations with high restoration indices and user counts will ensure targeted improvements, ultimately enhancing the overall reliability and efficiency of the electrical distribution network across the country. Additionally, integrating these findings into an operations handbook and utilizing advanced training simulators for personnel working with the power supply provider in Mexico will support ongoing improvements and operational excellence in power supply restoration.

Supplementary Materials

The following supporting information can be downloaded at: https://www.mdpi.com/article/10.3390/en17164154/s1, Recovery index in the central-western division of Mexico.

Author Contributions

Conceptualization, C.S.-I.; Methodology, C.S.-I. and J.R.V.-A.; Validation, C.S.-I. and L.B.L.-S.; Formal analysis, C.S.-I.; Investigation, C.S.-I., J.R.V.-A. and L.B.L.-S.; Resources, J.R.V.-A.; Data curation, J.R.V.-A. and L.B.L.-S.; Writing—original draft, J.R.V.-A., L.B.L.-S. and I.G.; Writing—review & editing, L.B.L.-S. and I.G.; Visualization, I.G.; Supervision, I.G. All authors have read and agreed to the published version of the manuscript.

Funding

This research received no external funding.

Data Availability Statement

The original contributions presented in the study are included in the article/supplementary material, further inquiries can be directed to the corresponding author.

Acknowledgments

The authors would like to thank the Centro de Control Divisional Centro Occidente of the Comisión Federal de Electricidad, and the Universidad Tecnológica de la Construcción for their support in carrying out this research. They also thank the PRODEP-2023-2024 Teacher Professional Development Program.

Conflicts of Interest

Authors Carlos Sánchez-Ixta and Juan Rodrigo Vázquez-Abarca are employees of the company Comisión Federal de Electricidad. The remaining authors declare that the research was conducted in the absence of any commercial or financial relationships that could be construed as a potential conflict of interest.

References

  1. Amadei, F.; Valigi, E.; D’Adamo, C. Enel’s Way to SAIDI. Available online: https://www.semanticscholar.org/paper/ENEL%E2%80%99S-WAY-TO-SAIDI-Amadei-Valigi/9be0241b2af1f1dea330136833d24c2212d44e20 (accessed on 12 May 2024).
  2. Priyanto, Y.T.K.; Otong, M.; Safarudin, Y.M. Analisis Indeks Saidi, Saifi, Caidi Dan Non-Delivery Energy Sistem Distribusi 20 Kv Pada Pt. Pln (Persero) Area Balikpapan Penyulang J2. In Proceedings of the Seminar Nasional NCIET, Semarang, Indonsia, 20 December 2020; Volume 1, pp. 415–422. [Google Scholar] [CrossRef]
  3. Jamshid, S.; Abrar, M. Evaluation of Load Point and Customer Point Indices of a Distribution Generation System. In Proceedings of the 2nd International Youth Conference on Radio Electronics, Electrical and Power Engineering, REEPE, Moscow, Russia, 12–14 March 2020; pp. 2–6. [Google Scholar] [CrossRef]
  4. Short, T. Reliability Indices Measurement. EPRI-PEAC 2002, pp. 1–12. Available online: http://resume.marcbrands.com/classfolder/45-859/[email protected]/courses/1/s04-45859/content/_184617_1/tom_short_epri_reliability_indices_2002.pdf (accessed on 10 June 2024).
  5. Short, T.A. Electric Power Distribution Handbook; CRC Press: Boca Raton, FL, USA, 2004; pp. 108–175. [Google Scholar]
  6. Paci, A.R.B. Distribution System Reliability Indices Case Study Albanian Distribution System. J. Multidiscip. Eng. Sci. Technol. 2018, 5, 9137–9143. [Google Scholar]
  7. IEEE Std 1366; IEEE Guide for Electric Power Distribution Reliability Indices. IEEE: Piscataway, NJ, USA, 2012. [CrossRef]
  8. NERC. 2011 Long-Term Reliability Assessment. Rep NERC 2011. Available online: https://www.nerc.com/pa/RAPA/ra/Reliability%20Assessments%20DL/2011%20LTRA_Final.pdf (accessed on 1 June 2024).
  9. US Department of Energy. An Assessment of Energy Technologies and Research Opportunities; (Increasing Efficiency of Building Systems and Technologies); Quadrennial Technology Review; US Department of Energy: Washington, DC, USA, 2015; Volume 38.
  10. U.S. Energy Information Administration. U.S. Power Customers Experienced an Average of Nearly Five Hours of Interruptions in 2019 n.d. Available online: https://www.eia.gov (accessed on 1 August 2024).
  11. Balabanyan, A.; Semikolenova, Y.; Singh, A.; Lee, M.A. Utility Performance and Behavior in Africa Today; World Bank Group: Washington, DC, USA, 2021. [Google Scholar] [CrossRef]
  12. Council of European Energy Regulators, Energy Community Regulatory Board. 7th Benchmarking Report on the Quality of Electricity and Gas Supply. 2022. Available online: https://www.energy-community.org/dam/jcr:532272db-5b1e-4cf4-b12e-7ed59933ba42/CEER_ECRB_Benchmarking%20Report_2022.pdf (accessed on 1 June 2024).
  13. Weiss, M.; Ravillard, P.; Sanin, M.E.; Carvajal, F.; Daltro, Y.; Chueca, E.; Hallack, M.C.M. Impact of Regulation on the Quality of Electric Power Distribution Services in Latin America and the Caribbean; Technical Note No IDB-TN-2328; Inter-American Development Bank, Energy Division: Washington, DC, USA, 2021. [Google Scholar]
  14. Prettico, G.; Marinopoulos, A.; Vitiello, S. Guiding electricity distribution system investments to improve service quality: A European study. Util. Policy 2022, 77, 101381. [Google Scholar] [CrossRef]
  15. Janiszewski, P.; Sawicki, J.; Kurpas, J.; Mróz, M. Practical Ways to Improve SAIDI and SAIFI Power Supply Reliability Indicators in an MV Grid. Acta Energ. 2018, 34, 45–50. [Google Scholar] [CrossRef]
  16. Heylen, E.; Deconinck, G.; Van Hertem, D. Review and classification of reliability indicators for power systems with a high share of renewable energy sources. Renew. Sustain. Energy Rev. 2018, 97, 554–568. [Google Scholar] [CrossRef]
  17. Pansini, A. Guide to Electrical Power Distribution Systems; The Fairmont Press: Lilburn, GA, USA, 2005; pp. 4–35. [Google Scholar]
  18. Patrick, D.R.; Fardo, S.W. Electrical Power Systems Technology; The Fairmont Press: Lilburn, GA, USA, 2009; pp. 203–2055. [Google Scholar]
  19. Tenbohlen, S.; Coenen, S.; Djamali, M.; Müller, A.; Samimi, M.H.; Siegel, M. Diagnostic measurements for power transformers. Energies 2016, 9, 347. [Google Scholar] [CrossRef]
  20. López, J.C.; Franco, J.F.; Rider, M.J. Optimisation-based switch allocation to improve energy losses and service restoration in radial electrical distribution systems. IET Gener. Transm. Distrib. 2016, 10, 2792–2801. [Google Scholar] [CrossRef]
  21. Van Hentenryck, P.; Coffrin, C. Transmission system repair and restoration. Math. Program. 2015, 151, 347–373. [Google Scholar] [CrossRef]
  22. Abniki, H.; Taghvaei, S.M.; Mohammadi-Hosseininejad, S.M. Reliability improvement in smart grid through incorporating energy storage systems in service restoration. Int. Trans. Electr. Energy Syst. 2019, 29, 1–18. [Google Scholar] [CrossRef]
  23. Aguero, J.R.; Spare, J.; Phillips, E.; O’Meally, C.; Wang, J.; Brown, R.E. Distribution system reliability improvement using predictive models. In Proceedings of the 2009 IEEE Power & Energy Society General Meeting, Calgary, AB, Canada, 26–30 July 2009; pp. 1–7. [Google Scholar] [CrossRef]
  24. Jamborsalamati, P.; Hossain, M.J.; Taghizadeh, S.; Konstantinou, G.; Manbachi, M.; Dehghanian, P. Enhancing Power Grid Resilience through an IEC61850-Based EV-Assisted Load Restoration. IEEE Trans. Ind. Inform. 2020, 16, 1799–1810. [Google Scholar] [CrossRef]
  25. Shen, F.; Wu, Q.; Xue, Y. Review of Service Restoration for Distribution Networks. J. Mod. Power Syst. Clean. Energy 2020, 8, 1–14. [Google Scholar] [CrossRef]
  26. Ćurčić, S.; Özveren, C.S.; Crowe, L.; Lo, P.K.L. Electric power distribution network restoration: A survey of papers and a review of the restoration problem. Electr. Power Syst. Res. 1995, 35, 73–86. [Google Scholar] [CrossRef]
  27. Huang, W.; Shao, C.; Hu, B.; Li, W.; Sun, Y.; Xie, K.; Zio, E.; Li, W. A restoration-clustering-decomposition learning framework for aging-related failure rate estimation of distribution transformers. Reliab. Eng. Syst. Saf. 2023, 232, 109043. [Google Scholar] [CrossRef]
  28. Xie, K.; Li, W. Analytical model for unavailability due to aging failures in power systems. Int. J. Electr. Power Energy Syst. 2009, 31, 345–350. [Google Scholar] [CrossRef]
  29. Wang, R.; Xue, A.; Huang, S.; Cao, X.; Shao, Z.; Luo, Y. On the estimation of time-varying failure rate to the protection devices based on failure pattern. In Proceedings of the 2011 4th International Conference on Electric Utility Deregulation and Restructuring and Power Technologies (DRPT), Weihai, China, 6–9 July 2011; pp. 902–905. [Google Scholar] [CrossRef]
  30. Zhou, D.; Wang, Z.; Li, C. Data requisites for transformer statistical lifetime modelling-part I: Aging-related failures. IEEE Trans. Power Deliv. 2013, 28, 1750–1757. [Google Scholar] [CrossRef]
  31. Xu, Y.; Liu, C.C.; Gao, H. Reliability analysis of distribution systems considering service restoration. In Proceedings of the 2015 IEEE Power & Energy Society Innovative Smart Grid Technologies Conference, Washington, DC, USA, 18–20 February 2015; pp. 1–5. [Google Scholar] [CrossRef]
  32. Shen, F.; Wu, Q.; Huang, S.; Lopez, J.C.; Li, C.; Zhou, B. Review of Service Restoration Methods in Distribution Networks. In Proceedings of the 2018 IEEE PES Innovative Smart Grid Technologies Conference Europe (ISGT-Europe), Sarajevo, Bosnia and Herzegovina, 21–25 October 2018. [Google Scholar] [CrossRef]
  33. Chiaradonna, S.; Di Giandomenico, F.; Masetti, G. Analyzing the impact of failures in the electric power distribution grid. In Proceedings of the 2016 Seventh Latin-American Symposium on Dependable Computing (LADC), Cali, Colombia, 19–21 October 2016; pp. 99–108. [Google Scholar] [CrossRef]
  34. Liu, H.; Davidson, R.A.; Apanasovich, T.V. Statistical forecasting of electric power restoration times in hurricanes and ice storms. IEEE Trans. Power Syst. 2007, 22, 2270–2279. [Google Scholar] [CrossRef]
  35. Duffey, R.B.; Ha, T. The probability and timing of power system restoration. IEEE Trans. Power Syst. 2013, 28, 3–9. [Google Scholar] [CrossRef]
  36. Vinogradov, A.; Bolshev, V.; Vinogradova, A.; Jasiński, M.; Sikorski, T.; Leonowicz, Z.; Goňo, R.; Jasińska, E. Analysis of the power supply restoration time after failures in power transmission lines. Energies 2020, 13, 2736. [Google Scholar] [CrossRef]
  37. Liu, Y.; Fan, R.; Terzija, V. Power system restoration: A literature review from 2006 to 2016. J. Mod. Power Syst. Clean Energy 2016, 4, 332–341. [Google Scholar] [CrossRef]
  38. Navarro-Chávez, C.L.; Delfín-Ortega, O.V.; Díaz-Pulido, A. Efficiency of the electricity sector in Mexico 2008–2015: An application of the DEA network model. Int. J. Energy Sect. Manag. 2020, 14, 683–706. [Google Scholar] [CrossRef]
  39. López, J.C.; Lavorato, M.; Rider, M.J. Optimal reconfiguration of electrical distribution systems considering reliability indices improvement. Int. J. Electr. Power Energy Syst. 2016, 78, 837–845. [Google Scholar] [CrossRef]
  40. Sperr, F.; Stai, E.; Venkatraman, A.; Krause, T.; Hug, G. Service Restoration in the Medium Voltage Grid Minimizing the SAIDI Contribution After Primary Substation Failures. IEEE Trans. Power Syst. 2024, 39, 66–82. [Google Scholar] [CrossRef]
  41. Chaitra, A.S.; Sudarshana Reddy, H.R. Improving Reliability in Distribution Systems through Optimal Allocation of Distributed Generators, Network Reconfiguration and Capacitor Placement. SN Comput. SCI 2024, 5, 1–12. [Google Scholar] [CrossRef]
  42. Alves, P.; Basílio, J.; Jorge, R.D.; Aleixo, A.C.; Paulo, R.D.; Blanquet, A.; Espírito Santo, B. Advanced Decentralized Protection, Control and Monitoring Strategies For Distribution Automation. In Proceedings of the 25th International Conference on Electricity Distribution, Madrid, Spain, 3–6 June 2019; Volume 1138, pp. 3–6. [Google Scholar]
  43. Zharkin, A.; Novskyi, V.; Popov, V.; Palachov, S. Improving the Reliability and Power Quality in Distribution Networks with Sources of Dispersed Generation. In Power Systems Research and Operation: Selected Problems; Springer: Cham, Swtizerland, 2022. [Google Scholar] [CrossRef]
  44. Anteneh, D.; Khan, B.; Mahela, O.P.; Alhelou, H.H.; Guerrero, J.M. Distribution network reliability enhancement and power loss reduction by optimal network reconfiguration. Comput. Electr. Eng. 2021, 96, 107518. [Google Scholar] [CrossRef]
  45. CRE. Reporte de Confiabilidad del Sistema Eléctrico Nacional. 2022. Available online: https://www.gob.mx/cms/uploads/attachment/file/876900/Anexo_Acuerdo_A-075-2023.pdf (accessed on 3 July 2024).
  46. SENER. Balance Nacional de Energía. Gob México. 2023. Available online: https://www.gob.mx/sener/articulos/balance-nacional-de-energia-296106 (accessed on 7 July 2024).
  47. SENER. Demanda y Consumo 2021–2035. Available online: https://www.gob.mx/cms/uploads/attachment/file/649612/PRODESEN_CAP_TULO-4.pdf (accessed on 7 July 2024).
  48. Dimitrijevic, S.; Rajakovic, N. An innovative approach for solving the restoration problem in distribution networks. Electr. Power Syst. Res. 2011, 81, 1961–1972. [Google Scholar] [CrossRef]
  49. Xie, S.; Wang, X.; Qu, C.; Wang, X.; Guo, J. Impacts of different wind speed simulation methods on conditional reliability indices. Int. Trans. Electr. Energy Syst. 2015, 25, 359–373. [Google Scholar] [CrossRef]
  50. Sampaio, R.F.; Melo, L.S.; Leão, R.P.S.; Barroso, G.C.; Bezerra, J.R. Automatic restoration system for power distribution networks based on multi-agent systems. IET Gener. Transm. Distrib. 2017, 11, 475–484. [Google Scholar] [CrossRef]
Figure 1. (a) Methodology, (b) single line diagram of a distribution substation, and (c) distribution substation showing the number of circuits dependent on the power transformer.
Energies 17 04154 g001
Figure 2. Demand in different zones and substations: (a) Average demand per substation, (b) average demand per circuit, and (c) share of total demand per zone.
Energies 17 04154 g002
Figure 3. Restoration rate by zone: (a) zone 1, (b) zone 4, (c) zone 3, (d) zone 10, (e) zone 9, (f) zone 7, (g) zone 8, (h) zone 2, (i) zone 11, (j) zone 5, (k) zone 6, and (l) zone 12.
Energies 17 04154 g003
Figure 4. Analysis of SAIDI from 2020–2023 with improvements.
Energies 17 04154 g004
Figure 5. Priority index for CWD areas.
Energies 17 04154 g005
Table 1. TNC analysis categories.
TypeDescription
AIt is designed for power transformers equipped with 1 to 4 medium voltage circuits, with a designated time frame of 1 min.
BIt is designed for power transformers equipped with 5 to 6 medium voltage circuits, with a specified duration of 1.5 min.
CThis applies to power transformers with more than six medium voltage circuits, for which a designated time of 2 min per circuit is allocated.
Table 2. TCT analysis categories.
TypeDescriptionDiagram
AIt is assumed that the circuit includes at least one remote-controlled connection with a circuit from another substation, with a defined time of 0.5 min allocated for this maneuver.Energies 17 04154 i001
BIt is assumed that the circuit is equipped with at least one remote connection to another circuit within the same substation, with a designated time of 0.75 min allocated for this operation.Energies 17 04154 i002
CIt is assumed that the restoration of circuit load occurs using the low-voltage side bus of the same power transformer, with a specified time of 0.75 min assigned for this maneuver.Energies 17 04154 i003
DIt is assumed that the restoration of the circuit load will be achieved through a manual connection with the assistance of field personnel, with a designated time of 30 min allocated for this operation.Energies 17 04154 i004
Table 3. Categories for CCB analysis.
TypeDescriptionQualifying
ASubstations with 1 to 4 medium voltage circuits1
BSubstations with 5 to 6 medium voltage circuits2
CSubstations with more than 6 medium voltage circuits3
Table 4. Categories for TS analysis.
TypeDescriptionQualifying
ARing substation1
RRadial Substation2
TSubstation in TAP3
Table 5. Categories for RTS analysis.
TypeDescriptionQualifyingImpact on Indicators
1Recovery time in scenario two < 5 min2NO
2Recovery time in scenario two = 5 min3NO
3Recovery time in scenario two > 5 min4YES
Table 6. Demand and users by zone in the central–western division of Mexico.
ZoneClueSubstations (SUB)Transformers
Power
CircuitsCircuits
Average per Bank
Users% USU DIVUSU/BankUSU/CTODemand (DEM) MW% DEM DivisionDEM/BankDEM/CTO
Zone 1Z121271506513,25820.5%19,0103422226.519.6%8.41.5
Zone 2Z279556219,6738.8%24,408399494.58.2%10.51.7
Zone 3Z31215685254,95410.2%16,9973749114.59.9%7.61.7
Zone 4Z41519844271,90410.9%14,3113237155.013.4%8.21.8
Zone 5Z567314163,2146.5%23,316526543.73.8%6.21.4
Zone 6Z657396105,7244.2%15,103271154.64.7%7.81.4
Zone 7Z71417835225,0919.0%13,2412712136.511.8%8.01.6
Zone 8Z888456163,7856.5%20,473364048.34.2%6.01.1
Zone 9Z91417724168,5296.7%9913234198.78.5%5.81.4
Zone 10Z101013645162,8726.5%12,529254599.18.6%7.61.5
Zone 11Z1145286128,2105.1%25,642457941.13.5%8.21.5
Zone 12Z1246325128,2715.1%21,379400845.33.9%7.61.4
Totals12015075152,505,485100%16,70333361157.6100%7.71.5
Table 7. Analysis of the index and restoration time in the central–western division areas.
TopologyNumber of CircuitsTPR/Substation (min)Restoration Index
ZoneClueSUBTransformers
Power
ARTABCScenario 1Scenario 21 to 45 to 78 to 910
Zone 1Z12127151555175.038.646143
Zone 2Z2794122165.324.80360
Zone 3Z3121510028164.013.76450
Zone 4Z4151911228474.119.56661
Zone 5Z5675014213.93.93310
Zone 6Z6574102055.326.21150
Zone 7Z7141710036294.318.14580
Zone 8Z8885123144.88.51340
Zone 9Z9141795010253.814.16830
Zone 10Z1010138206074.740.74270
Zone 11Z11452111225.25.20320
Zone 12Z12455001324.84.81320
Division1201508814185623714.618.23647634
Total 120150 67
Disclaimer/Publisher’s Note: The statements, opinions and data contained in all publications are solely those of the individual author(s) and contributor(s) and not of MDPI and/or the editor(s). MDPI and/or the editor(s) disclaim responsibility for any injury to people or property resulting from any ideas, methods, instructions or products referred to in the content.

