Article

Analysis of Soot Deposition Effects on Exhaust Heat Exchanger for Waste Heat Recovery System

Marine Design & Research Institute of China, Shanghai 200011, China
*
Author to whom correspondence should be addressed.
Energies 2024, 17(17), 4259; https://doi.org/10.3390/en17174259
Submission received: 30 July 2024 / Revised: 19 August 2024 / Accepted: 22 August 2024 / Published: 26 August 2024
(This article belongs to the Section J1: Heat and Mass Transfer)

Abstract

:
This study investigates the thermal–hydraulic behavior and deposition characteristics of a shell and tube exhaust heat exchanger using a CFD-based predictive model of soot deposition. Firstly, considering the influences of thermophoretic, wall shear stress, and other deposition and removal mechanisms, a predictive model is developed for long-term performance of heat exchangers under soot deposition. Then, the variations in exhaust heat exchanger performance during a 4 h deposition period are simulated based on the model. Subsequently, the variation of deposition distribution and different deposition velocities are also evaluated. Finally, an analysis of the long-term performance of the exhaust heat exchanger under varying gas velocities and temperature gradients is conducted, revealing the performance variations under all engine-operating conditions. Results show that the deterioration in normalized relative j / f 1 / 2 varies from 5.26% to 24.91% under different work conditions, and the exhaust heat exchanger with high gas velocity and low temperature gradient exhibits optimal long-term performance.

1. Introduction

Predictions indicate that, by 2040, global energy demand is expected to increase by one-third based on current energy policies adopted by most countries [1]. Consequently, many countries are transitioning their energy structures towards the direction of “efficient, low-carbon, and clean” [2,3]. However, as a widely used power device in industrial activities, the internal combustion engine (ICE) loses most of its generated energy into the surrounding environment through exhaust gas, cooling water, etc. [4]. Therefore, considering the significant potential for recovering exhaust heat energy and significantly reducing emissions of CO2 and other pollutants, waste heat recovery (WHR) systems are regarded as the most promising energy-saving technology for ICEs [5,6,7].
In engine WHR systems, as a high-quality heat source, the high-temperature exhaust is typically recovered by exhaust heat exchangers [8,9]. However, according to the survey conducted by Steinhagen et al., more than 90% of over 3000 heat exchangers used in various industrial applications in New Zealand are troubled by fouling issues [10]. Considering the abundance of soot particles in engine exhaust gas, the heat-exchange efficiency of exhaust heat exchangers systems will be significantly deteriorated due to soot deposition during the long-term operation. Consequently, it is necessary to analyze the soot deposition in exhaust heat exchanger.
In the 1980s, with the advent of the energy crisis, the issue of particle deposition attracted the widespread attention of scholars [11]. Due to the difference in the working environments of heat exchangers, there are many factors influencing particle deposition, including fluid composition, surface roughness, particle properties, heat transfer surface temperature gradients, etc. [12]. These factors make the study of particle deposition quite challenging. Moreover, on one hand, the soot size in an engine exhaust is primarily in the range of 20–80 nm, much smaller than typical deposition particles (micrometer-sized) [13]. On the other hand, in exhaust heat exchangers, considering the large temperature gradient caused by a high exhaust temperature, the soot deposition is primarily influenced by thermophoresis [14]. In summary, although the deposition principles are similar, the condition for particle deposition in an engine exhaust is relatively unique; thus, many valuable studies have been conducted on this topic.
Most studies on soot deposition under engine exhaust conditions focus on Exhaust Gas Recirculation (EGR) heat exchangers, primarily using experimental research methods. Park et al. [15] experimentally studied the performance changes in an EGR cooler over 5 h under different coolant temperatures, flow rates, and diesel oxidation catalysts using a light-duty diesel engine. The results showed that as coolant temperature decreased, the temperature gradient gradually increased, leading to a more severe deposition and a more significant efficiency reduction in the EGR heat exchanger. Additionally, lower flow rates resulted in more severe particle deposition at a constant particle number. Grillot et al. [16] examined the impact of flow rate on soot deposition under exhaust conditions and found that particle deposition gradually decreased with increasing flow rate. Furthermore, Abd-Elhady et al. [17,18] defined the critical velocity at which particles can roll on the surface and proposed that when flow velocity exceeds the critical velocity, particles no longer deposit on smooth surfaces. In comparison, there are fewer studies on soot deposition in exhaust heat exchangers. Aiello et al. [19] investigated the deposition in absorption heat pumps in diesel engine waste heat recovery systems and found that the deposition was most pronounced under the condition of the minimum coolant temperature and 100% engine load.
In recent years, due to its low cost, high reproducibility, and ability to simulate complex conditions, the concept of Computational Fluid Dynamics (CFDs) has gained widespread attention in the field of particle deposition. Lee et al. [20] considered gravity, elastic rebound, and adhesion forces to develop a two-dimensional numerical model of an evaporator in power plant using CFD for soot deposition prediction. The results indicated that fluid velocity and particle size are important factors for deposition in evaporators. Kasper et al. [21] established a CFD-based Eulerian–Lagrangian deposition model to numerically simulate heat transfer and particle deposition on heat transfer surfaces of different structures, revealing that spherical dimpled surfaces had superior overall performance. Based on previous studies, Han et al. [22] proposed an improved particle deposition mode to examine the impacts of thermophoresis and other key parameters on the dimensionless deposition. The results indicated that the improved model was more accurate.
As highlighted in the aforementioned research, the deposition of soot particles in exhaust gas significantly deteriorates the long-term performance of exhaust heat exchangers, leading to a decline in the overall efficiency of engine WHR systems. However, there is a paucity of simulation studies on the deposition characteristics and long-term performance of exhaust gas heat exchangers. Thus, it is necessary to analyze the impact of soot deposition on exhaust heat exchangers of engine WHR systems. In this paper, considering the shell-and-tube type is the most extensively employed heat exchanger in various industrial activities [23,24,25], the thermal–hydraulic behavior and deposit features of an exhaust heat exchanger with shell-and-tube type in engine WHR systems is conducted. First, a geometric model of the exhaust heat exchanger is established. Then, based on a CFD-based soot particle deposition model, the changes in thermal–hydraulic and deposit performance of the exhaust heat exchanger during a 4 h deposition period are analyzed under different gas velocities and temperature gradients. Lastly, the long-term performance of the exhaust heat exchanger under all engine-operating conditions is also numerically examined. The results offer guidance for the design of exhaust heat exchangers in engine WHR systems.

2. Modeling

2.1. Computational Domain

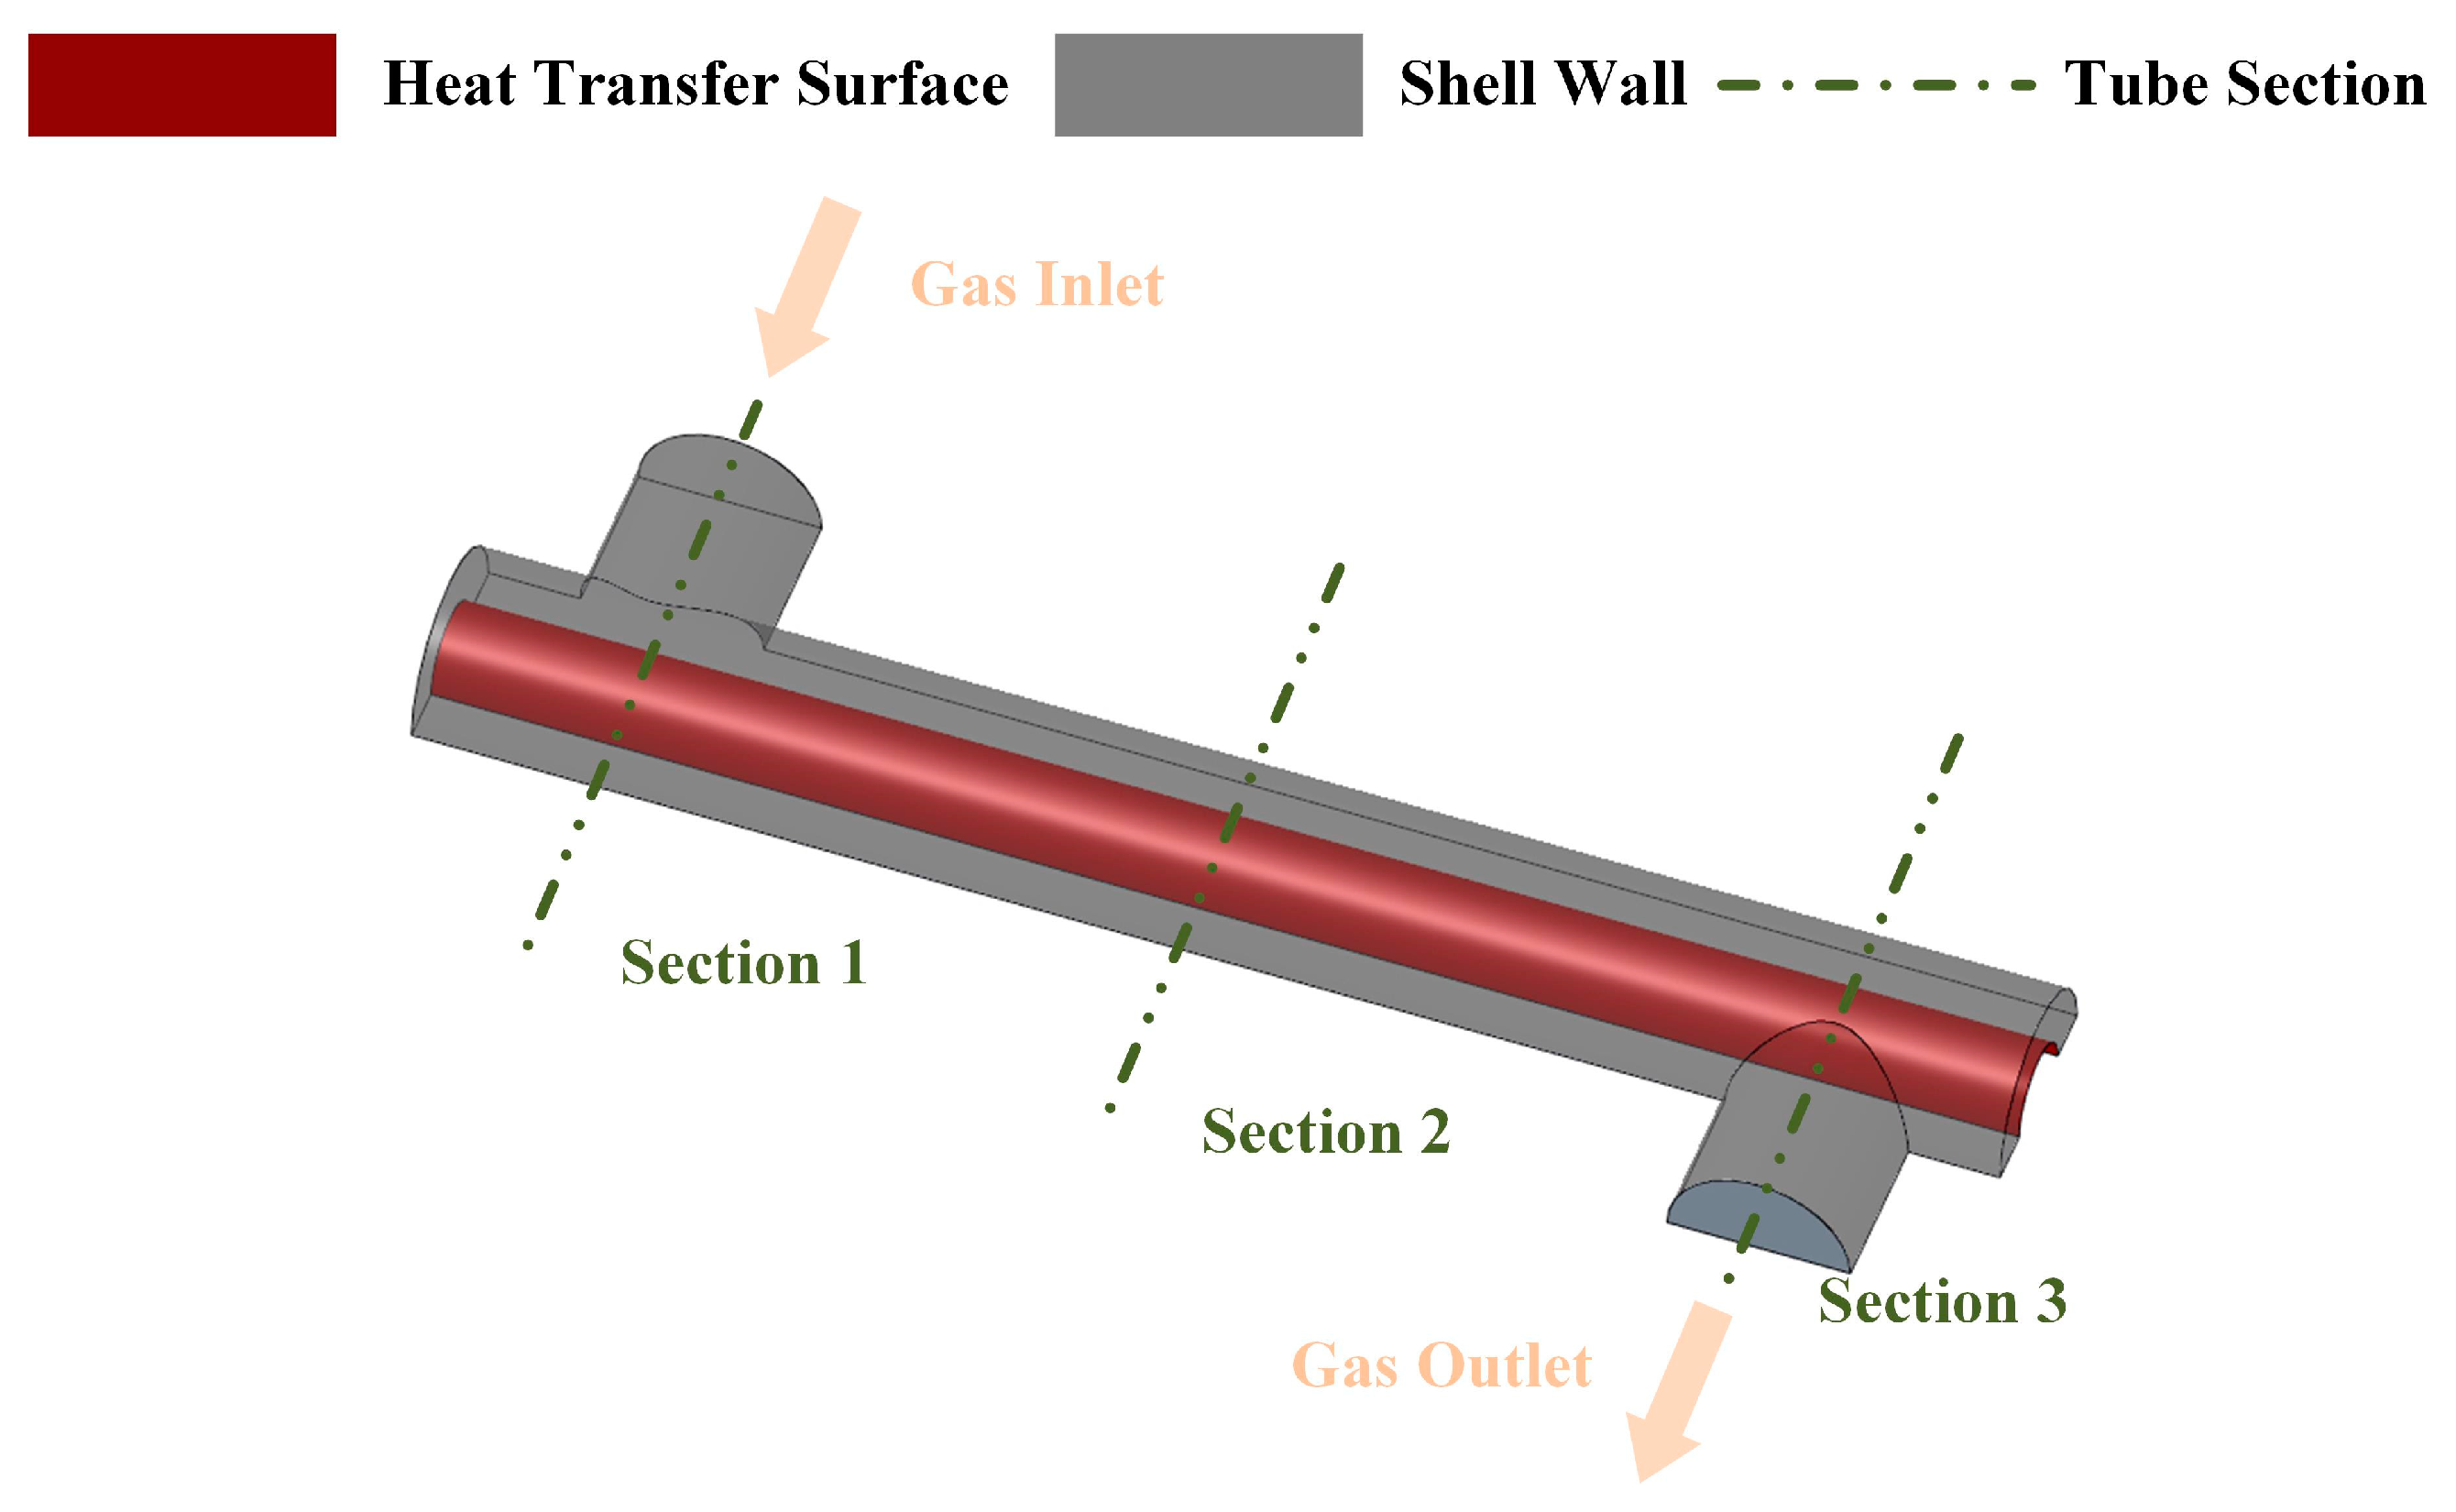
The exhaust heat exchanger model is exhibited in Figure 1. The diameters of the shell side and tube side are 16 mm and 8 mm, respectively, and the effective heat transfer length is 120 mm; wall thickness is not considered in the geometric model. Additionally, to prevent the influence of outlet backflow on the simulation, an adiabatic draft segment is added at the outlet.

2.2. Boundary Conditions and Numerical Method

The following boundary conditions are adopted for numerical simulation:
Symmetry plane at the cross-section: As shown in Figure 1, considering the large computational demand for long-term deposition simulations, only half of the exhaust heat exchanger is modeled.
Velocity inlet at the inlet: To investigate the impact of inlet gas velocity on the deposition performance, the inlet velocity is fixed.
Pressure outlet at the outlet: A fixed value (0 Pa) is set to facilitate the analysis of the pressure drop performance.
Isothermal boundary on the tube wall: The deposition characteristics of exhaust gas are primarily investigated in the model; thus, the temperature of the tube wall is fixed at a constant value (293.15 K).
Adiabatic and no-slip wall on the shell wall: Assuming the shell wall is well insulated, no heat will be lost from the shell wall.
The main boundary condition parameters of the numerical simulation for the exhaust heat exchanger studied in this paper are depicted in Table 1:
The Reynolds-averaged equations are selected for numerical simulation in this study, and the continuity equation, momentum equation, and energy equation are listed below [26]:
ρ t + ( ρ v ) = 0
t ρ v + ρ v v = p + τ ¯ ¯
ρ c p v T = ( k e f f T )
Based on the CFD software, the finite volume method is applied for calculation. The SIMPLE algorithm is used to solve the control equations. A pressure-based double-precision steady-state solver is selected to solve the thermal–hydraulic behavior of the exhaust heat exchanger. The realizable k-ε model can better simulate the turbulent flow in heat exchangers [27]. Therefore, this model is used for turbulence simulation in this study; the transport Equations for the realizable k-ε model are listed below:
t ρ k + x j ρ k u j = x j μ + μ t σ k k x j + G k + G b ρ ϵ Y M + S K
and
t ρ ϵ + x j ρ ϵ u j = x j μ + μ t σ ϵ ϵ x j + ρ C 1 S ϵ ρ C 2 ϵ 2 k + v ϵ + C 1 ϵ ϵ k C 3 ϵ G b + S ϵ
Additionally, to ensure the accuracy and convergence of the solver, the convergence criteria for the energy term is adjusted to 10−6, while the criteria for other values is set to 10−3 [28]. Other numerical model-related settings are set as default.

2.3. Assumptions

(a)
Only soot particles are considered in deposition.
(b)
During the simulation process, the properties of the exhaust gas and soot particle are considered as a function of temperature and a constant value, respectively.
(c)
Interactions between soot particles are not considered.
(d)
The impact of the deposit layer thickness on the flow area is not considered.

2.4. Deposition Model

The process of soot deposition can be summarized into two main components: deposition and removal [29]. Firstly, influenced by thermophoresis, diffusion, and inertial impaction, soot particles gradually separate from the exhaust gas and collide with the heat transfer surface. During collision process, considering that the gravity and buoyancy of the soot particles are relatively small in the exhaust condition, the drag force and van der Waals force are adopted for the adhesion probability calculation [30]. Additionally, during the particle removal process, soot particles already adhered to the wall have a certain probability of detaching from the heat exchanger wall due to wall shear stress [30]. The main mechanisms involved in this deposit and removal process are calculated as shown in Table 2.
Based on the aforementioned deposit and removal mechanisms of soot particles, a CFD-based soot deposition model was established in our previous study [31]. The thermal–hydraulic characteristics are calculated using CFD software (wall temperature gradient T , wall shear stress τ s , wall temperature T s u r , wall heat transfer rate Q s u r , and other exhaust gas parameters), and the deposition characteristics are calculated using a TFM model (deposit layer thickness h d e p , deposit surface temperature T s u r , etc.) Anyway, the real-time interaction of thermal–hydraulic and deposition characteristics is performed using a UDF module to simulate the long-term performance. Detailed modeling can be found in the previous work [31].

2.5. Exhaust Gas Properties and Soot Parameters

Due to its high temperature and significant heat transfer capacity, the properties of the exhaust gas vary drastically during heat transfer process. Thus, the default constant air properties cannot accurately simulate the heat transfer process of exhaust heat exchanger. Subsequently, the physical properties of the exhaust gas were fitted in polynomial form within the main operating temperature range for simulation in this paper.
Research shows that the average chemical formula for automotive diesel is C 12.3 H 22.2 [32]. Assuming complete combustion of diesel, the proportions of various components in the exhaust can be calculated based on the excess air ratio φ a [33]:
C 12.3 H 22.2 + 17.85 φ a O 2 + 3.76 N 2 12.3 C O 2 + 11.1 H 2 O + 3.76 × 17.85 φ a N 2 + 17.85 φ a 1 O 2
Therefore, the final component proportions are as follows: CO2 = 12.52%, H2O = 4.65%, O2 = 7.99%, and N2 = 74.84%. Based on the proportion of exhaust components, density and specific heat capacity can be directly obtained from Refprop [34]. However, due to the high proportion of water vapor, the thermal conductivity λ g and viscosity μ g cannot be directly derived. According to the research by Poling et al. [35], the thermal conductivity and viscosity can be calculated as follows:
λ g = i = 1 n y i λ i j = 1 n y j A i j
μ g = i = 1 n y i μ i j = 1 n y j A i j
A i j = M W j M W i 0.5
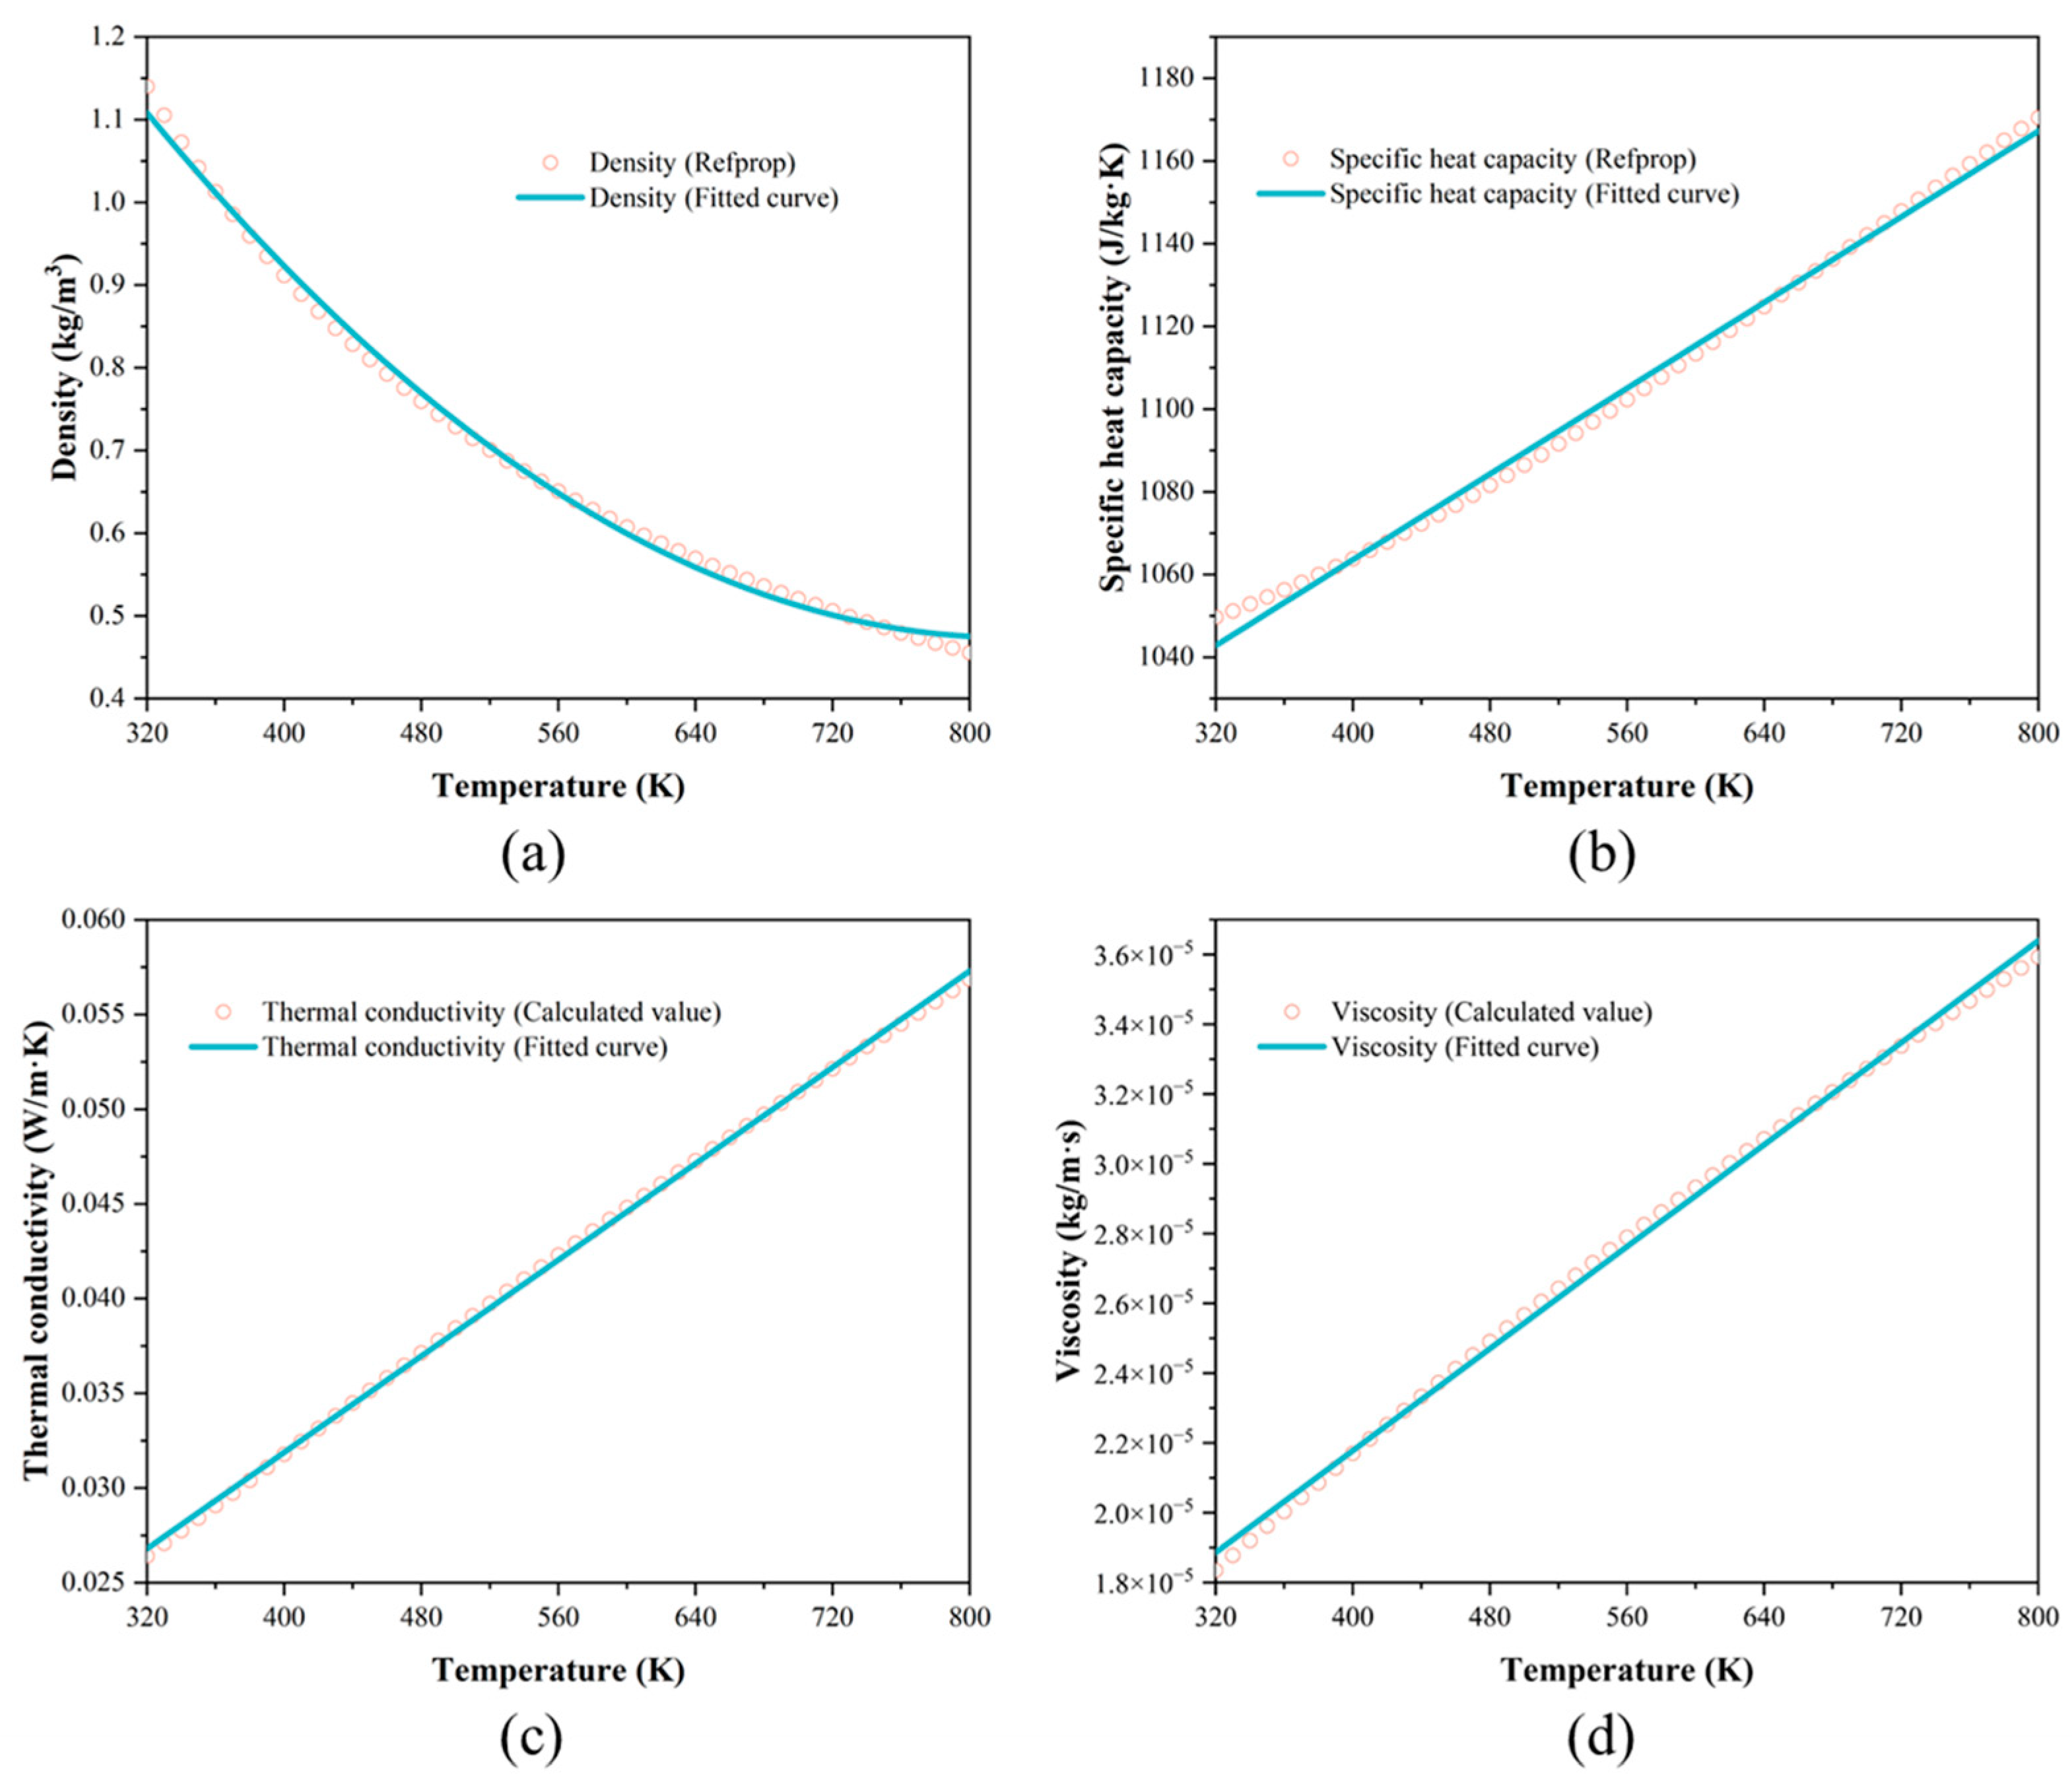
where λ i , μ i , y j , and M W i represent the thermal conductivity, viscosity, mole fraction, and molar mass of component i in the exhaust gas, respectively. Then, the calculation results are fitted using a polynomial form; the errors between fitted polynomial correlations and the calculated values are exhibited in Figure 2, and the fitted formulas are listed in Table 3. It is clear that that the polynomial fitting results can represent the changes in exhaust gas properties within the operating temperature range well.
In this paper, the physical properties of soot particles are assumed to remain constant during the simulation. Therefore, referring to the common operating conditions of diesel engines [36,37], the soot particle parameters are detailed in Table 4.

2.6. Data Processing

In the aforementioned deposition model, the exhaust gas mass flow mate, pressure, temperature, deposit layer thickness at different locations, and the distributions of parameters can be directly extracted from CFD software. These parameters are then utilized to calculate thermal resistance, pressure drop, and area goodness factor for further analysis. The specific calculation procedures are listed below.
The shell-side heat-transfer rate Q and pressure drop P of the exhaust heat exchanger are computed as follows:
Q = m c p T i n T o u t
P = P i n P o u t
where m , c p , T i n , T o u t , P i n , and P o u t represent the mass flow rate, specific heat capacity, inlet temperature, outlet temperature, inlet pressure, and outlet pressure of exhaust gas, respectively.
Additionally, the area goodness factor j / f 1 / 2 is used for evaluating the overall performance of the exhaust heat exchanger. The heat transfer factor j and friction factor f are computed as follows:
j = N u R e P r 1 / 3
f = 2 D h P N r o w ρ u 2
where N u , R e , P r , D h , N r o w , ρ , and u represent the average Nusselt number, Reynolds number, Prandtl number, hydraulic diameter of the computational domain, number of tubes, average density of exhaust gas, and average velocity of exhaust gas, respectively.
Moreover, the Nusselt number N u , Reynolds number R e , and hydraulic diameter D can be computed as follows:
N u = h D h k
R e = ρ u D μ
D h = 4 S c r o s s L w
where μ , S c r o s s , and L w represent the average viscosity of the exhaust gas, flow cross-sectional area, and wetted perimeter, respectively. The average convective heat transfer coefficient h is calculated as follows:
h = Q S h e x T m
where S h e x and T m represent the heat transfer area and logarithmic mean temperature difference in the exhaust heat exchanger, respectively.
S h e x = π D 3 L 1
T m = T i n T w a l l T o u t T w a l l l n T i n T w a l l / T o u t T w a l l
Compared to the performance under initial clean air conditions, the impact of soot deposition can be evaluated by the variation in thermal resistance, pressure drop, and j / f 1 / 2 . Thus, the relative thermal resistance, relative pressure drop, and relative j / f 1 / 2 at the time t l o c a l can be expressed as follows:
R f = R t h t = l o c a l R t h t = 0
P f = P t = l o c a l P t = 0
j / f 1 / 2 f = j / f 1 / 2 t = l o c a l j / f 1 / 2 t = 0
The thermal resistance R t h can be computed by the heat transfer area S h e x , logarithmic mean temperature difference T m , and heat transfer rate Q as follows:
R t h = S h e x T m Q
Finally, based on the performance parameters under the initial clean conditions, the aforementioned performance evaluation indicators were further non-dimensionalized. The normalized relative thermal resistance, normalized relative pressure drop, and normalized j / f 1 / 2 are calculated to assess the long-term performance, as detailed below:
R d = R f R t h t = 0
P d = P f P t = 0
j / f 1 / 2 d = j / f 1 / 2 f j / f 1 / 2 t = 0

2.7. Model Verification

Under the same exhaust gas conditions, the performance is simulated with four different grid resolutions. As shown in Table 5, the calculation results are relatively stable when the grid number exceeds 76,588 (Grid 2–Grid 4). The heat-exchange difference between Grid 3 and Grid 2-Grid 6 is less than 1.3%. Therefore, considering both calculation load and accuracy, Grid 3 is the optimal choice.
In our previous work [31], the deposition model was validated against experimental results, showing a high degree of agreement. On this foundation, the accuracy of the deposition model is further verified in this study. The soot deposition in different EGR coolers is experimentally studied by Malayeri et al. [38]. As shown in Figure 3, under different gas velocities, the simulation results of the deposition model in this study are contrasted with the experimental deposition data of a smooth exhaust pipe over 2 h. It should be noted that, during the initial stages of deposition under the gas velocity of 30 m/s, a portion of the deposit layer may have been spalled off the surface, resulting in no increase in the thermal resistance for the first 20 min [38]. As deposition progresses, the discrepancy between simulation and experimental results diminishes, ultimately reaching agreement. In summary, the model accurately simulates the deposition conditions and performance trends in the pipe, demonstrating high reliability.

3. Long-Term Performance under Different Exhaust Conditions

3.1. Thermal–Hydraulic Performance

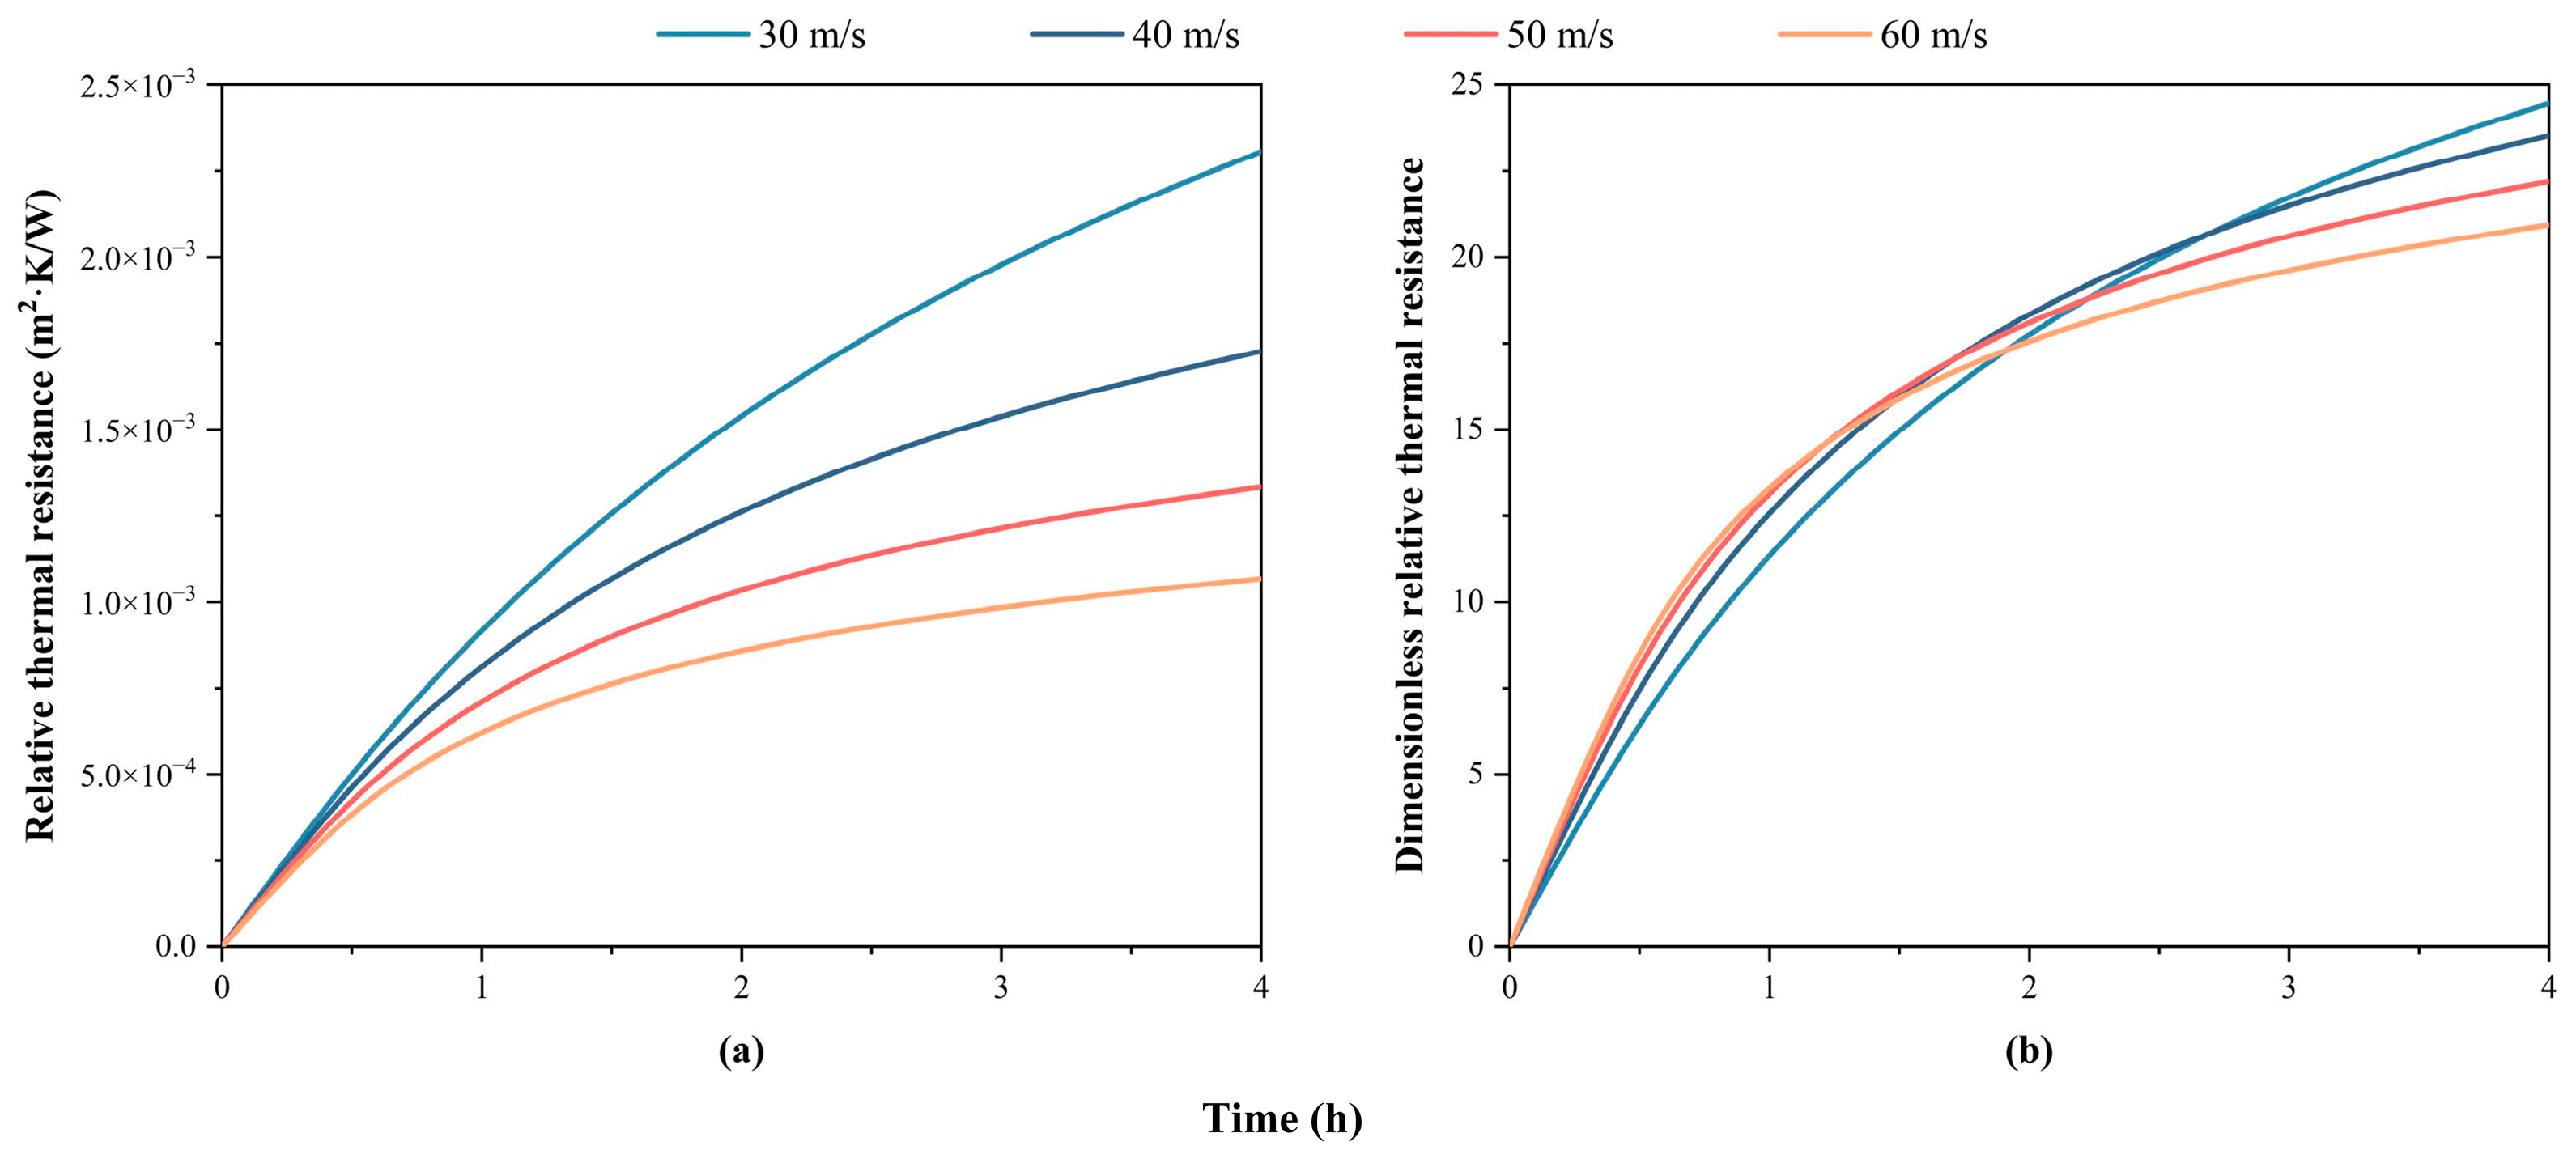
The thermal–hydraulic behavior variation in the heat exchanger is investigated under conditions of inlet gas velocity ranging from 30 to 60 m/s and a constant temperature difference of 400 K (inlet gas temperature 693.15 K) over 4 h. Figure 4 illustrates the changes in relative thermal resistance and normalized relative thermal resistance. Both relative thermal resistance and normalized relative thermal resistance show similar trends during the deposit process. Due to soot deposition, the deterioration of the heat exchanger performance is significant at different gas velocities, but the increase in relative thermal resistance gradually slows down as the deposition progresses, eventually stabilizing. Moreover, with the increase in inlet velocities, the relative thermal resistance increased from 1.07 × 10⁻3 to 2.31 × 10⁻3 m2·K/W after 4 h of soot deposition, with the normalized relative thermal resistance rising from 20.94% to 24.47%. Additionally, as a result of the increase in wall shear stress, the relative thermal resistance decreases significantly with increasing flow rate.
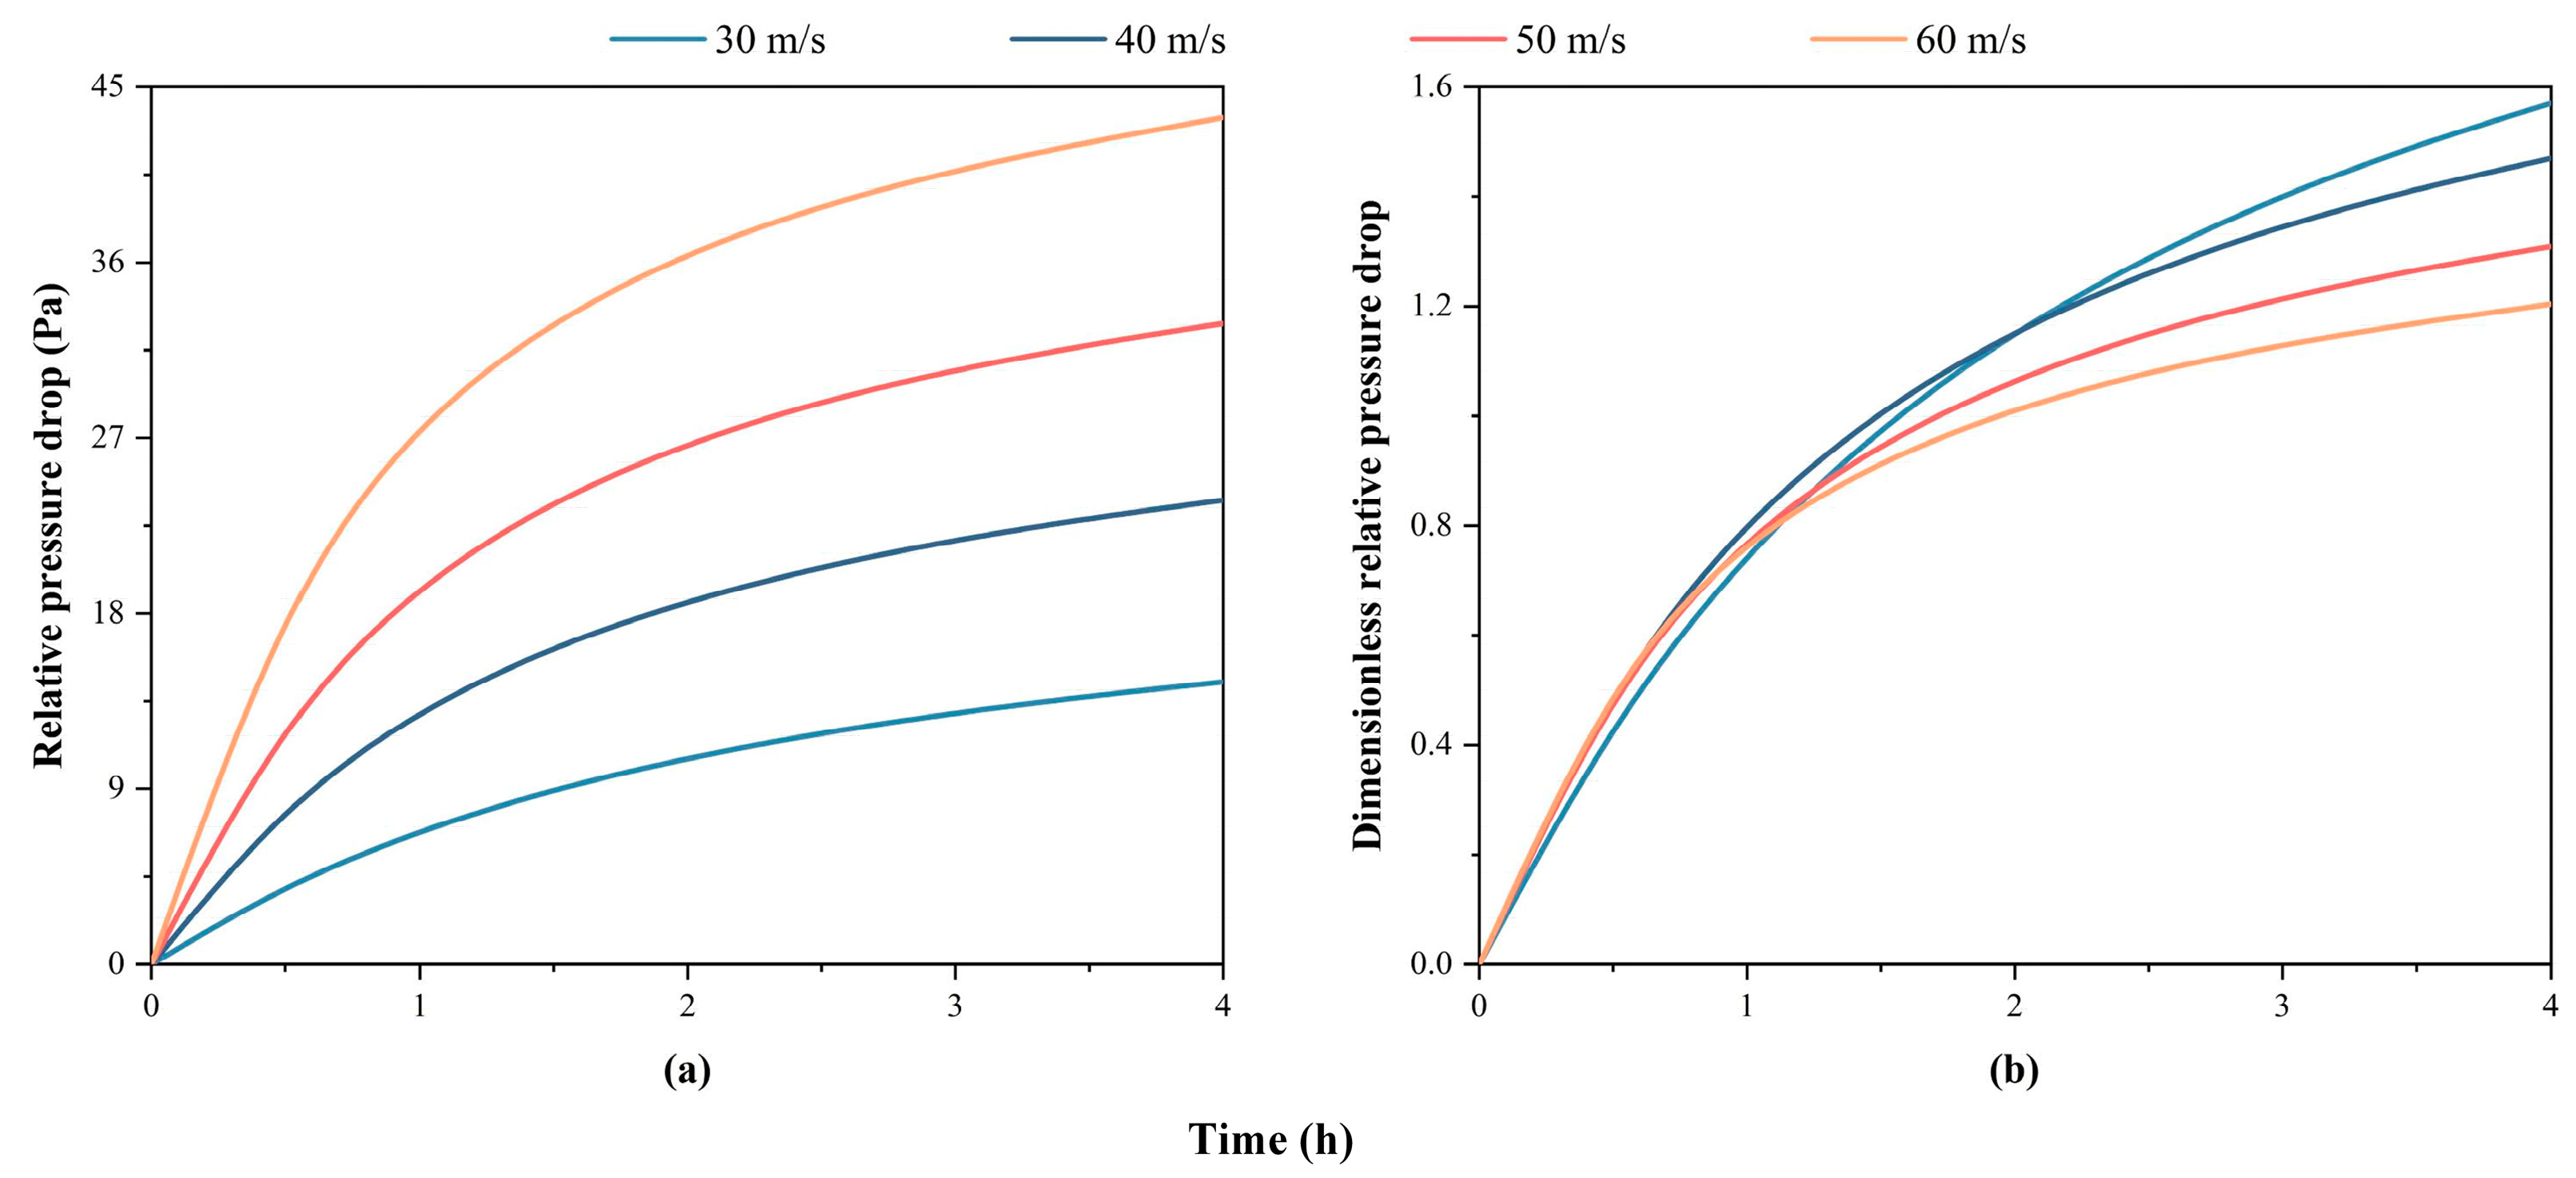
Figure 5 exhibits the variations in relative pressure drop and normalized relative pressure drop. As mentioned earlier, the heat transfer performance gradually deteriorates as the deposition progresses, resulting in a gradual increase in the average gas side temperature. As shown in Figure 2a, the gas density decreases with increasing temperature, leading to a gradual increase in the average flow velocity as deposition progresses. This ultimately leads to a continuous increase in the pressure drop.
Furthermore, with increasing gas velocities, the relative pressure drop of the heat exchanger increased from 14.48 Pa to 43.44 Pa after 4 h soot deposition. However, as shown in Figure 5b, the variation in normalized relative pressure drop shows the opposite trend, with smaller values observed under high gas velocity conditions. This is owing to the turbulence intensity in the exhaust heat exchanger increases with the rising gas velocity, leading to a rapid increase in the initial pressure drop under clean conditions. Additionally, it is worth mentioning that the impact of the deposit layer thickness on the flow area is not considered in the deposition model. In actual deposit processes, the flow area will decrease with the increasing deposit layer thickness, leading to a further increase in pressure drop.
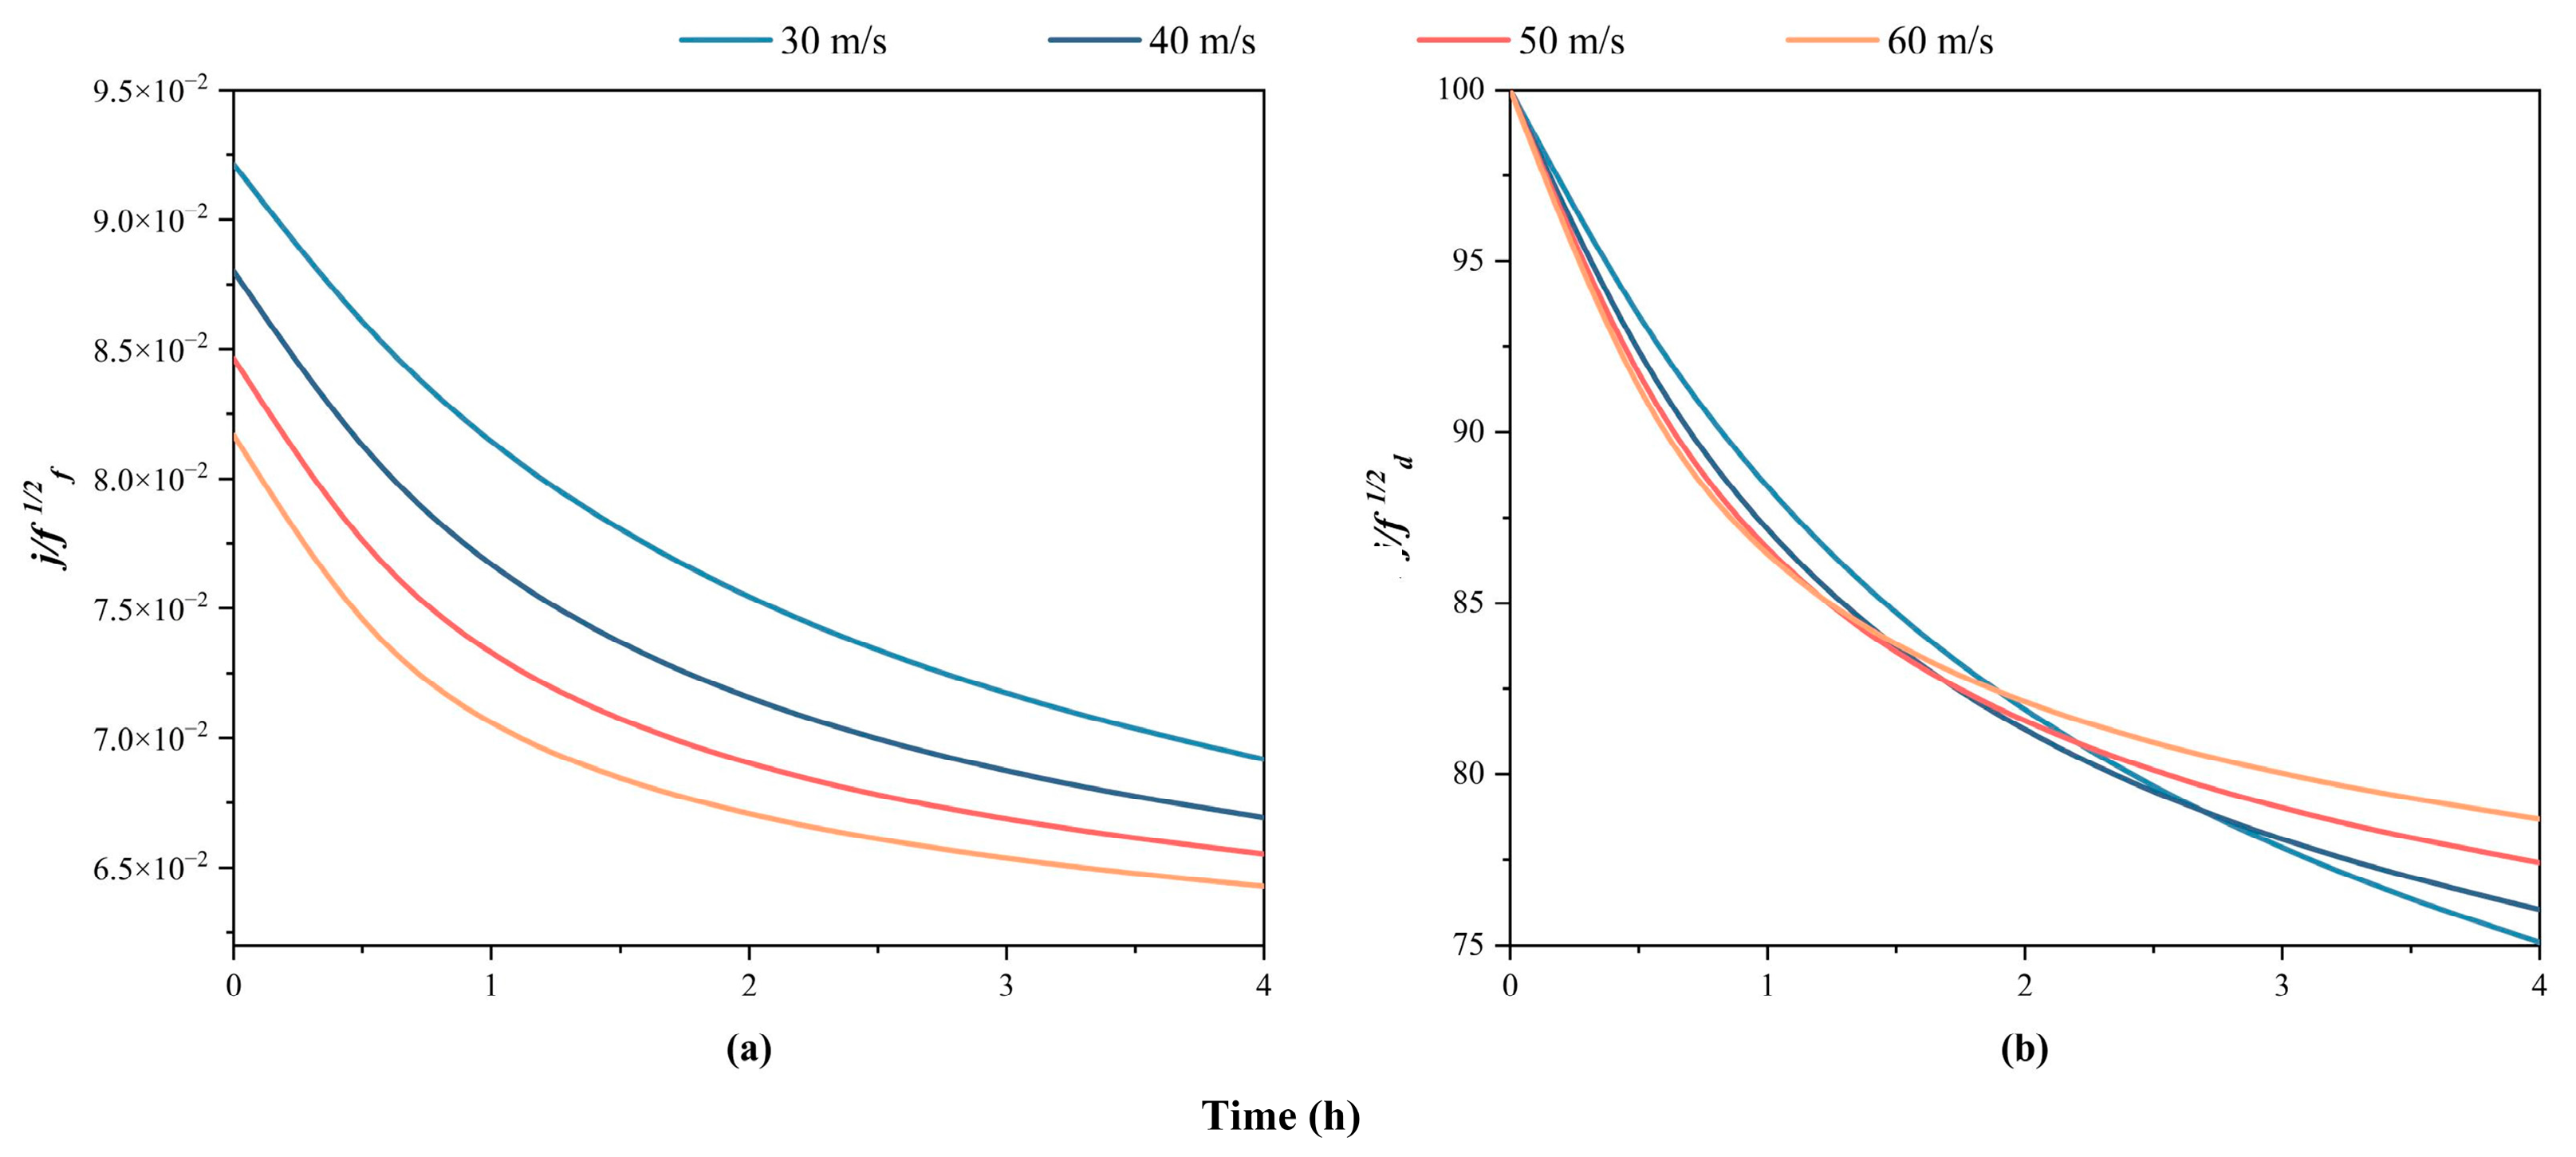
Under conditions of different gas velocities and a constant temperature difference (400 K), Figure 6 shows the changes in the j / f 1 / 2 f and j / f 1 / 2 d of the exhaust heat exchanger during a 4 h deposition period. The trends in the variation of comprehensive performance under different conditions are generally similar. As the deposition progresses, the comprehensive performance gradually deteriorates, and the rate of performance degradation gradually slows down, eventually stabilizing. Moreover, under the conditions of low inlet gas velocity, the increase in normalized relative thermal resistance and normalized relative pressure drop is more pronounced, resulting in a more significant deterioration in normalized comprehensive performance. Compared to the initial clean condition, the normalized comprehensive performance after 4 h soot deposition increases gradually from 75.09% to 78.69% as the gas inlet velocity rises from 30 to 60 m/s. That is to say, the increasing velocity can effectively mitigate the deterioration in the performance of the exhaust heat exchanger caused by soot deposition.

3.2. Deposition Distribution in Exhaust Heat Exchanger

As mentioned earlier, soot deposition is more pronounced under work conditions of lower gas velocity. Therefore, a severe work condition with gas velocity of 30 m/s and temperature difference of 400 K is selected to study the deposition distribution during a 4 h deposition period.
Figure 7 demonstrates the variation in different deposition velocities during a 4 h deposition period. It can be observed that the deposition velocity due to thermophoresis is significantly higher than those due to diffusion and inertial impaction. This also demonstrates that soot deposition is primarily influenced by thermophoresis in exhaust heat exchangers.
Additionally, Figure 7 shows that both thermophoresis and inertial impaction deposition velocities decrease gradually over the deposit process. During the 4 h deposition period, the thermophoresis deposition velocity reduces from 2.37 × 10⁻² m/s to 2.00 × 10⁻² m/s, and the inertial impaction deposition velocity reduces from 1.92 × 10⁻⁶ m/s to 1.81 × 10⁻⁶ m/s. As deposition progresses, the deposit layer thickness rises. Thus, the surface temperature of the deposition layer gradually increases, resulting in a rapid reduction in the wall temperature gradient and consequently reducing the deposition velocities.
Conversely, the deposition velocity due to diffusion increases gradually over the 4 h deposition period, rising from 8.04 × 10⁻⁵ m/s to 8.08 × 10⁻⁵ m/s. The increase is caused by the escalating average gas temperature with the decreasing heat transfer efficiency, intensifying the molecular movement and thereby augmenting the diffusion deposition velocity. Additionally, similar to the trend in thermal–hydraulic performance mentioned earlier, the variation in the different deposition velocities gradually slows down over time and eventually stabilizes.
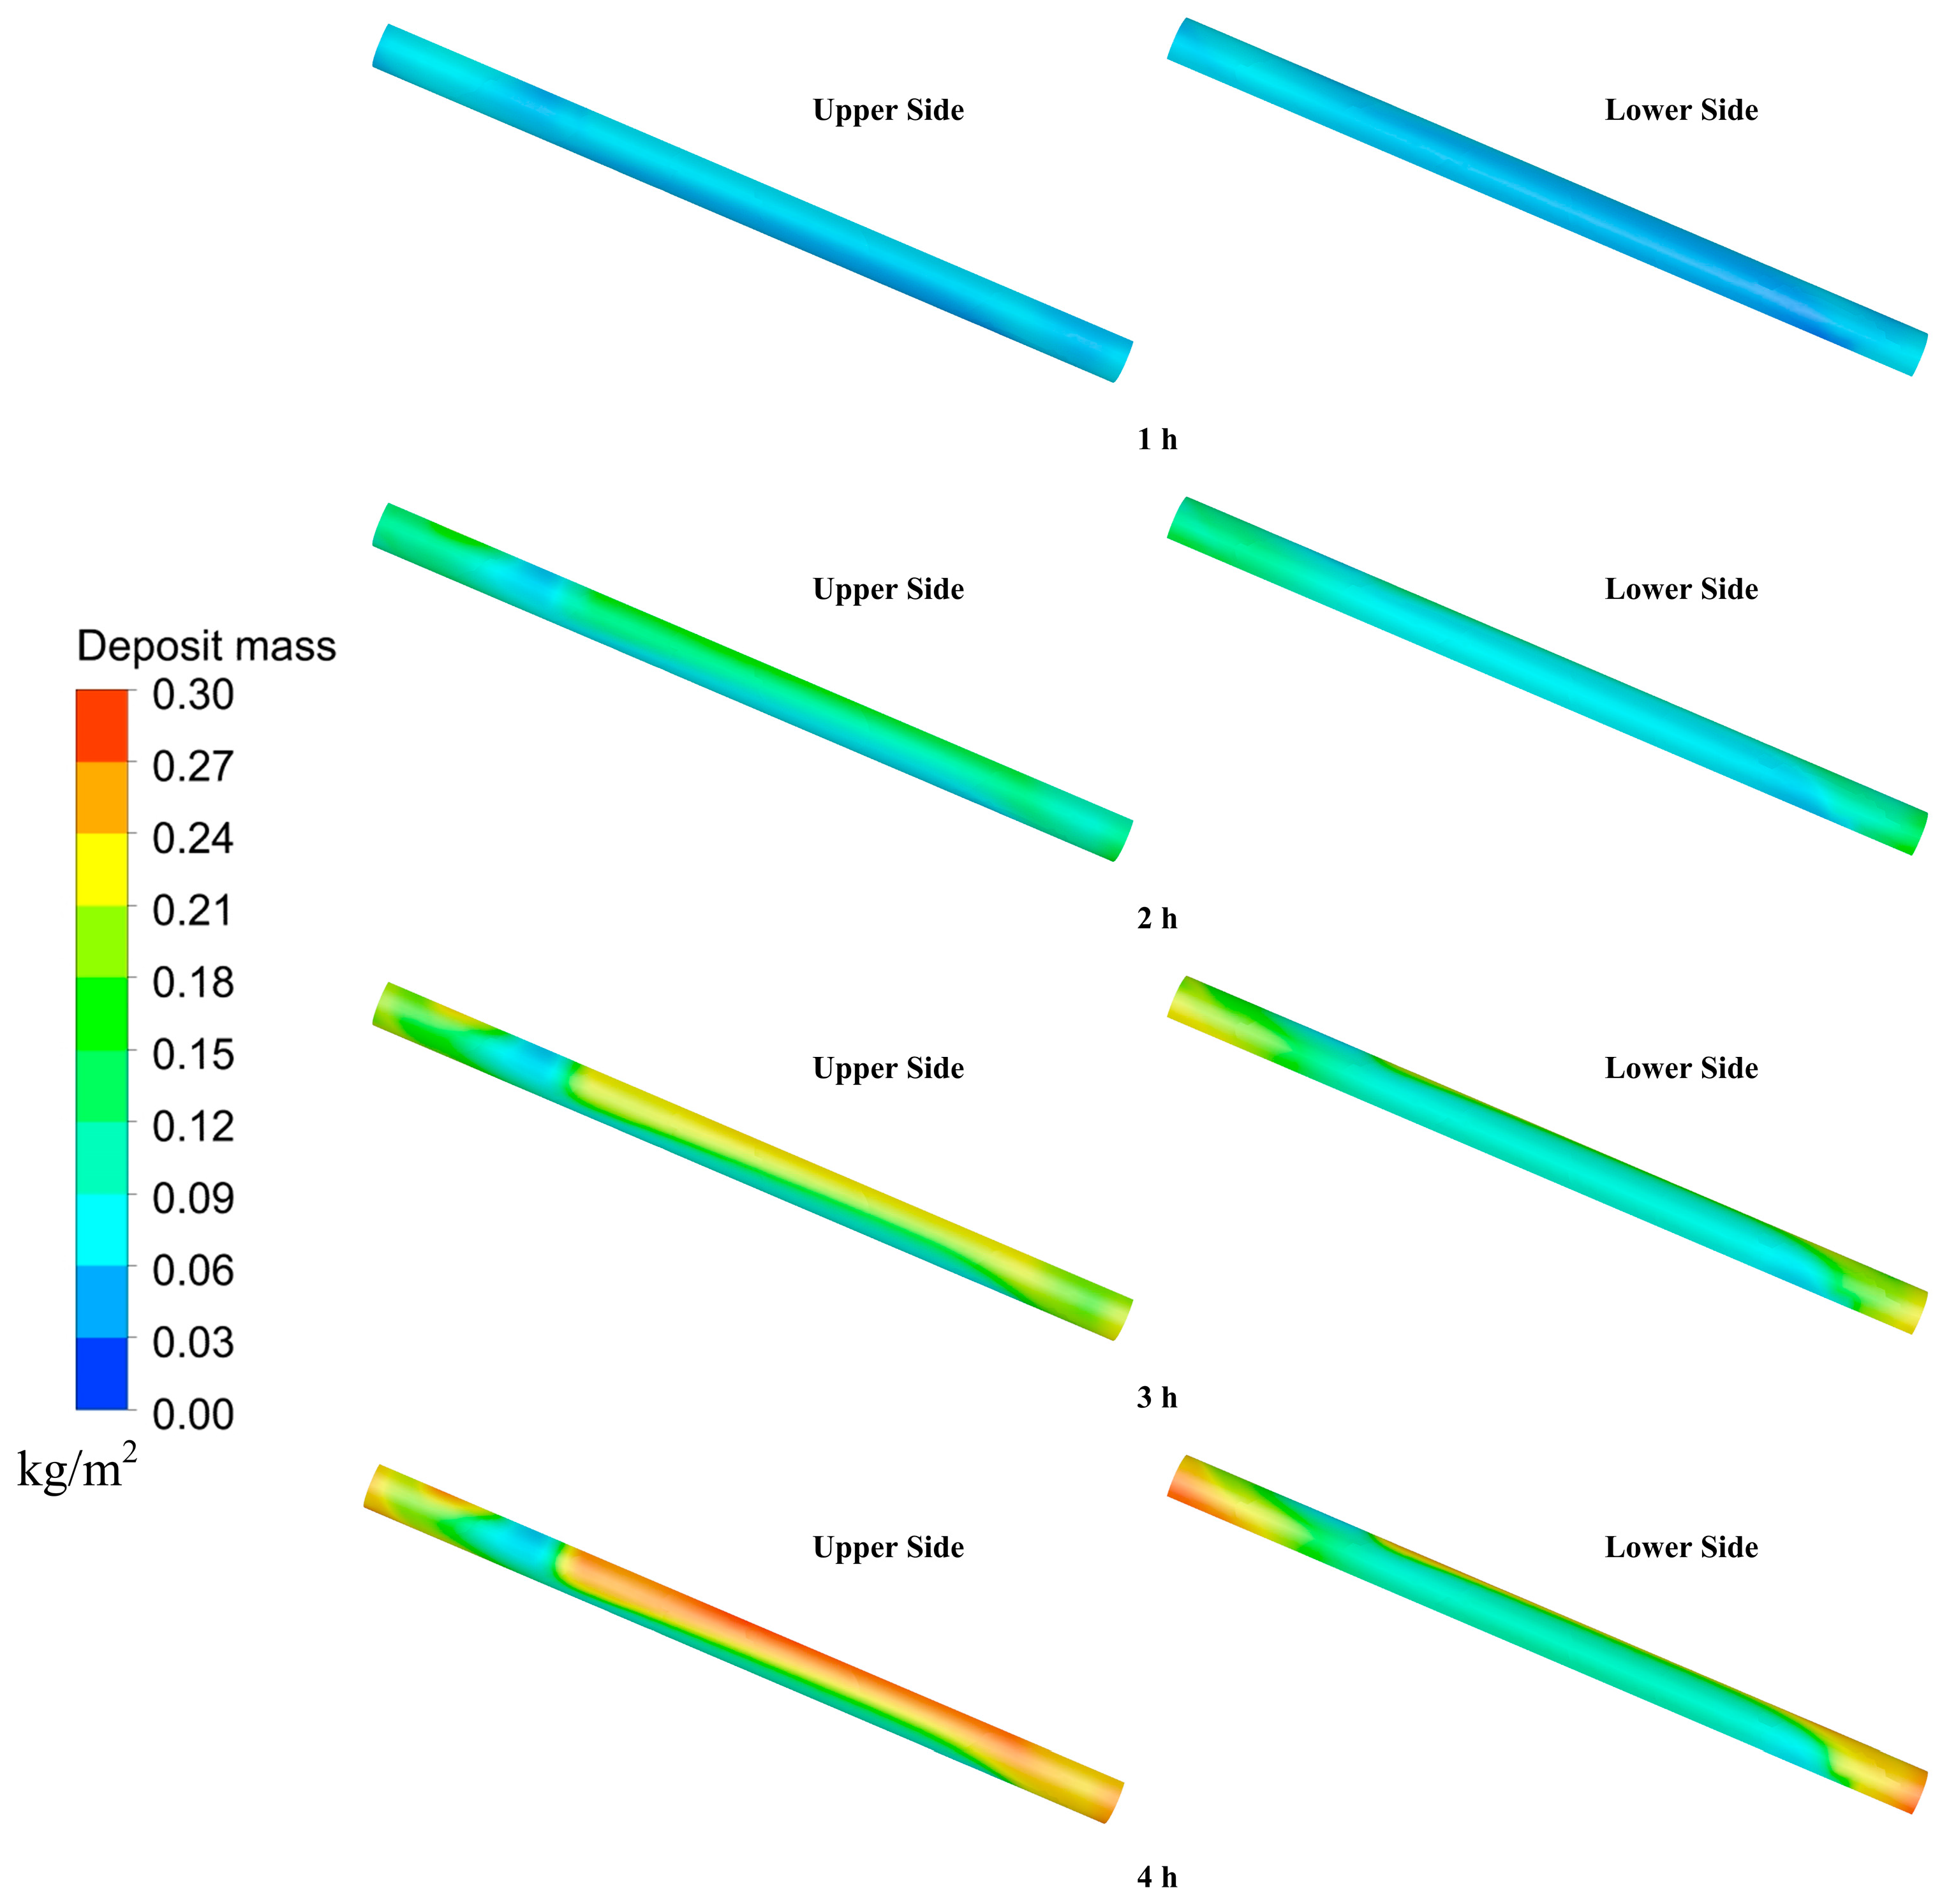
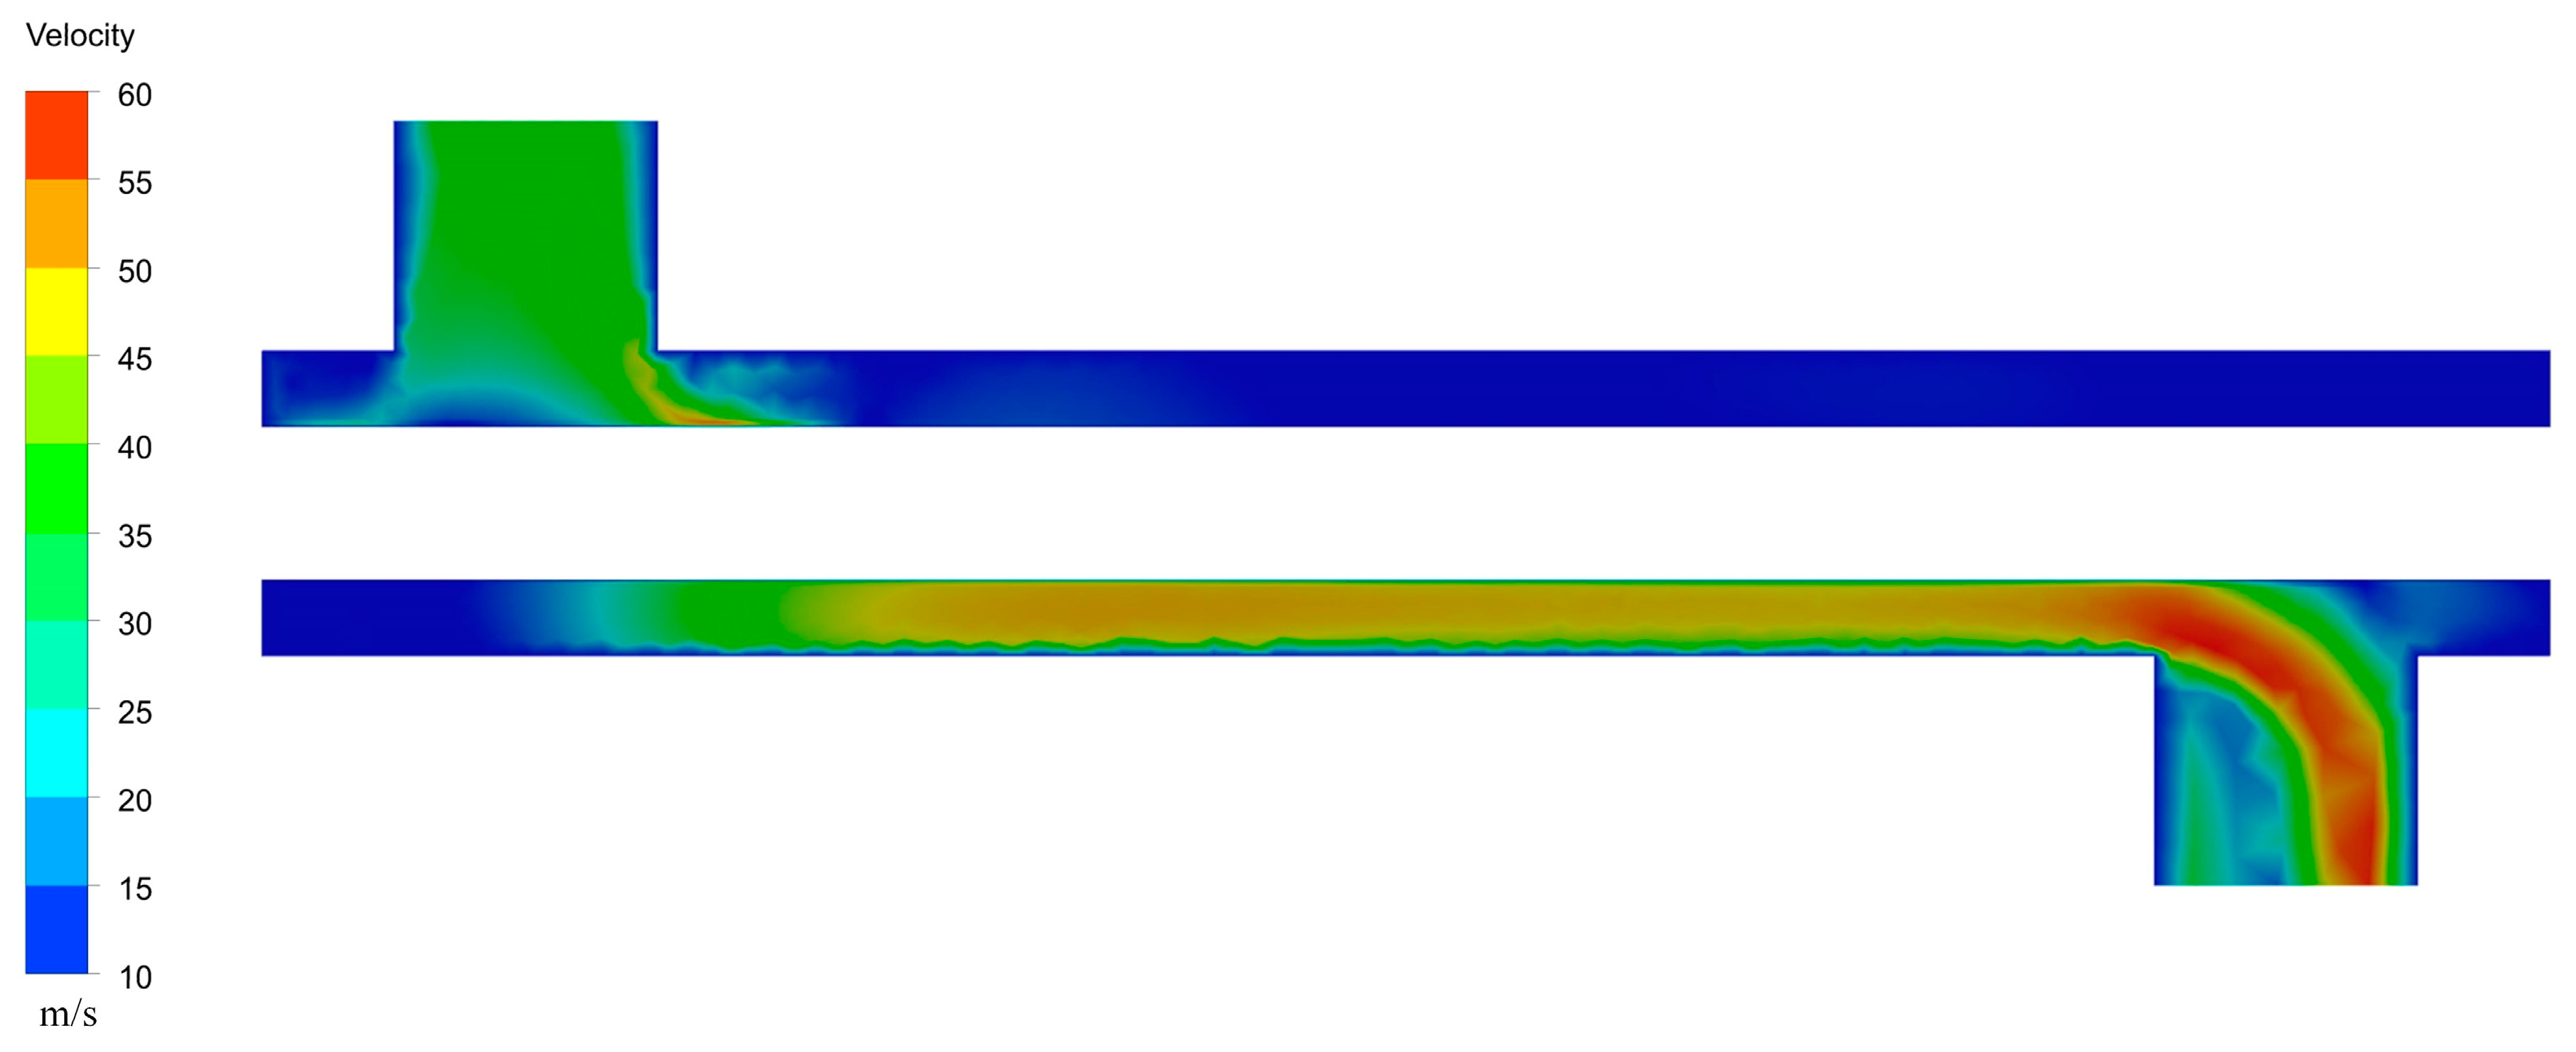
Figure 8 and Figure 9 depict the variation in deposit mass distribution on the heat transfer surface during the 4 h deposition period and the velocity distribution on the symmetrical surface after 4 h of soot deposition. It is evident that as deposition progresses, the deposition amount on the heat transfer tubes increases gradually, reaching a maximum of approximately 0.29 kg/m2 by the end of the 4 h deposition period. In this case, due to the presence of corners, the gas velocity is slower at both ends of the tubes, resulting in more pronounced deposition compared to the middle sections. Additionally, at the beginning of the deposition process, the deposition amounts at different positions are roughly the same. However, as deposition progresses, the deposition on the upper side of the heat-exchange surface gradually exceeds that on the lower side, mainly determined by the gas flow pattern. The specific locations of upper side and lower side can be referenced in Figure 1. Moreover, as depicted in Figure 9, due to the short effective heat transfer length, the flow of exhaust gas is not uniform in the exhaust heat exchanger. Consequently, the gas velocity and particle removal rate in the lower side is much larger than that in the upper side, ultimately resulting in more pronounced deposition on the upper side. To summarize, in the design of exhaust exchangers, efforts should be made to minimize additional soot deposition caused by corners and uneven flow, thereby enhancing the long-term performance of the exhaust heat exchanger.
As shown in Figure 8, it is clear that the deposit mass on heat transfer surface varies significantly between the ends and the center of the tube. Thus, to further illustrate the distribution of deposit layer thickness, the simulation results of the deposit mass distribution at the center sections of inlet (Section 1), tube center (Section 2), and outlet (Section 3) are analyzed, and the specific locations of these three sections are shown in Figure 10.
Figure 11a illustrates the deposit layer thickness at Section 1 after 4 h of soot deposition, with the deposit layer thickness ranging approximately from 0.082 mm to 0.138 mm. Due to its proximity to the end of tube, the lower side of this section exhibits lower gas velocity, leading to more pronounced soot deposition. Additionally, although the upper side of the inlet center section shows higher flow velocity, the direct collision of particles with the tube surface leads to an increased deposit mass compared to the adjacent areas.
Figure 11b shows the distribution of deposit layer thickness at Section 2, with the deposit layer thickness ranging approximately from 0.065 mm to 0.163 mm. This section represents the deposition distribution in the middle part of exhaust heat exchanger well. As previously discussed, due to the differential particle removal rate caused by the difference in gas velocities on the upper and lower sides, soot deposition is more pronounced on the upper side.
Figure 11c displays the distribution of deposit layer thickness at Section 3, with the deposit layer thickness ranging approximately from 0.062 mm to 0.140 mm. In contrast to the trend observed at the inlet (Section 1), the lower gas velocity on the upper side results in a more pronounced deposition. Additionally, due to proximity to the outlet, partial soot particles follow the movement of the gas and leave the tube surface, leading to a significant decrease in deposit mass on the lower side compared to other positions.
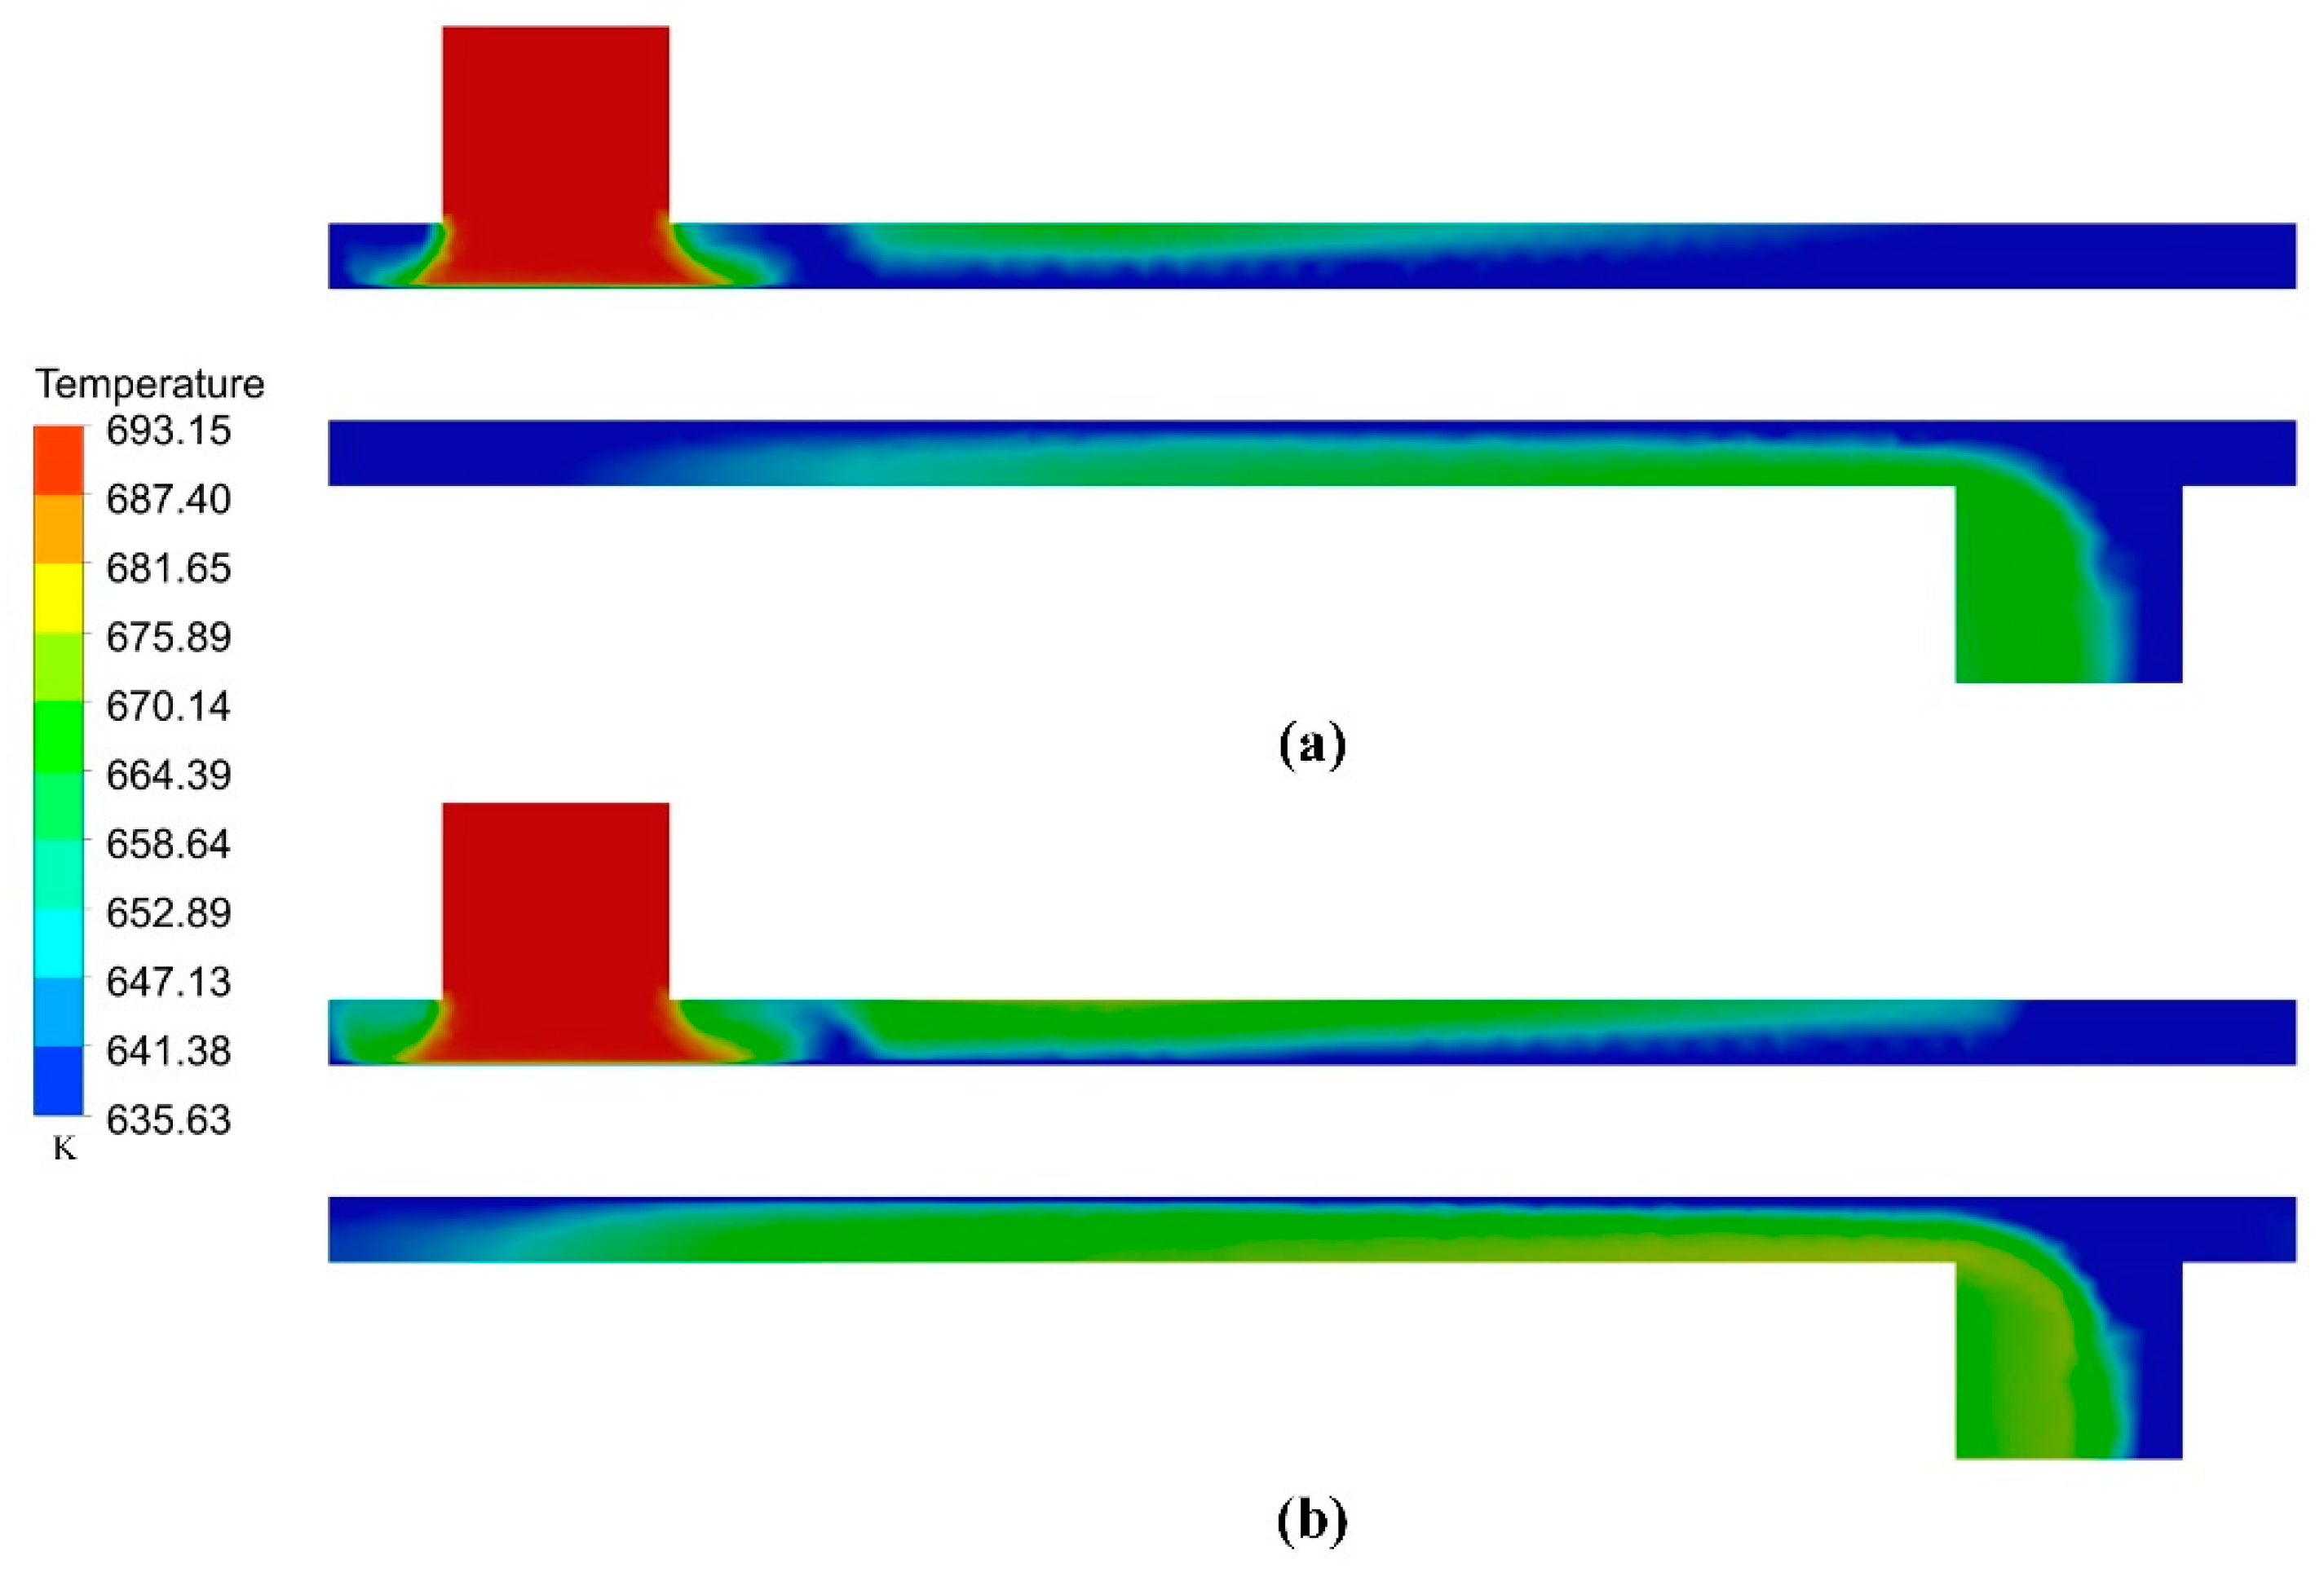
Figure 12 displays the variation in temperature distribution in the symmetry plane. The figures show that, as the heat-transfer process progresses, the exhaust gas temperature decreases gradually along the flow direction. Due to the influence of thermophoresis, areas with larger temperature gradients exhibit higher rates of soot deposition, resulting in a more uniform temperature distribution after the 4 h deposition period. Additionally, the heat transfer performance of the exhaust heat exchanger decreases as deposition progresses, causing the outlet temperature to rise from 635.63 K to 649.05 K during the 4 h deposition period. Moreover, as shown in Figure 8, deposition on the upper side is significantly higher than that on the lower side; thus, the temperature distribution changes more prominently on the upper side during the deposition period.

4. Performance Variation under All Engine Operating Conditions

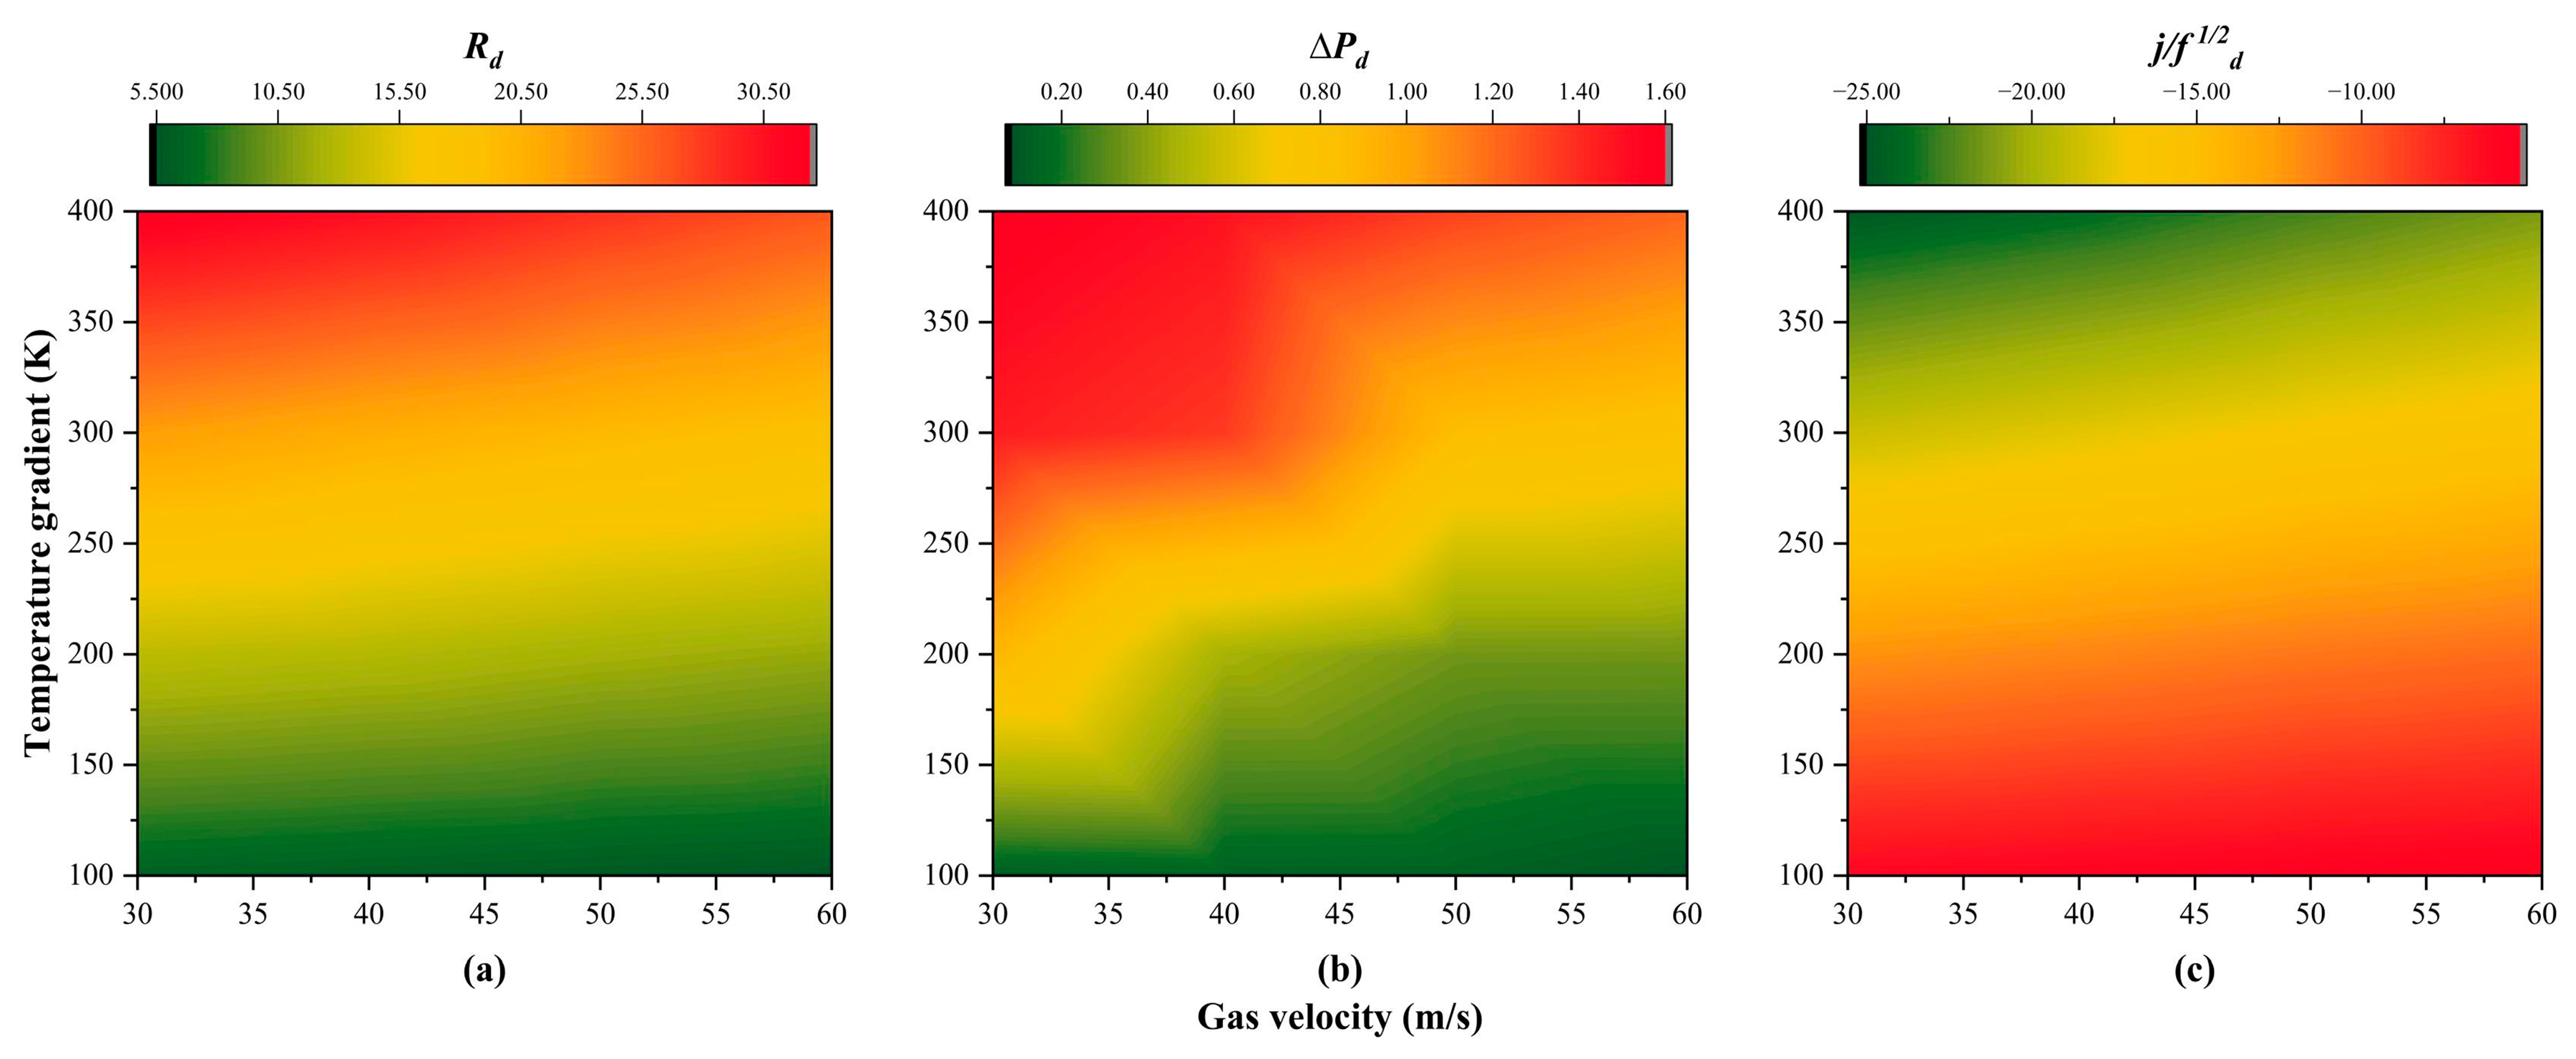
To study the variation in the exhaust heat exchanger performance under all engine-operating conditions, the normalized thermal–hydraulic behaviors under the conditions of different gas velocities (30–60 m/s) and temperature gradients (100–400 K) are simulated.
The variation in normalized relative thermal resistance is shown in Figure 13a. Under all engine-operating conditions, the increase in the normalized relative thermal resistance varies from 5.54% to 32.39% after the 4 h deposition period. The figure also indicates that the increase in normalized relative thermal resistance is more pronounced in conditions with high temperature gradients and low flow velocities. This phenomenon can be attributed to the following main reasons: Firstly, under high temperature gradients, the deposit mass increases rapidly due to the effect of thermophoresis; secondly, particle removal efficiency decreases gradually with decreasing gas velocity, further deteriorating the heat transfer performance.
The variation in normalized relative pressure drop and normalized relative j / f 1 / 2 under all engine-operating conditions is detailed in Figure 13b,c. Under all engine-operating conditions, the increase in the normalized relative pressure drop varies from 0.09% to 1.60%, and the deterioration in the normalized relative j / f 1 / 2 varies from 5.26% to 24.91%. As mentioned earlier, the impact of deposition on the flow area is not considered in the deposition model, resulting in minimal impact of soot deposition on pressure drop in the simulation results. Therefore, the trend in comprehensive performance aligns closely with that of heat transfer performance. The exhaust heat exchanger with high gas velocity and low temperature gradient exhibits optimal performance. Considering that high temperature gradients are crucial for the design of a high-efficiency heat exchanger, employing high gas velocity is a more viable method for mitigating deposition in the design of shell-and-tube exhaust heat exchanger.

5. Conclusions

In this paper, the long-term performance of the shell-and-tube exhaust heat exchanger is analyzed by a CFD-based predictive model. The variations in key characteristics, such as heat transfer, pressure drop, comprehensive performance, and deposition distribution, are analyzed during a 4 h deposition period. The results indicate that soot deposition significantly impairs the long-term performance of the exhaust heat exchanger. The primary results are listed below:
(1)
Soot deposition is primarily influenced by thermophoresis, and both thermal resistance and pressure drop rise gradually during the 4 h deposition period.
(2)
The exhaust heat exchanger with high gas velocity and low temperature gradient exhibits optimal performance after the 4 h deposition period.
(3)
Under all engine-operating conditions, the deterioration in the normalized relative j / f 1 / 2 varies from 5.26% to 24.91%. Meanwhile, in the design of the exhaust heat exchangers, employing a high-design gas velocity is an effective method for mitigating soot deposition.
(4)
It is undeniable that the deposit layer thickness on the flow area will be non-negligible after prolonged deposition. In future works, this aspect will be integrated into the deposition model to better guide the design of exhaust heat exchangers with superior long-term performance.

Author Contributions

Conceptualization, T.C.; Methodology, Y.W.; Software, M.F.; Validation, J.C.; Formal analysis, X.L.; Writing—original draft, T.C., H.L. and M.F.; Writing—review & editing, T.C., Y.W., J.C. and X.L.; Supervision, H.L. All authors have read and agreed to the published version of the manuscript.

Funding

This research received no external funding.

Data Availability Statement

The original contributions presented in the study are included in the article, further inquiries can be directed to the corresponding author.

Conflicts of Interest

The authors declare no conflicts of interest.

References

  1. BP p.l.c. BP Statistical Review of World Energy 2019; BP Plc: London, UK, 2019. [Google Scholar]
  2. Doğan, B.; Driha, O.M.; Balsalobre Lorente, D.; Shahzad, U. The mitigating effects of economic complexity and renewable energy on carbon emissions in developed countries. Sustain. Dev. 2021, 29, 1–284. [Google Scholar] [CrossRef]
  3. Bagherian, M.A.; Mehranzamir, K.; Pour, A.B.; Rezania, S.; Taghavi, E.; Nabipour-Afrouzi, H.; Dalvi-Esfahani, M.; Alizadeh, S.M. Classification and analysis of optimization techniques for integrated energy systems utilizing renewable energy sources: A review for CHP and CCHP systems. Processes 2021, 9, 339. [Google Scholar] [CrossRef]
  4. Heywood, J.B. Internal Combustion Engine Fundamentals; McGraw-Hill Education: New York, NY, USA, 2018. [Google Scholar]
  5. European Commission. Horizon 2020 Work Programme from 2018 to 2020. Available online: https://ec.europa.eu/commission/presscorner/detail/en/MEMO_17_4123 (accessed on 27 October 2017).
  6. Plotkin, S.; Stephens, T.; McManus, W. Vehicle Technology Deployment Pathways: An Examination of Timing and Investment Constraints; Argonne National Laboratory: Lemont, IL, USA, 2013. [Google Scholar]
  7. Pesyridis, A.; Asif, M.S.; Mehranfar, S.; Mahmoudzadeh Andwari, A.; Gharehghani, A.; Megaritis, T. Design of the organic Rankine cycle for high-efficiency diesel engines in marine applications. Energies 2023, 16, 4374. [Google Scholar] [CrossRef]
  8. Pandiyarajan, V.; Pandian, M.C.; Malan, E.; Velraj, R.; Seeniraj, R. Experimental investigation on heat recovery from diesel engine exhaust using finned shell and tube heat exchanger and thermal storage system. Appl. Energy 2011, 88, 77–87. [Google Scholar] [CrossRef]
  9. Cho, K.-C.; Shin, K.-Y.; Shim, J.; Bae, S.-S.; Kwon, O.-D. Performance Analysis of a Waste Heat Recovery System for a Biogas Engine Using Waste Resources in an Industrial Complex. Energies 2024, 17, 727. [Google Scholar] [CrossRef]
  10. Steinhagen, R.; Müller-Steinhagen, H.; Maani, K. Problems and costs due to heat exchanger fouling in New Zealand industries. Heat Transf. Eng. 1993, 14, 19–30. [Google Scholar] [CrossRef]
  11. Bott, T.R. Fouling of Heat Exchangers; Elsevier: Amsterdam, The Netherlands, 1995. [Google Scholar]
  12. Müller-Steinhagen, H.; Malayeri, M.; Watkinson, A. Heat Exchanger Fouling: Mitigation and Cleaning Strategies. Heat Transf. Eng. 2011, 32, 189–196. [Google Scholar] [CrossRef]
  13. Hurt, R.H.; Crawford, G.P.; Shim, H.-S. Equilibrium nanostructure of primary soot particles. Proc. Combust. Inst. 2000, 28, 2539–2546. [Google Scholar] [CrossRef]
  14. Lee, B.U.; Byun, D.S.; Bae, G.-N.; Lee, J.-H. Thermophoretic deposition of ultrafine particles in a turbulent pipe flow: Simulation of ultrafine particle behaviour in an automobile exhaust pipe. J. Aerosol Sci. 2006, 37, 1788–1796. [Google Scholar] [CrossRef]
  15. Park, S.; Lee, K.S.; Park, J. Parametric study on EGR cooler fouling mechanism using model gas and Light-Duty diesel engine exhaust gas. Energies 2018, 11, 3161. [Google Scholar] [CrossRef]
  16. Grillot, J.; Icart, G. Fouling of a cylindrical probe and a finned tube bundle in a diesel exhaust environment. Exp. Therm. Fluid Sci. 1997, 14, 442–454. [Google Scholar] [CrossRef]
  17. Abd-Elhady, M.; Rindt, C.; Wijers, J.; Van Steenhoven, A.; Bramer, E.A.; Van der Meer, T.H. Minimum gas speed in heat exchangers to avoid particulate fouling. Int. J. Heat Mass Transf. 2004, 47, 3943–3955. [Google Scholar] [CrossRef]
  18. Abd-Elhady, M.S.; Zornek, T.; Malayeri, M.R.; Balestrino, S.; Szymkowicz, P.G.; Müller-Steinhagen, H. Influence of gas velocity on particulate fouling of exhaust gas recirculation coolers. Int. J. Heat Mass Transf. 2011, 54, 838–846. [Google Scholar] [CrossRef]
  19. Aiello, V.C.; Kini, G.; Staedter, M.A.; Garimella, S. Investigation of fouling mechanisms for diesel engine exhaust heat recovery. Appl. Therm. Eng. 2020, 181, 115973. [Google Scholar] [CrossRef]
  20. Lee, B.-H.; Hwang, M.-Y.; Seon, C.-Y.; Jeon, C.-H. Numerical prediction of characteristics of ash deposition in heavy fuel oil heat recovery steam generator. J. Mech. Sci. Technol. 2014, 28, 2889–2900. [Google Scholar] [CrossRef]
  21. Kasper, R.; Turnow, J.; Kornev, N. Numerical modeling and simulation of particulate fouling of structured heat transfer surfaces using a multiphase Euler-Lagrange approach. Int. J. Heat Mass Transf. 2017, 115, 932–945. [Google Scholar] [CrossRef]
  22. Han, Z.; Xu, Z.; Sun, A.; Yu, X. The deposition characteristics of micron particles in heat exchange pipelines. Appl. Therm. Eng. 2019, 158, 113732. [Google Scholar] [CrossRef]
  23. Silaipillayarputhur, K.; Khurshid, H. The design of shell and tube heat exchangers–A review. Int. J. Mech. Prod. Eng. Res. Dev. 2019, 9, 87–102. [Google Scholar]
  24. Patel, D.S.; Parmar, R.R.; Prajapati, V.M. CFD Analysis of Shell and tube heat exchangers-A review. Int. Res. J. Eng. Technol. 2015, 17, 2231–2235. [Google Scholar]
  25. Hu, S.; Liang, Y.; Ding, R.; Xing, L.; Su, W.; Lin, X.; Zhou, N. Research on Off-Design Characteristics and Control of an Innovative S-CO2 Power Cycle Driven by the Flue Gas Waste Heat. Energies 2024, 17, 1871. [Google Scholar] [CrossRef]
  26. ANSYS Fluent. ANSYS FLUENT Theory Guide: Version 2020R1. Available online: https://ansyshelp.ansys.com/ (accessed on 30 July 2024).
  27. Wang, Q.-W.; Lin, M.; Zeng, M.; Tian, L. Investigation of turbulent flow and heat transfer in periodic wavy channel of internally finned tube with blocked core tube. J. Heat Transf. 2008, 130, 061801. [Google Scholar] [CrossRef]
  28. Jiaqiang, E.; Han, D.; Deng, Y.; Zuo, W.; Qian, C.; Wu, G.; Peng, Q.; Zhang, Z. Performance enhancement of a baffle-cut heat exchanger of exhaust gas recirculation. Appl. Therm. Eng. 2018, 134, 86–94. [Google Scholar]
  29. Epstein, N. Thinking about heat transfer fouling: A 5 × 5 matrix. Heat Transf. Eng. 1983, 4, 43–56. [Google Scholar] [CrossRef]
  30. Abarham, M.; Hoard, J.; Assanis, D.N.; Styles, D.; Curtis, E.W.; Ramesh, N. Review of soot deposition and removal mechanisms in EGR coolers. SAE Int. J. Fuels Lubr. 2010, 3, 690–704. [Google Scholar] [CrossRef]
  31. Ding, Y.; Chen, T.; Tian, H.; Shu, G.; Zhang, H. Experimental and numerical investigation of soot deposition on exhaust heat exchanger tube banks. Therm. Sci. Eng. Prog. 2023, 39, 101699. [Google Scholar] [CrossRef]
  32. Pulkrabek, W.W. Engineering fundamentals of the internal combustion engine. J. Eng. Gas Turbines Power 2004, 126, 106. [Google Scholar] [CrossRef]
  33. Li, X. Research on Design and Performance Optimization of Diesel Engine Waste Heat Recovery Bottoming System and Exhaust Heat Exchanger; Tianjin University: Tianjin, China, 2014. [Google Scholar]
  34. Lemmon, E.W.; Huber, M.L.; McLinden, M.O. NIST reference fluid thermodynamic and transport properties–REFPROP. NIST Stand. Ref. Database 2002, 23, v7. [Google Scholar]
  35. Poling, B.E.; Prausnitz, J.M.; O’connell, J.P. The Properties of Gases and Liquids; Mcgraw-Hill: New York, NY, USA, 2001; Volume 5. [Google Scholar]
  36. Warey, A.; Balestrino, S.; Szymkowicz, P.; Malayeri, M.R. A one-dimensional model for particulate deposition and hydrocarbon condensation in exhaust gas recirculation coolers. Aerosol Sci. Technol. 2012, 46, 198–213. [Google Scholar] [CrossRef]
  37. Tian, J. Study on Effect of PODE on PM Properties of Diesel Engine Exhaust and DPF Regeneration; Jiangsu University: Zhenjiang, China, 2020. [Google Scholar]
  38. Malayeri, M.R.; Zornek, T.; Balestrino, S.; Warey, A.; Szymkowicz, P.G. Deposition of nanosized soot particles in various EGR coolers under thermophoretic and isothermal conditions. Heat Transf. Eng. 2013, 34, 665–673. [Google Scholar] [CrossRef]
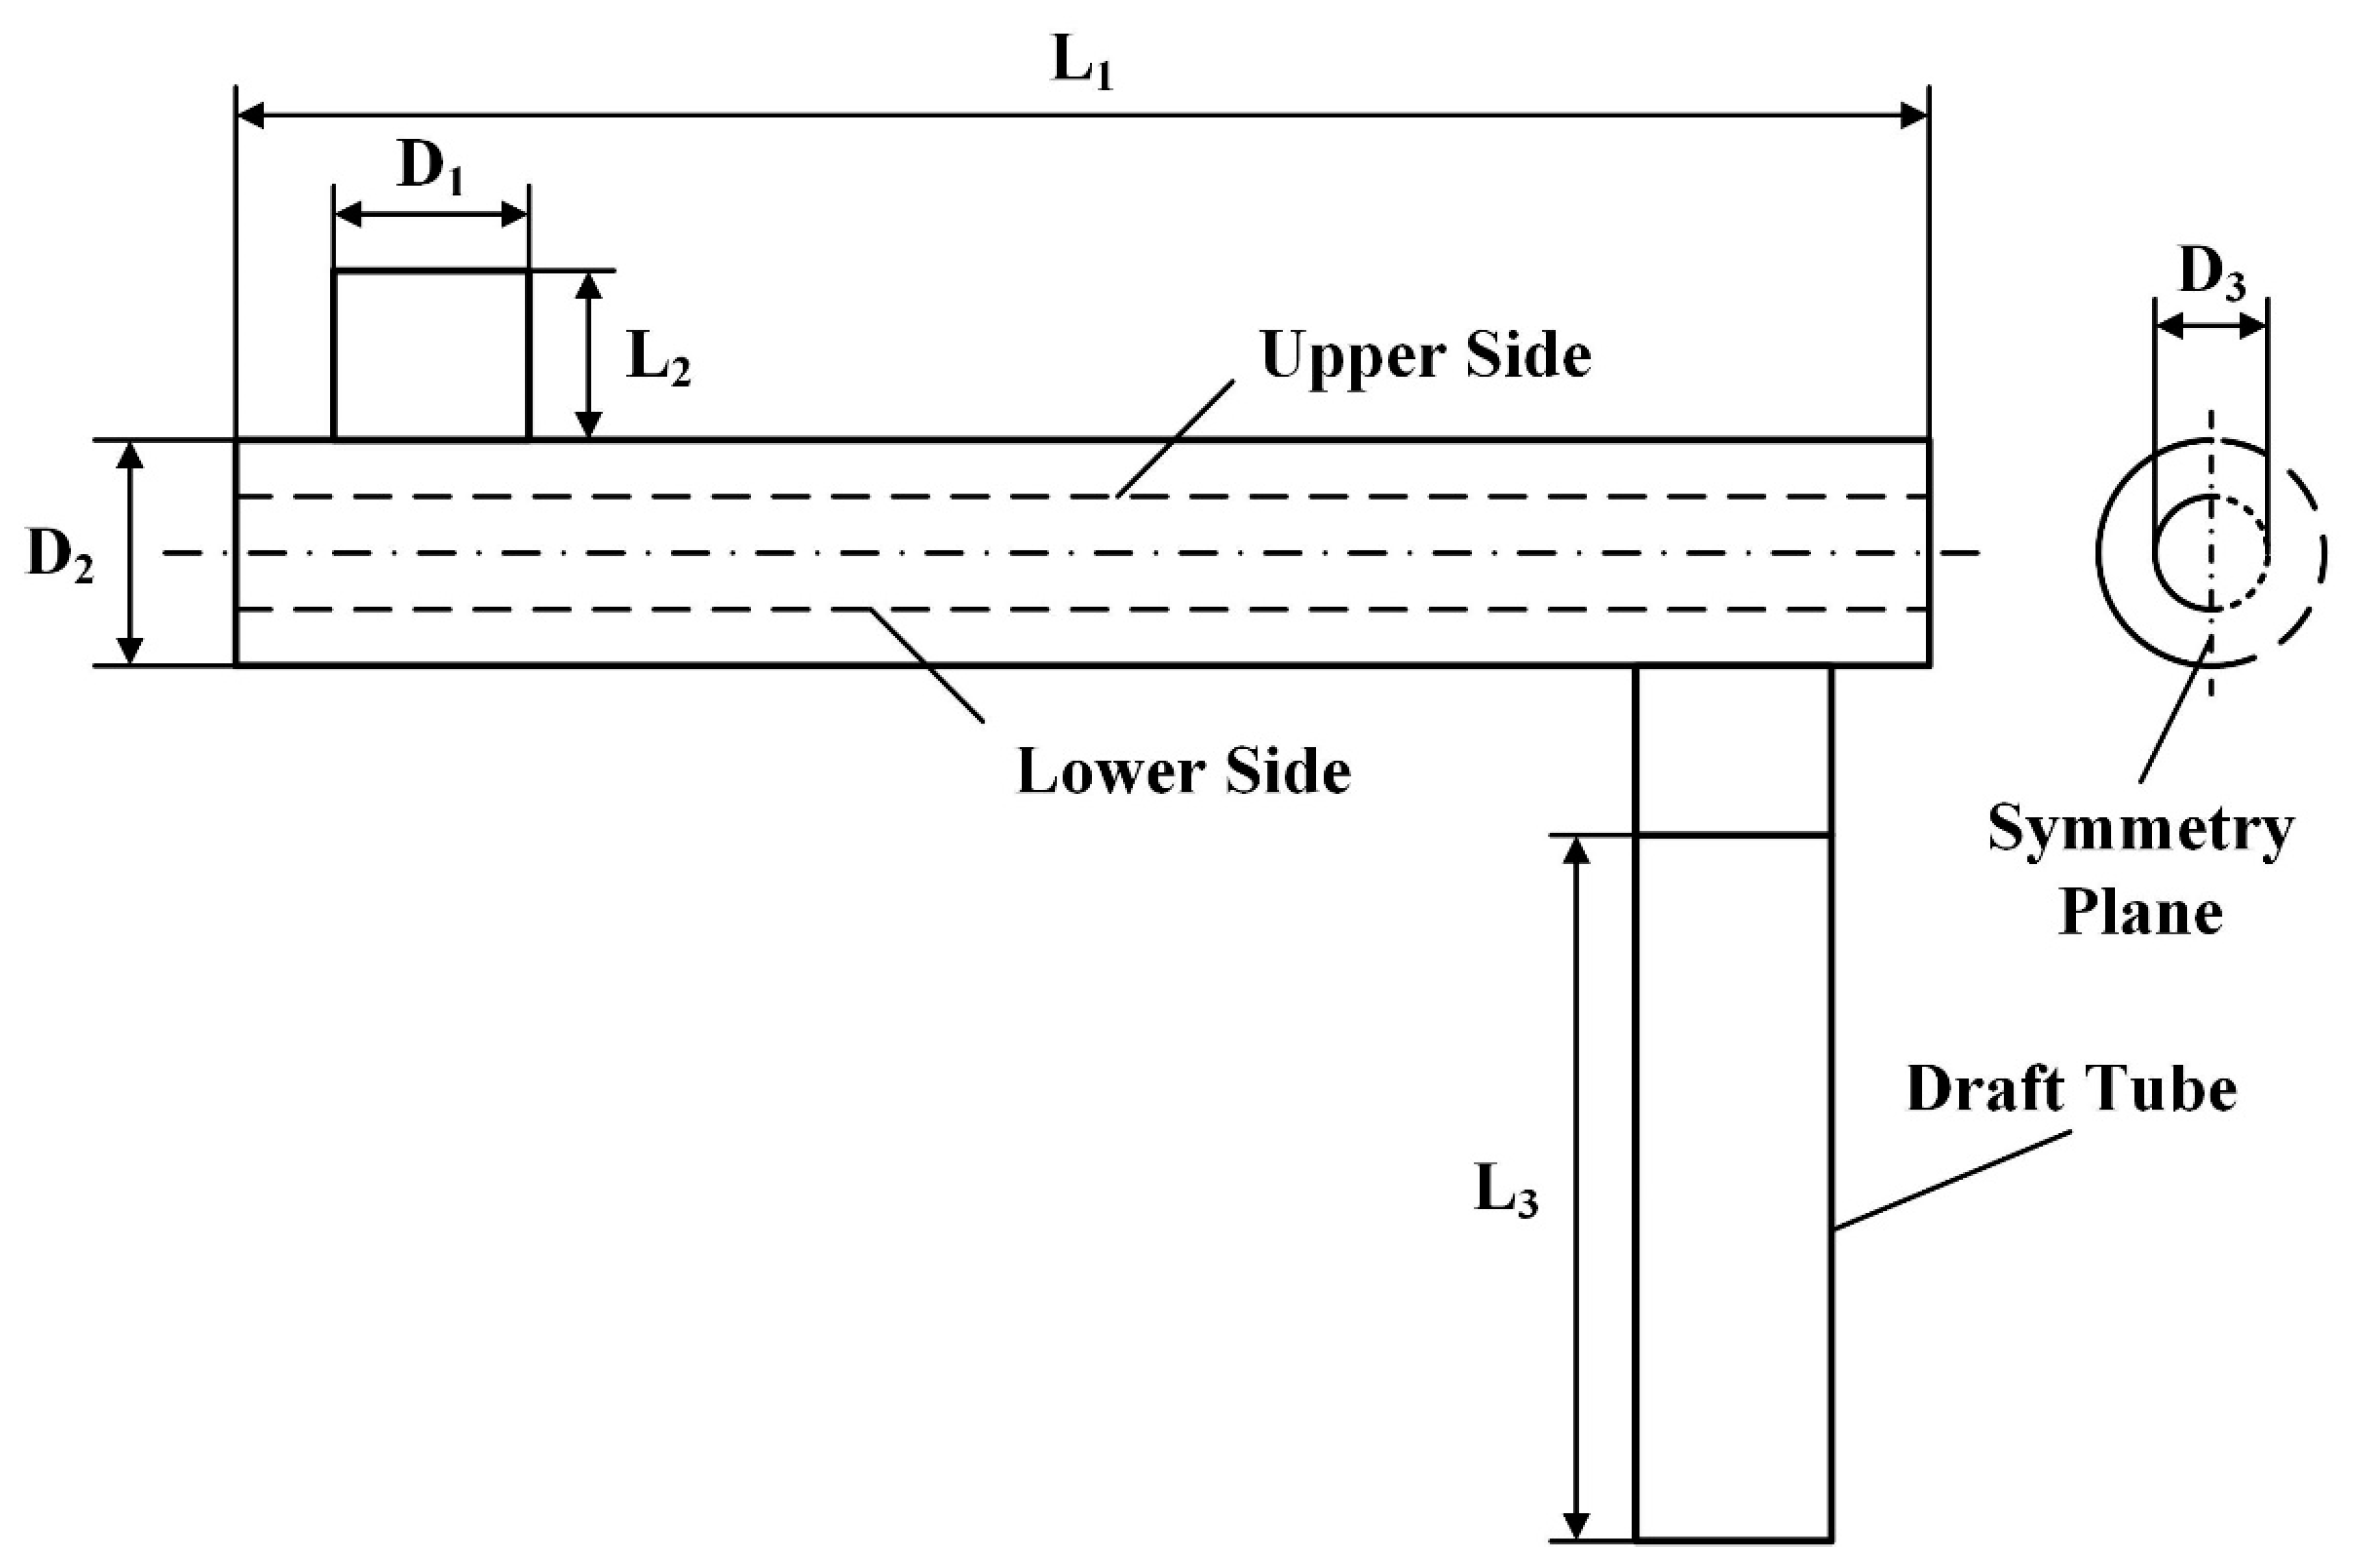
Figure 1. Schematics of exhaust heat exchanger: L 1 = 120 mm; L 2 = 12 mm; L 3 = 50 mm; D 1 = 13.86 mm; D 2 = 16 mm; D 3 = 8 mm.
Energies 17 04259 g001
Figure 2. Physical properties of exhaust gas: (a) density, (b) specific heat capacity, (c) thermal conductivity, and (d) viscosity.
Energies 17 04259 g002
Figure 3. Difference between simulation results and experimental data investigated by Malayeri et al. [38].
Energies 17 04259 g003
Figure 4. Variation in (a) relative thermal resistance and (b) normalized relative thermal resistance during 4 h deposition period.
Energies 17 04259 g004
Figure 5. Variation in (a) relative pressure drop and (b) normalized relative pressure drop during 4 h deposition period.
Energies 17 04259 g005
Figure 6. Variation in (a) j / f 1 / 2 f and (b) j / f 1 / 2 d during 4 h deposition period.
Energies 17 04259 g006
Figure 7. Variation in different deposition velocities during 4 h deposition period.
Energies 17 04259 g007
Figure 8. Variation in deposit mass distribution on the heat transfer surface during 4 h deposition period ( T = 400 K, u i n = 30 m/s).
Energies 17 04259 g008
Figure 9. The velocity distribution of the exhaust heat exchanger in the symmetry plane.
Energies 17 04259 g009
Figure 10. The specific locations of the three sections.
Energies 17 04259 g010
Figure 11. Deposit layer thickness distribution on (a) Section 1, (b) Section 2, and (c) Section 3 after 4 h deposition period ( T = 400 K, u i n = 30 m/s).
Energies 17 04259 g011
Figure 12. The temperature distribution of the exhaust heat exchanger in the symmetry plane under the (a) clean air condition and (b) 4 h deposition condition.
Energies 17 04259 g012
Figure 13. Variation in (a) normalized relative thermal resistance, (b) normalized relative pressure drop, and (c) j / f 1 / 2 d under all ICE operation conditions.
Energies 17 04259 g013
Table 1. Boundary conditions of exhaust heat exchanger.
ParameterUnitValues
Inlet temperature of exhaust gasK393.15–693.15
Inlet velocity of exhaust gasm/s30–60
Outlet pressure of exhaust gasPa0
Temperature of tube wallK293.15
Table 2. Formulas of deposit and removal process.
ParameterFormulas/
Deposit Process
Diffusion deposition velocity V d = 0.057 u * S c p 2 / 3 , where
u * = τ s ρ g ,   S c p = v g D p ,
D p = k b T g C c 3 π μ g d p
k b = 1.380649 × 10⁻²³ J/K
Inertial impaction deposition velocity V t = 4.5 × 10 4 u * τ p u * 2 v g /
Thermophoretic deposition velocity V t h = K t h v g T g T , where
K t h = 2 C s C c 1 + 3 C m K n × k g / k p + C t K n 1 + 2 k g / k p + 2 C t K n ,
C c = 1 + K n A + B e C K n
C s = 1.14 ,   C m = 1.17,
C t = 2.18 ,   A = 1.2
B = 0.4 ,   C = 1.1
Particle-sticking probability S P F V F D F D > F V = 1 F D F V , where
F D = 8 ρ g u * d p 2
F V = A H d p 12 Z 0 2
Z 0 = 0.2 d p
A H = 10–20 J
Removal Process
Removal mass m a s s r e m , c e l l t = K τ s m a s s n e t , a l l t t ψ ψ = 1
Table 3. Physical properties of exhaust gas within the operating temperature range.
ParameterUnitTemperature (K)Formula
Densitykg/m3320–800 0.000002488116 x 2 0.004105207 x + 2.166914
Specific heat capacityJ/(kg∙K) 0.2591265 x + 959.9381
Thermal conductivityW/(m∙K) 0.0000635358 x + 0.006465345
Viscositykg/(m∙s) 3.6535 × 10 8 x + 7.16745 × 10 6
Table 4. Related parameters of soot particles.
ParameterUnitValue
Soot particles
Diameternm130
Mass concentrationkg/m31.7 × 10−5
Densitykg/m31800
Thermal conductivity W/m∙K0.5
Deposit layer
Densitykg/m335
Thermal conductivityW/m∙K0.05
Table 5. The computed outlet gas temperature for different grid resolutions.
Inlet Gas Velocity
(m/s)
Inlet Gas
Temperature
(K)
Tube Wall
Temperature
(K)
NumberNumber of GridsHeat Exchange Capacity
(W)
30673.15353.15Grid 157,954121.57
Grid 276,588126.85
Grid 398,918125.62
Grid 4117,994127.21
Grid 5136,568125.73
Grid 6161,024126.33
Disclaimer/Publisher’s Note: The statements, opinions and data contained in all publications are solely those of the individual author(s) and contributor(s) and not of MDPI and/or the editor(s). MDPI and/or the editor(s) disclaim responsibility for any injury to people or property resulting from any ideas, methods, instructions or products referred to in the content.