
Study of a Novel 3D Façade Configuration and Its Impact on Energy Performance and Office Space Sustainability


Abstract
:1. Introduction
- Optimisation of the dimensions and angles of multi-angled façade systems can reduce building energy consumption and improve internal microclimate conditions;
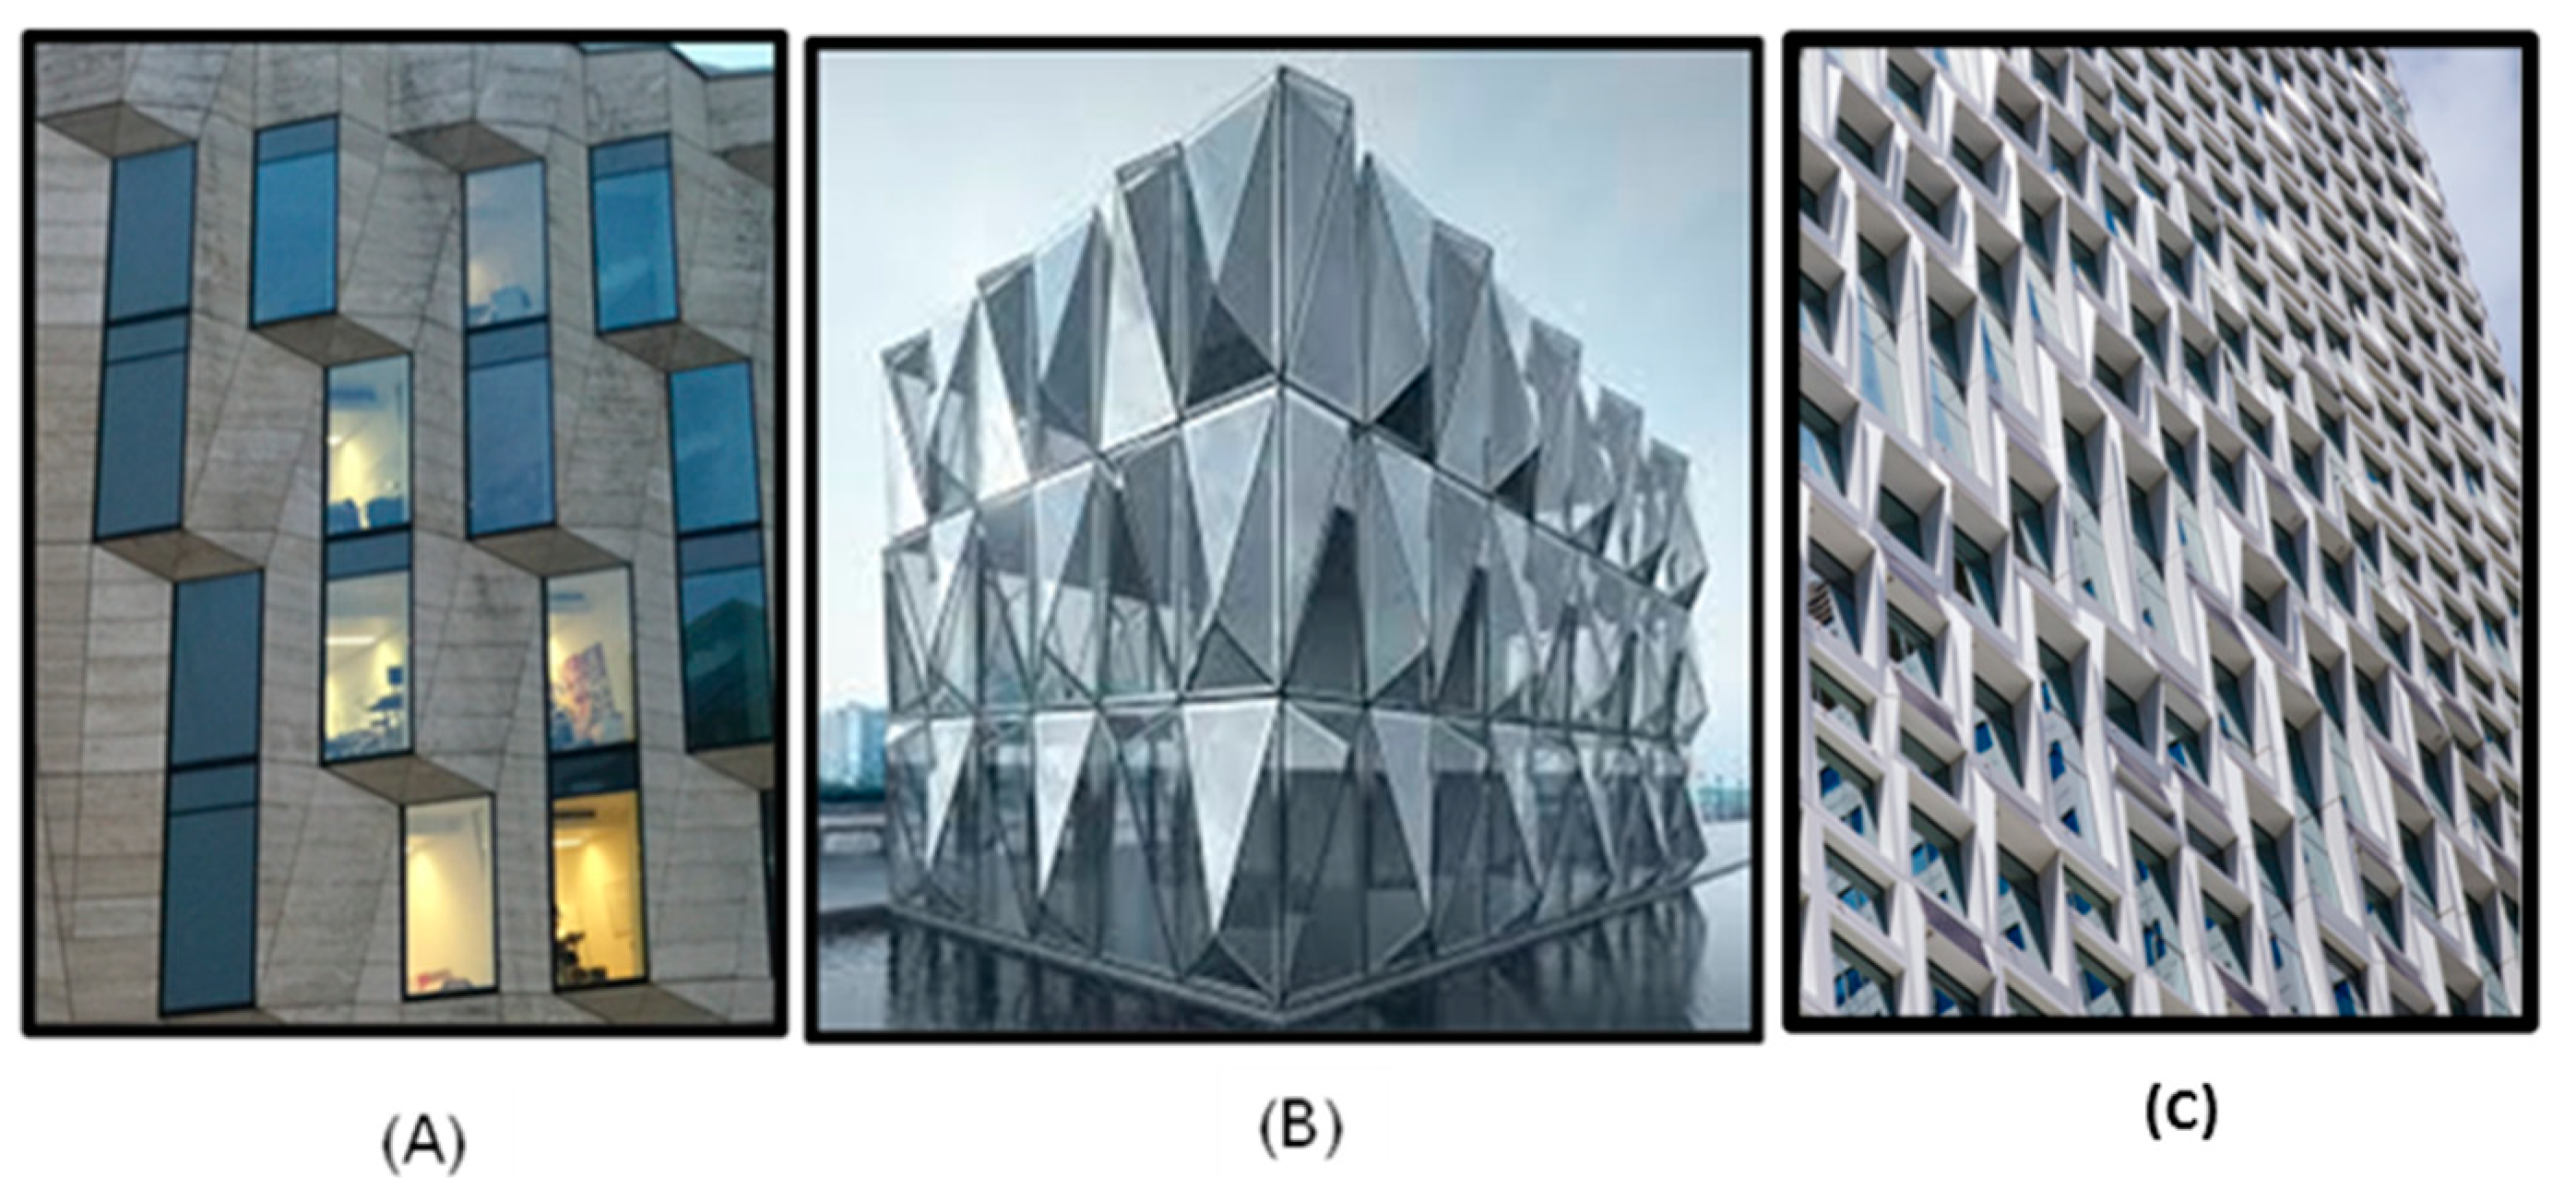
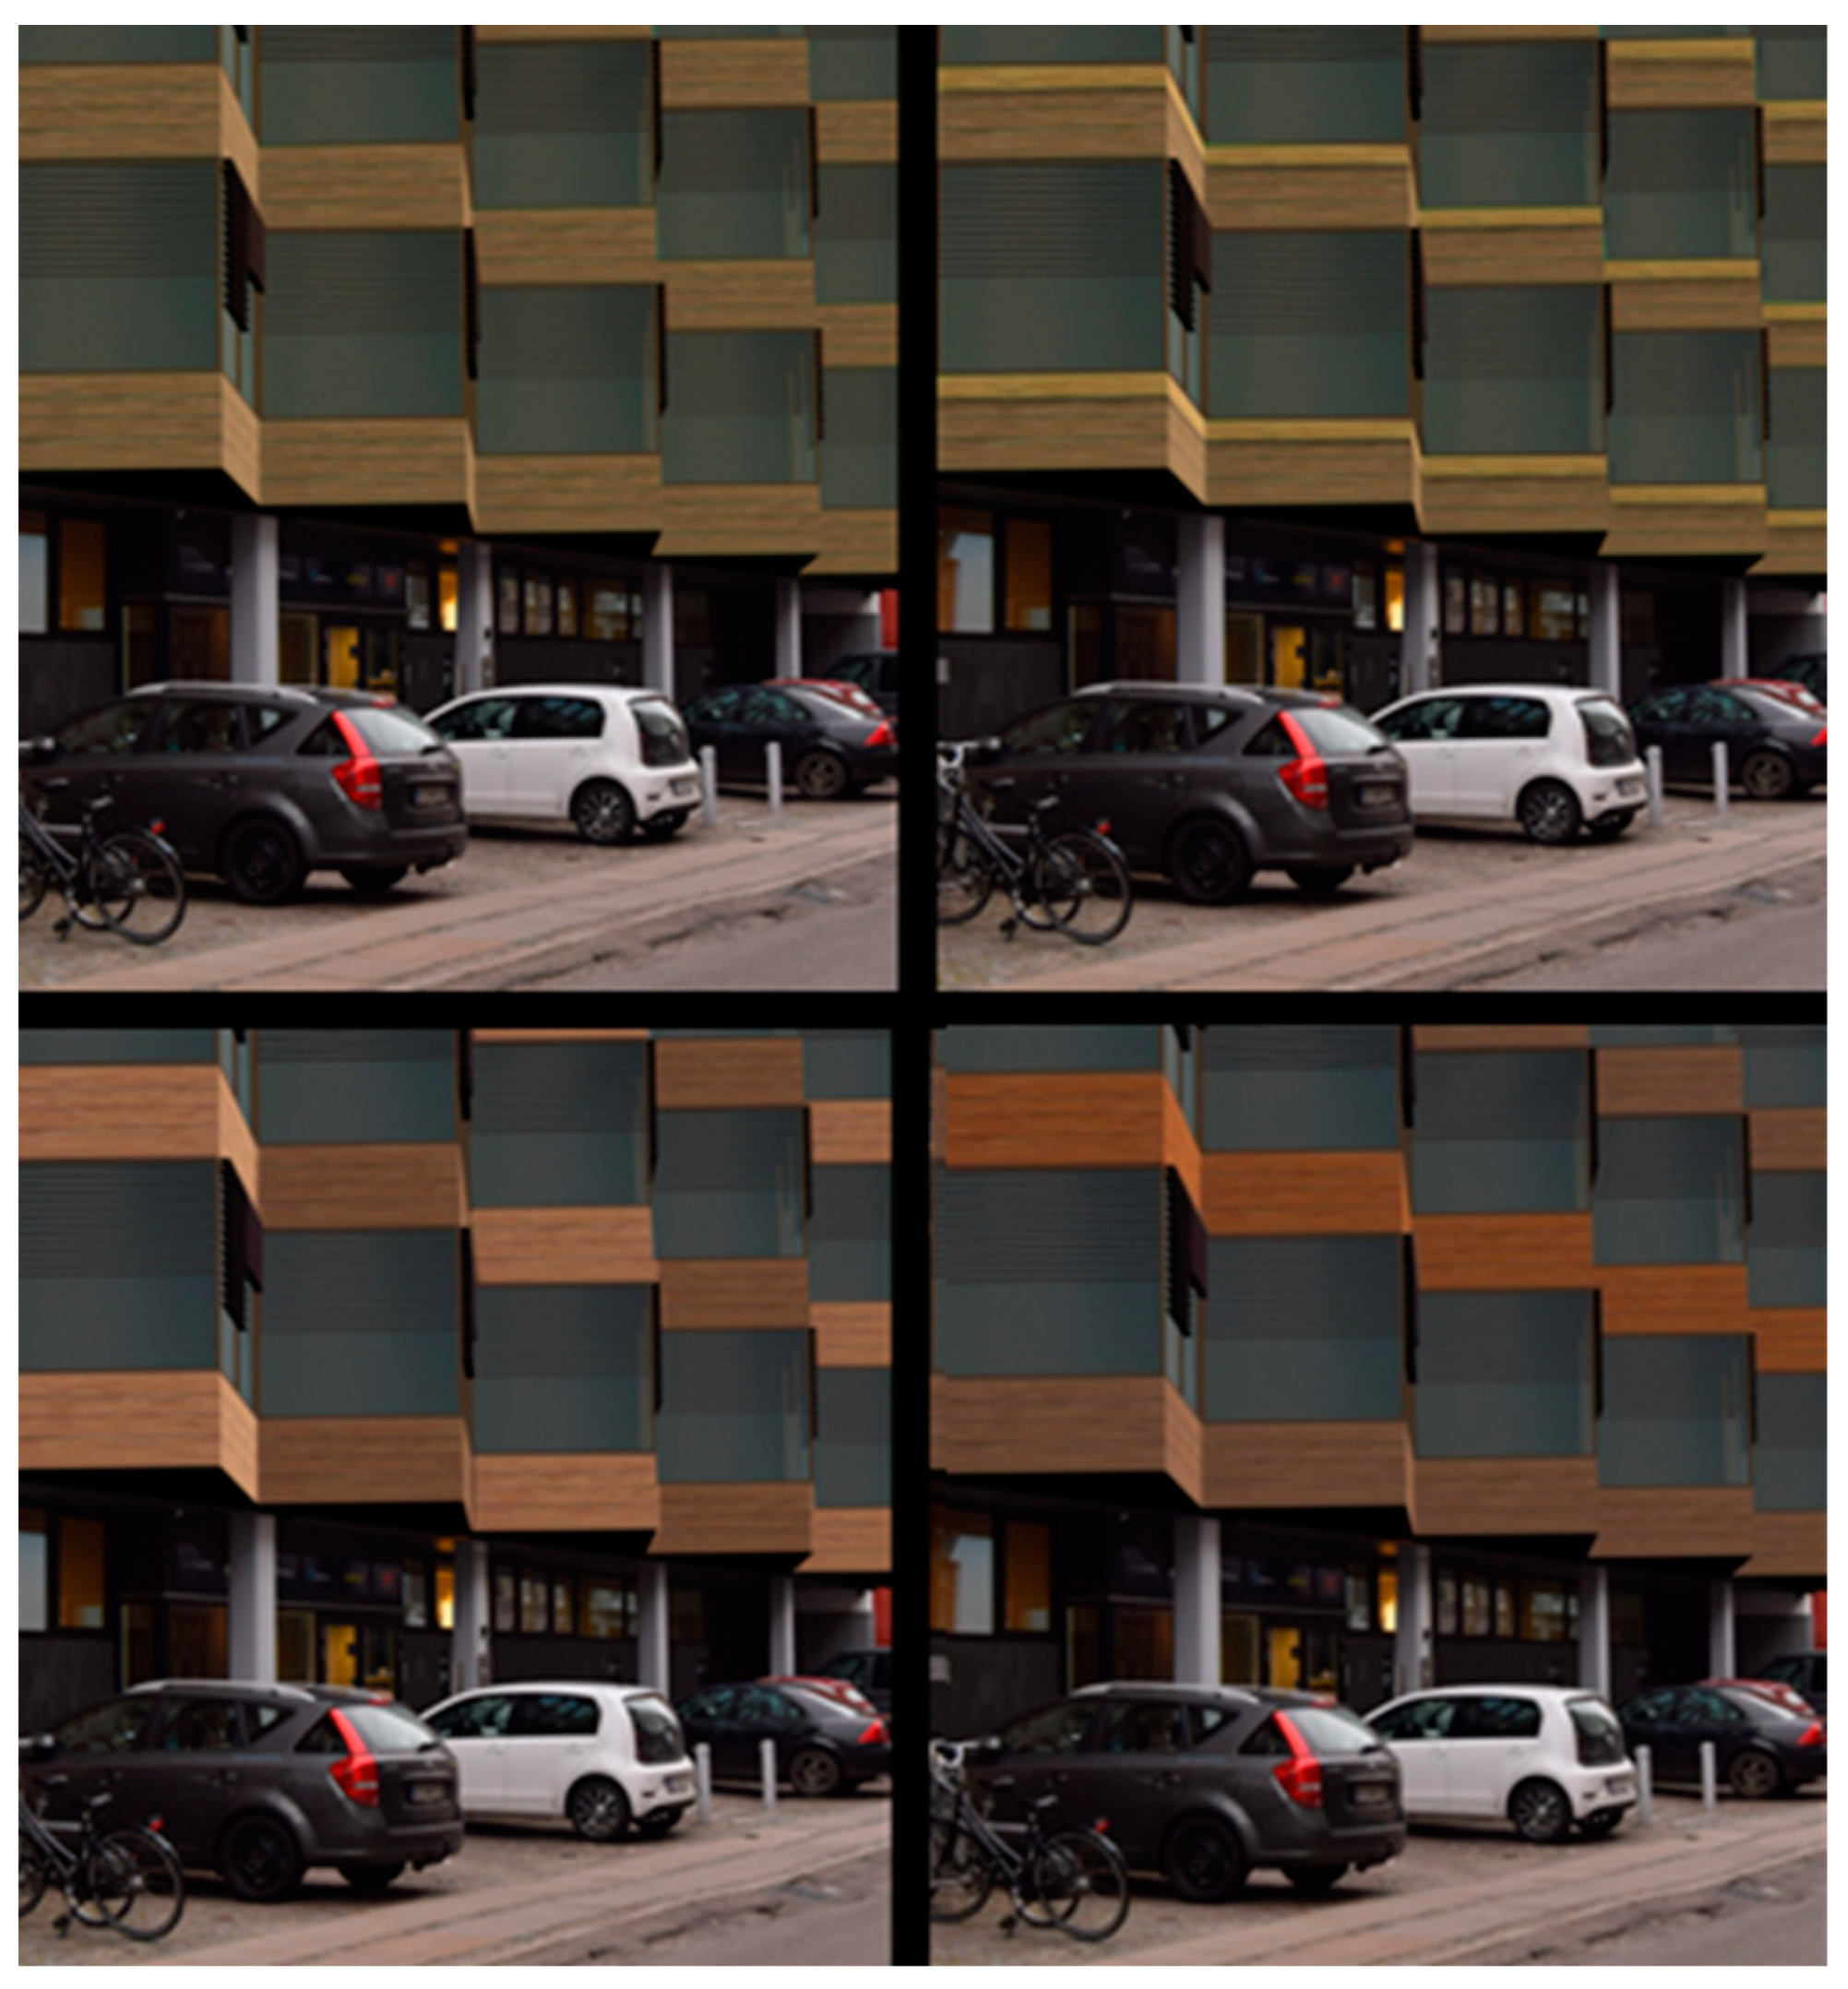
- The visual possibilities of the multi-angled façade system and how it interacts with the outside world can provide a visually pleasing effect;
- A higher level of energy efficiency can come as a result of the glass properties’ advantageous effects on the façade system;
- In addition to structural and aesthetic concerns, the systems provide economic advantages.
2. Materials and Methods
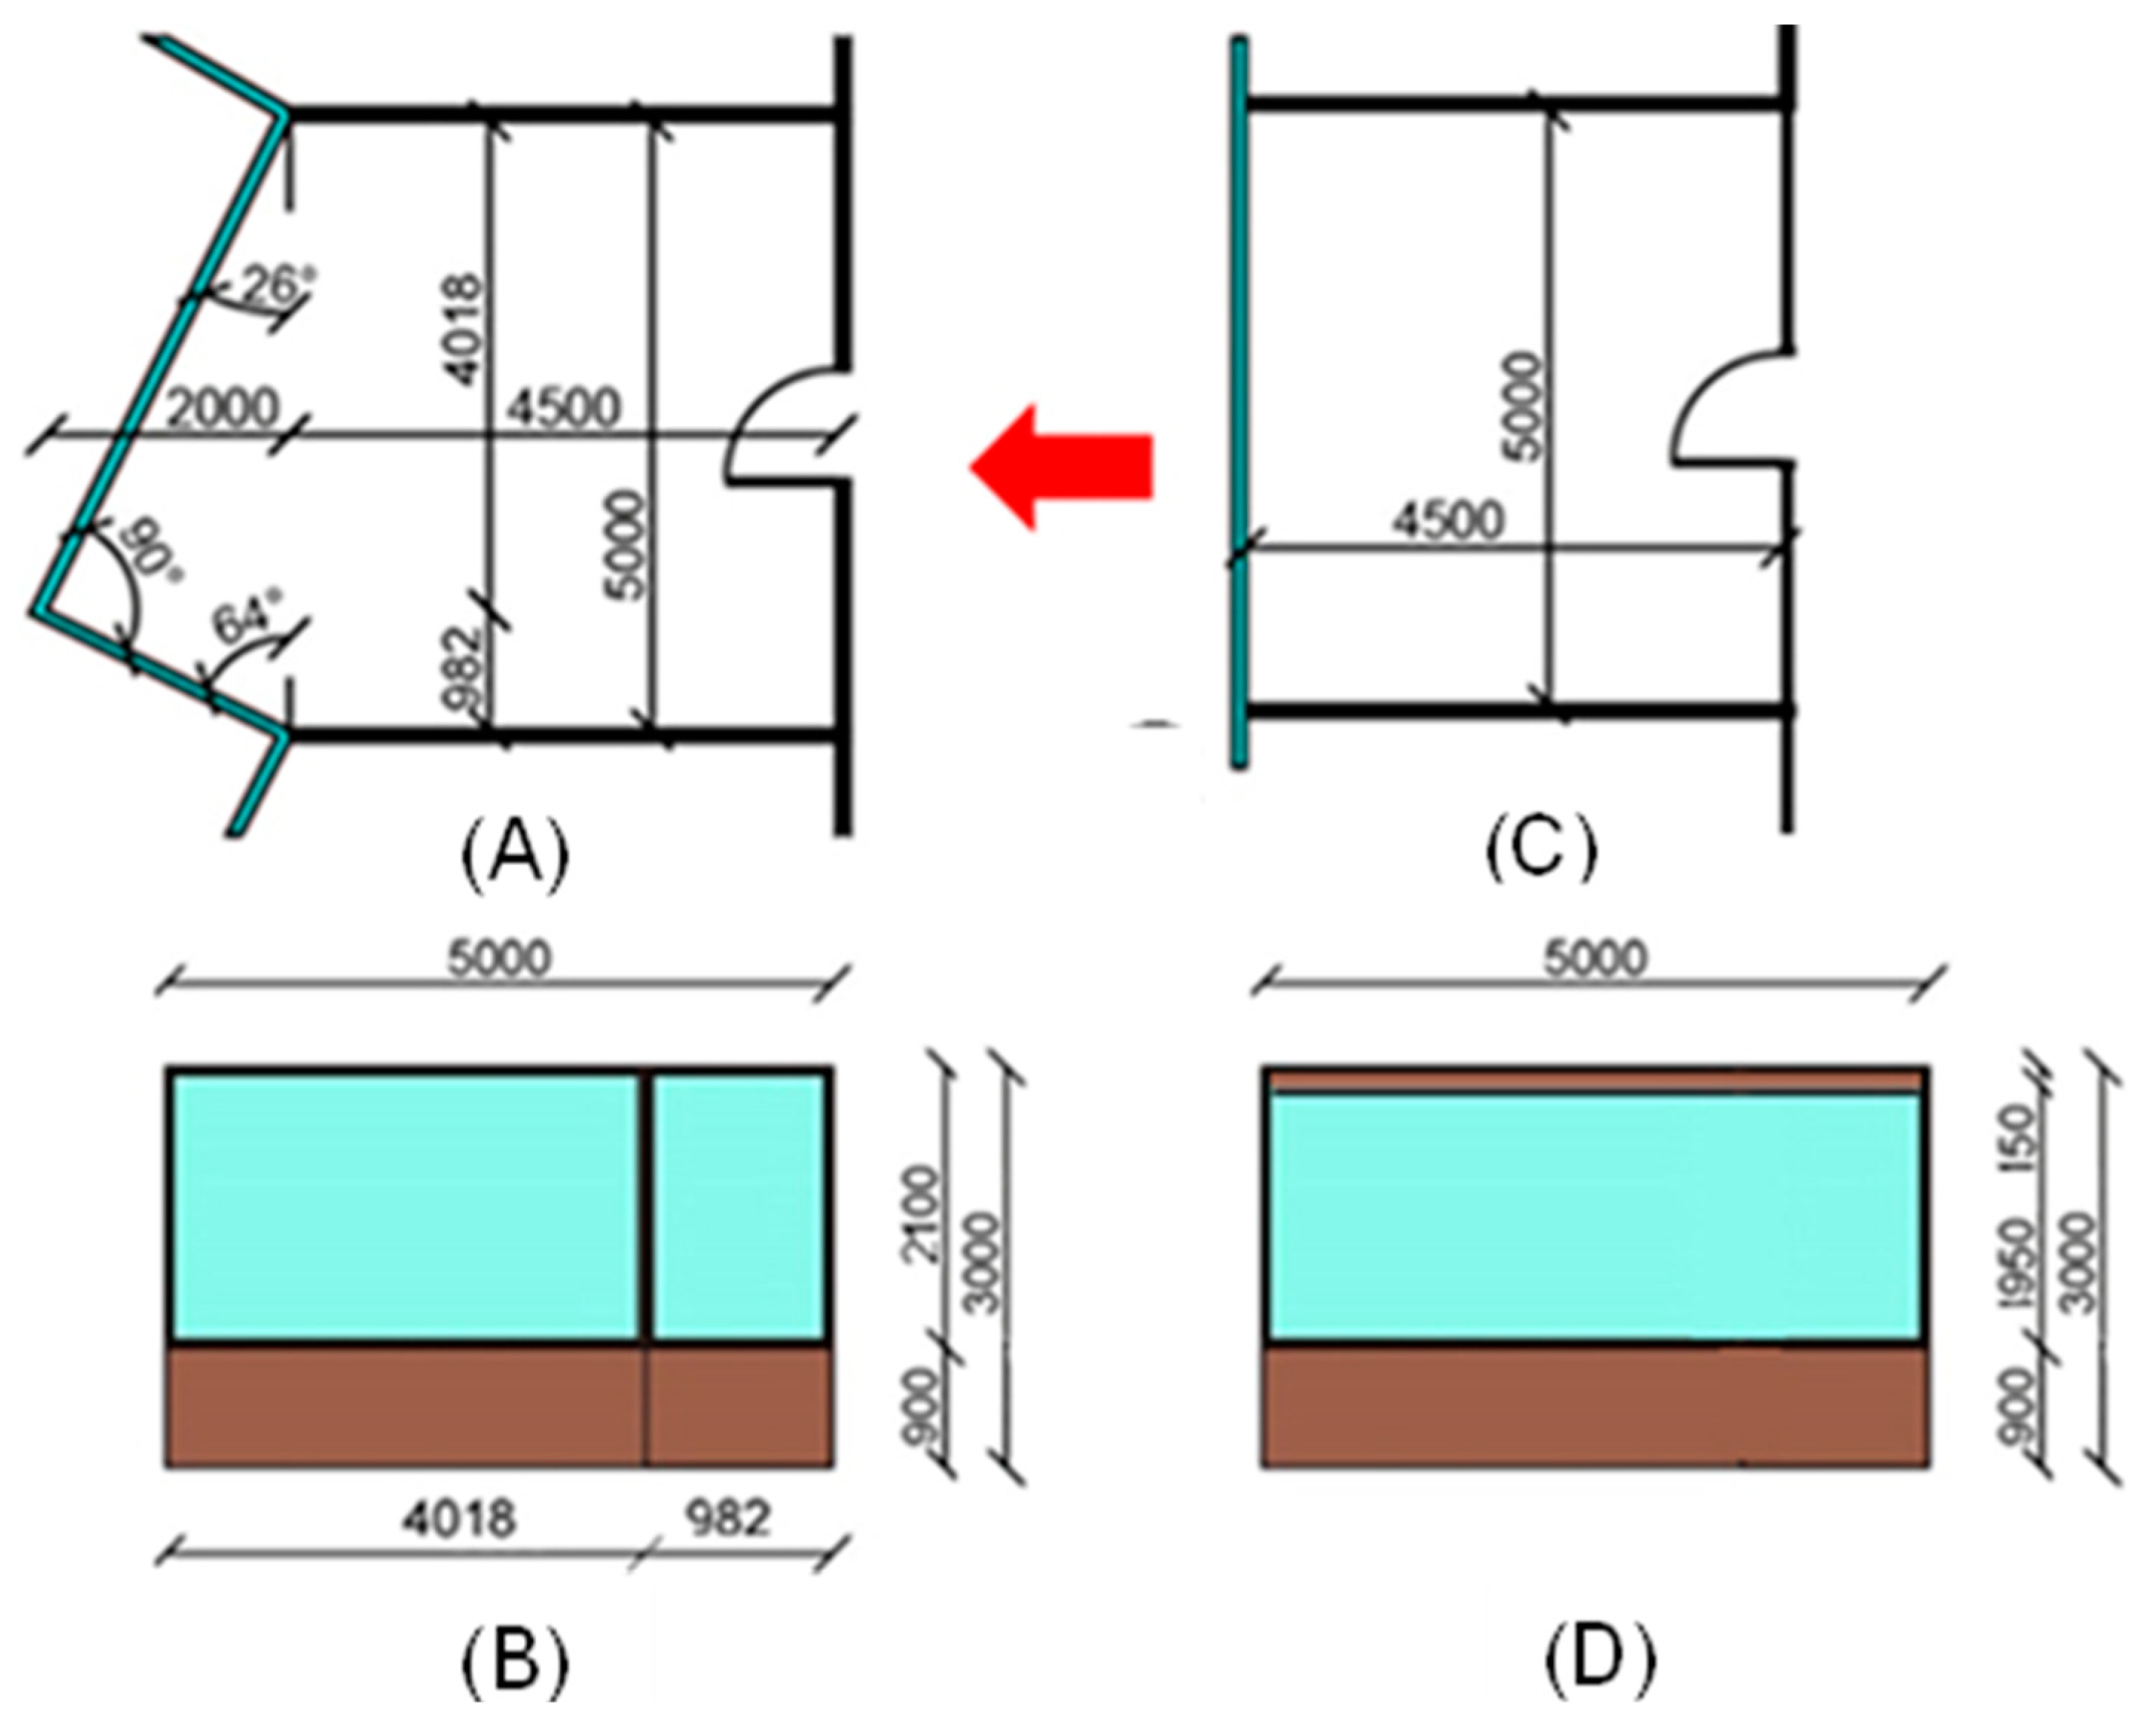
- A room model measuring 5 × 4.5 × 3 m (L × W × H) inside. Based on site inspections and a case study of several office buildings in Copenhagen, the researchers developed these dimensions. The dimensions are common for office rooms. The modelled room had adjacent rooms on each side and on the floors above and below;
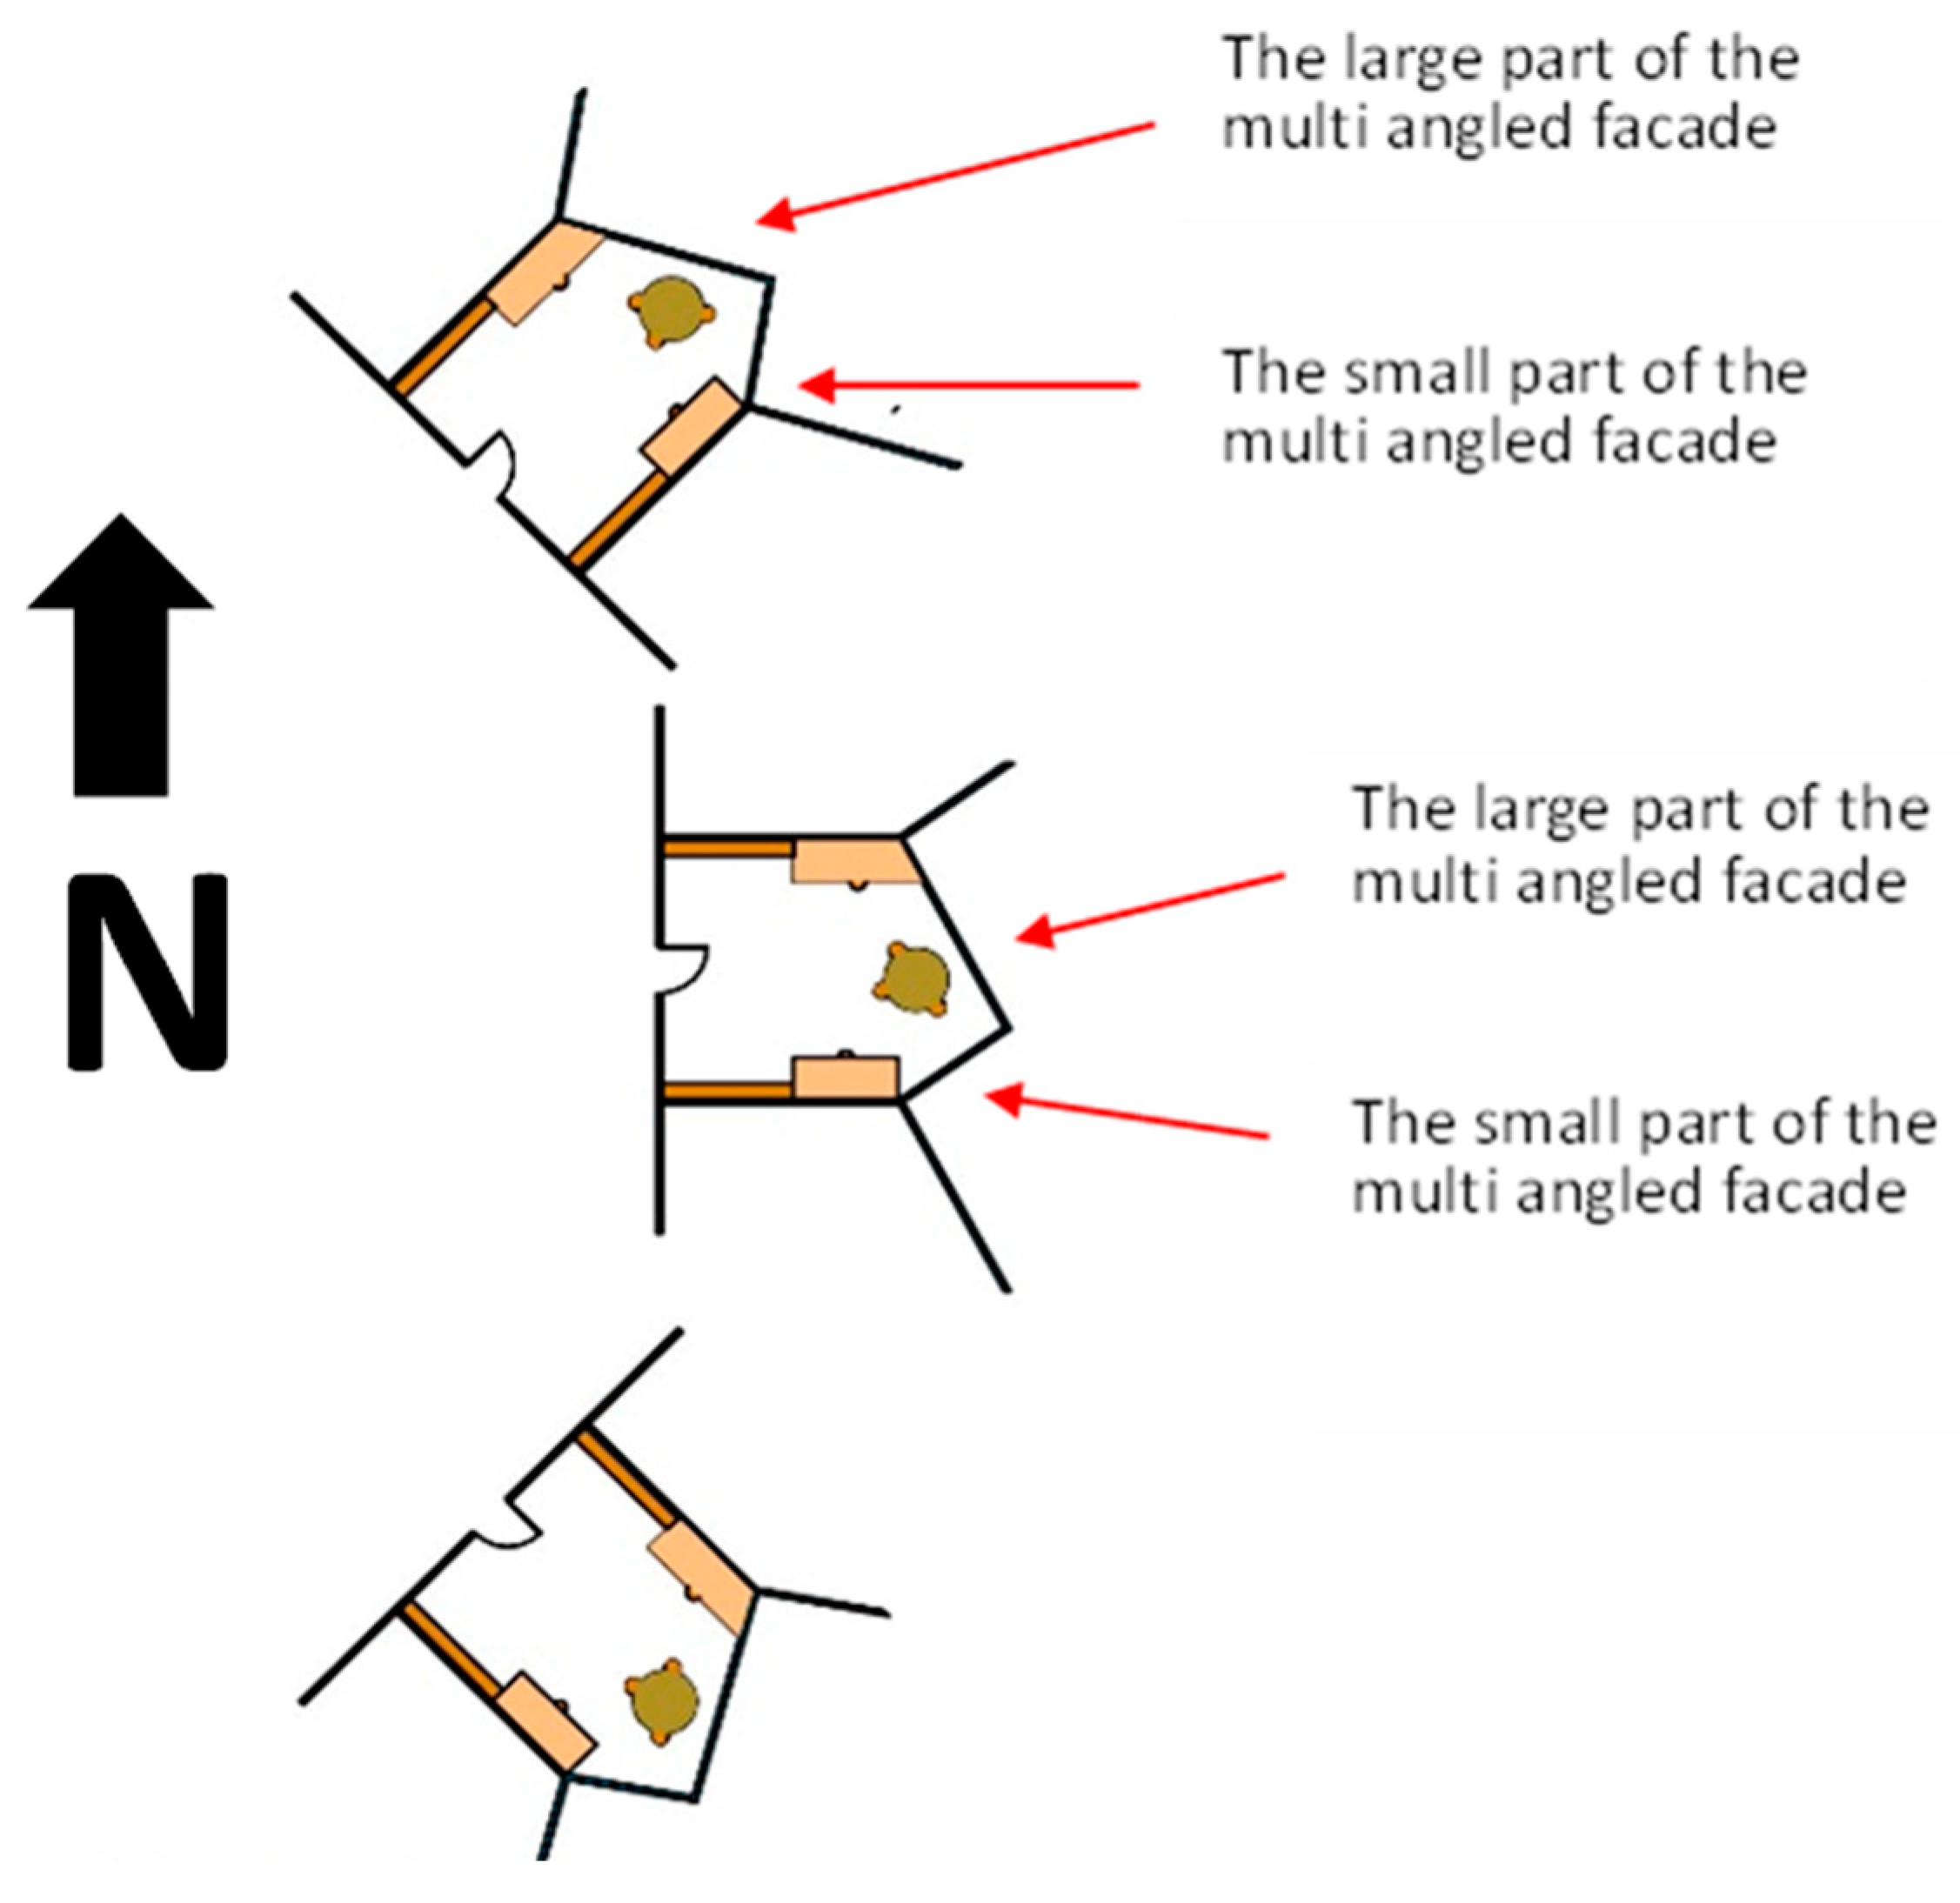
- The room model simulations employ two exterior façades, as Figure 2A shows: one that is flat and the other that is multi-angled, with the larger section oriented more towards the north and the smaller part towards the south. Similar to the east orientation, the room’s exterior façade faces west. As was discussed in the previous section, the best way to use this façade concept is to face either east or west;
- The building is located at latitude 55.633 N and longitude 12.667 E in Copenhagen, Denmark. Despite the case study‘s emphasis on Denmark, researchers may apply the findings to other global regions with comparable climates, such as those located between latitudes 50 N and 56 N. The meteorological year is 2022, and the weather file used for energy modelling is from IWEC (International Weather for Energy Calculation);
- Two people assumed to be working in the office with an activity level of 1.2 met [19]. For the two occupiers with two computers (40 W/PC), the researchers anticipated an average occupancy of 80%;
- The energy-efficient electrical lighting in the office room delivers 500 Lux for the work area [19] (which is usually 2/3 of the room area). Total lighting power is 110 W with 80 lm/W lighting efficiency. The electrical lighting is an energy-efficient fluorescent;
- The workplace uses a Variable Air Volume (VAV) mechanical ventilation system from 8:00 to 17:00 during the workday. The ventilation system‘s control depends on the room temperature and CO2 content. The heat exchanger efficiency for Lindab A/S products is 80%, which is an average value. The fan efficiency, or electricity to air, is 0.8, a market-standard efficiency number [20]. The typical pressure drop in the ventilation system is around 800 Pa. The ventilation system‘s SFP is 1000 J/m3. These values are for a ventilation system with a reasonable pressure drop [21]:
- a.
- The room‘s maximum operative temperature was 25 °C. (The researchers measured this with an occupant sitting 1 m from the front window and 1.5 m from the side wall. The measurement height was 0.6 m.) The researchers calculated the operative temperature with IDA ICE software as the average of both the local air temperature and the mean radiant temperature from the surfaces in the model [16];
- b.
- Relative humidity minimum value is 25% and maximum 60%, according to DS EN 16798 [19];
- c.
- For extended durations, the CO2 content should not exceed 1000 ppm, following Danish building standard BR15 [22]. The researchers establish 1100 ppm as the maximum amount within the working space.
- The researchers took into consideration that water-based radiators comprise the heating system. The thermostat is set to 21 °C (category I for the heating season in [19]) during business hours (07:00–17:00); outside of these hours, it is lowered to 16 °C. The researchers factored that district heating is the energy source to heat the building and provide hot water for home use;
- The parapet below the window is made from a 0.1 m thick concrete panel (from inside), insulation (0.245 m thick), and wood façade cladding materials (see Table 1). The parapets’ U-value of 0.125 W/m2K is approved by the Danish Building Regulation of 2015. According to communication with experts in IDA ICE EQUA, the U-value is calculated based on the materials’ properties and their thicknesses. Then, by adding the resistance values of external and internal surfaces from the zone’s air together with dimensioning temperatures of the local area of the building and surface components, a convective heat transfer coefficient on both sides is provided [23]. These results might somehow differ from the in situ U-value calculation through monitoring, such as using a heat flux meter (HFM) and temperature-based method (TBM). The first method calculates the U-value of building envelopes by dividing the heat flux rate by the temperature difference between indoors and outdoors. The second method follows Newton’s law of cooling for the measurement of U-value [24].
- The multi-angled façade systems employ automated exterior Venetian blinds in both sections and for the rooms with flat façades. One can use roller shading devices, although Venetian blinds contain slats, which inhabitants can sometimes change. The shading device has a 0.2 shading factor [25], which the Danish standard (SBI Guide, No. 264, Shading Devices) states. Occupants can manually operate the shading device, and it can be automatically controlled. For example, when the shading device is closed due to high illumination, the occupants can adjust the slats to allow some daylight to enter the room or prevent glare. The tiny south-facing window with multi-angled façades has an automatic shade system that depends on the operating temperature. The system closes at 24 °C. The automated shade mechanism on the large window, which faces further northwards, is reliant on the intensity of sunlight. At 250 W/m2, the maximum allowable solar radiation measured outside, it shuts. This is the value that is acceptable in Denmark. The automated window shade system in the simulated office rooms with flat façades is dependent on the amount of solar radiation. It closes at 250 W/m2 (the amount of solar radiation measured outside);
- By using a pressure test with 50 Pa, BR15 [22] states that the air change caused by leaks in the building envelope is not greater than 1.00 l/s per m2 of heated floor space;
- A three-layer glass window measuring 0.53 W/m2 K, LTg 0.72, gg 0.5, and Uf measuring 1.56 W/m2 K is included on the flat façade [26];
- The large window of the multi-angled façades similarly uses this window mentioned above; however, the smaller portion has a three-layer glass window (Ug = 0.62 W/m2 K, LTg = 0.74, gg = 0.63, and Uf = 1.56 W/m2 K) [26];
- The height of the bottom window frame is 0.9 m from the ground, while the top window frame is 2.85 m from the floor for the flat façade, which is a typical window height in Danish office buildings. This increases to 3 m for the multi-angled façade to provide more daylight. The window area below 0.9 m does not provide daylight to the working area and simultaneously increases loss of heat;
- There is about a 0.82 ratio between the glass and window areas. This is valid for the thinnest window frame containing three-layer window glass produced by VELFAC, which is one of Denmark’s largest companies for windows and doors. The window frame is made of wood and aluminium (where the latter protects the frame from the external environment), with a thickness of 5.4 cm. [27].
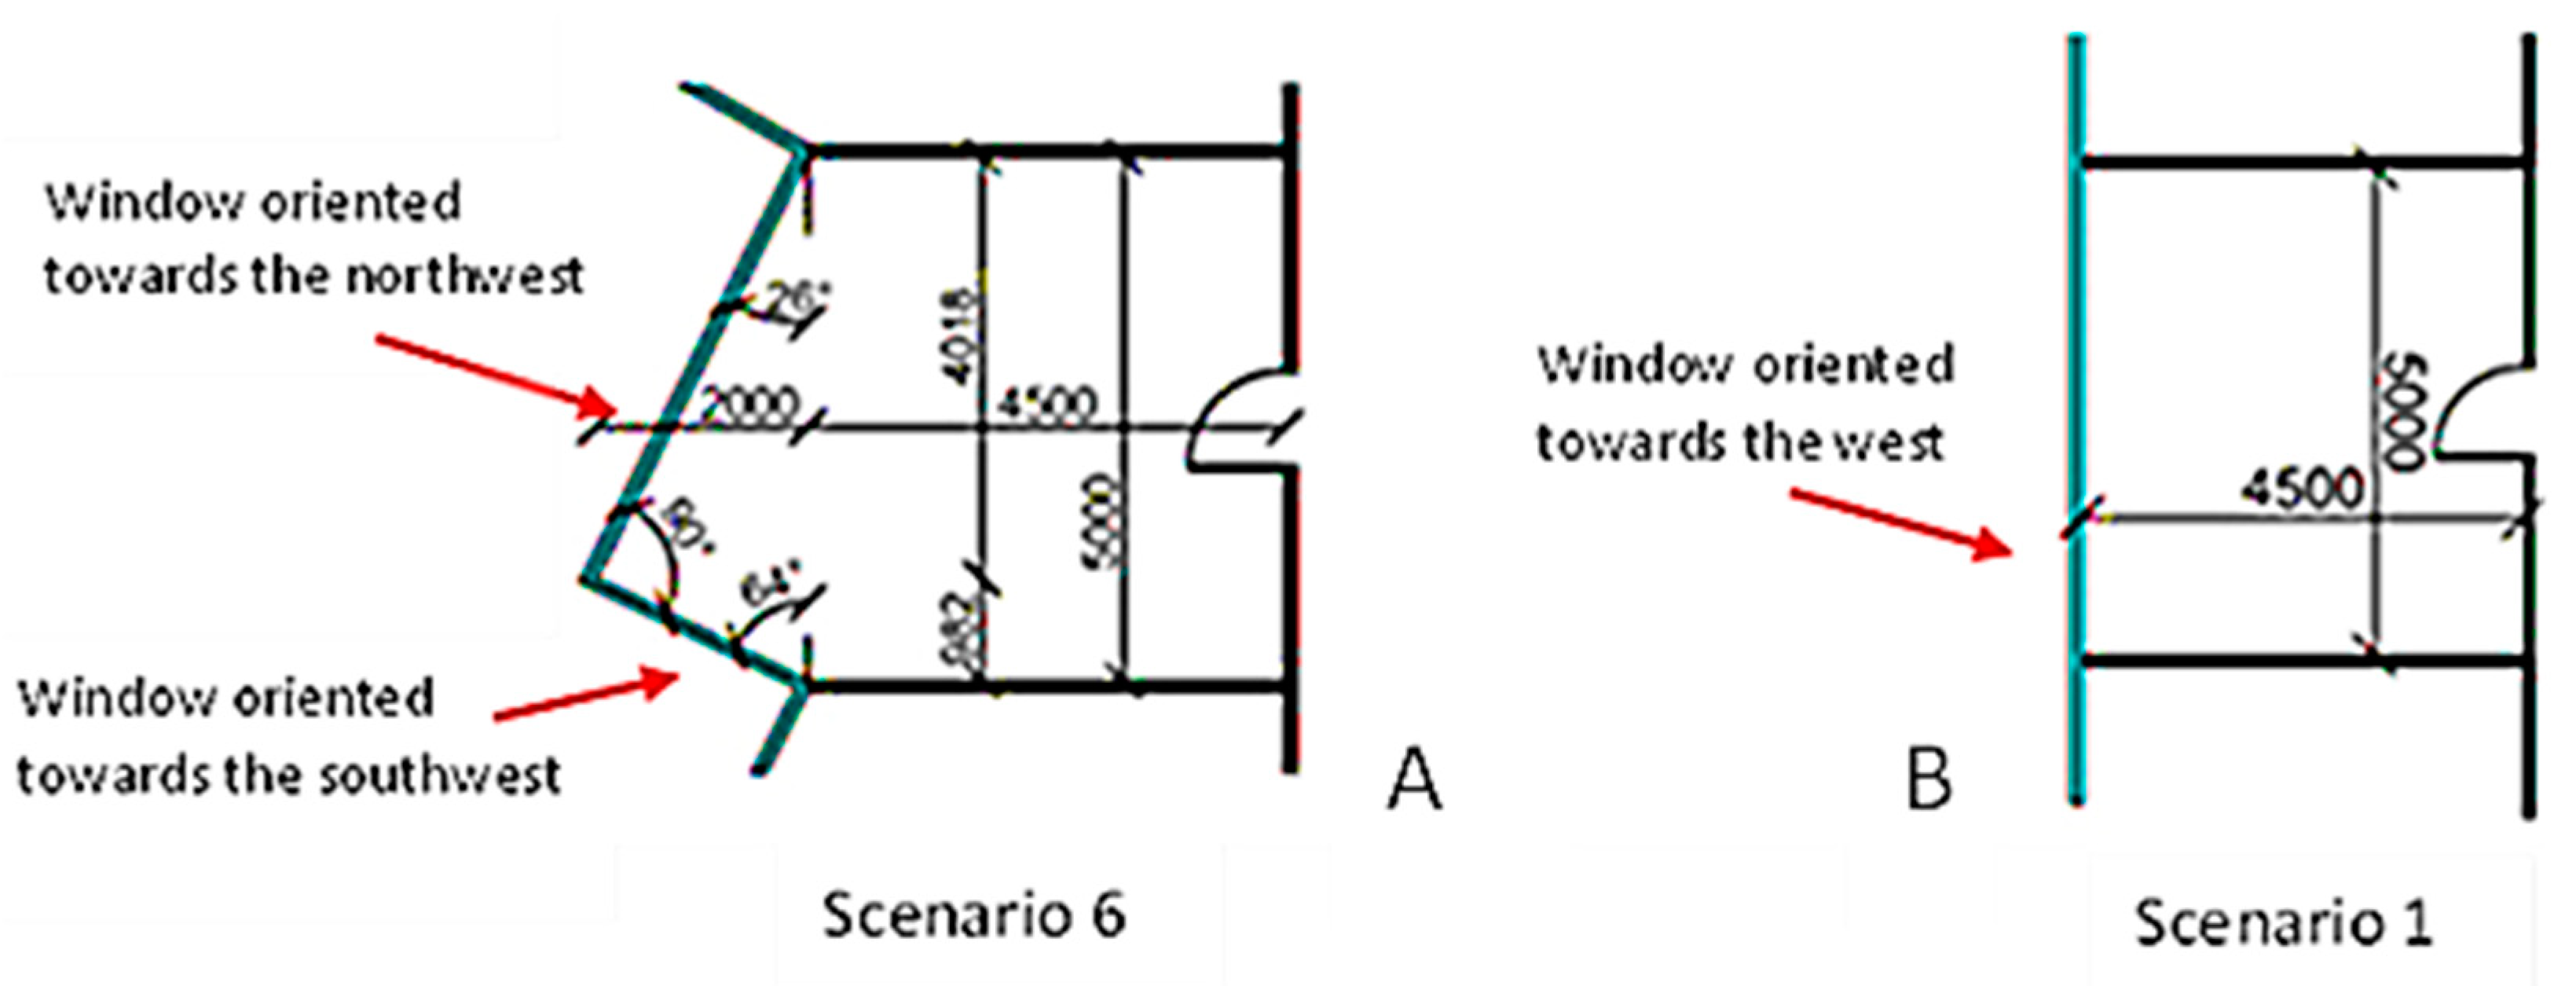
- Scenario 1: The model is the same as the model in Scenario 6 but with a flat façade. The window properties for this flat façade, which will be used for the other flat façades with different orientations, are Ug is 0.53 W/m2 K, Uf 1.56 W/m2K, LTg 0.72, and gg 0.5) [26];
- Scenario 2: Similar to Scenario 1, but the room is oriented towards the northwest;
- Scenario 3: Similar to Scenario 1, but the room is oriented towards the southwest;
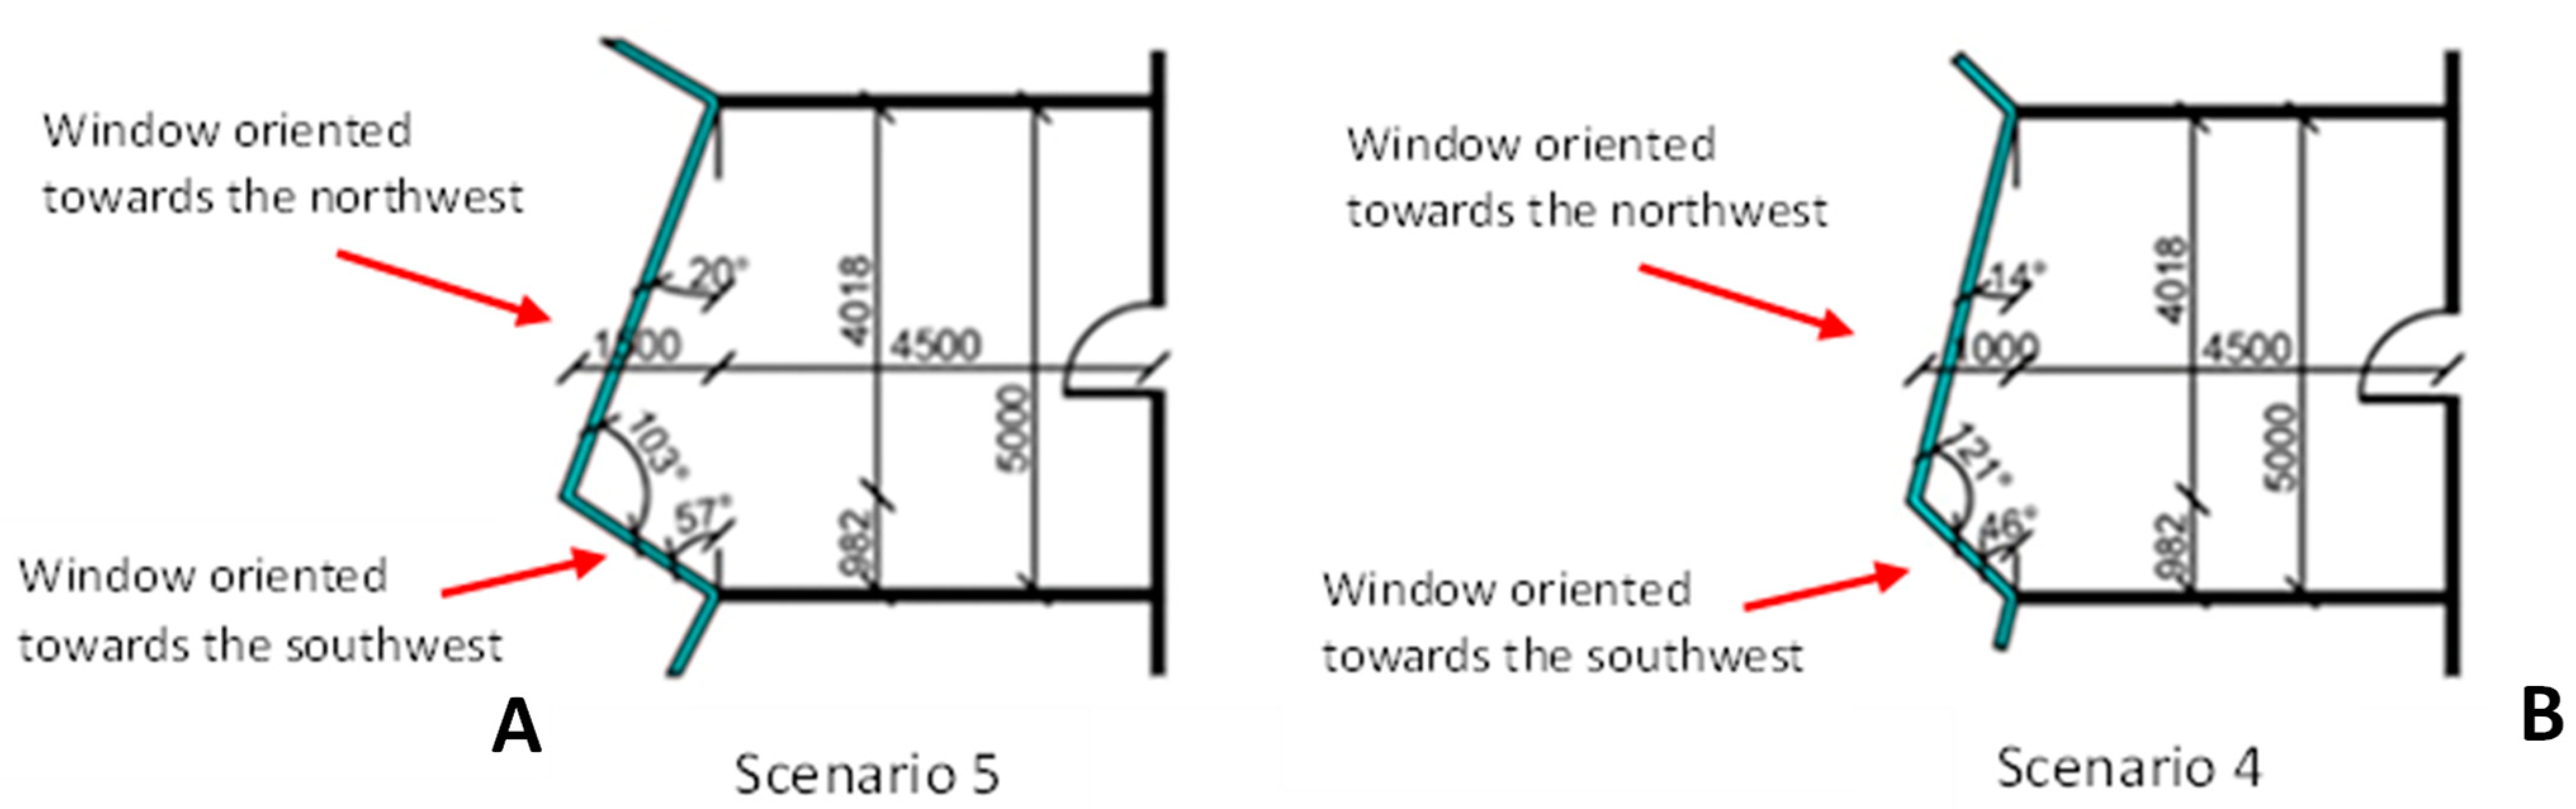
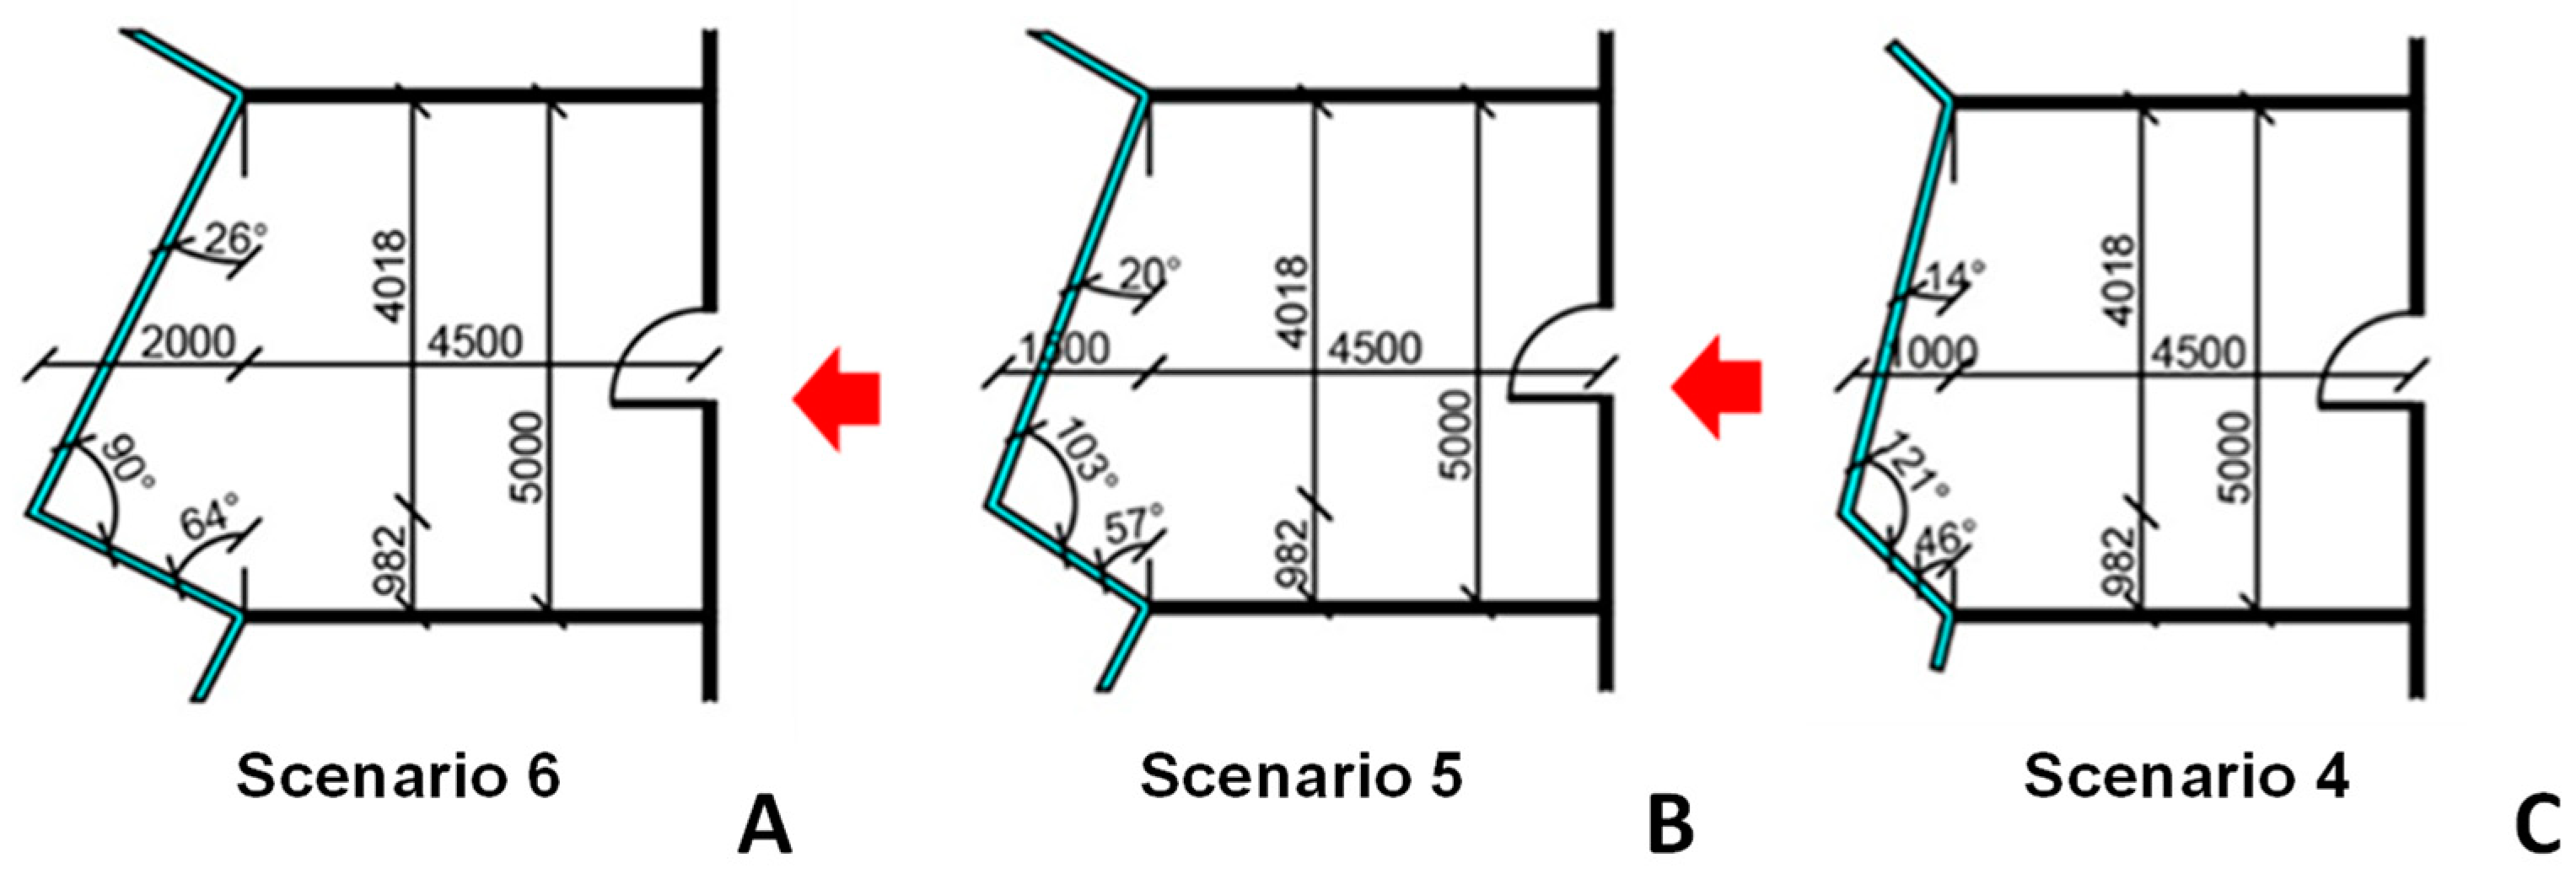
- Scenario 4: The room is the same as in the first scenario, but it has a multi-angled façade expansion (1 m);
- Scenario 5: There is a multi-angled façade like Scenario 4 but with a different façade extension (1.5 m);
- Scenario 6: There are multiple angles in the façade similar to Scenario 4 but with a different façade extension (2 m);
- Scenario 7: Like Scenario 6 but with the façade arrangement where the large window faces the south and the small window faces the north. The degree of Sun radiation determines how both windows’ shading is controlled;
- Scenario 8: Similar to Scenario 6, except the window facing southwest has a shading system that depends on solar radiation intensity;
- Scenario 9: Similar to Scenario 6 regarding the configuration, material properties, and shadings, but the room is oriented towards the northwest;
- Scenario 10: Similar to Scenario 6 regarding the configuration, material properties, and shadings, but the room is oriented towards the southwest.
3. Outcomes

| Scenarios | Number of Occupied Hours under Each Thermal Indoor Climate Category and Their Percentage of the Total Occupied Hours | |||
|---|---|---|---|---|
| Category I (High) | Category II (Medium) | Category III (Moderate) | Category IV (Low) | |
| 1 | 1667 (%71) | 601 (%25) | 63 (%3) | 18 (%1) |
| 2 | 1660 (%71) | 611 (%26) | 61 (%3) | 17 (%1) |
| 3 | 1735 (%74) | 536 (%23) | 61 (%3) | 17 (%1) |
| 4 | 1733 (%74) | 534 (%23) | 66 (%3) | 16 (%1) |
| 5 | 1745 (%75) | 521 (%22) | 67 (%3) | 16 (%1) |
| 6 | 1724 (%73) | 536 (%23) | 73 (%3) | 16 (%1) |
| 7 | 1273 (%54) | 938 (%40) | 101 (%4) | 37 (%2) |
| 8 | 1355 (%58) | 883 (%38) | 84 (%4) | 27 (%1) |
| 9 | 1616 (%69) | 644 (%27) | 75 (%3) | 14 (%1) |
| 10 | 1763 (%75) | 502 (%21) | 68 (%3) | 16 (%1) |
| Scenario 6 | Scenario 1 | |||||
|---|---|---|---|---|---|---|
| Northwest-Facing Window | Southwest-Facing Window | West-Facing Window | ||||
| Heat Loss (W) | Heat Gain (W) | Heat Loss (W) | Heat Gain (W) | Heat Loss (W) | Heat Gain (W) | |
| January | −121 | 18 | −67 | 41 | −128 | 33 |
| February | −128 | 49 | −70 | 92 | −130 | 69 |
| March | −145 | 105 | −79 | 145 | −142 | 137 |
| April | −109 | 161 | −60 | 69 | −115 | 181 |
| May | −89 | 198 | −50 | 44 | −95 | 219 |
| June | −75 | 213 | −42 | 42 | −80 | 231 |
| July | −51 | 218 | −29 | 43 | −54 | 238 |
| August | −50 | 186 | −28 | 47 | −52 | 200 |
| September | −68 | 147 | −38 | 39 | −71 | 164 |
| October | −87 | 84 | −48 | 66 | −95 | 99 |
| November | −108 | 27 | −59 | 56 | −112 | 52 |
| December | −120 | 14 | −66 | 28 | −126 | 25 |
| Scenario 4 | Scenario 5 | |||||||
|---|---|---|---|---|---|---|---|---|
| Window Facing the Northwest | Window Facing the Southwest | Window Facing the Northwest | Window Facing the Southwest | |||||
| Heat Loss (W) | Heat Gain (W) | Heat Loss (W) | Heat Gain (W) | Heat Loss (W) | Heat Gain (W) | Heat Loss (W) | Heat Gain (W) | |
| January | −113 | 22 | −41 | 34 | −116 | 20 | −54 | 36 |
| February | −119 | 53 | −43 | 72 | −122 | 51 | −57 | 80 |
| March | −134 | 110 | −49 | 110 | −138 | 107 | −64 | 126 |
| April | −102 | 160 | −38 | 47 | −104 | 161 | −49 | 58 |
| May | −83 | 193 | −31 | 34 | −86 | 198 | −41 | 39 |
| June | −70 | 208 | −26 | 34 | −72 | 208 | −34 | 38 |
| July | −48 | 214 | −18 | 34 | −49 | 217 | −24 | 38 |
| August | −46 | 179 | −17 | 37 | −47 | 180 | −23 | 42 |
| September | −63 | 142 | −23 | 31 | −65 | 144 | −30 | 35 |
| October | −82 | 86 | −30 | 38 | −84 | 86 | −39 | 48 |
| November | −100 | 34 | −37 | 45 | −103 | 31 | −48 | 50 |
| December | −112 | 16 | −41 | 25 | −115 | 15 | −54 | 25 |
4. Discussion
4.1. General Discussion
4.2. Comparing the Scenarios
4.2.1. Scenarios 1 and 6
- The amount of energy used for lighting
- The energy consumption for heating
- The amount of energy used in mechanical ventilation
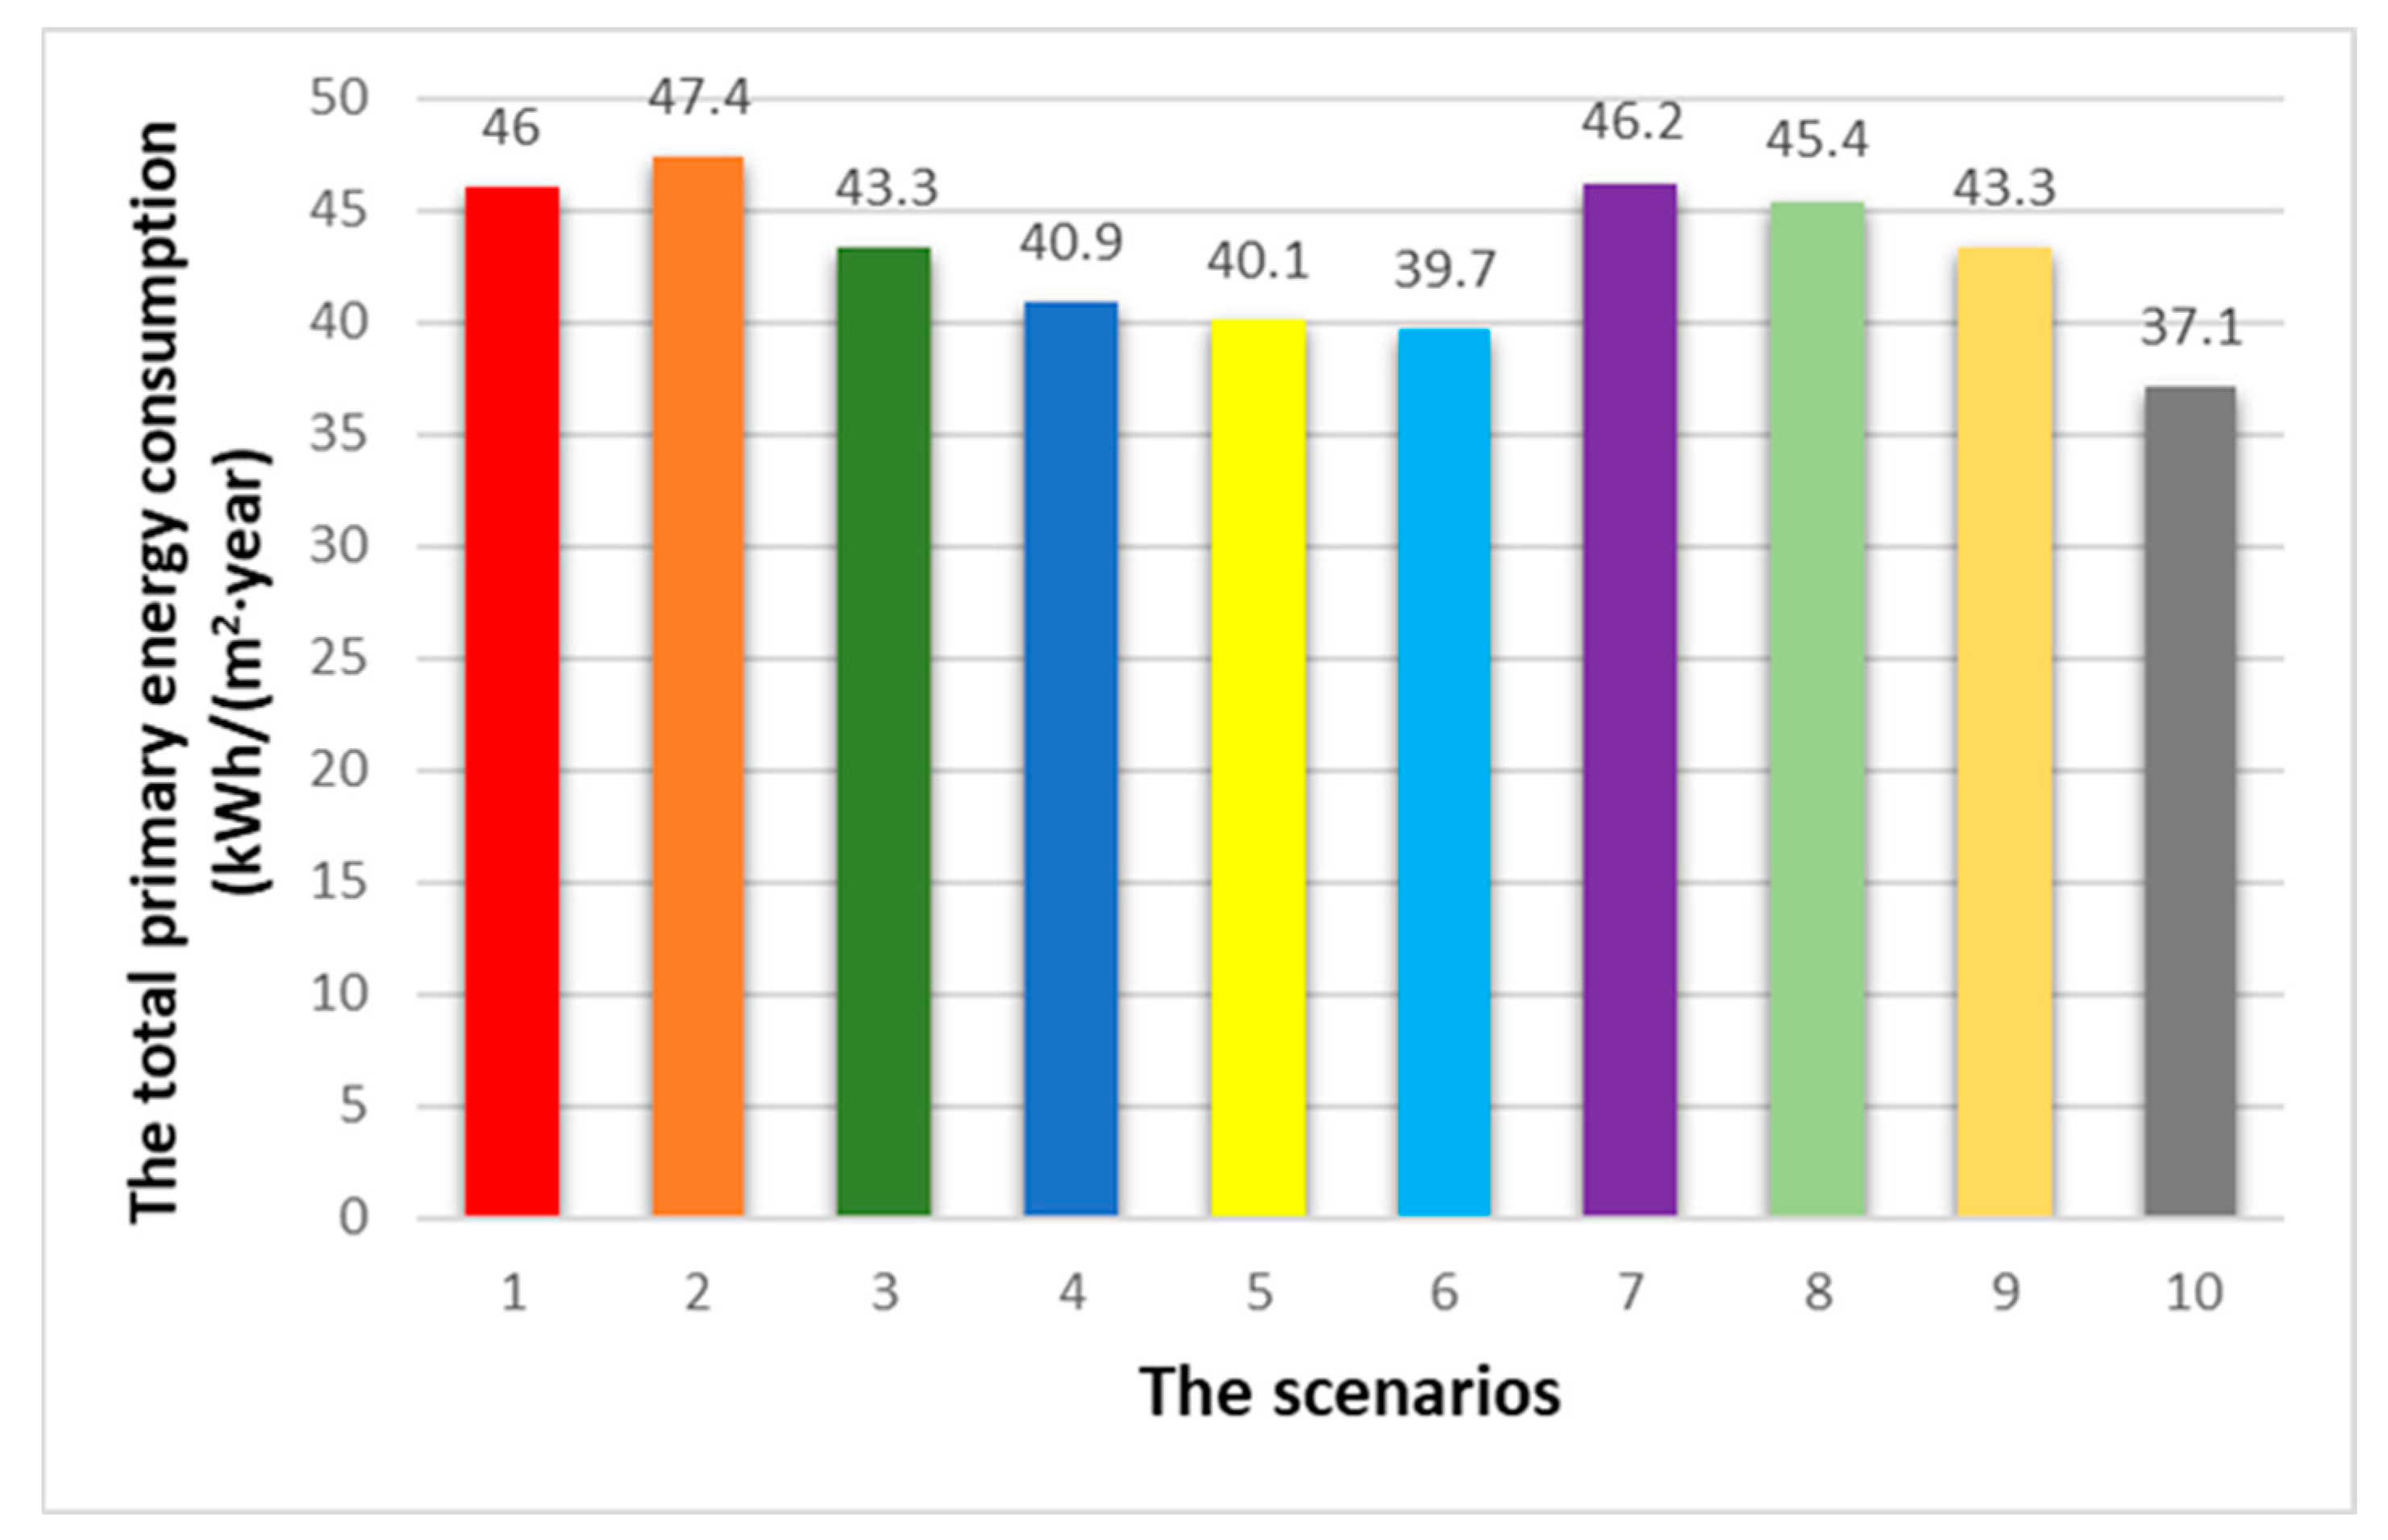
- The total energy consumption
4.2.2. Scenarios 4, 5, and 6
- The energy consumption for lighting
- The energy consumption for heating
- The energy consumption for mechanical ventilation
- The total energy consumption
4.2.3. Scenarios 1 and 6, 2 and 9, 3 and 10
4.3. The Limitations
4.4. Perspective and Future Work
- Optimisation of the dimensions and the properties of the façade components to reach a better result concerning the amount of energy used for heating, ventilation, and lighting;
- Orientation(s) of multi-angled façades on the actual vertical axis and a hypothetical horizontal axis, where the upper part is intended to collect heat gain from the Sun in the heating season, and the lower part is intended to supply more daylight and provide a better visual experience for the occupants;
- It is feasible to investigate a façade that has windows oriented differently along the horizontal and vertical axes, or when they are completely or partially inclined along the façade‘s diagonal axis, or even perpendicular to the Sun‘s rays.
5. Conclusions
Author Contributions
Funding
Data Availability Statement
Conflicts of Interest
References
- European Directive, “Energy topics”. 2023. Available online: https://ec.europa.eu/energy/en/topics/energy-efficiency (accessed on 14 August 2023).
- Directorate-General for Communication (European Commission). In Focus: Energy efficiency in Buildings. 2024. Available online: https://commission.europa.eu/ (accessed on 10 January 2024).
- Aksamija, A. Sustainable Facades; John Wiley & Sons, Inc.: Hoboken, NJ, USA, 2013. [Google Scholar]
- Juan, L. Eco-Friendly Building Façade; Artpower International Publishing Co., Ltd.: Hong Kong, China, 2022; ISBN 978-988-14687-7-2. [Google Scholar]
- Hopfe, C.; Mcleod, R.S. The Passivehaus Designer’s Manual; Routledge: London, UK; New York, NY, USA, 2015. [Google Scholar]
- EUmies Award. 2024. Available online: https://miesarch.com/work/1468 (accessed on 29 August 2024).
- Saint-Gobain Glass Limited. 2022. Available online: http://uk.saint-gobain-glass.com (accessed on 5 March 2023).
- Schüco International KG. 2021. Available online: http://www.schueco.com (accessed on 12 September 2023).
- Thorpe, D. Passive Solar Architecture Pocket Reference; Routledge: London, UK; New York, NY, USA, 2017. [Google Scholar]
- Fosdick, J.; Homes, T. Passive Solar Heating; National Institute of Building Sciences: Washington, DC, USA, 2016. [Google Scholar]
- Zogou, O.; Stapountzis, H. Energy analysis of an improved concept of integrated PV panels in an office building in central Greece. Appl. Energy 2011, 88, 853–866. [Google Scholar] [CrossRef]
- Christensen, J.E. Interviewee, Associate Professor DTU, Daylight Potentials. [Interview]. January 2018. Available online: https://construct.dtu.dk/ (accessed on 29 August 2024).
- Hannoudi, L.; Saleeb, N.; Dafoulas, G. The impact of glass properties on the energy efficiency and embodied carbon of multi-angled façade systems. J. Clean. Prod. 2024, 437, 40725. [Google Scholar] [CrossRef]
- Hannoudi, L.; Lauring, M.; Christensen, J.E. Multi-Angled Facade System for Office Building Renovation; Advanced Building Skins GmbH: Bern, Switzerland, 2016; ISBN 978-3-98120539-8. [Google Scholar]
- Unstudio. Hanwha Headquarters Remodelling. 2024. Available online: https://www.unstudio.com/en/page/11994/hanwha-headquarters-remodelling (accessed on 15 July 2024).
- EQUA. IDA Indoor Climate and Energy. EQUA Simulation AB. 2022. Available online: https://www.equa.se/en/ida-ice (accessed on 20 November 2023).
- EQUA; Simulation Technology Group. ASHRAE 140, 2004; Equa Simulation AB: Solna, Sweden, 2010. [Google Scholar]
- Kropf, S.; Zweifel, G. Validation of the Building Simulation Program IDA-ICE According to CEN 13791; Hochschule Für Technik+Architektur Luzern: Horw, Switzerland, 2010. [Google Scholar]
- European Committee for Standardization. DS/ EN 16798 Energy Performance of Buildings; CEN Technical Secretariat: Stockholm, Sweden, 2019. [Google Scholar]
- Lindab A/S, “Lindab components”. 2023. Available online: https://www.lindab.dk/ (accessed on 22 November 2023).
- Hvlid, C. Design of Ventilation; DTU: Lyngby, Denmark, 2014. [Google Scholar]
- Building and Housing Agency. Building Regulation 15. 2015. Available online: http://bygningsreglementet.dk/ (accessed on 17 August 2022).
- Rusanen, V. Interviewee, Project Engineer, Equa Simulation Finland Oy. U-Value Calculations in IDA ICE. [Interview]. August 2024. Available online: https://www.equa.se/fi (accessed on 29 August 2024).
- Mobaraki, B.; Pascual, F.J.C.; García, A.M.; Mascaraque, M.Á.M.; Vázquez, B.F.; Alonso, C. Studying the impacts of test condition and nonoptimal positioning of the sensors on the accuracy of the in-situ U-value measurement. Heliyon 2023, 9, e17282. [Google Scholar] [CrossRef] [PubMed]
- Johansen, K. Shading Devices; Aalborg University: Copenhagen, Denmark, 2016. [Google Scholar]
- Secretariat of the Energy Labeling Scheme for Vertical Windows. 2022. Available online: http://www.energivinduer.dk (accessed on 5 April 2022).
- Rasmusen, S. Interviewee, Velfac Window Products. [Interview]. March 2023. Available online: https://velfac.dk/ (accessed on 29 August 2024).
- UN/ Department of Economic and Social Affairs (UNDESA). Sustainable Development. 2023. Available online: https://sdgs.un.org/ (accessed on 23 November 2023).


| External Envelop Materials | Thickness (m) |
Thermal Conductivity (W/m·K) | Total Thickness m | Total U-Value (W/m2·K) |
|---|---|---|---|---|
| Wood covering (outside) | 0.030 | 0.140 | 0.4 | 0.125 |
| Air gap | 0.020 | 0.170 | ||
| Insulation | 0.245 | 0.036 | ||
| Concrete panel (inside) | 0.108 | 0.150 |
| The Scenarios | ||||||||||
|---|---|---|---|---|---|---|---|---|---|---|
| 1 | 2 | 3 | 4 | 5 | 6 | 7 | 8 | 9 | 10 | |
| The room area (m2) | 22.5 | 22.5 | 22.5 | 25.0 | 26.25 | 27.5 | 27.5 | 27.5 | 27.5 | 27.5 |
| Electric Lighting (kWh/(m2·year)) | 5.7 | 6.0 | 6.2 | 4.9 | 4.6 | 4.1 | 4.3 | 4.2 | 4.5 | 4.2 |
| HVAC/Aux (pumps and fans) (kWh/(m2·year)) | 13.3 | 12.8 | 12.8 | 11.7 | 11.0 | 10.4 | 13.8 | 13.3 | 9.6 | 10.4 |
| Heating (kWh/(m2·year)) | 26.9 | 28.5 | 24.3 | 24.4 | 24.6 | 25.1 | 28.4 | 27.9 | 29.3 | 22.4 |
| Total (kWh/(m2·year)) | 46.0 | 47.4 | 43.3 | 40.9 | 40.1 | 39.7 | 46.2 | 45.4 | 43.3 | 37.1 |
Disclaimer/Publisher’s Note: The statements, opinions and data contained in all publications are solely those of the individual author(s) and contributor(s) and not of MDPI and/or the editor(s). MDPI and/or the editor(s) disclaim responsibility for any injury to people or property resulting from any ideas, methods, instructions or products referred to in the content. |
© 2024 by the authors. Licensee MDPI, Basel, Switzerland. This article is an open access article distributed under the terms and conditions of the Creative Commons Attribution (CC BY) license (https://creativecommons.org/licenses/by/4.0/).
Share and Cite
Hannoudi, L.; Saleeb, N.; Dafoulas, G. Study of a Novel 3D Façade Configuration and Its Impact on Energy Performance and Office Space Sustainability. Energies 2024, 17, 4420. https://doi.org/10.3390/en17174420
Hannoudi L, Saleeb N, Dafoulas G. Study of a Novel 3D Façade Configuration and Its Impact on Energy Performance and Office Space Sustainability. Energies. 2024; 17(17):4420. https://doi.org/10.3390/en17174420
Chicago/Turabian StyleHannoudi, Loay, Noha Saleeb, and George Dafoulas. 2024. "Study of a Novel 3D Façade Configuration and Its Impact on Energy Performance and Office Space Sustainability" Energies 17, no. 17: 4420. https://doi.org/10.3390/en17174420