
Breaking the CO2 Gridlock: Can Renewables Lead the Way for the OECD?

Abstract
1. Introduction
2. Literature Review
2.1. Energy Consumption and CO2 Emissions
2.2. Populations, Thriving Economies, and CO2 Emissions
3. Empirical Approach
3.1. Method and Data
3.2. CO2 Emissions Estimation
3.3. The STIRPAT Model
3.4. Correlation Matrix
3.5. PLS Regression
4. Results
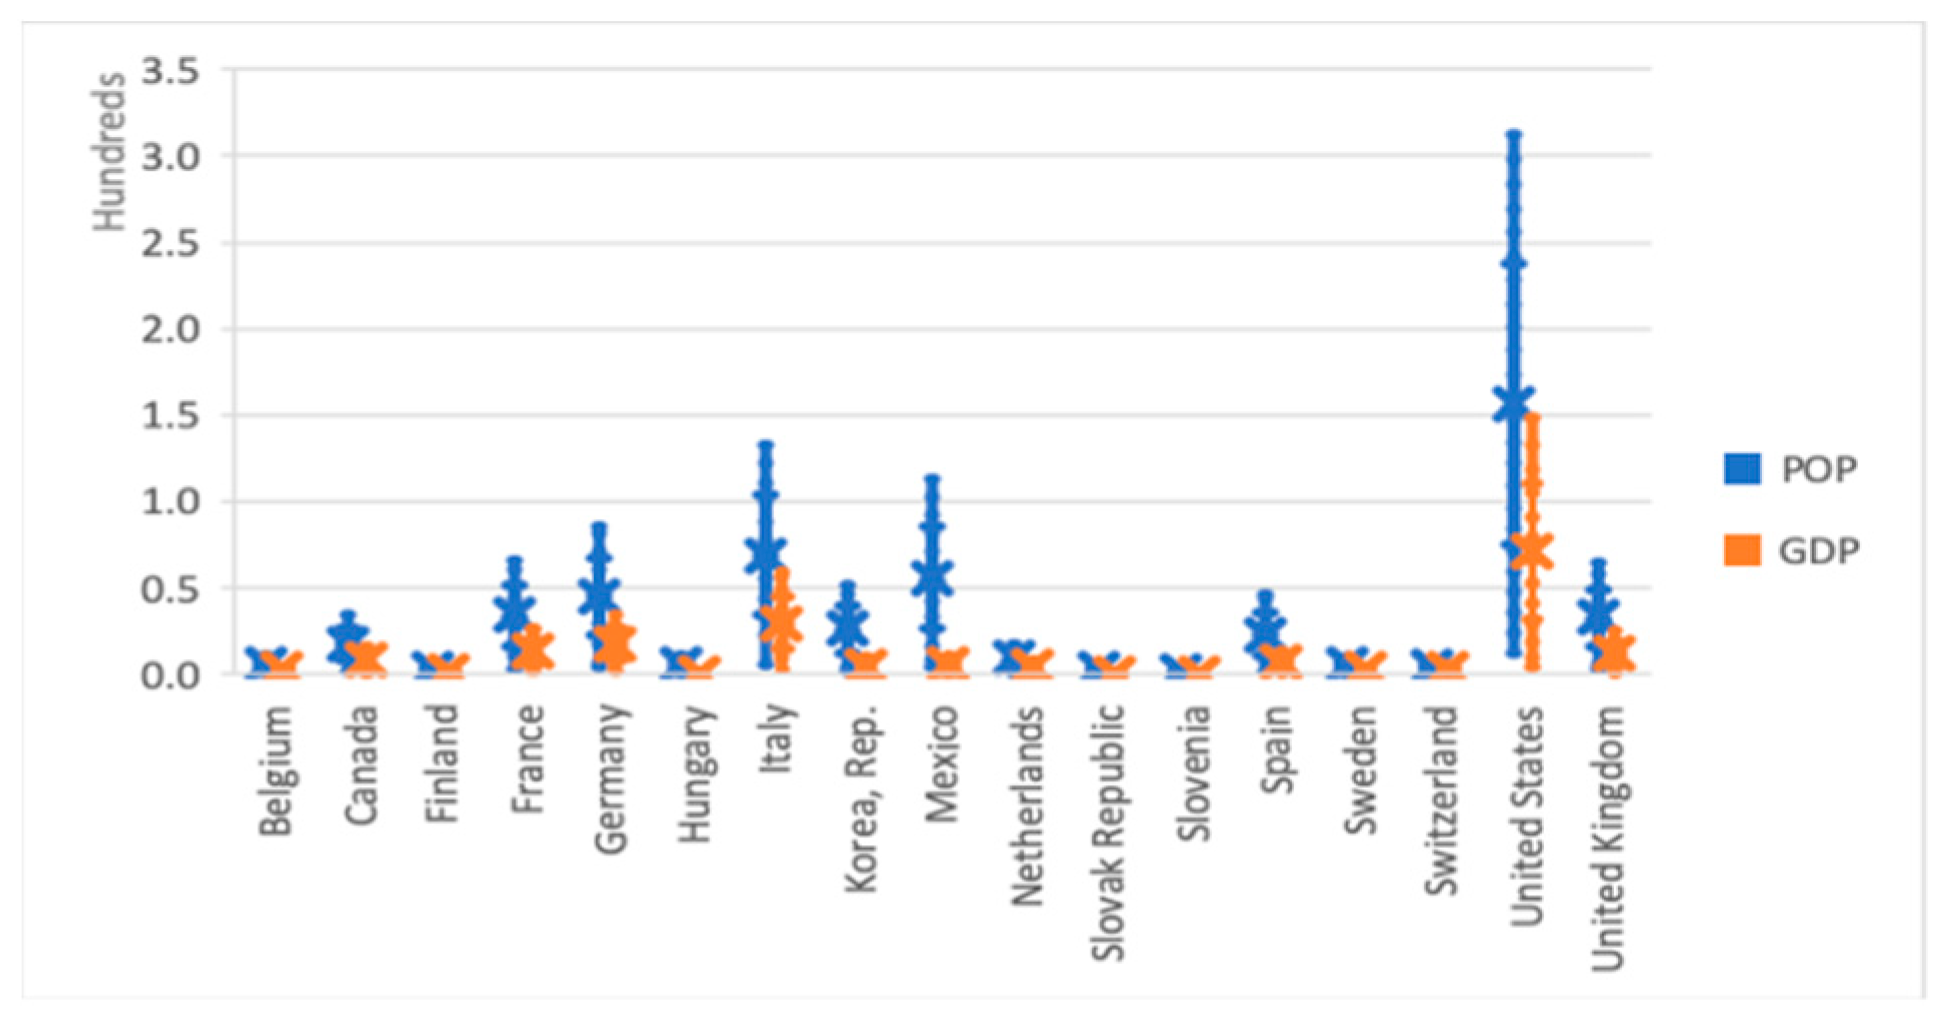
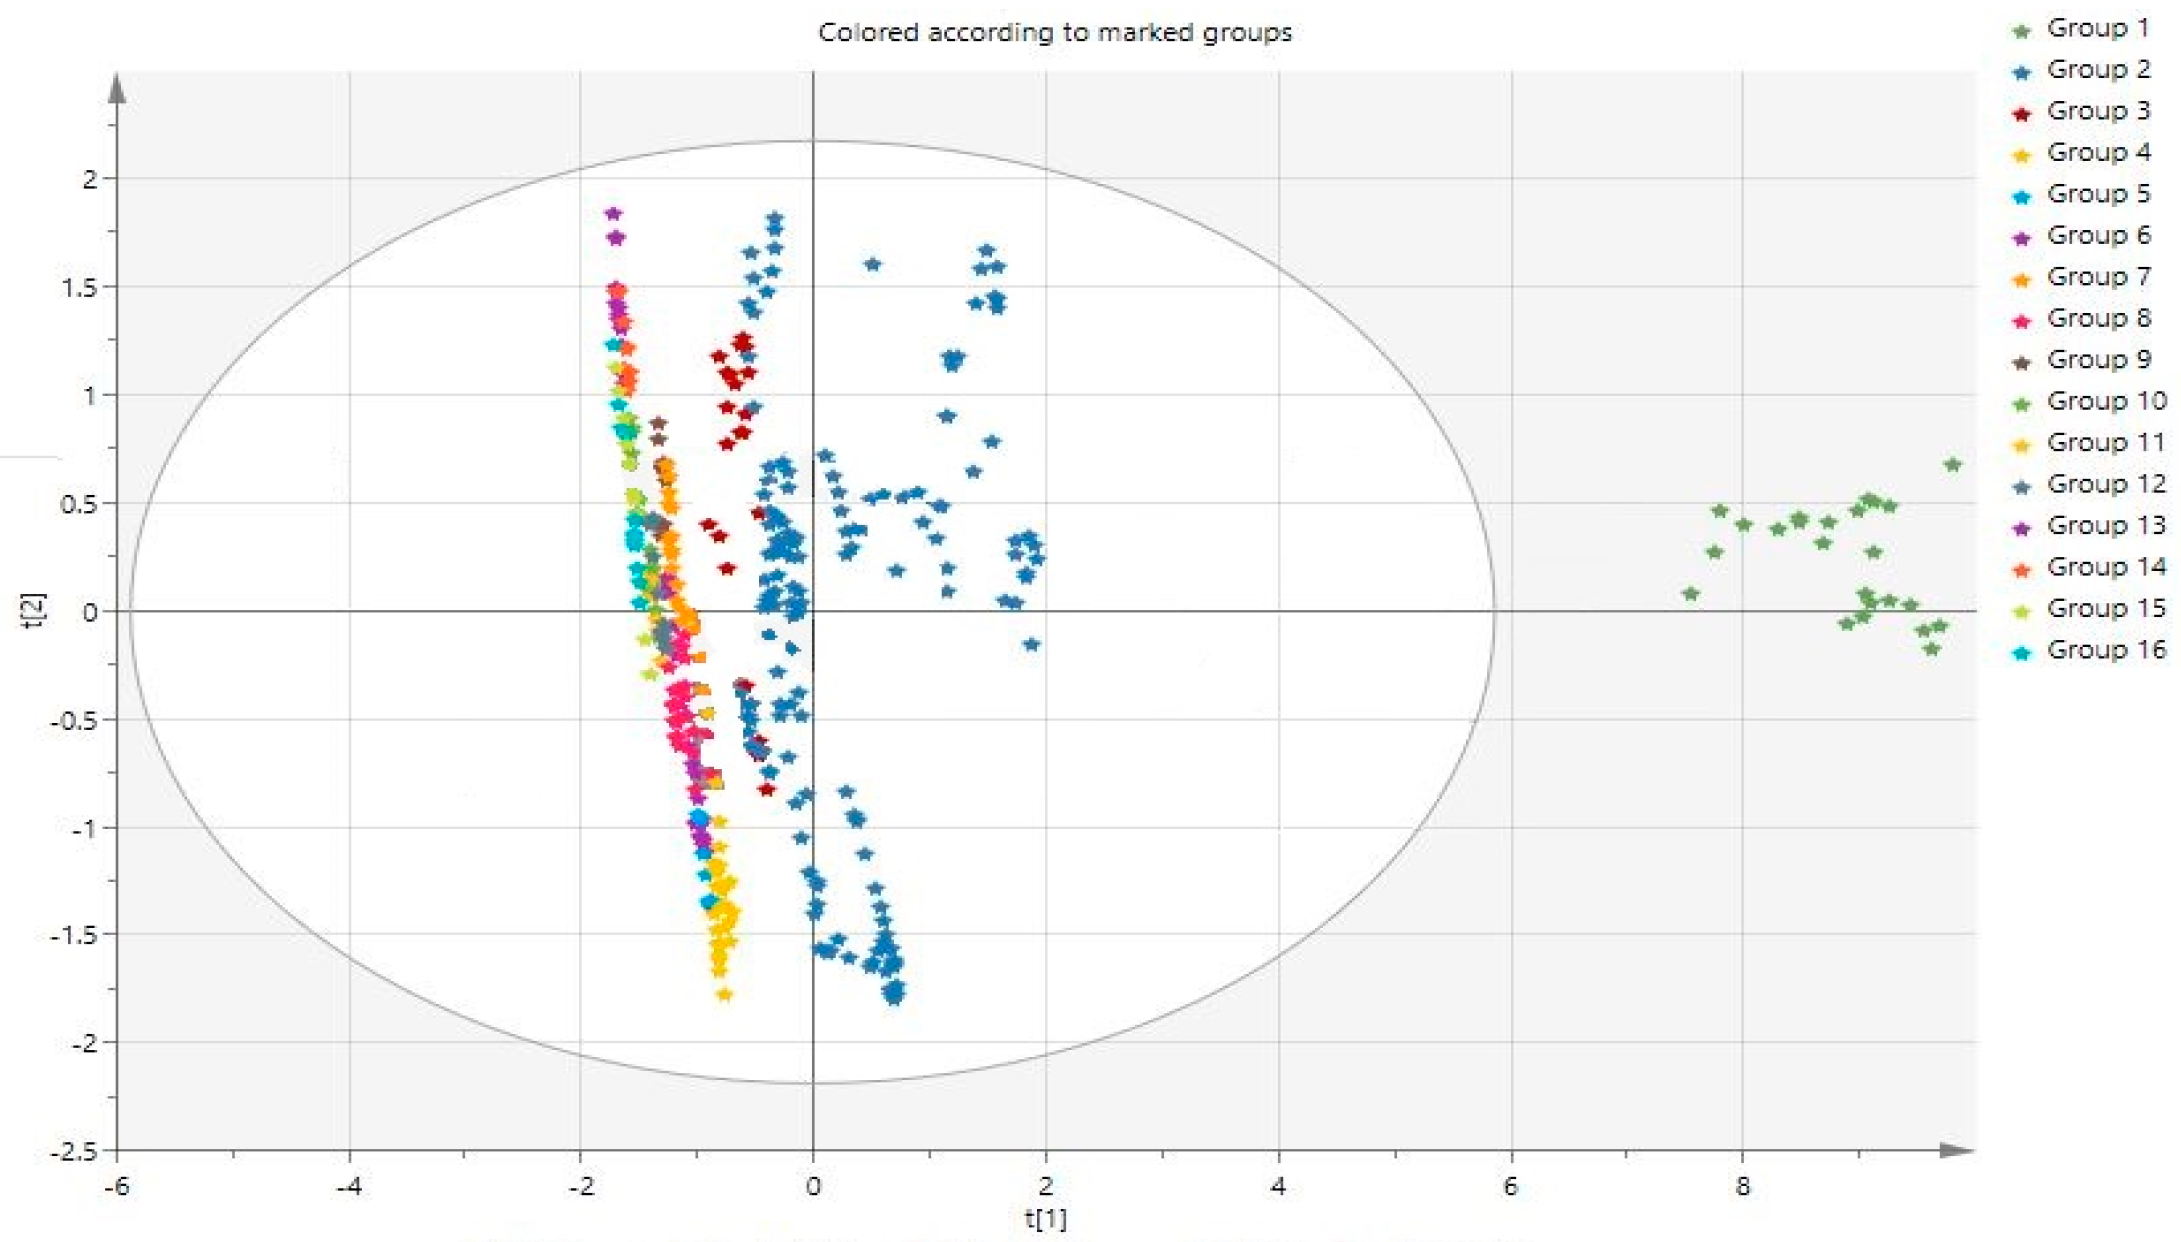
4.1. Scatter Plot
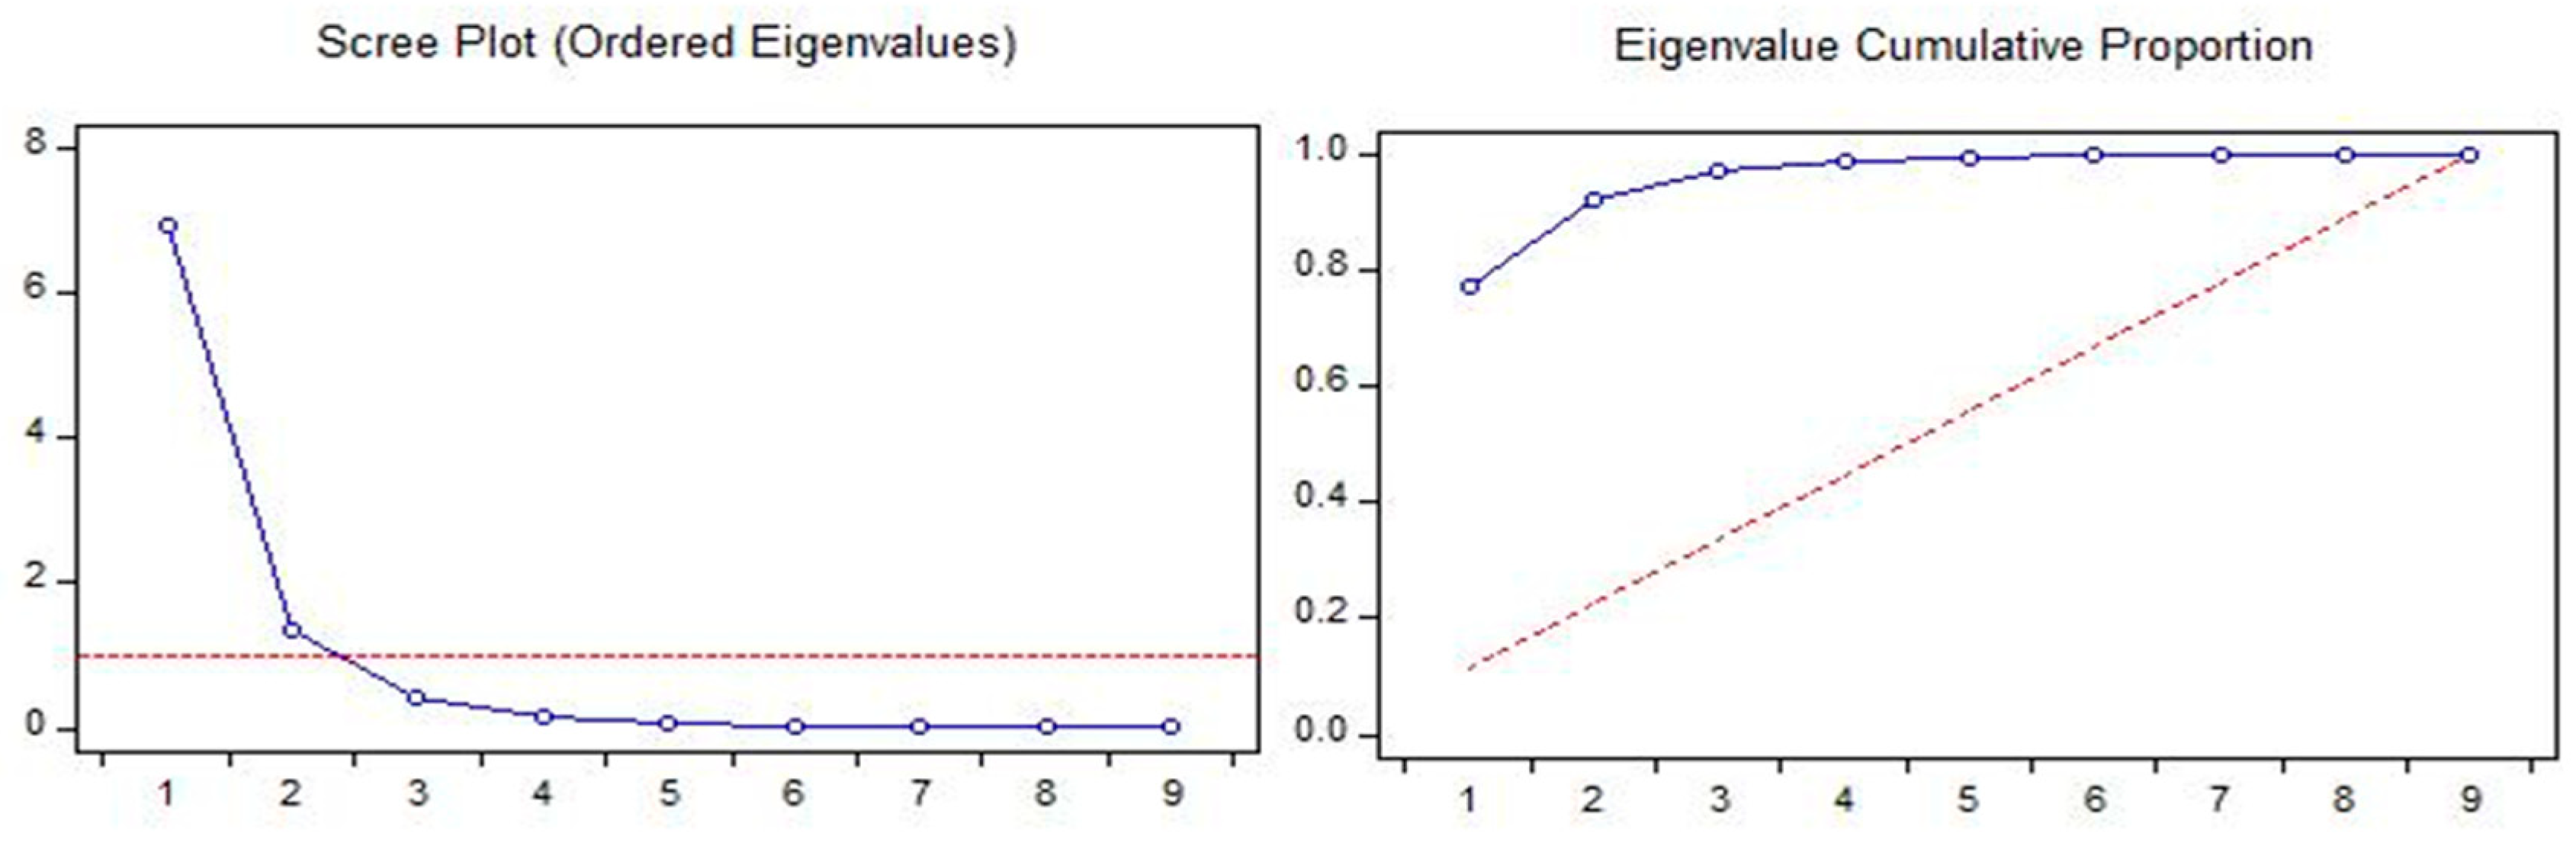
4.2. Principal Component Analysis
4.3. Linear Relationship
4.4. Observed and Predicted Analysis
4.5. Effects of Variables on Projection (VIP)
5. Discussion
6. Conclusions and Recommendations
Author Contributions
Funding
Data Availability Statement
Conflicts of Interest
Appendix A
Appendix B
| Nations No | Country | G7/G8 Membership | Region | Eurozone Membership |
| Economic Classification (World Bank) | ||||
| 1 | United States | Current G7 | North America | No |
| 2 | Canada | No | ||
| 3 | France | Europe | Yes | |
| 4 | Germany | Yes | ||
| 5 | Italy | Yes | ||
| 6 | United Kingdom | No | ||
| 7 | Spain | Not G7/G8 | Yes | |
| 8 | Sweden | No | ||
| 9 | Netherlands | Yes | ||
| 10 | Belgium | Yes | ||
| 11 | Finland | Yes | ||
| 12 | Slovak Republic | Yes | ||
| 13 | Slovenia | Yes | ||
| 14 | Switzerland | No | ||
| 15 | South Korea | Asia | No | |
| Upper-middle-income | ||||
| 16 | Mexico | Not G7/G8 | North America | No |
| 17 | Hungary | Europe | Yes | |
References
- Saidi, K.; Omri, A. Reducing CO2 emissions in OECD countries: Do renewable and nuclear energy matter? Prog. Nucl. Energy 2020, 126, 103425. [Google Scholar] [CrossRef]
- Yang, X.; Li, N.; Mu, H.; Pang, J.; Zhao, H.; Ahmad, M. Study on the long-term impact of economic globalization and population aging on CO2 emissions in OECD countries. Sci. Total Environ. 2021, 787, 147625. [Google Scholar] [CrossRef] [PubMed]
- IEA. Global CO2 Emissions Rose Less than Initially Feared in 2022 as Clean Energy Growth Offset Much of the Impact of Greater Coal and Oil Use; IEA: Paris, France, 2023. [Google Scholar]
- International Energy Agency. CO2 Emissions in 2022; IEA: Paris, France, 2023. [Google Scholar]
- Khurshid, A.; Khan, K.; Chen, Y.; Cifuentes-Faura, J. Do green transport and mitigation technologies drive OECD countries to sustainable path? Transp. Res. Part D Transp. Environ. 2023, 118, 103669. [Google Scholar] [CrossRef]
- Chen, C.; Pinar, M.; Stengos, T. Renewable energy and CO2 emissions: New evidence with the panel threshold model. Renew. Energy 2022, 194, 117–128. [Google Scholar] [CrossRef]
- Gurría, A. The Leaders Seminar: A Conversation on Climate Change and Cities; OECD: Paris, France, 2014. [Google Scholar]
- Isik, C.; Ongan, S.; Özdemir, D. The economic growth/development and environmental degradation: Evidence from the US state-level EKC hypothesis. Environ. Sci. Pollut. Res. 2019, 26, 30772–30781. [Google Scholar] [CrossRef]
- Sönnichsen, N. Leading Countries in Primary Energy Consumption Worldwide in 2019. Primary Energy Consumption by Country 2019 Nov 5, 2020. 2020. Available online: https://yearbook.enerdata.net/total-energy/world-consumption-statistics.html (accessed on 26 August 2024).
- Gozgor, G.; Lau, C.K.M.; Lu, Z. Energy consumption and economic growth: New evidence from the OECD countries. Energy 2018, 153, 27–34. [Google Scholar] [CrossRef]
- Ongan, S.; Isik, C.; Ozdemir, D. Economic growth and environmental degradation: Evidence from the US case environmental Kuznets curve hypothesis with application of decomposition. J. Environ. Econ. Policy 2021, 10, 14–21. [Google Scholar] [CrossRef]
- Cheng, C.; Ren, X.; Dong, K.; Dong, X.; Wang, Z. How does technological innovation mitigate CO2 emissions in OECD countries? Heterogeneous analysis using panel quantile regression. J. Environ. Manag. 2021, 280, 111818. [Google Scholar] [CrossRef] [PubMed]
- Yang, X.; Ramos-Meza, C.S.; Shabbir, M.S.; Ali, S.A.; Jain, V. The impact of renewable energy consumption, trade openness, CO2 emissions, income inequality, on economic growth. Energy Strategy Rev. 2022, 44, 101003. [Google Scholar] [CrossRef]
- Aydin, C.; Cetintas, Y. Does the level of renewable energy matter in the effect of economic growth on environmental pollution? New evidence from PSTR analysis. Environ. Sci. Pollut. Res. 2022, 29, 81624–81635. [Google Scholar] [CrossRef]
- Antimiani, A.; Costantini, V.; Paglialunga, E. Fossil fuels subsidy removal and the EU carbon neutrality policy. Energy Econ. 2023, 119, 106524. [Google Scholar] [CrossRef]
- Piecyk, M.I.; McKinnon, A.C. Forecasting the carbon footprint of road freight transport in 2020. Int. J. Prod. Econ. 2010, 128, 31–42. [Google Scholar] [CrossRef]
- Wu, R.; Xie, Z. Identifying the impacts of income inequality on CO2 emissions: Empirical evidences from OECD countries and non-OECD countries. J. Clean. Prod. 2020, 277, 123858. [Google Scholar] [CrossRef]
- Huang, S.-W.; Chung, Y.-F.; Wu, T.-H. Analyzing the relationship between energy security performance and decoupling of economic growth from CO2 emissions for OECD countries. Renew. Sustain. Energy Rev. 2021, 152, 111633. [Google Scholar] [CrossRef]
- Işık, C.; Ahmad, M.; Ongan, S.; Ozdemir, D.; Irfan, M.; Alvarado, R. Convergence analysis of the ecological footprint: Theory and empirical evidence from the USMCA countries. Environ. Sci. Pollut. Res. 2021, 28, 32648–32659. [Google Scholar] [CrossRef]
- Isik, C.; Ongan, S.; Ozdemir, D.; Ahmad, M.; Irfan, M.; Alvarado, R.; Ongan, A. The increases and decreases of the environment Kuznets curve (EKC) for 8 OECD countries. Environ. Sci. Pollut. Res. 2021, 28, 28535–28543. [Google Scholar] [CrossRef]
- Hashmi, R.; Alam, K. Dynamic relationship among environmental regulation, innovation, CO2 emissions, population, and economic growth in OECD countries: A panel investigation. J. Clean. Prod. 2019, 231, 1100–1109. [Google Scholar] [CrossRef]
- Hossain, M.E.; Islam, M.S.; Bandyopadhyay, A.; Awan, A.; Hossain, M.R.; Rej, S. Mexico at the crossroads of natural resource dependence and COP26 pledge: Does technological innovation help? Resour. Policy 2022, 77, 102710. [Google Scholar] [CrossRef]
- Yu, S.; Zhang, Q.; Hao, J.L.; Ma, W.; Sun, Y.; Wang, X.; Song, Y. Development of an extended STIRPAT model to assess the driving factors of household carbon dioxide emissions in China. J. Environ. Manag. 2023, 325, 116502. [Google Scholar] [CrossRef]
- Ghazali, A.; Ali, G. Investigation of key contributors of CO2 emissions in extended STIRPAT model for newly industrialized countries: A dynamic common correlated estimator (DCCE) approach. Energy Rep. 2019, 5, 242–252. [Google Scholar] [CrossRef]
- Lara-Moreno, A.; Morillo, E.; Merchán, F.; Villaverde, J. Comprehensive feasibility study of effectiveness and environmental impact of PAH bioremediation using an indigenous microbial degrader consortium and a novel strain Stenotrophomonas maltophilia CPHE1 isolated from an industrial polluted soil. J. Environ. Manag. 2021, 289, 112512. [Google Scholar] [CrossRef] [PubMed]
- Awaworyi Churchill, S.; Inekwe, J.; Ivanovski, K.; Smyth, R. Stationarity properties of per capita CO2 emissions in the OECD in the very long-run: A replication and extension analysis. Energy Econ. 2020, 90, 104868. [Google Scholar] [CrossRef]
- Zerbo, E.; Darné, O. On the stationarity of CO2 emissions in OECD and BRICS countries: A sequential testing approach. Energy Econ. 2019, 83, 319–332. [Google Scholar] [CrossRef]
- Ișik, C.; Ahmad, M.; Pata, U.K.; Ongan, S.; Radulescu, M.; Adedoyin, F.F.; Bayraktaroğlu, E.; Aydın, S.; Ongan, A. An Evaluation of the Tourism-Induced Environmental Kuznets Curve (T-EKC) Hypothesis: Evidence from G7 Countries. Sustainability 2020, 12, 9150. [Google Scholar] [CrossRef]
- Işık, C.; Ongan, S.; Bulut, U.; Karakaya, S.; Irfan, M.; Alvarado, R.; Ahmad, M.; Rehman, A. Reinvestigating the Environmental Kuznets Curve (EKC) hypothesis by a composite model constructed on the Armey curve hypothesis with government spending for the US States. Environ. Sci. Pollut. Res. 2022, 29, 16472–16483. [Google Scholar] [CrossRef] [PubMed]
- Xue, L.; Li, H.; Xu, C.; Zhao, X.; Zheng, Z.; Li, Y.; Liu, W. Impacts of industrial structure adjustment, upgrade and coordination on energy efficiency: Empirical research based on the extended STIRPAT model. Energy Strategy Rev. 2022, 43, 100911. [Google Scholar] [CrossRef]
- Lee, J.; Yucel, A.G.; Islam, M.T. Convergence of CO2 emissions in OECD countries. Sustain. Technol. Entrep. 2023, 2, 100029. [Google Scholar] [CrossRef]
- Briglauer, W.; Köppl-Turyna, M.; Schwarzbauer, W.; Bittó, V. Evaluating the effects of ICT core elements on CO2 emissions: Recent evidence from OECD countries. Telecommun. Policy 2023, 47, 102581. [Google Scholar] [CrossRef]
- Nan, S.; Huang, J.; Wu, J.; Li, C. Does globalization change the renewable energy consumption and CO2 emissions nexus for OECD countries? New evidence based on the nonlinear PSTR model. Energy Strategy Rev. 2022, 44, 100995. [Google Scholar] [CrossRef]
- Jin, C.; Lv, Z.; Li, Z.; Sun, K. Green finance, renewable energy and carbon neutrality in OECD countries. Renew. Energy 2023, 211, 279–284. [Google Scholar] [CrossRef]
- Sun, H.; Samuel, C.A.; Kofi Amissah, J.C.; Taghizadeh-Hesary, F.; Mensah, I.A. Non-linear nexus between CO2 emissions and economic growth: A comparison of OECD and B&R countries. Energy 2020, 212, 118637. [Google Scholar] [CrossRef]
- Attílio, L.A.; Faria, J.R.; Rodrigues, M. Does monetary policy impact CO2 emissions? A GVAR analysis. Energy Econ. 2023, 119, 106559. [Google Scholar] [CrossRef]
- Galvin, R. Reducing poverty in the UK to mitigate energy poverty by the 10% and LIHC indicators: What tax changes are needed, and what are the consequences for CO2 emissions? Ecol. Econ. 2024, 217, 108055. [Google Scholar] [CrossRef]
- Mujtaba, A.; Jena, P.K.; Bekun, F.V.; Sahu, P.K. Symmetric and asymmetric impact of economic growth, capital formation, renewable and non-renewable energy consumption on environment in OECD countries. Renew. Sustain. Energy Rev. 2022, 160, 112300. [Google Scholar] [CrossRef]
- Zhao, Z.; Gozgor, G.; Lau, M.C.K.; Mahalik, M.K.; Patel, G.; Khalfaoui, R. The impact of geopolitical risks on renewable energy demand in OECD countries. Energy Econ. 2023, 122, 106700. [Google Scholar] [CrossRef]
- Umar, M.; Safi, A. Do green finance and innovation matter for environmental protection? A case of OECD economies. Energy Econ. 2023, 119, 106560. [Google Scholar] [CrossRef]
- Yu, Y.; Jiang, T.; Li, S.; Li, X.; Gao, D. Energy-related CO2 emissions and structural emissions’ reduction in China’s agriculture: An input–output perspective. J. Clean. Prod. 2020, 276, 124169. [Google Scholar] [CrossRef]
- Sadiq, M.; Wen, F.; Bashir, M.F.; Amin, A. Does nuclear energy consumption contribute to human development? Modeling the effects of public debt and trade globalization in an OECD heterogeneous panel. J. Clean. Prod. 2022, 375, 133965. [Google Scholar] [CrossRef]
- Yu, Y.; Radulescu, M.; Ifelunini, A.I.; Ogwu, S.O.; Onwe, J.C.; Jahanger, A. Achieving Carbon Neutrality Pledge through Clean Energy Transition: Linking the Role of Green Innovation and Environmental Policy in E7 Countries. Energies 2022, 15, 6456. [Google Scholar] [CrossRef]
- Zhang, M.; Zhang, S.; Lee, C.-C.; Zhou, D. Effects of trade openness on renewable energy consumption in OECD countries: New insights from panel smooth transition regression modelling. Energy Econ. 2021, 104, 105649. [Google Scholar] [CrossRef]
- Yu, Y.; Chukwuma Onwe, J.; Jahanger, A.; Adebayo, T.S.; Hossain, M.E.; David, A. Linking shadow economy and CO2 emissions in Nigeria: Exploring the role of financial development and stock market performance. Fresh insight from the novel dynamic ARDL simulation and spectral causality approach. Front. Environ. Sci. 2022, 10, 983729. [Google Scholar] [CrossRef]
- Madaleno, M.; Nogueira, M.C. How Renewable Energy and CO2 Emissions Contribute to Economic Growth, and Sustainability—An Extensive Analysis. Sustainability 2023, 15, 4089. [Google Scholar] [CrossRef]
- Khan, I.; Zakari, A.; Ahmad, M.; Irfan, M.; Hou, F. Linking energy transitions, energy consumption, and environmental sustainability in OECD countries. Gondwana Res. 2022, 103, 445–457. [Google Scholar] [CrossRef]
- Chaouali, I.; Ben Jebli, M.; Ghazouani, T. Investigating the dynamic effects of service value added on CO2 emissions: Novel insights from a non-parametric approach. J. Environ. Manag. 2024, 365, 121553. [Google Scholar] [CrossRef]
- Xie, H.; Bui, W.K.T. Impact of globalization and energy consumption on CO2 emissions in China: Implications for energy transition. Financ. Res. Lett. 2024, 67, 105939. [Google Scholar] [CrossRef]
- Herwartz, H.; Theilen, B.; Wang, S. Unraveling the structural sources of oil production and their impact on CO2 emissions. Energy Econ. 2024, 132, 107488. [Google Scholar] [CrossRef]
- Isik, C.; Dogru, T.; Turk, E.S. A nexus of linear and non-linear relationships between tourism demand, renewable energy consumption, and economic growth: Theory and evidence. Int. J. Tour. Res. 2018, 20, 38–49. [Google Scholar] [CrossRef]
- Thombs, R.P. The asymmetric effects of fossil fuel dependency on the carbon intensity of well-being: A U.S. state-level analysis, 1999–2017. Glob. Environ. Chang. 2022, 77, 102605. [Google Scholar] [CrossRef]
- Korkmaz, Ö. Do oil, coal, and natural gas consumption and rents impact economic growth? An empirical analysis of the Russian Federation. Resour. Policy 2022, 77, 102739. [Google Scholar] [CrossRef]
- Balogh, J.M. The impacts of agricultural development and trade on CO2 emissions? Evidence from the Non-European Union countries. Environ. Sci. Policy 2022, 137, 99–108. [Google Scholar] [CrossRef]
- Pan, X.; Pan, X.; Wu, X.; Jiang, L.; Guo, S.; Feng, X. Research on the heterogeneous impact of carbon emission reduction policy on R&D investment intensity: From the perspective of enterprise’s ownership structure. J. Clean. Prod. 2021, 328, 129532. [Google Scholar] [CrossRef]
- Işik, C.; Kasımatı, E.; Ongan, S. Analyzing the causalities between economic growth, financial development, international trade, tourism expenditure and/on the CO2 emissions in Greece. Energy Sources Part B Econ. Plan. Policy 2017, 12, 665–673. [Google Scholar] [CrossRef]
- Hossain, M.E.; Rej, S.; Hossain, M.R.; Bandyopadhyay, A.; Tama, R.A.Z.; Ullah, A. Energy mix with technological innovation to abate carbon emission: Fresh evidence from Mexico applying wavelet tools and spectral causality. Environ. Sci. Pollut. Res. 2023, 30, 5825–5846. [Google Scholar] [CrossRef] [PubMed]
- Leal, P.H.; Marques, A.C. Rediscovering the EKC hypothesis for the 20 highest CO2 emitters among OECD countries by level of globalization. Int. Econ. 2020, 164, 36–47. [Google Scholar] [CrossRef]
- Wasti, S.K.A.; Zaidi, S.W. An empirical investigation between CO2 emission, energy consumption, trade liberalization and economic growth: A case of Kuwait. J. Build. Eng. 2020, 28, 101104. [Google Scholar] [CrossRef]
- Jahanger, A.; Yu, Y.; Hossain, M.R.; Murshed, M.; Balsalobre-Lorente, D.; Khan, U. Going away or going green in NAFTA nations? Linking natural resources, energy utilization, and environmental sustainability through the lens of the EKC hypothesis. Resour. Policy 2022, 79, 103091. [Google Scholar] [CrossRef]
- Essandoh, O.K.; Islam, M.; Kakinaka, M. Linking international trade and foreign direct investment to CO2 emissions: Any differences between developed and developing countries? Sci. Total Environ. 2020, 712, 136437. [Google Scholar] [CrossRef]
- Schäfer, S. Decoupling the EU ETS from subsidized renewables and other demand side effects: Lessons from the impact of the EU ETS on CO2 emissions in the German electricity sector. Energy Policy 2019, 133, 110858. [Google Scholar] [CrossRef]
- Hossain, M.R.; Rej, S.; Awan, A.; Bandyopadhyay, A.; Islam, M.S.; Das, N.; Hossain, M.E. Natural resource dependency and environmental sustainability under N-shaped EKC: The curious case of India. Resour. Policy 2023, 80, 103150. [Google Scholar] [CrossRef]
- Mastroeni, L.; Mazzoccoli, A.; Quaresima, G.; Vellucci, P. Decoupling and recoupling in the crude oil price benchmarks: An investigation of similarity patterns. Energy Econ. 2021, 94, 105036. [Google Scholar] [CrossRef]
- Huang, W.; Genaro Reivan Ortiz, G.; Kuo, Y.-L.; Maneengam, A.; Nassani, A.A.; Haffar, M. The Non-linear impact of renewable energy and trade on Consumption-based carbon emissions. Fuel 2022, 324, 124423. [Google Scholar] [CrossRef]
- Liu, C.; Cai, W.; Zhai, M.; Zhu, G.; Zhang, C.; Jiang, Z. Decoupling of wastewater eco-environmental damage and China’s economic development. Sci. Total Environ. 2021, 789, 147980. [Google Scholar] [CrossRef] [PubMed]
- Ehigiamusoe, K.U.; Dogan, E. The role of interaction effect between renewable energy consumption and real income in carbon emissions: Evidence from low-income countries. Renew. Sustain. Energy Rev. 2022, 154, 111883. [Google Scholar] [CrossRef]
- Anser, M.K.; Usman, M.; Godil, D.I.; Shabbir, M.S.; Sharif, A.; Tabash, M.I.; Lopez, L.B. Does globalization affect the green economy and environment? The relationship between energy consumption, carbon dioxide emissions, and economic growth. Environ. Sci. Pollut. Res. 2021, 28, 51105–51118. [Google Scholar] [CrossRef] [PubMed]
- Yang, S.; Jahanger, A.; Hossain, M.R. Does China’s low-carbon city pilot intervention limit electricity consumption? An analysis of industrial energy efficiency using time-varying DID model. Energy Econ. 2023, 121, 106636. [Google Scholar] [CrossRef]
- Wu, Y.; Zhu, Q.; Zhu, B. Decoupling analysis of world economic growth and CO2 emissions: A study comparing developed and developing countries. J. Clean. Prod. 2018, 190, 94–103. [Google Scholar] [CrossRef]
- Jahanger, A.; Hossain, M.R.; Usman, M.; Chukwuma Onwe, J. Recent scenario and nexus between natural resource dependence, energy use and pollution cycles in BRICS region: Does the mediating role of human capital exist? Resour. Policy 2023, 81, 103382. [Google Scholar] [CrossRef]
- Abbasi, K.R.; Shahbaz, M.; Zhang, J.; Irfan, M.; Alvarado, R. Analyze the environmental sustainability factors of China: The role of fossil fuel energy and renewable energy. Renew. Energy 2022, 187, 390–402. [Google Scholar] [CrossRef]
- Rehman, F.U.; Islam, M.M.; Raza, S.A. Does disaggregate energy consumption matter to export sophistication and diversification in OECD countries? A robust panel model analysis. Renew. Energy 2023, 206, 274–284. [Google Scholar] [CrossRef]
- Wang, J.; Usman, M.; Saqib, N.; Shahbaz, M.; Hossain, M.R. Asymmetric environmental performance under economic complexity, globalization and energy consumption: Evidence from the World’s largest economically complex economy. Energy 2023, 279, 128050. [Google Scholar] [CrossRef]
- Khan, R.; Zhuang, W.; Najumddin, O.; Butt, R.S.; Ahmad, I.; Al-Faryan, M.A.S. The impact of agricultural intensification on carbon dioxide emissions and energy consumption: A comparative study of developing and developed nations. Front. Environ. Sci. 2022, 10, 1036300. [Google Scholar] [CrossRef]
- Zheng, S.; Khan, R. Performance evaluation of e-commerce firms in China: Using three-stage data envelopment analysis and the Malmquist productivity index. PLoS ONE 2021, 16, e0255851. [Google Scholar] [CrossRef] [PubMed]
- Khan, R. Catch-up growth with alpha and beta decoupling and their relationships between CO2 emissions by GDP, population, energy production, and consumption. Heliyon 2024, 10, e31470. [Google Scholar] [CrossRef] [PubMed]
- Najmuddin, O.; Li, Z.; Khan, R.; Zhuang, W. Valuation of Land-Use/Land-Cover-Based Ecosystem Services in Afghanistan—An Assessment of the Past and Future. Land 2022, 11, 1906. [Google Scholar] [CrossRef]
- Khan, R. The impact of a new techno-nationalism era on eco-economic decoupling. Resour. Policy 2023, 82, 103452. [Google Scholar] [CrossRef]
- Khan, R.; Kong, Y. Effects of Energy Consumption on GDP: New Evidence of 24 Countries on Their Natural Resources and Production of Electricity. Ekonomika 2020, 99, 26–49. [Google Scholar] [CrossRef]
- Jie, W.; Rabnawaz, K. Renewable energy and CO2 emissions in developing and developed nations: A panel estimate approach. Front. Environ. Sci. 2024, 12, 1405001. [Google Scholar] [CrossRef]
- Khan, R. Beta decoupling relationship between CO2 emissions by GDP, energy consumption, electricity production, value-added industries, and population in China. PLoS ONE 2021, 16, e0249444. [Google Scholar] [CrossRef]
- Khezri, M.; Heshmati, A.; Khodaei, M. Environmental implications of economic complexity and its role in determining how renewable energies affect CO2 emissions. Appl. Energy. 2022, 306, 117948. [Google Scholar] [CrossRef]
- Omri, A.; Belaïd, F. Does renewable energy modulate the negative effect of environmental issues on the socio-economic welfare? J. Environ. Manag. 2021, 278, 111483. [Google Scholar] [CrossRef]
- Ben Jebli, M.; Ben Youssef, S. The role of renewable energy and agriculture in reducing CO2 emissions: Evidence for North Africa countries. Ecol. Indic. 2017, 74, 295–301. [Google Scholar] [CrossRef]
- Jahanger, A.; Ozturk, I.; Chukwuma Onwe, J.; Joseph, T.E.; Razib Hossain, M. Do technology and renewable energy contribute to energy efficiency and carbon neutrality? Evidence from top ten manufacturing countries. Sustain. Energy Technol. Assess. 2023, 56, 103084. [Google Scholar] [CrossRef]
- Jahanger, A.; Zaman, U.; Hossain, M.R.; Awan, A. Articulating CO2 emissions limiting roles of nuclear energy and ICT under the EKC hypothesis: An application of non-parametric MMQR approach. Geosci. Front. 2023, 14, 101589. [Google Scholar] [CrossRef]
- Mehmood Mirza, F.; Sinha, A.; Rehman Khan, J.; Kalugina, O.A.; Wasif Zafar, M. Impact of energy efficiency on CO2 Emissions: Empirical evidence from developing countries. Gondwana Res. 2022, 106, 64–77. [Google Scholar] [CrossRef]
- D’Errico, M.C. Sustainable economic growth and energy security nexus: A stochastic frontier analysis across OECD countries. Energy Econ. 2024, 132, 107447. [Google Scholar] [CrossRef]
- Liu, Y.; Lai, X. EKC and carbon footprint of cross-border waste transfer: Evidence from 134 countries. Ecol. Indic. 2021, 129, 107961. [Google Scholar] [CrossRef]
- Chen, F.; Zhang, W.; Li, F.; Sun, Y.; Yu, H. Does fintech positively moderate the impact of mineral resources on green growth? Role of economic policy uncertainty in OECD economies. Resour. Policy 2024, 94, 105097. [Google Scholar] [CrossRef]
- IEA. E.I.O.; IEA: Paris, France, 2020. [Google Scholar]
- Khan, R. Comparing the effects of agricultural intensification on CO2 emissions and energy consumption in developing and developed countries. Front. Environ. Sci. 2023, 10, 1065634. [Google Scholar] [CrossRef]
- Alvarado, R.; Murshed, M.; Cifuentes-Faura, J.; Işık, C.; Razib Hossain, M.; Tillaguango, B. Nexuses between rent of natural resources, economic complexity, and technological innovation: The roles of GDP, human capital and civil liberties. Resour. Policy 2023, 85, 103637. [Google Scholar] [CrossRef]
- Ongan, S.; Işık, C.; Bulut, U.; Karakaya, S.; Alvarado, R.; Irfan, M.; Ahmad, M.; Rehman, A.; Hussain, I. Retesting the EKC hypothesis through transmission of the ARMEY curve model: An alternative composite model approach with theory and policy implications for NAFTA countries. Environ. Sci. Pollut. Res. 2022, 29, 46587–46599. [Google Scholar] [CrossRef]
- Zambrano-Monserrate, M.A. Clean energy production index and CO2 emissions in OECD countries. Sci. Total Environ. 2024, 907, 167852. [Google Scholar] [CrossRef] [PubMed]
- Dam, M.M.; Durmaz, A.; Bekun, F.V.; Tiwari, A.K. The role of green growth and institutional quality on environmental sustainability: A comparison of CO2 emissions, ecological footprint and inverted load capacity factor for OECD countries. J. Environ. Manag. 2024, 365, 121551. [Google Scholar] [CrossRef] [PubMed]
- Marra, A.; Colantonio, E.; Cucculelli, M.; Nissi, E. The ‘complex’ transition: Energy intensity and CO2 emissions amidst technological and structural shifts. Evidence from OECD countries. Energy Econ. 2024, 136, 107702. [Google Scholar] [CrossRef]
- Cheng, Q.; Wang, H.; Li, Y. The effect of urban cultural diversity on the entrepreneurship of rural-to-urban migrant workers. China Econ. Rev. 2022, 74, 101810. [Google Scholar] [CrossRef]
- Kong, Y.S.; Khan, R. To examine environmental pollution by economic growth and their impact in an environmental Kuznets curve (EKC) among developed and developing countries. PLoS ONE 2019, 14, e0209532. [Google Scholar] [CrossRef]
- Wei, T. What STIRPAT Tells About Effects of Population and Affluence on The Environment? Ecol. Econ. 2011, 72, 70–74. [Google Scholar] [CrossRef]
- Jiang, Q.; Rahman, Z.U.; Zhang, X.; Guo, Z.; Xie, Q. An assessment of the impact of natural resources, energy, institutional quality, and financial development on CO2 emissions: Evidence from the B&R nations. Resour. Policy 2022, 76, 102716. [Google Scholar] [CrossRef]
- Hussain, J.; Khan, A.; Zhou, K. The impact of natural resource depletion on energy use and CO2 emission in Belt & Road Initiative countries: A cross-country analysis. Energy 2020, 199, 117409. [Google Scholar] [CrossRef]
- Rosiello, A.; Maleki, A. A dynamic multi-sector analysis of technological catch-up: The impact of technology cycle times, knowledge base complexity and variety. Res. Policy 2021, 50, 104194. [Google Scholar] [CrossRef]
- Eriksson, L.; Trygg, J.; Wold, S. PLS-Trees in Data Mining and Clustering. Available online: https://analyticalsciencejournals.onlinelibrary.wiley.com/doi/abs/10.1002/cem.1254 (accessed on 26 August 2024).
- Said, N.S.; Sarbon, N.M. Physical and Mechanical Characteristics of Gelatin-Based Films as a Potential Food Packaging Material: A Review. Membranes 2022, 12, 442. [Google Scholar] [CrossRef]
- Chen, Y.; Xu, W.; Zhou, Q.; Zhou, Z. Total Factor Energy Efficiency, Carbon Emission Efficiency, and Technology Gap: Evidence from Sub-Industries of Anhui Province in China. Sustainability 2020, 12, 1402. [Google Scholar] [CrossRef]
- Ren, L.; Zhou, S.; Peng, T.; Ou, X. A review of CO2 emissions reduction technologies and low-carbon development in the iron and steel industry focusing on China. Renew. Sustain. Energy Rev. 2021, 143, 110846. [Google Scholar] [CrossRef]
- Nasir, M.A.; Canh, N.P.; Lan Le, T.N. Environmental degradation & role of financialisation, economic development, industrialisation and trade liberalisation. J. Environ. Manag. 2021, 277, 111471. [Google Scholar] [CrossRef]
- Salim, R.A.; Shafiei, S. Urbanization and renewable and non-renewable energy consumption in OECD countries: An empirical analysis. Econ. Model. 2014, 38, 581–591. [Google Scholar] [CrossRef]
- Yang, Y.; Lan, H.; Li, J. Spatial Econometric Analysis of the Impact of Socioeconomic Factors on PM2.5 Concentration in China’s Inland Cities: A Case Study from Chengdu Plain Economic Zone. Int. J. Environ. Res. Public Health 2019, 17, 74. [Google Scholar] [CrossRef]
- Awaworyi Churchill, S.; Inekwe, J.; Ivanovski, K.; Smyth, R. Transport infrastructure and CO2 emissions in the OECD over the long run. Transp. Res. Part D Transp. Environ. 2021, 95, 102857. [Google Scholar] [CrossRef]
- Karlilar, S.; Balcilar, M.; Emir, F. Environmental sustainability in the OECD: The power of digitalization, green innovation, renewable energy and financial development. Telecommun. Policy 2023, 47, 102568. [Google Scholar] [CrossRef]
- Liao, J.; Liu, X.; Zhou, X.; Tursunova, N.R. Analyzing the role of renewable energy transition and industrialization on ecological sustainability: Can green innovation matter in OECD countries. Renew. Energy 2023, 204, 141–151. [Google Scholar] [CrossRef]
- Yu, H.; Wang, J.; Xiao, H.; Liu, M. Quality grade identification of green tea using the eigenvalues of PCA based on the E-nose signals. Sens. Actuators B Chem. 2009, 140, 378–382. [Google Scholar] [CrossRef]
- Manubolu, V.N.; Diwakar Reddy, V. Experimental study on mechanical behavior of corn-based reinforced composites using GRA and PCA. Mater. Today Proc. 2023. [Google Scholar] [CrossRef]
- Yang, L.; Zhang, K.; Chen, Z.; Liang, Y. Fault diagnosis of WOA-SVM high voltage circuit breaker based on PCA Principal Component Analysis. Energy Rep. 2023, 9, 628–634. [Google Scholar] [CrossRef]
- Verma, S.; Singh, V. Impact of artificial intelligence-enabled job characteristics and perceived substitution crisis on innovative work behavior of employees from high-tech firms. Comput. Hum. Behav. 2022, 131, 107215. [Google Scholar] [CrossRef]
- Olivier, J.G.; Schure, K.M.; Peters, J.A.H.W. Trends in Global CO2 and Total Greenhouse Gas Emissions; PBL Netherlands Environmental Assessment Agency: The Hague, The Netherlands, 2017. [Google Scholar]
- Veas, C.; Crispi, F.; Cuadrado, C. Association between gender inequality and population-level health outcomes: Panel data analysis of organization for Economic Co-operation and Development (OECD) countries. EClinicalMedicine 2021, 39, 101051. [Google Scholar] [CrossRef] [PubMed]
- Yang, X.; Li, N.; Mu, H.; Zhang, M.; Pang, J.; Ahmad, M. Study on the long-term and short-term effects of globalization and population aging on ecological footprint in OECD countries. Ecol. Complex. 2021, 47, 100946. [Google Scholar] [CrossRef]
- Boissonneault, M.; Rios, P. Changes in healthy and unhealthy working-life expectancy over the period 2002–2017: A population-based study in people aged 51–65 years in 14 OECD countries. Lancet Healthy Longev. 2021, 2, e629–e638. [Google Scholar] [CrossRef]
- Ozcan, B.; Tzeremes, P.G.; Tzeremes, N.G. Energy consumption, economic growth and environmental degradation in OECD countries. Econ. Model. 2020, 84, 203–213. [Google Scholar] [CrossRef]
- Pan, X.; Uddin, M.K.; Ai, B.; Pan, X.; Saima, U. Influential factors of carbon emissions intensity in OECD countries: Evidence from symbolic regression. J. Clean. Prod. 2019, 220, 1194–1201. [Google Scholar] [CrossRef]
- Naeem, M.A.; Appiah, M.; Taden, J.; Amoasi, R.; Gyamfi, B.A. Transitioning to clean energy: Assessing the impact of renewable energy, bio-capacity and access to clean fuel on carbon emissions in OECD economies. Energy Econ. 2023, 127, 107091. [Google Scholar] [CrossRef]
- Lei, Q.; Huang, W.; Zhao, F.; Sarwar, S.; Chaudhary, M.G. The importance of public sector size and resources volatility in carbon emissions: Empirical evidence from OECD countries. Resour. Policy 2023, 85, 103968. [Google Scholar] [CrossRef]
- Chovancová, J.; Zambrano-Monserrate, M.A.; Bergougui, B.; Ahakwa, I.; Dam, M.M. Global determinants of methane emissions in OECD countries: A dynamic panel approach. Res. Glob. 2024, 9, 100232. [Google Scholar] [CrossRef]
- Dias, F.; Suhadolnik, N.; Camargo, H.; Da Silva, S. Predicting the pulse of the Amazon: Machine learning insights into deforestation dynamics. J. Environ. Manag. 2024, 362, 121359. [Google Scholar] [CrossRef]
- Ur Rahman, Z.; Iqbal Khattak, S.; Ahmad, M.; Khan, A. A disaggregated-level analysis of the relationship among energy production, energy consumption and economic growth: Evidence from China. Energy 2020, 194, 116836. [Google Scholar] [CrossRef]
- Yu, B.; Fang, D. Decoupling economic growth from energy-related PM2.5 emissions in China: A GDIM-based indicator decomposition. Ecol. Indic. 2021, 127, 107795. [Google Scholar] [CrossRef]
- Li, M.; Zaidan, A.M.; Ageli, M.M.; Wahab, S.; Khan, Z. Natural resources, environmental policies and renewable energy resources for production-based emissions: OECD economies evidence. Resour. Policy 2023, 86, 104096. [Google Scholar] [CrossRef]
- Barrales-Ruiz, J.; Neudörfer, P. The oil price (Ir)relevance for global CO2 emissions. Energy Rep. 2024, 11, 3016–3021. [Google Scholar] [CrossRef]
- Shahnazi, R.; Jamshidi, N.; Shafiei, M. Investigating the effects of crony capitalism on CO2 emissions. J. Clean. Prod. 2024, 438, 140833. [Google Scholar] [CrossRef]
- Işık, C.; Sirakaya-Turk, E.; Ongan, S. Testing the efficacy of the economic policy uncertainty index on tourism demand in USMCA: Theory and evidence. Tour. Econ. 2020, 26, 1344–1357. [Google Scholar] [CrossRef]
- Ahmad, M.; Akhtar, N.; Jabeen, G.; Irfan, M.; Anser, M.K.; Wu, H.; Işık, C. Intention-Based Critical Factors Affecting Willingness to Adopt Novel Coronavirus Prevention in Pakistan: Implications for Future Pandemics. Int. J. Environ. Res. Public Health 2021, 18, 6167. [Google Scholar] [CrossRef]
- Irfan, M.S. Interventions for the Current COVID-19 Pandemic: Frontline Workers’ Intention to Use Personal Protective Equipment. Front. Public Health 2022, 4, 793642. [Google Scholar] [CrossRef]
- Işık, C.; Bulut, U.; Ongan, S.; Islam, H.; Irfan, M. Exploring how economic growth, renewable energy, internet usage, and mineral rents influence CO2 emissions: A panel quantile regression analysis for 27 OECD countries. Resour. Policy 2024, 92, 105025. [Google Scholar] [CrossRef]
- Papież, M.; Śmiech, S.; Frodyma, K. The role of energy policy on the decoupling processes in the European Union countries. J. Clean. Prod. 2021, 318, 128484. [Google Scholar] [CrossRef]
- Su, M.; Yang, Z.; Abbas, S.; Bilan, Y.; Majewska, A. Toward enhancing environmental quality in OECD countries: Role of municipal waste, renewable energy, environmental innovation, and environmental policy. Renew. Energy 2023, 211, 975–984. [Google Scholar] [CrossRef]
- Puertas, R.; Marti, L. Eco-innovation and determinants of GHG emissions in OECD countries. J. Clean. Prod. 2021, 319, 128739. [Google Scholar] [CrossRef]
- Zhao, J.; Wang, J.; Dong, K. The role of green finance in eradicating energy poverty: Ways to realize green economic recovery in the post-COVID-19 era. Econ. Chang. Restruct. 2022, 56, 3757–3785. [Google Scholar] [CrossRef]


| Variables | Code | IPAT | Description | |
|---|---|---|---|---|
| CO2 emissions | CO2 emissions | I | CO2 emissions manufactured via the combustion of coal, gas, and oil. | |
| Urban population growth (annual%) | UPG | P1 | P | The proportion of the total population that lives in urban regions as a percentage. |
| Population total (POP/1 million) | POP | P2 | Using this definition of population and some expected values for the middle of the year, we can calculate the total population. | |
| GDP (constant 2010 US$) | GDP | A | The GDP is calculated using the prices paid by purchasers, and it represents the total gross value added by all residents. | |
| Primary energy consumption | PEC | T1 | T | The overall energy consumption of a nation is typically referred to as the “gross inland energy consumption” of that nation. |
| Oil consumption (tons) | OIC | T2 | The process of burning things in various fields results in the release of energy. | |
| Nuclear energy consumption (Mtoe) | NEC | T3 | Energy consumption. | |
| Renewable–geothermal, biomass, and others | RGB | T4 | Geothermal and biomass. | |
| Industry (including construction) value added (% of GDP) | ICG | T5 | Value-added construction spending is a proportion of total economic output. The construction, mining, energy, water, and gas industries are the ones that most significantly contribute to economic value. | |
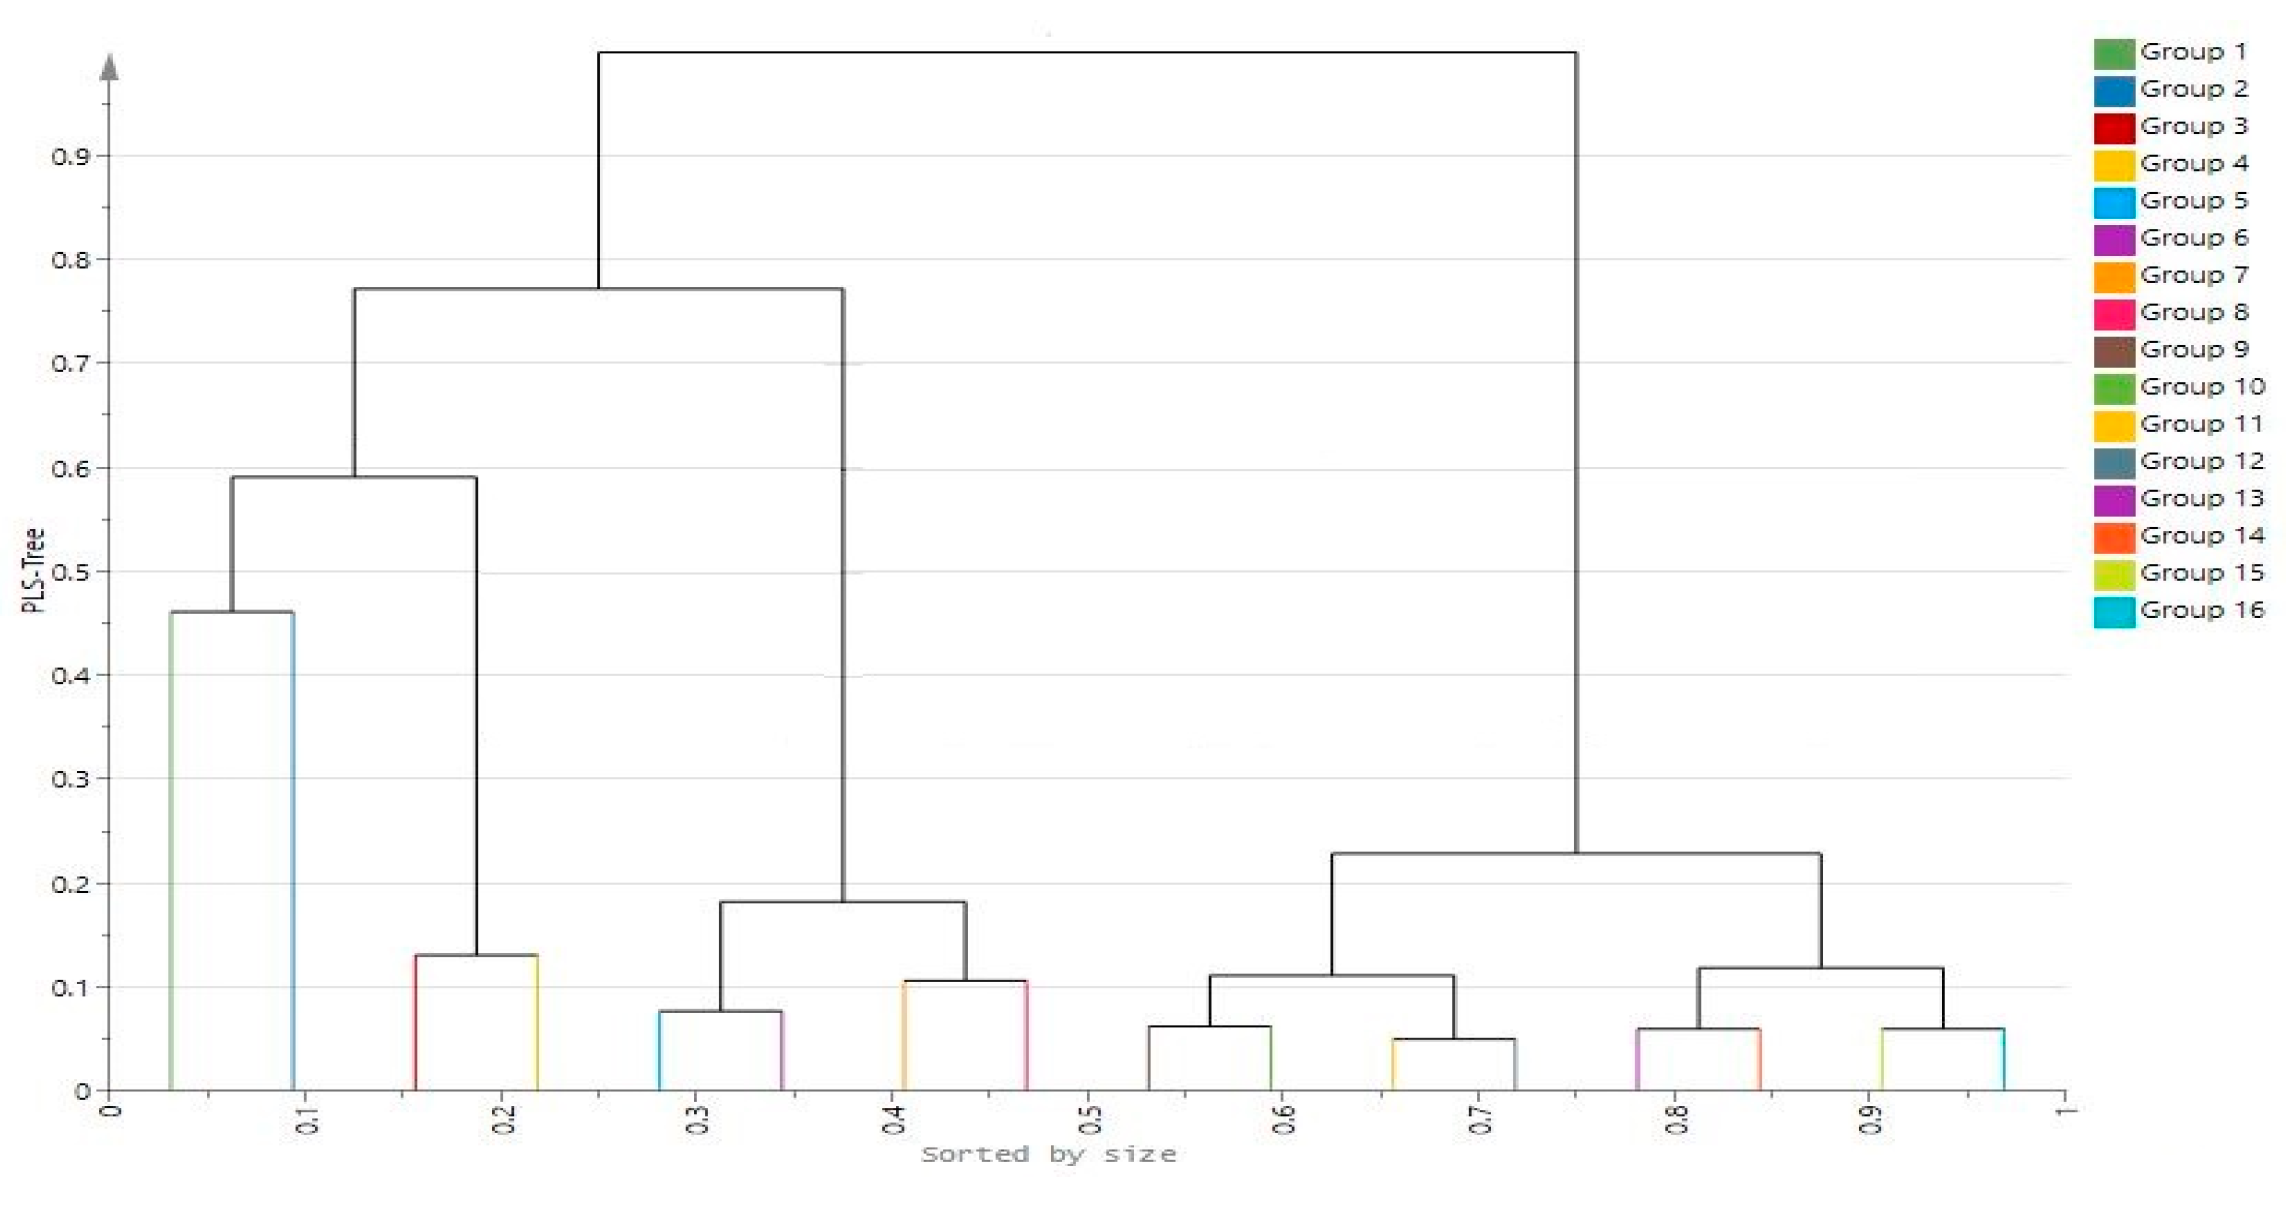
| Groups | Total Observations (408) | Country Codes | Countries (17) |
|---|---|---|---|
| Group 1 | 24 | USA | United States |
| Group 2 | 168 | CAN, FRA, DEU, ITA, KOR, MEX, ESP, SWE, GBR | Canada, France, Germany, Italy, Rep. of Korea, Mexico, Spain, Sweden, United Kingdom |
| Group 3 | 23 | CAN, KOR, ESP | Canada, Rep. of Korea, Spain |
| Group 4 | 28 | NLD, ESP, SWE | Netherlands, Spain, Sweden |
| Group 5 | 9 | NLD | Netherland |
| Group 6 | 15 | BEL | Belgium |
| Group 7 | 12 | SWE | Sweden |
| Group 8 | 34 | FIN, SVN, CHE | Finland, Slovenia, Switzerland |
| Group 9 | 9 | BEL | Belgium |
| Group 10 | 16 | FIN, HUN | Finland, Hungary |
| Group 11 | 13 | HUN | Hungary |
| Group 12 | 10 | ||
| Group 13 | 14 | SVK | Slovak Republic |
| Group 14 | 10 | ||
| Group 15 | 15 | SVN | Slovenia |
| Group 16 | 8 |
| Probability | CO2 | POP | GDP | PEC | OIC | NEC | RGB | ICG | UPG |
|---|---|---|---|---|---|---|---|---|---|
| CO2 | 1.000 | ||||||||
| POP | 0.932 *** | 1.000 | |||||||
| GDP | 0.963 *** | 0.950 *** | 1.000 | ||||||
| PEC | 0.997 *** | 0.934 *** | 0.970 *** | 1.000 | |||||
| OIC | 0.996 *** | 0.943 *** | 0.968 *** | 0.997 *** | 1.000 | ||||
| NEC | 0.874 *** | 0.844 *** | 0.895 *** | 0.898 *** | 0.890 *** | 1.000 | |||
| RGB | 0.903 *** | 0.866 *** | 0.923 *** | 0.905 *** | 0.895 *** | 0.766 *** | 1.000 | ||
| ICG | −0.219 *** | −0.136 *** | −0.282 *** | −0.238 *** | −0.205 *** | −0.335 *** | −0.272 *** | 1.000 | |
| UPG | 0.169 *** | 0.252 *** | 0.135 *** | 0.172 *** | 0.193 *** | 0.119 *** | 0.111 *** | −0.074 * | 1.000 |
| Variable | Unstandardized Coefficient | Std. Error | Standardize Coefficient | Elasticity of Means | t-Statistic | VIF |
|---|---|---|---|---|---|---|
| CO2 | 122.011 | 23.681 | - | 0.197 | 5.152 *** | - |
| POP | 0.511 | 0.177 | 0.029 | 0.045 | 2.893 *** | 17.036 |
| GDP | −3.738 | 0.583 | −0.102 | −0.125 | −6.406 *** | 41.561 |
| PEC | 1.658 | 0.095 | 0.668 | 0.719 | 17.412 *** | 242.433 |
| OIC | 3.048 | 0.242 | 0.484 | 0.533 | 12.620 *** | 242.544 |
| NEC | −2.686 | 0.182 | −0.099 | −0.124 | −14.792 *** | 7.370 |
| RGB | 0.520 | 0.522 | 0.008 | 0.009 | 0.996 * | 9.406 |
| ICG | −4.498 | 0.822 | −0.018 | −0.190 | −5.475 *** | 1.754 |
| UPG | −49.060 | 6.027 | −0.024 | −0.064 | −8.140 *** | 1.412 |
| Cumulative Value | Cumulative Proportion | ||||
|---|---|---|---|---|---|
| Number | Value | Difference | Proportion | ||
| 1 | 6.931 | 5.565 | 0.770 | 6.931 | 0.770 |
| 2 | 1.366 | 0.931 | 0.152 | 8.297 | 0.922 |
| 3 | 0.435 | 0.284 | 0.048 | 8.733 | 0.970 |
| 4 | 0.152 | 0.086 | 0.017 | 8.884 | 0.987 |
| 5 | 0.065 | 0.032 | 0.007 | 8.950 | 0.994 |
| 6 | 0.034 | 0.019 | 0.004 | 8.983 | 0.998 |
| 7 | 0.014 | 0.013 | 0.002 | 8.998 | 1.000 |
| 8 | 0.001 | 0.001 | 0.000 | 8.999 | 1.000 |
| 9 | 0.001 | --- | 0.000 | 9.000 | 1.000 |
| Variable | PC 1 | PC 2 | PC 3 | PC 4 | PC 5 | PC 6 | PC 7 | PC 8 | PC 9 |
|---|---|---|---|---|---|---|---|---|---|
| CO2 | 0.373 | (0.116) | 0.018 | (0.235) | 0.201 | 0.367 | (0.011) | 0.178 | 0.765 |
| POP | 0.370 | 0.057 | (0.032) | (0.010) | (0.842) | 0.099 | (0.366) | 0.072 | (0.021) |
| GDP | 0.375 | (0.066) | 0.072 | 0.037 | (0.234) | (0.334) | 0.822 | 0.074 | 0.034 |
| PEC | 0.375 | (0.103) | 0.009 | (0.121) | 0.262 | 0.287 | (0.012) | 0.588 | (0.580) |
| OIC | 0.376 | (0.084) | (0.004) | (0.137) | 0.106 | 0.378 | 0.092 | (0.774) | (0.266) |
| NEC | 0.354 | (0.087) | 0.094 | 0.874 | 0.204 | (0.089) | (0.194) | (0.038) | 0.076 |
| RGB | 0.370 | (0.066) | 0.083 | (0.378) | 0.231 | (0.709) | (0.377) | (0.102) | (0.011) |
| ICG | 0.078 | 0.754 | 0.644 | (0.029) | 0.063 | 0.073 | 0.016 | 0.004 | 0.000 |
| UPG | 0.184 | 0.617 | (0.750) | 0.040 | 0.126 | (0.054) | 0.042 | 0.006 | 0.026 |
| Variable | Scale and Centered Coefficient | Rotated Coefficient | ||||
|---|---|---|---|---|---|---|
| t1 | t1 and t2 | t1, t2, and t3 | t1 | t1 and t2 | t1, t2, and t3 | |
| CO2 emissions | 0.507 | 0.507 | 0.507 | 0.507 | 0.507 | 0.507 |
| POP | 0.165 | 0.160 | (0.038) | 0.975 | 0.857 | (0.064) |
| GDP | 0.169 | 0.162 | 0.019 | 0.999 | 0.871 | 0.032 |
| PEC | 0.175 | 0.213 | 0.539 | 1.038 | 1.144 | 0.915 |
| OIC | 0.175 | 0.215 | 0.531 | 1.038 | 1.150 | 0.902 |
| NEC | 0.155 | 0.130 | (0.110) | 0.919 | 0.697 | (0.187) |
| RGB | 0.158 | 0.154 | 0.048 | 0.933 | 0.827 | 0.082 |
| ICG | (0.042) | 0.048 | 0.006 | (0.249) | 0.257 | 0.011 |
| UPG | 0.035 | (0.008) | 0.006 | 0.206 | (0.043) | 0.011 |
| R2Y (cum) | 0.961 | 0.972 | 0.996 | 0.961 | 0.972 | 0.996 |
| Q2 (cum) | 0.961 | 0.972 | 0.995 | 0.961 | 0.972 | 0.995 |
Disclaimer/Publisher’s Note: The statements, opinions and data contained in all publications are solely those of the individual author(s) and contributor(s) and not of MDPI and/or the editor(s). MDPI and/or the editor(s) disclaim responsibility for any injury to people or property resulting from any ideas, methods, instructions or products referred to in the content. |
© 2024 by the authors. Licensee MDPI, Basel, Switzerland. This article is an open access article distributed under the terms and conditions of the Creative Commons Attribution (CC BY) license (https://creativecommons.org/licenses/by/4.0/).
Share and Cite
Jie, W.; Khan, R. Breaking the CO2 Gridlock: Can Renewables Lead the Way for the OECD? Energies 2024, 17, 4511. https://doi.org/10.3390/en17174511
Jie W, Khan R. Breaking the CO2 Gridlock: Can Renewables Lead the Way for the OECD? Energies. 2024; 17(17):4511. https://doi.org/10.3390/en17174511
Chicago/Turabian StyleJie, Wang, and Rabnawaz Khan. 2024. "Breaking the CO2 Gridlock: Can Renewables Lead the Way for the OECD?" Energies 17, no. 17: 4511. https://doi.org/10.3390/en17174511
APA StyleJie, W., & Khan, R. (2024). Breaking the CO2 Gridlock: Can Renewables Lead the Way for the OECD? Energies, 17(17), 4511. https://doi.org/10.3390/en17174511