Article

Detection Method for Inter-Turn Short Circuit Faults in Dry-Type Transformers Based on an Improved YOLOv8 Infrared Image Slicing-Aided Hyper-Inference Algorithm

1
Xiluodu Hydropower Plant, Zhaotong 657300, China
2
Three Gorges Ecological Environment Co., Ltd., Zhaotong 657300, China
3
State Key Laboratory of Power Transmission Equipment Technology, School of Electrical Engineering, Chongqing University, Chongqing 400044, China
*
Author to whom correspondence should be addressed.
Energies 2024, 17(18), 4559; https://doi.org/10.3390/en17184559
Submission received: 22 August 2024 / Revised: 1 September 2024 / Accepted: 4 September 2024 / Published: 12 September 2024
(This article belongs to the Section F: Electrical Engineering)

Abstract

:
Inter-Turn Short Circuit (ITSC) faults do not necessarily produce high temperatures but exhibit distinct heat distribution and characteristics. This paper proposes a novel fault diagnosis and identification scheme utilizing an improved You Look Only Once Vision 8 (YOLOv8) algorithm, enhanced with an infrared image slicing-aided hyper-inference (SAHI) technique, to automatically detect ITSC fault trajectories in dry-type transformers. The infrared image acquisition system gathers data on ITSC fault trajectories and captures images with varying contrast to enhance the robustness of the recognition model. Given that the fault trajectory constitutes a small portion of the overall infrared image and is subject to significant background interference, traditional recognition algorithms often misjudge or omit faults. To address this, a YOLOv8-based visual detection method incorporating Dynamic Snake Convolution (DSConv) and the Slicing-Aided Hyper-Inference algorithm is proposed. This method aims to improve recognition precision and accuracy for small targets in complex backgrounds, facilitating accurate detection of ITSC faults in dry-type transformers. Comparative tests with the YOLOv8 model, Fast Region-based Convolutional Neural Networks (Fast-RCNNs), and Residual Neural Networks (Retina-Nets) demonstrate that the enhancements significantly improve model convergence speed and fault trajectory detection accuracy. The approach offers valuable insights for advancing infrared image diagnostic technology in electrical power equipment.

1. Introduction

In recent years, the manufacturing technology for dry-type transformers has advanced significantly. Their benefits, including environmental friendliness, efficient operation, and fire and explosion resistance, have led to their widespread use in power distribution systems [1]. As societal demand for electricity grows, so do the requirements for equipment insulation performance and operational reliability. Winding faults are a primary failure mode for dry-type transformers, accounting for 48% of total failures. Due to differences in insulation structures between dry-type and oil-immersed transformers, real-time monitoring of winding insulation—especially inter-turn insulation—does not adequately meet operational needs. Minor Inter-Turn Short Circuit (ITSC) faults can be challenging to detect and may quickly escalate into severe multi-turn short circuits, leading to winding insulation damage and directly threatening the safe operation of the distribution network [2,3].
In the field of winding short circuit detection, extensive research has been conducted by many scholars [4,5]. Common online monitoring methods include vibration monitoring and thermal imaging [6,7]. By analyzing monitoring signals across time, frequency, and time-frequency domains, features indicative of the target system’s health can be designed based on domain knowledge. However, current research faces limitations due to the isolation of physical structures, which hampers the accurate detection of minor faults within the transformer. Advances in artificial intelligence technology have led to the widespread adoption of data-driven online transformer fault classification methods, which are effective at recognizing minor differences in data [8]. Recently, deep learning techniques have emerged as a promising direction for image-based fault diagnosis. However, there is limited research on identifying and localizing inter-turn short circuits using infrared imaging techniques. Most existing studies rely on frequency response analysis [9], differential admittance [10], and differential current monitoring, which are prone to inaccuracies as transformers age. The literature [11] performed thermal analysis of dry-type transformer failures using computational fluid dynamics software (COMSOL Multiphysics 6.0) and confirmed that transformer failures are heat-related. Consequently, early detection of thermal trends is crucial for minimizing accidents [12,13,14].
To improve the detection capability of inter-turn short circuit faults in dry-type transformers and advance the use of machine vision and deep learning methods in power equipment fault detection, this paper presents an enhanced algorithm based on the You Only Look Once (YOLOv8) framework. The proposed approach incorporates an infrared image Slicing-Aided Hyper-Inference (SAHI) technique, Dynamic Snake Convolution (DSConv), and a robust data acquisition system to effectively identify fault trajectories. Extensive comparative tests against established models, such as Fast Region-based Convolutional Neural Networks (Fast-RCNN) and Residual Neural Network (Retina-Net), reveal notable enhancements in model convergence speed and fault trajectory detection accuracy. It offers a new approach and algorithmic basis for detecting small-target faults and performing unmanned inspections of electrical power equipment in complex backgrounds.

2. Research on the Improved Yolov8 Slicing-Aided Hyper-Inference Algorithm

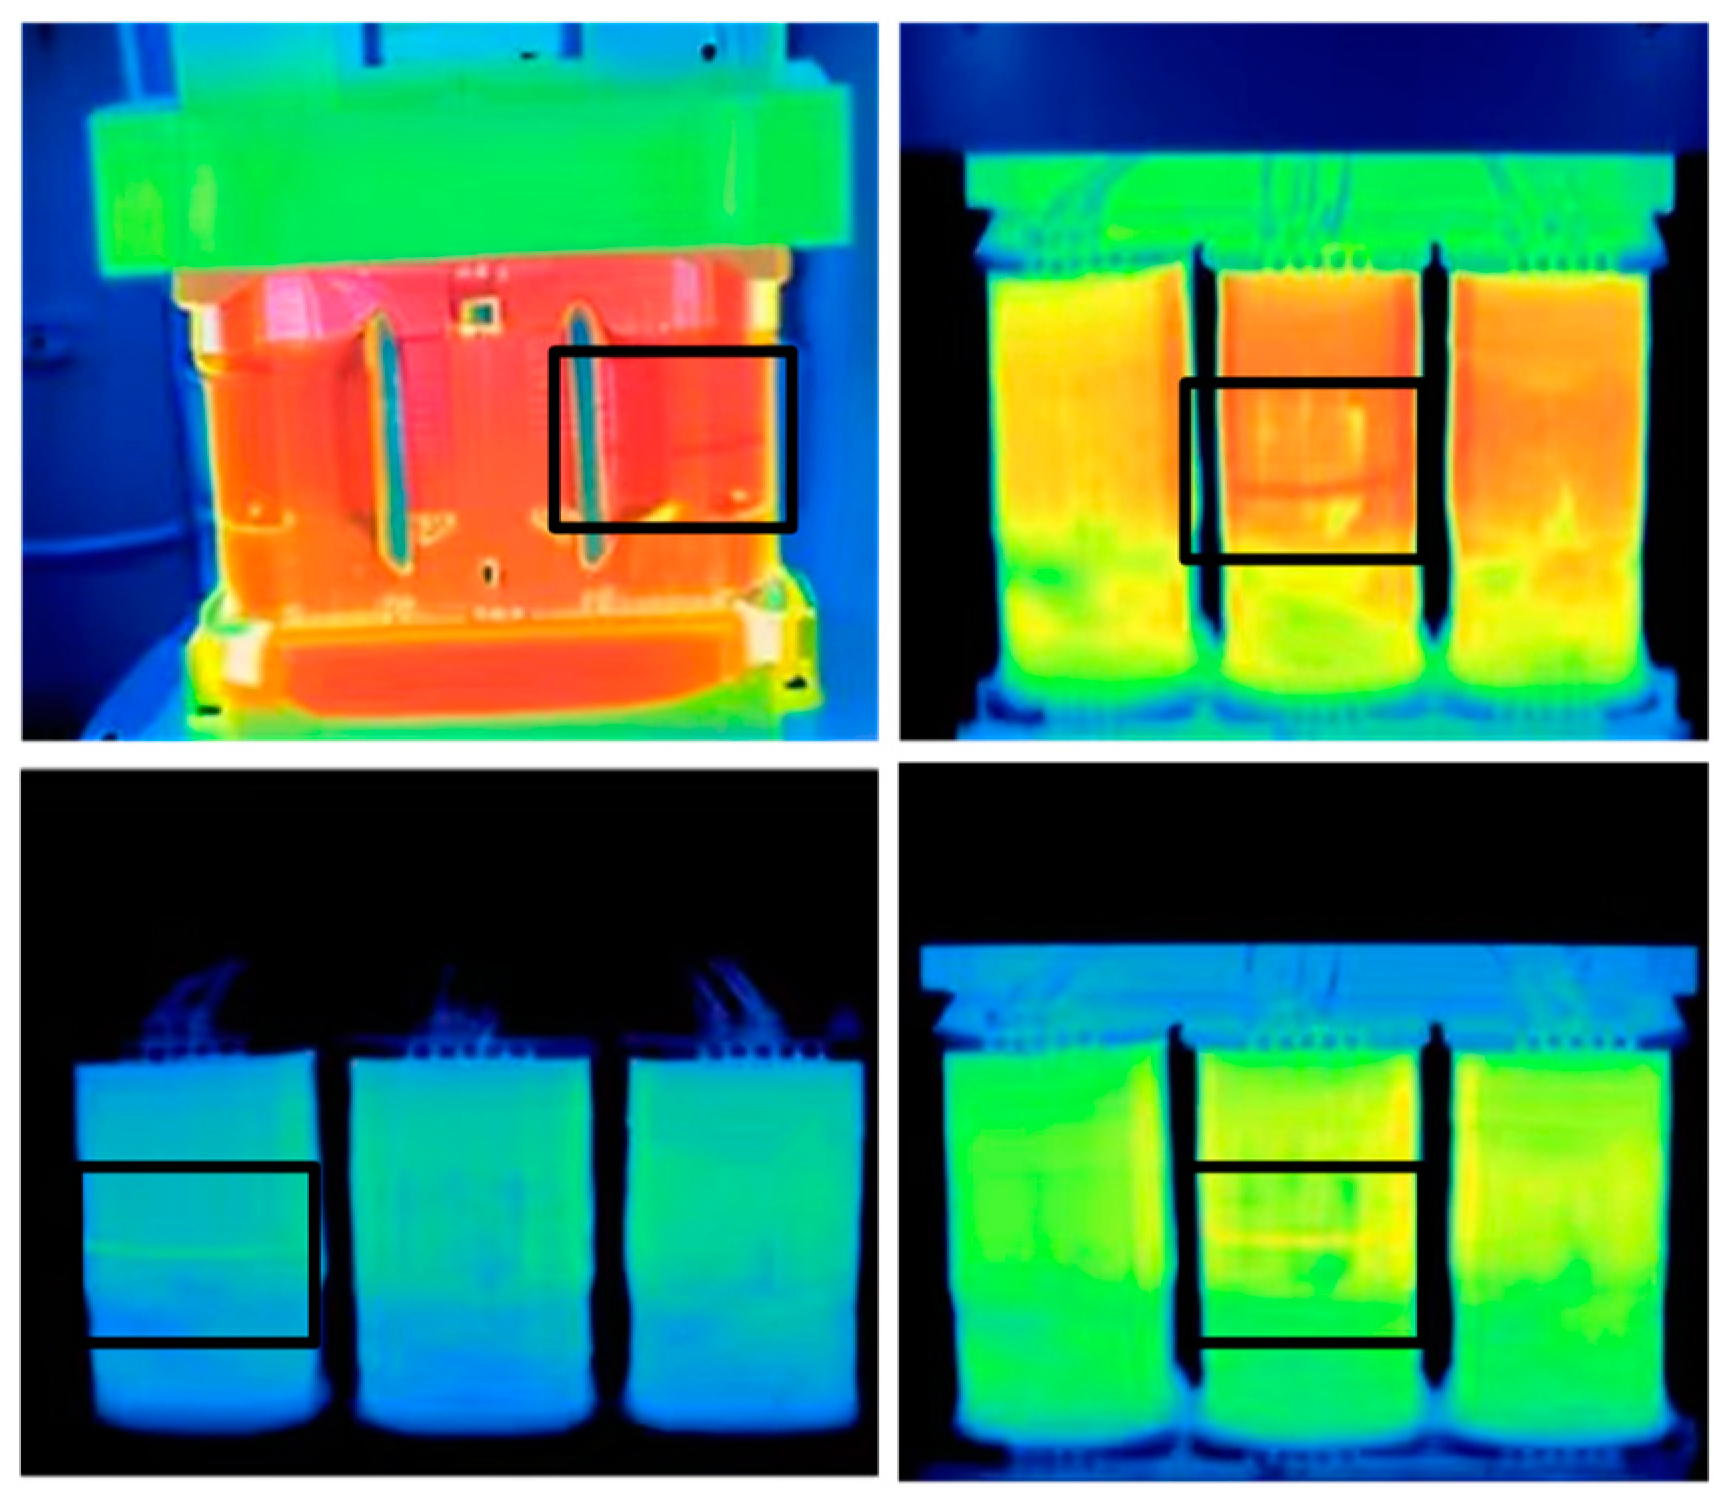
2.1. Data Collection and Dataset Production

In this study, we utilized a TOPRIE H2 infrared camera (Toprie, Shenzhen, China) with a 6.8 mm lens, featuring a multi-palette function to enhance image color richness. We conducted frontal horizontal imaging of the inter-turn short circuit faults in dry-type transformers. The samples were taken from a 10 kV dry-type transformer. Infrared image data were collected using the TOPRIE H2 infrared camera under controlled environmental conditions to ensure data consistency. The data acquisition was performed at a stable ambient temperature of 25 °C, with relative humidity maintained at approximately 50%. The distance between the camera and the dry-type transformer was consistently set at 1.5 m to maintain uniform image resolution and quality. Additionally, to further ensure consistency in data acquisition, all images were captured under similar lighting conditions with minimal external infrared interference. Due to the sufficient dielectric strength of the epoxy resin, the windings do not burn immediately after a short circuit, resulting in a clear infrared signature of high temperature around the transformer coils. We captured 1215 infrared images of the fault track, of which 142 were discarded due to fuzziness, leaving 1073 usable images. A portion of these images, showing the fault tracks, is displayed in Figure 1.
As shown in Figure 1, the black frame line indicates the infrared fault track. Using LabelImg, we processed the labeled regions by defining the transformer windings and fault tracks as labels 0 and 1, respectively. These labels were stored in YOLO format, ensuring a one-to-one correspondence between images and labels, which serves as the foundation for creating the COCO dataset. To enhance the quality and consistency of the input data, image normalization was initially applied to scale the pixel values to the standard range of [0, 1]. This preprocessing step ensures more stable and efficient model training by standardizing the input data. Due to the limited number of data samples for each type, there is a risk of overfitting during training. To address this, we employed the widely used Mosaic data augmentation algorithm. This technique enhances the dataset by segmenting images, applying pixelation, and restructuring them [15,16]. The augmented data not only increases the diversity of the training dataset but also improves the model’s robustness and generalization ability. The number of augmented data samples and their corresponding label names are detailed in Table 1.
As shown in Table 1, the number of images in each category is large and balanced, fulfilling the basic requirements for an image recognition dataset. Consequently, the dataset is prepared for use in generating the model through subsequent network calls [17]. In this study, the COCO dataset format is employed to randomly split the data into training, testing, and validation sets with a ratio of 8:1:1, ensuring a balanced representation of both types of identification image data.

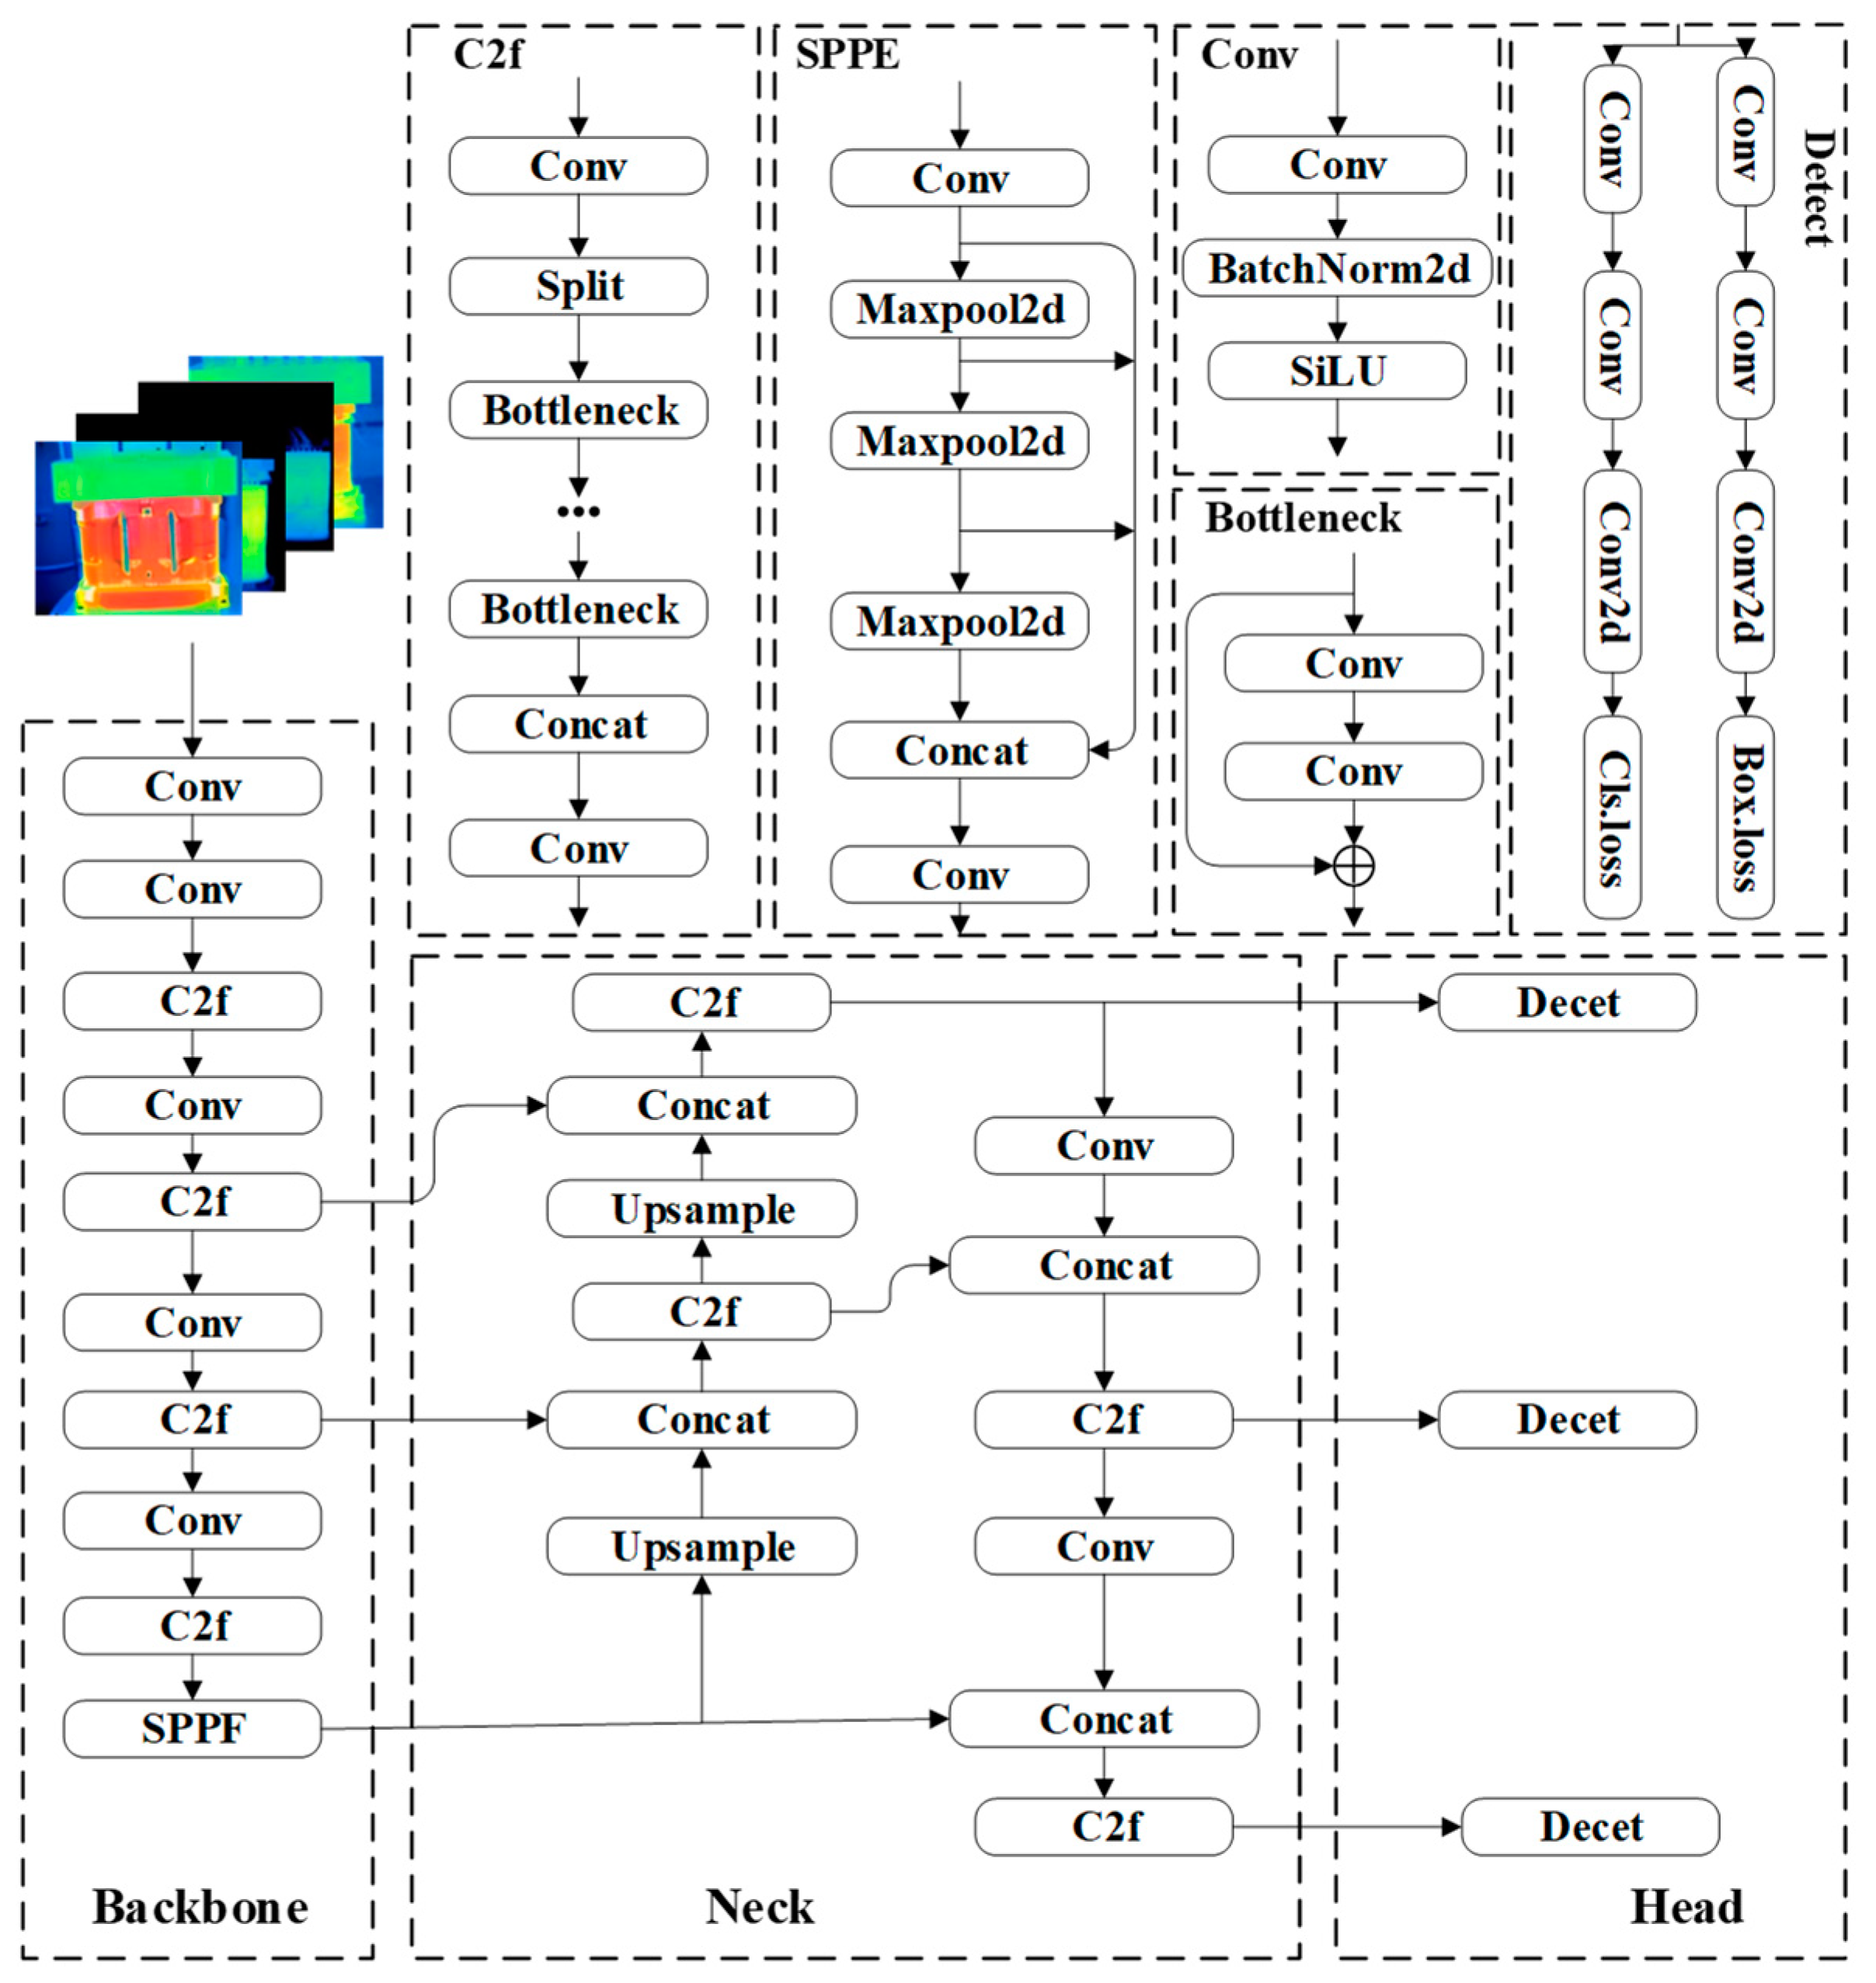
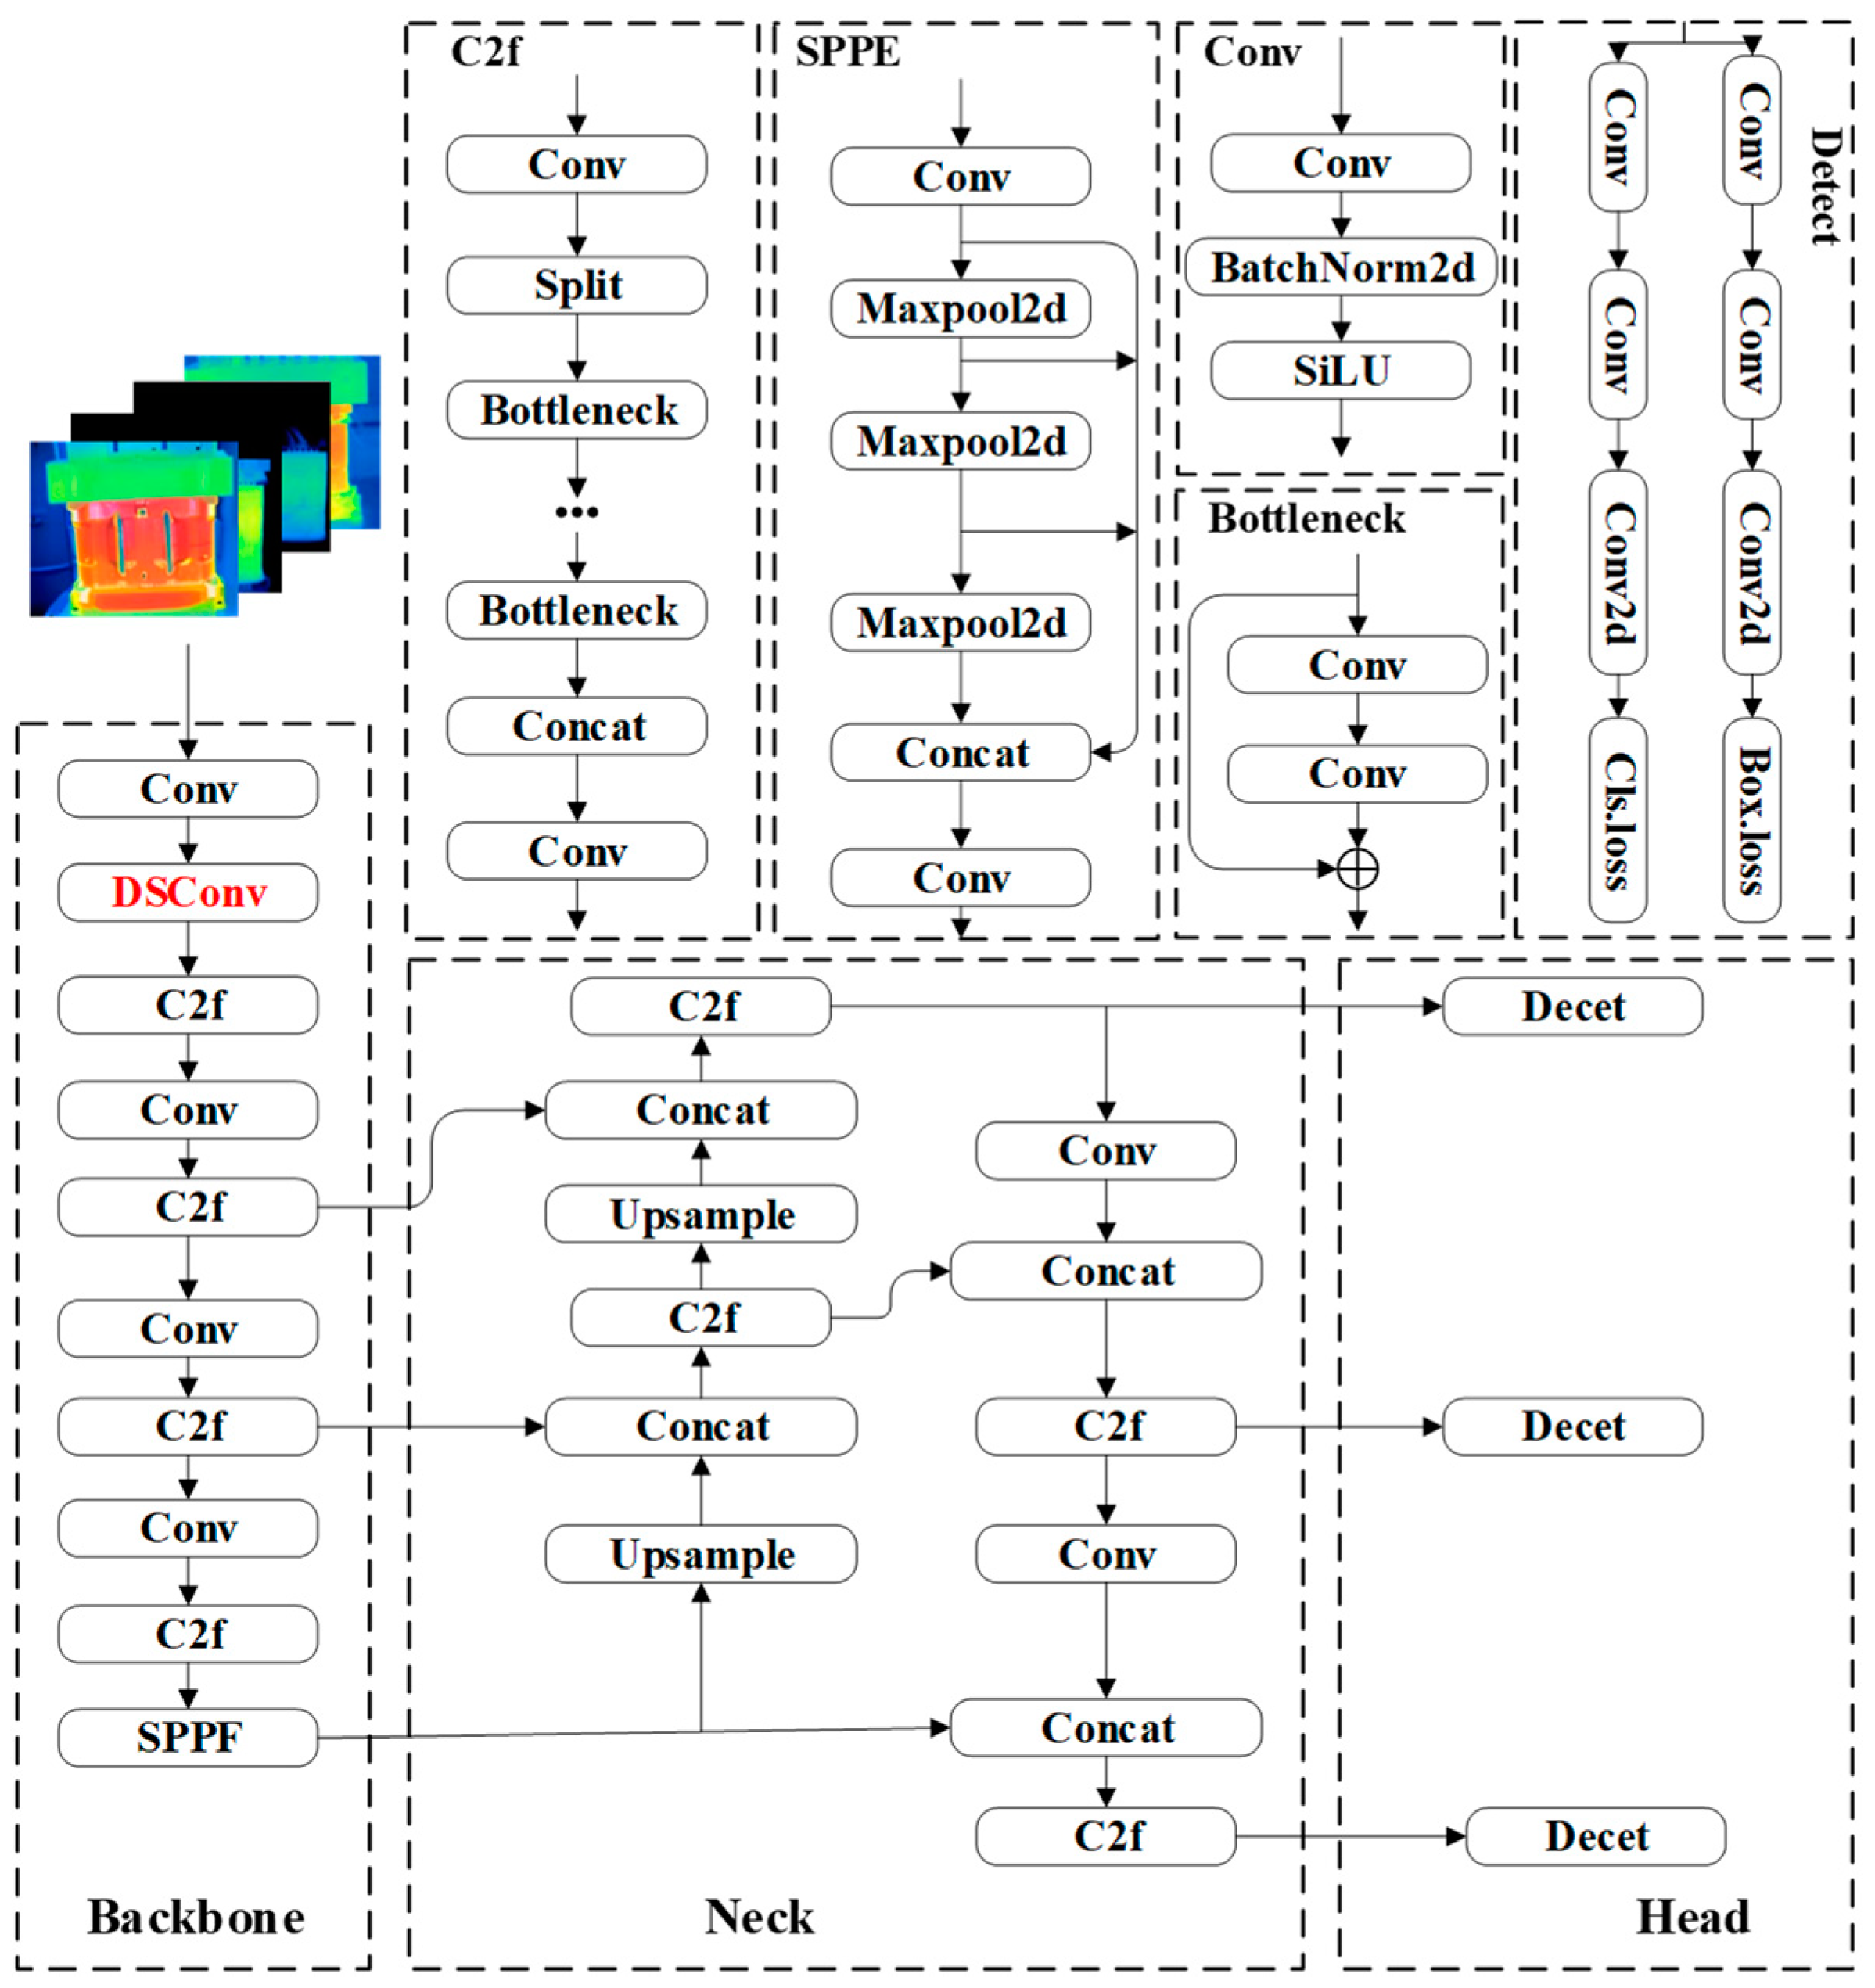
2.2. Network Structure of YOLOv8

YOLOv8 is the newer State-of-The-Art (SOTA) single-stage object detection algorithm that integrates and optimizes the core principles of the YOLO family. Innovations in YOLOv8’s backbone network, detection head, and loss function have led to significant improvements in detection accuracy compared to its predecessors YOLOv5, YOLOv6, and YOLOv7 [18,19].
For target identification, the Binary Cross-Entropy (BCE) loss function is employed, while the Distribution Focal Loss (DFL) and Complete Intersection over Union (CIoU) loss functions are used for bounding box regression, as shown in Equations (1)–(5).
L B C E ( y , y ) = 1 n i = 1 n [ y i log ( y i ) + ( 1 y i ) log ( 1 y i ) ]
L D F ( S i , S i + 1 ) = ( ( x i + 1 x ) log ( S i ) + ( x x i ) log ( S i + 1 ) )
L C I o U = 1 I o U + ρ 2 ( c , c g t ) d 2 + α ν
α = ν 1 I o U + ν
ν = 4 π 2 ( c a r c t a n w g t h g t a r c t a n w h ) 2
here, n denotes the number of samples, i represents the actual category of the samples, and yi′ indicates the predicted probability for the i-th sample. xi and xi+1 are the two labels closest to the true label x, while S denotes the softmax function. c represents the predicted frame, cgt denotes the true frame, ρ2 (c, cgt) is the Euclidean distance between the centroids of the predicted and true frames, and d is the diagonal distance of the smallest closed bounding box that contains both the predicted and true bounding boxes. α is the equilibrium parameter, and v measures the consistency of the aspect ratio.
YOLOv8 offers a unified model training framework that significantly enhances the algorithm’s scalability. To accommodate various scene requirements, YOLOv8 provides five model versions: YOLOv8n, YOLOv8s, YOLOv8m, YOLOv8l, and YOLOv8x. These models are based on YOLOv8n, with increased depth and width. Among them, the YOLOv8n model is the smallest, featuring the fastest detection speed, while the YOLOv8x model is the largest, offering the highest detection accuracy but the slowest speed [20]. For practical real-time defect recognition, this study selected the YOLOv8n model, which will be referred to simply as YOLOv8 for brevity and space efficiency.
The YOLOv8 model architecture consists of an input network, a backbone network, a neck network, and an output network. The input network processes the image to a uniform resolution. The backbone network, utilizing a convolutional neural network, extracts features. YOLOv8 employs the C2f structure instead of the C3 structure to improve gradient flow and optimize channel numbers for better multi-scale fitting. The neck network uses the PAN-FPN architecture to retain information across various feature levels, with an added attention module to enhance global and local feature correlation, thus improving information fusion and propagation [21]. The output network generates the location and classification features of the target through classification and regression. The complete YOLOv8 algorithm model is illustrated in Figure 2.
Due to the challenges posed by detecting small targets and complex background colors, which can interfere with fault trajectory recognition, the original YOLOv8 network may struggle with accurate identification or may misdetect such situations. Therefore, it is necessary to enhance the original YOLOv8 network by integrating the dynamic serpentine convolution and slicing-aided hyper-inference algorithm to improve its ability to accurately identify small targets and address discrepancies.

2.3. Improvement of YOLOv8 Algorithm

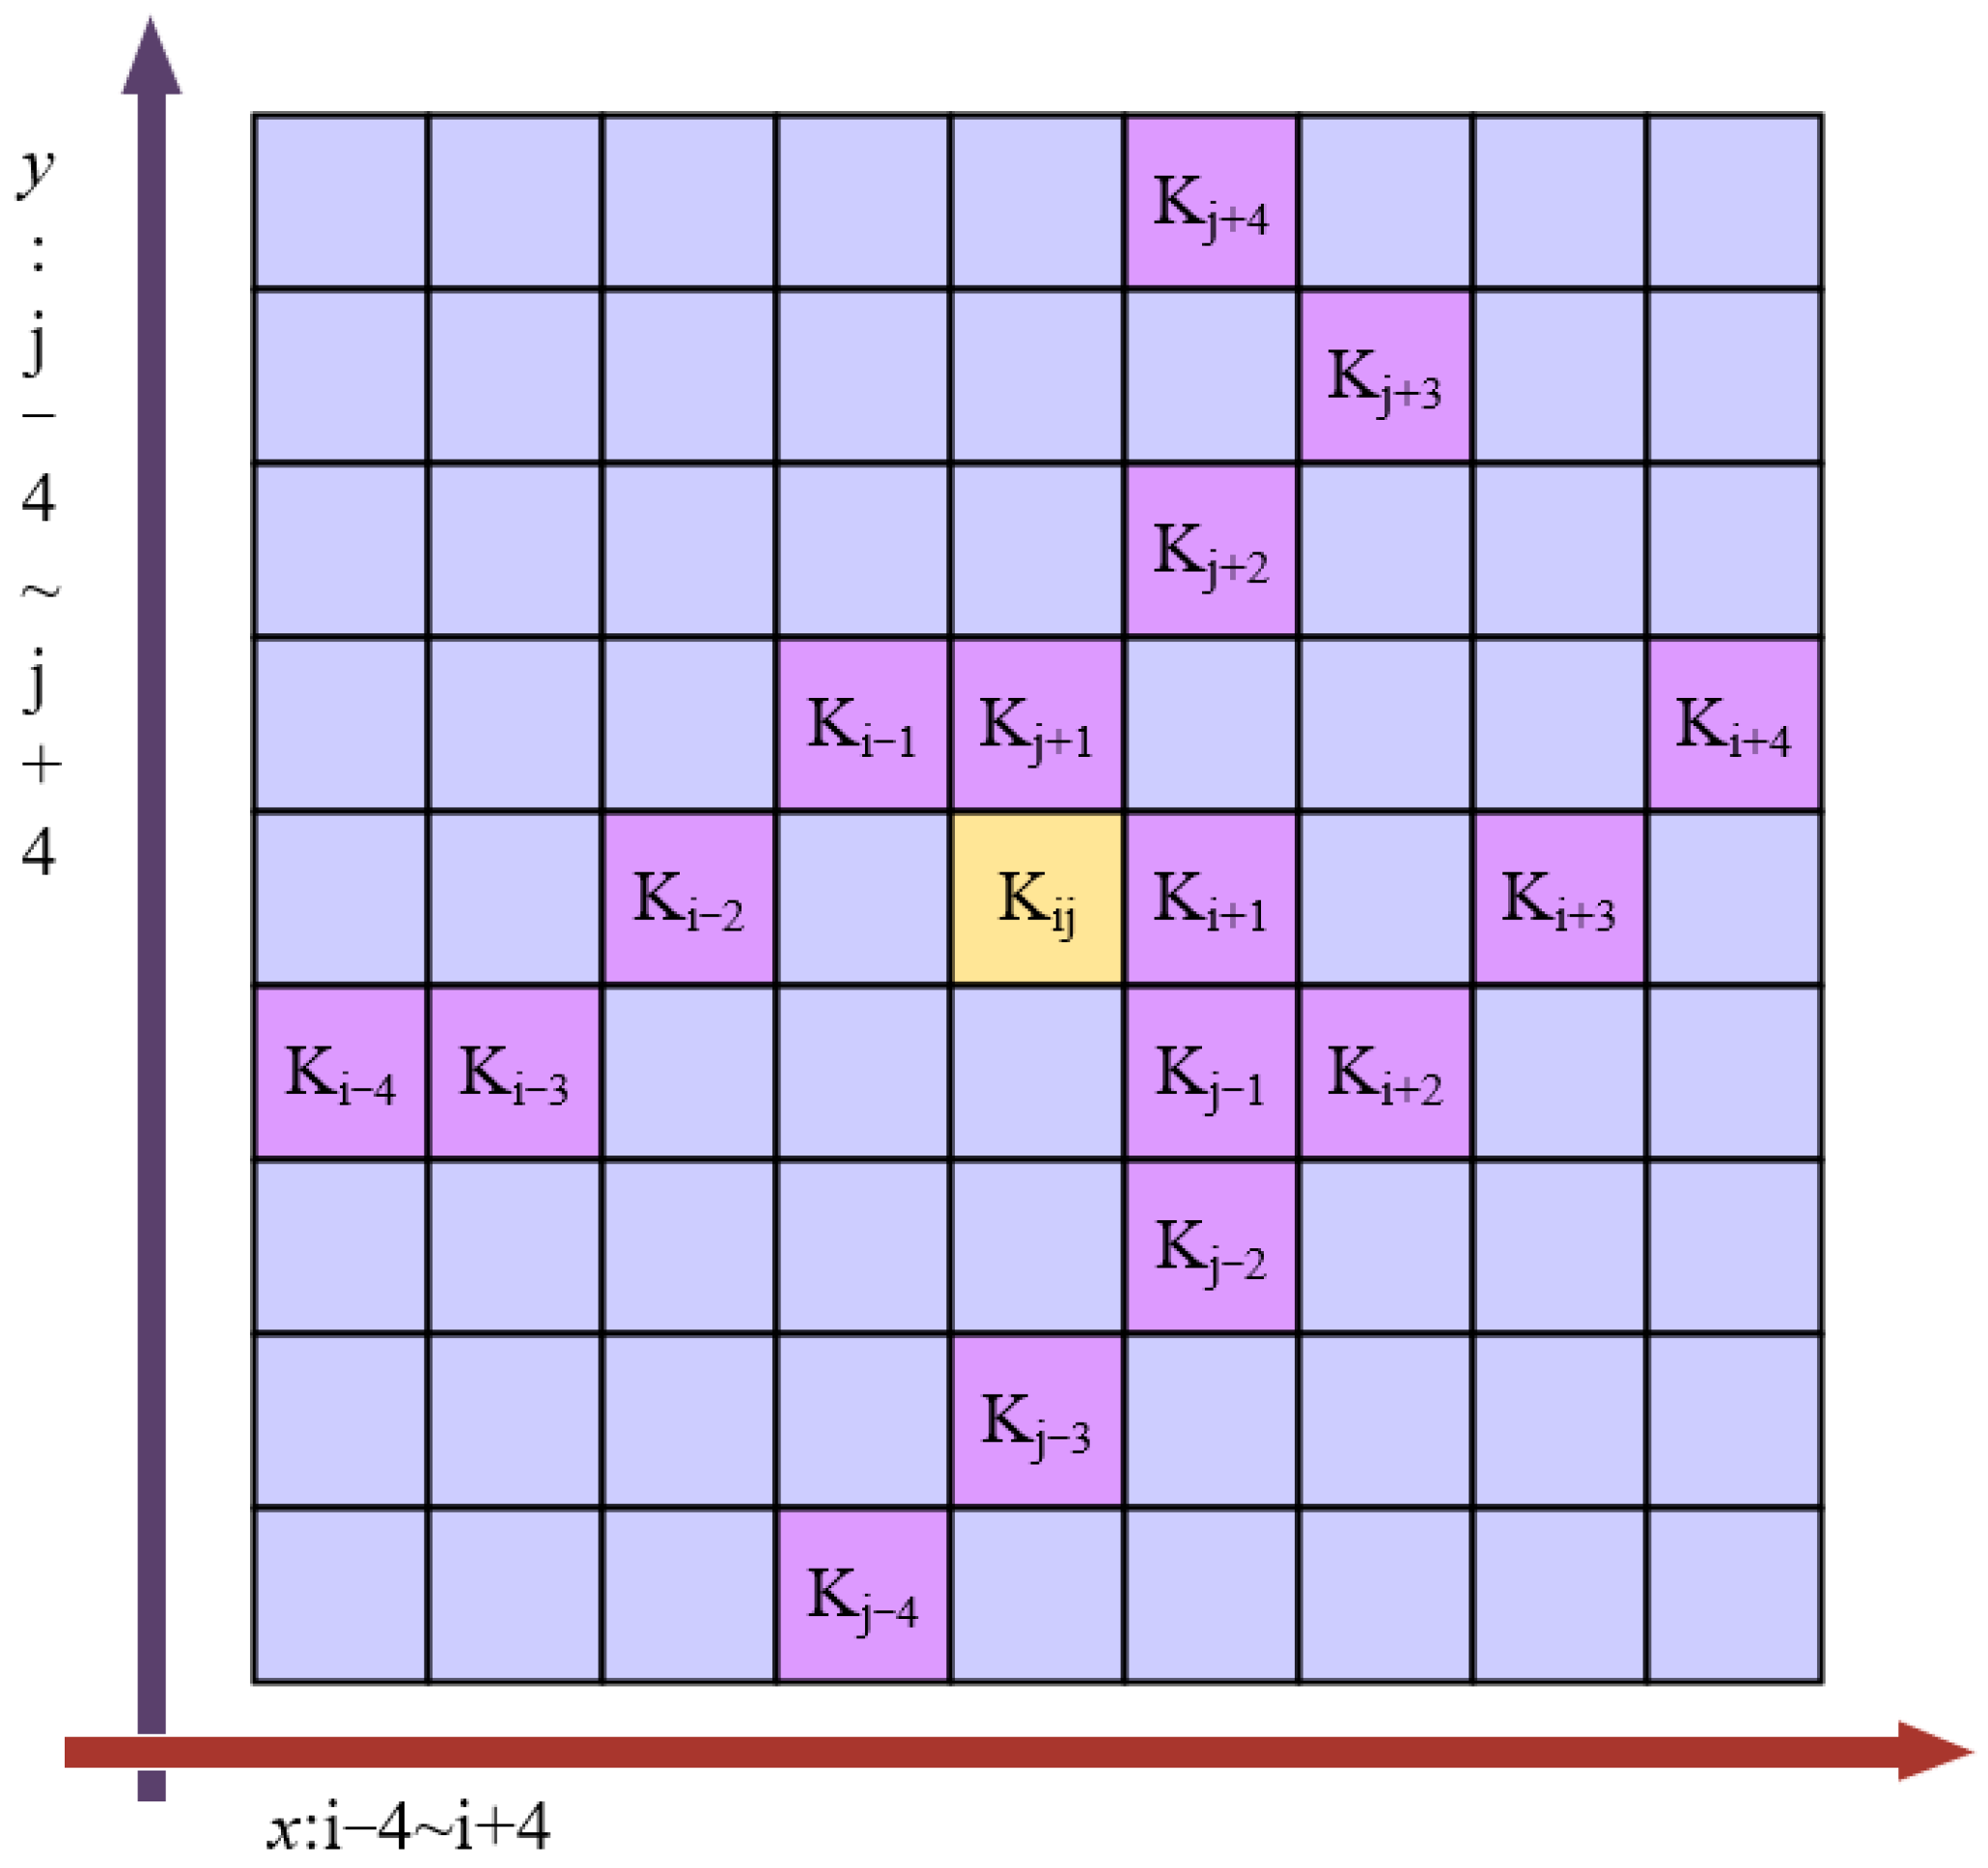
2.3.1. Dynamic Snake Convolution

Dynamic Snake Convolution (DSConv) is a convolutional neural network structure designed for image processing and computer vision tasks. By introducing serpentine paths, it enhances the receptive field of the convolution operation, resulting in more accurate and faster inline pattern recognition, as well as improved expressive power and model performance [22]. The original YOLOv8 network encounters difficulties in detecting small targets, particularly when fault trajectories display dispersed or ring-shaped patterns, which are typical in inter-turn short circuit faults in dry-type transformers. Such patterns are challenging for standard convolutional operations to detect due to their fixed receptive fields. The proposed enhancement, utilizing DSConv, overcomes these limitations by enabling the model to adjust its receptive field dynamically. This adaptation improves the network’s ability to accurately identify and distinguish small, intricate fault trajectories amidst varied and noisy backgrounds.
The core idea behind introducing DSConv in this study is to replace the fixed receptive field of traditional convolution operations with a variable receptive field that focuses on the fundamental structural features of the fault trajectory in infrared images. Unlike traditional convolution, which uses a constant kernel size at each position, DSConv adapts the receptive field dynamically based on the content of the input image by incorporating a serpentine path. Specifically, DSConv adjusts the centroid of the convolution kernel at each position using a learnable offset, allowing the receptive field to be adaptively modified. This approach enables DSConv to capture both local and global information in the image more effectively.
Specifically, for extracting fault trajectories in infrared images, DSConv utilizes local features in the convolution kernel of the basic structural features. For a standard two-dimensional convolution with coordinates K, where the center coordinates are Ki = (xi, yi) with i being an integer and an expansion rate of 1, the 3 × 3 convolution kernel is represented as shown in Equation (6).
K = { ( x 1 , y 1 ) , ( x , y 1 ) , , ( x + 1 , y + 1 ) }
To enhance the convolutional kernel’s adaptability to small targets in fault trajectories amidst complex backgrounds, a deformation offset a is introduced. However, if the model learns this deformation offset randomly, the sensed region may misalign with the target, particularly in complex feature structures. To address this, this study employs an iterative strategy, as illustrated in Figure 3. This strategy sequentially aligns each target with an observable location, ensuring consistent feature attention and preventing the perceptual region from being excessively distorted due to boundary deformation offsets.
In DSConv, the standard convolution kernel is stretched on the x-axis and y-axis. Using a convolution kernel of size 9, for the x-axis, each particular position Ki ± c is computed as (xi ± c, yi ± c), where c = {0, 1, 2, 3, 4} denotes the horizontal distance to the center grid. The selection of the base ± for each grid position in the convolution kernel K is a cumulative process. Starting from the center position Ki, each subsequent position Ki + 1 depends on the previous grid position and adds an offset ∆ = {δ|δ ∈ [–1, 1]}. This cumulative offset ∑ ensures that the convolution kernel agrees with the morphological structure of the scratched, cracked, and broken gesture features in the x-axis direction.
K i ± c = ( x i + c , y i + c ) = x i + c , y i + Σ i i + c Δ y ( x i c , y i c ) = x i c , y i + Σ i c i Δ y
Equation (7) is modified in the y-axis direction as follows:
K j ± c = x j + c , y j + c = x j + Σ j j + c Δ x , y j + c x j c , y j c = x j + Σ j c j Δ x , y j c
Since the offset ∆ is typically a decimal, bilinear interpolation is applied as follows:
K = Σ K B ( K , K ) K
Here, K represents the fractional position in Equations (7) and (8), while K′ enumerates all integral space positions. B is a bilinear interpolation kernel, which can be decomposed into two one-dimensional kernels as shown in Equation (10).
B ( K , K ) = b ( K x , K x ) b ( K y , K y )
As shown in Figure 4, DSConv accommodates a 9 × 9 range during deformation due to variations in the two-dimensional (x-axis, y-axis) space, thereby extending the model’s receptive field. This dynamic adaptation is particularly effective for capturing the morphological aspects of the four types of epoxy resin enclosure defects in dry-type transformers, enhancing the detection of key features, and providing a foundation for small target identification.

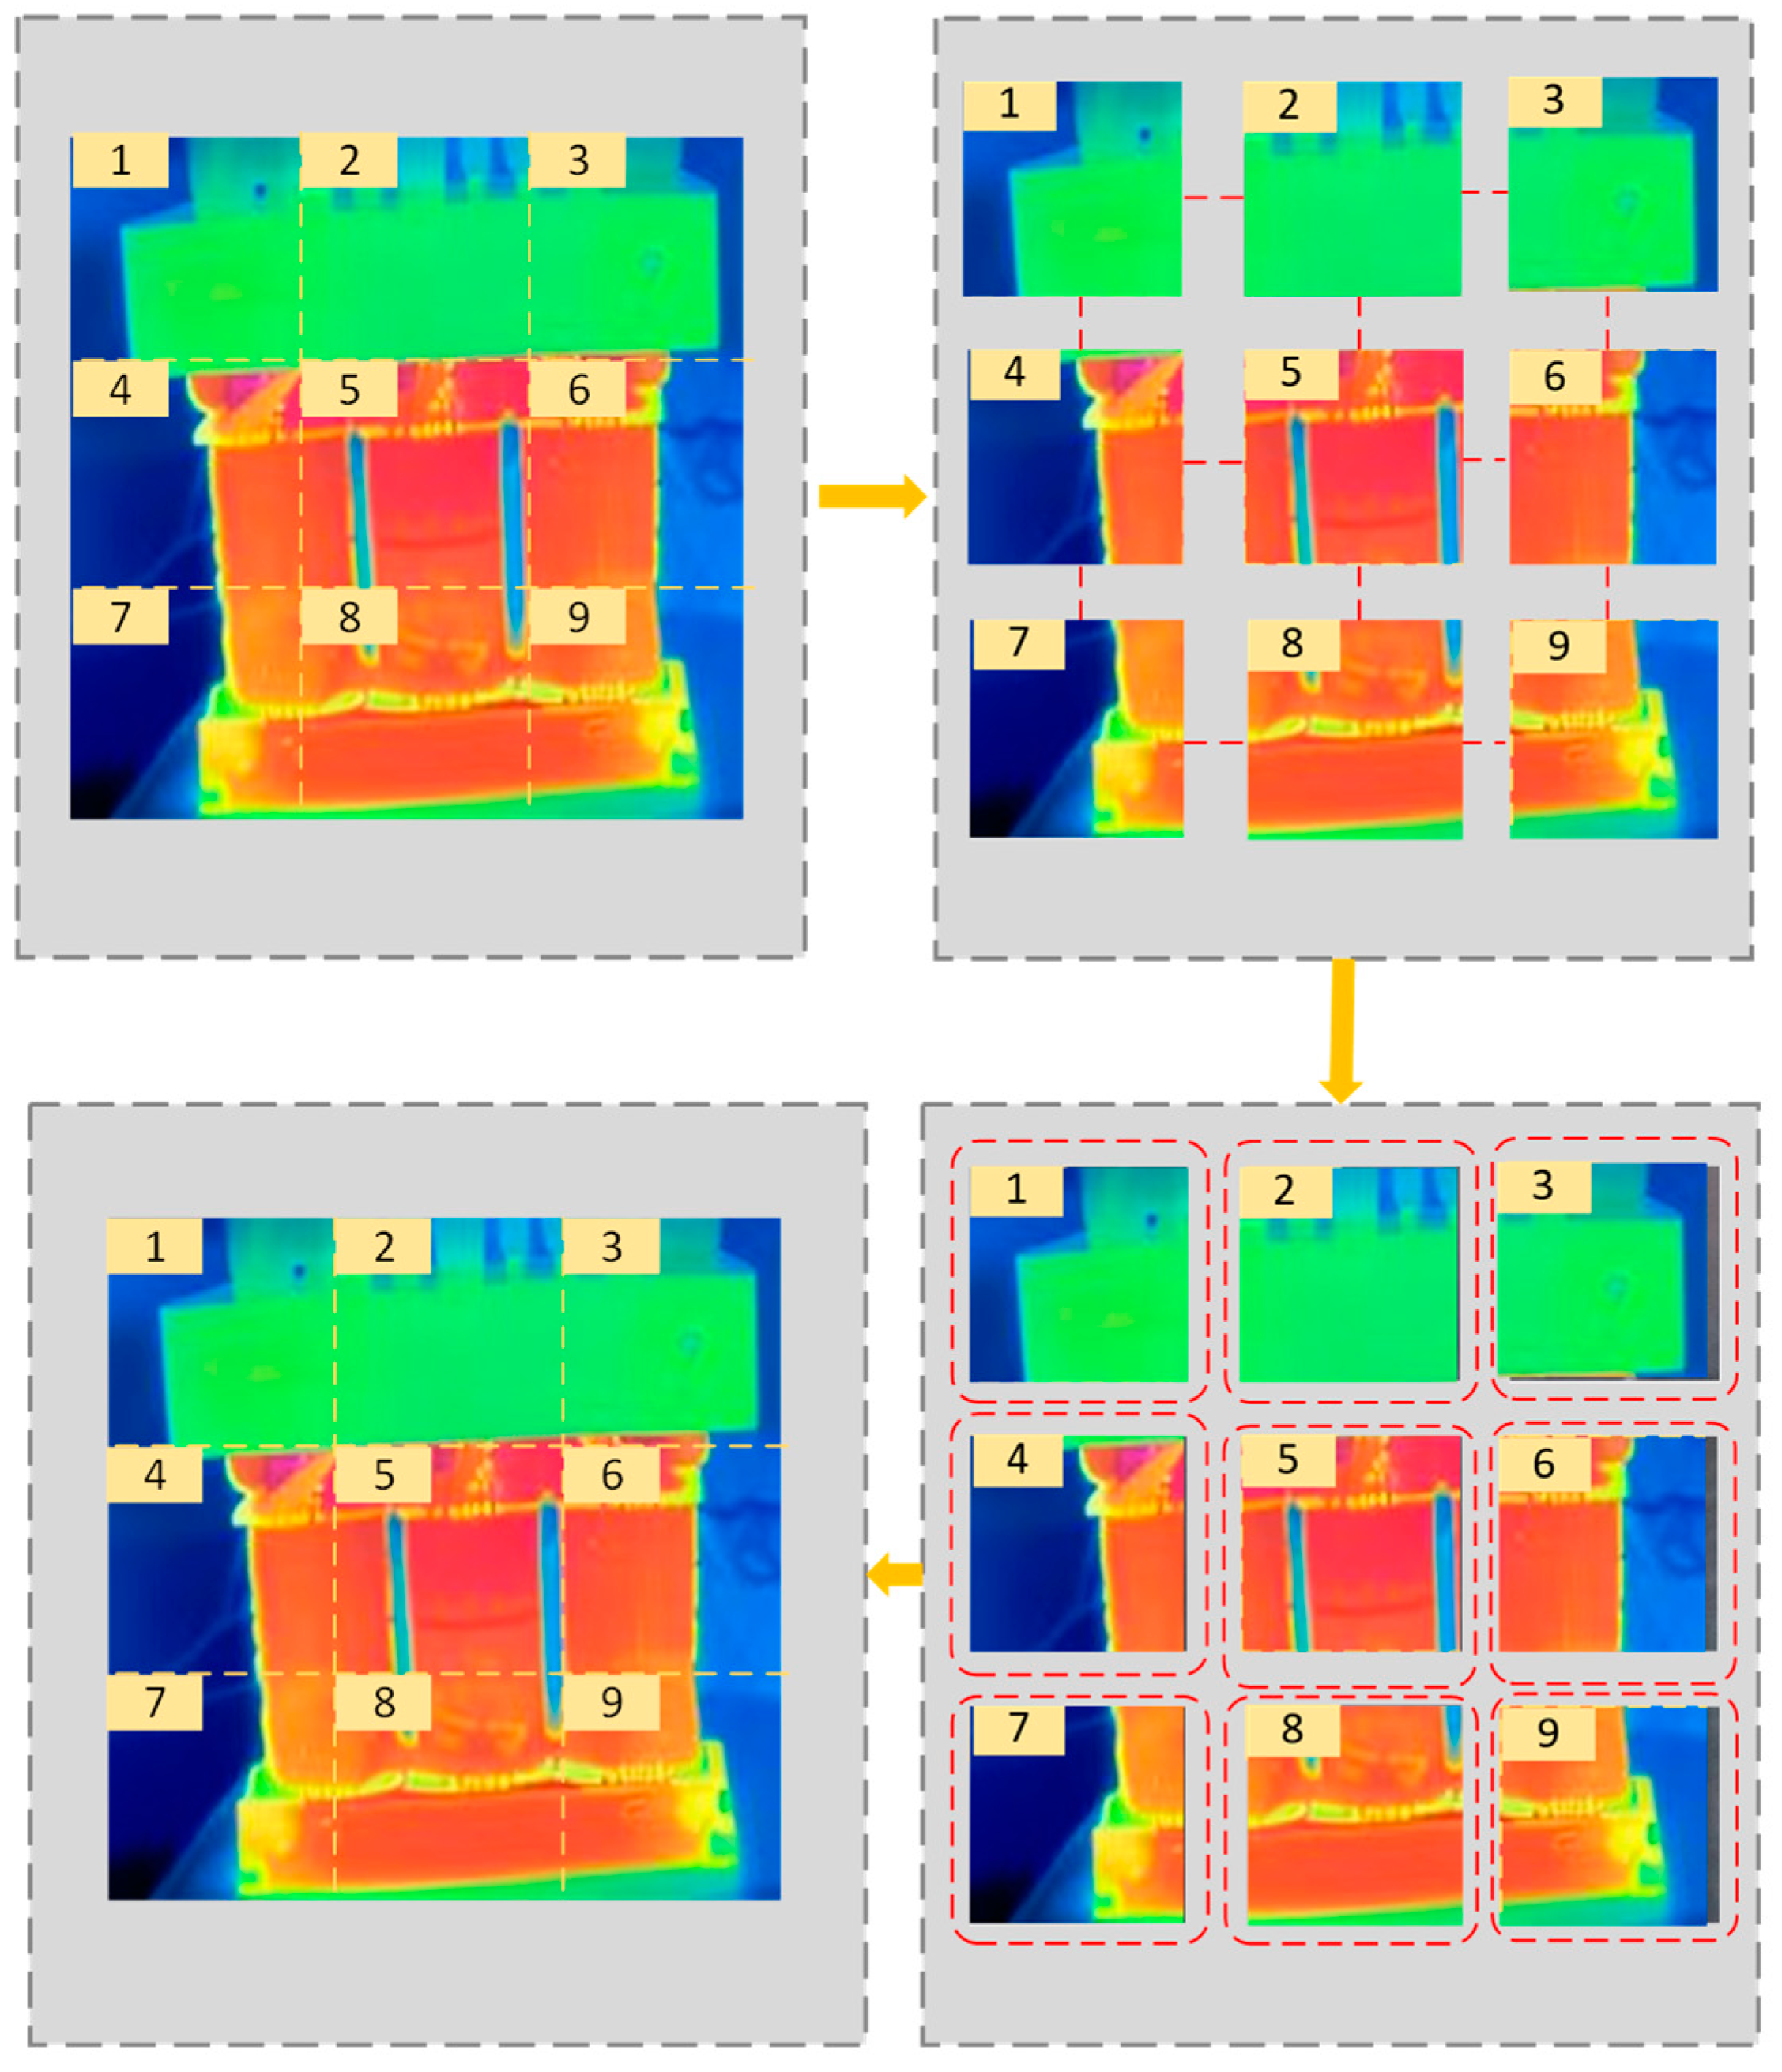
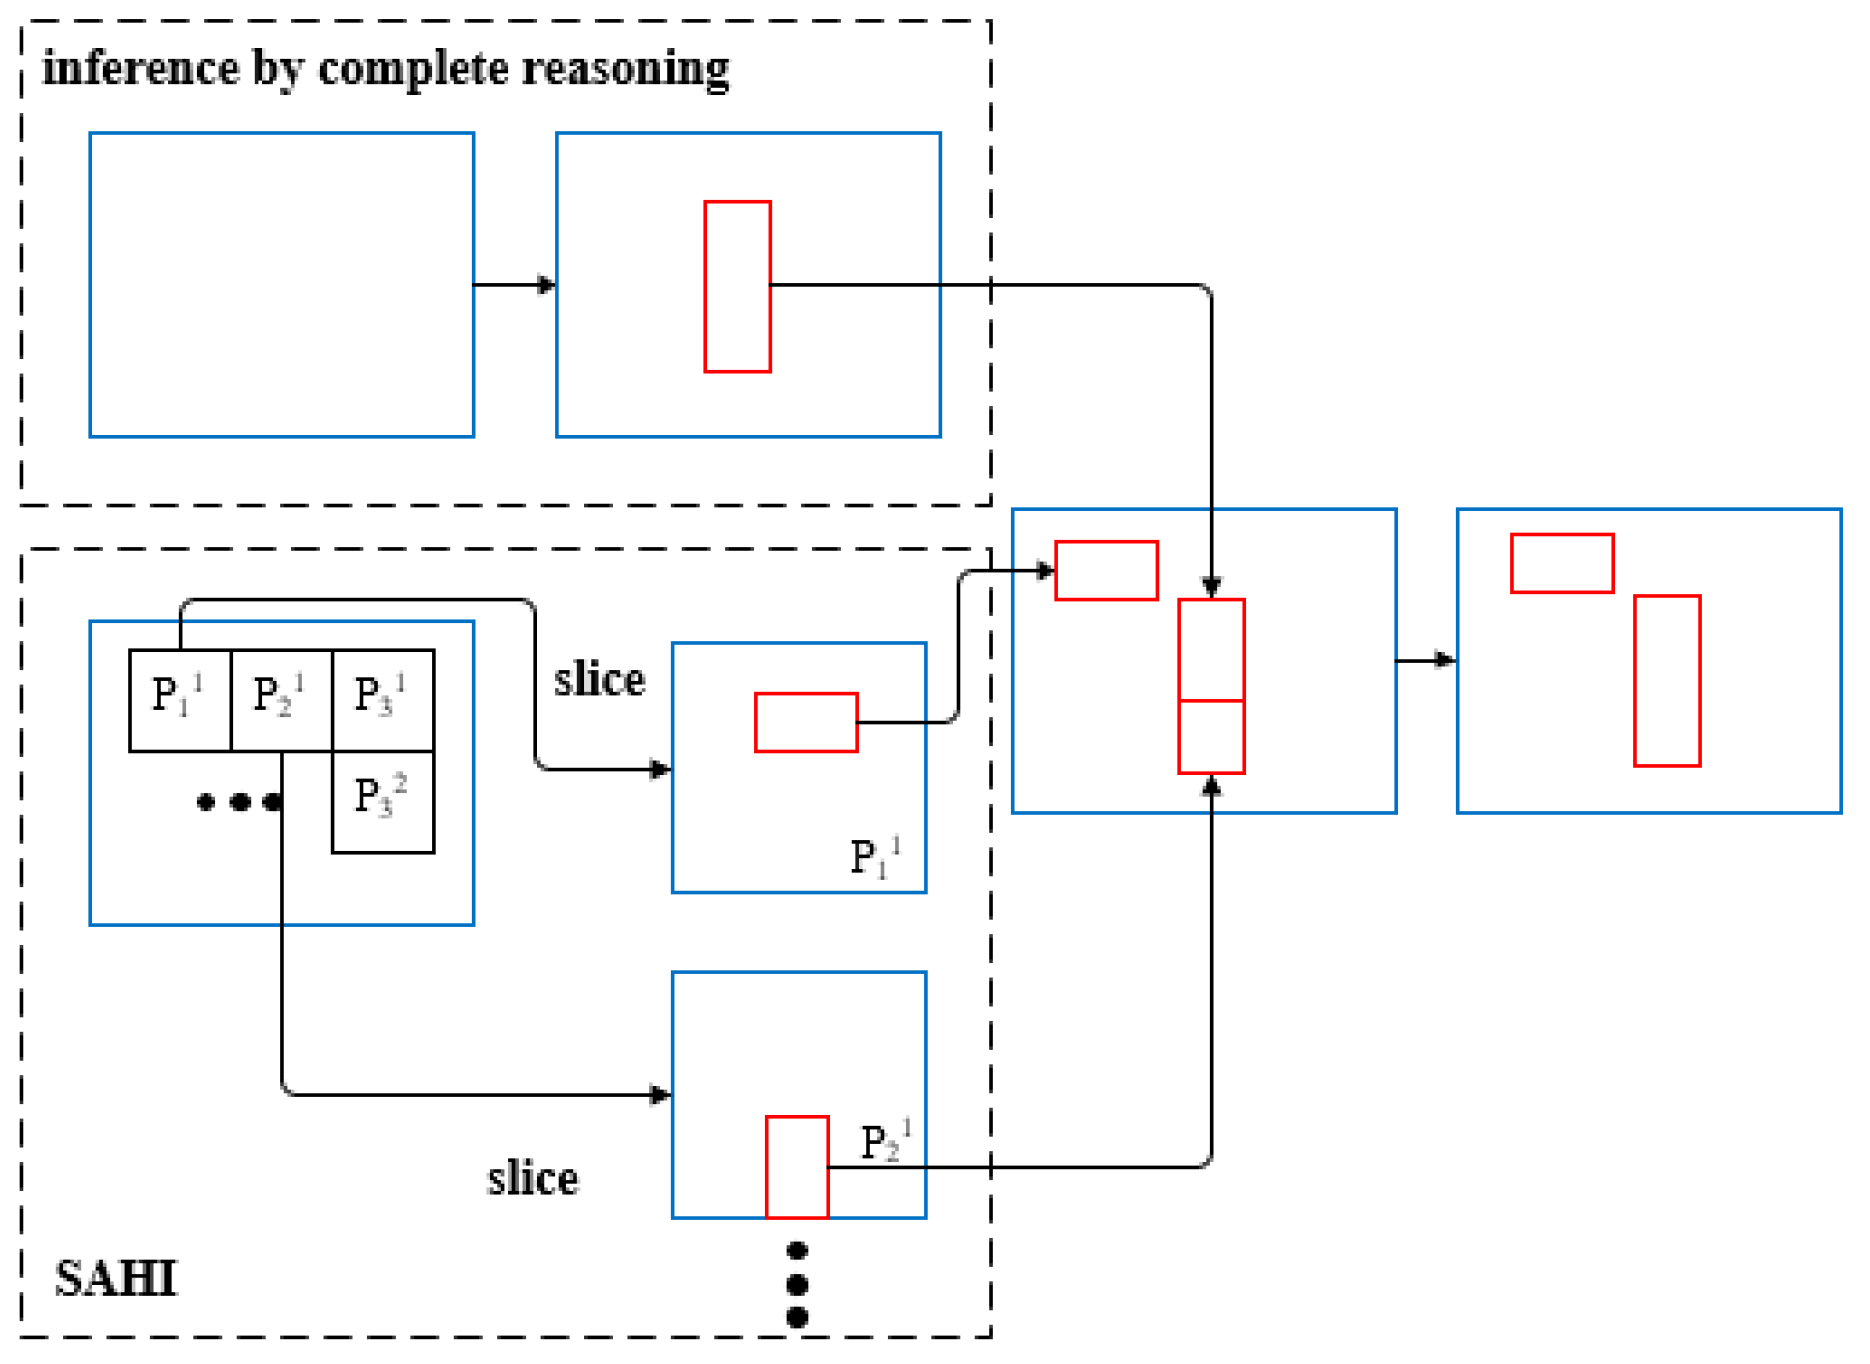
2.3.2. Slicing-Aided Hyper-Inference Algorithm

In the defect recognition process for the epoxy resin enclosure of dry-type transformers, achieving accurate recognition of small targets and complex morphologies is challenging with YOLOv8 network improvements alone. Therefore, this study further integrates the SAHI algorithm with the enhanced YOLOv8 network incorporating dynamic snake convolution, aiming to significantly improve the visual recognition model’s ability to detect small targets and complex morphological features.
Compared to direct recognition with the YOLOv8 network, the SAHI algorithm processes the input image or video by dividing it into multiple slices (the number of slices is configurable), with each subgraph containing a segment of nodes and corresponding constraints. The purpose of slicing is to break the input graph into the smallest possible subgraphs, thereby reducing computation during inference on each subgraph. Target detection is performed separately on each slice, and results are aggregated based on positional information between slices. After processing, the slices are reassembled, and the inference results from each subgraph are merged to produce the recognition results for the entire graph, validated by checking the consistency of the picture order between subgraphs [23]. For overlapping detection frames, the algorithm intelligently merges results during the splicing process to maintain recognition accuracy. Additionally, the model, after incorporating the SAHI algorithm, achieves memory optimization through image decomposition, reducing hardware requirements. The slicing operation flow is illustrated in Figure 5.

2.3.3. Improved YOLOv8 Slicing-Aided Hyper-Inference Algorithm

Fault trajectories were defined as the visible paths of thermal anomalies that suggest potential inter-turn short circuit faults. The boundaries of these trajectories were meticulously delineated based on distinct changes in thermal intensity, ensuring that the annotations precisely captured the extent of the faults. The enhanced YOLOv8 network integrates the SAHI algorithm to create an improved YOLOv8 model optimized for detecting small targets and complex morphologies. In this article, the improved model, referred to as ‘DSConv-YOLOv8-SAHI’, integrates Dynamic Snake Convolution (DSConv) with Slicing-Aided Hyper-Inference (SAHI) to enhance the YOLOv8 architecture. This model is also described as the ‘Improved YOLOv8 infrared image slicing-aided hyper-inference algorithm’. In this revised model, the original Conv module is replaced with the DSConv module during training. The updated model structure is illustrated in Figure 6.
The SAHI hierarchical approach is employed in the recognition phase of the SAHI algorithm for the improved YOLOv8. As illustrated in Figure 7, the original query image is divided into overlapping patches of size M × N. Each patch is resized while preserving the aspect ratio, and an independent object detection forward pass is performed on each patch. Optionally, a full inference step can be conducted on the original image to detect larger objects. Finally, the predictions from the overlapping patches are merged back to the original image size using non-maximum suppression (NMS). During NMS, boxes with a high intersection ratio or those meeting a predefined matching threshold are considered matches. Results with detection probabilities below the threshold are discarded, ensuring that only the most reliable and non-overlapping detections are retained [24,25,26].

3. Model Generation and Evaluation

The COCO dataset is fed into the improved YOLOv8 model with the SAHI algorithm, as well as into the networks for comparison. All networks are evaluated using a unified platform that operates on Windows 10 and utilizes GPUs for model training. The batch size for each model is uniformly set to 128, and the number of training iterations is consistently set to 500. Specific hardware and software configuration details are provided in Table 2.
Both the improved model and the comparison models were implemented and iterated using the PyTorch framework (version 2.0.0). The selection of PyTorch facilitates the efficient management of complex network architectures and the dynamic computations required by the SAHI algorithm. The study employs a 3 × 3 slicing configuration, which strikes an optimal balance between recognition accuracy and computational load. While increasing the number of slices could enhance recognition by better-isolating fault trajectories, it would also significantly escalate processing time and computational demands. On the other hand, reducing the number of slices could decrease computational overhead but might compromise detection accuracy. By employing a 3 × 3 slicing configuration, the approach ensures that fault trajectories are adequately represented within each slice, thereby improving detection performance without incurring excessive computational costs.
Figure 8 shows the variation in individual loss functions for YOLOv8, Fast-RCNN, Retina-Net, and the improved YOLOv8 with the SAHI algorithm, plotted against the number of training iterations.
Figure 8 illustrates the trend in loss error (LOSS) during training for four models: YOLOv8, Fast-RCNN, Retina-Net, and the improved YOLOv8 with the slicing-assisted hyper-inference algorithm. The horizontal axis represents the number of iterations, while the vertical axis shows the loss error value. The results indicate that the loss error for all models decreases as the number of iterations increases. Specifically, YOLOv8 exhibits a faster decrease in loss error and eventually stabilizes at a lower level. In contrast, Fast-RCNN shows a slower reduction in loss error compared to YOLOv8 but also stabilizes at a lower value. Retina-Net follows a similar trend to Fast-RCNN but achieves a slightly higher stable loss value. The improved YOLOv8 with the SAHI algorithm demonstrates the most rapid decline in loss error and reaches a lower loss value earlier in the training process, indicating superior convergence performance. By 400 iterations, the LOSS values for YOLOv8, Fast-RCNN, Retina-Net, and the improved YOLOv8 with slicing-assisted hyper-inference algorithm stabilize at approximately 0.095, 0.029, 0.038, and 0.016, respectively. These results suggest that the improved YOLOv8 model has superior training efficiency and potential performance advantages compared to the other models.
Figure 8 shows that replacing the Conv (Convolution) layer in the original YOLOv8 network with DSConv, and applying the SAHI algorithm to segment the dataset and recognition images results in high training accuracy. The observed and estimated minimum target values approach 0. To evaluate model effectiveness, Figure 9 compares the accuracy of the four models on the test set.
Figure 9 illustrates that the improved YOLOv8 with the SAHI algorithm achieves the highest mean Average Precision (mAP) value of 97.06% during training, reflecting superior detection performance and stability. This value is the highest among all models and indicates a stable curve. The Retina-Net model follows, with an mAP value that stabilizes at 88.98%. Although the YOLOv8 model shows slower initial growth, it eventually reaches an mAP value of 91.32%, surpassing Retina-Net. The Fast-RCNN model, with a final mAP value of 83.55%, demonstrates the weakest performance among the four models, showing a noticeable gap compared to the improved YOLOv8 model, despite some improvement during training. In summary, the improved YOLOv8 with SAHI algorithm outperforms the other models in terms of accuracy and stability on the dataset used in this study.
After generating the models, YOLOv8, Fast-RCNN, Retina-Net, and the improved YOLOv8 with SAHI algorithm were exported and evaluated using the test set to assess their precision. This study uses Precision (P), Recall (R), and mean Average Precision (mAP) for model evaluation. Precision (P) represents the proportion of true positive samples among all positive predictions and is calculated as shown in Equation (11). Recall (R) indicates the proportion of true positive samples among all actual positives and is computed as shown in Equation (12). The mAP measures the average precision across all categories.
P = T P T P + F P
R = T P T P + F N
here, TP denotes the number of true positive detections, FP represents the number of false alarms, and FN refers to the number of missed detections. The experimental results after testing the models on the test set are presented in Table 3.
Table 3 shows that compared to the original YOLOv8, all three indicators have improved, with the average accuracy of recognition increasing by approximately 6 percentage points. This indicates that the improved YOLOv8 with SAHI algorithm significantly advances the detection of small targets and complex backgrounds in dry-type transformer inter-turn short circuit fault trajectories. In comparison to the Fast-RCNN and Retina-Net models, the improved YOLOv8 model demonstrates superior performance in detecting these fault trajectories. Figure 10 displays the recognition results for randomly selected images from the validation set, illustrating the performance of each model.
Figure 10 demonstrates that the improved YOLOv8 with the SAHI algorithm significantly outperforms YOLOv8, Fast-RCNN, and Retina-Net in recognizing small targets against complex backgrounds. The inclusion of dynamic snake convolution and the SAHI algorithm results in notable improvements in detection performance, especially when the fault trajectory is similar in color to the background. Specifically, the recognition accuracy increases by 2.5%, 4.5%, and 7.5% compared to YOLOv8, Fast-RCNN, and Retina-Net, respectively. This indicates that the improved YOLOv8 model offers enhanced efficiency and accuracy in detecting inter-turn short circuit fault trajectories in dry-type transformers.
While the proposed DSConv and SAHI algorithms improve the model’s capability to detect small and complex fault patterns, these enhancements can also increase computational complexity and resource consumption. In practical engineering applications, such as real-time monitoring in substations or industrial environments, it is essential to balance model accuracy with computational efficiency. The increased computational demand of the enhanced model is a trade-off for significantly improved detection accuracy and robustness in complex backgrounds. For deployment in resource-constrained environments, potential solutions could involve model optimization techniques such as quantization or pruning or utilizing edge computing to offload intensive computations. Further research is required to thoroughly evaluate these trade-offs and optimize the model for various operational conditions.

4. Conclusions

This paper introduces an enhanced YOLOv8 model, incorporating an infrared image slicing-aided hyper-inference algorithm, specifically designed for detecting inter-turn short circuit faults in dry-type transformers. Initially, defects in the epoxy resin shell of the dry-type transformer are sampled. The YOLOv8 network is then improved by integrating dynamic snake convolution (DSConv) and the slicing-aided hyper-inference (SAHI) algorithm. In this process, the original convolution layers in YOLOv8 are replaced with DSConv, and both the dataset and recognition images are processed using the SAHI algorithm, which involves slicing, recognition, and restructuring. The resulting model, DSConv-YOLOv8-SAHI, is tailored for fault trajectory detection in dry-type transformers based on the collected data. The model’s performance is validated through horizontal ablation studies comparing it with the original YOLOv8 and vertical network comparisons with Fast-RCNN. The principal findings of this study are as follows:
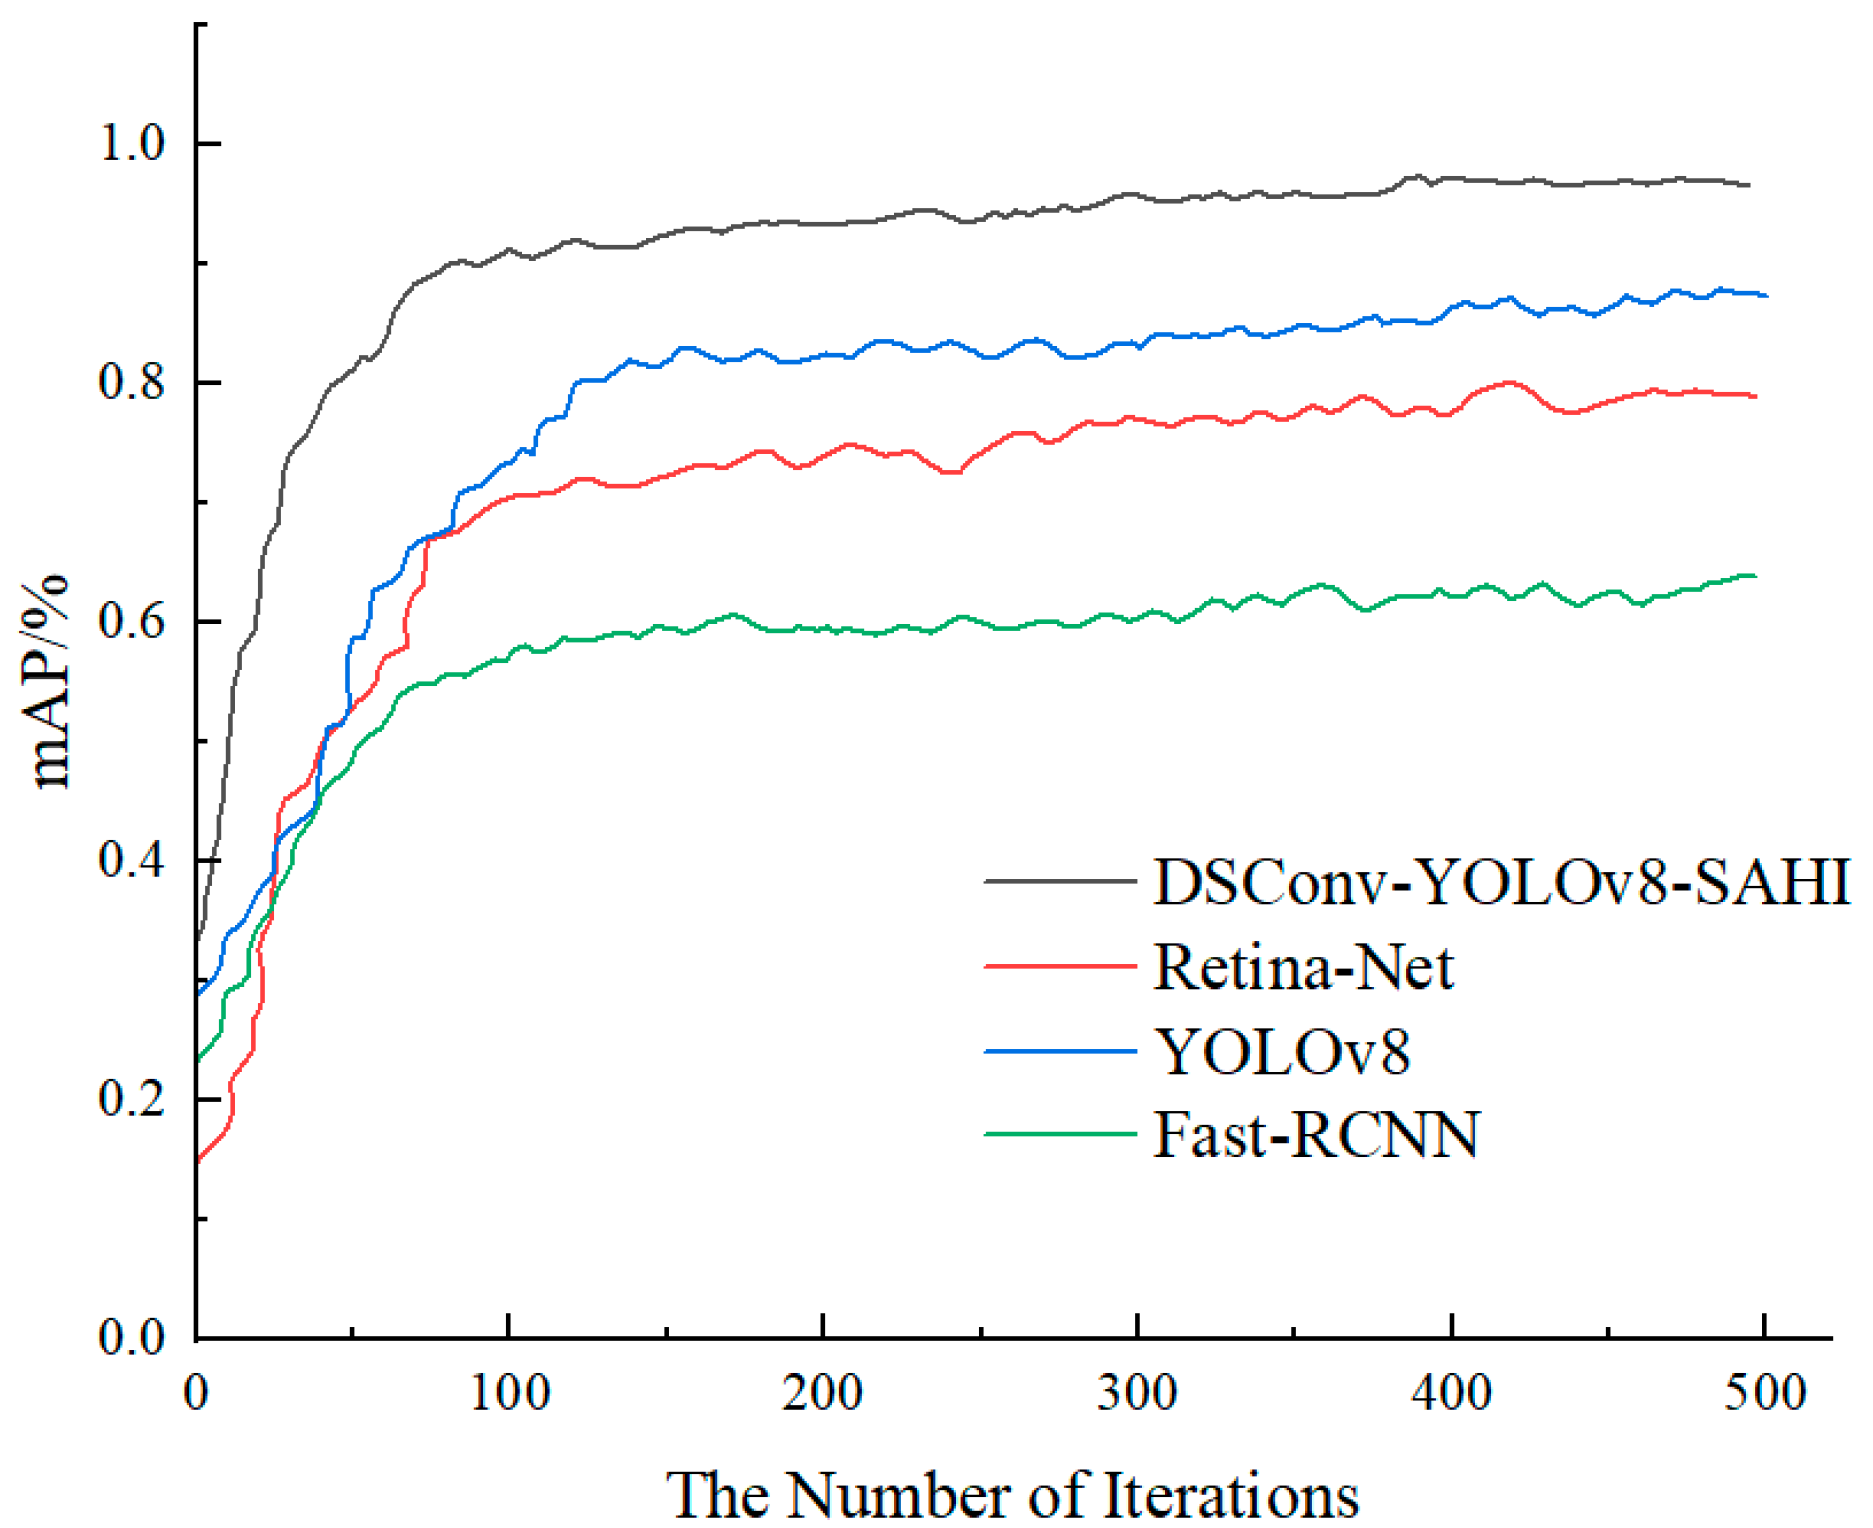
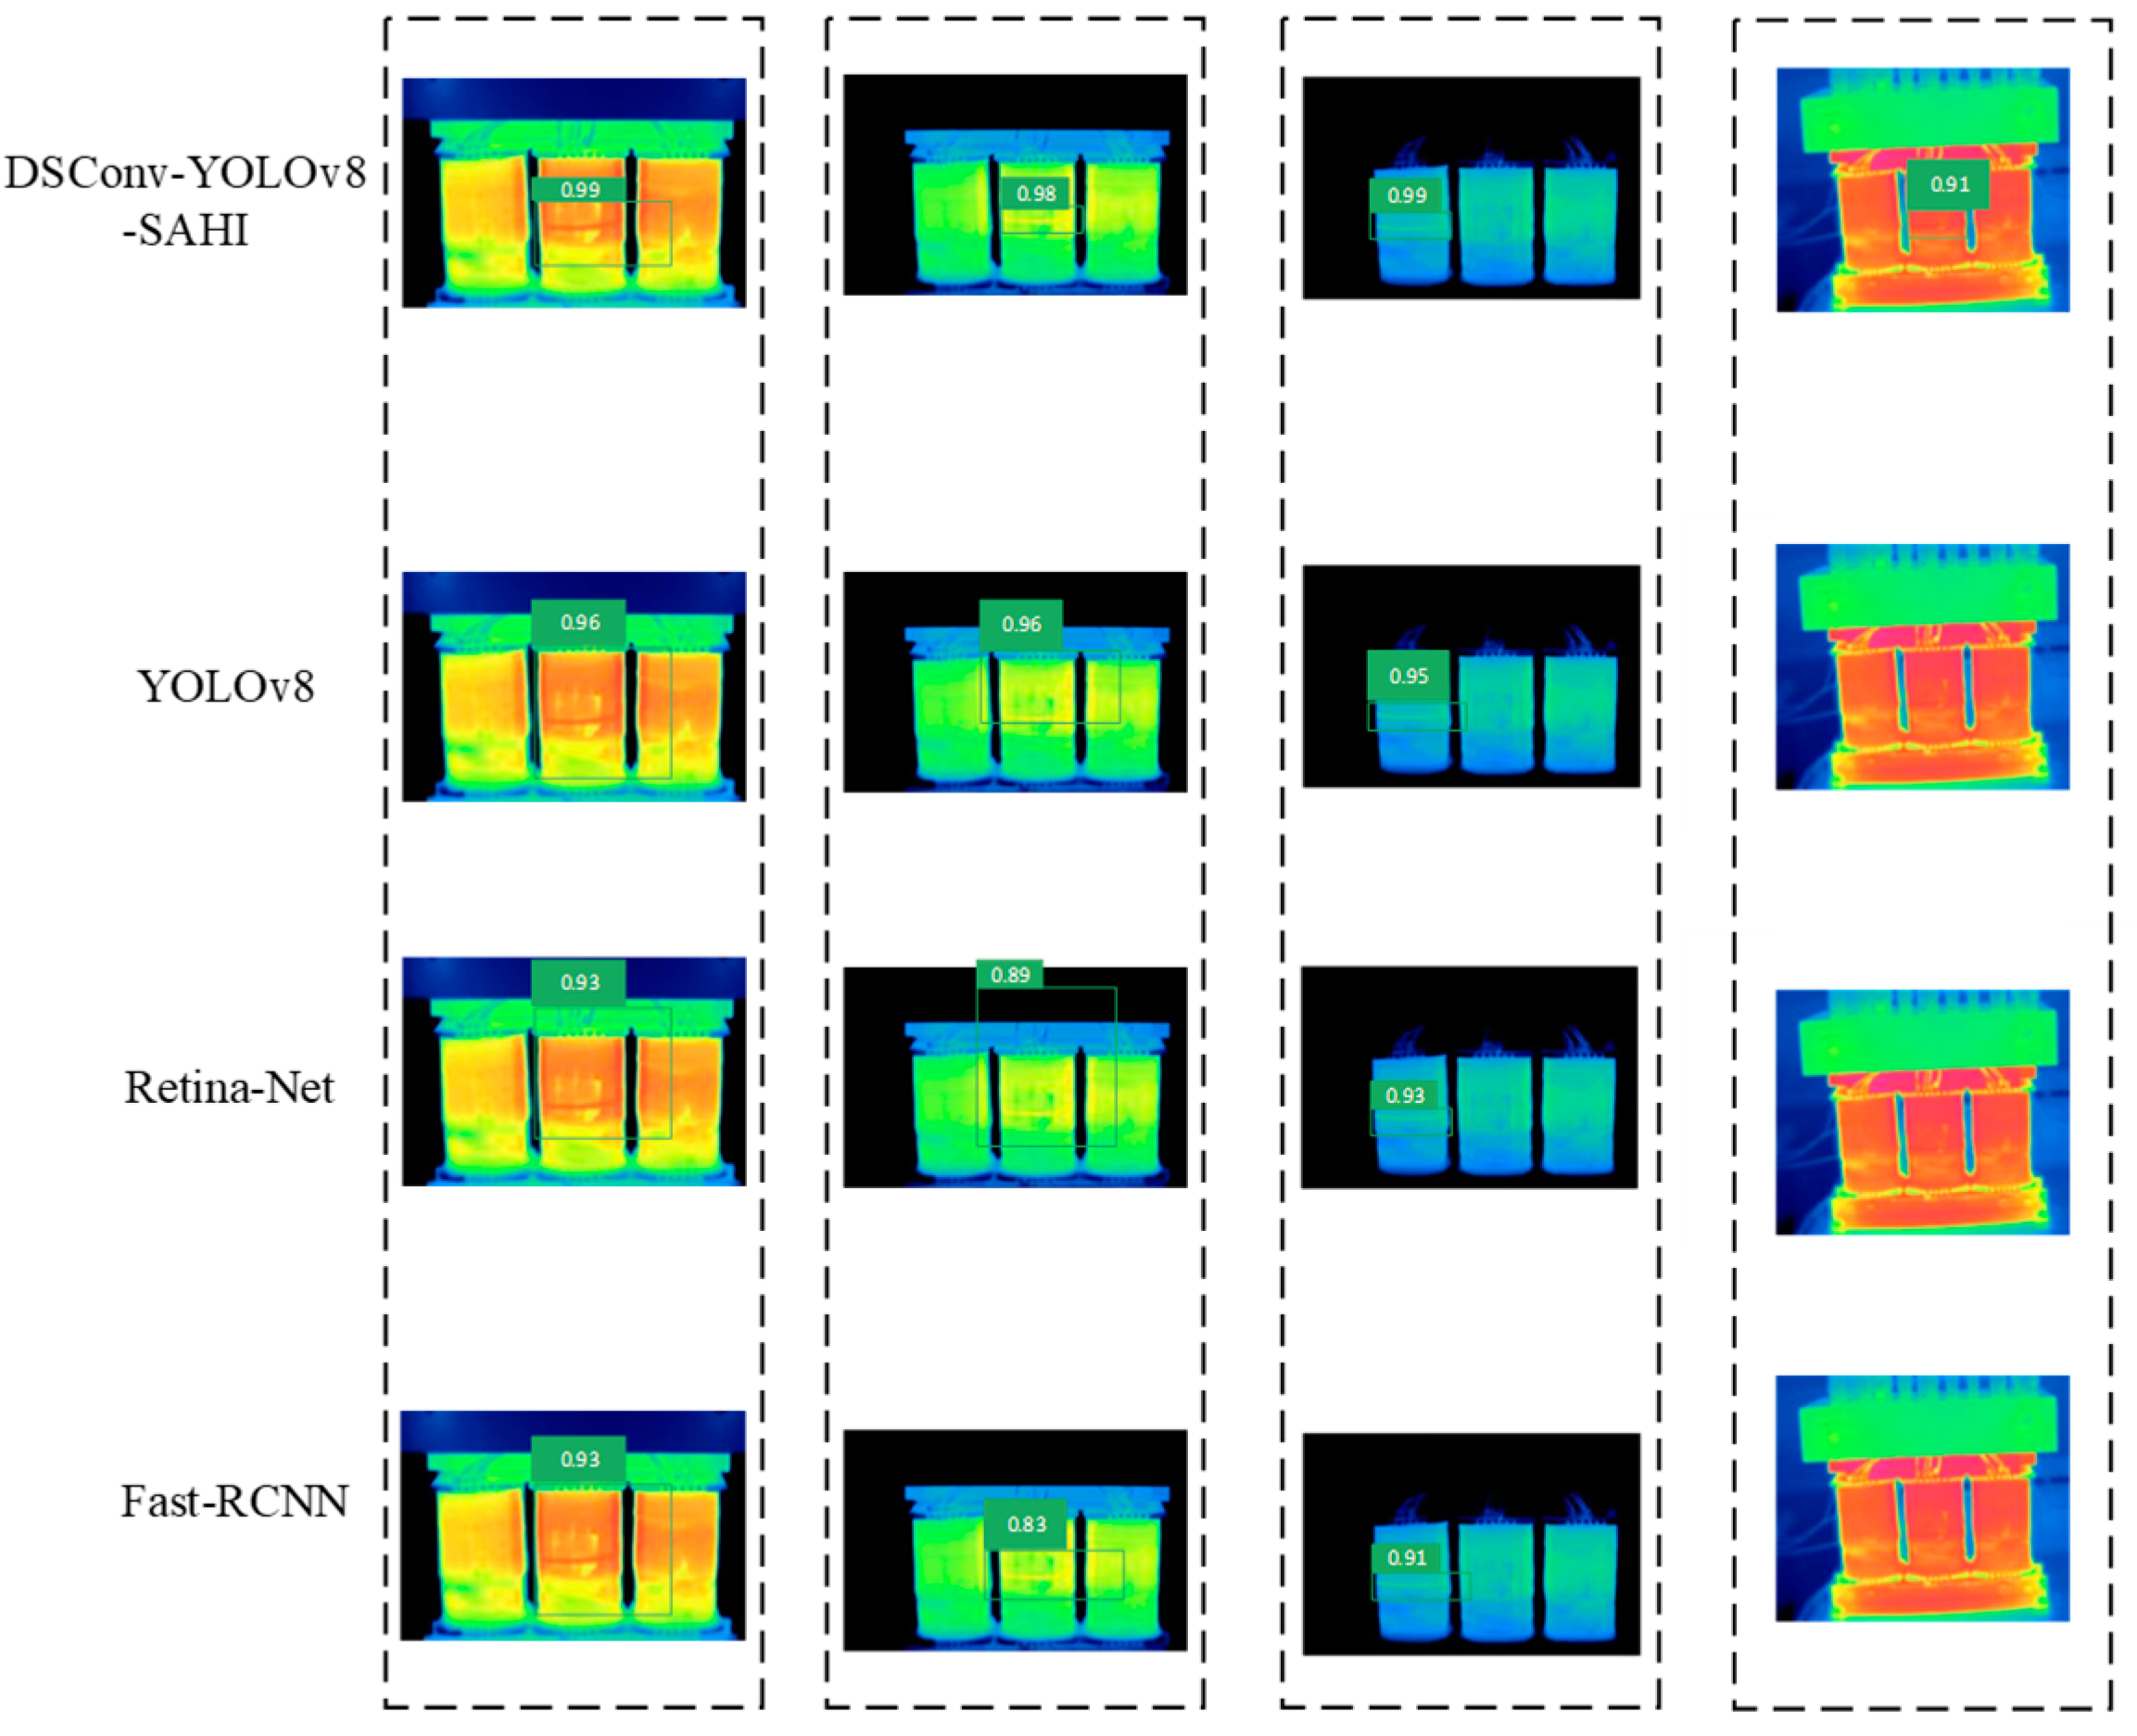
  • No overfitting or underfitting occurred during the training process. Experimental validation results demonstrate that the average accuracy of the proposed improved YOLOv8 slicing-aided hyper-inference algorithm exceeds 97%. This algorithm effectively detects the trajectory of inter-turn short circuit faults in dry-type transformers and shows strong potential for practical application;
  • The enhanced YOLOv8 model shows a 5.74% improvement in average accuracy compared to the original YOLOv8 model in horizontal ablation tests. In vertical network evaluations, the accuracy of the enhanced YOLOv8 model improves by 13.51% over Fast-RCNN and by 8.08% over Retina-Net. Overall, the improved YOLOv8 slicing-aided hyper-inference algorithm demonstrates superior prediction accuracy and stability compared to other models, offering a robust algorithmic foundation for detecting defects in small targets and complex backgrounds;
  • The proposed method for detecting inter-turn short circuit fault trajectories in dry-type transformers is valuable for enhancing transformer operation and maintenance efficiency. Additionally, it offers significant reference value for fault detection in other electrical equipment and introduces a new approach to unmanned power equipment inspection.
In practical engineering applications, particularly in environments like substations or industrial facilities, real-time detection capabilities are essential. The effectiveness of the proposed YOLOv8-based method in these settings is influenced by several factors, including the model’s processing speed, hardware requirements, and resilience to environmental variables such as temperature fluctuations. In this study, the hardware configuration was selected to optimize both processing speed and detection accuracy, thereby enhancing the model’s suitability for real-time fault detection scenarios. Furthermore, potential interference factors, such as temperature variations and their effects on detection accuracy, were carefully considered in the design of the data collection and model training processes. Future research should focus on addressing these challenges by incorporating more diverse environmental data and optimizing the model for various hardware configurations to ensure reliable and efficient performance in real-world engineering applications.

Author Contributions

Conceptualization, Z.Z. and P.Z.; methodology, J.X.; software, Y.W.; validation, L.W., Z.M. and H.Y. (Hekai Yang); formal analysis, H.Y. (Haobo Yang); investigation, J.D.; resources, J.W.; data curation, H.Y. (Hekai Yang); writing—original draft preparation, H.Y. (Haobo Yang); writing—review and editing, J.D.; visualization, Z.Z.; supervision, J.W.; project administration, P.Z.; funding acquisition, P.Z. All authors have read and agreed to the published version of the manuscript.

Funding

This research was funded by China Yangtze Power Co., Ltd., grant number Z412302023.

Data Availability Statement

The data used in the analysis presented in the paper will be made available, subject to the approval of the data owner.

Conflicts of Interest

Y.W. was employed by Three Gorges Ecological Environment Co., Ltd. Z.Z., J.X., L.W. and Z.M. were employed by Xiluodu Hydropower Plant. The remaining authors declare that the research was conducted in the absence of any commercial or financial relationships that could be construed as a potential conflict of interest. The authors declare that this study received funding from China Yangtze Power Co., Ltd. The funder was not involved in the study design, collection, analysis, interpretation of data, the writing of this article or the decision to submit it for publication.

References

  1. Zhu, B.; Xian, R.; Fan, H.; Liu, X.; Gao, H.; Chen, L. Transformer fault diagnosis technology based on the fusion of WRSR and improved naive Bayes. Power Syst. Prot. Control 2021, 49, 120–128. [Google Scholar]
  2. Zheng, Y.; Gong, X.; Pan, S.; Sun, J. Analysis on Leakage Flux Characteristics of turn-to-turn short-circuit fault for power transformer. Autom. Electr. Power Syst. 2022, 46, 121–127. [Google Scholar]
  3. Chen, H.; Wang, Q.; Liu, X. Transformer fault diagnosis based on BAS-BP model. J. Xinyang Norm. Univ. (Nat. Sci. Ed.) 2020, 33, 635–639. [Google Scholar]
  4. Zhang, H.; Wang, X.; Gong, R.; Long, R.; Jian, Z. Influence of support failure on short-circuit dynamic characteristics of transformer winding. Transformer 2024, 61, 22–28. [Google Scholar]
  5. Xian, R.; Chen, L.; Geng, K.; Fan, H.; Zhang, B.; Gao, H. Research on electromagnetic characteristics of short circuit faults in low-voltage windings of grounding transformers. Power Syst. Prot. Control 2021, 49, 74–82. [Google Scholar]
  6. Ballal, M.S.; Suryawanshi, H.M.; Mishra, M.K.; Chaudhari, B.N. Interturn faults detection of transformers by diagnosis of neutral current. IEEE Trans. Power Deliv. 2016, 31, 1096–1105. [Google Scholar] [CrossRef]
  7. Li, D.; Liu, Y.; Fan, X.; Li, H.; Li, Y.; Liu, H. Discrimination and degree detection of axial and radial deformation in transformer windings based on distributed sensing of ribbon optical fibers. Proc. CSEE 2024, 1–11. [Google Scholar]
  8. Cui, J.; Ma, H. Voiceprint Recognition model of transformer core looseness fault based on improved MFCC and 3D-CNN. Electr. Mach. Control 2022, 26, 150–160. [Google Scholar]
  9. Zhou, L.; Li, W.; Jiang, J.; Gao, S.; Yan, J. Improved FRA modeling and radial deformation fault analysis of traction transformer windings. Electr. Power Autom. Equip. 2019, 39, 213–218. [Google Scholar]
  10. Meira, M.; Bossio, G.; ÁLvarez, R.; Mombello, E.; Verucchi, C. Differential current monitoring for the detection of inter-turns short circuits in power transformers. In Proceedings of the 2020 IEEE Biennial Congress of Argentina (ARGENCON), Resistencia, Argentina, 1–4 December 2020; pp. 1–7. [Google Scholar]
  11. Santos, M.G.; Aquino, B.R.R.; Lira, S.M.M. Thermography and artificial intelligence in transformer fault detection. Electr. Eng. 2018, 100, 1317–1325. [Google Scholar] [CrossRef]
  12. Chen, S.; Sheng, G.; Zhang, L.; Wang, F. Fast Simulation method of temperature field distribution for dry-type transformer based on equivalent thermal parameters of windings. High Volt. Eng. 2024, 1–13. [Google Scholar]
  13. Hou, T. Simulation of Dry-type Transformer Drying and DC Heating Temperature Field. Electr. Switchg. 2024, 62, 47–51+55. [Google Scholar]
  14. Li, X.; Su, B.; Chen, W.; Yi, J.; Yao, X. Simulation analysis of temperature field of dry-type transformer under natural cooling. Mech. Electr. Eng. Technol. 2024, 53, 253–256+282. [Google Scholar]
  15. Yang, G.; Wang, J.; Nie, Z.; Yang, H.; Yu, S. A Lightweight YOLOv8 tomato detection algorithm combining feature enhancement and attention. Agronomy 2023, 13, 1824. [Google Scholar] [CrossRef]
  16. Zhao, P.; Wang, J.; Xia, H.; He, W. A Novel Industrial Magnetically Enhanced Hydrogen Production Electrolyzer and Effect of Magnetic Field Configuration. Appl. Energy 2024, 367, 123402. [Google Scholar] [CrossRef]
  17. Jia, S.; Tian, M.; Lu, H. Combined neural network anomaly detection algorithm based on data augmentation. Inf. Technol. Informatiz. 2023, 187–190. [Google Scholar]
  18. Sheng, X.; Shen, H. Semi-supervised text classification algorithm with data augmentation and similar pseudo-labels. Appl. Res. Comput. 2023, 40, 1019–1023+1051. [Google Scholar]
  19. Zhao, P.; Wang, J.; He, W.; Xia, H.; Cao, X.; Li, Y.; Sun, L. Magnetic Field Pre-Polarization Enhances the Efficiency of Alkaline Water Electrolysis for Hydrogen Production. Energy Convers. Manag. 2023, 283, 116906. [Google Scholar] [CrossRef]
  20. Su, J.; Jia, Z.; Qin, Y.; Zhang, J. Improved YOLOv8 algorithm for industrial surface defect detection. Comput. Eng. Appl. 2024, 1–15. [Google Scholar] [CrossRef]
  21. Hu, X.; Chang, Y.; Qin, H.; Xiao, J.; Cheng, H. Binocular ranging method based on improved YOLOv8 and GMM image point set matching. J. Graph. 2024, 1–14. [Google Scholar]
  22. Long, Y.; Xiao, X. Improved YOLOv8 metal surface defect detection model. Manuf. Technol. Mach. Tool 2024, 1–12. [Google Scholar]
  23. Wang, M.; Wu, B. Application of building concrete crack detection technology based on YOLOv8. Inter. Archit. China 2024, 181–183. [Google Scholar]
  24. Zhao, P.; Wang, J.; Sun, L.; Li, Y.; Xia, H.; He, W. Optimal Electrode Configuration and System Design of Compactly-Assembled Industrial Alkaline Water Electrolyzer. Energy Convers. Manag. 2024, 299, 117875. [Google Scholar] [CrossRef]
  25. Chen, Z.; Yang, X.; Chen, X. Collaboration application of YOLO and SAHI models in the detection of apparent damage of building facades. Constr. Technol. 2022, 51, 114–119. [Google Scholar]
  26. Fan, D.; Yang, Y.; Feng, S.; Dai, W.; Liang, B.; Xiong, J. SIPNet SAHI: Multiscale sunspot extraction for high-resolution full solar images. Appl. Sci. 2023, 14, 7. [Google Scholar] [CrossRef]
Figure 1. Partial image with fault traces.
Energies 17 04559 g001
Figure 2. YOLOv8 network structure.
Energies 17 04559 g002
Figure 3. DSConv iteration policy.
Energies 17 04559 g003
Figure 4. DSConv receptive field.
Energies 17 04559 g004
Figure 5. Slicing-aided hyper-inference algorithm.
Energies 17 04559 g005
Figure 6. Improved YOLOv8 network structure.
Energies 17 04559 g006
Figure 7. SAHI hierarchical approach.
Energies 17 04559 g007
Figure 8. Training loss error plot.
Energies 17 04559 g008
Figure 9. The mAP comparison results.
Energies 17 04559 g009
Figure 10. Four types of model recognition renderings.
Energies 17 04559 g010
Table 1. Augmented data.
NumberCategory of IdentificationNumber of Enhanced ImagesLabel Name
1winding20000
2fault trajectory20001
Table 2. Detailed configuration table for software and hardware.
Hardware and SoftwareVersions and Parameters
CPUIntel Core i7 13700F
CUDA12.2
GPUNVIDIA GeForce RTX 4070
operating systemWindows 10
PythonPython 3.9
Pytorch2.0.0
PycharmPycharm 2019
Table 3. Model comparison data.
Model Namep (%)R (%)Map (%)
YOLOv886.4386.2791.32
Fast-RCNN80.2179.1583.55
Retina-Net83.0281.1988.98
DSConv-YOLOv8-SAHI91.6988.6497.06
Disclaimer/Publisher’s Note: The statements, opinions and data contained in all publications are solely those of the individual author(s) and contributor(s) and not of MDPI and/or the editor(s). MDPI and/or the editor(s) disclaim responsibility for any injury to people or property resulting from any ideas, methods, instructions or products referred to in the content.

