Article

Multi-Scale Visualization Study of Water and Polymer Microsphere Flooding through Horizontal Wells in Low-Permeability Oil Reservoir

1
Research Institute of Geological Exploration and Development, Chuanqing Drilling Engineering Company, Ltd., China National Petroleum Corporation (CNPC), Chengdu 610500, China
2
International Nature Gas Technology Support Center, China National Petroleum Corporation (CNPC), Chengdu 610500, China
3
International Ltd., Chuanqing Drilling Engineering Company, Ltd., China National Petroleum Corporation (CNPC), Chengdu 610500, China
4
State Key Laboratory of Oil & Gas Reservoir and Exploitation, Southwest Petroleum University, Chengdu 610500, China
5
School of Petroleum and Natural Gas Engineering, Southwest Petroleum University, Chengdu 610500, China
*
Author to whom correspondence should be addressed.
Energies 2024, 17(18), 4597; https://doi.org/10.3390/en17184597
Submission received: 4 June 2024 / Revised: 9 July 2024 / Accepted: 8 August 2024 / Published: 13 September 2024

Abstract

:
Our target USH reservoir in the D oilfield is characterized by “inverse rhythm” deposition with the noticeable features of “high porosity and low permeability”. The reservoir has been developed with waterflooding using horizontal wells. Due to the strong heterogeneity of the reservoir, water channeling is severe, and the water cut has reached 79%. Considering the high temperature and high salinity reservoir conditions, polymer microspheres (PMs) were selected to realize conformance control. In this study, characterization of the polymer microsphere suspension was achieved via morphology, size distribution, and viscosity measurement. Furthermore, a multi-scale visualization study of the reservoir development process, including waterflooding, polymer microsphere flooding, and subsequent waterflooding, was conducted using macro-scale coreflooding and calcite-etched micromodels. It was revealed that the polymer microspheres could swell in the high salinity brine (170,000 ppm) by 2.7 times if aged for 7 days, accompanied by a viscosity increase. This feature is beneficial for the injection at the wellbore while swelled to work as a profile control agent in the deep formation. The macro-scale coreflood with a 30 cm × 30 cm × 4.5 cm layer model with 108 electrodes installed enabled the oil distribution visualization from different perpendicular cross sections. In this way, the in situ conformance control ability of the polymer microsphere was revealed both qualitatively and quantitatively. Furthermore, building on the calcite-etched visible micro-model, the pore-scale variation of the residual oil when subjected to waterflooding, polymer microsphere waterflooding, and subsequent waterflooding was collected, which revealed the oil displacement efficiency increase by polymer microspheres directly. The pilot test in the field also proves the feasibility of conformance control by the polymer microspheres, i.e., more than 40,000 bbls of oil increase was observed in the produces, accompanied by an obvious water reduction.

1. Introduction

Carbonate reservoirs, namely calcite, dolomite, and limestone, are the main oil and gas production resources. More than 60% of the proven global oil reserves and more than 40% of the proven global gas reserves are held in carbonate reservoirs [1]. In the Middle East, oil production accounts for approximately two-thirds of global production, and approximately 80% of the oil reservoirs are carbonates [2].
Waterflooding has been the most common oil recovery method for carbonate reservoirs in the Middle East. However, due to the strong heterogeneity of the carbonate reservoirs, at the later stage of waterflooding, the water cut of the oil production wells is high, caused by the water channeling through high permeability thief zones. As is well known, early and excess water production brings severe problems to the oil fields, i.e., it not only increases costs related to scaling, corrosion, water-oil separation, and well shut-ins but also brings environmental problems such as degradation of groundwater, soils, surface water, and the ecosystems they support [3]. For example, it is reported that the worldwide daily oil production is approximately 75 million barrels, accompanied by 210 million barrels of water production. It costs roughly 5 to more than 50 cents to treat each barrel of water. For an oil production well with a water cut higher than 80%, the cost of produced water treatment could reach $4 per barrel of oil produced [4]. Therefore, conformance control becomes an important environmental and financial challenge for the oil and gas industries [5].
Broadly speaking, conformance control can be achieved by any work that could change the streamline in the reservoir, such as ① injection or production rates change, ② mechanical solutions in the wellbore, ③ infill drilling, ④ targeted stimulation, ⑤ chemical treatment in the near-wellbore region and ⑥ chemical treatment deep in the reservoir [6]. Meanwhile, the chemical-based conformance control agents could be further classified as:
(1)
Near-wellbore blocking agents: The typical near-wellbore blocking agents are fast cross-linked polymer gels. As illustrated in the article [7], the gel is generally prepared with a high concentration of low molecular weight polymers and a cross-linker. The gel can be injected in the injector or producer side, targeting the near-wellbore region (often <15 ft radial penetration) for un-fractured reservoirs. Although the agent volume is small, the resistance factor should be high enough to withstand the high-pressure drop in the near-wellbore zone. This treatment can be significantly rewarding, provided that there is no vertical cross-flow between reservoir strata.
(2)
In-depth blocking agents: The in-depth blocking agents are able to create a block in the deep reservoir under an activation trigger, which causes the agents to change from a “flowing” to a “blocking” state. As illustrated in the work of [8], the in-depth blocking agents are generally delayed cross-linked gels. Such conformance control agents are suitable for the condition when the high permeability streaks or fractures are well diagnosed and localized.
(3)
Continuous flooding agents: The continuous flooding chemical agents are injected into the reservoir in large volumes, which do not rigorously block the flowing path but increase the flow resistance. This can be achieved either by increasing the displacing phase viscosity or by the adsorption of the injectant. Therefore, the normal polymer solution is one type of continuous flooding agent that generally improves conformance control by reducing the mobility ratio [9]. The other types of continuous flooding agents include colloidal dispersion gels (CDG) [10], microgels [11], relative permeability modifiers (RPM) [12], and polymer microspheres [13].
Among these chemical-based conformance control agents, polymer microspheres are small particles comprised of cross-linked polyacrylamide, which was proposed in the early 21st century and has received extensive attention [14,15,16,17,18,19,20]. Polymer microspheres have been employed as conformance control agents by temporarily blocking the high permeability thief zone and diverting water into the unswept zones. In addition, the blockage is temporary and reversible since the microsphere will be eventually displaced to the next zone by the subsequently injected water. One of the most important features of polymer microspheres is that the microspheres are less susceptible to the reservoir conditions and can be used in reservoirs with temperatures up to ~130 °C and brine salinities up to 300,000 ppm [21]. Pilot tests have also been conducted, for example, in Shengli, Dagang Oilfields, Jidong, Changqing, and Bohai Bay of China [22,23,24,25], as well as in Canada [26] and Oman [21]. In addition, the results of these pilot tests demonstrate a good conformance control effect.
To reveal and explain the conformance control ability of polymer microspheres, both experimental and modelling work have been conducted by researchers. However, compared to experimental studies, there are fewer modeling studies that predict the polymer microsphere performance. Wu and Bai [27] developed a conceptual model based on their laboratory tests, in which their particle gel (PG) was treated as an additional component of the water phase, and the mobilization of the PG through pores was described by a modified Darcy’s Law. Feng et al. [28] developed a mathematical model based on filtration theory, which considered the blocking process of the PG due to deposition and desorption. Wang et al. [29,30] presented an advanced phenomenological model for preformed particle gel (PPG) transport in porous media. Their model calculated the PPG plugging probability using log-normal and normal distribution functions and considered the PPG remobilization behavior using power-law equations. Comparatively, extensive experimental work has been carried out to investigate the properties and the performance of PM on conformance control and oil recovery increase. Bai et al. [31] studied the effect of gelant composition and reservoir environments (temperature, brine salinity, and pH) on the PPG properties. Bai et al. [32] investigated the PPG transport mechanisms using an etched micromodel. They revealed six transport patterns, i.e., direct pass, adsorption, deform and pass, snap-off and pass, shrink and pass, and trap. They also found that PPG can pass through a pore throat only when the driving pressure is higher than the threshold pressure, which is determined by the particle size, strength, and pore structure. Imqam et al. [33] studied the effectiveness of using hydrochloric acid in removing the gel cakes that formed on the low-permeability formation surface when injecting particle gel into the target zones for conformance control. Wang et al. [34] investigated the effect of fracture length, fracture height, matrix permeability, and residual oil on the PPG placement, dehydration, and water control performance. Pu et al. [35] evaluated a new re-crosslinkable PPG in the conformance control of fractured reservoirs. They found that the new PPG product can re-crosslink to form rubber-like materials to plug fractures efficiently.
Building on the features and mechanisms of polymer microspheres in improving the oil recovery efficiency, as well as the characteristics of our target oil reservoir (as described in Section 1.1), polymer microspheres are adopted as the conformance control agents in this study. The basic properties of the polymer microspheres are measured first and will be used to explain the conformance control performance in the porous media. Macro-scale and micro-scale displacement tests are employed to visualize the residual oil variation process when subjected to waterflooding and polymer microsphere flooding. In addition, pilot testing results are supplied to validate the success of polymer microspheres in conformance control of low permeability carbonate oil reservoirs.

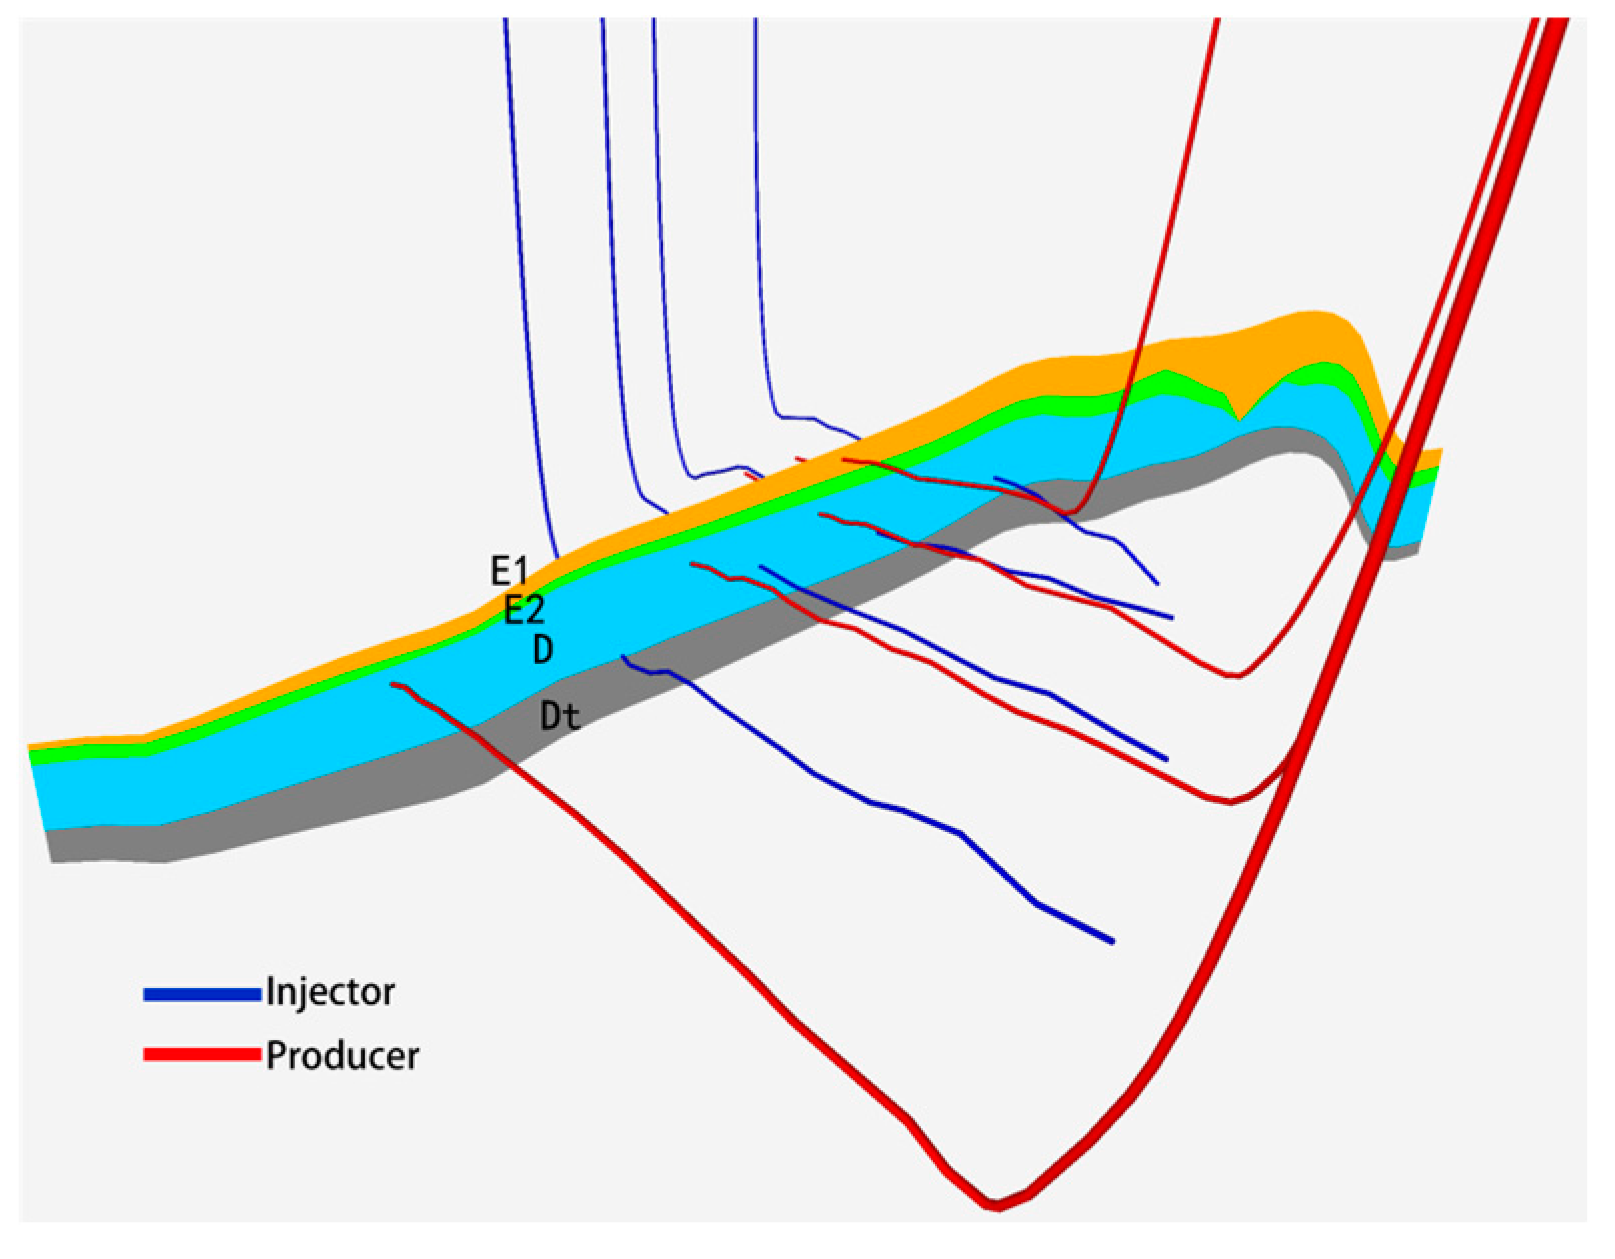
1.1. Characteristics of USH Reservoir in D Oilfield

The main reservoir of the D oilfield is the Carboniferous USH carbonates. As shown in Figure 1, ertically, it is divided into five layers from bottom to top, i.e., A, B, C, D, and E. The USH-D and E layers are the main productive layers, which are mainly composed of bioclastic limestone, bioclastic mud limestone, and bioclastic particle limestone. The storage space mainly comprises various types of dissolution pores. Among them, bioclastic body cavity pores and intra-granular pores are the primary type; inter-granular pores are the secondary type; in addition, few fractures and sutures are developed. The reservoir rock is deposited in an “inverse rhythm”, with the noticeable feature of “high porosity and low permeability”, For example, the average porosity is 27.4%. Meanwhile, the average permeability is 5.3 mD.
The reservoir is being developed using horizontal wells with a toe-heel reverse, “top injection, bottom production” strategy, and under the line-drive pattern (as shown in Figure 2). The well spacing is small, at 100 m, and the horizontal section is 800–1000 m.
At present, the water cut of the reservoir has reached 79%; the recovered percentage of the geological reserves is 22.4%. It is urgent to reduce the water cut and increase oil recovery in the future.

2. Materials and Methods

2.1. Materials

The oil used in this study is light crude oil sampled from the USH reservoir, which has a 39 API and a viscosity of 0.7 cP at a reservoir temperature of 90 °C. The brine used in this study was prepared with NaCl, with a total salinity of 170,000 ppm.

2.2. Characterization of the Polymer Microsphere Dispersion System

The polymer microsphere dispersion system was prepared using the 170,000 ppm brine, targeting a concentration of 3000 ppm. The microscopic morphology of the polymer microsphere dispersion was observed using a SteREO Discovery V20 microscope (Zeiss, New York, NY, USA). Furthermore, the particle size analysis was accomplished using the software ImageJ 1.53t. The internal structure of the polymer microsphere was observed under high-resolution scanning electron microscopy (SEM). The apparent viscosity of the polymer microsphere dispersion was measured using a Brookfield DV-III viscometer at 90 °C. Additionally, the interfacial tension (IFT) between the polymer microsphere dispersion and the crude oil was collected using the drop shape analysis system (DSA 100, KRÜSS, Hamburg, Germany).

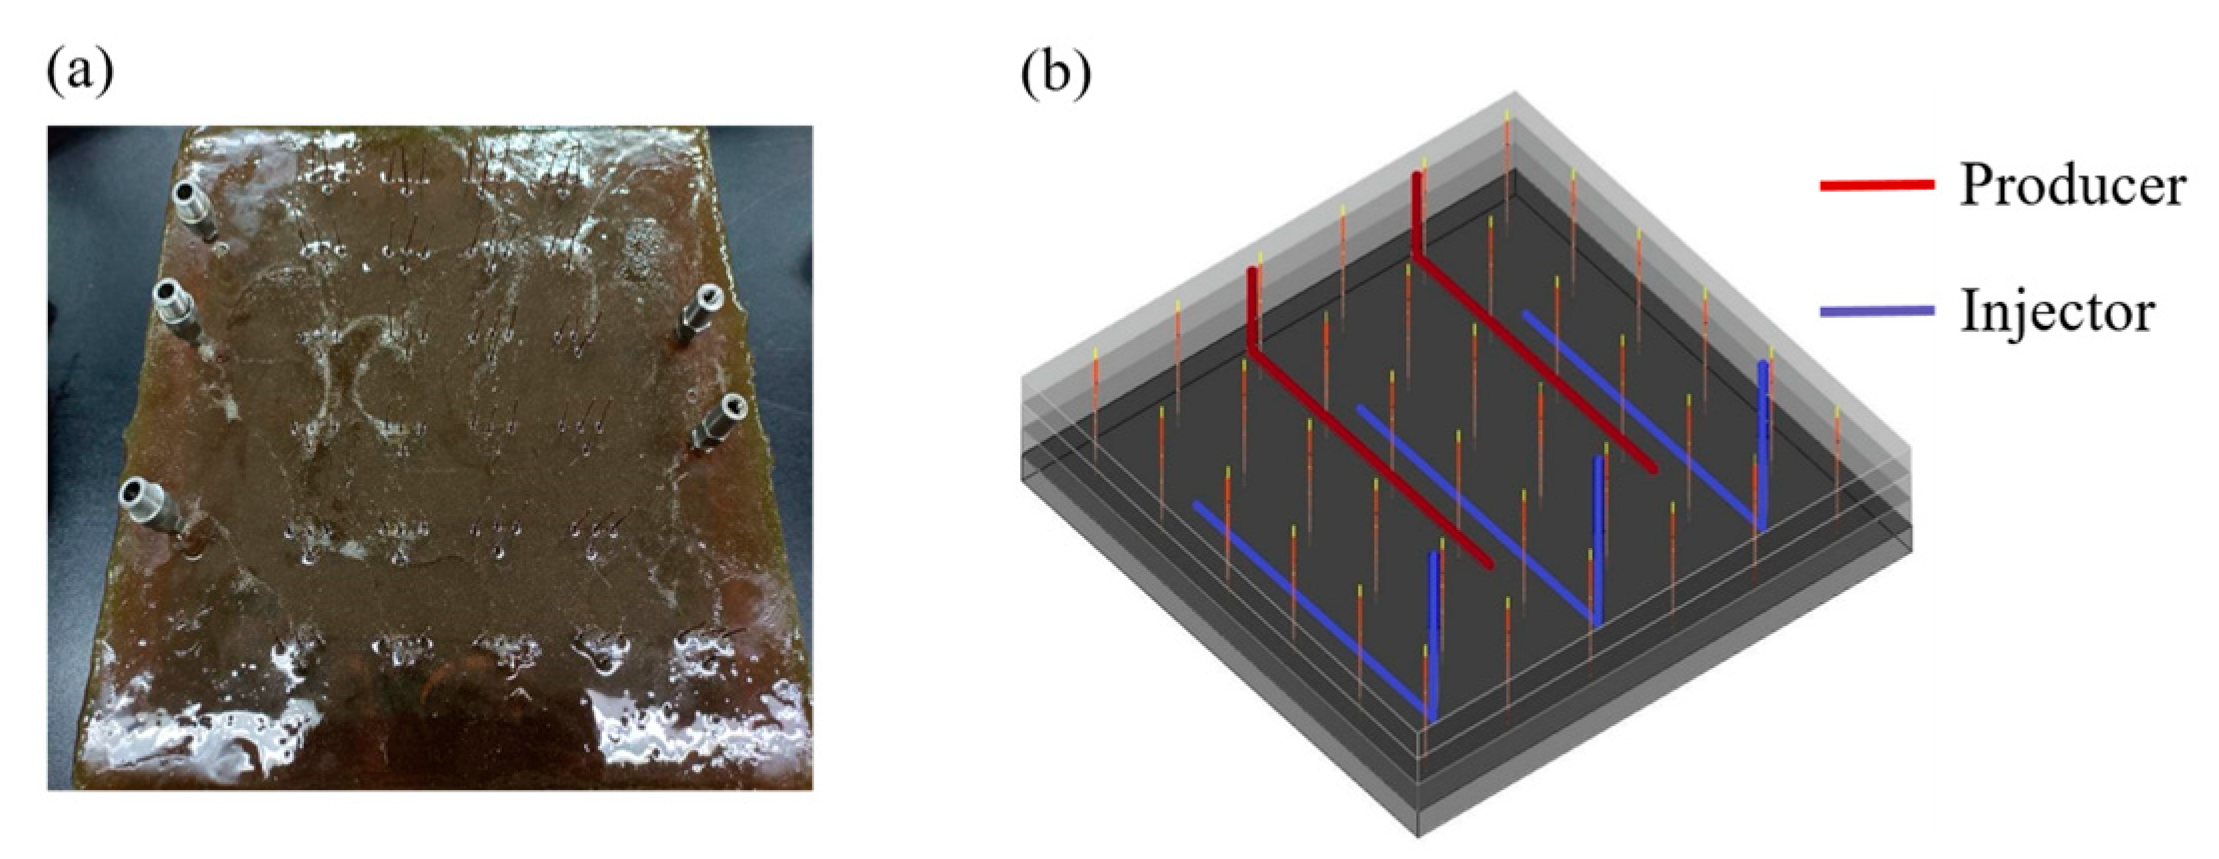
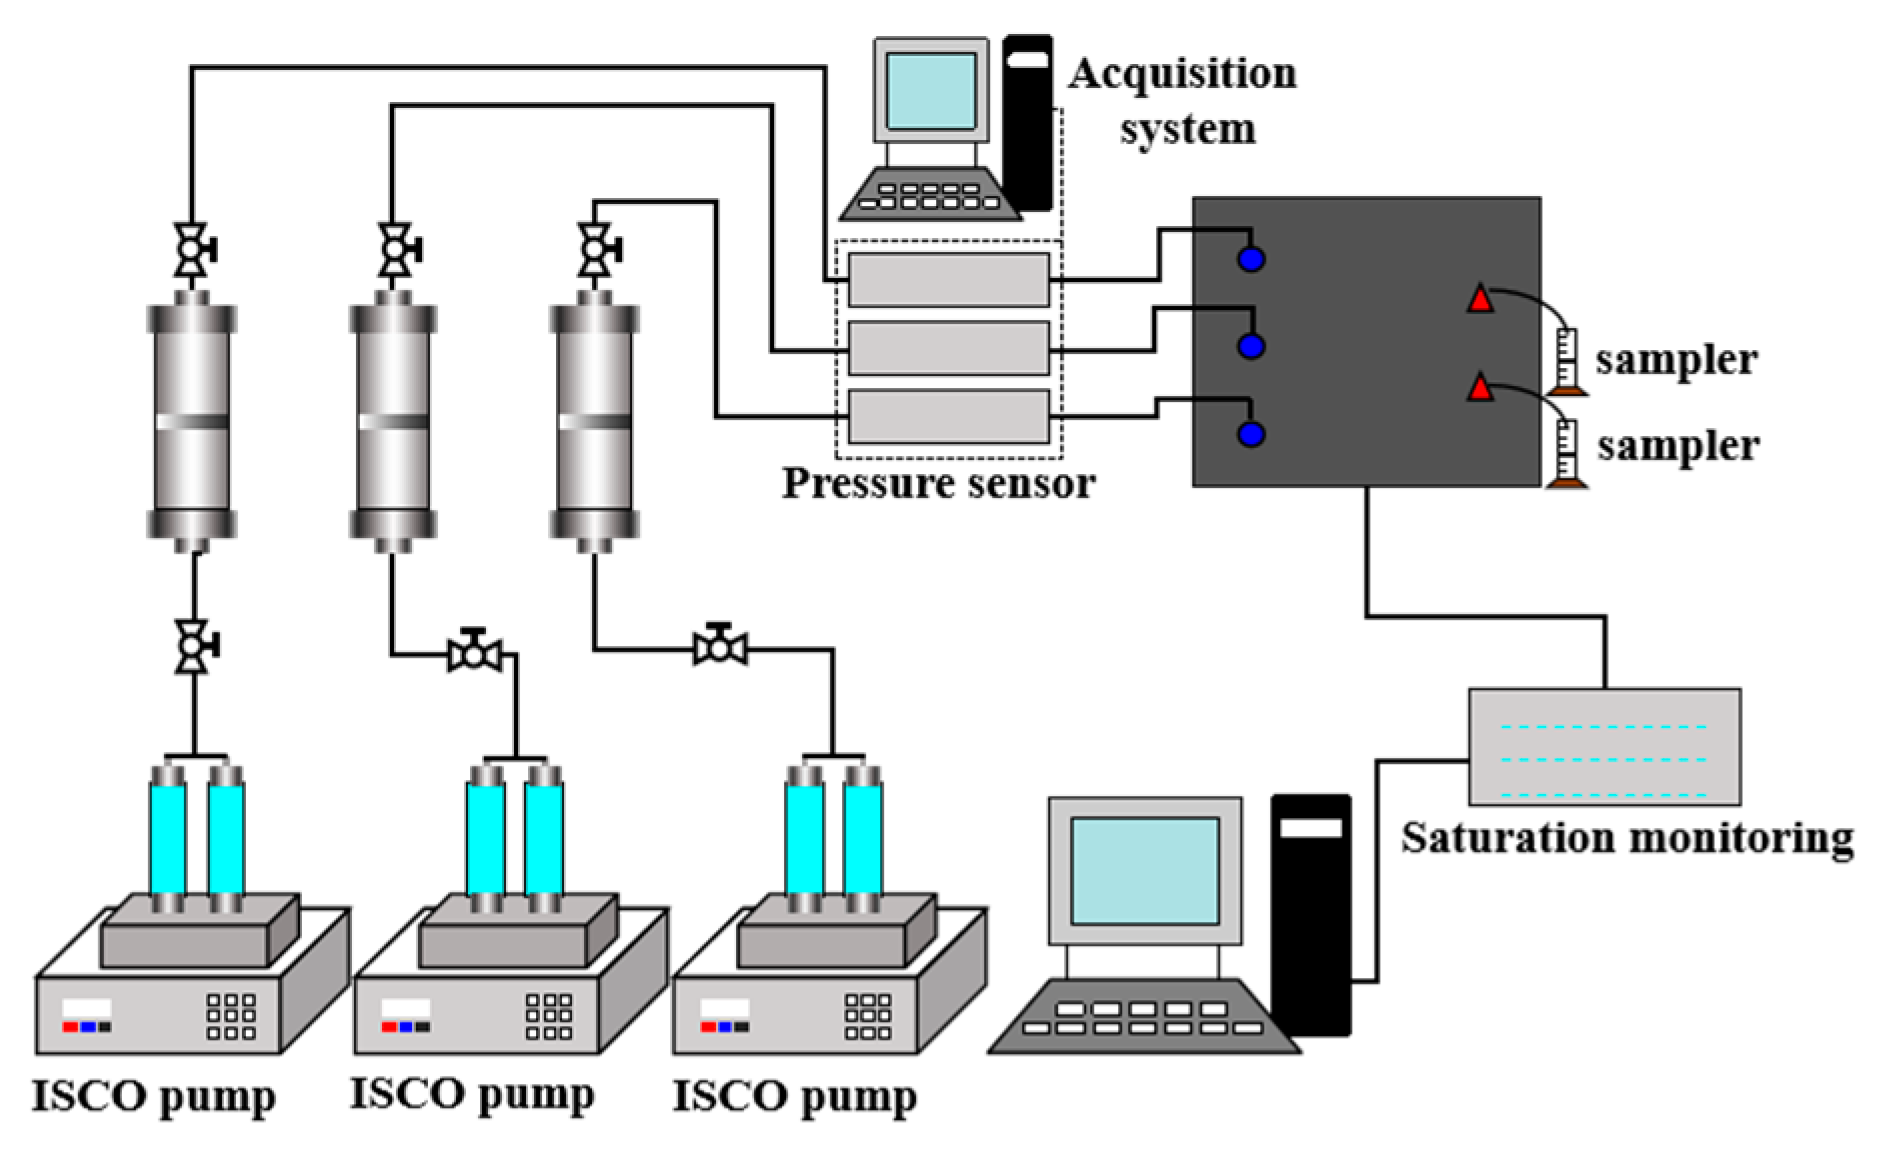
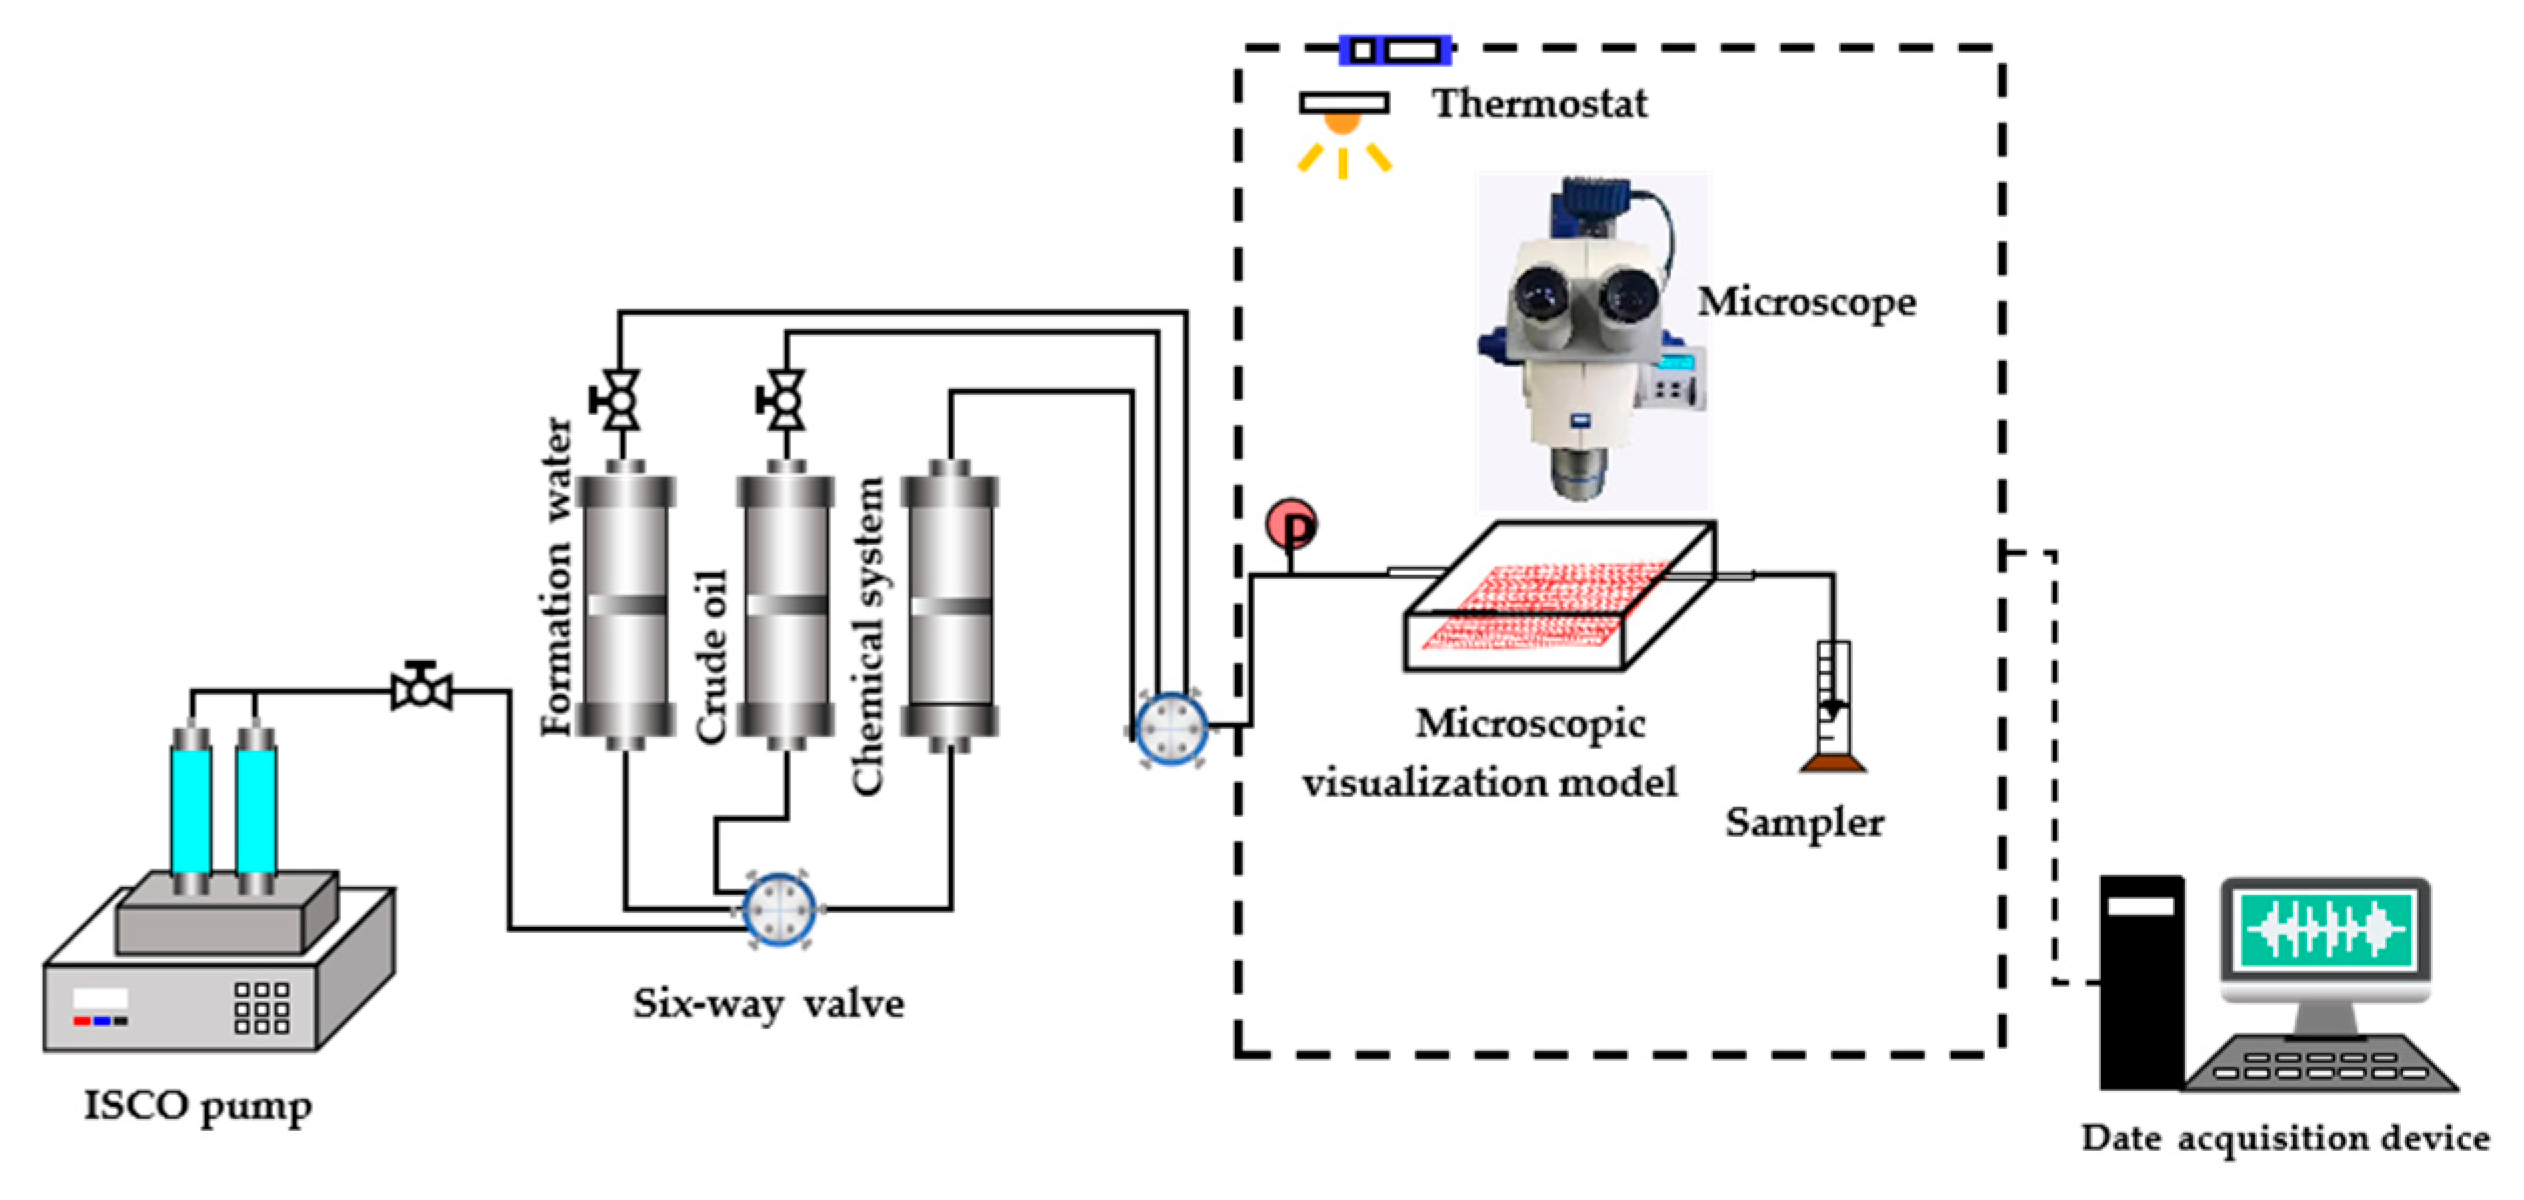
2.3. Macro-Coreflood Experiment

To simulate the actual stratified reservoir, a four-layered rock sample was prepared in our lab using calcite grains (as shown in Figure 3). These macro-models were used in the subsequent coreflood tests. The dimensions of our prepared rock sample are 30 cm in length, 30 cm in width, and 4.5 cm in height. The average gas permeability and porosity of the rock sample are 16.4 mD and 23.90%, respectively. The gas permeability for each layer, from top to bottom layer, is 16, 13, 10, and 6 mD, respectively.
To mimic the actual horizontal well pattern, three injectors and two producers were placed in the artificial rocks, as shown in Figure 4a. In addition, fluids are injected from the bottom and produced from the top. In order to obtain the water saturation distribution in the rock sample, 108 electrodes were installed.
The experimental setup used to perform the macro-coreflood tests is shown in Figure 5. The detailed procedures to carry out the coreflood tests are as follows. The experimental temperature is 90 °C.
The dry rock sample was vacuum-saturated with formation brine. The porosity was determined from the weight difference between the saturated and dry rock samples.
The 100% water-saturated rock sample was aged for 1 week at 90 °C to reach ionic equilibrium between the rock and brine.
Crude oil was injected into the rock sample to establish initial water saturation. Subsequently, the oil-saturated rock was aged for 3 weeks at 90 °C to restore the rock wettability.
A total of 2.5 PV of brine was injected at a flow rate of 1.0 cc/min. Then, 1.0 PV of polymer microsphere suspension was injected at a flow rate of 1.0 cc/min. Finally, another 1 PV of chase brine was injected.
During the coreflood test, effluents were collected, and the volume was measured. In addition, the electrical resistivity data were collected.

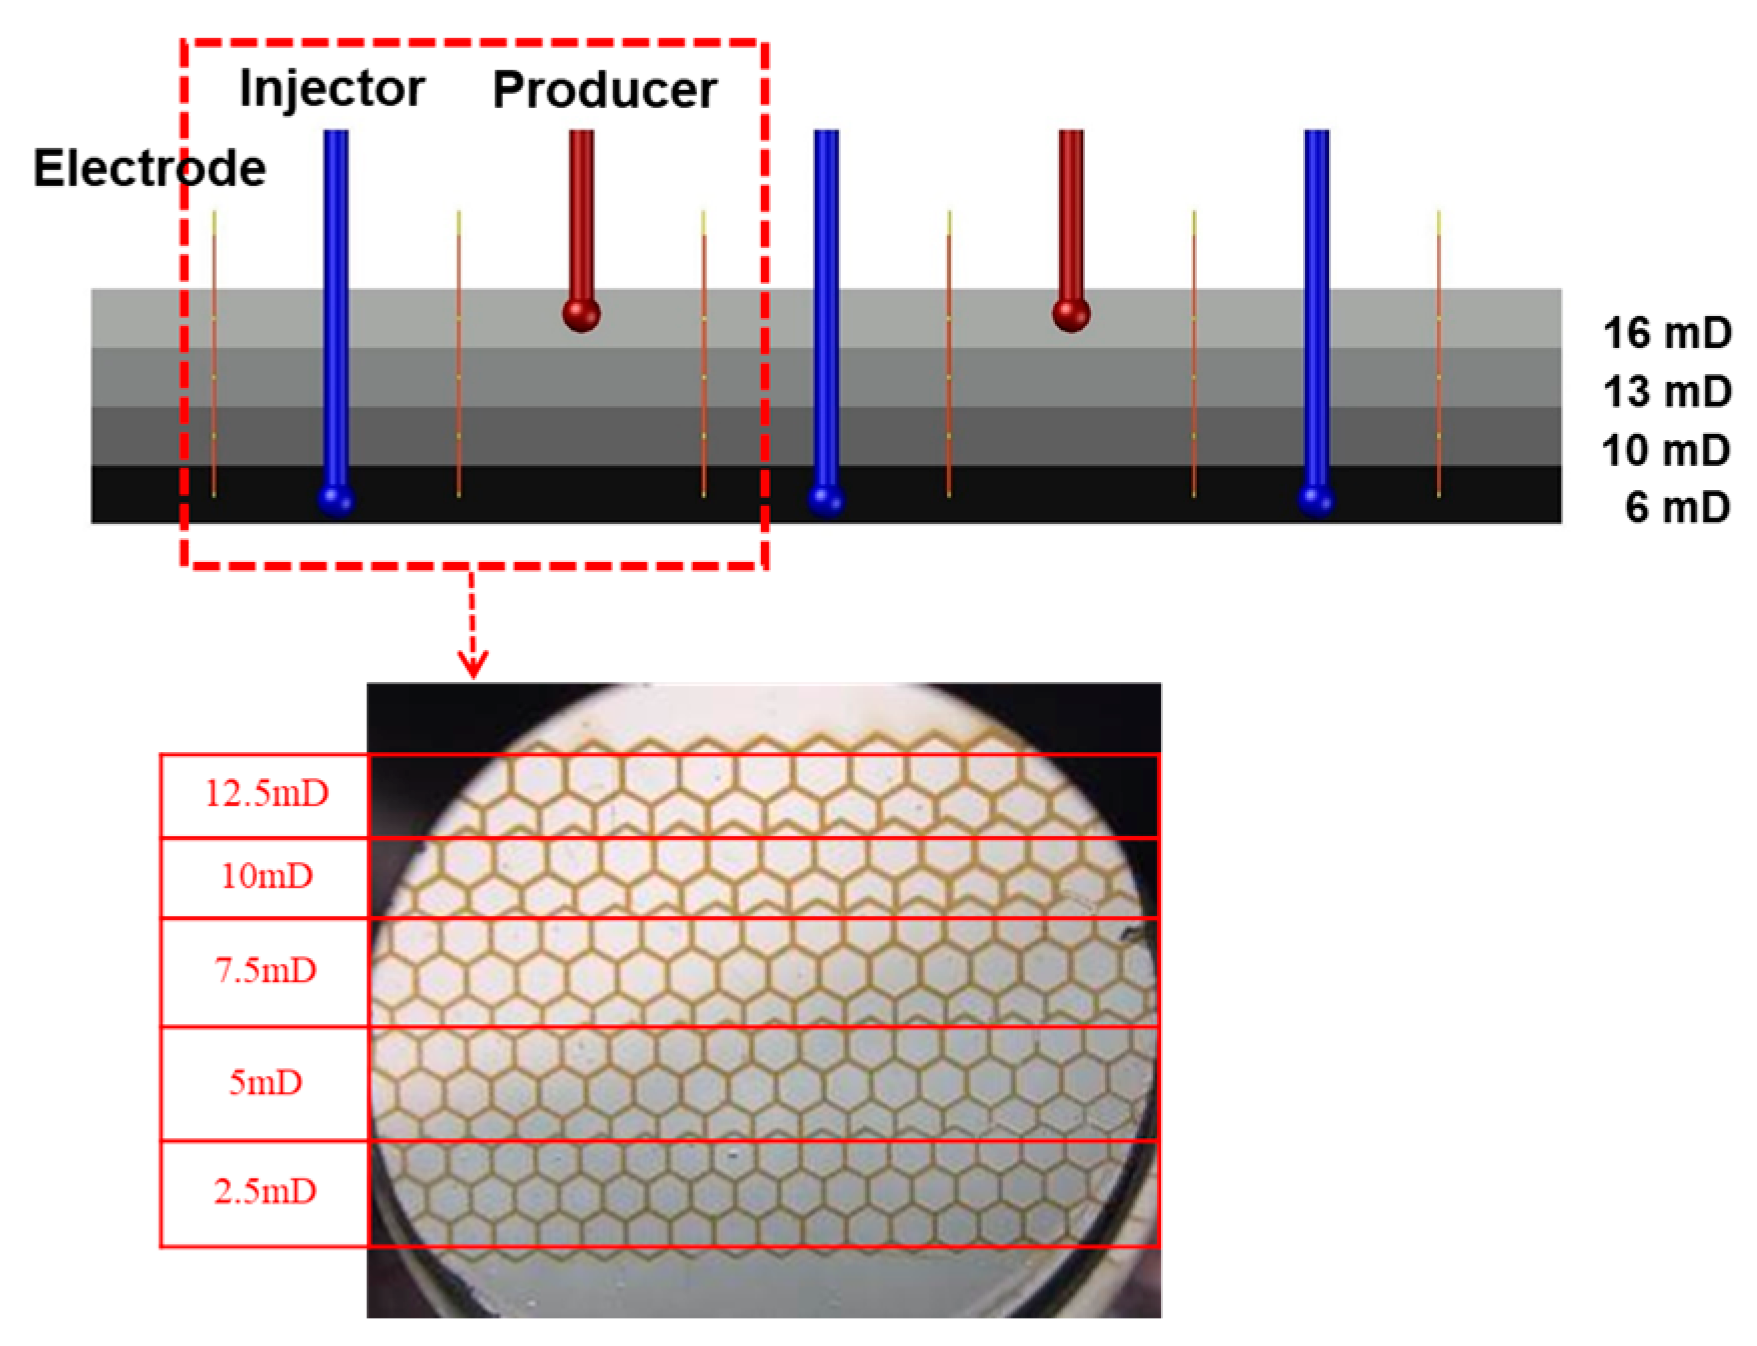
2.4. Micro-Model Experiment

To visualize the micro-scale oil displacement process, tests were conducted using artificial micro-models that mimic a subsection of the macro-rock model, as shown in Figure 6. The procedures to fabricate the micro-model are as follows. First, calcite wafers were cut from large calcite crystals using a saw and subsequently ground smooth. The smoothed wafer was coated with beeswax; after cooling and solidification of the beeswax layer, it was smoothed to provide a homogeneous acid-resistant layer. The desired etching pattern was inscribed through the beeswax film mask using a CO2 laser cutter. The calcite wafer was immersed in 10% HCl for 15 min to etch the desired microchannel patterns. Afterward, the etched wafer was immersed in DI (Deionized) water to remove the residual acid and subsequently heated to 150 °C to remove the wax mask. The cleaned, etched surface was adhered to a borosilicate glass slide using a thin layer of adhesive. The etching depth of the micro-model is 2 μm. The pore diameters for different layers of the micro-model are summarized in Table 1.
The etched micromodel was subsequently installed in the displacement experiment setup (Figure 7). To better observe the displacement process, methylene blue dye was added to the injected water to enhance the visualization contrast. Thereby, it was observed under the microscopy that water appeared blue, oil appeared brown-yellow, and the polymer microsphere was white. Like the macro-coreflooding test, after the micro-model was saturated with oil, waterflooding was initiated at the rate of 0.001 cc/min. After 10 PV of water was injected, polymer microsphere suspension with a concentration of 3000 ppm was injected at 0.001 cc/min for 16 PV. Subsequent waterflooding was performed at a rate of 0.001 cc/min for 14 PV.

3. Results and Discussion

3.1. Characterization Results of the Polymer Microsphere Dispersion System

The microscopic morphology and particle size distribution of the polymer microsphere dispersion system at different aging times were obtained using Zeiss SteREO Discovery V20 microscopy, and the results are shown in Figure 8. As can be seen, under the microscope, the polymer microspheres are in the shape of a sphere. The average sizes of the polymer microspheres after being aged for 1, 3, 5, and 7 days are 32.94 ± 9.7 μm, 39.80 ± 12.24 μm, 47.83 ± 13.58 μm and 53.52 ± 14.18 μm, respectively. It is easy to infer that the microsphere size has increased by 2.7 times after being aged for 7 days under the reservoir temperature of 90 °C. This is ascribed to the fact that brine entered the 3D internal network structure of the microsphere (Figure 9) during the aging process.
Consequently, the apparent viscosity of the polymer microsphere dispersion system increases with time, as displayed in Figure 10. The swelling behavior of the polymer microsphere indicates good injectivity and in-depth conformance control ability. In other words, in the near-wellbore region, the polymer microspheres were not fully swelled yet and had a relatively small particle size. In addition, there is a high-pressure gradient near the wellbore. Therefore, these conditions promote the injection and further migration of the polymer microspheres into the deep formation. As polymer microspheres propagate in the formation, they swell and start plugging some small pore throats, thereby diverting the subsequently injected fluids.

3.2. Analysis of the Macro-Coreflood Test Results

In this study, macro-coreflooding tests were conducted on 3D heterogeneous rock samples to mimic the real reservoir formation. In this process, the pressure at the injections and the effluent volume at the producers were measured. In addition, with the collection of resistivity data using 108 electrodes, the oil saturation distributions on different cross-sections were obtained, as shown in Figure 11, Figure 12 and Figure 13. The oil recovery efficiency, water cut, and pressure response were obtained, as shown in Figure 14.
Figure 11 displays the water saturation distribution on the A-A’ cross-section. From Figure 11, it is obvious to conclude that: ① At the beginning, injected water entered the reservoir from the position slightly behind the center of the horizontal well. As injection continued, water invaded the upper, more permeable layer, spreading horizontally in the bottom, less permeable layer. As long as the water reached the upper-most layer, it swept the most permeable layer quickly, leaving the lower layers less swept. It is worthwhile to notice that the displacement front is more preferential to the heel of the producer, which could be attributed to the “heel-toe effect” of the horizontal well and has been proven by the actual MPLT (Memory Production Logging Tool) test results of several wells in the USH reservoirs. ② After water flooding, most of the remaining oil is distributed in the form of patches on both sides of the middle and lower layers, with less in the upper layer. ③ As the polymer microsphere was injected, the sweep efficiency of the rock sample increased significantly, which demonstrates the profile-control capability of our used polymer microspheres. After 1 PV of polymer microsphere was injected, the sweep efficiency stabilized. ④ The subsequent waterflooding reduced the remaining oil saturation further until the cumulative water injection reached 1PV.
Figure 12 displays the water saturation distribution on the B-B’ cross-section. In the waterflooding process, the water displacement front advanced from the bottom to the top layer, targeting the producers. The water-sweeping zone is displayed in an inversed trapezoid shape, which is ascribed to the “inverse rhythm” deposition of the reservoir layers. The following polymer microsphere injection and subsequent water-flooding decreased the residual oil saturation further.
Figure 13 displays the oil saturation distribution in the four layers from the top view. It is obvious to reach the following conclusions, combined with Figure 14.
① In the waterflooding stage, water was injected from the bottom layer and propagated to the upper layers. After 0.4 PV of water was injected, the displacement front reached the producers in the top layer. When the cumulative injection volume reached 2.5 PV, the preferential flow paths, i.e., from injectors to producers, from low permeable layers to high permeable layers, had formed. The sweep efficiencies on the edges of the core sample and the lower layers are relatively poor. From Figure 14, it is easy to see after 2.5 PV of water injection, both the pressure response and the fluid production stabilized, which is consistent with the results shown in Figure 13. A close examination of Figure 14 demonstrates that after water was injected for 2.5 PV, the oil recovery factor in both producers reached 22.5%, and the water cut reached 99.4%. It’s worthwhile to point out that the response of the two producers is quite similar because the lateral heterogeneity was not considered in our artificial rock model.
② After the polymer microspheres were injected, Figure 13 displays the obvious enlargement of the swept areas on all four layers. It is of great significance to see the evident increase in the sweeping efficiency of the low layers, which indicates the strong fluid-diverting capability of the polymer microsphere. Figure 14 demonstrates that after 1.0 PV of polymer microspheres were injected, the pressure response and the fluid production stabilized. The pressure rose sharply due to polymer microsphere injection and then reached a plateau after 1.0 PV. The oil recovery factor of both producers has increased from 22.5% to 27.5%; the water cut decreased from 99.4% to 72.5%.
③ In the subsequent waterflooding, the injected water displaced both the polymer microspheres and the oil. The oil saturation map of Figure 13 shows that slightly higher sweep efficiency was achieved at the top two layers. This phenomenon indicates that the injected water is able to displace the polymer microspheres in the high permeability layers; thereafter, a new water-flowing path was formed. Figure 14 shows more quantitative results. After the subsequent waterflooding was initiated, the water cut rose sharply, i.e., from 72.5% to 99.5%. The oil recovery factor increased slightly from 27.5% to 28.1%. The pressure at the injectors declined but was still higher than the one at the first stage waterflood, which indicates the polymer microsphere has built a residual resistance in the rock sample. The subsequent waterflood stabilized after 1 PV. However, most changes in the pressure and saturation occurred in the first 0.3 PV of water injection.

3.3. Analysis of the Micro-Model Test Results

The test results performed on the calcite micro-model are displayed in Figure 15. As can be seen, the waterflooding process can be divided into three stages. ① The early stage (0~2.5 PV): Due to the high K v K h ratio, the placement of the producer at the bottom layer and the injector at the top layer, the injected water mainly propagated along two pathways, i.e., the upward pathway I and the forward pathway II (Figure 15a–d). Thereby, the overall displacement front displays like a “1/4 circle arc”. ② The intermediate stage (2.5~5.0 PV): At this stage, as shown in Figure 15e,f, pathway I has reached the high-permeable top layer. Subsequently, water propagated quickly along the top layer. With respect to pathway II, when water approximated the location below the producer, water flowed towards the producer quickly. Thereby, there is a significant amount of remaining oil located in the middle-upper layer (Figure 15f). ③ The late stage (5.0~10.0 PV): At this stage, as shown in Figure 15g,h, water mainly flowed along the newly-directed pathways I and II; thereby, the sweep efficiency declined sharply.
When polymer microspheres were injected into the reservoir, as displayed in Figure 15i–l, the swept areas were enlarged significantly, i.e., from 86.32% to 99.15% (as shown in Table 2), which proves the diverting ability of the polymer microspheres. In the chase water drive, 14PV of water was injected (Figure 15m–p), and only marginal oil recovery was improved, i.e., from 99.15% to 99.26%Further examination of the results reveals that polymer microspheres also improve the microscopic displacement efficiency. According to the morphology of the residual oil, the residual oil is classified into connected residual oil, residual oil in the form of droplets, and residual oil in the form of oil film, as displayed in Figure 16. Table 2 quantifies the amount of different forms of residual oil at various stages. From Figure 16 and Table 2, it is obvious that: ① at the end of the water drive, connected residual oil occupies 68.04%, and droplet residual oil takes 30.28%; ② meanwhile, after the polymer microspheres were injected for 16 PV, most residual oils are in the form of individual droplets (50.23%) and oil films (12.95). This phenomenon is attributed to the fact that if the PM is a suitable size and enters a pore space, the PM could squeeze more oil out of the pore space compared with water. Therefore, it is easy to summarize that the PM can enhance the oil recovery not only by improving the sweep efficiency but also the microscopic displacement efficiency.

4. Pilot Test

A pilot test of polymer microsphere flooding has been performed with a 2-injection and 3-production well pattern at the field site. The injection wells have undergone a total of 347 days of injection, which is further divided into four stages. As more detailed information is displayed in Table 3, a total amount of 86 tons of polymer microsphere have been injected with an average concentration of 1300 ppm. Consequently, more than 40,000 bbls of oil increase was observed in the produces, accompanied by obvious water reduction. A close examination of the results in Table 3 demonstrates that the oil increase and the water cut decrease vary for different producers, i.e., Producer DM-01 received higher benefits from the PM treatment compared with Producers DM-04 and DM-07. It is easy to infer that compared to the laboratory study, there is stronger heterogeneity and complexity both laterally and vertically. Therefore, the response for different wells varies if compared with the laboratory results. In addition, as more detailed information was gained from the pilot testing, it was realized that the existence of natural fractures could not be ignored for some sections. Therefore, in a future study, a new type of polymer microsphere might need to be synthesized to meet the more complex conditions.

5. Conclusions

In this study, polymer microspheres are considered conformance control agents that reduce the water cut and increase the oil recovery. In this study, a multi-scale visualization study of the waterflooding and polymer microsphere flooding process was conducted. The following key points are pinpointed.
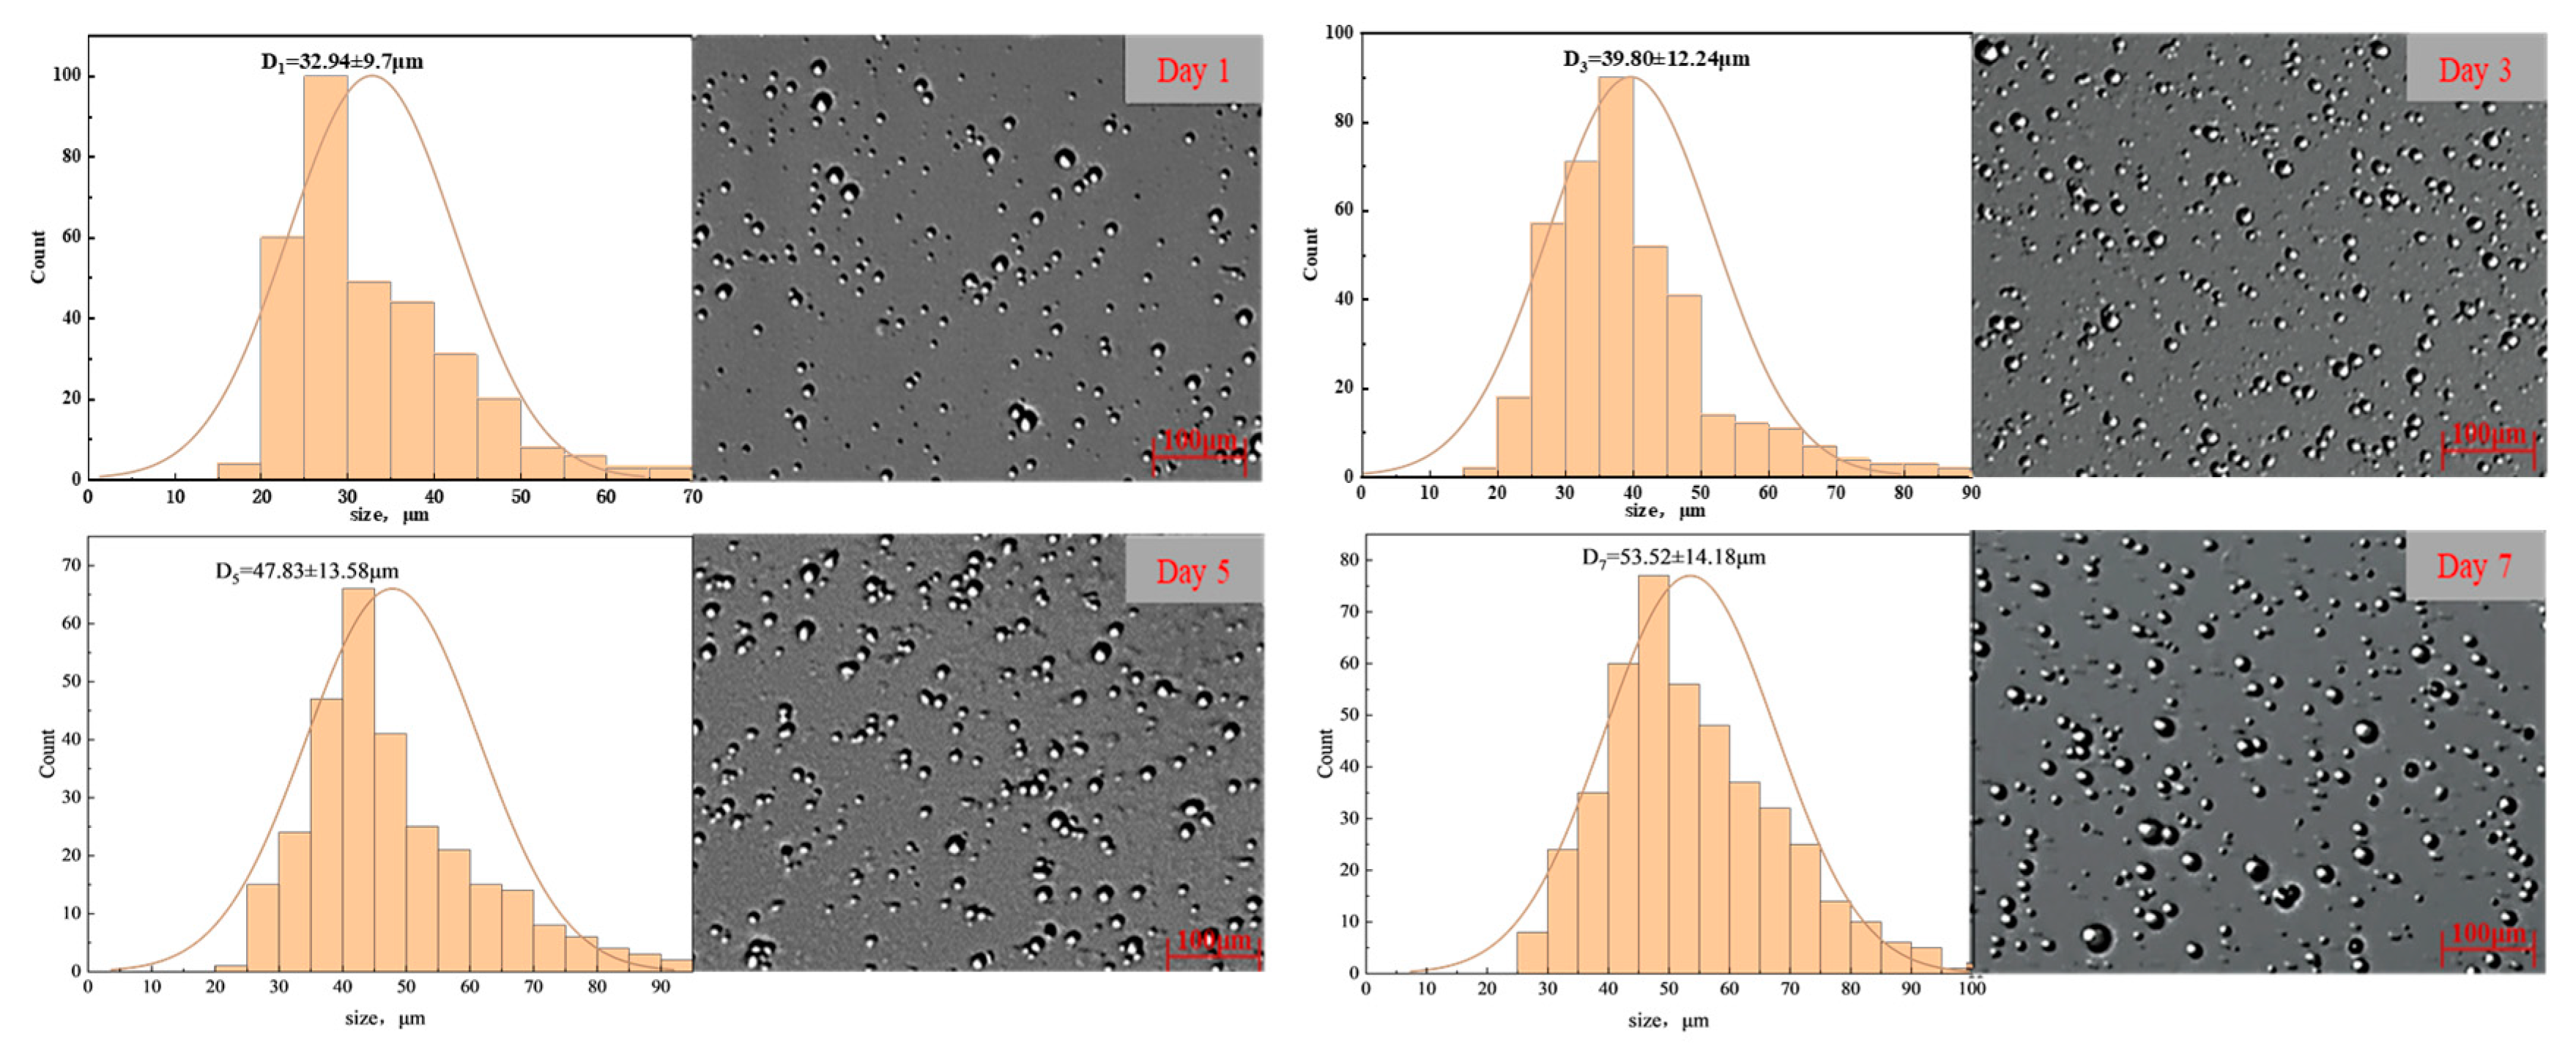
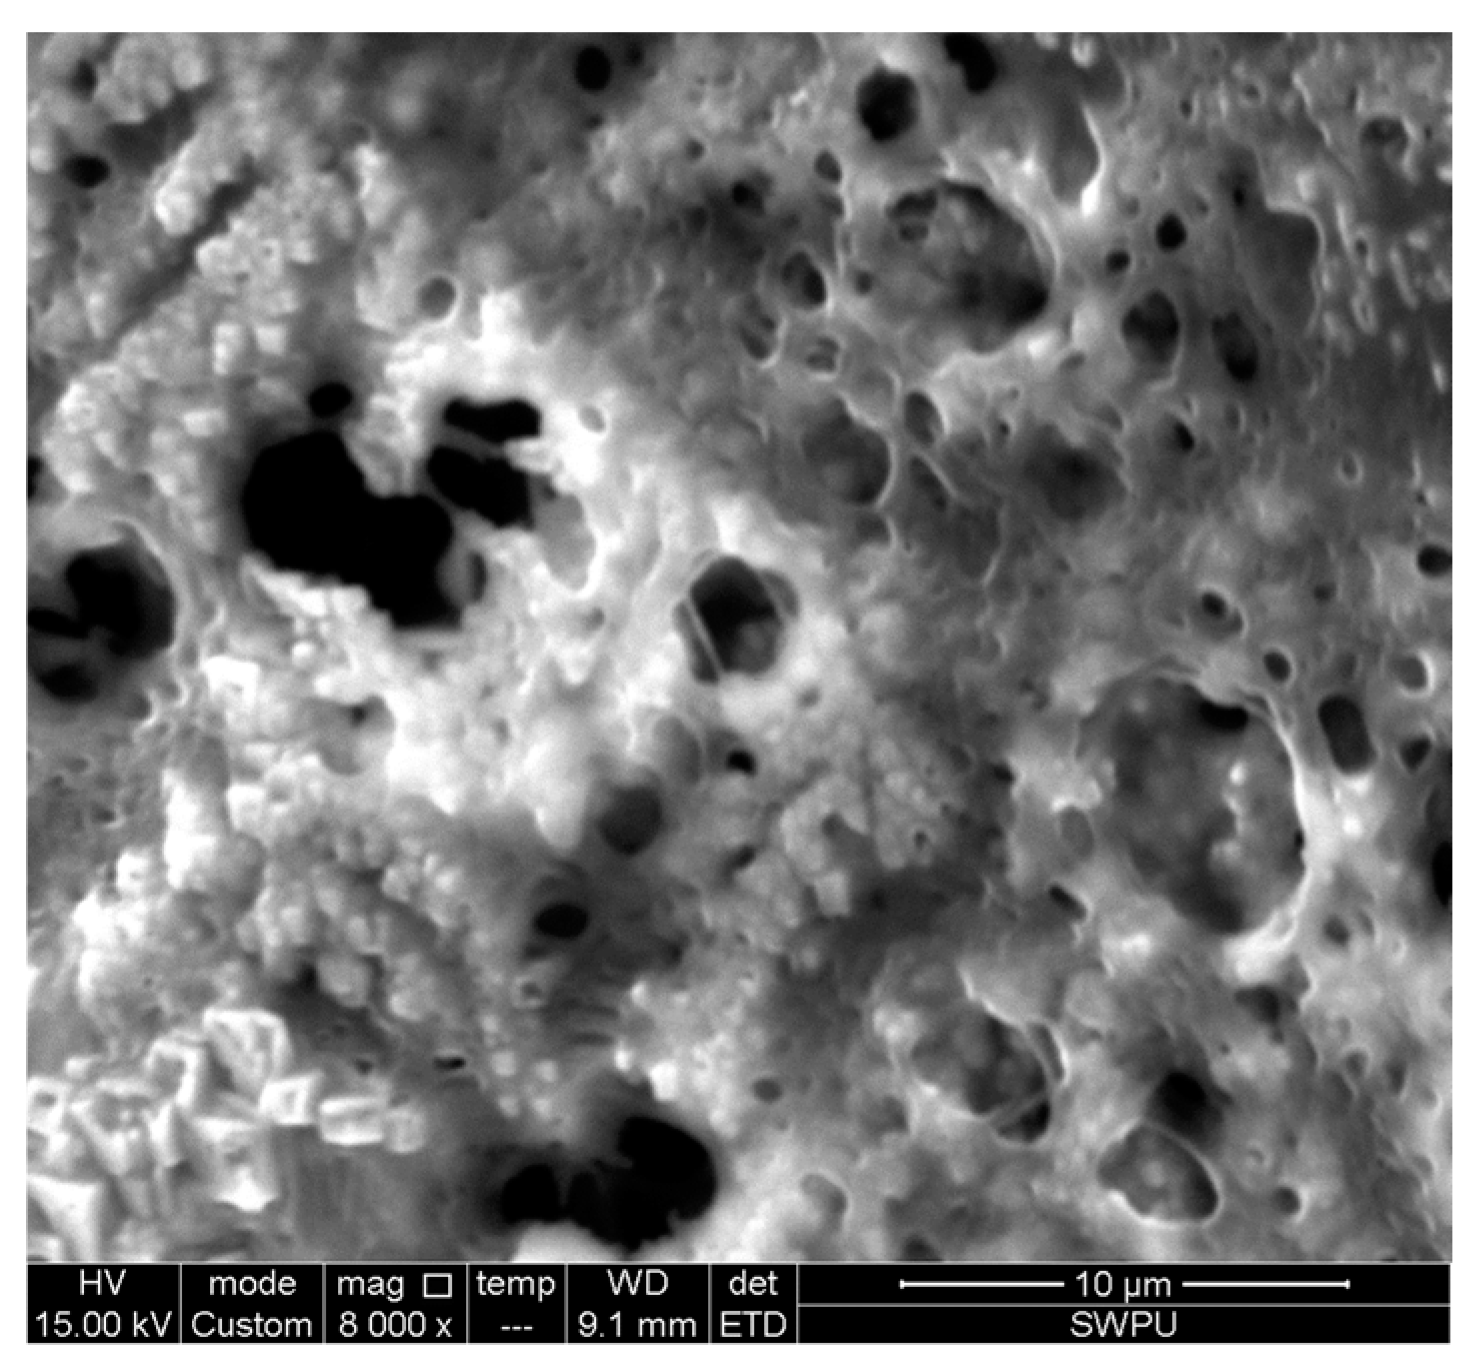
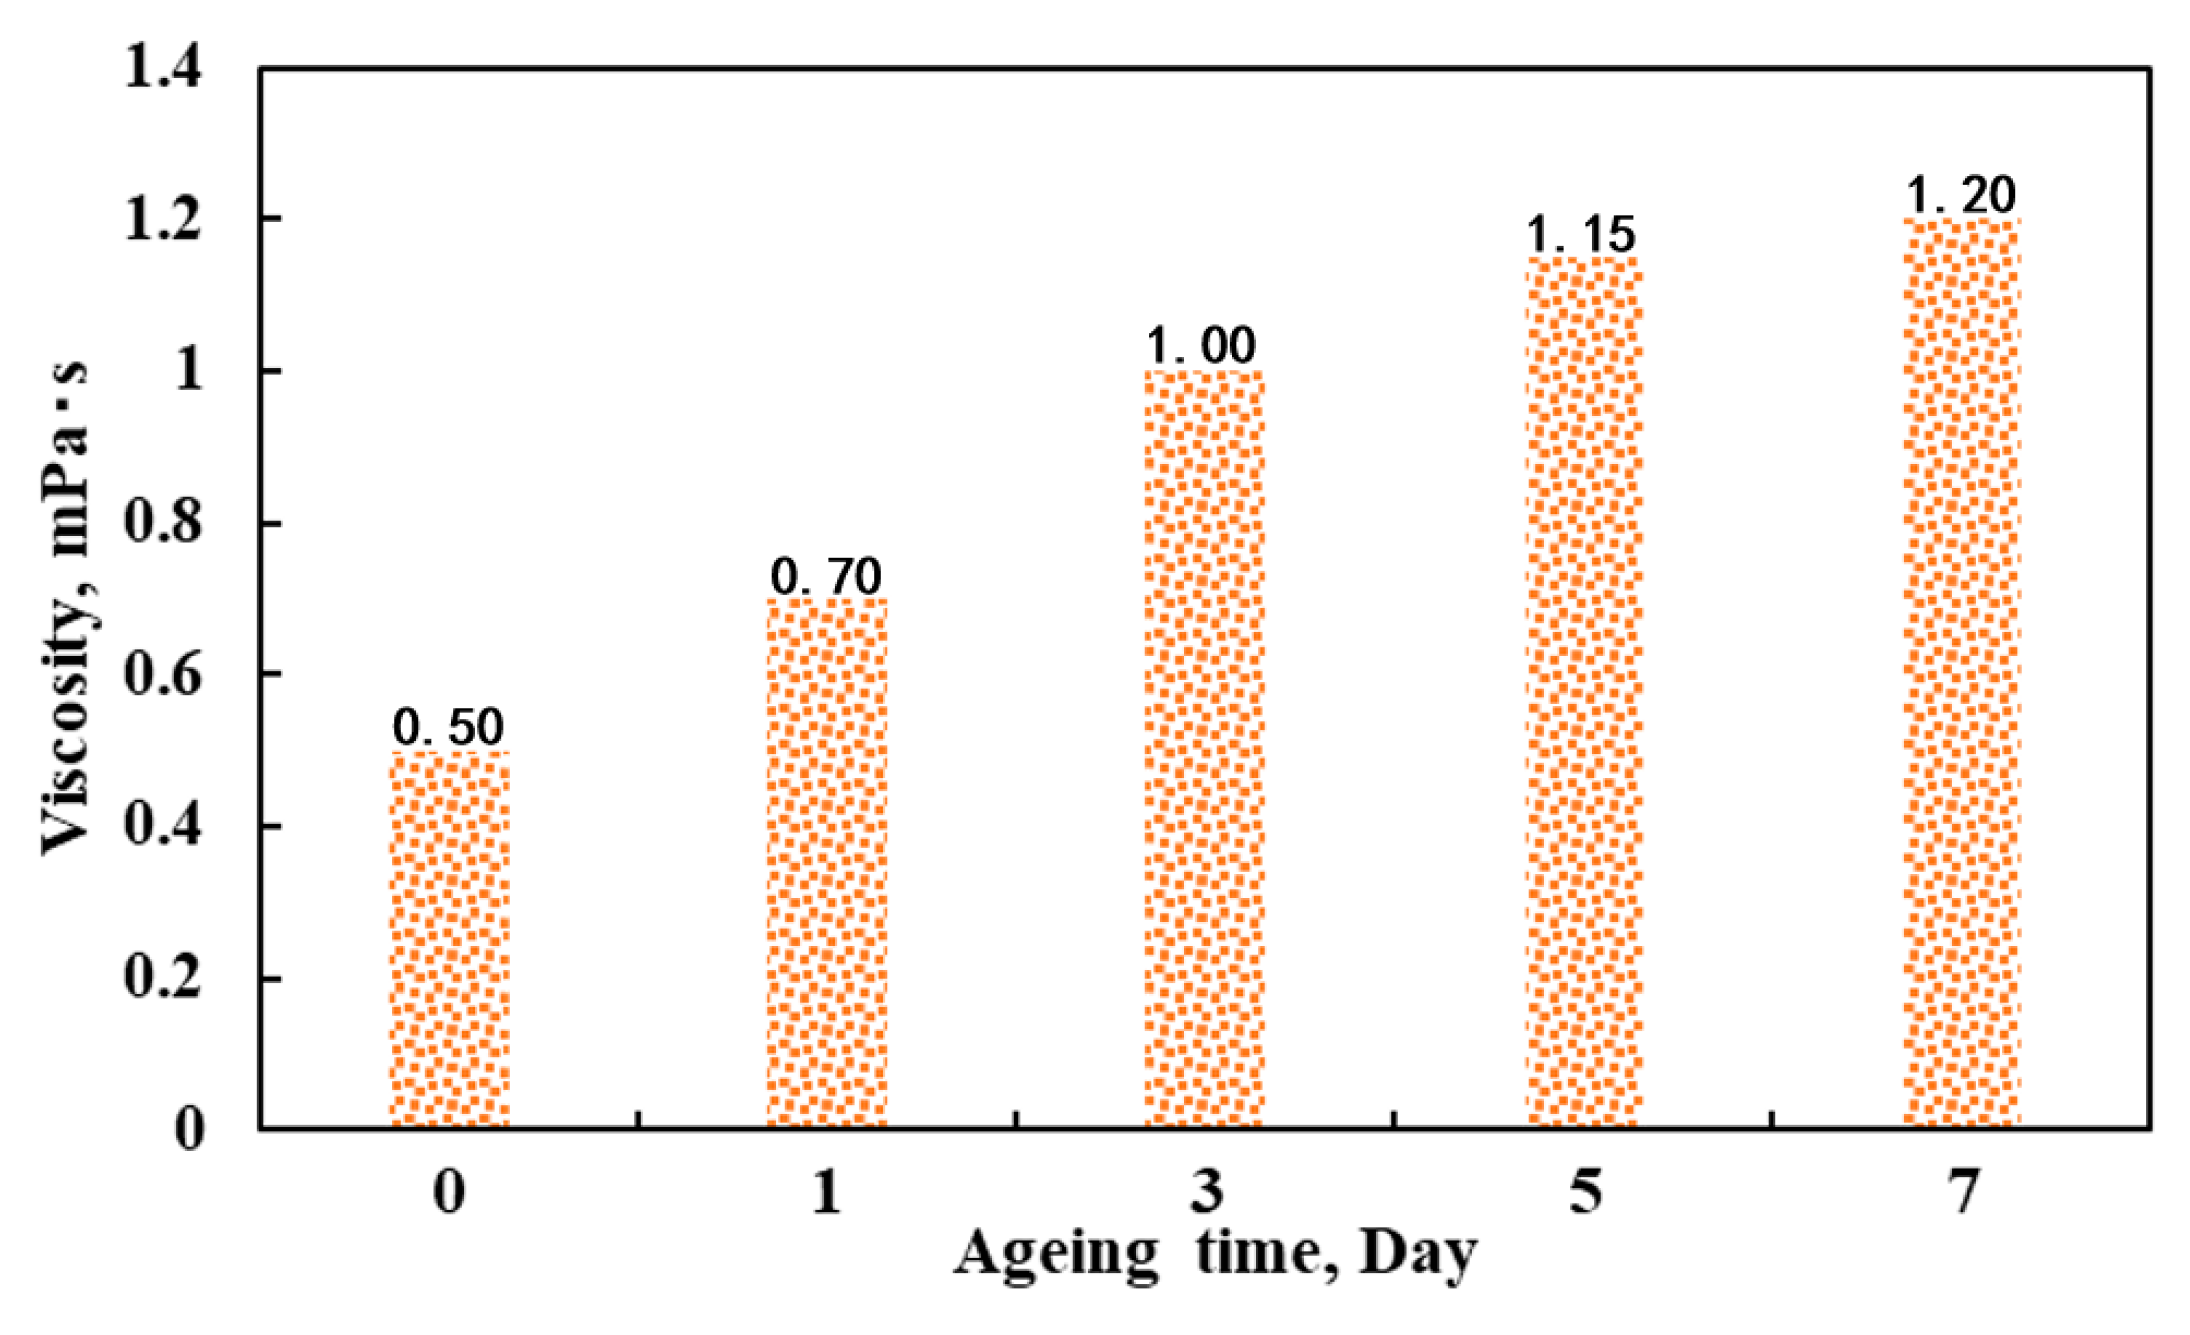
A comprehensive characterization of our used polymer microsphere was accomplished. It was revealed that the polymer microsphere has a spherical shape in the solution. The size of the polymer microsphere grew from 32.94 μm to 53.52 μm after being aged for 7 days. The apparent viscosity of the polymer microsphere dispersion also increases with time from 0.5 cP to 1.2 cP. These features indicate that the polymer microspheres are easy to inject at the wellbore with small particle size while swelling in the deep formation and function to block the preferential flowing path.
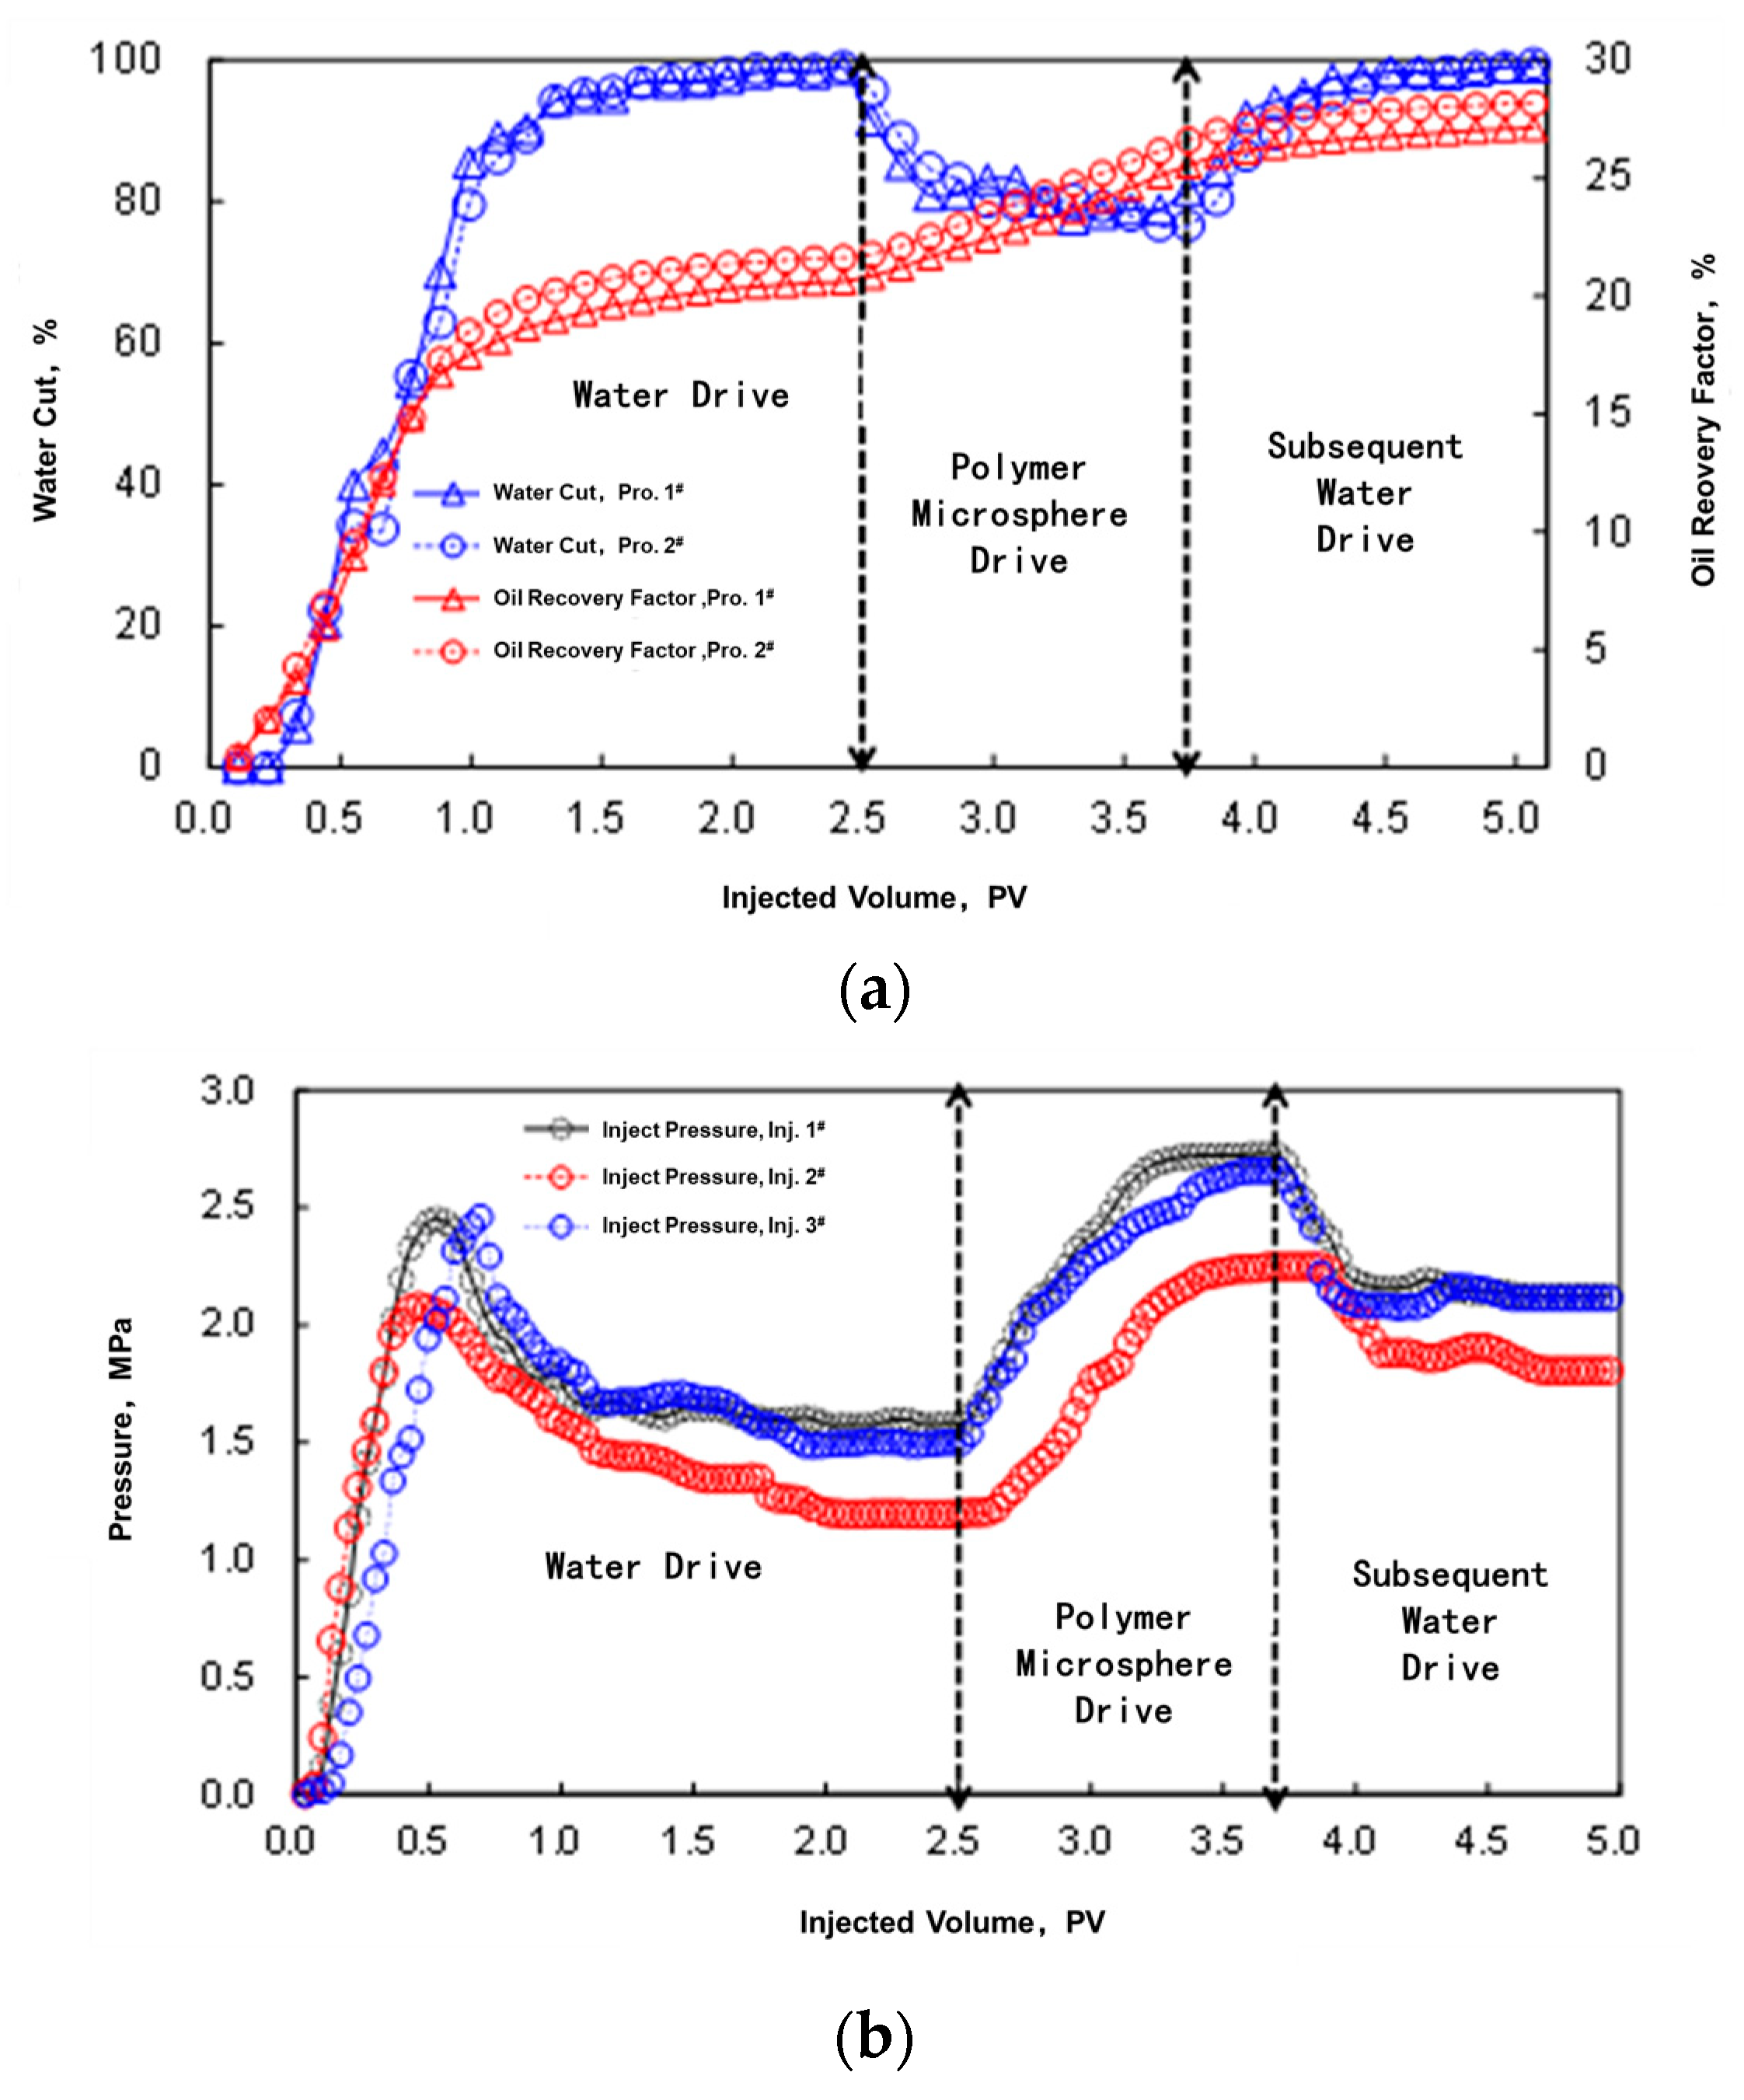
Macro-scale visualization results indicate that due to the inverse rhythm deposition feature of the reservoir, during the waterflooding process, the water invades the upper permeable layer quickly. When polymer microspheres were injected for 1.0 PV, the oil recovery factor of both producers increased from 22.5% to 27.5%; the water cut decreased from 99.4% to 72.5%. The subsequent waterflooding even further reduced the remaining oil saturation due to the diverted water flowing path.
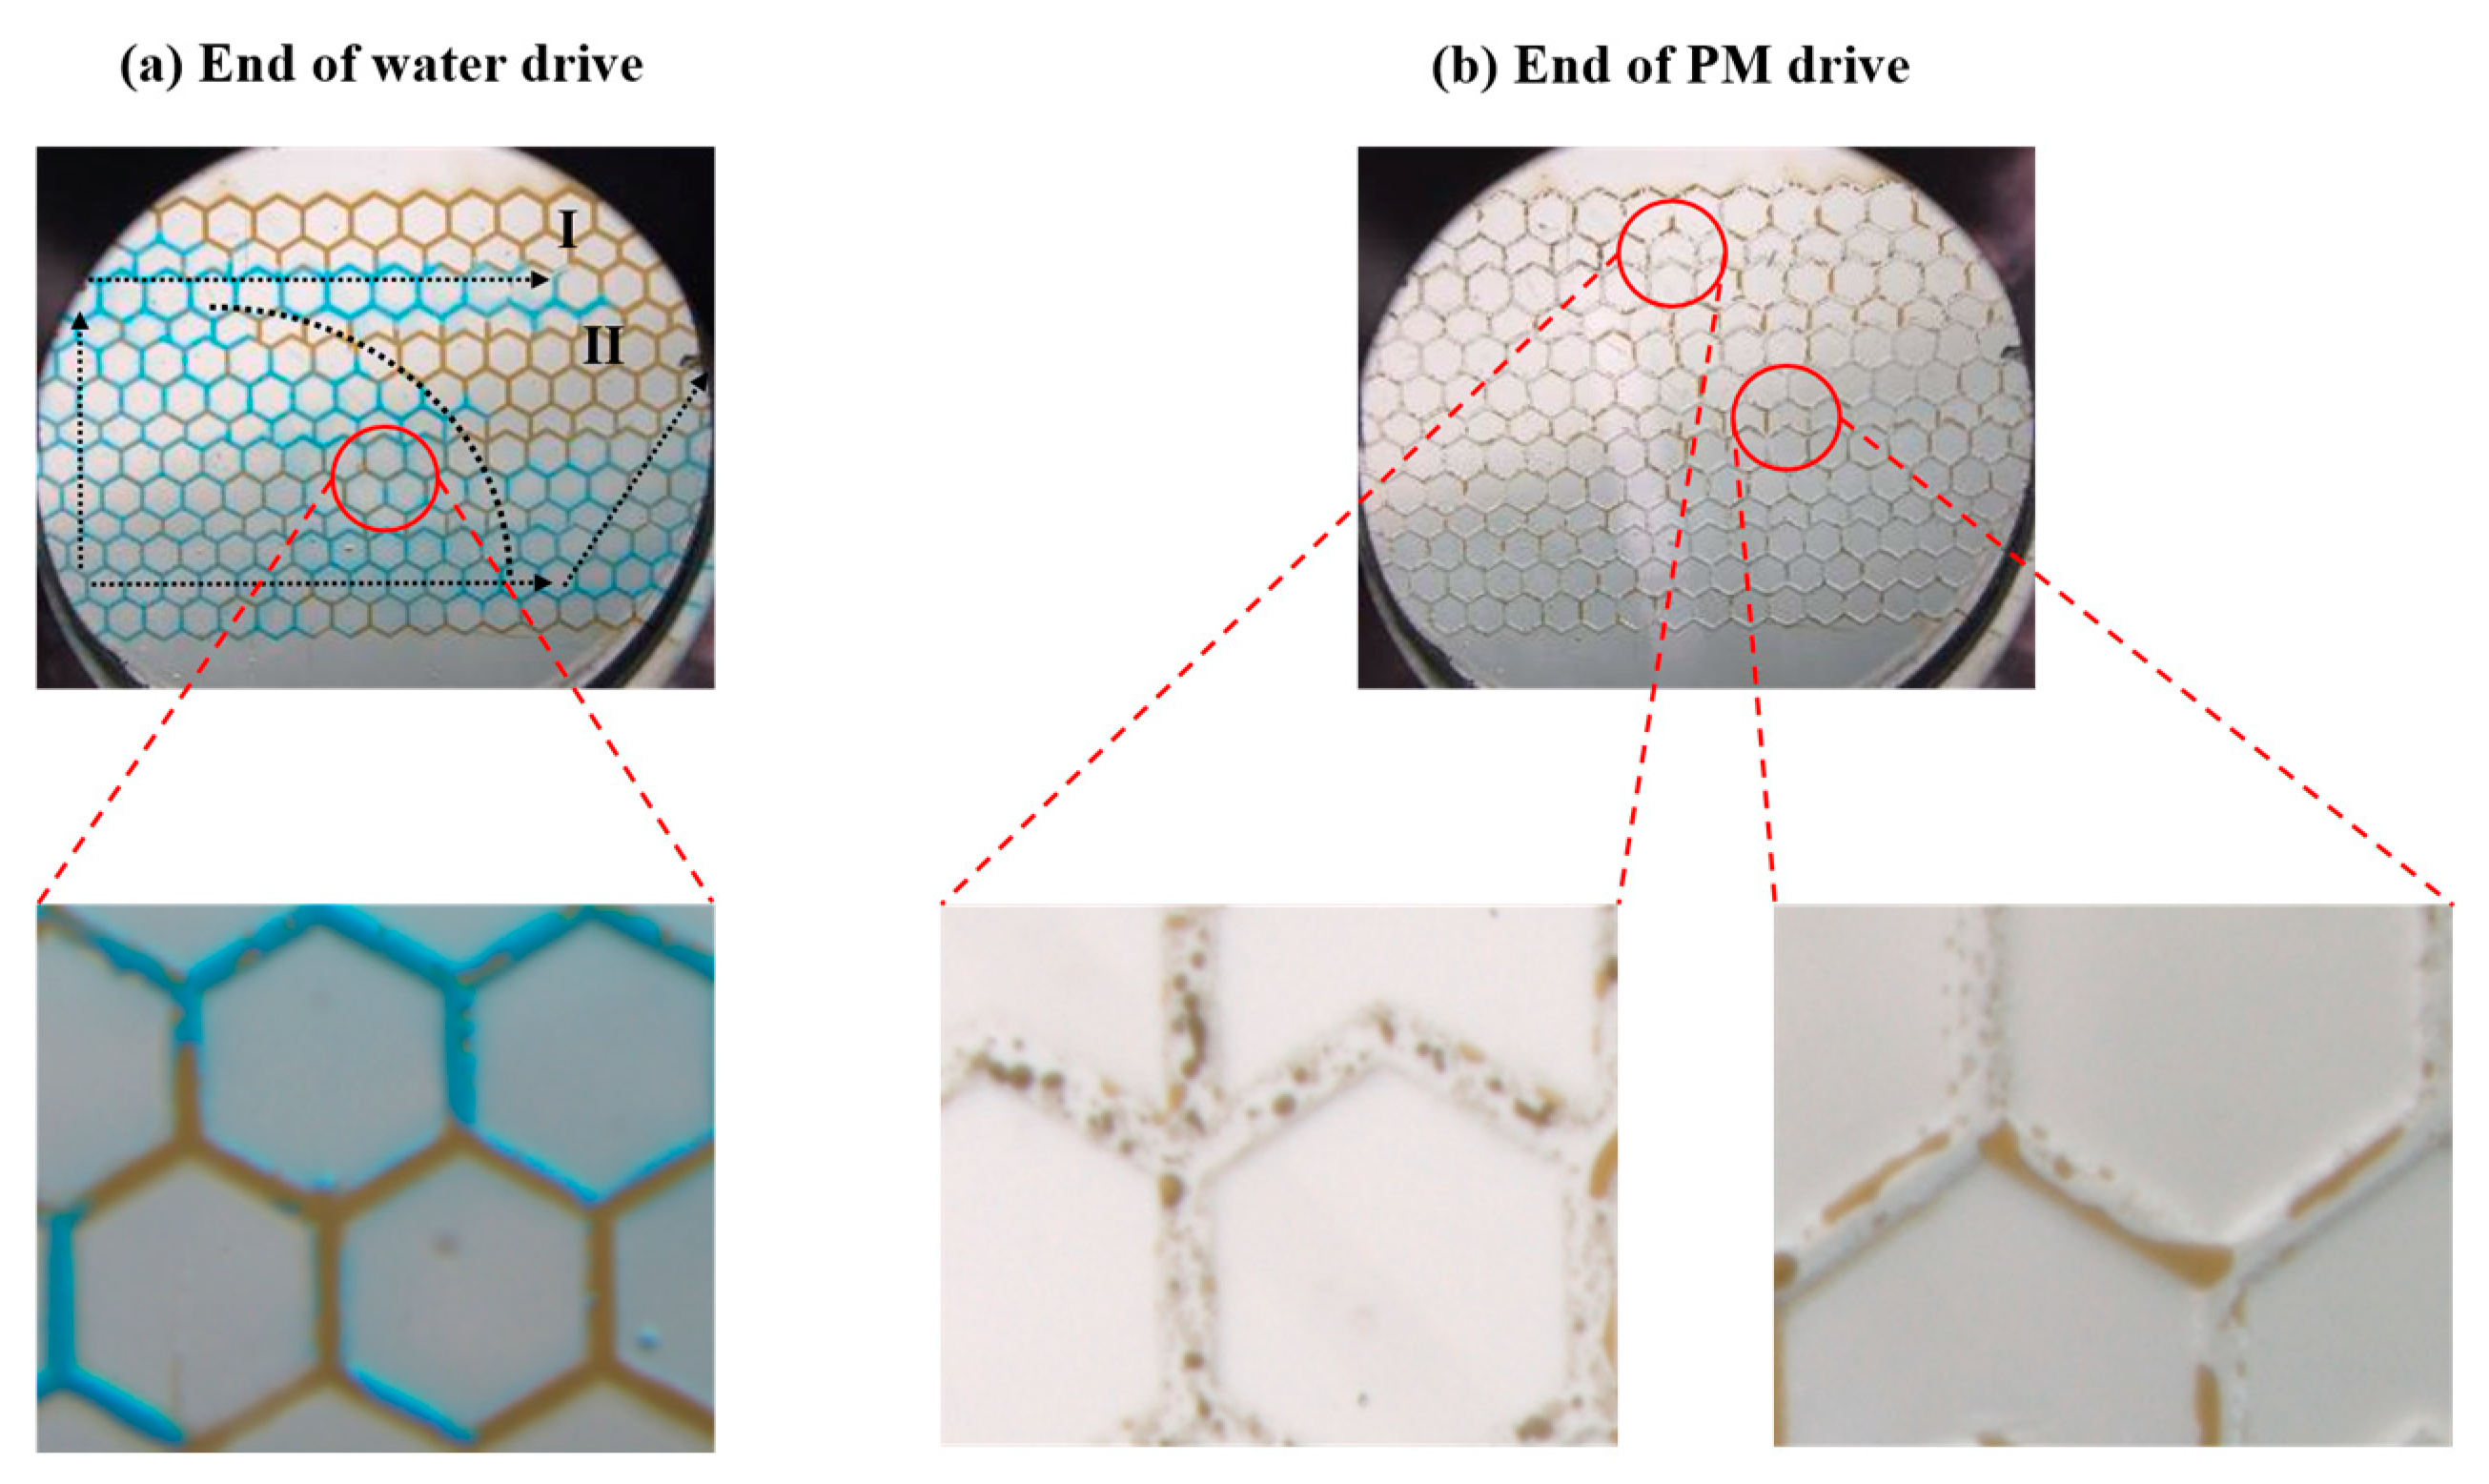
Micro-scale visualization using a calcite-etched micro-mode revealed that in the waterflooding process, the displacement front displays like a “1/4 circle arc”. The sweep efficiency was improved from 86.32% to 99.15% when polymer microspheres were injected. Furthermore, the connected residual oil was reduced from 68.04% to 36.82%, accompanied by increased dispersed oil droplets and oil film.
The pilot test with 2-injection and 3-production well pattern also proves the feasibility of conformance control by the polymer microspheres. A more than 40,000 bbls of oil increase was observed in the produces, accompanied by obvious water reduction.

Author Contributions

Methodology, Z.L.; Writing—original draft, L.C. and X.W.; Writing—review & editing, Y.X. and X.W.; Supervision, X.W.; Project administration, J.C. and G.C. All authors have read and agreed to the published version of the manuscript.

Funding

The financial support from The National Natural Science Foundation of China (Grant number 52104040), China National Petroleum Corporation (CNPC) (2023ZZ19 and CQ2024B-26-4-2) and the Sichuan Science & Technology Foundation (2023NSFSC0936 and 2023YFH0005).

Data Availability Statement

The original contributions presented in the study are included in the article, further inquiries can be directed to the corresponding author.

Conflicts of Interest

Authors Liang Cheng, Yang Xie, Jie Chen, Zhongming Luo and Guo Chen were employed by the company CNPC. The remaining authors declare that the research was conducted in the absence of any commercial or financial relationships that could be construed as a potential conflict of interest.

References

  1. Agency, I.E. World Energy Outlook; OECD/IEA: Paris, France, 2009; ISBN 926428205X. [Google Scholar]
  2. Nairn, A.; Alsharhan, A. Sedimentary Basins and Petroleum Geology of the Middle East; Elsevier: Amsterdam, The Netherlands, 1997; ISBN 008054083X. [Google Scholar]
  3. Ebrahimi, M.; Kovacs, Z.; Schneider, M.; Mund, P.; Bolduan, P.; Czermak, P. Multistage filtration process for efficient treatment of oil-field produced water using ceramic membranes. Desalination Water Treat. 2012, 42, 17–23. [Google Scholar] [CrossRef]
  4. Bailey, B.; Crabtree, M.; Tyrie, J.; Elphick, J.; Kuchuk, F.; Romano, C.; Roodhart, L. Water control. Oilfield Rev. 2000, 12, 30–51. [Google Scholar]
  5. Elsharafi, M.O.; Bai, B. Effect of weak preformed particle gel on unswept oil zones/areas during conformance control treatments. Ind. Eng. Chem. Res. 2012, 51, 11547–11554. [Google Scholar] [CrossRef]
  6. Glasbergen, G.; Abu-Shiekah, I.; Balushi, S.; Wunnik, J.V. Conformance control treatments for water and chemical flooding: Material screening and design. In Proceedings of the SPE EOR Conference at Oil and Gas West Asia, Muscat, Oman, 31 March–2 April 2014. [Google Scholar]
  7. Sydansk, R.D.; Southwell, G. More than 12 years’ experience with a successful conformance-control polymer-gel technology. SPE Prod. Facil. 2000, 15, 270–278. [Google Scholar] [CrossRef]
  8. Roussennac, B.; Toschi, C. Brightwater® Trial in Salema Field (Campos Basin, Brazil). In Proceedings of the SPE Europec featured at EAGE Conference and Exhibition, Barcelona, Spain, 14–17 June 2010. [Google Scholar]
  9. Abu-Shiekah, I.; Glasbergen, G.; Balushi, S.; Wunnik, J.V. Conformance control treatments for water and chemical flooding: Opportunity and risk evaluation. In Proceedings of the SPE EOR Conference at Oil and Gas West Asia, Muscat, Oman, 31 March–2 April 2014. [Google Scholar]
  10. Bjørsvik, M.; Høiland, H.; Skauge, A. Formation of colloidal dispersion gels from aqueous polyacrylamide solutions. Colloids Surf. A Physicochem. Eng. Asp. 2008, 317, 504–511. [Google Scholar] [CrossRef]
  11. Dupuis, G.; Al-Maamari, R.S.; Al-Hashmi, A.; Al-Sharji, H.H.; Zaitoun, A. Mechanical and thermal stability of polyacrylamide-based microgel products for EOR. In Proceedings of the SPE International Conference on Oilfield Chemistry, The Woodlands, TX, USA, 8–10 April 2013. [Google Scholar]
  12. Vasquez, J.; Eoff, L.; Dalrymple, D. Laboratory Evaluation of a Relative-Permeability Modifier for Profile Modification in Injection Wells. In Proceedings of the SPE Oklahoma City Oil and Gas Symposium/Production and Operations Symposium, Oklahoma City, OH, USA, 17–19 April 2023. [Google Scholar]
  13. Tian, Y.; Wang, L.; Tang, Y.; Liu, C.; Ma, C.; Wang, T. Research and application of nano polymer microspheres diversion technique of deep fluid. In Proceedings of the SPE International Oilfield Nanotechnology Conference and Exhibition, Noordwijk, The Netherlands, 12–14 June 2012. [Google Scholar]
  14. Shiran, B.S.; Skauge, A. Wettability and oil recovery by polymer and polymer particles. In Proceedings of the SPE Asia Pacific Enhanced Oil Recovery Conference, Kuala Lumpur, Malaysia, 11–13 August 2015. [Google Scholar]
  15. Wang, L.; Zhang, G.; Ge, J.-J.; Li, G.; Zhang, J.; Ding, B. Preparation of microgel nanospheres and their application in EOR. In Proceedings of the SPE International Oil and Gas Conference and Exhibition in China, Beijing, China, 8–10 June 2010. [Google Scholar]
  16. Yao, C.; Lei, G.; Li, L.; Gao, X. Preparation and characterization of polyacrylamide nanomicrospheres and its profile control and flooding performance. J. Appl. Polym. Sci. 2013, 127, 3910–3915. [Google Scholar] [CrossRef]
  17. Yao, C.; Lei, G.; Li, L.; Gao, X. Selectivity of pore-scale elastic microspheres as a novel profile control and oil displacement agent. Energy Fuels 2012, 26, 5092–5101. [Google Scholar] [CrossRef]
  18. Goudarzi, A.; Almohsin, A.; Varavei, A.; Delshad, M.; Bai, B.; Sepehrnoori, K. New experiments and models for conformance control microgels. In Proceedings of the SPE Improved Oil Recovery Conference, Tulsa, OH, USA, 12–16 April 2014. [Google Scholar]
  19. Hua, Z.; Lin, M.; Dong, Z.; Li, M.; Zhang, G.; Yang, J. Study of deep profile control and oil displacement technologies with nanoscale polymer microspheres. J. Colloid Interface Sci. 2014, 424, 67–74. [Google Scholar] [CrossRef] [PubMed]
  20. Lenchenkov, N.S.; Slob, M.; Van Dalen, E.; Glasbergen, G.; Van Kruijsdijk, C. Oil recovery from outcrop cores with polymeric nano-spheres. In Proceedings of the SPE Improved Oil Recovery Conference, Tulsa, OH, USA, 13 April 2016. [Google Scholar]
  21. Andrianov, A.; Wang, Y.; Busaidi, K.; Kindi, Z.; Naabi, A.; Hasani, M.; Liu, E. Nanospheres Application for Conformance Control in Low-Permeability Carbonate Formation in Oman Block 5. In Proceedings of the Abu Dhabi International Petroleum Exhibition and Conference, Abu Dhabi, UAE, 2–5 October 2023. [Google Scholar]
  22. Jia, Y.; Yang, H.; Cheng, C.; Li, Z.; Hou, G.; Yuan, X.; Zhao, W.; Zhang, Z.; Liu, T. Field application and performance evaluation of polymer microsphere profile control in low permeability oil reservoir. In Proceedings of the Abu Dhabi International Petroleum Exhibition and Conference, Abu Dhabi, UAE, 14 November 2019. [Google Scholar]
  23. Zhao, H.; Wu, Z.; Zheng, X.; Lin, M.; Li, M. Preparation and performance research of water-soluble crosslinked polymer microspheres. Fine Chem. 2005, 22, 62–64. [Google Scholar] [CrossRef]
  24. Lei, G.; Zheng, J. Composing of pore-scale polymer microsphere and its application in improving oil recovery by profile control. J. China Univ. Pet. 2007, 31, 87–90. [Google Scholar]
  25. Liu, C.; Liao, X.; Zhang, Y.; Chang, M.-M.; Mu, C.; Li, T.; Qin, R.; Fu, R.; Bie, X.; Zheng, J. Field application of polymer microspheres flooding: A pilot test in offshore heavy oil reservoir. In Proceedings of the SPE Annual Technical Conference and Exhibition, San Antonio, TX, USA, 8–10 October 2012. [Google Scholar]
  26. Irvine, R.; Davidson, J.; Baker, M.; Devlin, R.; Park, H. Nano spherical polymer pilot in a mature 18 API sandstone reservoir water flood in Alberta, Canada. In Proceedings of the SPE Asia Pacific Enhanced Oil Recovery Conference, Kuala Lumpur, Malaysia, 11–13 August 2015. [Google Scholar]
  27. Wu, Y.-S.; Bai, B. Modeling particle gel propagation in porous media. In Proceedings of the SPE Annual Technical Conference and Exhibition, Denver, CO, USA, 21–24 September 2008. [Google Scholar]
  28. Feng, Q.; Zhang, G.; Yin, X.; Luan, Z. Numerical simulation of the blocking process of gelled particles in porous media with remaining polymers. Pet. Sci. 2009, 6, 284–288. [Google Scholar] [CrossRef]
  29. Wang, J.; Liu, H.; Wang, Z.; Xu, J.; Yuan, D. Numerical simulation of preformed particle gel flooding for enhancing oil recovery. J. Pet. Sci. Eng. 2013, 112, 248–257. [Google Scholar] [CrossRef]
  30. Wang, J.; Liu, H.Q.; Zhang, H.l.; Sepehrnoori, K. Simulation of deformable preformed particle gel propagation in porous media. AIChE J. 2017, 63, 4628–4641. [Google Scholar] [CrossRef]
  31. Bai, B.; Li, L.; Liu, Y.; Liu, H.; Wang, Z.; You, C. Preformed particle gel for conformance control: Factors affecting its properties and applications. SPE Reserv. Eval. Eng. 2007, 10, 415–422. [Google Scholar] [CrossRef]
  32. Bai, B.; Liu, Y.; Coste, J.-P.; Li, L. Preformed particle gel for conformance control: Transport mechanism through porous media. SPE Reserv. Eval. Eng. 2007, 10, 176–184. [Google Scholar] [CrossRef]
  33. Imqam, A.; Elue, H.; Muhammed, F.A.; Bai, B. Hydrochloric acid applications to improve particle gel conformance control treatment. In Proceedings of the SPE Nigeria Annual International Conference and Exhibition, Lagos, Nigeria, 5–7 August 2014. [Google Scholar]
  34. Wang, Z.; Bai, B.; Sun, X.; Wang, J. Effect of multiple factors on preformed particle gel placement, dehydration, and plugging performance in partially open fractures. Fuel 2019, 251, 73–81. [Google Scholar] [CrossRef]
  35. Pu, J.; Bai, B.; Alhuraishawy, A.; Schuman, T.; Chen, Y.; Sun, X. A recrosslinkable preformed particle gel for conformance control in heterogeneous reservoirs containing linear-flow features. SPE J. 2019, 24, 1714–1725. [Google Scholar] [CrossRef]
Figure 1. Illustration of the stratigraphic distribution and well-logging curves of the USH reservoir in D oilfield.
Energies 17 04597 g001
Figure 2. Illustration of the horizontal well deployment in the USH reservoir of D oilfield.
Energies 17 04597 g002
Figure 3. Artificial rock samples used in the macro-coreflooding tests: (a) picture of the real rock sample; (b) schematic of the layered structure of the rock sample and well placements.
Energies 17 04597 g003
Figure 4. Top view (Pro. 1# and Pro. 2# are two producers; Inj. 1#, Inj. 2# and Inj. 3# are three injecteors.) (a), cross-sectional view of A-A’ (b) and B-B’ (c) of the artificial rock sample.
Energies 17 04597 g004
Figure 5. Experimental setup of the macro-corefloods.
Energies 17 04597 g005
Figure 6. Schematic of the calcite-etched micromodel.
Energies 17 04597 g006
Figure 7. Setup of the displacement experiment.
Energies 17 04597 g007
Figure 8. Microscopic morphology and size distribution of the polymer microsphere dispersion system after being aged for different times.
Energies 17 04597 g008
Figure 9. SEM imaging of the 3D internal structure of the polymer microsphere.
Energies 17 04597 g009
Figure 10. Apparent viscosity of the polymer microsphere dispersion system under different aging times.
Energies 17 04597 g010
Figure 11. Oil saturation distribution variation on the A-A’ cross section in the process of macro-coreflooding.
Energies 17 04597 g011
Figure 12. Oil saturation distribution variation on the B-B’ cross section in the process of macro-coreflooding.
Energies 17 04597 g012
Figure 13. Oil saturation distribution variation on the four layers from top view in the process of macro-coreflooding.
Energies 17 04597 g013
Figure 14. Oil recovery factors and water cuts response of two producers (a); and injection pressure response of three injections in the process of macro-coreflooding (b).
Energies 17 04597 g014
Figure 15. Results of the micro-model displacement experiments.
Energies 17 04597 g015
Figure 16. Microscopic residual oil morphology at the end of the water drive and PM drive stage.
Energies 17 04597 g016
Table 1. Etched pore diameters of the micromodel.
Permeability (mD)12.510.07.55.02.5
Pore Diameter (μm)2.101.640.700.820.22
Table 2. Summary of the micro-model displacement experiments.
Displacement StageSweep Efficiency/%Connected Residual Oil/%Residual Oil in the Form of Droplets/%Residual Oil in the Form of Oil Film/%
Waterflood86.3268.0430.281.68
PM drive99.1536.8250.2312.95
Chase water drive99.2620.6661.8217.51
Table 3. Summary of the polymer microsphere flooding pilot test results in USH reservoir.
Injector DM-02 Injector DM-15
StageInjection DaysMicrosphere Concentration (ppm)Injection Rate
(bbl/d)
Injection Amount of Microspheres
(t)
Injection DaysMicrosphere
Concentration (ppm)
Injection Rate
(bbl/d)
Injection Amount of Microspheres
(t)
Stage 13123004503.6945200095010.05
Stage 292130082011.941451200130026.74
Stage 3628009505.5412980095011.52
Stage 4162100080014.022810008002.5
Total days347347
Producer DM-01Producer DM-04Producer DM-07
StageDaily oil increase(bbl/d)Daily oil increase(bbl/d)Daily oil increase(bbl/d)
Stage 15.70.00.0
Stage 234.414.40.0
Stage 316.58.00.0
Stage 465.753.318.0
Subsequent stages
(376 day)
48.82.635.2
Total oil increase
(Mbbl)
33.92.037.49
Total reduction in water cut (%)20.09.012.0
Disclaimer/Publisher’s Note: The statements, opinions and data contained in all publications are solely those of the individual author(s) and contributor(s) and not of MDPI and/or the editor(s). MDPI and/or the editor(s) disclaim responsibility for any injury to people or property resulting from any ideas, methods, instructions or products referred to in the content.

