Article

Life Cycle Assessment Comparison of Orchard Tractors Powered by Diesel and Hydrogen Fuel Cell

Department of Mechanical and Aerospace Engineering, Politecnico di Torino, Corso Duca degli Abruzzi, 24, 10129 Turin, Italy
*
Authors to whom correspondence should be addressed.
Energies 2024, 17(18), 4599; https://doi.org/10.3390/en17184599
Submission received: 17 August 2024 / Revised: 3 September 2024 / Accepted: 10 September 2024 / Published: 13 September 2024
(This article belongs to the Section A: Sustainable Energy)

Abstract

:
To reduce the impact of the agricultural sector on the environment, human health and resource depletion, several steps should be taken to develop innovative powertrain systems. The agricultural sector must be involved in this innovation, since diesel-powered tractors are an important source in terms of pollution. In this context, fuel-cell systems have gained importance, making them one of the possible substitutes due to their characteristics featuring almost zero local emissions, low refueling time and high efficiency. However, to effectively assess the sustainability of a fuel-cell tractor, a cradle-to-grave life cycle assessment, comprising production, use phase and end of life, must be performed. This article presents a comparative analysis, according to different impact categories, of the life cycle impacts of a traditional diesel-powered tractor and a fuel-cell hybrid tractor, designed considering operative requirements and functional constraints. The study was conducted according to the LCA technique (defined by ISO 14040 and ISO 14044 standards), combining secondary data, mainly derived from studies and reports available in the literature, with the use of the Ecoinvent 3.0 database. The results are presented according to ten different impact categories defined by ReCiPe 2016 v 1.03 at the midpoint level. The findings obtained showed that the fuel-cell tractor allows for a relevant reduction in all the considered categories. The highest-impact reduction, more than 92%, was obtained in the human toxicity non-carcinogenic category, while the lowest reduction, around 4.55%, was observed for the fossil fuel scarcity category, mainly due to the adoption of gray hydrogen which is produced from fossil fuels. As for the climate change category, the fuel-cell tractor showed a reduction of more than 34% in the life cycle impact. Finally, the authors also considered the case of green hydrogen produced using solar energy. In this case, further reductions in the impact on climate change and fossil fuel resource depletion were obtained. However, for the other impact categories, the results were worse compared to using gray hydrogen.

1. Introduction

Climate change mitigation and adaptation can be considered one of the most important challenges that humanity will face in the near future. Indeed, the effects of climate change are already revealing their potential on different levels: ecosystems, health and economy. The results are changes in biodiversity, species abundance and distribution [1], increasing extreme weather events [2] and human diseases [3]. For these reasons in 2016, 195 countries approved an international treaty, known as the Paris Climate Agreement [4], in order to reduce the risks linked to climate change effects. In this sense, most anthropogenic activities, from the primary to the tertiary sector, must be rethought in order to be compatible with the aims set by several political organizations. One of the best strategies identified to accomplish this duty is the shifting from a linear economy to a circular economy (CE) model. Indeed, CE well supports sustainability and green-economy concepts because it aims to maximize resource circularity and gives great importance to the end-of-life (EOL) phase of a product according to a zero-waste vision [5,6]. In this context, the agricultural sector is an important source of emissions, both directly produced during farming activities and indirectly produced due to other sources and processes [7]. The agricultural machinery industry is strongly involved in these dynamics, since the use of such vehicles implies the production of greenhouse gases, as a consequence of fuel combustion within the thermal engine [8]. In addition, agricultural vehicles also emit several pollutants such as NOx, unburnt hydrocarbons, particulate matter and so on. These pollutants have several negative effects both on the environment and human health. Taghizadeh-Hesary et al. [9] highlighted that CO2 and PM2.5 are major risk factors for lung cancer, with latent effects on the economy due to public health issues. Dai et al. [10] evaluated the possible effects of climate change, using regional climate models, on the Hanjang river basin, observing that significant changes will occur in terms of temperatures and extreme weather events. Since food production sustainability will be fundamental in the near future considering the current worldwide population growth trend [11], both tractor manufacturers and academics are developing new innovative solutions in order to improve vehicle efficiency and pursue sustainability purposes [12,13]. Thus, recently, more and more tractor manufacturers have developed vehicles equipped with alternative powertrains, such as hybrid or full-electric architectures, or started using new propellants such as hydrogen [14,15,16,17,18].
In this context, fuel-cell powertrains have gained attention due to their characteristics featuring zero local emissions, long mileage and fast refueling, which, combined with the high energy density of hydrogen, make them a promising alternative to traditional powertrains for heavy-duty vehicles.
Di Ilio et al. [19] investigated the possibility of adopting a fuel-cell/battery hybrid powertrain for a heavy-duty yard truck used for operations in ports, showing promising results in terms of energy performance. Ahluwalia et al. [20] analyzed the cost competitiveness of agricultural vehicles powered by different fuel cells, observing that in some cases, they are already competitive with their traditional diesel counterparts in terms of the total cost of ownership. Pardhi et al. [21] performed a comprehensive review of the main technical features and opportunities of adopting fuel-cell powertrains for long-haul heavy-duty vehicles, showing that, thanks to a longer range, fast refueling and higher payload capacity, fuel-cell alternatives have a higher technical potential for substituting traditional systems with respect to battery electric trucks. Nevertheless, from a technical point of view, there are still some barriers, in particular durability issues, that are preventing the large-scale adoption of fuel-cell systems for vehicular applications, and thus, noticeable efforts are performed by the scientific community to analyze and overcome these limitations [22,23].
In the literature, several studies investigated the benefits and drawbacks of adopting fuel-cell powertrains for passenger cars and buses [24,25,26], demonstrating that, depending on the hydrogen production method, they can effectively reduce the environmental impact of the transport sector. Indeed, according to [27], hydrogen from electrolysis powered with renewables has an associated global warming potential per kilogram that can be ten times lower with respect to hydrogen produced from steam methane reforming. However, off-road vehicles, such as agricultural tractors, are characterized by different operative requirements, work scenarios and design constraints [28], and thus, a dedicated analysis must be performed. Indeed, these vehicles are characterized by different constraints and requirements, and their typical work scenarios are completely different from those of a passenger car. To the authors’ knowledge, most of the literature focuses on the design stage or energy management optimization of fuel-cell-powered agricultural tractors [29,30,31], while a complete evaluation of their environmental impact on the complete life cycle is, at present, missing. As a consequence, there is a lack of knowledge about the effectiveness of reducing the impact of agricultural practices on the environment, human health and resource depletion by substituting the traditional diesel-powered tractors with the fuel-cell-powered counterparts. Among the different techniques that can be used to assess the environmental impact of a product or a service, life cycle assessment (LCA) methodology was adopted, because it is a standardized methodology, defined by ISO 14040 [32] and ISO 14044 [33] standards, and its results are presented according to well-defined impact categories [34]. In this way, the analysis is more robust and easier to understand, avoiding possible misleading results.
In this study, the impact, according to different impact categories comprising the effects on the environment, human health and resource depletion, of the entire life cycle of an orchard tractor equipped with a hydrogen fuel cell was evaluated and compared with its traditional counterpart. The main goal of the study is to determine and quantify the benefits of the implementation of fuel-cell systems to propel agricultural tractors and their effects on the overall sector-related impacts. The study presented stands in continuity with other similar works already developed by the authors [35,36], which investigated the carbon footprint of ICE and hybrid-electric orchard tractors, in order to understand the bottlenecks of different kinds of powertrains in terms of environmental impact. The assessment was conducted by combining secondary data, available in the literature, and the use of the Ecoinvent v 3.0 database (cut-off system model). The paper is divided into four parts: after a brief introduction of the two case studies, the boundaries, the functional unit (FU) and the goal and scope of the analysis are defined. Then, a life cycle inventory (LCI) is described for each stage (production, service life and EOL) of the life cycle of the vehicles. The results according to “gate-to-gate” and “cradle-to-grave” approaches are presented, and, lastly, the case using green hydrogen is introduced and compared to diesel and gray hydrogen.

2. Materials and Methods

This study was conducted using LCA methodology, as described in ISO 14040 and ISO 14044 standard series [32,33]. According to this technique, the analysis is structured in four sections:
  • Goal and scope definition.
  • Life cycle inventory (LCI) description.
  • Impact assessment (LCA results).
  • Analysis of results and discussion.
It is important to underline that the purpose of this kind of study is to supply a global vision of very intricate and large assets and to provide possible solutions. Hence, final users have to manage it as a support tool during the design-making phase or, for example, to make the appropriate considerations regarding disposal scenarios.

2.1. Goal and Scope, System Boundaries and Functional Unit

The assessment proposed in this paper aims to make a comparison between two orchard tractors equipped with two different powertrains. The first one is a diesel internal combustion engine tractor (ICET), representing the traditional vehicle currently used, whereas the second one is a fuel-cell hybrid electric tractor (FCHET). Both tractors are considered to operate in Europe. Orchard tractors have a central role in European agriculture: indeed, orchards and vineyard cultivation represent one of the fastest-growing businesses in the last years in terms of both hectares and tractor selling intended for this kind of farming activity [37,38]. Furthermore, its main features, such as compactness, handling, etc., make orchard tractors one of the most versatile working vehicles currently present on the market.
For these reasons, the research activity performed by the authors could be addressed to a diversified audience:
  • Tractor manufacturers to help them during the design process.
  • Environmental impact specialists and researchers.
  • Institutional agencies to help them during the regulation-making process.
As said previously, the study focuses on orchard-specialized tractors. This kind of agricultural tractor presents some common features like small-medium power (up to 90 kW), a compact shape and the ability to operate in tough environments characterized by tight and high-slope paths. The assessment activity is based on the comparison between an ICET and an FCHET of the same power size. The architectures of both tractors are shown in Figure 1. From a technical point of view, a hybrid configuration with a battery pack as a secondary power source was selected since it can enhance the fuel-cell system’s durability, avoiding excessive output power fluctuations in the FC system. Indeed, the battery pack has enough energy capacity to handle the dynamic part of the external load for a sufficient time. Therefore, in this configuration, the FC system should manage the average power demand, while the battery pack should handle the power oscillations that are common during typical orchard tractor work scenarios [16,39]. The PEMFC type was selected for the powertrain since it is the most promising fuel-cell technology for vehicular applications due to its compactness, low operating temperature, durability and efficiency.
The ICET driveline (Figure 1a) is the most common for this kind of vehicle: the power developed by the thermal unit is directly provided to the driveshaft, which then delivers power to the gearbox and tires for motion, PTO and hydraulics for implements and auxiliary services.
The powertrain for the fuel-cell hybrid electric tractor (FCHET) considered in this work (Figure 1b) is composed of a primary energy source, namely a polymer-electrolyte membrane fuel cell (PEMFC) stack, and a secondary energy source, a Li-ion battery pack. They provide the electric energy to the electric motor, which then delivers power to the same loads of the ICET. For simplicity, in Figure 1b, the BoP of the fuel-cell system is not represented. The proposed architecture was presented in a previous study of the research group and was designed considering the on-board space availability constraints deriving from the operative requirements of orchard tractors [40]. Apart from the different components of the powertrain system, the other parts of the vehicle were assumed to be the same as the traditional vehicle. In Figure 2, the boundaries of the system are shown.
The system considers only orchard tractors, which means that all the implements used during the service life of the tractor are not considered. Furthermore, from Figure 2, it is possible to observe that the life cycle of each tractor can be subdivided into 3 main stages:
  • Production phase: every step from raw material extraction to the final assembly to obtain one ICET and one FCHET is considered.
  • Use phase: this stage considers the service life of the tractor which is constituted by two essential elements, namely propellant consumption and ordinary maintenance.
  • End-of-life phase: once the service life ends, both tractors undergo a series of disposal and waste treatments in order to avoid raw materials and energy production from primary sources.
Concerning the FU, it was set to 1 kgvehicle−1 year−1 (shortened 1 kgv−1 y−1). The use of weight models based on product mass is very useful to permit the reuse of the model data for research purposes. The temporal reference, which allows the enlargement of the audience who can be interested in this research field [35,41], is related to the supposed operational life of the vehicle and was set equal to 10 years.

2.2. LCI Production Phase

Production-phase LCI consists of the data collection of all material and energy flows linked to the manufacturing of the product system. In this study, data collection by component was conducted in order to understand the composition of both orchard tractors and better detect any bottlenecks depending on the specific impact category considered.
Thus, all the main components of an orchard tractor were split into 5 groups, called “sub-assemblies”:
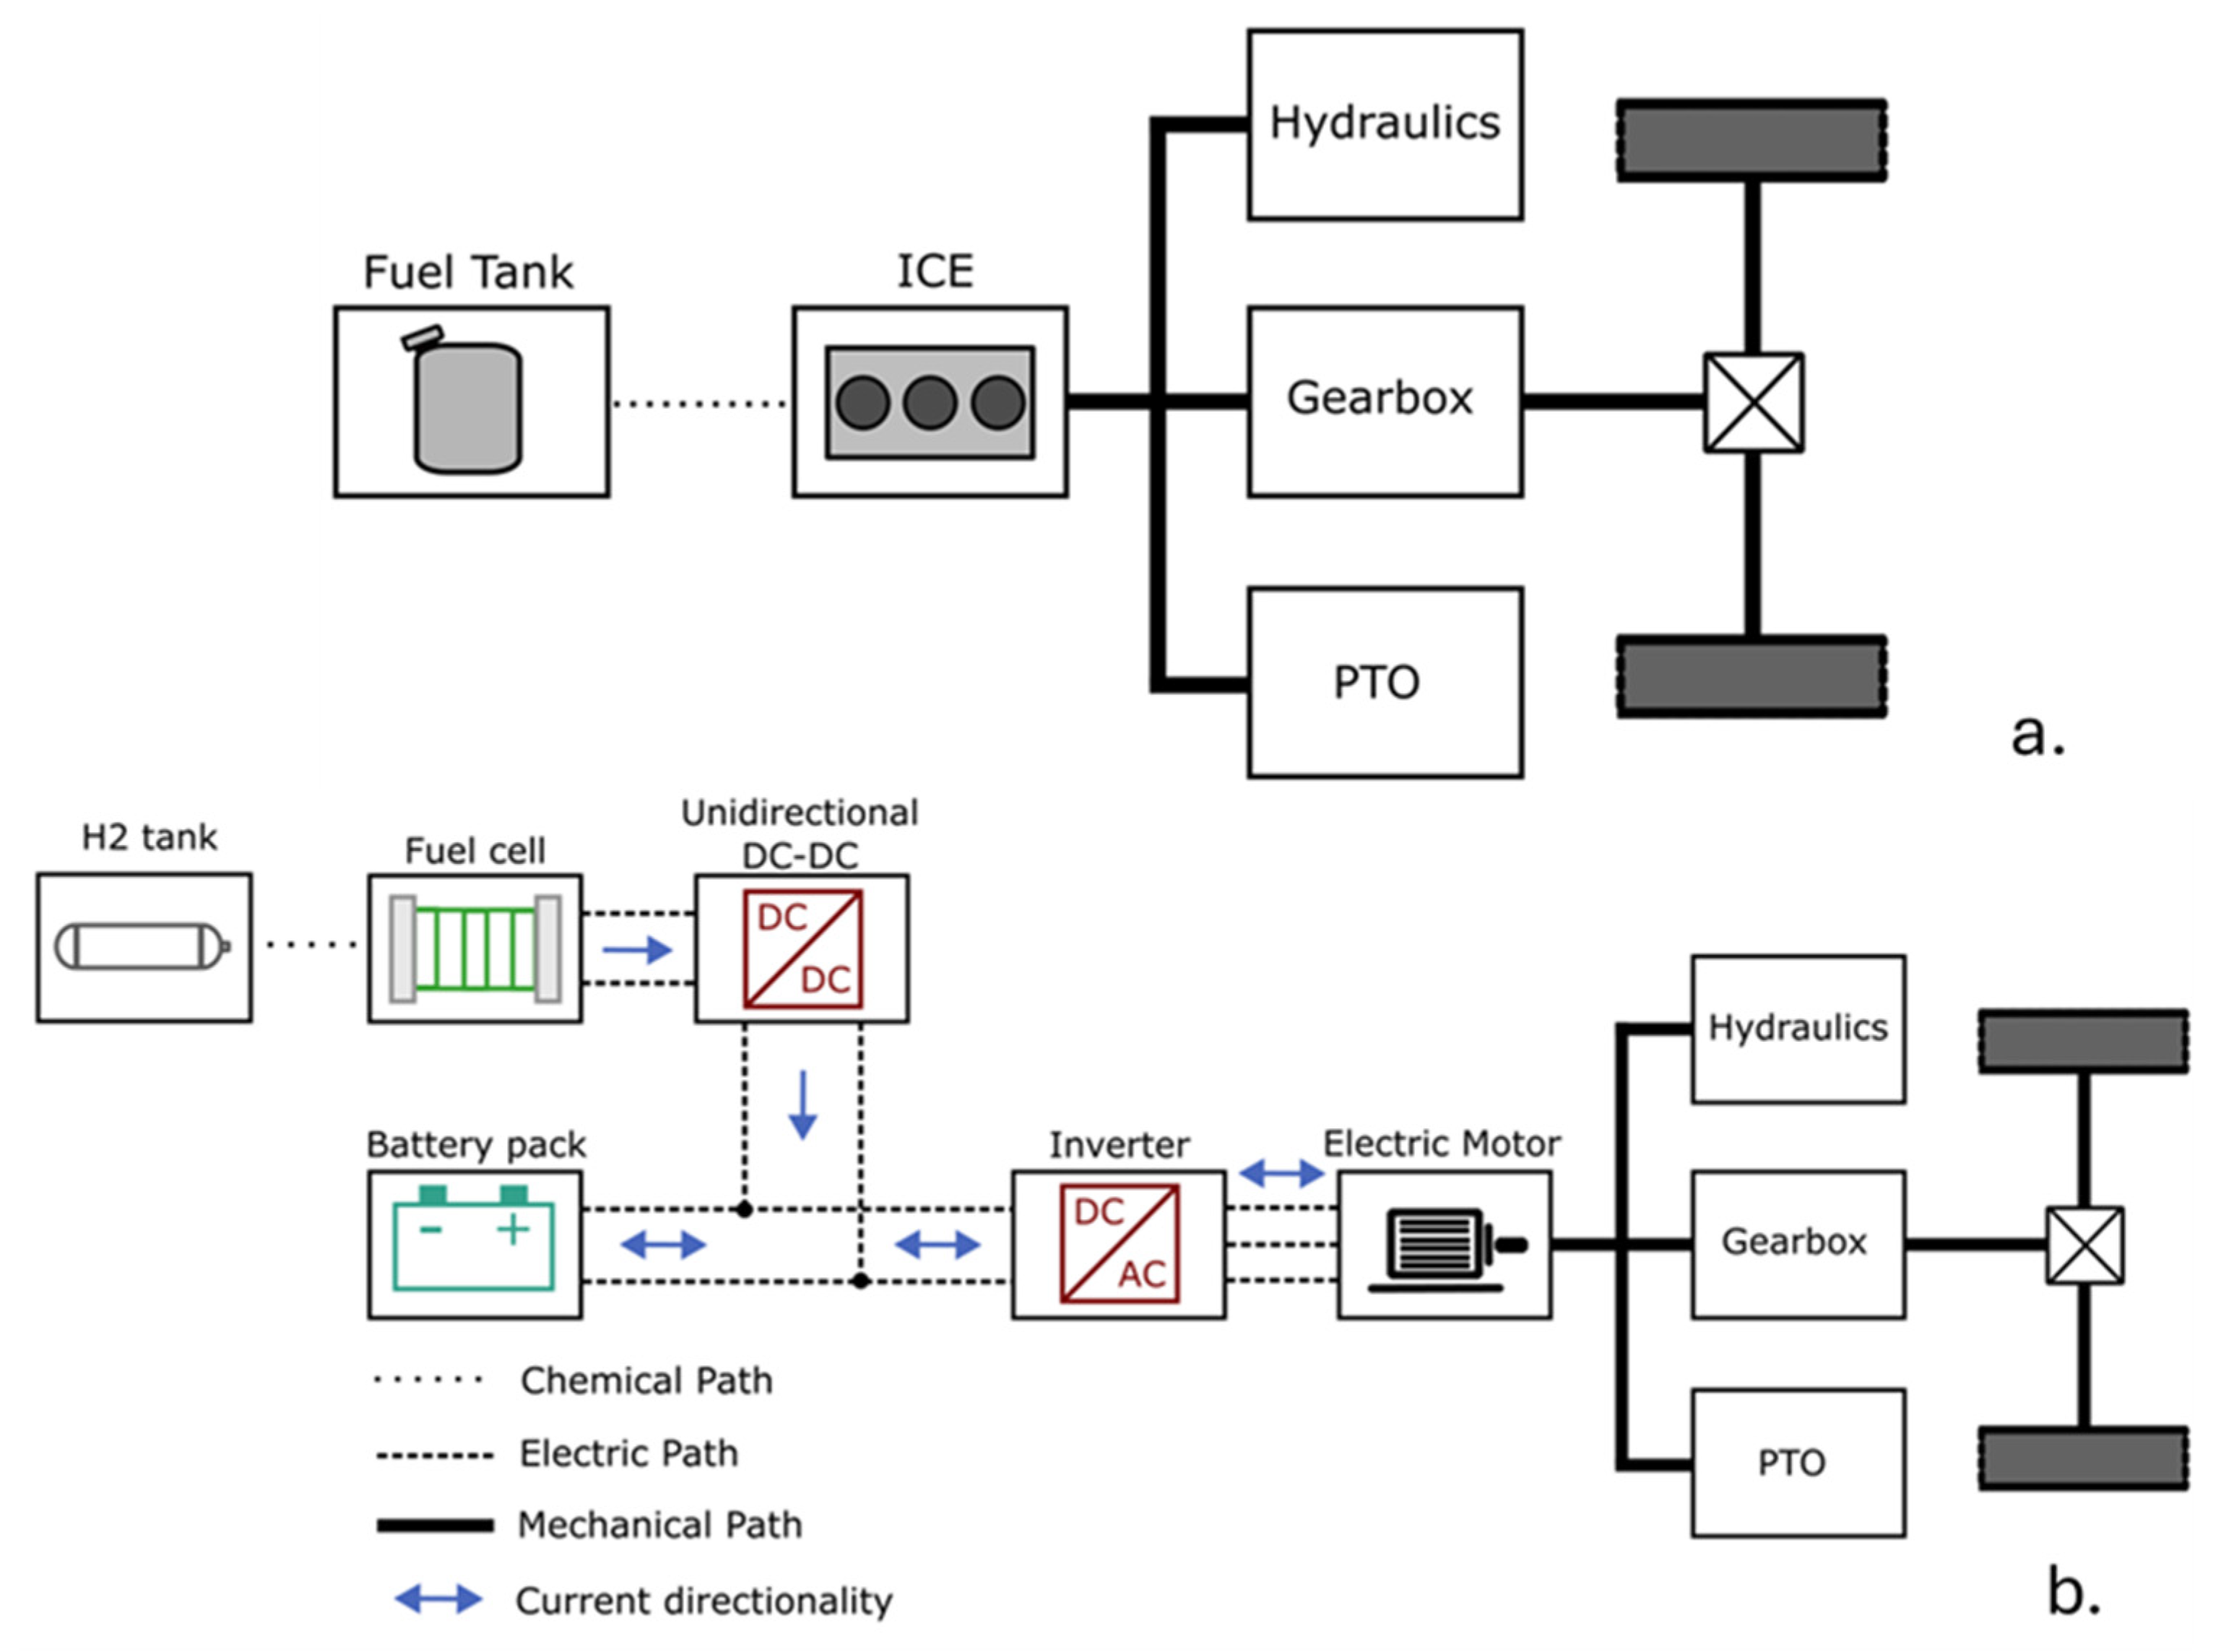
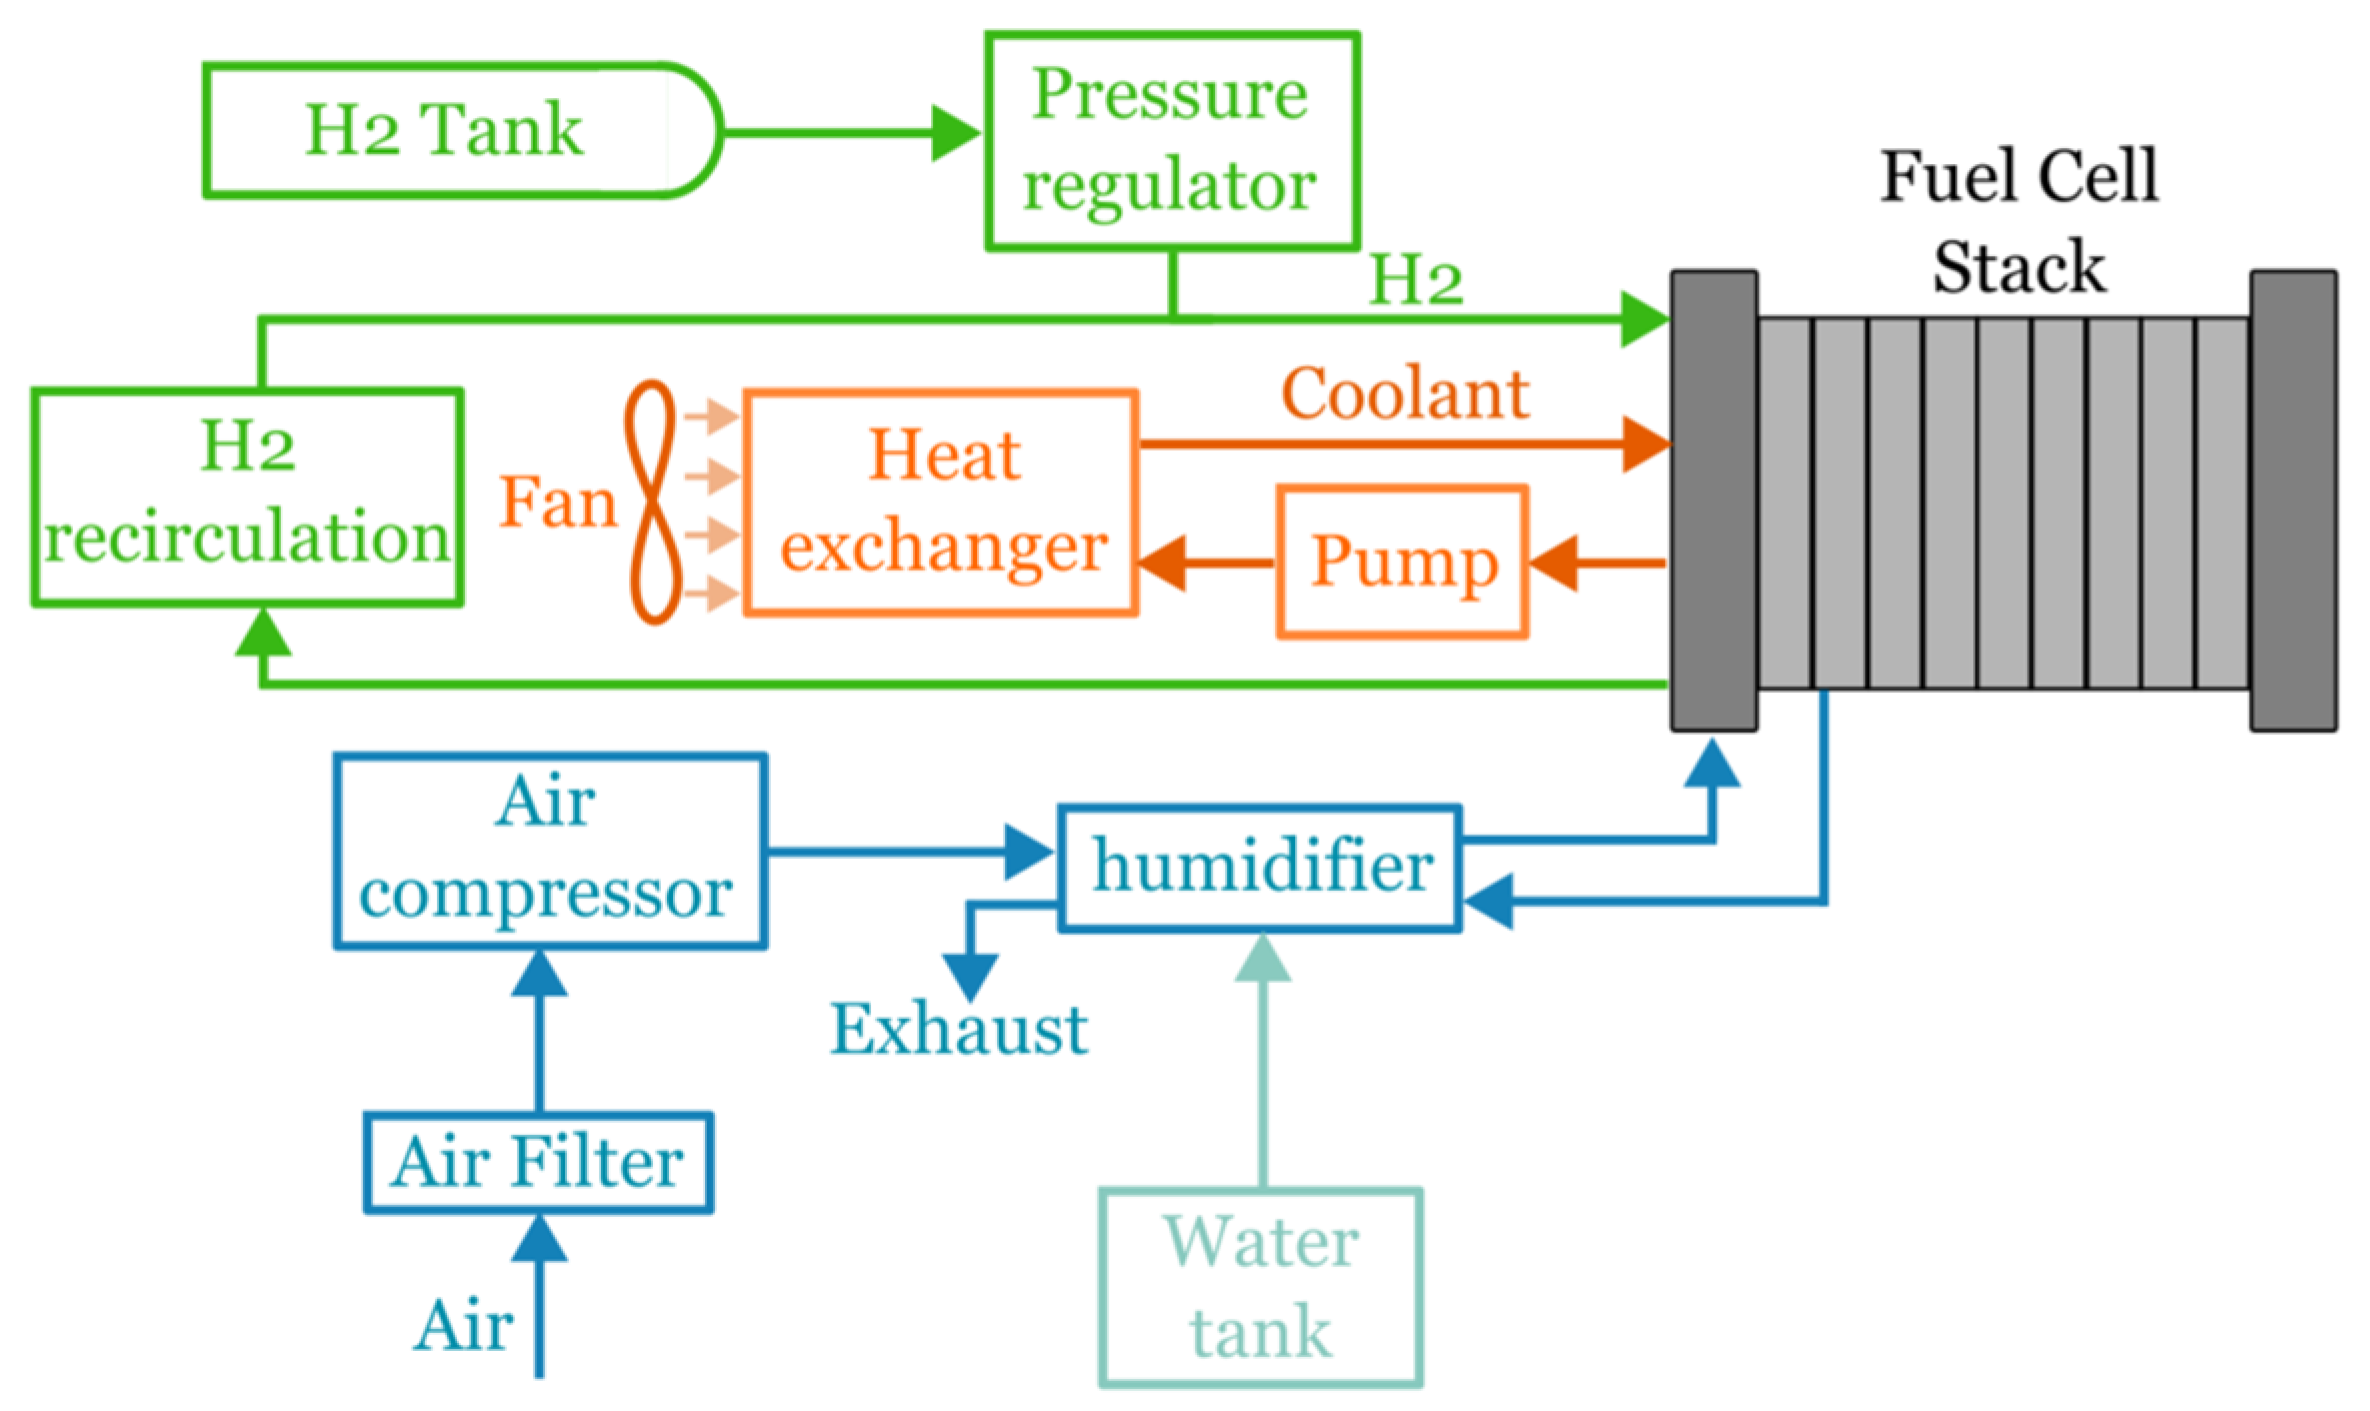
  • Power Generation: It comprises all the components that allow the power generation of the tractor. For the ICET, it mainly considers the engine and the aftertreatment system. For the FCHET, it considers the whole FC system, comprising the Balance of Plant (BoP), the hydrogen tank, power converters, the electric motor and the Li-ion battery pack.
  • Chassis and Transmission: It comprises the components that constitute the main chassis of the vehicle and the powertrain system downstream from the power source; furthermore, in this category, also tires and rims were added.
  • Electrical Auxiliary Services System: It comprises the main components linked to the service electrical system of the vehicles such as a 12 V lead-acid battery, vehicle control units, etc.
  • Cooling and Hydraulic Systems: This group contains all the components used for the cooling and hydraulic services of the vehicle. It should be noted that, for the FCHET, the fuel-cell heat management system is not considered in this category as it is part of the BoP, while cooling systems for the electric motor, battery pack and power converters are taken into account.
  • Other Category: This category is composed of all the remaining components necessary to complete the tractor such as the driver’s workplace, external bodywork, a rollbar, etc.
In Figure 3, a global overview of how the tractor mass was split into the different sub-assemblies is shown. It should be noted that the two vehicles have almost the same mass. This result was obtained downstream of the process of defining the two vehicle inventories and derives from the actual state of the art of the two different power systems. The only two groups with noticeably different masses are the Power Generation and Electrical Auxiliary Services System, while for the other groups, the differences are negligible. This is due to the assumption that, apart from the powertrain, the other parts of the two vehicles are almost the same. The Electrical Auxiliary Services System presents some differences due to some additional electrical auxiliary services that must be added to the electric vehicle.
In the following paragraphs, each sub-assembly is analyzed, providing their main components’ composition and the relative value according to the functional unit defined in the previous section.

2.2.1. ICET Production-Phase LCI

Concerning the ICET, its data collection was essentially based on the previous work developed by the authors of this article [35,36]. The Power Generation sub-assembly of the ICET is essentially composed of two macro-components: the engine and the aftertreatment system, composed of a Diesel Particulate Filter and a Diesel Oxidation Catalyst, since the ICET is equipped with a 75 kW EU stage IIIB diesel internal combustion engine. The engine was modeled considering its main material composition—cast iron, steel and aluminum—according to Liu et al. [42], whereas the Diesel Particulate Filter was modeled considering a metallic structure and only silicon carbide as active material, as stated by Larsson et al. [43].
The tractor chassis was assumed to be realized essentially using cast iron parts and a small amount of steel sheet parts. The transmission comprises all the principal components necessary to transmit power from the engine to the external loads, mainly steel shafts and steel gears [44]. Lastly, the tires were modeled according to the material composition defined by Dong et al. [45].
The LCI of the electronic group was developed considering a typical 12 V system used for medium-power agricultural vehicles. Cabling refers to a basic LV electrical system and considers both cables and connectors, whereas the vehicle control unit is composed of 46% of steel (housing), 32% of plastics, 14% of printed wiring boards and 8% of cables according to the Ecoinvent 3.0 database.
Lastly, in the Other Category group, falls all the remaining main components of the vehicles. Specifically, screws, tractor paint, plastics for external bodywork and the main components that constitute the driver’s workplace, namely the seat, rollbar and dashboard, were considered. In Table 1, the LCI of the ICET production phase is reported.

2.2.2. FCHET Production-Phase LCI

The FCHET orchard tractor, as said before, presents the same architecture as the ICET vehicle. Thus, with the exception of the Power Generation and Electrical Auxiliary Services System groups, the remaining sub-assemblies were assumed to be approximately the same as the traditional orchard tractor.
The FCHET considered in this work is equipped with a primary energy source, a PEMFC stack with a rated power of 66 kW, and a secondary energy source, a 6 kWh Li-ion battery pack. The main properties of the FCHET are reported in Table 2. As mentioned before, the proposed powertrain was designed considering the requirements and constraints typical of orchard tractors and was presented in previous work from the authors’ research group [39]. The size of the fuel-cell system was defined considering the endurance requirements (up to 8 h of continuous working) in the most demanding tasks, such as the use of a rotary harrow [15]. The battery pack capacity was consequently determined taking into account the on-board space constraints that are particularly strict for orchard tractors, since compactness is crucial to move among the plant rows.
The fuel-cell system is generally composed of three main subsystems: the PEMFC stack, FC system auxiliaries, namely the BoP, and the hydrogen storage system. The stack comprises the membrane, the catalyst layer, gas diffusion layers, bipolar plates, the stack housing and other minor elements. The system auxiliaries comprise the air management system, the heat management system, the fuel supply system and the water management system. As for the hydrogen storage system, it can be composed of pressurized tanks, metal hydride tanks or cryogenic tanks [46].
To evaluate the FC stack inventory for the manufacturing stage, the approach adopted by the authors is similar to the one used by Usai et al. [47]. According to this approach, the stack can be completely defined and dimensioned considering some key parameters. The total and active area of the stack was evaluated using the stack power density, expressed in W/cm2, and the total-to-active-area ratio. The values adopted for this sizing procedure were the same as used in [47] and are coherent with the US DOE targets [48]. As for the catalyst layer, it was modeled as a platinum alloy deposited on a porous carbon layer. Generally, the Pt loading is around 0.15–0.5 mg/cm2active [49,50,51]. To follow the same approach used in [46], we considered a Pt load of 0.32 mg/cm2active. As for the membrane, its material must be characterized by high ionic conductivity, gas impermeability, mechanical robustness and thermal stability. The most adopted material is Nafion, a material developed in the late 1960s, even if other solutions are being investigated by the research community [52]. The membrane thickness is generally in the range of 10–100 μm [49] and has a density of 2 g/cm3. Another important element of the stack is represented by the gas diffusion layers (GDLs), which allow the gas reactants to reach the catalyst layer. In most PEMFC stacks, the GDLs are realized in carbon cloth or carbon paper with Polytetrafluoroethylene (PTFE) [49,50,51] and have a thickness of 100–400 μm [49]. In addition, a microporous layer is usually integrated between the GDL and the catalyst layer [49,51]. This layer was assumed to be realized in carbon black and PTFE, with a thickness of 50 μm [49]. As for the bipolar plates, they can be realized with stainless steel, aluminum or carbon-based composites [49,50,51], even if in some cases titanium is used [53]. In the case of metallic bipolar plates, to improve corrosion resistance, a protective coating is applied. Usually, the bipolar plates are the heaviest element of the stack. In our study, we assumed the bipolar plates to be realized in stainless steel. Finally, other stack elements considered in this study were end plates, current collectors, tie rods, gaskets and the stack housing [47,50]. In addition, electricity for the manufacturing of the stack was taken into account [54]. The main assumptions made during the life cycle inventory of the stack are reported in Table 3.
The BoP refers to all the peripherals critical to system integration, including air blowers, control units, valves, water and thermal management subsystems, humidifiers, cooling units, fuel delivery systems and sensors [49]. Figure 4 shows a simplified scheme of a PEMFC BoP system [55]. Generally, the BoP is divided into four main subsystems: air management, water management, heat management and fuel management. The heaviest element of the air management system is the air compressor [47]. Its material composition was evaluated using the bill of material given in [56], while the other elements, such as the air filter, were modeled using the work in [57] as a reference. Regarding water management, the elements considered were the air pre-cooler, humidifier and tubing. Heat management comprised the radiator, fan and coolant pump. Finally, the hydrogen supply system was modeled considering the ejectors, valves and pipes. For most of these components, the bill of material was extrapolated combining the data available in [56,57].
For vehicular application, the most adopted technology for hydrogen storage is represented by pressurized tanks that can store hydrogen in gaseous form with pressures up to 700 bar [58]. Modern 700 bar hydrogen tanks are known as Type IV tanks. According to [59], the Type IV hydrogen tank weights approximately 102 kg and is composed of 76 kg of carbon fiber and 26 kg of epoxy resin, with a hydrogen capacity of 5.6 kg, and, in addition, presents a plastic liner made from high-density PE (HDPE), with a weight of approximately 7.5 kg. For the fuel-cell tractor proposed in this study, one Type IV tank was considered as a storage system. The hydrogen storage system is the major contributor in terms of weight to the fuel-cell system.
The Li-ion battery pack considered for the proposed powertrain has a capacity of 6 kWh and a rated voltage of 240 V. The technology considered for the battery pack is lithium iron phosphate (LFP). Its inventory was elaborated by combining data available in the literature [60,61,62,63,64]. A battery is composed of negative electrodes, with graphite as active material, and positive electrodes, whose active material depends on the battery technology and, in the case of LFP batteries, is represented by LiFePO4. According to [60,63,64], the %wt. of the anode is around 12–24%, while the %wt. of the cathode active material is in the range of 25–33%. Polyvinylidene difluoride (PVDC) was assumed as the binder material, with a %wt. of around 2% [60,63]. The electrolyte was assumed to be LiFP6 dissolved in a solution of 1:1 ethylene carbonate (EC) and dimethyl carbonate (DMC). The %wt. of the electrolyte is generally in the range of 9–16% [60,61,63,64]. The separator was supposed to be 80% wt. of polypropylene (PP) and 20% wt. of polyethylene (PE) and accounted for about 5% of the total weight of the pack [60]. Finally, the BMS, the cell container and the module casing were considered.
The inventory of the electric motor was evaluated combining the data available in [65,66,67]. According to these data, the stator and rotor cores are mainly composed of electrical steel, with a small percentage of silicon and aluminum (about 2% and 0.4%, respectively) and a thin coating of phenolic resin. The mass of the stator and rotor cores represents around 40–50% of the whole machine mass. The conducting wire is composed of copper insulated by one or multiple layers of insulation materials, typically polyester resins, polyamide resins or alkyd resins. The stator is generally soaked in some impregnation material to be partially or fully encapsulated. The rotor endplates and the motor shaft are composed mainly of stainless steel, and their size depends on the maximum torque of the motor. The housing, whose size is generally a function of the rated power, is supposed to be made of aluminum. As for the magnets, they are hypothesized to be neodymium magnets Nd(Dy)FeB, with a mass of approximately 3% of the electric machine mass. Finally, other elements that were considered in the inventory were the bearings, made with low-alloyed steel, terminals, screws and nuts. The total mass of the machine is coherent with the state of the art of electric motors [68].
As for the power converters, the fuel-cell tractor architecture is characterized by two main elements: the inverter and the DC-DC converter for the connection between the fuel cell and the battery pack. The inventory of the two power converters was determined using the data available in [69] and scaling the mass in accordance with the rated power. For simplicity, the inventory was considered the same for both the DC-DC and the inverter. According to [69], the power converter can be divided into the following subparts: the casing, in aluminum protected by a varnish, the power module, composed of power devices, diodes, chips, etc., with a baseplate in copper and power terminals in galvanized steel, the DC link capacitor, the busbar, made with copper layers insulated by Polyethylene terephthalate (PET), the printed circuit board (PCB) and other minor parts such as screws, washers, spacers and so on. The subpart with the major contribution in terms of mass is the aluminum casing, which represents more than 60% of the entire power converter mass. The other subparts’ masses range between 7 and 10% of the total mass, apart from the PCB mass which generally is around 2–4%. Table 4 summarizes the material and mass distributions for the battery pack, electric motor and power converters.
In Table 5, the LCI of the FCHET Power Generation sub-assembly is reported.
To complete the life cycle inventory of both tractors’ manufacturing, two last intermediary flows must be defined: the final assembly energy and the transport contribution. Indeed, once each component has been produced, the whole vehicle must be assembled in the final assembly-production line to obtain the final product. The energy required to assemble one single tractor was assumed to be only in the form of electricity and was estimated as 13% of the entire production energy necessary to produce one vehicle, as described in [70]. The total amount of energy necessary to obtain one vehicle was calculated considering an average value of 50 MJ per vehicle kilogram, as stated by Mantoam et al. [44]. As a consequence, the amount of energy to assemble one orchard tractor is 6.50 × 10⁻¹ MJ per FU for each vehicle. Since the two vehicles have almost the same mass, the assembling energy is almost the same for both of them. To consider the impact associated with assembly electricity, the European generic grid mix was considered.
Focusing on transport contribution, each intermediary flow was subdivided into two groups, depending on the places of origin of the component:
  • Group 1: An average distance of 250 km from the assembly-line plant was assumed; in this case, road transport by lorry was considered. The vehicle considered operates with diesel, and it is equipped with a EURO 6 diesel engine.
  • Group 2: An average distance of 2500 km from the assembly-line plant was assumed; in this case, sea transport by container ship (43,000 tonnes of load capacity) was considered.
In Group 1 falls every flow whose production could be placed in Europe, such as metal components. In Group 2 falls every flow whose production typically is not placed in Europe, such as all electronic devices (Li-ion cells, PCBs, vehicle control units, etc.) and precious materials like platinum. The LCI of transport contributions for both tractors are shown in Table 6. The values of each item were obtained by multiplying the emissions per kilometer produced to transport one kilogram of material by the masses of the transported element and the considered average distance.

2.3. Use-Phase LCI

In this section, the emissions produced by both tractor architectures during their service life were evaluated. The scenario assumed consists of an annual working time of 1000 h for 10 years [71,72]. For both powertrains, the use-phase emissions are mainly related to the following:
  • Propellant production and consumption.
  • Service maintenance: lubricant and tire substitutions.
  • Transport of the maintenance elements.
Focusing on propellant production and consumption, for traditional vehicles, the use phase is generally the major contributor to the total life cycle emissions for most of the impact categories considered [73]. On the other side, for fuel-cell vehicles, the impact of the use phase on the total emissions strongly depends on the hydrogen production mix [74]. In this study, the authors decided to adopt a realistic-case approach; hence, the total amount of hydrogen produced was assumed to come from fossil energy sources (so-called “grey hydrogen”). The annual duty cycle considered is composed of five field tasks and is described in Table 7. This duty cycle refers to common operations performed in vineyard cultivations.
For the evaluation of the diesel consumption during the use phase, a numerical model of the powertrain, developed in Matlab Simulink (v. 2022b) was used. This model comprises a fuel consumption estimation model [39,76] that evaluates the normalized brake-specific fuel consumption (BSFC) using a polynomial function that considers the actual engine speed and torque:
Z = b 1 + b 2 X + b 3 Y + b 4 X 2 + b 5 X Y + b 6 Y 2
where:
  • X is the normalized engine speed: X = n n n o m 100
  • Y is the normalized brake torque: Y = T T n o m 100
  • Z is the normalized BSFC: Z = B S F C B S F C m i n 100
  • bi are the polynomial coefficients; the values of these coefficients can be found in Appendix A.
According to this model, the region of minimum BSFC is usually located at about 73–77% of the nominal engine rotational speed (2600 rpm) and at high load, generally around 85–95% of the nominal torque (335 Nm). The engine parameters were assumed according to datasheets available for commercial engines with very close characteristics to the case study of this work [77]. The vehicle speed during the field task was assumed to be 7 km/h, while the engine speed was set at 1600 rpm with the PTO working at a 540eco regime. According to simulations, the average diesel fuel consumption during its operational life was estimated to be 6.71 L per working hour. This value was obtained as the ratio between the overall diesel consumed during the vehicle life, according to the annual duty cycle described in Table 7, and the total amount of hours during the use phase in which the vehicle is turned on.
For the evaluation of hydrogen consumption, the powertrain model presented in [39] was used. The parameters of the fuel-cell model were updated according to the values assumed for the life cycle inventory of the manufacturing stage. According to this model, the fuel-cell voltage was evaluated using the following equations [39,78,79]:
V s t a c k = N c e l l V N e r n s t V a c t V o h m V c o n c
V N e r n s t = V c e l l 0 R g T 2 F ln p H 2 O p O 2 0.5 p H 2
V a c t = R g T 2 F α log i d e n s i 0
V o h m = R o h m i d e n s
V c o n c = R g T 2 F log 1 i d e n s i l i m
where:
  • Vstack is the overall stack voltage.
  • VNernst is the Nernst voltage.
  • Vact, Vohm and Vconc represent, respectively, the voltage losses due to activation processes, ohmic resistance and concentration processes.
  • V0cell represents the standard cell potential, equal to 1.229 V.
  • Ncell is the number of cells in the stack.
  • F is the Faraday constant, equal to 96,485.33 C/mol.
  • Rg is the ideal gas constant.
  • pH2O, pO2 and pH2 are, respectively, the water, oxygen and hydrogen partial pressures.
  • T is the stack temperature.
  • α is the charge transfer coefficient.
  • idens is the current density.
  • i0 is the reaction exchange current density.
  • ilim is the maximum current density.
The ohmic resistance of the stack was supposed to be a function of the stack temperature, membrane water content and membrane thickness [80,81]. As for the hydrogen consumption, the mass flow reacting at the fuel-cell anode was evaluated according to the following equation:
q H 2 r e a c t = N c e l l i F C M M H 2 2 F
where MMH2 is the H2 molar mass, and iFC is the fuel-cell current. The powertrain model considered the power absorbed by the fuel-cell system auxiliaries, represented mainly by the air compressor. According to simulations, the average hydrogen consumption during the FCHET operational life was estimated to be 1.27 kg per working hour. Also in this case, the average hydrogen consumption was obtained as the ratio between the total hydrogen consumed during the FCHET life and the overall amount of hours for which the vehicle is turned on.
According to Lovarelli et al. [72], the service maintenance consists of 3 operations:
  • Engine lubricant oil substitution every 300 h (only for ICET).
  • Hydraulic oil substitution every 1500 h.
  • Tire substitution every 2500 h.
Unintended failures were not considered in this study. Indeed, their inventory results were quite difficult to model, since multiple factors affected them such as tractor operating conditions, tractor quality and attention paid by the farmer during tractor operation. However, the propellant production and consumption usually affect almost all emissions during the use phase, and thus, unexpected maintenance can be considered negligible [35,36].
Also, in the use phase, transport contribution was taken into account, assuming an average distance of the manufacturing plants and propellant production sites of 250 km from the tractor working place in the form of land transport by lorry. In Table 8, the use-phase LCIs of the ICET and FCHET are reported. According to the numerical models, the mean efficiency of the fuel-cell powertrain was around 46%, which is in line with values available in the literature considering that these vehicles generally operate at medium-low load, where the efficiency of the FC system is higher [82]. In contrast, the efficiency of the internal combustion engine is lower at low loads, resulting in a mean vehicle efficiency of around 27% according to the considered work scenarios and the adopted fuel consumption model.

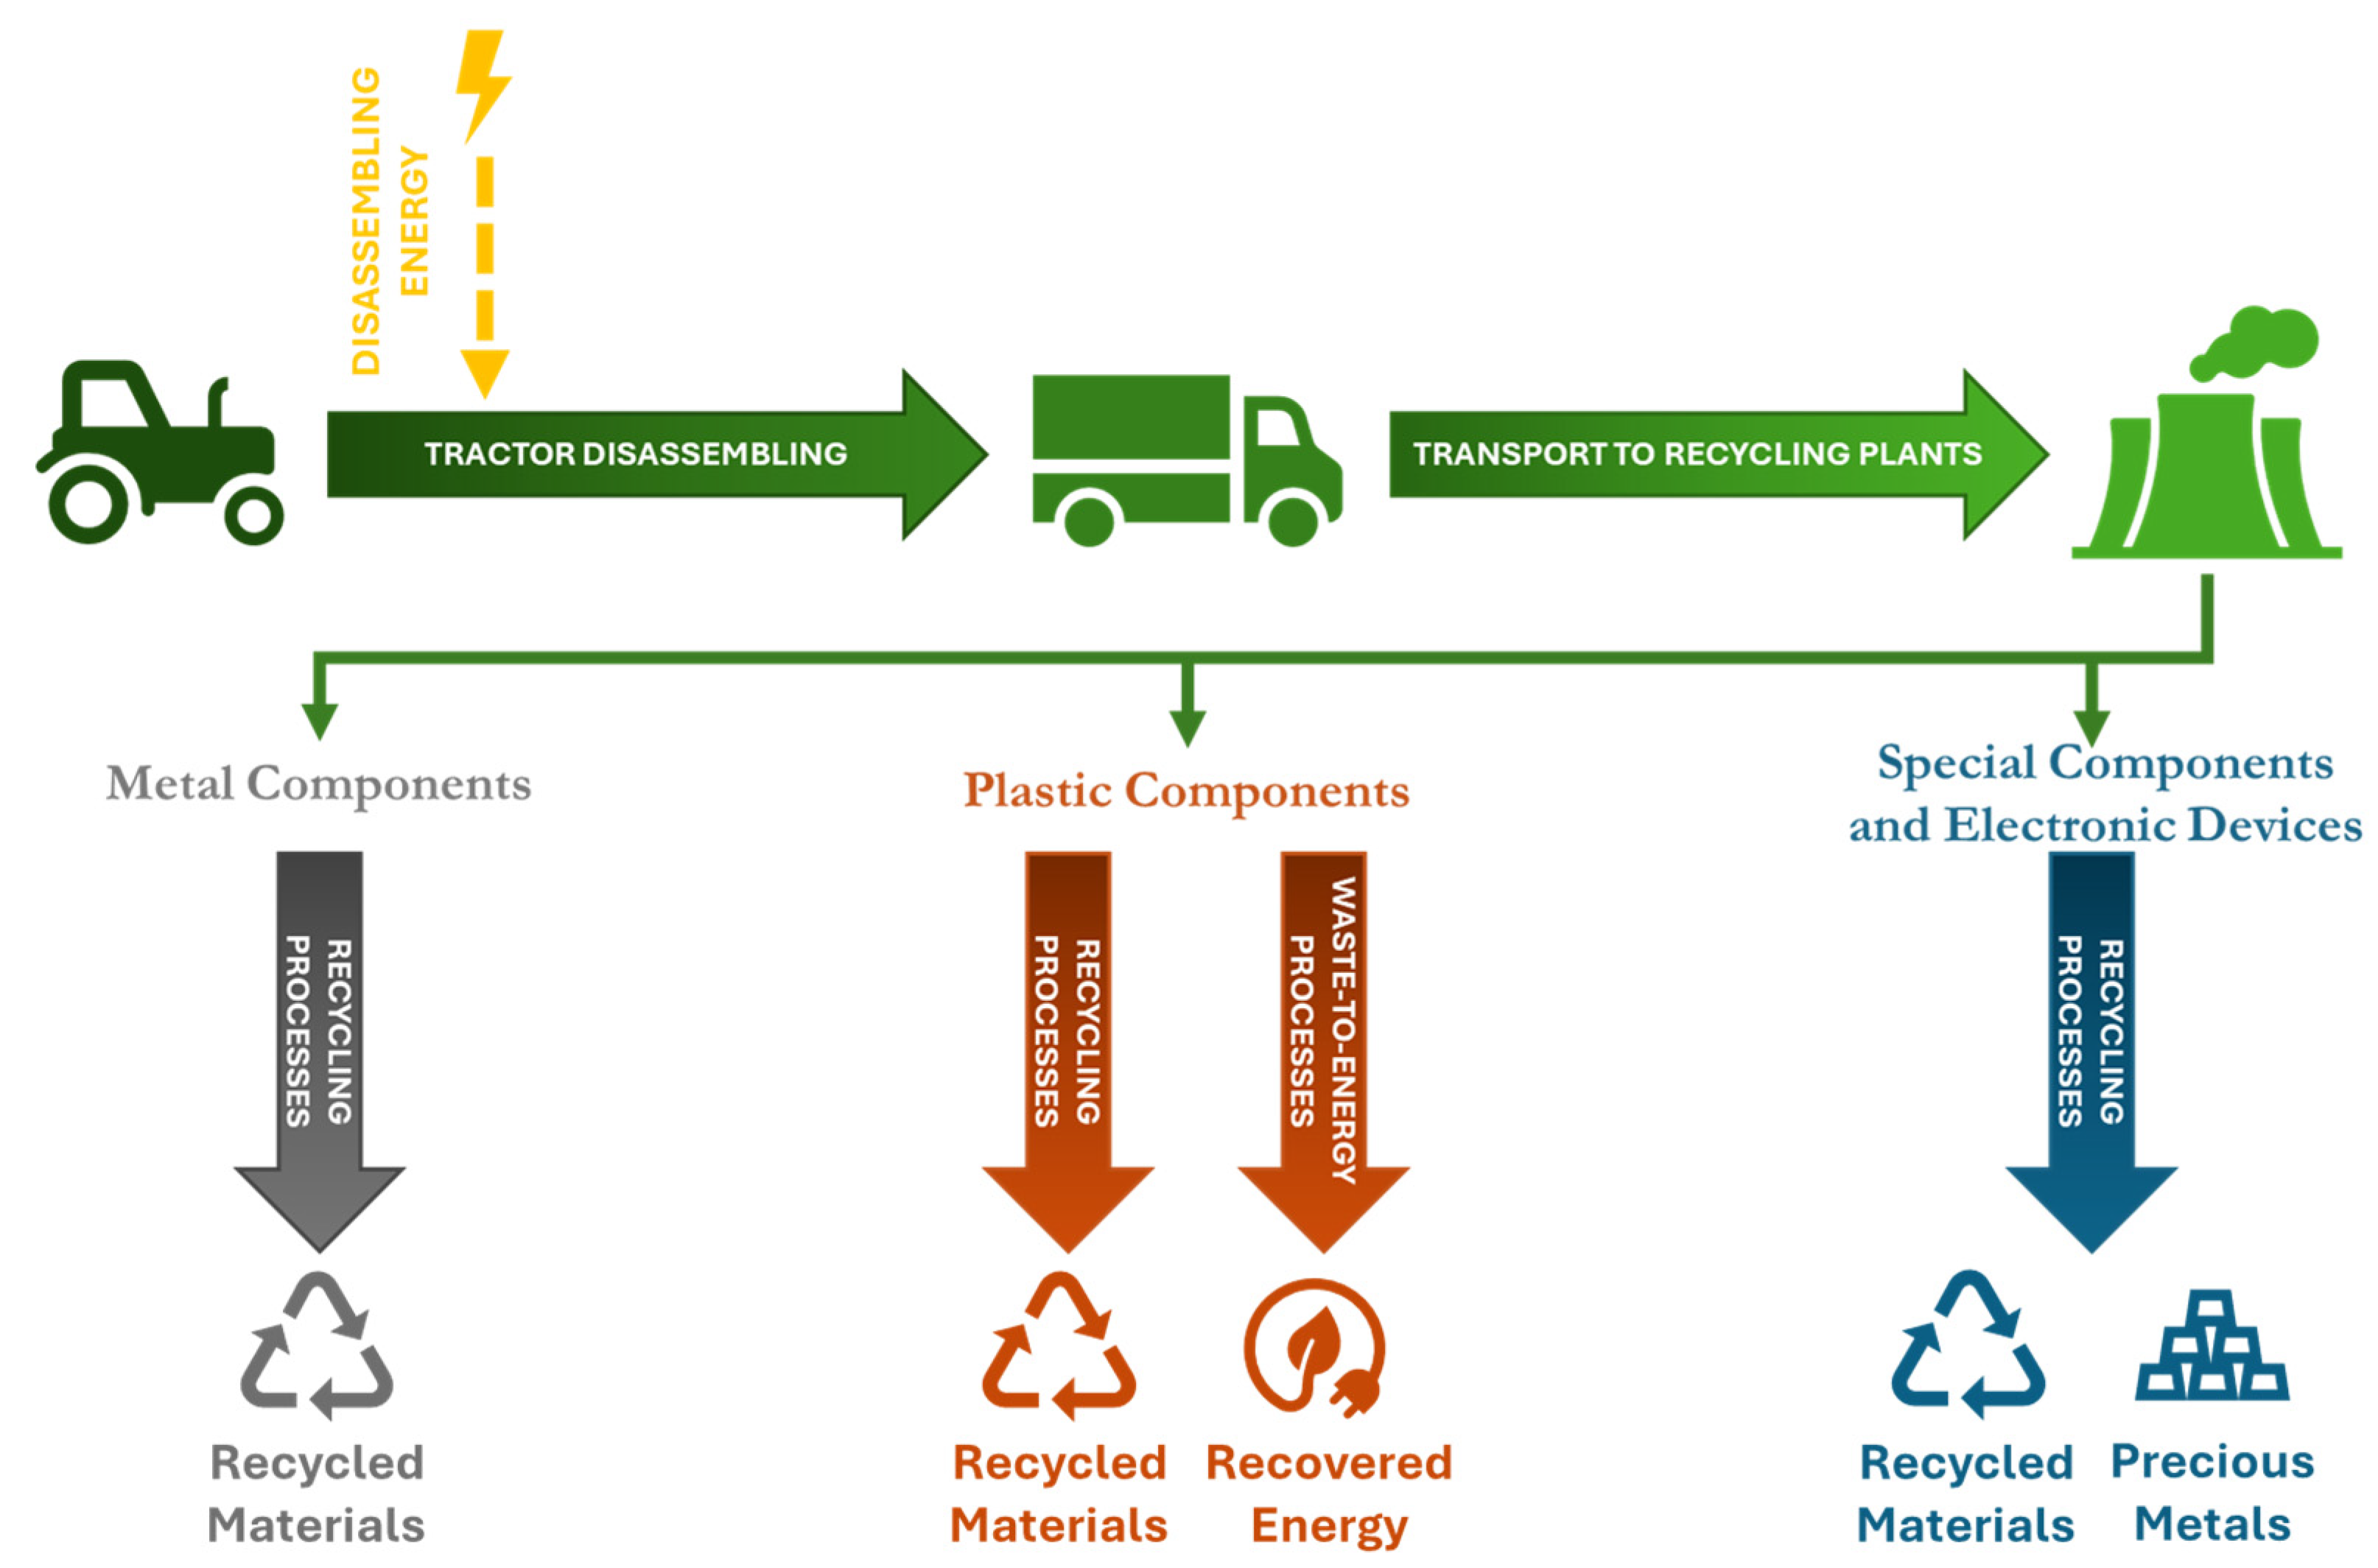
2.4. End-of-Life-Phase LCI

The EOL phase is the last stage of the tractor life cycle and defines how the disposal will be managed. In this study, the EOL scenario assumed is shown in Figure 5. The idea at the base of the assumed scenario is to recover as much as possible, both in the form of secondary raw materials and energy, in order to avoid their production from primary sources. All the disposal procedures were modeled according to the ones already present in the Ecoinvent 3.0 database, using exactly or quite similar processes for all the components. The first step consists of the tractor disassembling to obtain the single components, which then will be transferred to the recycling plants. This action required a certain amount of energy, and it was assumed as the same as the one required to assemble a single tractor during the production stage (50 MJ/kgvehicle). Once the tractor has been dismantled, the different components are transferred to the corresponding recycling plants. The transport assumption is the same as that of the use phase: the recycling plants are located at an average distance of 250 km from the disassembling site. The transport occurs by lorry, according to the generic European freight transport by a EURO 6 standard lorry. The different components of the vehicles can be subdivided into 3 main categories:
  • Metal components.
  • Plastic components.
  • Special components and electronic devices.
The metal components present the same recycling approach. Indeed, firstly, the different materials are collected, sorted and pressed. Then, the materials are recycled, according to their specific recycling process. The result is the production of secondary raw materials from scraps. However, a recovery rate for each single metal was assumed [83] to reflect a realistic recycling scenario: 88% for steel and cast iron, 96% for aluminum and 100% for brass and copper.
The plastic components can be subdivided into 3 sub-categories, depending on the type of plastic material: thermoplastic components, thermoset components and rubber-derived products. Thermoplastic materials are usually recyclable. Thus, their disposal treatments are finalized to recover some secondary raw materials, using an average recovery rate of 84% [83]. The other 2 groups usually belong to the unrecyclable material category; hence, they received a waste-to-energy process. Specifically, thermoset components were assigned to municipal incineration to obtain thermal energy, instead of natural gas (net energy production 7.66 MJ/kg). Rubber-derived components, most of which are represented by tires, are incinerated in order to avoid steam production from primary sources (heating value of 31.99 MJ/kg), which is one of the most important elements necessary in tire production [45]. The heating values were chosen according to the Ecoinvent 3.0 database.
The last category brings together complex components, such as all the electronic components present in the tractor or the fuel-cell stack. The purpose of disposal treatments, reserved for these components, is to recover secondary materials and precious metals, like the ones contained in the PCBs or fuel-cell stack:
  • PCBs’ end-of-life treatments consist of PCB collection, shredding and separation with the purpose of retrieving secondary copper and precious metals by electrolytic refining.
  • Used cable treatments consist of shredding and the separation of copper from the other materials to recover secondary copper scrap.
  • 12 V lead-acid battery undergoes a remelting treatment in order to recover lead scrap from used batteries.
  • Vehicle control units, the inverter and the DC/DC converter receive a similar treatment: separation from the external metallic case (steel or cast iron), PCBs and cabling, which then get one of the respective aforementioned disposal treatments. Furthermore, the big capacitors present in the inverter and DC/DC converter undergo a hazardous waste incineration process in order to produce thermal energy (net energy production 17.11 MJ/kg) according to the Ecoinvent 3.0 database.
  • The electric motor EOL scenario consists of manual separation from the steel rotor and stator and copper windings which are then recycled according to the procedure reserved for metal components described above; the magnets are recycled according to the magnet-to-magnet process described in [84].
  • The aftertreatment system end-of-life scenario is based on the Ecoinvent 3.0 database, using catalytic converter waste treatment.
The last three components that deserve a more detailed description are the battery pack, the fuel-cell stack and the hydrogen tank. Regarding battery pack recycling, the first step is the mechanical manual dismantling of the battery pack and the battery modules. Thanks to this step, the battery and module case, electric wires, plastic materials and PCBs can be easily taken and subdued to their respective recycling processes. The cells are recycled as described in [85]. Specifically, cells’ EOL is divided into three phases: pre-treatments, metal extraction of cathode material by hydrometallurgical processing and cathode active material leaching in order to recover metals (97% of Li and 93.3% of Fe [86]). The fuel-cell stack disposal treatment consists of the manual dismantling of the different components, followed by the subdivision of the components by material, which are then recycled according to the processes described in the previous paragraphs. Particular importance was given to the EOL management of platinum contained in the stack, since it is a critical raw material with a high associated impact [87]. Its recycling process was modeled using the most efficient EOL scenario (recovery rate of 76%) described in [88]. It consists of H2O2/HCl solvent leaching with liquid/liquid extraction. Lastly, regarding the hydrogen tank, whose main materials are HDPE and CFRP, after a mechanical separation, the HDPE is recycled to recover some secondary granulate, whereas the CFRP is the only material allocated to landfilling.

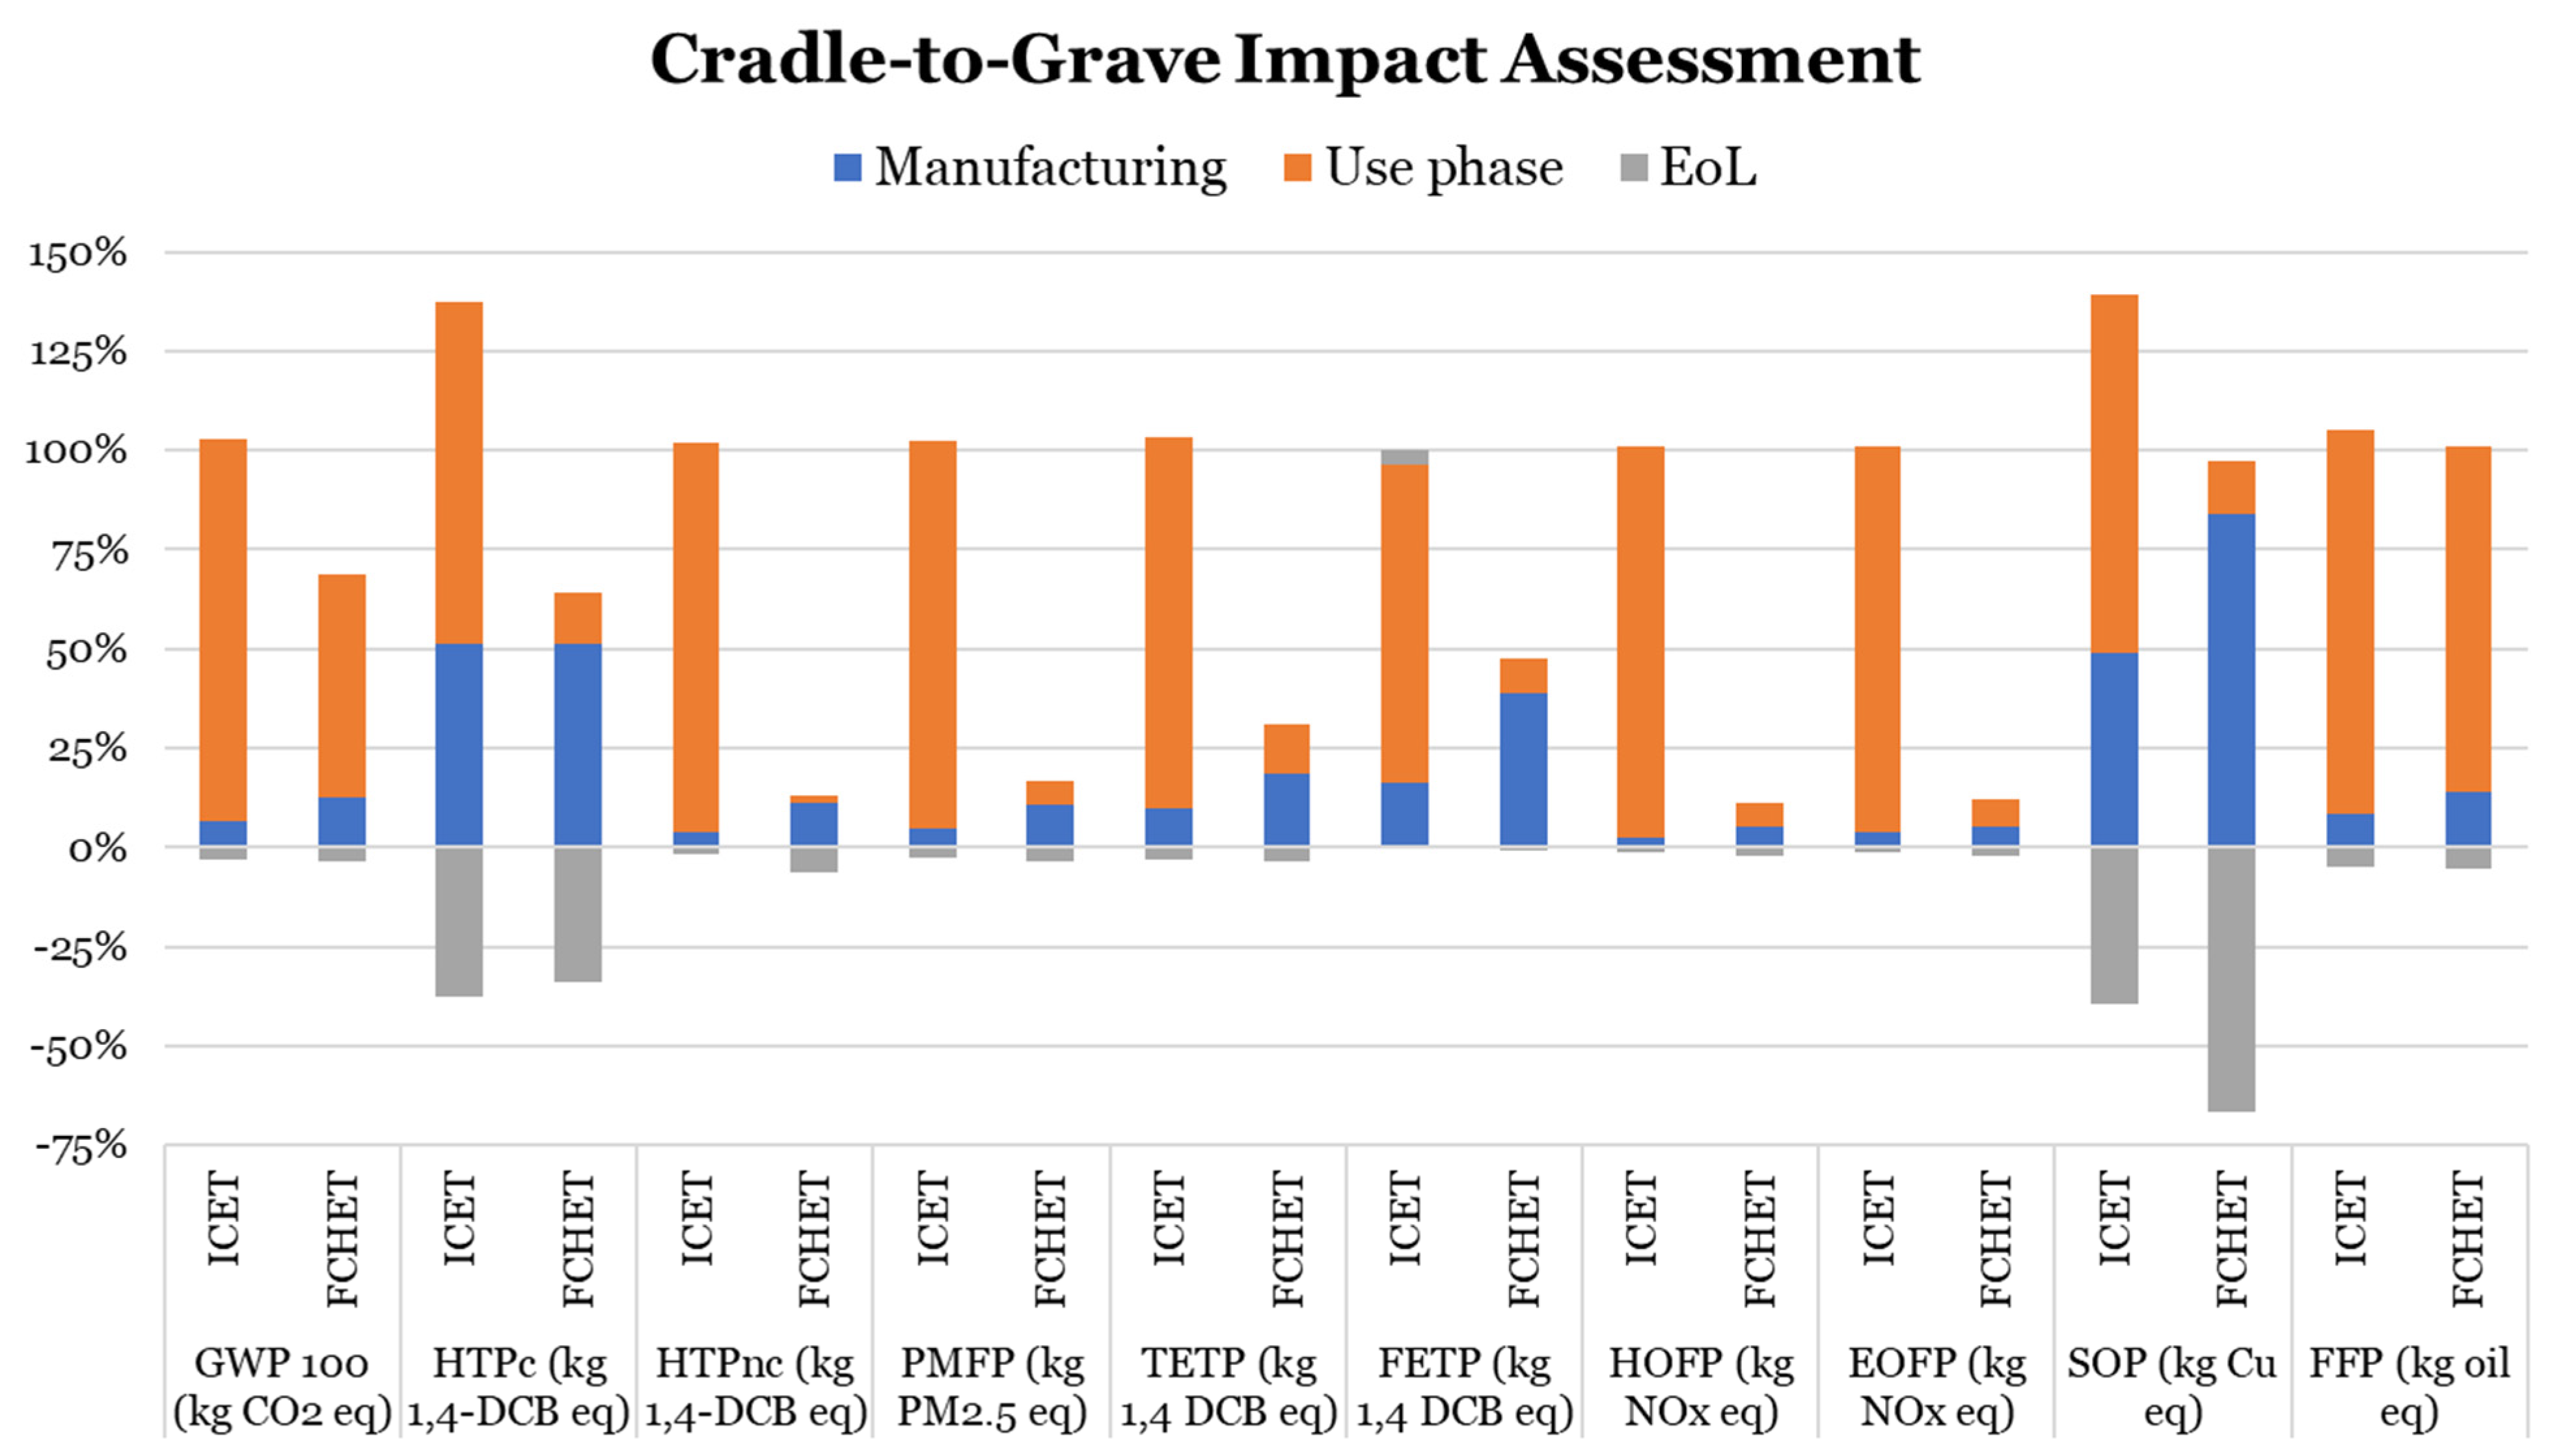
3. Results and Discussion

In this section, the results of the environmental assessment will be exposed, analyzed and discussed. The LCA impact assessment allows us to divide the emissions associated with the product inventory into a certain number of impact categories, in order to make them more understandable [89]. For this study, some of the impact categories defined by ReCiPe 2016 v 1.03 at the midpoint level were considered [89,90]. In particular, the authors selected 10 impact categories whose effects can affect human health, ecosystems and resource availability:
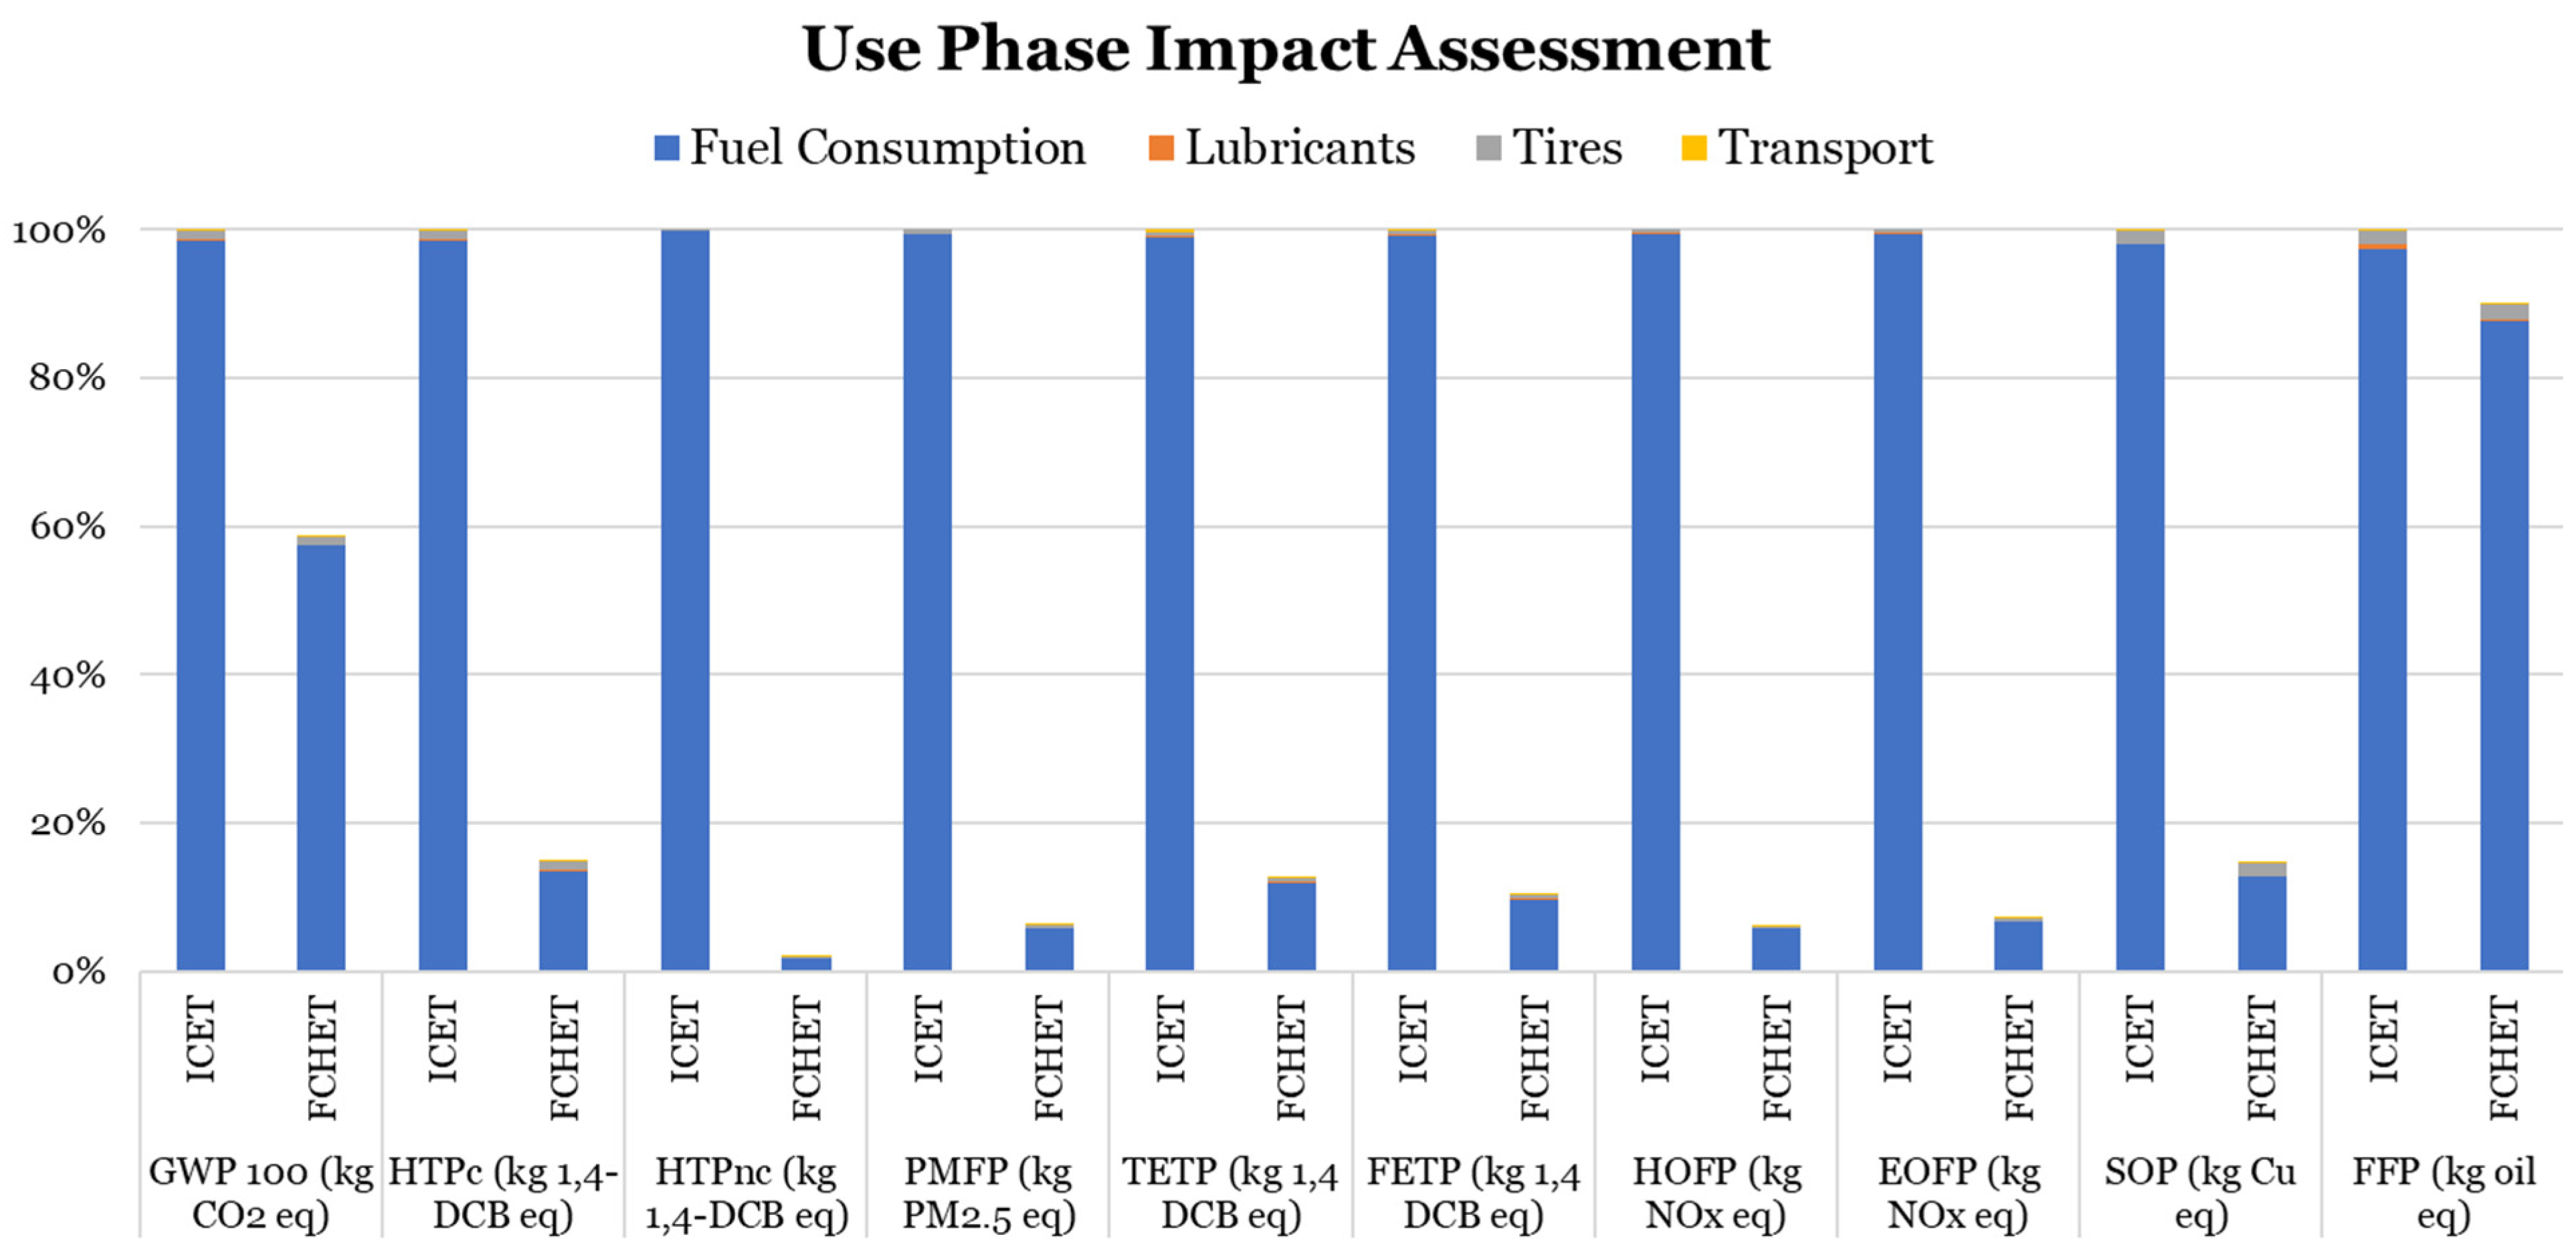
  • Global warming potential (GWP): measured in kgCO2eq., it is associated with the global emissions of greenhouse gasses (GHG).
  • Human toxicity carcinogenic (HTPc) and non-carcinogenic (HTPnc): measured in kilograms 1,4 dichlorobenzene-equivalents (kg1,4DCBeq.), it expresses the increased risk of carcinogenic and non-carcinogenic disease associated with the chemical emission of the product.
  • Particulate matter formation potential (PMFP): measured in kgPM2.5eq., it is associated with the increased risk of inhalation of particulate matter by humans.
  • Terrestrial (TETP) and freshwater (FETP) ecotoxicity: measured in kilograms 1,4 dichlorobenzene-equivalents (kg1,4DCBeq.), it expresses the increased risk for terrestrial and freshwater species due to a change in the chemical composition of the environment.
  • Photochemical oxidant formation for terrestrial ecosystems (EOFP) and humans (HOFP): both measured in kgNOxeq., they express the increased risk for humans and terrestrial species due to the incremented ozone intake caused by NOx and non-methane volatile organic compound (NMVOC) emissions.
  • Mineral resource scarcity (Surplus Ore Potential, SOP): measured in kgCueq., it is correlated with the future ore grade decrease of minerals caused by its extraction.
  • Fossil resource scarcity (Fossil Fuel Potential, FFP): measured in kg oil eq., it is defined as the ratio between the upper heating values of a fossil resource and crude oil.
In the following paragraphs, the results are discussed firstly according to a gate-to-gate approach and then according to a cradle-to-grave approach.

3.1. Production-Phase Results

In this section, the results related to the production phase are shown. As asserted before, the production phase takes into account all the processes, from raw material extraction to final vehicle assembly, necessary to obtain the ICET and the FCHET. The environmental impact comparison of the production phase for the two vehicles is shown in Figure 6, while the numerical values are reported in Table 9. The results are presented in percentage with respect to the ICET case for each impact category. As a consequence, the ICET production assessment is always reported as 100%. This way, the different environmental impact between the two tractors is more graphically understandable.
To quantify the increase in the environmental impact, it is also useful to observe Table 9.
Observing the chart, it is possible to note that, with the only exception of the HTPc impact category, where the results obtained for the two vehicles are comparable, the impact assessment of the FCHET production is considerably higher than the ICET. The reasons that may explain this can be found in the production of the two “Power Generation” sub-assemblies. Indeed, just observing the chart in Figure 6, it can be noted that the most impactful sub-assembly of the ICET is mainly the “Chassis and Transmission” group, since it is composed of large quantities of iron metals (almost 68% of the tractor’s total mass). In contrast, the most impactful sub-assembly of the FCHET is “Power Generation”, despite the chassis and transmission of both vehicles being essentially the same. In particular, what emerges is the environmental impact of the hydrogen tank and the fuel-cell stack with peaks accounting for, on average, between 40% and 50% of the entire vehicle production. The explanation for these results can be found in the large amount of carbon-fiber-reinforced polymer (CFRP) used to produce the tank and in the extraction and production of pure platinum used in the stack. It should be noted that the high impact of the tank production also affects powertrain systems that adopt a hybrid engine running on hydrogen. In this case, the absence of the stack reduces the production phase impact; however, use-phase emissions are expected to be higher since the combustion process involves the production of emissions as by-products. This result assumes more relevance considering that they represent only 6% of the total mass of the FCHET. The other macro-components of the FCHET power generation system do not have a meaningful impact overall, but their contributions are focused on certain impact categories such as the impact of the electric motor in the SOP category (36% of the total) and the impact of the battery pack in the TETP and FETP impact categories (7 and 5%, respectively). In summary, the higher impact of the FCHET production phase with respect to the traditional counterpart can be attributed to those components, required for the Power Generation sub-assembly, that require a certain amount of precious metals, electronic devices, non-ferrous metals (such as lithium, copper and so on) or elements that must have very specific and demanding properties (such as the hydrogen tank), etc., whose production is associated with an extremely high impact. Instead, the Power Generation sub-assembly of the ICET is mainly composed of steel and cast iron components and, furthermore, is a more mature and well-developed technology.
Further consideration can be given to the contribution of assembly and transport. The former has a non-negligible impact only in the GWP100 and FFP categories since the majority of the electric energy in Europe is produced by fossil fuels. The transport contribution for both systems is meaningless in almost all impact categories (less than 1% on average).

3.2. Use-Phase Results

For the traditional powertrain, the emissions were evaluated considering both the local emissions due to the combustion process and the fuel production processes, related to crude oil extraction, treatment and transport. As for the fuel-cell powertrain, it was assumed that no local emissions were produced, and thus, all the emissions are related to the H2 production and supply. As for the hydrogen production mix, the authors considered only gray hydrogen, mainly produced through steam methane reforming [91]. The authors decided to consider gray hydrogen since it corresponds to the worst-case scenario in terms of environmental impact, and in the current scenario, low-emission hydrogen is less than 1% of the total global production. However, the authors also want to point out that the use-phase emission can be significantly reduced if green hydrogen, namely hydrogen from the electrolysis of water powered with renewables, is used to feed the fuel-cell system [92,93]. The results of the comparative analysis for the use phase are shown in Figure 7, while the results in terms of the FU are presented in Table 10. It can be stated that a major impact comes from fuel consumption, with service maintenance having a negligible effect on the total use-phase emissions. In all the selected impact categories, the fuel-cell powertrain showed an important reduction in the related emissions. Specifically, for the HTPnc, PMFP, FETP, HOFP and EOFP categories, the fuel-cell powertrain was estimated to reduce more than 90% of the impact of the vehicle use phase. The category in which the difference between the two powertrains was found to be smaller is the FFP category (−10%), mainly because the hydrogen was assumed to be obtained from fossil fuels, mostly methane. Indeed, steam methane reforming is the most adopted process for gray hydrogen production and involves natural gas as feedstock. Thus, the process has a relevant impact in terms of fossil fuel resource depletion. Specifically, the reforming reaction produces H2 and CO starting from CH4 and H2O and is characterized by a strong endothermic behavior. As for the GWP100 category, the fuel-cell powertrain showed a reduction of approximately 41%, which is coherent with the results obtained in other papers available in the literature when comparing fuel-cell hybrid electric cars with their traditional counterparts [94,95].

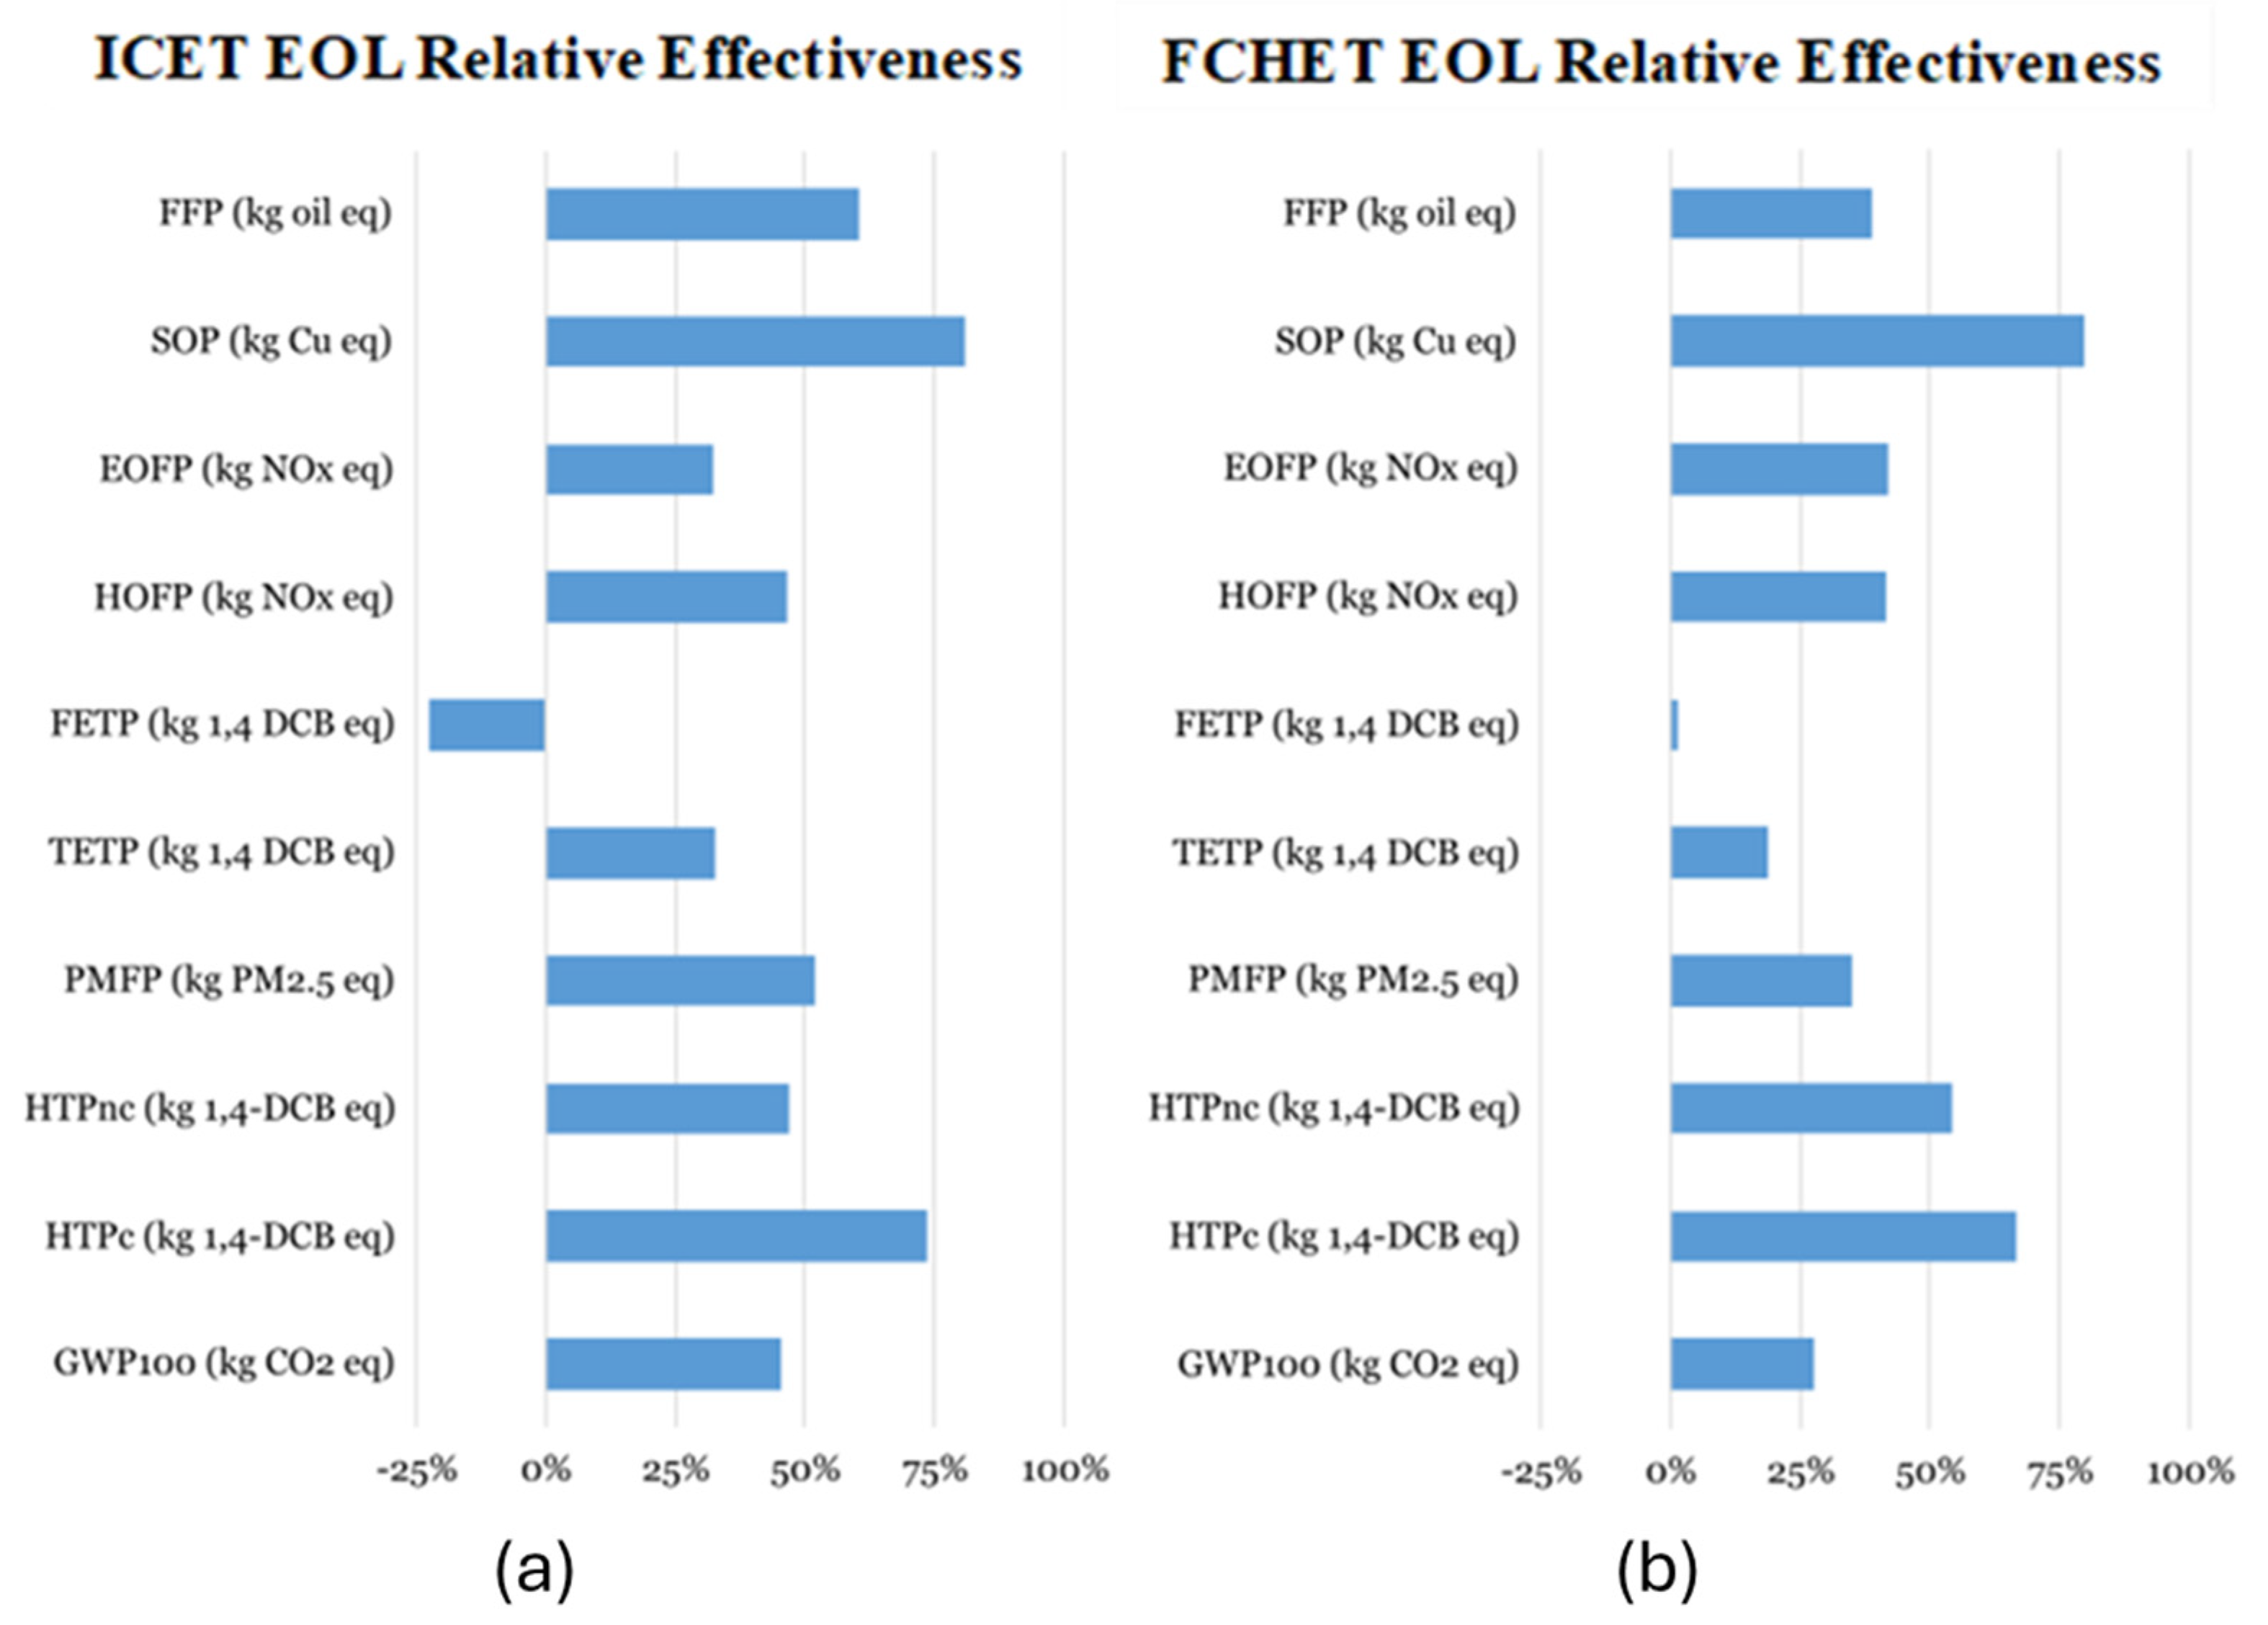
3.3. End-of-Life Results

The EOL analysis considered the following steps: transport of the elements, dismantling, disposal and recycling processes. Figure 8 shows a comparative analysis between the ICET and FCHET for the EOL phase. The transport and dismantling processes contribute with additional impact since they require additional energy to be performed. Nevertheless, other involved processes, such as energy extraction or material recycling, generally reduce the overall life cycle impact. In particular, the high recycling rates of metals allow for a significant reduction in the equivalent emissions of most of the considered impact categories. The only case in which the EOL phase contributes to an increase in emissions is the ICET in the FETP category. As can be seen from Figure 1, the EOL phase emission reduction is more relevant for the FCHET, mainly due to the Pt recycling process. The only impact category in which the ICET showed a higher emission reduction with respect to the FCHET is the HTPc category. On the other hand, the HTPnc category is the one in which the FCHET showed a greater difference compared to the ICET. Table 11 reports the results of the EOL analysis in terms of the functional unit. The delta percentages reported in the table represent the percentage difference of the FCHET in comparison with the ICET. Consequently, a negative delta percentage means a higher impact reduction for the FCHET due to its end-of-life phase.

3.4. Global Results

In this section, the overall results for the entire life cycle of both vehicles are presented. In Figure 9, the chart of the results for each impact category is shown, reported as percentages with respect to the traditional case, whereas in Table 12, the numerical results of the entire life cycle are presented.
As can be seen, both the chart and the table underline the great potential of the FCHET to reduce the vehicle impact in all the selected impact categories. Indeed, the use of an FCHET can lead to several benefits in terms of damage to human health, ecosystems and resource availability. Specifically, considering the HTPnc, HOFP and EOFP categories, the FCHET showed a reduction of more than 90% in the related equivalent emissions. The only category in which the two tractors reported almost the same impact is the FFP category, in which the difference in the life cycle emissions was estimated at 4.55%. This can be related to the hydrogen production process, which in this study involves fossil fuel resources. Another important difference that can be highlighted from the comparison between the two tractors regards the relative most impactful life cycle stage. For the ICET, the major contributor is represented by the use phase. This result is in accordance with other studies available in the literature [35,36,96]. On the contrary, for the FCHET, the manufacturing stage is the most critical in six of the ten considered impact categories. The use phase is the principal contributor in those categories, such as GWP100 and FFP, whose related emissions are strictly correlated to the use of fossil fuels. Another important consideration concerns the importance of recycling. To explain this concept, the authors defined “EOL relative effectiveness” (EOLRE) as the ratio (expressed in percentage) between the EOL impact, with a minus sign, and the production impact for each impact category considered in this study:
E O L R E = E O L i m p a c t P r o d u c t i o n i m p a c t 100
It can be considered as an expression of how much the impact can be reduced thanks to the recovery of materials and energy in the product system considered, according to a circular economy vision. Observing the chart in Figure 10, it can be stated that, with the only exception of the FETP category, the EOL stage allows for a reduction of between 25% and 80% in the impact related to the production stage. This is valid for both tractors, demonstrating how powerful the recycling process can be.
Although this study demonstrates the relevant benefits of adopting FCHETs in substitution with ICETs, several aspects could be further improved. Firstly, increasing the amount of green and blue hydrogen, namely hydrogen coming from renewable sources and fossil fuels but with carbon capture technologies, will certainly reduce the impact of the use phase (60–90% GHG emission reduction) [27,97]. As said before, in the analysis of the production stage of the FCHET, the fuel-cell stack and the hydrogen tank emerged as bottlenecks for the environment. Thus, academics and manufacturers should investigate alternative solutions to produce them, such as considering the reduction in platinum loading or the redesign of the hydrogen tank [47,59]. Another important aspect that should be addressed regards fuel-cell system efficiency, which can be improved in the upcoming years [98]. Lastly, another aspect that could be addressed and is valid for both the FCHET and the ICET concerns vehicle mass optimization, which could lead to spare emissions because of propellant consumption and production emission reduction [35].

3.5. Life Cycle Impact Adopting Green Hydrogen

In recent years, with the growing interest in hydrogen-based powertrains, the involved stakeholders began to economically invest in greener and more sustainable ways to produce hydrogen. For this reason, in this section, a brief overview of the potential environmental impact of the FCHET using green hydrogen as a propellant is discussed. The expression “green hydrogen” is usually used when referring to hydrogen produced through the electrolysis of water powered with electricity coming from renewables. Sometimes, the expression is used more generally for hydrogen produced with associated emissions or under other specific sustainability criteria. To assess the impact of using green hydrogen to propel the FCHET, in this paper, the electrolysis of water is considered. According to this process, an electrolyzer is powered with electricity to separate H2O, namely deionized water, into oxygen and hydrogen ions. At the cathode, hydrogen ions then combine to form H2. The whole process can be described according to the following reactions:
A n o d e : 2 H 2 O l O 2 g + 4 H + a q + 4 e
C a t o d e : 4 H + a q + 4 e 2 H 2 g
In this study, the green hydrogen production scenario considers the production of in-house green hydrogen by the farmer using a small PEM electrolyzer and a 3 kWp (peak kW) solar panel to provide the electricity necessary for hydrogen generation. Furthermore, an 80% efficiency of the electrolyzer is assumed [99]. Table 13 reports the LCI for the production process of 1 kg of green hydrogen.
The results of the cradle-to-grave life cycle assessment of the FCHET powered with green hydrogen are reported and compared with the ICET and FCHET with gray hydrogen cases in Table 14.
The obtained results highlighted that, for certain impact categories such as GWP and FFP, which are particularly linked to the exploitation of fossil fuels, the use of green hydrogen allowed a further reduction in the environmental impact of the tractor with respect to the FCHET using gray hydrogen. Thus, green hydrogen can be a feasible path to mitigate global warming and fossil fuel resource depletion. On the contrary, for most of the other impact categories, the use of green hydrogen showed worse results compared to the use of gray hydrogen and, in the TETP and FETP categories, even worse than the ICET case. These results may be explained by the use of photovoltaic panels that are constituted using materials that may have a significant impact in those categories [100]. Indeed, the use of electricity coming from other renewables, such as wind farms, might have a lower impact [101]. However, the authors wanted to focus on the case in which the electrolysis was powered using solar panels since it is a more feasible way in which a farm can independently produce electricity on its own. Even if the results might be surprising, they are coherent with other studies available in the literature, which showed that, in some specific impact categories, green hydrogen might be worse than hydrogen coming from fossil fuels [102].

4. Conclusions

The purpose of the presented study is to perform an environmental impact comparison between a traditional internal combustion engine (ICET) and a fuel-cell hybrid electric (FCHET) orchard tractor. The comparison was conducted using life cycle assessment methodology and considering the entire life cycle of the two products. The entire life cycle comprises three main stages: production, use phase and end of life. As for the production, it takes into account all the processes involved from raw material extraction to the final vehicle assembly. The use-phase stage considers the emissions related to the operative life of the tractor, thus concerning fuel consumption and maintenance. Finally, the end-of-life stage aims at reducing the overall life cycle impact through material recycling and energy extraction processes. According to ISO 14040 and ISO 14044 standard series, the analysis was conducted by defining goals and scopes, system boundaries and the functional unit. Then, the life cycle inventories for the production and end-of-life stages of the two product systems were developed grouping the main components into five categories: power generation, chassis and transmission, electric and electronics, cooling and hydraulics and other. As for the use phase, numerical models were exploited to determine the propellant consumptions of the ICET and FCHET according to typical work scenarios. The impact assessment was conducted considering ten different impact categories, defined by ReCiPe 2016 v 1.03 at the midpoint level and related to human health, ecosystem preservation and resource depletion. From the analysis, it can be stated that the FCHET tractor showed relevant reductions in almost all the considered impact categories, with estimated reductions ranging from 4.55% for the FFP category to more than 92% for the HTPnc category. However, the analysis also highlighted that the production stage of the FCHET is critical compared to the traditional ICET. Indeed, in most of the categories, the production of the FCHET exhibited higher impact levels, with peaks of almost +200%. However, the stage that swings the balance is the use phase. As a matter of fact, even if considering the use of gray hydrogen, the FCHET reported very high emission savings in most of the considered impact categories. Finally, the EOL stage results highlighted the importance of energy and material recovery, especially for some materials, like platinum, whose production process is particularly impactful. However, there are several areas that should be improved to reduce the overall impact of the FCHET, regarding both the fuel-cell system design, involving the introduction of new materials or the development of more efficient systems, and the hydrogen production mix, with the amount of green and blue hydrogen that should progressively increase at the expense of gray hydrogen. In this context, the authors also considered the case of the FCHET tractor powered using green hydrogen produced through the electrolysis of water powered with solar panels. The results showed that, using green hydrogen produced in this way, a significant further reduction in the impact in the GWP100 and FFP categories can be obtained. On the other hand, for the other categories, the results were worse than the FCHET powered with gray hydrogen. In conclusion, the study demonstrates that fuel-cell powertrains can be an effective strategy to replace traditional systems in the sector of Non-Road Mobile Machinery, with the aim of reducing their impact on human health, environmental pollution and resource depletion.

Author Contributions

Conceptualization, S.M., V.M., F.M. and A.S.; methodology, S.M. and V.M.; formal analysis, S.M. and V.M.; investigation, S.M. and V.M.; resources, S.M. and V.M.; data curation, S.M. and V.M.; writing—original draft preparation, S.M. and V.M.; writing—review and editing, S.M., V.M., F.M. and A.S.; visualization, S.M., V.M., F.M. and A.S.; supervision, S.M., F.M. and A.S.; project administration, A.S. All authors have read and agreed to the published version of the manuscript.

Funding

This research received no external funding.

Data Availability Statement

The original contributions presented in the study are included in the article, further inquiries can be directed to the corresponding author.

Conflicts of Interest

The authors declare no conflicts of interest.

Abbreviations

AC: Alternating Current; BMS: Battery Management System; BoP: Balance of Plant; BSFC: Brake-Specific Fuel Consupmtion; CE: Circular Economy; CFRP: Carbon-Fiber-Reinforced Polymer; DC: Direct Current; DMC: Dimethyl Carbonate; EC: Ethylene Carbonate; EOL: End of Life; FC: Fuel Cell; EOFP: Photochemical Oxidant Formation For Terrestrial Ecosystems; FCHET: Fuel-Cell Hybrid Electric Tractor; FETP: Freshwater Ecotoxicity; FFP: Fossil Fuel Potential; FU: Functional Unit; GDLs: Gas Diffusion Layers; GHG: Green House Gasses; GWP: Global Warming Potential; HDPE: High-Density Polyethylene; HOFP: Photochemical Oxidant Formation for Humans; HTPc: Human Toxicity Carcinogenic; HTPnc: Human Toxicity Non-carcinogenic ICE: Internal Combustion Engine; ICET: Internal Combustion Engine Tractor; LCA: Life Cycle Assessment; LCI: Life Cycle Inventory; LFP: Lithium Iron Phosphate; LV: Low Voltage; PCB: Printed Circuit Board PE: Polyethylene; PET: Polyethylene Terephthalate; PEMFC: Polymer-Electrolyte Membrane Fuel Cell; PMFP: Particulate Matter Formation Potential; PP: Polypropylene; PTFE: Polytetrafluoroethylene; PTO: Power Take-Off; PVDC: Polyvinylidene Difluoride; SOP: Surplus Ore Potential; TETP: Terrestrial Ecotoxicity.

Appendix A

The values of the polynomial coefficients for the engine fuel consumption estimation model are reported in Table A1.
Table A1. Coefficients for the engine fuel consumption estimation model.
CoefficientValue
b1172.28
b2−0.7
b3−1.03089
b40.0064989
b50.00276
b60.00769

References

  1. Singh, J.; Schädler, M.; Demetrio, W.; Brown, G.G.; Eisenhauer, N. Climate change effects on earthworms—A review. Soil Org. 2019, 91, 114–138. [Google Scholar] [CrossRef]
  2. Stott, P.A.; Christidis, N.; Otto, F.E.L.; Sun, Y.; Vanderlinden, J.; van Oldenborgh, G.J.; Vautard, R.; von Storch, H.; Walton, P.; Yiou, P.; et al. Attribution of extreme weather and climate-related events. WIREs Clim. Change 2016, 7, 23–41. [Google Scholar] [CrossRef]
  3. Patz, J.A.; Campbell-Lendrum, D.; Holloway, T.; Foley, J.A. Impact of regional climate change on human health. Nature 2005, 438, 310–317. [Google Scholar] [CrossRef]
  4. Christoff, P. The promissory note: COP 21 and the Paris Climate Agreement. Environ. Politics 2016, 25, 765–787. [Google Scholar] [CrossRef]
  5. Wang, J.X.; Burke, H.; Zhang, A. Overcoming barriers to circular product design. Int. J. Prod. Econ. 2022, 243, 108346. [Google Scholar] [CrossRef]
  6. Arruda, E.H.; Melatto, R.A.P.B.; Levy, W.; de Melo Conti, D. Circular economy: A brief literature review (2015–2020). Sustain. Oper. Comput. 2021, 2, 79–86. [Google Scholar] [CrossRef]
  7. Zhao, L.; Lv, Y.; Wang, C.; Xue, J.; Yang, Y.; Li, D. Embodied greenhouse gas emissions in the international agricultural trade. Sustain. Prod. Consum. 2023, 35, 250–259. [Google Scholar] [CrossRef]
  8. Secten—Le Rapport de Référence sur les Émissions de gaz à Effet de Serre et de Polluants Atmosphériques en France. Available online: https://www.citepa.org/fr/secten/ (accessed on 8 August 2024).
  9. Taghizadeh-Hesary, F.; Taghizadeh-Hesary, F. The impacts of air pollution on health and economy in Southeast Asia. Energies 2020, 13, 1812. [Google Scholar] [CrossRef]
  10. Dai, C.; Qin, X.S.; Zhang, X.L.; Liu, B.J. Study of climate change impact on hydro-climatic extremes in the Hanjiang River basin, China, using CORDEX-EAS data. Weather Clim. Extrem. 2022, 38, 100509. [Google Scholar] [CrossRef]
  11. Platis, D.; Anagnostopoulos, C.; Tsaboula, A.; Menexes, G.; Kalburtji, K.; Mamolos, A. Energy Analysis, and Carbon and Water Footprint for Environmentally Friendly Farming Practices in Agroecosystems and Agroforestry. Sustainability 2019, 11, 1664. [Google Scholar] [CrossRef]
  12. Martelli, S.; Mocera, F.; Somà, A. Co-Simulation of a Specialized Tractor for Autonomous Driving in Orchards; SAE Technical Paper: Warrendale, PA, USA, 2022. [Google Scholar] [CrossRef]
  13. Mocera, F.; Martelli, S.; Somà, A. State of the Art and Future Trends of Electrification in Agricultural Tractors; SAE Technical Paper: Warrendale, PA, USA, 2022. [Google Scholar] [CrossRef]
  14. Mocera, F.; Martini, V. Numerical Performance Investigation of a Hybrid eCVT Specialized Agricultural Tractor. Appl. Sci. 2022, 12, 2438. [Google Scholar] [CrossRef]
  15. Mocera, F.; Martini, V.; Somà, A. Comparative Analysis of Hybrid Electric Architectures for Specialized Agricultural Tractors. Energies 2022, 15, 1944. [Google Scholar] [CrossRef]
  16. Martini, V.; Mocera, F.; Somà, A. Design and Experimental Validation of a Scaled Test Bench for the Emulation of a Hybrid Fuel Cell Powertrain for Agricultural Tractors. Appl. Sci. 2023, 13, 8582. [Google Scholar] [CrossRef]
  17. Mocera, F.; Somà, A.; Martelli, S.; Martini, V. Trends and Future Perspective of Electrification in Agricultural Tractor-Implement Applications. Energies 2023, 16, 6601. [Google Scholar] [CrossRef]
  18. Mocera, F.; Martelli, S.; Costamagna, M. Dynamic behaviour of a battery pack for agricultural applications. IOP Conf. Ser. Mater. Sci. Eng. 2022, 1214, 012032. [Google Scholar] [CrossRef]
  19. Di Ilio, G.; Di Giorgio, P.; Tribioli, L.; Bella, G.; Jannelli, E. Preliminary design of a fuel cell/battery hybrid powertrain for a heavy-duty yard truck for port logistics. Energy Convers. Manag. 2021, 243, 114423. [Google Scholar] [CrossRef]
  20. Ahluwalia, R.K.; Wang, X.; Star, A.G.; Papadias, D.D. Performance and cost of fuel cells for off-road heavy-duty vehicles. Int. J. Hydrogen Energy 2022, 47, 10990–11006. [Google Scholar] [CrossRef]
  21. Pardhi, S.; Chakraborty, S.; Tran, D.D.; El Baghdadi, M.; Wilkins, S.; Hegazy, O. A Review of Fuel Cell Powertrains for Long-Haul Heavy-Duty Vehicles: Technology, Hydrogen, Energy and Thermal Management Solutions. Energies 2022, 15, 9557. [Google Scholar] [CrossRef]
  22. Jia, C.; He, H.; Zhou, J.; Li, K.; Li, J.; Wei, Z. A performance degradation prediction model for PEMFC based on bi-directional long short-term memory and multi-head self-attention mechanism. Int. J. Hydrogen Energy 2024, 60, 133–146. [Google Scholar] [CrossRef]
  23. Jia, C.; Zhou, J.; He, H.; Li, J.; Wei, Z.; Li, K. Health-conscious deep reinforcement learning energy management for fuel cell buses integrating environmental and look-ahead road information. Energy 2024, 290, 130146. [Google Scholar] [CrossRef]
  24. Teng, Z.; Tan, C.; Liu, P.; Han, M. Analysis on carbon emission reduction intensity of fuel cell vehicles from a life-cycle perspective. Front. Energy 2024, 18, 16–27. [Google Scholar] [CrossRef]
  25. Fernández, R.Á.; Pérez-Dávila, O. Fuel cell hybrid vehicles and their role in the decarbonisation of road transport. J. Clean Prod. 2022, 342, 130902. [Google Scholar] [CrossRef]
  26. Liu, F.; Shafique, M.; Luo, X. Quantifying delayed climate mitigation benefits in electric and fuel cell vehicle deployment for sustainable mobility. Sustain. Prod. Consum. 2024, 49, 398–414. [Google Scholar] [CrossRef]
  27. Ji, M.; Wang, J. Review and comparison of various hydrogen production methods based on costs and life cycle impact assessment indicators. Int. J. Hydrogen Energy 2021, 46, 38612–38635. [Google Scholar] [CrossRef]
  28. Mattetti, M.; Maraldi, M.; Lenzini, N.; Fiorati, S.; Sereni, E.; Molari, G. Outlining the mission profile of agricultural tractors through CAN-BUS data analytics. Comput. Electron. Agric. 2021, 184, 106078. [Google Scholar] [CrossRef]
  29. Liu, M.; Li, Y.; Xu, L.; Wang, Y.; Zhao, J. General modeling and energy management optimization for the fuel cell electric tractor with mechanical shunt type. Comput. Electron. Agric. 2023, 213, 108178. [Google Scholar] [CrossRef]
  30. Xu, W.; Liu, M.; Xu, L.; Zhang, S. Energy Management Strategy of Hydrogen Fuel Cell/Battery/Ultracapacitor Hybrid Tractor Based on Efficiency Optimization. Appl. Sci. 2022, 13, 151. [Google Scholar] [CrossRef]
  31. Yang, H.; Sun, Y.; Xia, C.; Zhang, H. Research on Energy Management Strategy of Fuel Cell Electric Tractor Based on Multi-Algorithm Fusion and Optimization. Energies 2022, 15, 6389. [Google Scholar] [CrossRef]
  32. ISO 14040:2006; Environmental Management Life Cycle Assessment Principles and Framework 2006. International Standard Organization ISO: Geneva, Switzerland, 2006. Available online: https://www.iso.org/standard/37456.html (accessed on 2 October 2023).
  33. ISO 14044:2006; Environmental Management—Life Cycle Assessment—Requirements and Guidelines. Available online: https://www.iso.org/standard/38498.html (accessed on 12 July 2024).
  34. Cerutti, A.K.; Bruun, S.; Beccaro, G.L.; Bounous, G. A review of studies applying environmental impact assessment methods on fruit production systems. J. Environ. Manag. 2011, 92, 2277–2286. [Google Scholar] [CrossRef]
  35. Martelli, S.; Mocera, F.; Somà, A. Carbon Footprint of an Orchard Tractor through a Life-Cycle Assessment Approach. Agriculture 2023, 13, 1210. [Google Scholar] [CrossRef]
  36. Martelli, S.; Mocera, F.; Somà, A. New Challenges Towards Electrification Sustainability: Environmental Impact Assessment Comparison Between ICE and Hybrid-Electric Orchard Tractor; SAE Technical Paper: Warrendale, PA, USA, 2023. [Google Scholar] [CrossRef]
  37. EUROSTAT. Agricultural Production—Orchards 2019. Available online: https://ec.europa.eu/eurostat/statistics-explained/index.php?title=Agricultural_production_-_orchards (accessed on 18 March 2023).
  38. Pala, G.S. Trattrici: +17% in Europa Nonostante le Difficoltà. AgroNotizie, Le Novità per l’agricoltura 2022. Available online: https://agronotizie.imagelinenetwork.com/agrimeccanica/2022/03/28/trattrici-17-in-europa-nonostante-le-difficolta/74450 (accessed on 18 March 2023).
  39. Martini, V.; Mocera, F.; Somà, A. Numerical Investigation of a Fuel Cell-Powered Agricultural Tractor. Energies 2022, 15, 8818. [Google Scholar] [CrossRef]
  40. Franceschetti, B.; Rondelli, V.; Capacci, E. Lateral Stability Performance of Articulated Narrow-Track Tractors. Agronomy 2021, 11, 2512. [Google Scholar] [CrossRef]
  41. Wolff, S.; Seidenfus, M.; Gordon, K.; Álvarez, S.; Kalt, S.; Lienkamp, M. Scalable Life-Cycle Inventory for Heavy-Duty Vehicle Production. Sustainability 2020, 12, 5396. [Google Scholar] [CrossRef]
  42. Liu, Z.; Li, T.; Jiang, Q.; Zhang, H. Life Cycle Assessment–based Comparative Evaluation of Originally Manufactured and Remanufactured Diesel Engines. J. Ind. Ecol. 2014, 18, 567–576. [Google Scholar] [CrossRef]
  43. Larsson, G.; Hansson, P.-A. Environmental impact of catalytic converters and particle filters for agricultural tractors determined by life cycle assessment. Biosyst. Eng. 2011, 109, 15–21. [Google Scholar] [CrossRef]
  44. Mantoam, E.J.; Romanelli, T.L.; Gimenez, L.M. Energy demand and greenhouse gases emissions in the life cycle of tractors. Biosyst. Eng. 2016, 151, 158–170. [Google Scholar] [CrossRef]
  45. Dong, Y.; Zhao, Y.; Hossain, M.U.; He, Y.; Liu, P. Life cycle assessment of vehicle tires: A systematic review. Clean. Environ. Syst. 2021, 2, 100033. [Google Scholar] [CrossRef]
  46. Manoharan, Y.; Hosseini, S.E.; Butler, B.; Alzhahrani, H.; Senior, B.T.F.; Ashuri, T.; Krohn, J. Hydrogen Fuel Cell Vehicles; Current Status and Future Prospect. Appl. Sci. 2019, 9, 2296. [Google Scholar] [CrossRef]
  47. Usai, L.; Hung, C.R.; Vásquez, F.; Windsheimer, M.; Burheim, O.S.; Strømman, A.H. Life cycle assessment of fuel cell systems for light duty vehicles, current state-of-the-art and future impacts. J. Clean. Prod. 2021, 280, 125086. [Google Scholar] [CrossRef]
  48. U.S. Department of Energy O of EE& REH and FCTO. DOE Technical Targets for Polymer Electrolyte Membrane Fuel Cell Components n.d. Available online: https://www.energy.gov/eere/fuelcells/doe-technical-targets-polymer-electrolyte-membrane-fuel-cell-components (accessed on 13 December 2023).
  49. Wang, Y.; Ruiz Diaz, D.F.; Chen, K.S.; Wang, Z.; Adroher, X.C. Materials, technological status, and fundamentals of PEM fuel cells—A review. Mater. Today 2020, 32, 178–203. [Google Scholar] [CrossRef]
  50. Simons, A.; Bauer, C. A life-cycle perspective on automotive fuel cells. Appl. Energy 2015, 157, 884–896. [Google Scholar] [CrossRef]
  51. Miotti, M.; Hofer, J.; Bauer, C. Integrated environmental and economic assessment of current and future fuel cell vehicles. Int. J. Life Cycle Assess. 2017, 22, 94–110. [Google Scholar] [CrossRef]
  52. Sun, X.; Simonsen, S.; Norby, T.; Chatzitakis, A. Composite Membranes for High Temperature PEM Fuel Cells and Electrolysers: A Critical Review. Membranes 2019, 9, 83. [Google Scholar] [CrossRef] [PubMed]
  53. Yoshida, T.; Kojima, K. Toyota MIRAI Fuel Cell Vehicle and Progress Toward a Future Hydrogen Society. Interface Mag. 2015, 24, 45–49. [Google Scholar] [CrossRef]
  54. Mori, M.; Iribarren, D.; Cren, J.; Cor, E.; Lotrič, A.; Gramc, J.; Drobnič, B.; Rey, L.; Campos-Carriedo, F.; Puig-Samper, G.; et al. Life cycle sustainability assessment of a proton exchange membrane fuel cell technology for ecodesign purposes. Int. J. Hydrogen Energy 2023, 48, 39673–39689. [Google Scholar] [CrossRef]
  55. Vidović, T.; Tolj, I.; Radica, G.; Bodrožić Ćoko, N. Proton-Exchange Membrane Fuel Cell Balance of Plant and Performance Simulation for Vehicle Applications. Energies 2022, 15, 8110. [Google Scholar] [CrossRef]
  56. Sinha, J.; Lasher, S.; Yang, Y.; Kopf, P. Direct Hydrogen PEMFC Manufacturing Cost Estimation for Automotive Applications. Fuel Cell Tech Team Review 2004. Available online: https://www.energy.gov/eere/fuelcells/articles/direct-hydrogen-pemfc-manufacturing-cost-estimation-automotive-applications (accessed on 13 December 2023).
  57. Carlson, E.J.; Kopf, P.; Sinha, J.; Sriramulu, S.; Yang, Y. Cost Analysis of PEM Fuel Cell Systems for Transportation 2005. Available online: https://www.nrel.gov/docs/fy06osti/39104.pdf (accessed on 13 December 2023).
  58. Hua, T.Q.; Roh, H.-S.; Ahluwalia, R.K. Performance assessment of 700-bar compressed hydrogen storage for light duty fuel cell vehicles. Int. J. Hydrogen Energy 2017, 42, 25121–25129. [Google Scholar] [CrossRef]
  59. Benitez, A.; Wulf, C.; de Palmenaer, A.; Lengersdorf, M.; Röding, T.; Grube, T.; Robinius, M.; Stolten, D.; Kuckshinrichs, W. Ecological assessment of fuel cell electric vehicles with special focus on type IV carbon fiber hydrogen tank. J. Clean. Prod. 2021, 278, 123277. [Google Scholar] [CrossRef]
  60. Dai, Q.; Kelly, J.C.; Gaines, L.; Wang, M. Life Cycle Analysis of Lithium-Ion Batteries for Automotive Applications. Batteries 2019, 5, 48. [Google Scholar] [CrossRef]
  61. Peters, J.F.; Weil, M. Providing a common base for life cycle assessments of Li-Ion batteries. J. Clean. Prod. 2018, 171, 704–713. [Google Scholar] [CrossRef]
  62. Hao, H.; Mu, Z.; Jiang, S.; Liu, Z.; Zhao, F. GHG Emissions from the Production of Lithium-Ion Batteries for Electric Vehicles in China. Sustainability 2017, 9, 504. [Google Scholar] [CrossRef]
  63. Sharmili, N.; Nagi, R.; Wang, P. A review of research in the Li-ion battery production and reverse supply chains. J. Energy Storage 2023, 68, 107622. [Google Scholar] [CrossRef]
  64. Lagnelöv, O.; Larsson, G.; Larsolle, A.; Hansson, P.-A. Life Cycle Assessment of Autonomous Electric Field Tractors in Swedish Agriculture. Sustainability 2021, 13, 11285. [Google Scholar] [CrossRef]
  65. Nordelöf, A.; Grunditz, E.; Tillman, A.-M.; Thiringer, T.; Alatalo, M. A scalable life cycle inventory of an electrical automotive traction machine—Part I: Design and composition. Int. J. Life Cycle Assess. 2018, 23, 55–69. [Google Scholar] [CrossRef]
  66. Nordelöf, A.; Grunditz, E.; Lundmark, S.; Tillman, A.-M.; Alatalo, M.; Thiringer, T. Life cycle assessment of permanent magnet electric traction motors. Transp. Res. D Transp. Environ. 2019, 67, 263–274. [Google Scholar] [CrossRef]
  67. Nordelöf, A.; Tillman, A.-M. A scalable life cycle inventory of an electrical automotive traction machine—Part II: Manufacturing processes. Int. J. Life Cycle Assess. 2018, 23, 295–313. [Google Scholar] [CrossRef]
  68. Sudha, B.; Vadde, A.; Sachin, S. A review: High power density motors for electric vehicles. J. Phys. Conf. Ser. 2020, 1706, 012057. [Google Scholar] [CrossRef]
  69. Baudais, B.; Ben Ahmed, H.; Jodin, G.; Degrenne, N.; Lefebvre, S. Life Cycle Assessment of a 150 kW Electronic Power Inverter. Energies 2023, 16, 2192. [Google Scholar] [CrossRef]
  70. Sato, F.E.K.; Nakata, T. Energy Consumption Analysis for Vehicle Production through a Material Flow Approach. Energies 2020, 13, 2396. [Google Scholar] [CrossRef]
  71. Bacenetti, J. How does annual utilisation can affect the environmental impact of tractors? A life-cycle assessment comparing hypothetical scenarios for farmers and agricultural contractors in Northern Italy. Biosyst. Eng. 2022, 213, 63–75. [Google Scholar] [CrossRef]
  72. Lovarelli, D.; Bacenetti, J.; Fiala, M. A new tool for life cycle inventories of agricultural machinery operations. J. Agric. Eng. 2016, 47, 40–53. [Google Scholar] [CrossRef]
  73. Kannangara, M.; Bensebaa, F.; Vasudev, M. An adaptable life cycle greenhouse gas emissions assessment framework for electric, hybrid, fuel cell and conventional vehicles: Effect of electricity mix, mileage, battery capacity and battery chemistry in the context of Canada. J. Clean. Prod. 2021, 317, 128394. [Google Scholar] [CrossRef]
  74. Ahmadi, P.; Khoshnevisan, A. Dynamic simulation and lifecycle assessment of hydrogen fuel cell electric vehicles considering various hydrogen production methods. Int. J. Hydrogen Energy 2022, 47, 26758–26769. [Google Scholar] [CrossRef]
  75. Beligoj, M.; Scolaro, E.; Alberti, L.; Renzi, M.; Mattetti, M. Feasibility Evaluation of Hybrid Electric Agricultural Tractors Based on Life Cycle Cost Analysis. IEEE Access 2022, 10, 28853–28867. [Google Scholar] [CrossRef]
  76. Golverk, A.A. The Method for Development of a Diesel Engine Universal Performance Map. J. Fuels Lubr. 1994, 103, 1041–1048. [Google Scholar]
  77. V3800-CR-T-E4B (2600 rpm) n.d. Available online: https://global.engine.kubota.co.jp/en/products/detail/82/ (accessed on 5 December 2023).
  78. Quan, R.; Li, Z.; Liu, P.; Li, Y.; Chang, Y.; Yan, H. Minimum hydrogen consumption-based energy management strategy for hybrid fuel cell unmanned aerial vehicles using direction prediction optimal foraging algorithm. Fuel Cells 2023, 23, 221–236. [Google Scholar] [CrossRef]
  79. Quan, R.; Guo, H.; Li, X.; Zhang, J.; Chang, Y. A real-time energy management strategy for fuel cell vehicle based on Pontryagin’s minimum principle. iScience 2024, 27, 109473. [Google Scholar] [CrossRef]
  80. Huang, Z.; Shen, J.; Chan, S.H.; Tu, Z. Transient response of performance in a proton exchange membrane fuel cell under dynamic loading. Energy Convers. Manag. 2020, 226, 113492. [Google Scholar] [CrossRef]
  81. Cruz Rojas, A.; Lopez Lopez, G.; Gomez-Aguilar, J.; Alvarado, V.; Sandoval Torres, C. Control of the Air Supply Subsystem in a PEMFC with Balance of Plant Simulation. Sustainability 2017, 9, 73. [Google Scholar] [CrossRef]
  82. Lohse-Busch, H.; Stutenberg, K.; Duoba, M.; Liu, X.; Elgowainy, A.; Wang, M.; Wallner, T.; Richard, B.; Christenson, M. Automotive fuel cell stack and system efficiency and fuel consumption based on vehicle testing on a chassis dynamometer at minus 18 °C to positive 35 °C temperatures. Int. J. Hydrogen Energy 2020, 45, 861–872. [Google Scholar] [CrossRef]
  83. Lotrič, A.; Sekavčnik, M.; Kuštrin, I.; Mori, M. Life-cycle assessment of hydrogen technologies with the focus on EU critical raw materials and end-of-life strategies. Int. J. Hydrogen Energy 2021, 46, 10143–10160. [Google Scholar] [CrossRef]
  84. Jin, H.; Afiuny, P.; McIntyre, T.; Yih, Y.; Sutherland, J.W. Comparative Life Cycle Assessment of NdFeB Magnets: Virgin Production versus Magnet-to-Magnet Recycling. Procedia CIRP 2016, 48, 45–50. [Google Scholar] [CrossRef]
  85. Vasconcelos, D.d.S.; Tenório, J.A.S.; Botelho Junior, A.B.; Espinosa, D.C.R. Circular Recycling Strategies for LFP Batteries: A Review Focusing on Hydrometallurgy Sustainable Processing. Metals 2023, 13, 543. [Google Scholar] [CrossRef]
  86. Song, Y.; Xie, B.; Song, S.; Lei, S.; Sun, W.; Xu, R.; Yang, Y. Regeneration of LiFePO4 from spent lithium-ion batteries via a facile process featuring acid leaching and hydrothermal synthesis. Green Chem. 2021, 23, 3963–3971. [Google Scholar] [CrossRef]
  87. Martínez-Hernando, M.P.; García-Franco, E.; Bolonio, D.; Ortega, M.F.; García-Martínez, M.J. Life cycle sustainability assessment of the platinum supply chain in the European Union. Sustain. Prod. Consum. 2024, 46, 679–689. [Google Scholar] [CrossRef]
  88. Duclos, L.; Lupsea, M.; Mandil, G.; Svecova, L.; Thivel, P.-X.; Laforest, V. Environmental assessment of proton exchange membrane fuel cell platinum catalyst recycling. J. Clean. Prod. 2017, 142, 2618–2628. [Google Scholar] [CrossRef]
  89. Hauschild, M.Z.; Huijbregts, M.A.J. Introducing Life Cycle Impact Assessment. In Life Cycle Impact Assessment. LCA Compendium—The Complete World of Life Cycle Assessment; Hauschild, M., Huijbregts, M., Eds.; Springer: Dordrecht, The Netherlands, 2015; pp. 1–16. [Google Scholar] [CrossRef]
  90. Huijbregts, M.A.J.; Steinmann, Z.J.N.; Elshout, P.M.F.; Stam, G.; Verones, F.; Vieira, M.; Zijp, M.; van Zelm, R. ReCiPe2016, a harmonised life cycle impact assessment method at midpoint and endpoint level. Int. J. Life Cycle Assess. 2017, 22, 138–147. [Google Scholar] [CrossRef]
  91. International Energy Agency IEA. Global Hydrogen Review 2022. 2022. Available online: https://www.iea.org/reports/global-hydrogen-review-2022 (accessed on 13 December 2023).
  92. Martini, V.; Mocera, F.; Somà, A. Carbon Footprint Enhancement of an Agricultural Telehandler through the Application of a Fuel Cell Powertrain. World Electr. Veh. J. 2024, 15, 91. [Google Scholar] [CrossRef]
  93. Henriksen, M.S.; Matthews, H.S.; White, J.; Walsh, L.; Grol, E.; Jamieson, M.; Skone, T.J. Tradeoffs in life cycle water use and greenhouse gas emissions of hydrogen production pathways. Int. J. Hydrogen Energy 2024, 49, 1221–1234. [Google Scholar] [CrossRef]
  94. Liu, X.; Reddi, K.; Elgowainy, A.; Lohse-Busch, H.; Wang, M.; Rustagi, N. Comparison of well-to-wheels energy use and emissions of a hydrogen fuel cell electric vehicle relative to a conventional gasoline-powered internal combustion engine vehicle. Int. J. Hydrogen Energy 2020, 45, 972–983. [Google Scholar] [CrossRef]
  95. Buberger, J.; Kersten, A.; Kuder, M.; Eckerle, R.; Weyh, T.; Thiringer, T. Total CO2-equivalent life-cycle emissions from commercially available passenger cars. Renew. Sustain. Energy Rev. 2022, 159, 112158. [Google Scholar] [CrossRef]
  96. Lee, J.; Cho, H.; Choi, B.; Sung, J.; Lee, S.; Shin, M. Life cycle assessment of tractors. Int. J. Life Cycle Assess. 2000, 5, 205–208. [Google Scholar] [CrossRef]
  97. Xu, X.; Zhou, Q.; Yu, D. The future of hydrogen energy: Bio-hydrogen production technology. Int. J. Hydrogen Energy 2022, 47, 33677–33698. [Google Scholar] [CrossRef]
  98. Chen, Z.; Huang, H.; Shi, T.; Peng, X.; Feng, J. Efficiency improvement and Thermo-economic analysis of proton exchange membrane fuel cell system with energy recovery for both air and hydrogen. Appl. Therm. Eng. 2023, 233, 121114. [Google Scholar] [CrossRef]
  99. Zhang, J.; Li, J. Revolution in Renewables: Integration of Green Hydrogen for a Sustainable Future. Energies 2024, 17, 4148. [Google Scholar] [CrossRef]
  100. Krebs-Moberg, M.; Pitz, M.; Dorsette, T.L.; Gheewala, S.H. Third generation of photovoltaic panels: A life cycle assessment. Renew. Energy 2021, 164, 556–565. [Google Scholar] [CrossRef]
  101. Khan, M.H.A.; Sitaraman, T.; Haque, N.; Leslie, G.; Saydam, S.; Daiyan, R.; Amal, R.; Kara, S. Strategies for life cycle impact reduction of green hydrogen production—Influence of electrolyser value chain design. Int. J. Hydrogen Energy 2024, 62, 769–782. [Google Scholar] [CrossRef]
  102. Shen, H.; Crespo del Granado, P.; Jorge, R.S.; Löffler, K. Environmental and climate impacts of a large-scale deployment of green hydrogen in Europe. Energy Clim. Change 2024, 5, 100133. [Google Scholar] [CrossRef]
Figure 1. ICET (a) and FCHET (b) driveline architectures. Please note that, for simplicity, the BoP of the fuel-cell system is not represented in (b).
Energies 17 04599 g001
Figure 2. Boundaries of the analysis.
Energies 17 04599 g002
Figure 3. Tractor mass distribution among the different sub-assemblies.
Energies 17 04599 g003
Figure 4. Simplified schematic of a typical BoP system for PEMFC stacks. Green: hydrogen adduction system. Orange: heat management system. Blue: air adduction system. Light Blue: water management system.
Energies 17 04599 g004
Figure 5. EOL scenario for both orchard tractors.
Energies 17 04599 g005
Figure 6. Production-phase gate-to-gate results.
Energies 17 04599 g006
Figure 7. Use-phase gate-to-gate results.
Energies 17 04599 g007
Figure 8. EOL gate-to-gate results.
Energies 17 04599 g008
Figure 9. Cradle-to-grave results. Please note that the sum of Manufacturing, Use phase and EOL is always 100% for the ICET case.
Energies 17 04599 g009
Figure 10. ICET (a) and FCHET (b) EOL relative effectiveness.
Energies 17 04599 g010
Table 1. ICET Production-Phase LCI.
Sub-AssemblyMacro-ComponentValue [kg per FU]
Power GenerationEngine1.30 × 10−2
Aftertreatment system8.00 × 10−4
Chassis and TransmissionChassis4.54 × 10−2
Transmission1.94 × 10−2
Tires8.00 × 10−3
Electrical Auxiliary Services System12 V lead-acid battery8.00 × 10−4
PCB4.00 × 10−5
Cabling6.00 × 10−4
Vehicle control units1.20 × 10−4
Cooling and Hydraulic SystemsRadiators (aluminum)1.60 × 10⁻³
Steel pipe2.20 × 10−3
Rubber1.12 × 10−3
Brass 2.60 × 10⁻³
Other CategorySeat6.00 × 10−4
Rollbar1.20 × 10−3
Dashboard4.00 × 10−4
External bodywork1.00 × 10−3
Paint2.00 × 10−4
Screw1.40 × 10−3
Table 2. FCHET powertrain main properties.
FC stack rated power66 kW
Li-ion battery pack capacity6 kWh
Li-ion battery pack rated voltage240 V
Electric motor rated power75 kW
Electric motor rated speed2600 rpm
Table 3. Assumptions made during the evaluation of the life cycle inventory of the FC stack.
Stack power density1.095 W/cm2
Total-to-active-area ratio0.625
Membrane active area6.03 m2
Membrane materialNafion, 25.4 μm thick
Pt load0.32 mg/cm2active
GDLCarbon paper with PTFE, 210 μm thick
Microporous layerCarbon black and PTFE, 50 μm thick
Bipolar plate materialStainless steel with coating
Table 4. Battery pack, electric motor and power converter material and mass distribution.
Powertrain
Element
Sub-ComponentMaterial% wt.
Battery PackCathodeLiFePO4 (active material)25%
AnodeGraphite (active material)20%
BinderPVDC2%
ElectrolyteLiFP6 + solution 1:1 EC and DMC9%
SeparatorPE + PP5%
BMS-5%
Cell containerAluminum4%
Module casingAluminum20%
Pack caseAluminum and steel10%
Electric MotorStator and rotor coresElectrical steel with coating46%
Conducting wireCopper with insulation materials11%
Rotor endplatesStainless steel1.5%
Motor shaftStainless steel4%
HousingAluminum25%
MagnetsNd(Dy)FeB3%
Other-9.5%
Power ConverterCasingAluminum with varnish62%
BusbarCopper layers insulated by PET9%
Power moduleCopper, plastics, silicone gel, galvanized steel7%
DC link capacitorPlastic-film-type capacitance7%
PCB-4%
Other-11%
Table 5. FCHET Power Generation sub-assembly LCI.
Macro-ComponentValue FU [ k g · k g V 1 · y 1 ]
FC Stack1.60 × 10−3
Air Compressor2.00 × 10−4
Water Management3.00 × 10−4
Heat Management6.00 × 10−4
Hydrogen Supply System1.60 × 10−4
Hydrogen Tank4.40 × 10−3
DC/DC Converter2.40 × 10−4
Battery Pack2.40 × 10−3
Inverter2.40 × 10−4
Electric Motor1.80 × 10−3
Signal and Power Cabling6.00 × 10−4
Table 6. Production phase transport contribution.
Group TransportValue FU [ k g · k m · k g V 1 · y 1 ]
ICETFCHET
Group 13.39 × 103.33 × 10
Group 21.974.59
Table 7. Annual duty cycle of an orchard tractor, according to Beligoj et al. [75].
TaskAnnual Work Time (%)Avg. Power (kW)
Weeding14.3%35.6
Use of atomizer14.3%42.1
Grape harvesting14.3%20.7
Plant lifting plowing28.6%11.0
Use of tying machine28.6%5.3
Table 8. ICET and FCHET use-phase LCIs.
VehicleMacro-ComponentValue FU [ 1 · k g V 1 · y 1 ]
ICETPropellant (Diesel Fuel)2.24 kg
Engine Lubricant Oil1.08 × 102 kg
Hydraulic Oil
Tires2.40 × 10−2 kg
Transport (Road Transport)5.69 × 10² kgkm
FCHETPropellant (Gray Hydrogen)5.08 × 10⁻¹ kg
Hydraulic Oil3.60 × 10−3 kg
Tires2.40 × 10−2 kg
Transport (Road Transport)1.34 × 10² kgkm
Table 9. Production-phase numerical results. Please note that a positive delta percentage means a higher impact for the FCHET with respect to the ICET.
Impact CategoryICETFCHET∆ %
GWP100 [ k g C O 2 e q . · k g V 1 · y 1 ]6.01 × 10−11.1183.72%
HTPc [ k g 1 , 4 D C B e q . · k g V 1 · y 1 ]4.04 × 10−14.03 × 10−1−0.34%
HTPnc [ k g 1 , 4 D C B e q . · k g V 1 · y 1 ]1.22 3.53189.42%
PMFP [ k g P M 2.5 e q . · k g V 1 · y 1 ]9.88 × 10−42.22 × 10−3124.60%
TETP [ k g 1 , 4 D C B e q . · k g V 1 · y 1 ] 3.206.1793.05%
FETP [ k g 1 , 4 D C B e q . · k g V 1 · y 1 ] 7.01 × 10−21.67 × 10−1138.85%
HOFP [ k g N O x e q . · k g V 1 · y 1 ] 1.52 × 10−33.51 × 10−3127.56%
EOFP [ k g N O x e q . · k g V 1 · y 1 ] 2.66 × 10−33.67 × 10−338.22%
SOP [ k g C u e q . · k g V 1 · y 1 ] 1.48 × 10−12.54 × 10−172.01%
FFP [ k g O i l e q . · k g V 1 · y 1 ] 2.11 × 10−13.48 × 10−165.26%
Table 10. Use-phase numerical results. Please note that a negative delta percentage means a lower impact for the FCHET with respect to the ICET.
Impact CategoryICETFCHET∆ %
GWP100 [ k g C O 2 e q . · k g V 1 · y 1 ] 8.605.05−41.28%
HTPc [ k g 1 , 4 D C B e q . · k g V 1 · y 1 ] 6.82 × 10−11.02 × 10−1−85.08%
HTPnc [ k g 1 , 4 D C B e q . · k g V 1 · y 1 ] 3.09 × 106.15 × 10−1−98.01%
PMFP [ k g P M 2.5 e q . · k g V 1 · y 1 ] 2.03 × 10−21.30 × 10−3−93.60%
TETP [ k g 1 , 4 D C B e q . · k g V 1 · y 1 ] 3.08 × 103.97−87.08%
FETP [ k g 1 , 4 D C B e q . · k g V 1 · y 1 ] 3.43 × 10−13.57 × 10−2−89.61%
HOFP [ k g N O x e q . · k g V 1 · y 1 ]6.66 × 10−24.08 × 10−3−93.88%
EOFP [ k g N O x e q . · k g V 1 · y 1 ] 6.84 × 10−24.88 × 10−3−92.87%
SOP [ k g C u e q . · k g V 1 · y 1 ]2.75 × 10−14.04 × 10−2−85.30%
FFP [ k g O i l e q . · k g V 1 · y 1 ]2.422.17−10.07%
Table 11. End-of-life numerical results.
Impact CategoryICETFCHET∆ %
GWP100 [ k g C O 2 e q . · k g V 1 · y 1 ]−2.74 × 10⁻¹−3.04 × 10⁻¹−10.85%
HTPc [ k g 1 , 4 D C B e q . · k g V 1 · y 1 ]−2.97 × 10⁻¹−2.68 × 10⁻¹+9.72%
HTPnc [ k g 1 , 4 D C B e q . · k g V 1 · y 1 ]−5.73 × 10⁻¹−1.92−234.30%
PMFP [ k g P M 2.5 e q . · k g V 1 · y 1 ]−5.15 × 10⁻⁴−7.80 × 10⁻⁴−51.42%
TETP [ k g 1 , 4 D C B e q . · k g V 1 · y 1 ]−1.05 × 10−1.16 × 10−1−10.70%
FETP [ k g 1 , 4 D C B e q . · k g V 1 · y 1 ]1.57 × 10⁻²−2.39 × 10⁻³−115.21%
HOFP [ k g N O x e q . · k g V 1 · y 1 ]−7.19 × 10⁻⁴−1.46 × 10⁻³−102.56%
EOFP [ k g N O x e q . · k g V 1 · y 1 ]−8.59 × 10⁻⁴−1.53 × 10⁻³−78.24%
SOP [ k g C u e q . · k g V 1 · y 1 ]−1.20 × 10⁻¹−2.03 × 10⁻¹−69.71%
FFP [ k g O i l e q . · k g V 1 · y 1 ]−1.28 × 10⁻¹−1.36 × 10⁻¹−6.34%
Table 12. Cradle-to-grave numerical results.
Impact CategoryICETFCHET∆ %
GWP100 [ k g C O 2 e q . · k g V 1 · y 1 ]8.935.85−34.46%
HTPc [ k g 1 , 4 D C B e q . · k g V 1 · y 1 ]7.89 × 10−12.36 × 10−1−70.04%
HTPnc [ k g 1 , 4 D C B e q . · k g V 1 · y 1 ]3.15 × 102.23−92.92%
PMFP [ k g P M 2.5 e q . · k g V 1 · y 1 ]2.08 × 10−22.74 × 10−3−86.82%
TETP [ k g 1 , 4 D C B e q . · k g V 1 · y 1 ]3.29 × 108.99−72.71%
FETP [ k g 1 , 4 D C B e q . · k g V 1 · y 1 ]4.29 × 10−12.01 × 10−1−53.20%
HOFP [ k g N O x e q . · k g V 1 · y 1 ]6.75 × 10−26.13 × 10−3−90.91%
EOFP [ k g N O x e q . · k g V 1 · y 1 ]7.02 × 10−27.02 × 10−3−90.00%
SOP [ k g C u e q . · k g V 1 · y 1 ]3.03 × 10−19.19 × 10−2−69.71%
FFP [ k g O i l e q . · k g V 1 · y 1 ]2.502.38−4.55%
Table 13. LCI to produce 1 kg of green hydrogen.
ElementQuantity
Deionized water9 kg
Electrical power (from PV panels)160 kWh
Table 14. Cradle-to-grave result comparison among the three cases.
Impact CategoryFCHET with Green HydrogenDifference with Respect to ICETDifference with Respect to FCHET Using Gray Hydrogen
GWP 100   [ k g C O 2 e q . · k g V 1 · y 1 ]2.31−74%−60%
HTPc   [ k g 1 , 4 D C B e q . · k g V 1 · y 1 ]3.67 × 10⁻¹−53%+55%
HTPnc   [ k g 1 , 4 D C B e q . · k g V 1 · y 1 ]9.21−71%+313%
PMFP   [ k g P M 2.5 e q . · k g V 1 · y 1 ]5.80 × 10⁻³−72%+112%
TETP   [ k g 1 , 4 D C B e q . · k g V 1 · y 1 ]6.90 × 10+110%+668%
FETP   [ k g 1 , 4 D C B e q . · k g V 1 · y 1 ]1.01+135%+401%
HOFP   [ k g N O x e q . · k g V 1 · y 1 ]7.19 × 10⁻³−89%+17%
EOFP   [ k g N O x e q . · k g V 1 · y 1 ]7.50 × 10⁻³−89%+7%
SOP   [ k g C u e q . · k g V 1 · y 1 ]1.22 × 10⁻¹−60%+32%
FFP   [ k g O i l e q . · k g V 1 · y 1 ]6.80 × 10⁻¹−73%−71%
Disclaimer/Publisher’s Note: The statements, opinions and data contained in all publications are solely those of the individual author(s) and contributor(s) and not of MDPI and/or the editor(s). MDPI and/or the editor(s) disclaim responsibility for any injury to people or property resulting from any ideas, methods, instructions or products referred to in the content.

