Article

Effect of Heating Rate on the Pyrolysis Behavior and Kinetics of Coconut Residue and Activated Carbon: A Comparative Study

1
Key Laboratory of Coal Clean Conversion and Chemical Process Autonomous Region, College of Chemistry and Chemical Engineering, Xinjiang University, Urumqi 830000, China
2
State Key Laboratory of Coal Combustion, School of Energy and Power Engineering, Huazhong University, Wuhan 430074, China
3
Department of Chemistry, Shaheed Benazir Bhutto University Sheringal, Dir Upper 18000, Khyber Pakhtunkhwa, Pakistan
4
Department of Chemistry, Abdul Wali Khan University, Mardan 23200, Khyber Pakhtunkhwa, Pakistan
5
Program in Environmental and Polymer Engineering, Graduate School of INHA University, 100 Inha-ro, Michuhol-gu, Incheon 22212, Republic of Korea
6
Department of Environmental Engineering, INHA University, 100 Inha-ro, Michuhol-gu, Incheon 22212, Republic of Korea
*
Authors to whom correspondence should be addressed.
Energies 2024, 17(18), 4605; https://doi.org/10.3390/en17184605
Submission received: 1 August 2024 / Revised: 26 August 2024 / Accepted: 6 September 2024 / Published: 13 September 2024
(This article belongs to the Collection Feature Papers in Advanced Energy Materials)

Abstract

:
The pyrolysis process of coconut residue and the activated carbon was investigated using thermogravimetric analysis in the range of 25 to 900 °C, with three altered heating rates: 3, 5, and 10 °C/min. The results of the thermal decomposition showed that it occurred in three distinct phases: dehydration, active pyrolysis, and passive pyrolysis. The derivative thermogravimetric analysis indicated that increasing the heating rate led to a shift in the maximum weight loss rate towards higher temperatures. To better understand the kinetics constraints, the Coats–Redfern method was applied to determine the activation energy (Ea) and the frequency factor (A). The activation energies for the pyrolysis process varied between 159.57 and 177.45 kJ/mol for RCR and from 132.62 to 147.1 kJ/mol for ACCR at different heating rates. Additionally, the physical properties of the samples were investigated using techniques like scanning electron microscopy and the Brunauer–Emmett–Teller surface analysis. The findings of the study demonstrated that the activation energies of the activated carbon were lower than those of the original biomass. Furthermore, the activation energy values achieved from the D1–D4 models were considered reliable, indicating that the D model was more suitable compared to other models for describing the pyrolysis process and predicting its kinetics.

1. Introduction

Biomass has played a crucial role in supporting life on the Earth, serving as a source of food, heat for cooking and buildings, and energy for industries for centuries [1]. However, with the rise of fossil fuels, which include sources like coal, oil, and gas, biomass was largely overshadowed. The increased emissions of greenhouse gases, particularly carbon dioxide, have shifted the focus back to biomass [2]. Unlike fossil fuels, biomass releases carbon dioxide during combustion but absorbs the released CO2 again via photosynthesis, making it a renewable and carbon-rich energy source [3].
In the pursuit of renewable and sustainable energy sources, biomass has gained global attention as a potential replacement for fossil fuels. Kinetic modeling plays a significant role in converting biomass into energy and valuable products through thermal degradation [4]. Pyrolysis, one of the degradation processes of biomass, has received considerable interest due to its importance. Furthermore, these technologies offer a promising way to utilize agricultural and forestry residues, making them highly attractive for energy production [5].
Thermogravimetric analysis (TGA), which measures changes in sample weight with increasing temperature, provides valuable kinetic parameters for biomass degradation. These parameters include the activation energy, pre-exponential factor, and the order of reaction [6]. Thermal investigation indicates that activation energy is a crucial factor controlling reactivity and influencing reaction rates, while the pre-exponential factor is associated with the material’s structure. Thus, the reactivity of biomass is assessed through activation energy [7]. However, the kinetic constraints are influenced by operational conditions such as sample size, heating rate, moisture content, and heating medium. In the scientific literature, there are numerous approaches detailed for determining the activation energy and pre-exponential factors, making direct comparisons challenging [6].
Several studies have investigated the kinetic properties of biomass. Zakrzewski’s [8] study provides detailed kinetic parameters for the pyrolysis of pine particles, including activation energies ranging from 91.8 to 175.8 kJ/mol and pre-exponential factors between 91.8 to 175.8 kJ/mol and 4.7 × 10⁵ to 7.2 × 101 min−1. These values are higher compared to some other biomasses, indicating more energy-intensive decomposition. Understanding these parameters helps in optimizing pyrolysis processes by adjusting heating rates, reactor design, and energy input to achieve efficient and cost-effective biomass conversion. Gao [9] examined and compared studies on similar feedstocks (rice straw) to assess how different additives influence activation energy and decomposition kinetics in the presence of O2 and N2. The literature study indicates that the activation energy of the biomass was found to be inferior 74 kJ/mol compared to briquette 126 kJ/mol. Reina et al. [10] examined the thermogravimetric properties of forest wood through dynamic and isothermal procedures in an inert environment. Different heating rates, from 5 to 100 °C/min, were used in dynamic experiments. The activation energies obtained were 130.1, 136.20, and 128.0 kJ/mol, with 1.89 × 10⁷, 3.40 × 10⁷, and 1.24 × 10⁷ s−1 pre-exponential factors [10]. Deka et al. [11] analyzed three types of hardwood, using thermogravimetric in the presence of nitrogen, employing heating rates of 20–30 °C/min, in the temperature range 30–650 °C. Overall, these studies contribute to our understanding of the kinetic properties of biomass and indicate its significant promise as a renewable energy source.
The aim of this investigation was to conduct a new study focused on the production of activated carbon for use as an adsorbent in the removal of dyes from wastewater. This topic was previously discussed in our earlier papers [6,12]. In addition, we aimed to investigate the kinetics of the thermal decomposition of both the raw biomass and the activated carbon by employing thermogravimetric analysis using different heating rates to enable a comparative analysis of the thermal behavior under an inert atmosphere. The experimental data at various heating rate are correlated to the achieved activation energy and the coefficients corresponding to different solid conversions.

2. Experimental

2.1. Raw Materials

The coconut residue was crushed and constantly heated for 8 h at high temperatures in an oxygen-free environment, yielding a carbon product. The carbon was leached with a 0.2 N nitric acid and hydrochloric acid solution in 1:1 and left for 24 h at 25 °C with regular mixing. The sample was washed until it became neutral. The samples were further activated with n-hexane to remove organic content.
The biomass waste of the coconut residue (RCR) and activated carbon (ACCR), which were prepared from the corresponding biomass, were selected for the kinetic study. Table 1 presents data related to the proximate and ultimate analysis of the samples. These samples were processed by grinding and passing through a mesh with a size range of 70–170, and they were subsequently dried at a temperature of 80 °C for a duration exceeding 5 h.

2.2. Pyrolysis through TGA

The samples of the activated carbon and raw biomass were subjected to thermal degradation analysis using a TA instrument SDT Q600 thermogravimetric analyzer (New Castle, DE, USA). The mass loss of the samples was measured with a perseverance of 0.1 mg as a function of temperature. A sample of 5 to 10 mg was placed in a TGA microbalance. The temperature was increased from 25 to 900 °C at an altered heating rate of 3, 5, and 10 °C/min in the presence of an inert atmosphere. These heating rates were chosen to ensure that thermal degradation occurred at low or moderate rates, minimizing any potential heat transfer effects [13]. To create an inert atmosphere and prevent oxidative degradation, highly pure nitrogen gas was injected into the furnace at a flow rate of 100 mL/min at 25 °C and atmospheric pressure. Before each run, nitrogen gas was introduced into the furnace for 10 to 15 min to establish the inert atmosphere.
The loss of biomass, observed as the TG curve, was measured using an electronic scale in conjunction with the linearly increasing furnace temperature. The crucible temperature, representing the actual temperature of the solid, was monitored using a thermocouple attached to the crucible surface. This allowed for the determination of the exothermic and endothermic nature of the pyrolysis reaction. The mass loss (TG curve) was obtained by subtracting the recorded mass variation on the electronic scale at a given heating rate. To analyze the derivative thermogravimetric analysis (DTG) curve specific to the sample, the TG curve was differentiated without any smoothing correction of the data. It is important to note that this approach may introduce some deviations when estimating the kinetic parameters [14,15]. In order to ensure precision and consistency of the collected data, parallel blank runs were conducted, and all observations were recorded in triplicate, with average values reported.

2.3. Kinetic Studies

Kinetic studies of the pyrolysis of raw and activated carbon determined the consequences of temperature and time of reaction on the degradation process. Pyrolysis is a very complex procedure, but some scholars [4,16] have estimated the degradation process in one reaction.
The equation belonging to the kinetic reaction is as follows:
d α dt = kf α
where (k) is the rate constant (min−1), α is known as the degree of conversion, and η is the order of reaction. The degree of conversion α can be stated as follows:
α = w o w w o w × 100 %
(w) indicates the weight of the biomass at time (t), with Wo and W, which indicate the preliminary and final weight in the reaction.
Arrhenius’s equation was used to calculate the activation energy.
k = Aexp E RT
R indicates the universal gas constant which is equal to (8.314 J K−1 mol−1), (A) is known as a pre-exponential factor, whereas (E) determines the activation energy (kJ mol−1).
β indicates the constant heating rate at temperature (T), changed with respect to time (t).
β = dT / dt
Rearrange Equation (1)
d α dT = A β exp E RT f α
G α = 0 α d α f α = 0 T A β exp E RT dT = A β 1 E , T = AE β R P x
Here, E RT and P(x) symbolize the temperature integral
P x = x exp x x 2 dx
It is verified that the thermal condition is independent of the experiments; the kinetic constraints (A) and (E) are accessible through Equation (7), depending on the integral from the Equation (5).

Coats–Redfern Method

The Coats–Redfern method is a technique used to determine kinetic parameters, such as activation energy, by analyzing a single thermogravimetric (TG) curve. This method involves mathematical operations that include integration and logarithms [17].
ln ln 1 α T 2 = ln AR β E 1 2 RT E E RT   n = 1
ln ln ( 1 a ) 1 n T 2 1 n = ln AR β E 1 2 RT E E RT   n 1
For the most activation energy E , 2 RT E 1   so   ln AR β E 1 2 RT E ln AR β E , this could be considered as a constant.
Devolatilization is a complicated procedure; several investigators [18] have approached the pyrolysis process as a single-rate reaction. A graph of ln ln 1 α T 2 is plotted against 1 T showing a straight line with slope of ( E R ), with an intercept of ln AR β E , providing the value of (E) and (A) [5,19]. Subsequently, obtaining the kinetic constraints, the degree of conversion α can be determined by Equation (9):
1 α CR = exp ART 2 β E exp E RT
ln g x T 2 = ln AR β E 1 2 RT E E R 1 T
In this study, an investigation of various mechanisms was conducted to regulate the most suitable kinetic mechanism that provides a detailed understanding of the thermal oxidation process of the samples. The Coats–Redfern method was chosen as it is widely used and considered a reliable technique for thermodynamic purposes [20]. The choice of the Coats–Redfern method was also influenced by Petrovic and Zavargo [21], who demonstrated that this method yielded activation energy and pre-exponential values that were approximately 2% lower compared to other methods.
By employing the Coats–Redfern method, it was supposed that the heat transfer within the particles was negligible due to the reduction in the raw biomass and activated carbon. This assumption allowed for the consideration of continuous parallel reactions, which provided a more comprehensive understanding of the thermal oxidation process. Overall, the Coats–Redfern method was deemed appropriate for this study as it offered a reliable and accurate approach for determining the kinetic parameters of the reaction.

3. Results and Discussion

3.1. Thermogravimetric Analysis

Based on the TGA results, the recorded curves were divided into three regions which indicate the thermal decomposition of organic matter in the biomass. The TG and DTG curves of the raw coconut residue (RCR) and activated carbon from coconut residue (ACCR) are shown in Figure 1. The samples were treated at altered heating rates (3, 5, and 10 °C/min) in the presence of nitrogen. The first phase observed in the DTG curve corresponded to the release of water vapor and highly volatile compounds from the biomass. In the second phase, the highest weight loss happened, which was attributed to the degradation as well as the elimination of residual char after the volatiles were eliminated from the biomass. The chemical treatment of the char samples resulted in a lower percentage of volatiles being released during the main degradation time. Furthermore, previous studies indicated that the realization of char hinders the emission of volatile substance from the surface; this action leads to a decrease in the quantity of volatile substances [22,23,24]. This suggests that the adsorbed chemicals have an inhibitive effect on the degradation behavior of the treated samples [25,26,27].
The speed at which the initial phase operates, primarily containing moisture and volatile components, was not investigated in the recent study, as it had been studied in previous papers. The temperature zone corresponding to mass loss is provided in Supplementary Data Table S1. Figure 1 represents the mass loss as a function of temperature at different heating rates for the RCR and ACCR samples. The solid residue yield was 26.22% and 27.97% for the RCR and ACCR, respectively, at 5 °C/min. The peak temperatures of RCR pyrolysis were 319 °C, 330 °C, and 338 °C, while for ACCR they were 322 °C, 340 °C, and 356 °C at 3–10 °C/min.
The maximum degradation observed in the TG and DTG curves was influenced by the increase in heating rate. However, the dehydration zone did not exhibit significant differences among the heating rates. As the heating rate increased, the highest points on the TG curves (indicating maximum mass loss) and the lowest points on the DTG curves (indicating the points of maximum rate of mass loss) shifted to higher temperatures. This can be attributed to the higher instantaneous thermal energy delivered to the system at lower heating rates; additionally, it took more time for the purge gas to stabilize and match the temperature inside the furnace. The higher heating rate resulted in shorter reaction times, thus shifting the maximum curves towards higher temperatures [27].
Referring to the information provided in the cited source [6], the first derivative of the TG curve that shows a decrease in mass over temperature (DTG), exhibited three decomposition phases for the spruce and bark samples. The first phase of decomposition occurred between 500 and 586 K. The next phase was between 615 and 680 K and displayed a peak at 645 K, leading to the maximal decomposition. The third stage took place within the temperature range of 692 to 875 K. Di Blasi’s [28] study also revealed that hemicellulose was decomposed at 495–590 K, while cellulose decomposition occurred between 615 and 680 K with a peak at 642 K.

3.2. Analysis of Thermal Decomposition Kinetics Using the Coats–Redfern Method

Bends reveal the solid-state mechanism for the second region of the samples through the Coats–Redfern method, as shown in Figure 1. As we can see from the figures, three different heating rates were applied for the raw sample and their activated carbon having altered slopes for the six solid-state mechanisms mentioned in Table 2 using the Coats–Redfern method. Through various mechanisms, the value of g(α) was examined. The most accurate mechanism should be selected on the basis of the greatest correlation coefficient and its activation energy. Table 3 indicates that most of the mechanisms followed the highest R2 value, closest to 1, for the thermal kinetics.

3.3. Evaluation of Kinetic Energy through Coats–Redfern Method

The validity of the model-based Coats–Redfern method for determining the degradation of RCR and ACCR was assessed using Equation (10), which relies on the Arrhenius equation. The Coats–Redfern method takes into the account the heating rate as a parameter. Table 2 presents the various kinetic models that were applied to identify the pyrolysis mechanism, while Table 3 provides the calculated kinetic parameters using different heating rates.
The results obtained from the thermogravimetric analysis were analyzed using different models to investigate the kinetic constraints, containing activation energy (E) and pre-exponential factor (A) as well as the regression equation and correlation coefficient (R2). The kinetic parameters were calculated by plotting the regression line and determining the slope and intercept. It was observed that the kinetic parameters obtained using different heating rates and various mechanisms yielded reaction models that reasonably fit the experimental data. All the models exhibited high correlation coefficients, suggesting a strong alignment between the predicted values and the experimental results.
Upon calculating the thermal kinetics of all the samples in Table 3, it is evident that the D1–D4 models are applicable to the second zone of pyrolysis, which is characterized as the “effective state mechanism”. Similar findings were reported by Agrawal et al. [29] and Zakrzewski et al. [8], who considered the degradation of wood samples and lignocellulosic materials, concluding that the D3 mechanism was the most effective model. Guo et al. [30] analyzed the pyrolysis of oil palm fibers at low temperatures and identified the three-dimensional diffusion mechanism as the most effective model. However, a first-order reaction was observed at a higher temperature. Vlaev et al. [31] investigated the degradation of lignocellulosic constituents using rice and discovered that the (D4) model, also known as the Ginstling–Brounshtein equation, provided a suitable description for diffusion-controlled reactions.
In a recent paper, multiple g(α) models were fitted to the experimental data and demonstrated high correlation coefficients (R2). However, one of the drawbacks of this method is that in many cases, more than one model can fit the experimental results, making it challenging to select the most appropriate model and accurately estimate the kinetic parameters. This challenge has been acknowledged in the literature [32], and a similar issue was encountered in the present study. To address this ambiguity and improve the accuracy of the model selection and estimation of the kinetic parameters, a combined approach involving TG analysis, dynamic studies, and isothermal studies can be implemented in future investigations. This integrated approach would provide a more comprehensive understanding of the homogeneous biomass and facilitate the determination of the appropriate model and thermal coefficients.
Figure 2 displays the plots obtained using the Coats–Redfern method for biomass and activated carbon samples. The activation energies for the pyrolysis process varied between 159.57 and 177.45 kJ/mol for RCR and from 132.62 to 147.1 kJ/mol for ACCR at different conversion values (V/V*), as shown in Table 3. It was observed that each stage of the conversion reaction corresponded to a specific activation energy during the pyrolysis process. The maximum activation energies recorded for the samples were 177.45 kJ/mol and 147.1 kJ/mol, respectively.

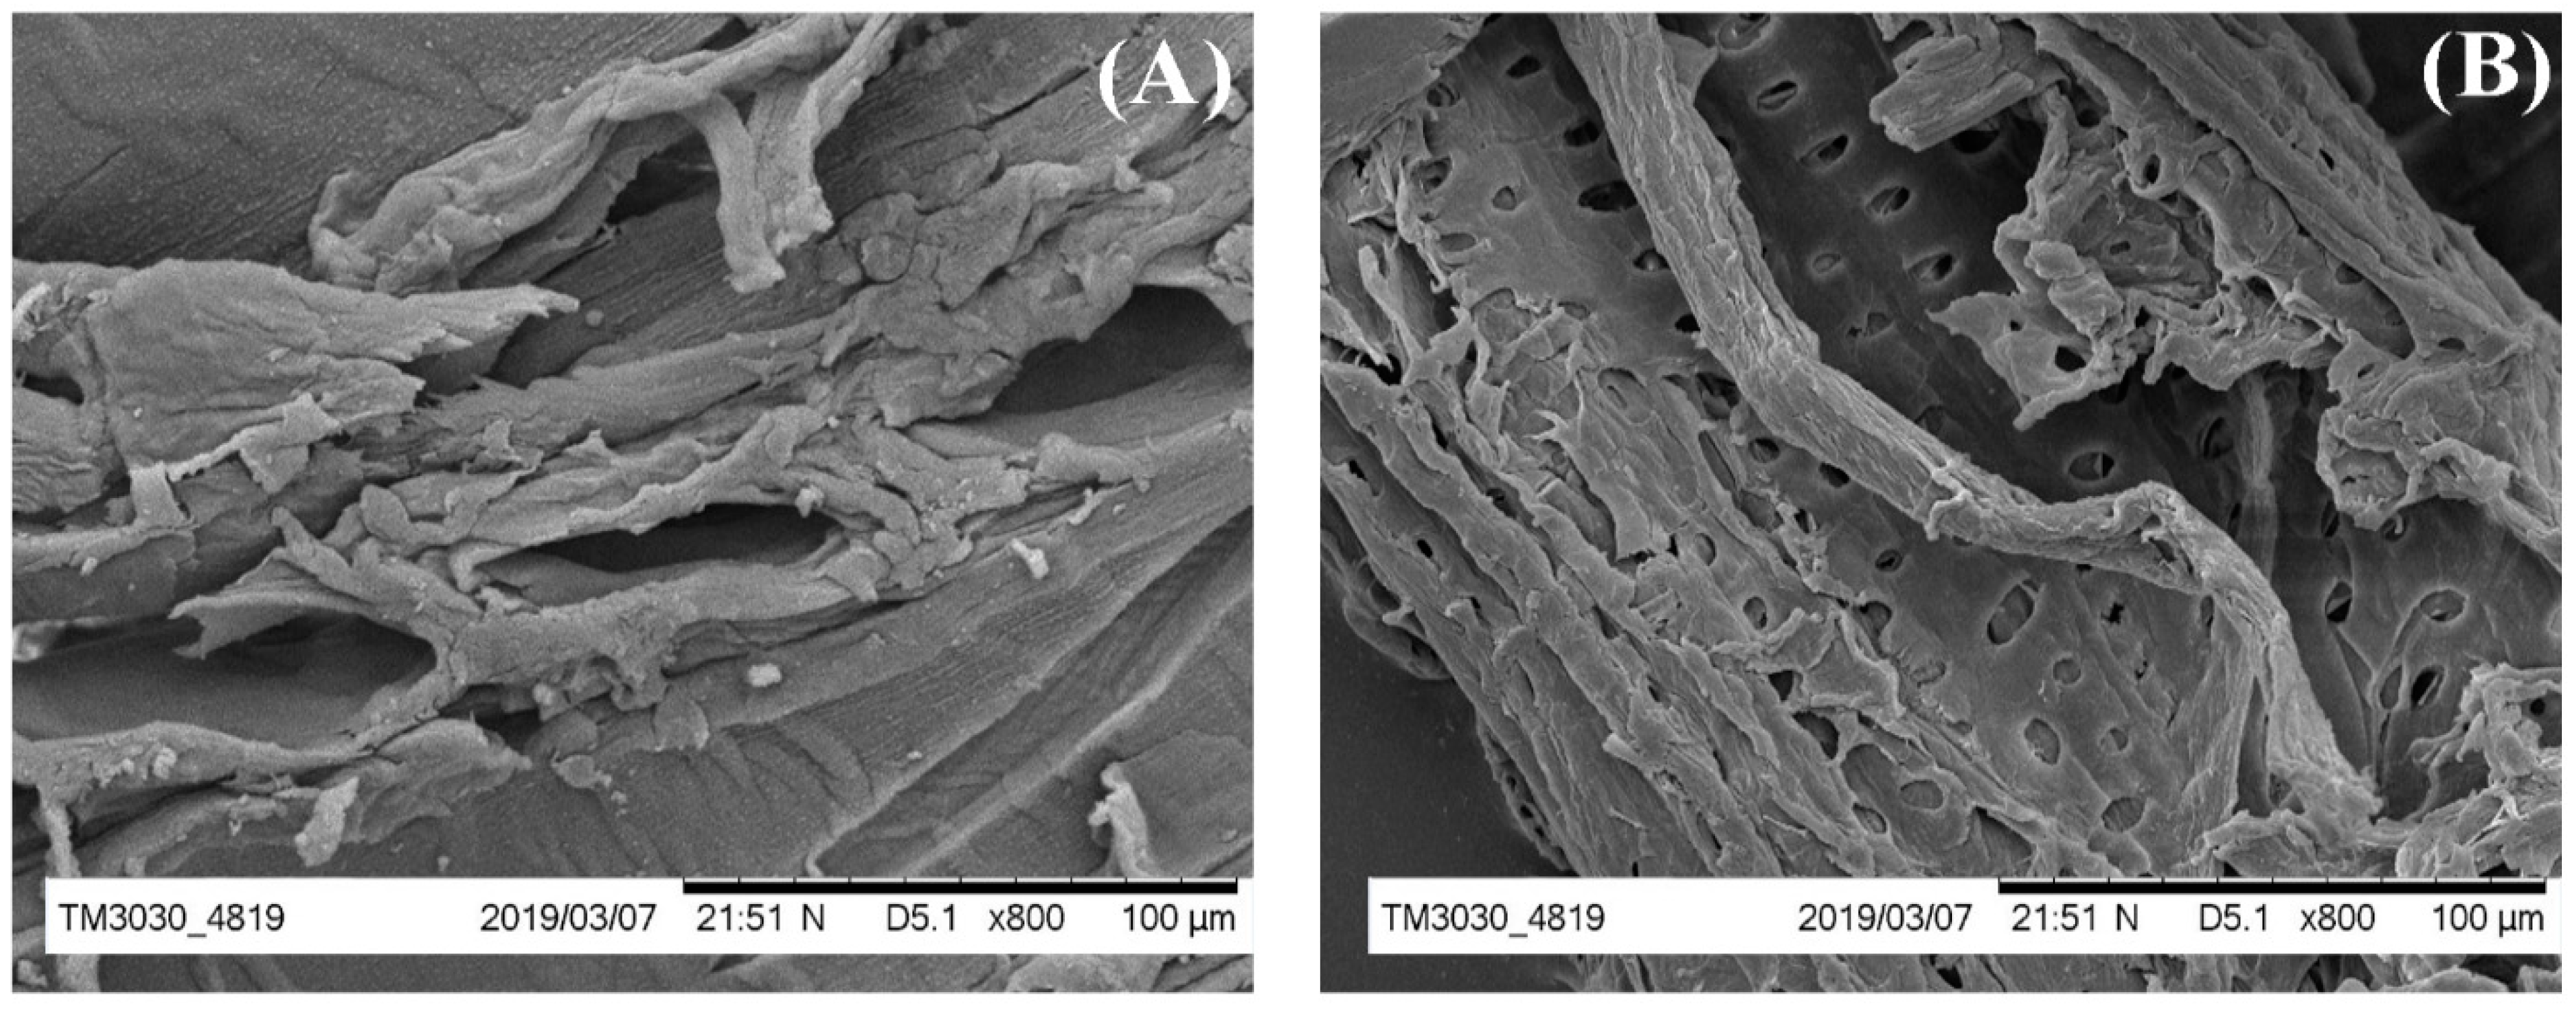
3.4. Scanning Electron Microscopy (SEM)

Particle size and morphology of the materials were analyzed by SEM (Scanning Electron Microscopy, JSM-6510A/JSM-6510LA, JEOL Ltd., Tokyo, Japan). Figure 3 displays the micrographs of the precursor material (coconut residue) and the activated carbon. The SEM analysis revealed that the morphology of the precursor material underwent significant changes after the pyrolysis and activation processes. The structure transformed into one with larger pores, indicating the decomposition of labile compounds during these processes. In contrast, the surface of the raw samples appeared smooth and lacked noticeable pores. However, after activation, a well-defined and developed pore structure became evident in the activated carbon micrograph. The surface of the activated carbon appeared smoother compared to the precursor material, suggesting a more refined and organized structure.
In summary, the SEM analysis demonstrated that the pyrolysis and activation processes resulted in morphological transformations, leading to the development of a porous structure in the activated carbon, which is advantageous for its adsorption properties.

3.5. Brunauer–Emmett–Teller (BET)

The BET (Brunauer, Emmett, and Teller) method, is a technique employed to determine the surface area of a sample. It operates on the principle of multilayer adsorption taking place in an inert atmosphere on the surface of an adsorbent. This method serves as a foundation for assessing the micro-porous surface area of the adsorbent [33].
The BET approach extends the Langmuir theory, initially developed for monolayer adsorption, to account for multilayer adsorption. It assumes that nitrogen (N2) molecules adhere to the surface of the adsorbent in various layers.
1 v [ P o P 1 ] = C 1 v m c p p o + 1 v m c
p and p o represent the adsorbate diffusion pressure, and the amount of gas adsorbed on the surface is represented as v , while v m indicates the volume of monolayer N2 adsorbed. The constant value in this context is denoted as c, as provided below:
c = exp E 1 E L R T
E 1 is used to denote the heat of sorption for the initial layer, while E L is employed for the subsequent layers. Equation (11) describes the adsorption isotherm by plotting v [ P o P 1 ]   vs .   = p / p o .   A indicates slope and intercept is represented by 1 ; both are utilized to analyze the adsorption of monolayer N2. v m is a constant, denoted as c , calculated using the following equation:
v m = 1 A + 1  
c = 1 + A I  
The equation below is commonly referred to as total specific surface area.
S BET , total = v m N s V
v m   signifies the molar volume of nitrogen gas, while V represents the molar volume of the adsorbate gas.
S B E T = S t o t a l a
The surface areas (SBET) of the activated carbon and the raw samples were attained from 1/W [(Po/P) − 1] versus P/Po adsorption of N2, which increased from 150 to 355 m2·g−1 for coconut residue. The findings indicate that the surface area expands as a result of the chemical treatment applied to the samples, as detailed in Table 4. This chemical treatment leads to the purification of the surface, removing foreign substances and enhancing it for adsorption purposes. Another contributing factor to the increased surface area is the presence of non-polar carbon groups on the sample surface, especially at elevated temperatures, which contributes to a more uniform surface, as outlined in reference [19].

4. Conclusions

In this study, coconut residue was subjected to pretreatment for the production of activated carbon. The kinetic pyrolysis of the samples was investigated using TGA under an inert atmosphere. The Coats–Redfern method was employed to analyze the kinetics and obtain novel insights. The average activation energies obtained by using the Coats–Redfern method were 29.24 and 177.45 kJ/mol and 29.24 to 147.1 kJ/mol using coconut residue and activated carbon, respectively, at heating rates of 3–10 °C/min. Moreover, the activation energies of the raw biomass were higher than the activated carbon. The experimental data exhibited a high correlation coefficient greater than 0.96, indicating a strong agreement between the predicted values and the experimental results. The SEM analysis confirmed an increased porous structure and specific surface area in all the prepared samples. Similarly, the BET analysis supported these findings. These factors, including the enhanced porous structure and specific surface area, were identified as key contributors to the lower activation energy observed in the activated carbon. These findings highlight the potential of coconut residue as a precursor for the production of activated carbon with desirable properties.

Supplementary Materials

The following supporting information can be downloaded at: https://www.mdpi.com/article/10.3390/en17184605/s1, Table S1: Characteristics of the raw biomass wastes and their activated carbon.

Author Contributions

All authors contributed to the study’s conception and design. Study design, experimental, writing, reviewing, and editing were performed by I.M. and N.R. Conceptualization, methodology, supervision, and validation were performed by X.L., H.U., A.K., C.C. and C.H. were responsible for reviewing and editing. All authors have read and agreed to the published version of the manuscript.

Funding

This research was funded by the National Key Research and Development Program of China (Grant No. SQ2019YFC190252).

Institutional Review Board Statement

This research work does not violate any of the ethical and moral consideration, in terms of animals and human use.

Informed Consent Statement

Not applicable.

Data Availability Statement

All data generated or analyzed during this research work are included in this article.

Acknowledgments

We acknowledge the cooperation and support of Higher Education Commission of Pakistan. The authors are also grateful to the National Key Research and Development Program of China (Grant No. SQ2019YFC190252) for the financial support and the research support provided through a Fulbright Visiting Scholar Award from the Korean-American Educational Commission, funded by the U.S. and Korean Governments.

Conflicts of Interest

The Authors declare that there are no conflicts of interest related to this work.

References

  1. Bach, Q.V.; Tran, K.Q.; Skreiberg, Ø.; Trinh, T.T. Effects of wet torrefaction on pyrolysis of woody biomass fuels. Energy 2015, 88, 443–456. [Google Scholar] [CrossRef]
  2. Bhavanam, A.; Sastry, R. Kinetic study of solid waste pyrolysis using distributed activation energy model. Bioresour. Technol. 2015, 178, 126–131. [Google Scholar] [CrossRef] [PubMed]
  3. Aksu, Z. Application of biosorption for the removal of organic pollutants: A review. Process Biochem. 2005, 40, 997–1026. [Google Scholar] [CrossRef]
  4. Çepelioğullar, Ö.; Pütün, A.E. Thermal and kinetic behaviors of biomass and plastic wastes in co-pyrolysis. Energy Convers. Manag. 2013, 75, 263–270. [Google Scholar] [CrossRef]
  5. Edreis, E.M.; Li, X.; Luo, G.; Sharshir, S.; Yao, H. Kinetic analyses and synergistic effects of CO2 co-gasification of low sulphur petroleum coke and biomass wastes. Bioresour. Technol. 2018, 267, 54–62. [Google Scholar] [CrossRef]
  6. Ian, I.; Li, X.; Jian, Y.; Dacres, O.D.; Zhong, M.; Liu, J.; Ma, F.; Rahman, N. Kinetic study of biomass pellet pyrolysis by using distributed activation energy model and Coats Redfern methods and their comparison. Bioresour. Technol. 2019, 294, 122099. [Google Scholar]
  7. Nemanova, V.; Abedini, A.; Liliedahl, T.; Engvall, K. Co-gasification of petroleum coke and biomass. Fuel 2014, 117, 870–875. [Google Scholar] [CrossRef]
  8. Zakrzewski, R. Pyrolysis kinetics of wood comparison of iso and polythermal thermogravimetric methods. Electron. J. Pol. Agric. Univ. 2003, 6, #04. [Google Scholar]
  9. Gao, Y.; Ding, L.; Li, X.; Wang, W.; Xue, Y.; Zhu, X.; Hu, H.; Luo, G.; Naruse, I.; Bai, Z.; et al. Na&Ca removal from Zhundong coal by a novel CO2-water leaching method and the ashing behavior of the leached coal. Fuel 2017, 210, 8–14. [Google Scholar]
  10. Reina, J.; Velo, E.; Puigjaner, L. Thermogravimetric study of the pyrolysis of waste wood. Thermochim. Acta 1998, 320, 161–167. [Google Scholar] [CrossRef]
  11. Deka, M.; Saikia, C.; Baruah, K. Studies on thermal degradation and termite resistant properties of chemically modified wood. Bioresour. Technol. 2002, 84, 151–157. [Google Scholar] [CrossRef] [PubMed]
  12. Wang, X.; Hu, Z.; Mian, I.; Dacres, O.D.; Li, J.; Wei, B.; Zhong, M.; Li, X.; Rahman, N.; Luo, G.; et al. Gasification Kinetics of Organic Solid Waste Pellets: Comparative Study Using Distributed Activation Energy Model and Coats–Redfern Method. Energies 2022, 15, 9575. [Google Scholar] [CrossRef]
  13. Wang, G.; Zhang, J.; Shao, J.; Liu, Z.; Zhang, G.; Xu, T.; Guo, J.; Wang, H.; Xu, R.; Lin, H. Thermal behavior and kinetic analysis of co-combustion of waste biomass/low rank coal blends. Energy Convers. Manag. 2016, 124, 414–426. [Google Scholar] [CrossRef]
  14. Liu, N.; Fan, W.; Dobashi, R.; Huang, L. Kinetic modeling of thermal decomposition of natural cellulosic materials in air atmosphere. J. Anal. Appl. Pyrolysis 2002, 63, 303–325. [Google Scholar] [CrossRef]
  15. Chen, S.; Meng, A.; Long, Y.; Zhou, H.; Li, Q.; Zhang, Y. TGA pyrolysis and gasification of combustible municipal solid waste. J. Energy Inst. 2015, 88, 332–343. [Google Scholar] [CrossRef]
  16. Coats, A.W.; Redfern, J.P. Kinetic parameters from thermogravimetric data. Nature 1964, 201, 68. [Google Scholar] [CrossRef]
  17. Miura, K.; Maki, T. A simple method for estimating f (E) and k 0 (E) in the distributed activation energy model. Energy Fuels 1998, 12, 864–869. [Google Scholar] [CrossRef]
  18. Ferdous, D.; Dalai, A.K.; Bej, S.K.; Thring, R.W. Pyrolysis of Lignins: Experimental and Kinetics Studies. Energy Fuels 2002, 16, 1405–1412. [Google Scholar] [CrossRef]
  19. Edreis, E.M.; Yao, H. Kinetic thermal behaviour and evaluation of physical structure of sugar cane bagasse char during non-isothermal steam gasification. J. Mater. Res. Technol. 2016, 5, 317–326. [Google Scholar] [CrossRef]
  20. Hu, M.; Chen, Z.; Wang, S.; Guo, D.; Ma, C.; Zhou, Y.; Chen, J.; Laghari, M.; Fazal, S.; Xiao, B.; et al. Thermogravimetric kinetics of lignocellulosic biomass slow pyrolysis using distributed activation energy model, Fraser–Suzuki deconvolution, and iso-conversional method. Energy Convers. Manag. 2016, 118, 1–11. [Google Scholar] [CrossRef]
  21. Petrović, Z.S.; Zavargo, Z.Z. Reliability of methods for determination of kinetic parameters from thermogravimetry and DSC measurements. J. Appl. Polym. Sci. 1986, 32, 4353–4367. [Google Scholar] [CrossRef]
  22. Neagu, M.; Vijan, L.; Giosanu, D. Adsorption study of phenolic compounds substituted with NO2 and Cl groups on activated carbon. J. Environ. Prot. Ecol. 2013, 14, 552–558. [Google Scholar]
  23. Maiti, S.; Purakayastha, S.; Ghosh, B. Thermal characterization of mustard straw and stalk in nitrogen at different heating rates. Fuel 2007, 86, 1513–1518. [Google Scholar] [CrossRef]
  24. Cai, J.; Liu, R. New distributed activation energy model: Numerical solution and application to pyrolysis kinetics of some types of biomass. Bioresour. Technol. 2008, 99, 2795–2799. [Google Scholar] [CrossRef]
  25. Kök, M.; Pamir, M. Non-isothermal pyrolysis and kinetics of oil shales. J. Therm. Anal. Calorim. 1999, 56, 953–958. [Google Scholar] [CrossRef]
  26. Strezov, V.; Moghtaderi, B.; Lucas, J. Thermal study of decomposition of selected biomass samples. J. Therm. Anal. Calorim. 2003, 72, 1041–1048. [Google Scholar] [CrossRef]
  27. Quan, C.; Li, A.; Gao, N. Thermogravimetric analysis and kinetic study on large particles of printed circuit board wastes. Waste Manag. 2009, 29, 2353–2360. [Google Scholar] [CrossRef] [PubMed]
  28. Di Blasi, C. Combustion and gasification rates of lignocellulosic chars. Prog. Energy Combust. Sci. 2009, 35, 121–140. [Google Scholar] [CrossRef]
  29. Agarwal, R.K. On the use of the Arrhenius equation to describe cellulose and wood pyrolysis. Thermochim. Acta 1985, 91, 343–349. [Google Scholar] [CrossRef]
  30. Guo, J.; Lua, A.C. Effect of Heating Temperature on the Properties of Chars and Activated Carbons Prepared From Oil Palm Stones. J. Therm. Anal. Calorim. 2000, 60, 417–425. [Google Scholar] [CrossRef]
  31. Vlaev, L.; Markovska, I.; Lyubchev, L. Non-isothermal kinetics of pyrolysis of rice husk. Thermochim. Acta 2003, 406, 1–7. [Google Scholar] [CrossRef]
  32. Wu, Y.; Wang, G.; Zhu, J.; Wang, Y.; Yang, H.; Jin, L.; Hu, H. Insight into synergistic effect of co-pyrolysis of low-rank coal and waste polyethylene with or without additives using rapid infrared heating. J. Energy Inst. 2022, 102, 384–394. [Google Scholar] [CrossRef]
  33. Pollard, S.; Fowler, G.; Sollars, C.; Perry, R. Low-cost adsorbents for waste and wastewater treatment: A review. Sci. Total. Environ. 1992, 116, 31–52. [Google Scholar] [CrossRef]
Figure 1. TGA and DTG curve of (a) raw biomass (b) activated carbon.
Energies 17 04605 g001
Figure 2. Exploring ln [g(x)/T2] verses 1/T plots as a tool for kinetic parameter determination.
Energies 17 04605 g002
Figure 3. SEM micrograph of (A) RCR and (B) ACCR.
Energies 17 04605 g003
Table 1. Proximate and ultimate analysis of WC and CS.
Biomass
Sample
Proximate Analysis (wt. %)Ultimate Analysis (wt.%, daf)CV (MJ/Kg, db)
AadVdafFCdaf *CHO *NS
RCR5.3592.820.751.96.2147.93.871.7720.9
ACCR0.7272.412.434.56.0039.42.040.9511.5
* Calculated by difference A = ash content, V = volatile matter, FC = fixed carbon.
Table 2. Mathematical representation of kinetic models: f(x) and g(x) expressions.
ModelSymbolf(x)g(x)
First-orderO1(1 − x)−ln(1 − x)
Three dimensions (Contracting Sphere)R33(1 − x)2/31 − (1 − x)1/3
One-dimensional diffusionD1α−1/2α2
Two-dimensional diffusion, cylindrical symmetryD2[−ln(1 − α)]−1α + (1 − α) ln(1 − α)
Random nucleation and subsequent growthA22(1 − α) [−ln(1 − α)]1/2[−ln(1 − α)]1/2
Random nucleation and subsequent growthA33(1 − α) [−ln(1 − α)]1/3[−ln(1 − α)]1/3
Table 3. Chemical reactions (HM), phase boundary-controlled reactions (SCM) and diffusion mechanism using Coats–Redfern Method.
Samplesg(α)E (kJ/mol)R2Average E
± σ
3/5/10 °C/min3/5/10 °C/min
RCR−ln(1 − x)98.09/110.3/113.960.999/0.995/0.996107.45 ± 6.78
1 − (1 − x)1/386.78/97.77/100.940.996/0.991/0.99395.16 ± 6.07
α2146.15/163.83/168.720.974/0.964/0.969159.57 ± 9.69
α + (1 − α) ln(1 − α)162.63/182.05/187.660.987/0.980/0.983177.45 ± 10.7
[−ln(1 − α)]1/244.04/50.30/52.030.999/0.995/0.99648.79 ± 3.43
[−ln(1 − α)]1/326.02/30.30/31.390.999/0.993/0.99429.24 ± 2.32
ACCR−ln(1 − x)79.68/91.71/92.040.992/0.988/0.98787.81 ± 5.75
1 − (1 − x)1/370.64/81.45/81.780.998/0.995/0.99577.96 ± 5.17
α2120.58/138.29/1390.990/0.988/0.990132.62 ± 8.52
α + (1 − α) ln(1 − α)133.84/153.36/154.100.997/0.994/0.996147.1 ± 9.38
[−ln(1 − α)]1/235.18/41.15/41.220.990/0.985/0.98439.17 ± 2.82
[−ln(1 − α)]1/320.35/24.04/24.920.987/0.982/0.98122.96 ± 1.84
Table 4. BET surface area (m2/g) of carbon.
SamplesSpecific Surface Area (m2/g)Pore Volume (cm3/g)Average Pore Size (nm)
RCR1450.009915.867
ACCR4880.01189.928
Disclaimer/Publisher’s Note: The statements, opinions and data contained in all publications are solely those of the individual author(s) and contributor(s) and not of MDPI and/or the editor(s). MDPI and/or the editor(s) disclaim responsibility for any injury to people or property resulting from any ideas, methods, instructions or products referred to in the content.

