Abstract
This paper aimed to explore a suitable ventilation method at a lower cost of energy to pursue a high learning efficiency based on the characteristics of a Chinese student group and campus building. Firstly, the model was established by Modelica and a good agreement between the numerical simulation and the results by CONTAM 3.4.0.3 was obtained. Secondly, the effects of the fixed window-opening ratio method (FWM), switch control window-opening ratio method (SCM), and automatic control window-opening ratio method (ACM) on CO2 concentration, indoor air temperature, and the heating capacity of air conditioning were investigated. The results showed that, when the FWM with 0% opening or 20% opening was adopted, the indoor CO2 concentration (ICC) was higher than the limit value of the classroom air quality standard, which was 1000 ppm. When the fixed window-opening ratio was greater than 40%, the indoor air temperature could not be controlled at the set value of 18 °C, which presented bad indoor thermal comfort. Meanwhile, when the ACM was adopted, the duration to meet good indoor thermal comfort was 57.17% higher than that of the SCM. However, both of them could maintain the average ICC below the set value in the class. Lastly, the fresh air energy consumption under different ventilation methods was compared. When the design temperature was 13.5 °C, it could be revealed that the fresh air energy consumption under the ACM, SCM, and FWM with 40% opening was 46.58%, 48.38%, and 51.26% lower than those at 18 °C. In summary, it was recommended to set the design temperature of the classroom at 13.5 °C, and the ACM was suggested as a suitable ventilation method to provide fresh air for the classroom.
1. Introduction
People spent more than 90% of their time in different indoor environments, such as offices, homes, care centers, schools, universities, shopping centers, etc. Indoor environmental quality (IEQ) is critical to human health, well-being, and work efficiency [1]. In particular, students spend one-third of their time every day in classrooms and school buildings. For children aged 7–14 years living in Organization for Economic Co-operation and Development countries, they spent nearly 7000 h in school classrooms [2]. Indoor air quality (IAQ) problems would not only lead to long-term and short-term health problems for students, but also affect students’ learning efficiency and teachers’ teaching quality. IAQ management is critical in classrooms where students spend most of their time [3,4]. Therefore, researchers and scholars have been more and more interested in this microenvironment [5,6].
Carbon dioxide (CO2) is a normal trace component in the atmosphere at about 400 ppm [7]. However, CO2 concentration in closed or poorly ventilated environments is often higher than natural levels due to human metabolism [8]. Scholars agree that CO2 concentration is not only regarded as representative of ventilation, but also counted as a key pollutant affecting indoor environmental quality and occupant health [9]. Therefore, exploring optimal CO2 concentration levels is crucial for the well-being and productivity of occupants in enclosed spaces [10]. Branco’s research results show that the limit value of the ICC of 1000 ppm has been accepted worldwide, according to the recommendations of the World Health Organization (WHO Region, 2000) and the American Society of Heating, Refrigerating and Air-Conditioning Engineers (ASHRAE Standard 62) [11]. Satish U et al. [12] found that, when the ICC increased from 600 ppm to 1000 ppm, most people’s decision-making measures decreased slightly, but when the indoor concentration increased to 2500 ppm, they decreased significantly. The result showed that the performance of the MATB task decreased significantly when the CO2 concentration increased from 1500 ppm to 3500 ppm [10]. In addition, some researchers found that a high CO2 concentration in the classroom not only made it difficult for students to concentrate, reducing their learn efficiency, but also affected the work status of teachers. It was easy for teachers and students to develop health problems in the environment. Cumulative damage could lead to more serious consequences in the long term. D.G. Shendell et al. [13] found that, for every 1000 ppm CO2 concentration increase in classrooms, the relative increase in student absenteeism was 10–20%. The study also showed that participants’ performance was negatively affected by exposure to a lack of learning at 2700 ppm CO2 relative to the 830 ppm participants, and that people who were already sleep deprived might be more susceptible to the effects of CO2 in enclosed spaces [14].
In addition, good thermal comfort was also associated with improved human productivity, concentration, performance, and well-being [5]. Owing to the special requirements of educational buildings in the aspects of high personal density, young age, and more sedentary activities, the determination of classroom environment design parameters should also be fully considered regarding its impact on thermal comfort and learning performance [15,16,17]. The recommended values of current thermal environment design parameters in the specification, such as indoor temperature, could not be used directly to guide classroom environment design [18]. Recently, some researchers [19] suggested that modest reductions in classroom air temperatures, i.e., when the temperature was decreased from 25 °C to 20 °C (77 °F to 68 °F), improved student academic performance. Performance improved on both numerical and language-based tasks that required concentration and logical thinking. Jingjiang et al. [18] showed that the classroom temperature range was 13.0–15.0 °C to meet the thermal demands in Chinese students’ classrooms compared with the indoor temperature range recommended by the Chinese regulations in winter. Therefore, exploring the impact of indoor and outdoor pollutants in classrooms on IAQ and how to achieve good IAQ with low energy consumption was crucial for the health and sustainable development of teachers and students. In order to improve IAQ and supply fresh air, different regulations had been put forward for different indoor requirements [20,21].
Recently, natural ventilation and mechanical ventilation are two methods to provide indoor fresh air. For colleges, previous educational building research mainly focused on the overall composition of the campus and the design of the external environment; the indoor environment design mainly focused on sound insulation and lighting, but insufficient consideration was given to the IAQ and thermal environment. Moreover, due to the early design of public buildings in colleges and the uncertainty of the number of users, mechanical ventilation was basically not set up, and natural ventilation was mainly used instead. The effect of natural ventilation on improving indoor air quality attracted the extensive attention of researchers [22,23]. Good natural ventilation could improve the thermal comfort of the classroom and reduce the ICC [24]. Natural ventilation does not require the installation of fresh air equipment, and outdoor air only needed to be introduced through an external window. Therefore, natural ventilation became the most commonly used fresh air supply method. Efforts were made to improve the IAQ and thermal comfort with low or no energy consumption by natural ventilation [22,23,25]. Jie Gao et al. [26] found that, in the heating season, the automatic operation of windows had a significant impact on CO2 concentration and classroom temperature. The perception of the indoor environment was more positive in a classroom ventilated by automatically operated windows and exhaust fans. This classroom reported fewer symptoms than others.
Nowadays, for the simulation of building ventilation and pollutant transport, a multizone model is simulated with computational fluid dynamics (CFD) software to obtain precise flow fields and precision in a certain region. However, CFD simulations faced a formidable challenge; the performing high-fidelity CFD simulations were time-consuming. Therefore, it was impractical for scenarios that required extensive CFD execution [27]. Multizone models had the advantage of being shorter than CFD simulations. Many multizone models (such as CONTAM, COMIS, and the Modelica model established by the multizone approach [28]) were widely used to study pollutant transport [29,30,31,32]. Multizone models could also be coupled with other platforms to obtain more accurate flow fields and parameter values in a specific space. M. Justo Alonso et al. [33] developed a coupled building model for energy, airflow, and pollutant transport to analyze different strategies for controlling supply and return air recirculation rates, including the use of the Demand Controlled Ventilation (DCV) strategy, which uses collaborative simulations between EnergyPlus and CONTAM. Zuo et al. [29,34] integrated FFD with Modelica for coupled simulations of indoor airflow, HVAC control, and building envelope heat transfer. Coupled simulations could simulate the dynamic interactions between indoor environments with stratified air and the building envelope faster than real time [34]. The Buildings Library developed by Wetter et al. [35] had greatly facilitated simulations on four Modelica platforms by other researchers in the field of the building environment. Fu et al. [36] studied the energy consumption of a data center using the Modelica building library. The simulation results showed potential energy savings of up to 24% by addressing identified control-related issues and optimizing supply air temperature. Because of the ease of being established on the Modelica simulation platform, new models and control modules were also widely used in the research on heating [29], ventilation [24], heat transfer [37], heat storage [38], and energy systems [39,40], etc.
Moreover, according to the 2021 education statistics released by China’s Ministry of Education, there were 529,300 schools at all levels and of all types in China, 291 million students in school, and the average education duration was 10.9 years and still rising. Obviously, Chinese people were spending more and more time in the classroom. According to the current China classroom ventilation situation, most classrooms have no basic ventilation facilities and only rely on manual window opening to improve indoor air quality. Too little manual window opening resulted in indoor CO2 far higher than the limit of classroom air quality standard, which seriously affected students’ learning efficiency and was harmful to students’ health. Also, too much manual window opening would increase the load of fresh air, waste energy, and decrease indoor thermal comfort, affecting the learning efficiency of indoor students. It was urgent to improve the ventilation methods of school classrooms, maintaining indoor thermal comfort and reducing ICC at a low cost of energy consumption so as to ensure students’ physical and mental health and learning efficiency in the classroom.
Thus, this paper established a Modelica model, considering the student’s learning efficiency and the energy cost, to explore the relationship between winter indoor air quality, thermal comfort, and fresh air energy consumption in colleges by different ventilation methods, and some suggestions were provided for the selection of fresh air systems in college classrooms.
2. Methodology
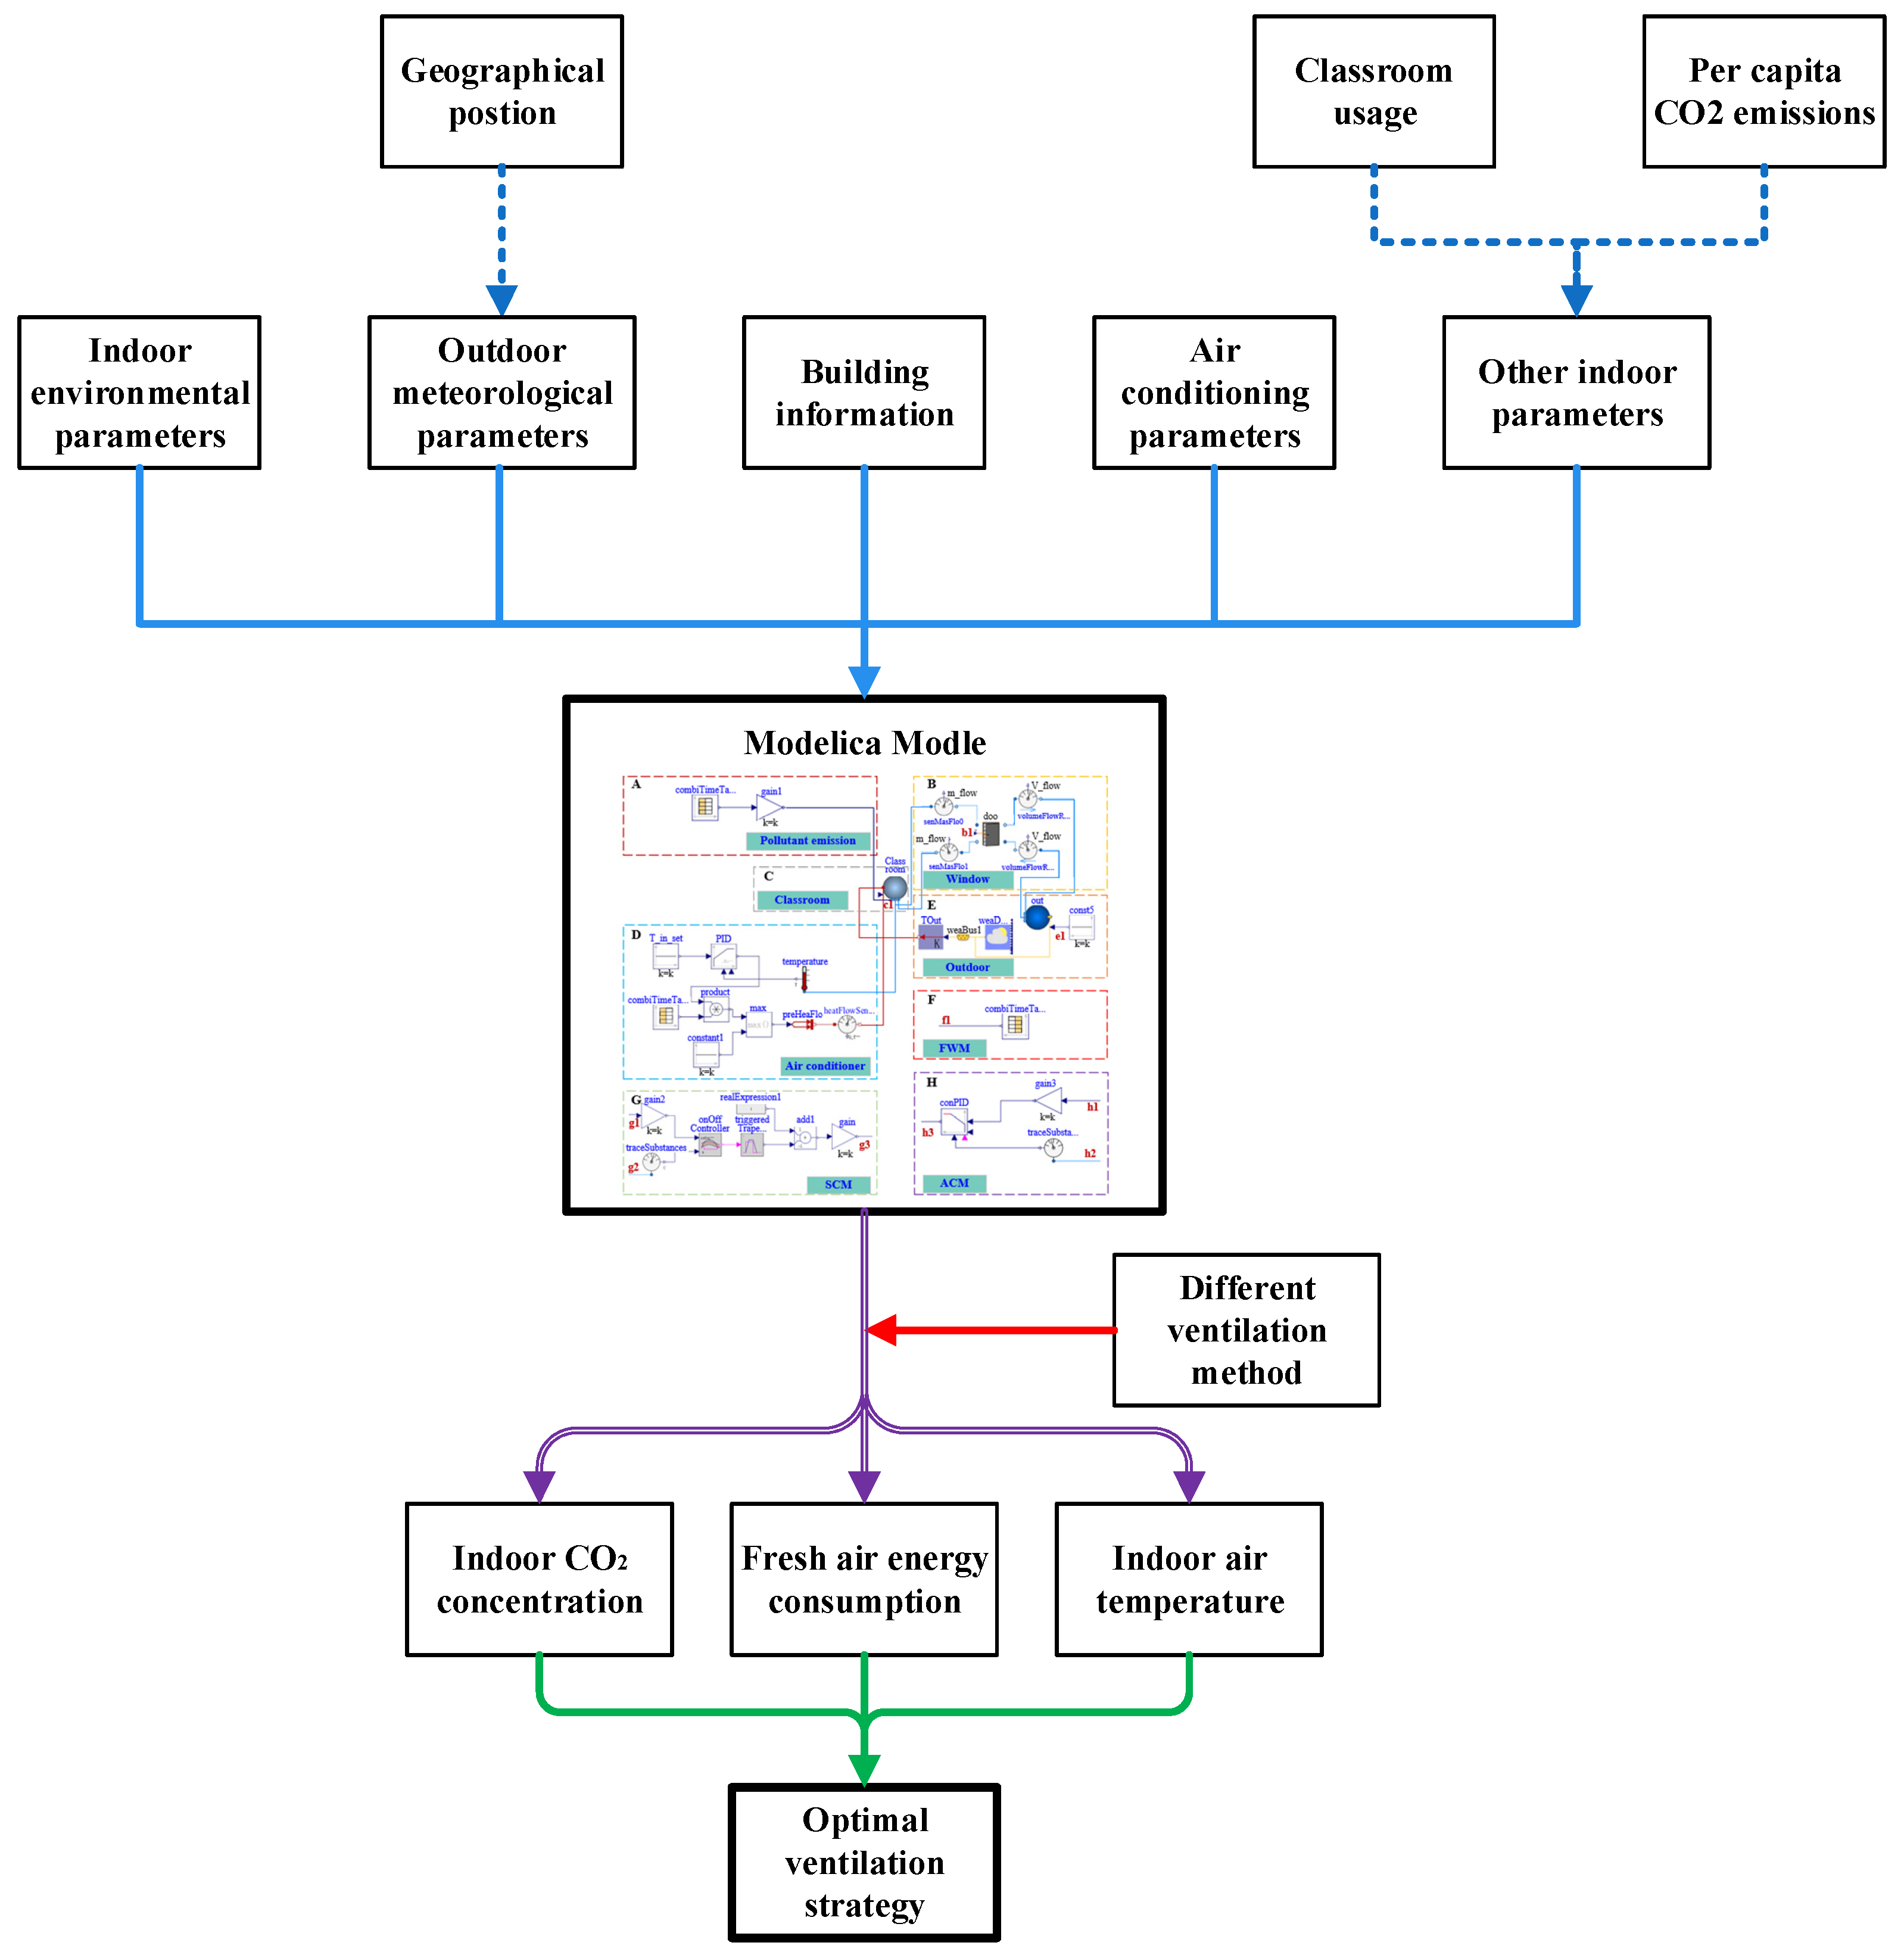
In order to simulate indoor air quality, the thermal comfort and fresh air energy consumption of a college classroom in Wuhan under different fresh air supply methods were necessary to determine model parameters. The Modelica model is established in this paper. The main research process is shown in Figure 1. In Section 2.1, the outdoor meteorological parameters of Wuhan are statistically analyzed. In addition, the typical space layout of university classrooms was adopted. The parameters of classroom interior design are introduced in Section 2.2, which include the real picture of the classroom, the performance parameters of air conditioning, the calculation method of energy consumption, the calculation method of per capita CO2 production, and the usage time of the classroom. The air conditioning performance parameters and energy consumption calculation method are introduced in Section 2.2. In Section 2.3, the Modelica models of different fresh air supply methods are introduced according to the above parameters. Finally, the simulation model by Modelica is validated in Section 2.4.
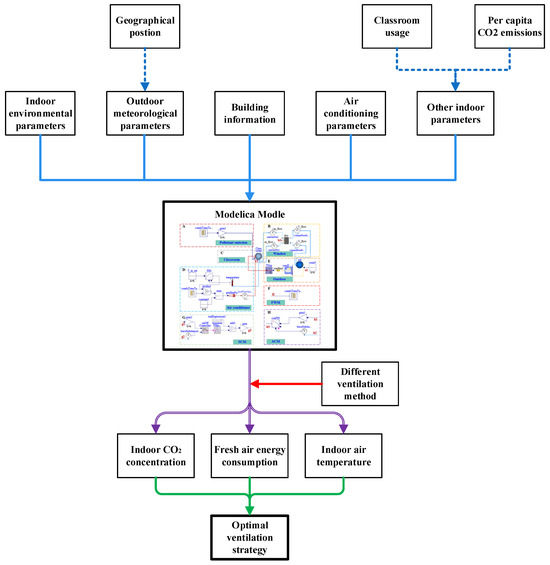
Figure 1.
Flow chart of this study.
2.1. Outdoor Meteorological Parameters
Wuhan is located in central China, with east longitude 113°41′–115°05′ and north latitude 29°58′–31°22′. It is the largest urban education center in central China. By the end of 2020, Wuhan had 83 institutions of higher education with more than 1 million students, according to a list of national institutions of higher learning provided by China’s Ministry of Education. Wuhan is located in the hot summer and cold winter areas of China. According to the Chinese thermal standard [41], the requirements of heat protection in summer must be met, and appropriate consideration should be given to thermal insulation in winter, without winter heating.
Figure 2 shows the temperature variation curve of outdoor meteorological parameters in Wuhan. The coldest month in Wuhan was January. The highest temperature in January was 9 °C on average, and the lowest temperature was 0 °C, which was consistent with the highest and lowest temperature on 2 January. Therefore, in this paper, the weather parameters on 2 January represented the outdoor weather parameters in winter.
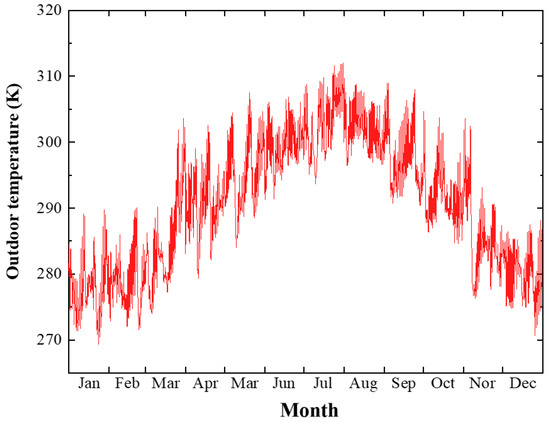
Figure 2.
Outdoor meteorological parameters of Wuhan.
2.2. Indoor Environmental Parameters
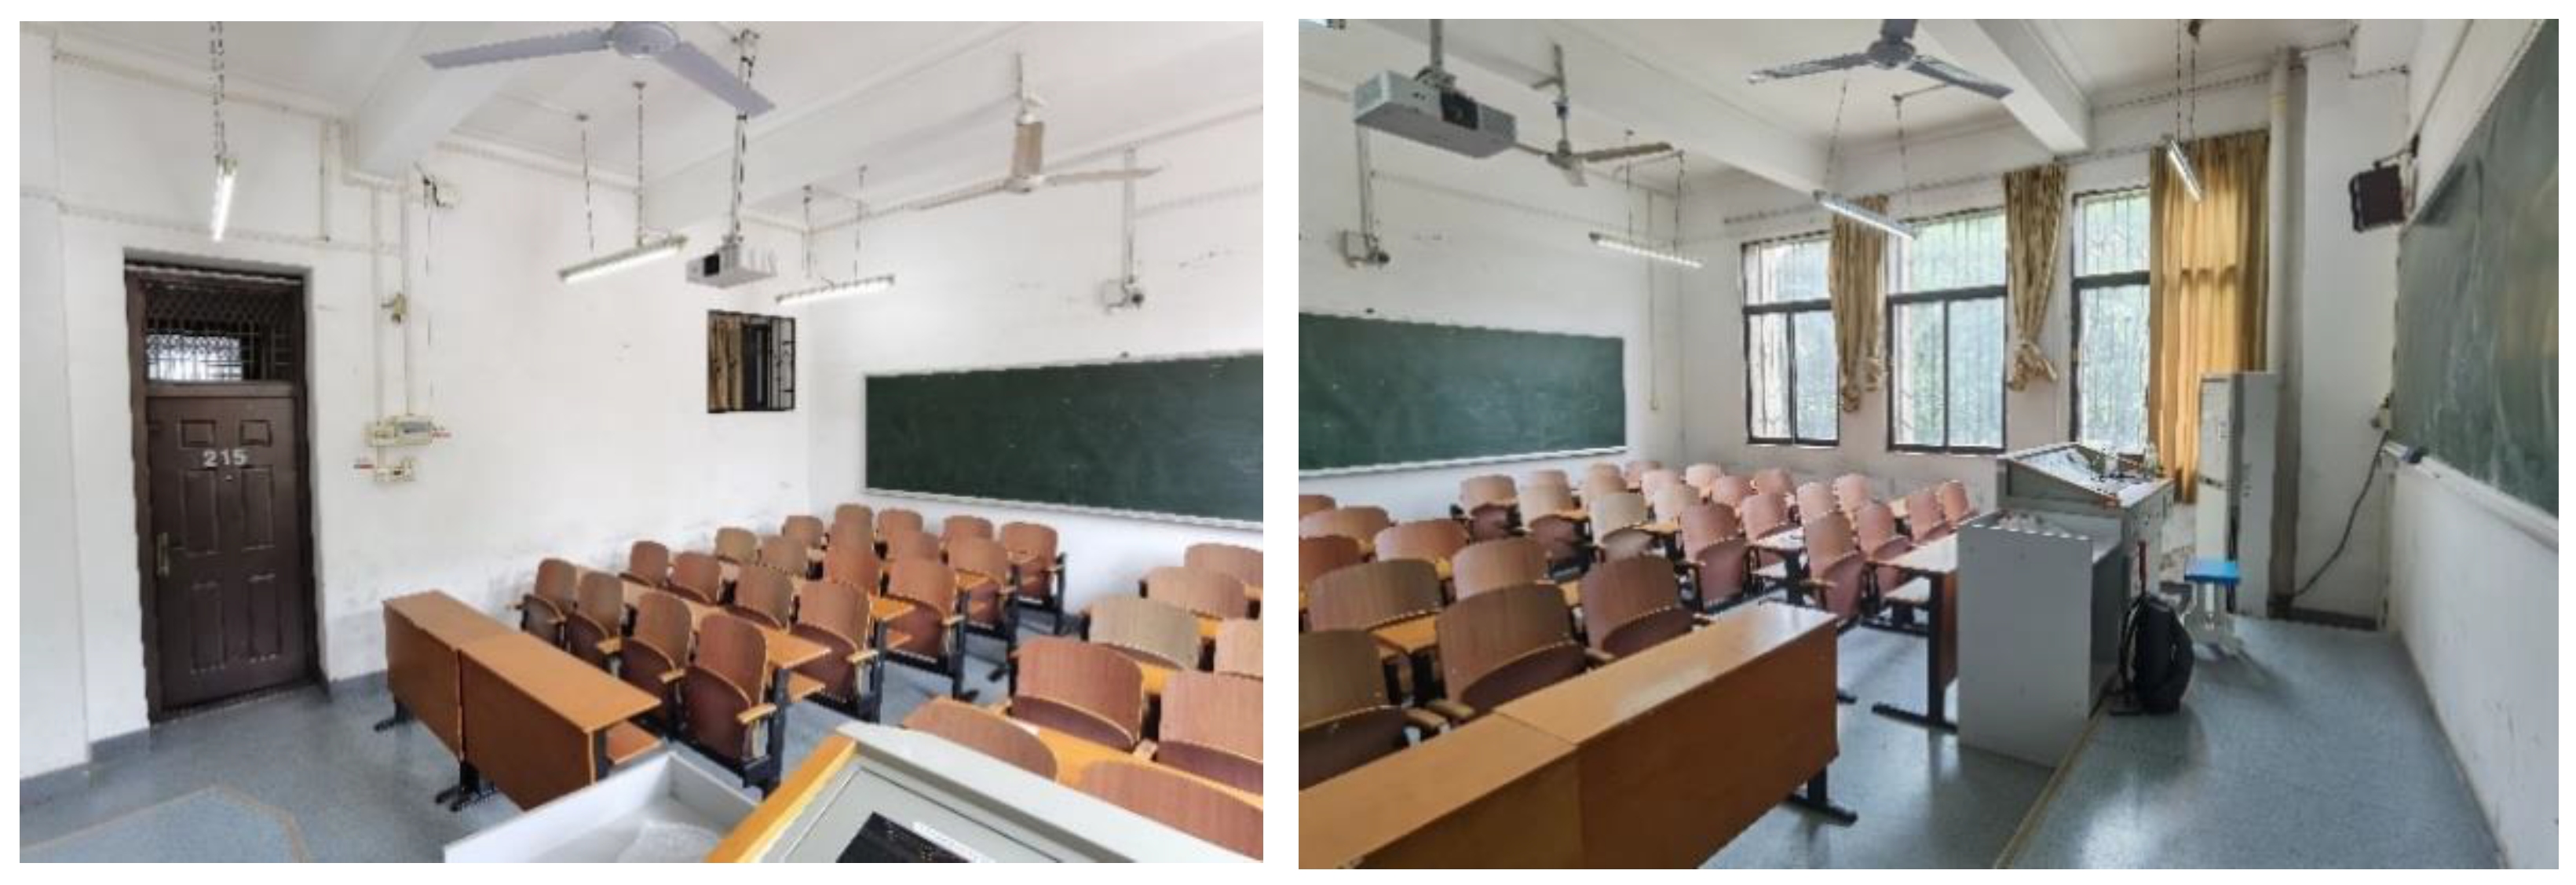
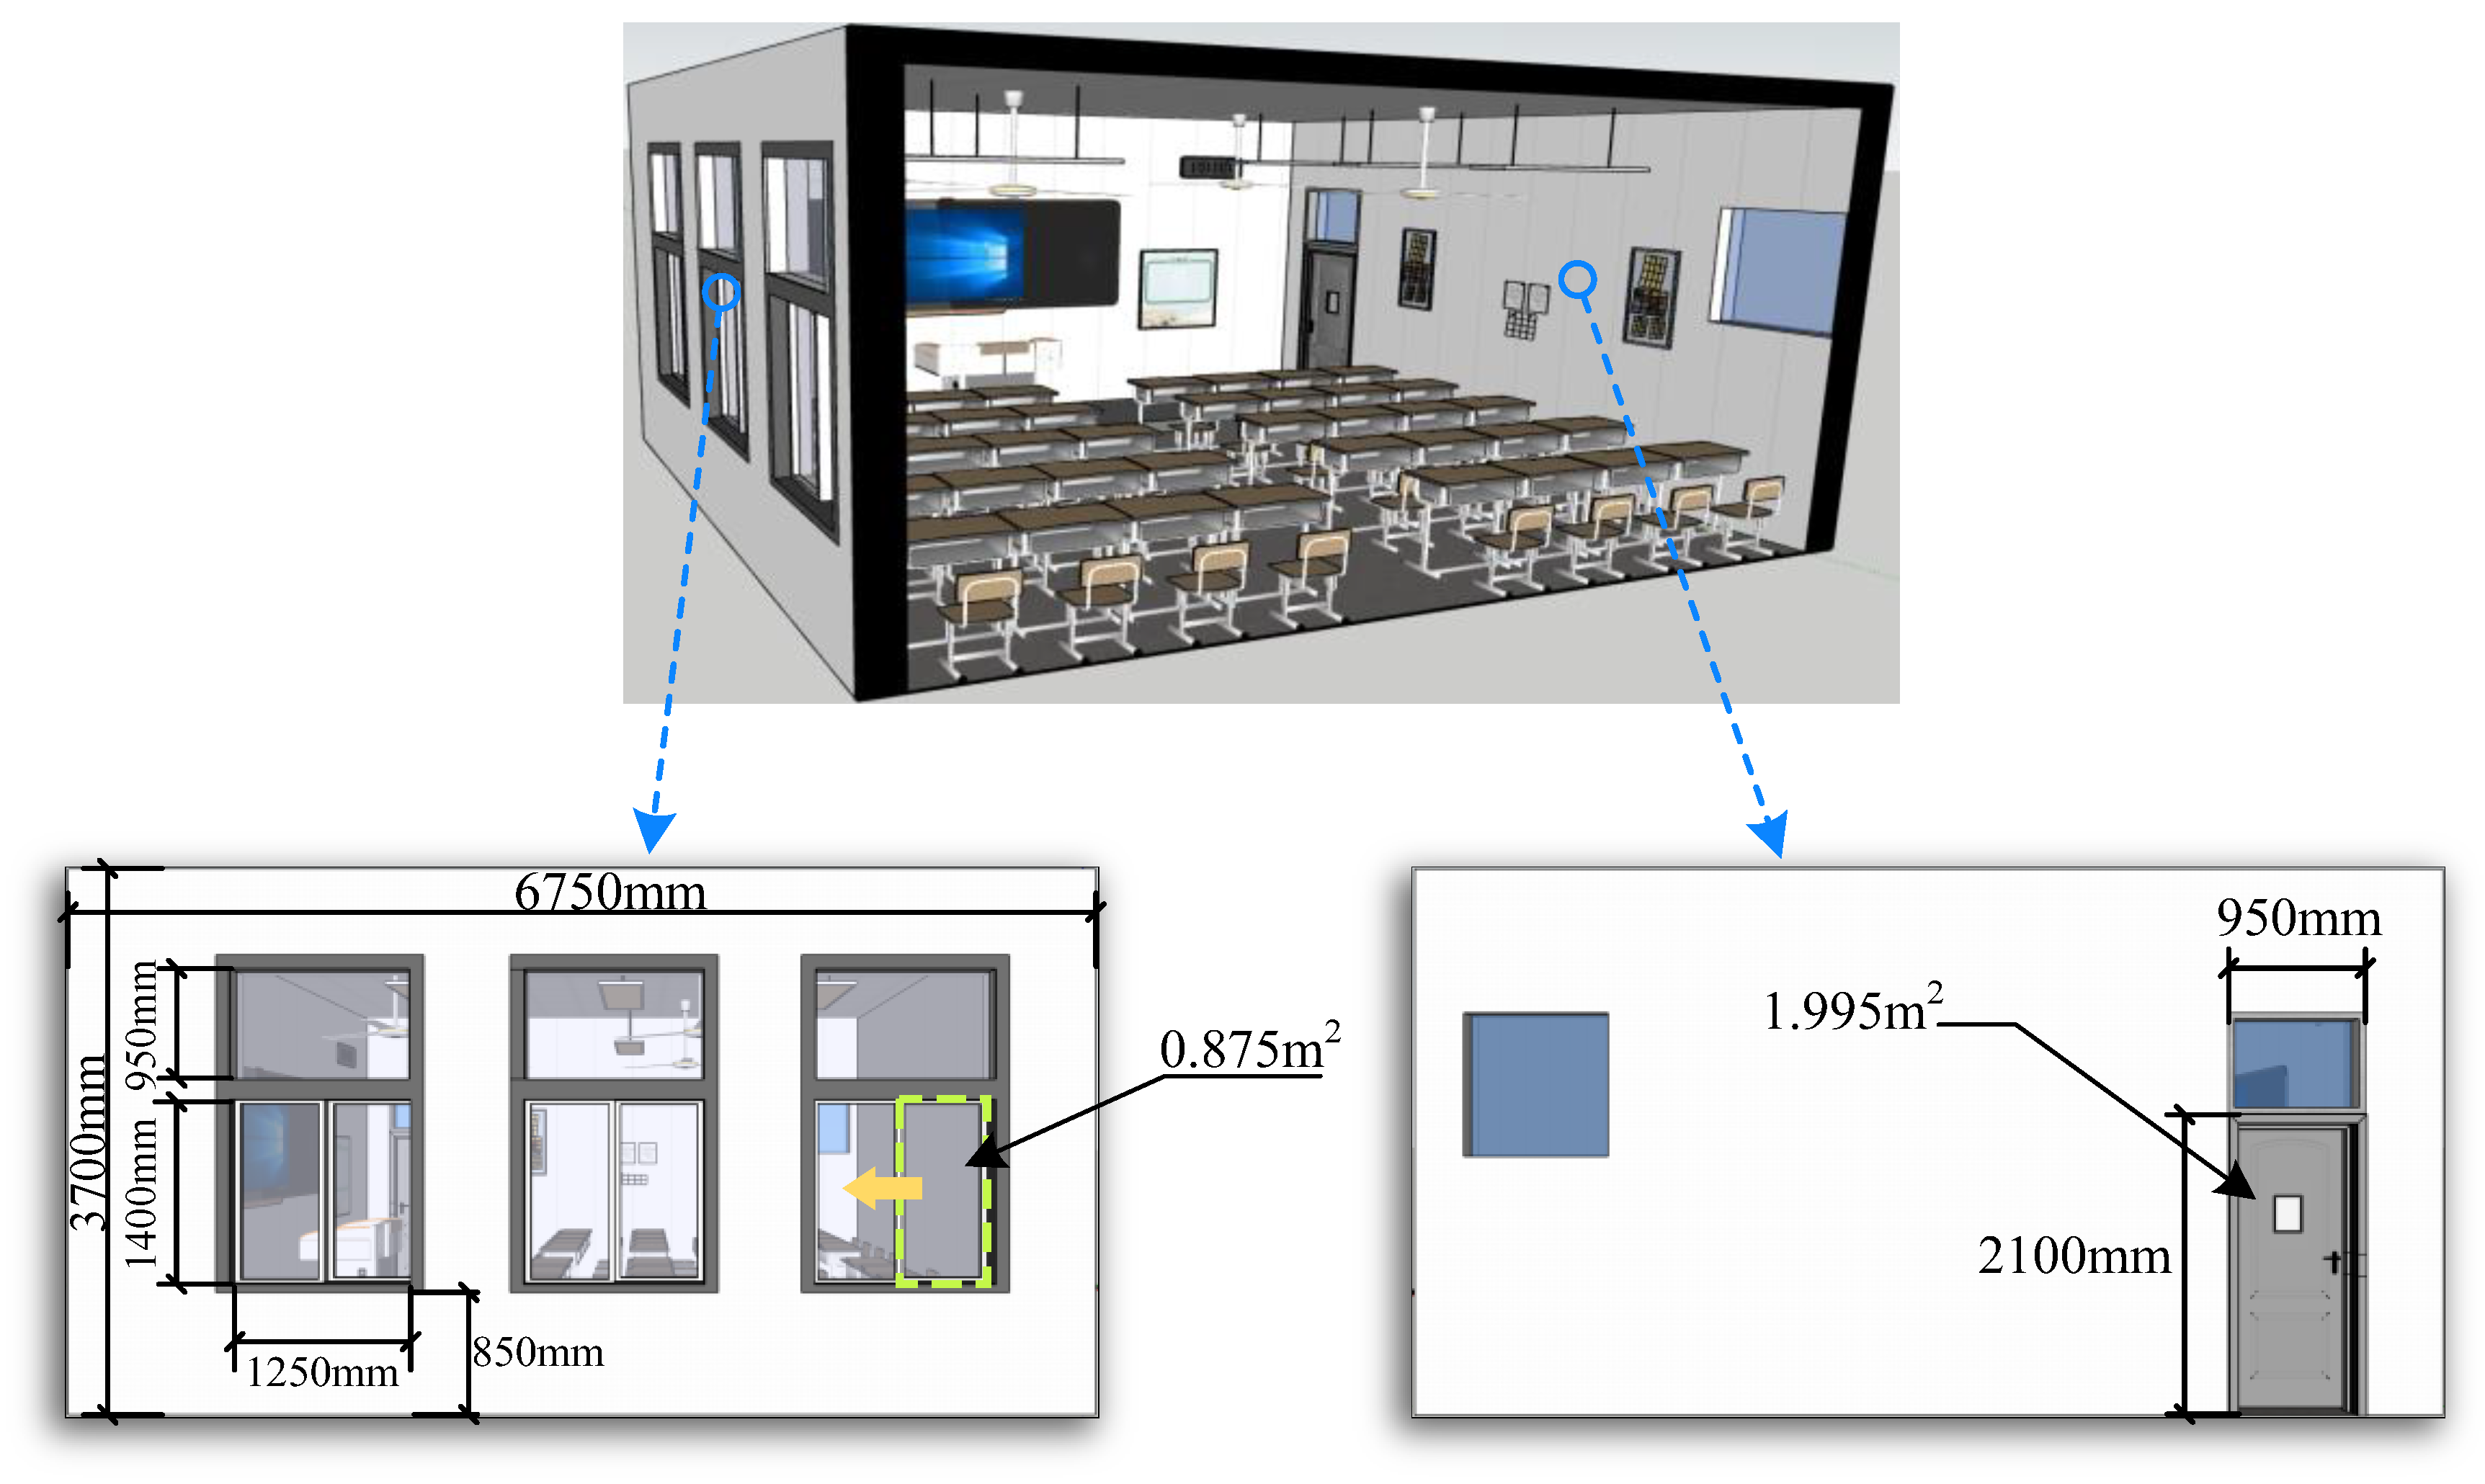
In this study, the ordinary college classroom in Figure 3 was used. The model diagram of the classroom and the specific parameters of the door and windows are shown in Figure 4. The specific parameters of the classroom are listed in Table 1. Indoor temperature was regulated by split air conditioning, and the performance parameters of the air conditioner are shown in Table 2.

Figure 3.
Picture of the research classroom.
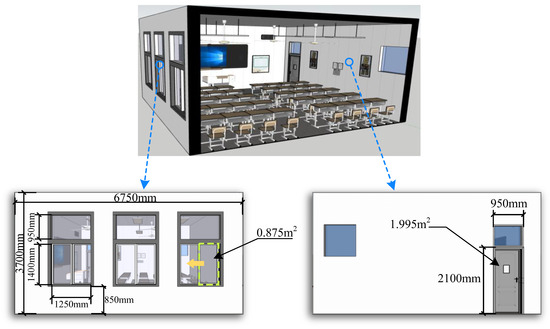
Figure 4.
Model diagram of the research classroom and the specific parameters of the door and windows.

Table 1.
Parameters of the classroom.
Table 2.
Performance parameters of the air conditioner.
The calculation of building heat load QB (W) (excluding fresh air heat load) was defined as follows:
where, QH (W), QEE (W), and QBE (W) were the heat dissipation of classroom human body, the heat dissipation of electrical equipment, and the heat transfer of enclosure, respectively. Considering the maximum QB under typical weather conditions, this study conservatively evaluated the ability of air conditioning to handle fresh air temperature.
In addition, the split air conditioner in the classroom was responsible for building load and fresh air load. The heating capacity of the air conditioner was responsible for the energy consumption of fresh air, which was calculated as follows:
where C was the maximum fresh air load that the actual air conditioner can handle, and CFM was the maximum heating capacity of the air conditioner for fresh air. Due to defrosting, ash deposition, and other reasons, the actual heating capacity of the air conditioner was lower than the rated heating capacity (CR). Therefore, in this study, the correction factor was (). CB was the heating capacity of building load. Specific parameter values are shown in Table 3.
Table 3.
Specific heat transfer value.
The CO2 calculation method of A. Persily’s study [42] was used to estimate the CO2 generation rate from building occupants using basal metabolic rates and physical activity levels of individuals combined with information from the field of human metabolism and exercise physiology. Compared with the existing method for calculating CO2 generation considering body surface area and physical activity level, this method used the basic metabolic rate and physical activity level of the individual of interest.
Based on the fact that 1 kcal (0.0042 MJ) of energy use could be converted into 0.206 L O2 consumption [43], the O2 consumed per unit time VO2 could be calculated by Formula (3):
where BMR is the basal metabolic rate. BMR is the energy necessary for life, such as the energy required for cell function and replacement, body temperature maintenance, brain function, and heart and respiratory function. The calculation method is shown in Table 4. Meanwhile, in this paper, the variable M (in dimensionless units of met) was used to describe the ratio of the human energy use associated with a particular physical activity to the BMR of that individual, referred as the metabolic rate.
Table 4.
The values of γ and δ [44,45].
The respiratory quotient, RQ, is the ratio of the volumetric rate at which CO2 is produced to the rate at which oxygen is consumed, and its value depends primarily on diet [46]. Therefore, the calculation method of CO2 generation rate was as follows.
The effect of air pressure and temperature on the rate of CO2 production has not been discussed in previous studies. These two variables to comprehensively characterize the formation rate are provided in this paper so as to avoid the requirement to consider the air density. These equations can be used to calculate CO2 generation rates at other pressures and temperatures using the following equations:
where T is the air temperature in K and P is the pressure in kPa. The value of the coefficient β is 0.000211.
When the age was 18 to 30, the calculation formula of BMR was as follows:
where the m is body mass in units of kg. For males and females, the values of γ and δ are shown in Table 4.
According to the 2020 physical examination data published by Hubei university in Wuhan, the average age of college students was 20 years old, the average weight of male students was 67.4 kg, and the average weight of female students was 54.1 kg. Based on the formulas above, the corresponding value of was calculated and the results are shown in Table 5.
Table 5.
Parameter values [46,47].
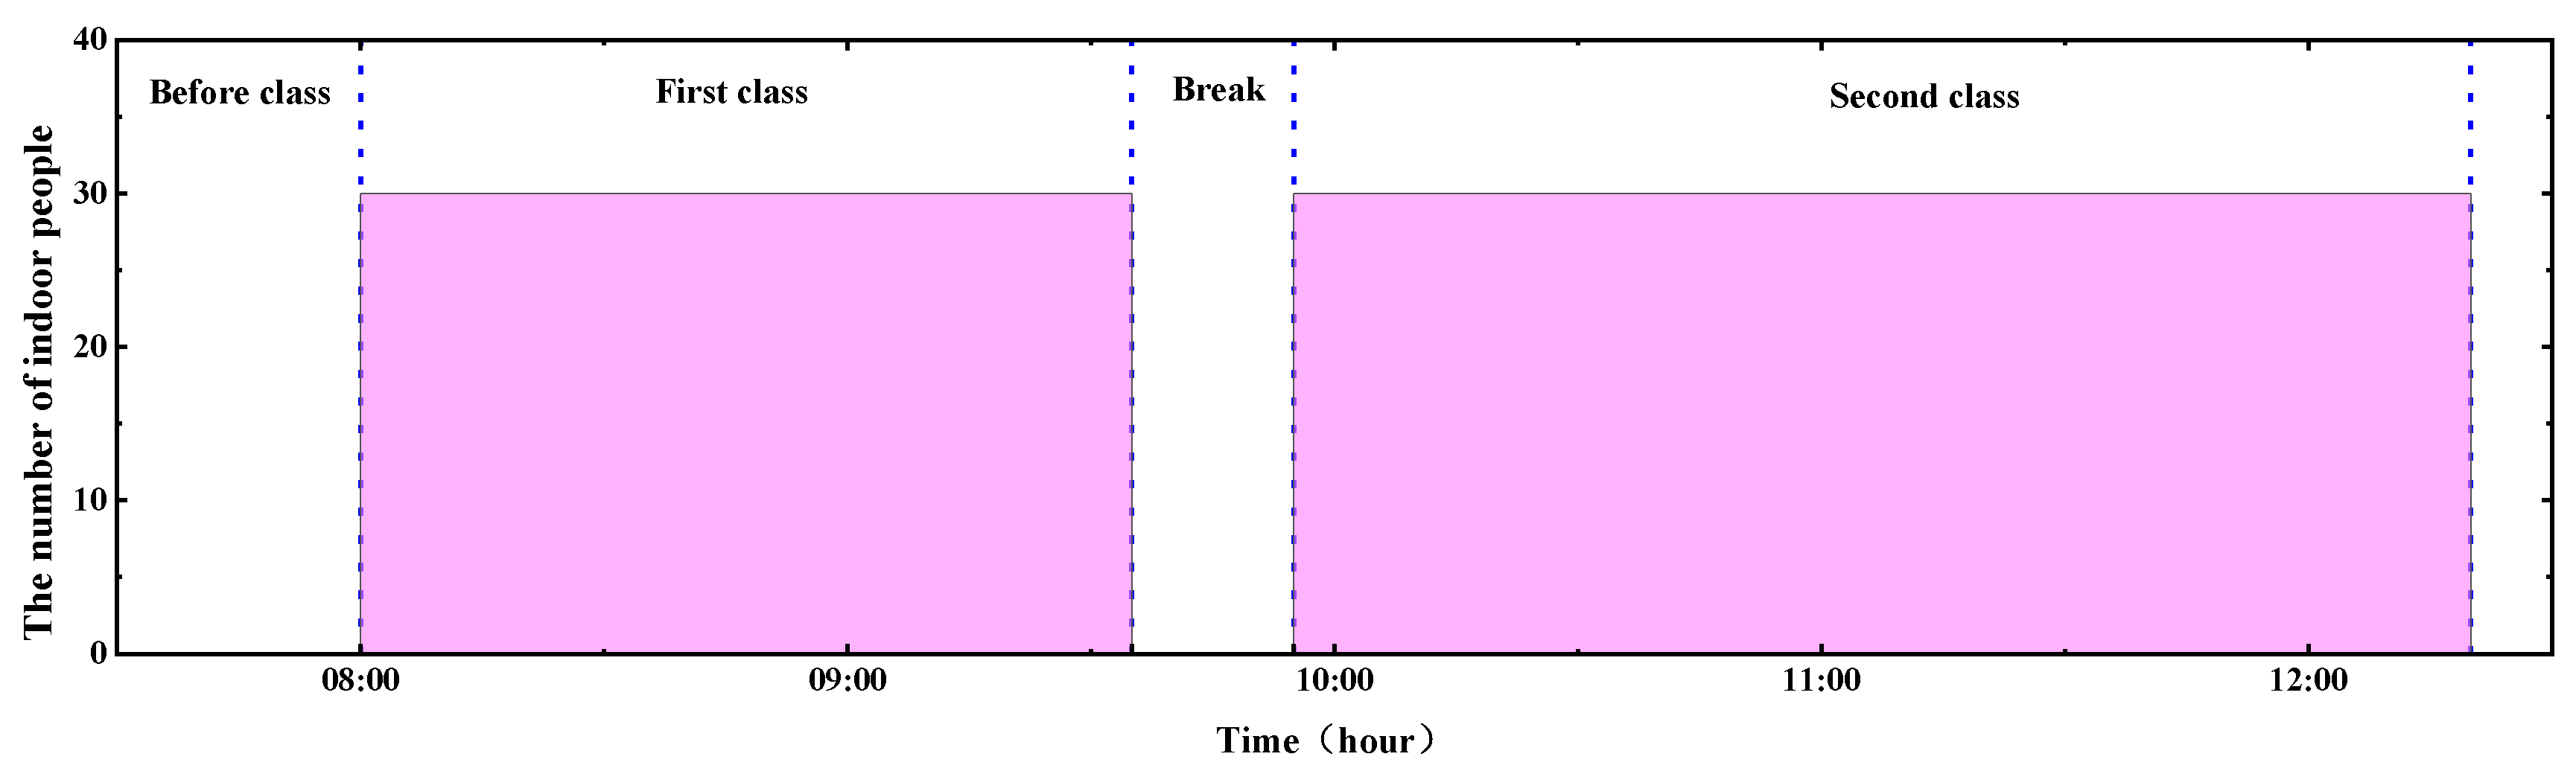
In this paper, the research only focused on the usage time of the classroom in the morning. The first class was taken as the starting point for calculation, namely, the first class was from 8:00 to 9:35, and the second class was from 9:55 to 12:20. The calculation duration time was from 8:00 to 12:20. During this period, indoor students were regarded as the only source of carbon dioxide. According to the work and rest schedule of Hubei university, the usage schedule of the classroom was obtained, as shown in Figure 5.

Figure 5.
Number of people in the classroom during the whole calculation period.
Meanwhile, some assumptions were made as follows:
- (1)
- The CO2 in the classroom was evenly distributed. The outdoor CO2 concentration remained 400 ppm.
- (2)
- There were 30 students in the classroom, which is a common pattern in Chinese universities.
- (3)
- The CO2 generation remained constant during the class and no CO2 had been generated during the break.
- (4)
- The influence of students entering and leaving the classroom was ignored.
- (5)
- The building energy consumption caused by the load of the building envelope remained constant.
2.3. Modelica Model
Based on the parameters given in the previous section, the model was established by OpenModelica v1.19.2, as shown in Figure 6. The fixed window-opening method (FWM), switch control method (SCM), and automatic control method (ACM) were applied. These three models (models 1–3) composed of different modules (modules A–H) were used to study the effects of three fresh air supply methods on the ICC, indoor air temperature, and fresh air energy consumption. Module A was the CO2 production model, which input the amount of CO2 produced by real-time students as a fixed value. Module B was the window-opening ratio model, which connected the indoor and outdoor models. The window-opening ratio was controlled in the proportion of 0–100% by the control interface b1. Module C was the indoor module of the classroom, which was used to input the original physical parameters of the classroom. Module D was an air conditioning model, which regulated the indoor ambient temperature within the heating capacity of the air conditioner through a proportional integral differential (PID) controller. Module E was used to obtain the outdoor meteorological parameters. Module F was used to define six different window-opening ratios of fixed doors and windows (f1 was connected to b1), namely 0%, 20%, 40%, 60%, 80%, and 100%, respectively. Module G was the SCM (g1, g2, and g3 were, respectively, connected to e1, c1, and b1). Firstly, a fixed value was set, and the window would be opened to the set value when the ICC was above 1000 ppm. When the ICC was reduced below 1000 ppm, the window would be closed. As the lag time was set, the ICC in the classroom would slightly exceed 1000 ppm. Module H was the ACM. The connection mode was basically the same as that of switch control type, and g1, g2, and g3 connected to e1, c1, and b1, respectively. The window-opening ratio was controlled by the ACM according to the ICC in real time and the ACM would maintain the ICC at 1000 ppm.
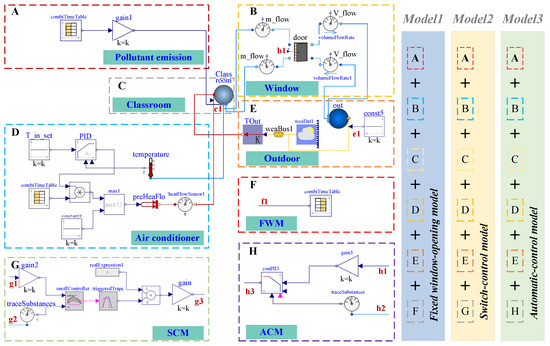
Figure 6.
Modelica model of the investigation.
2.4. Validation
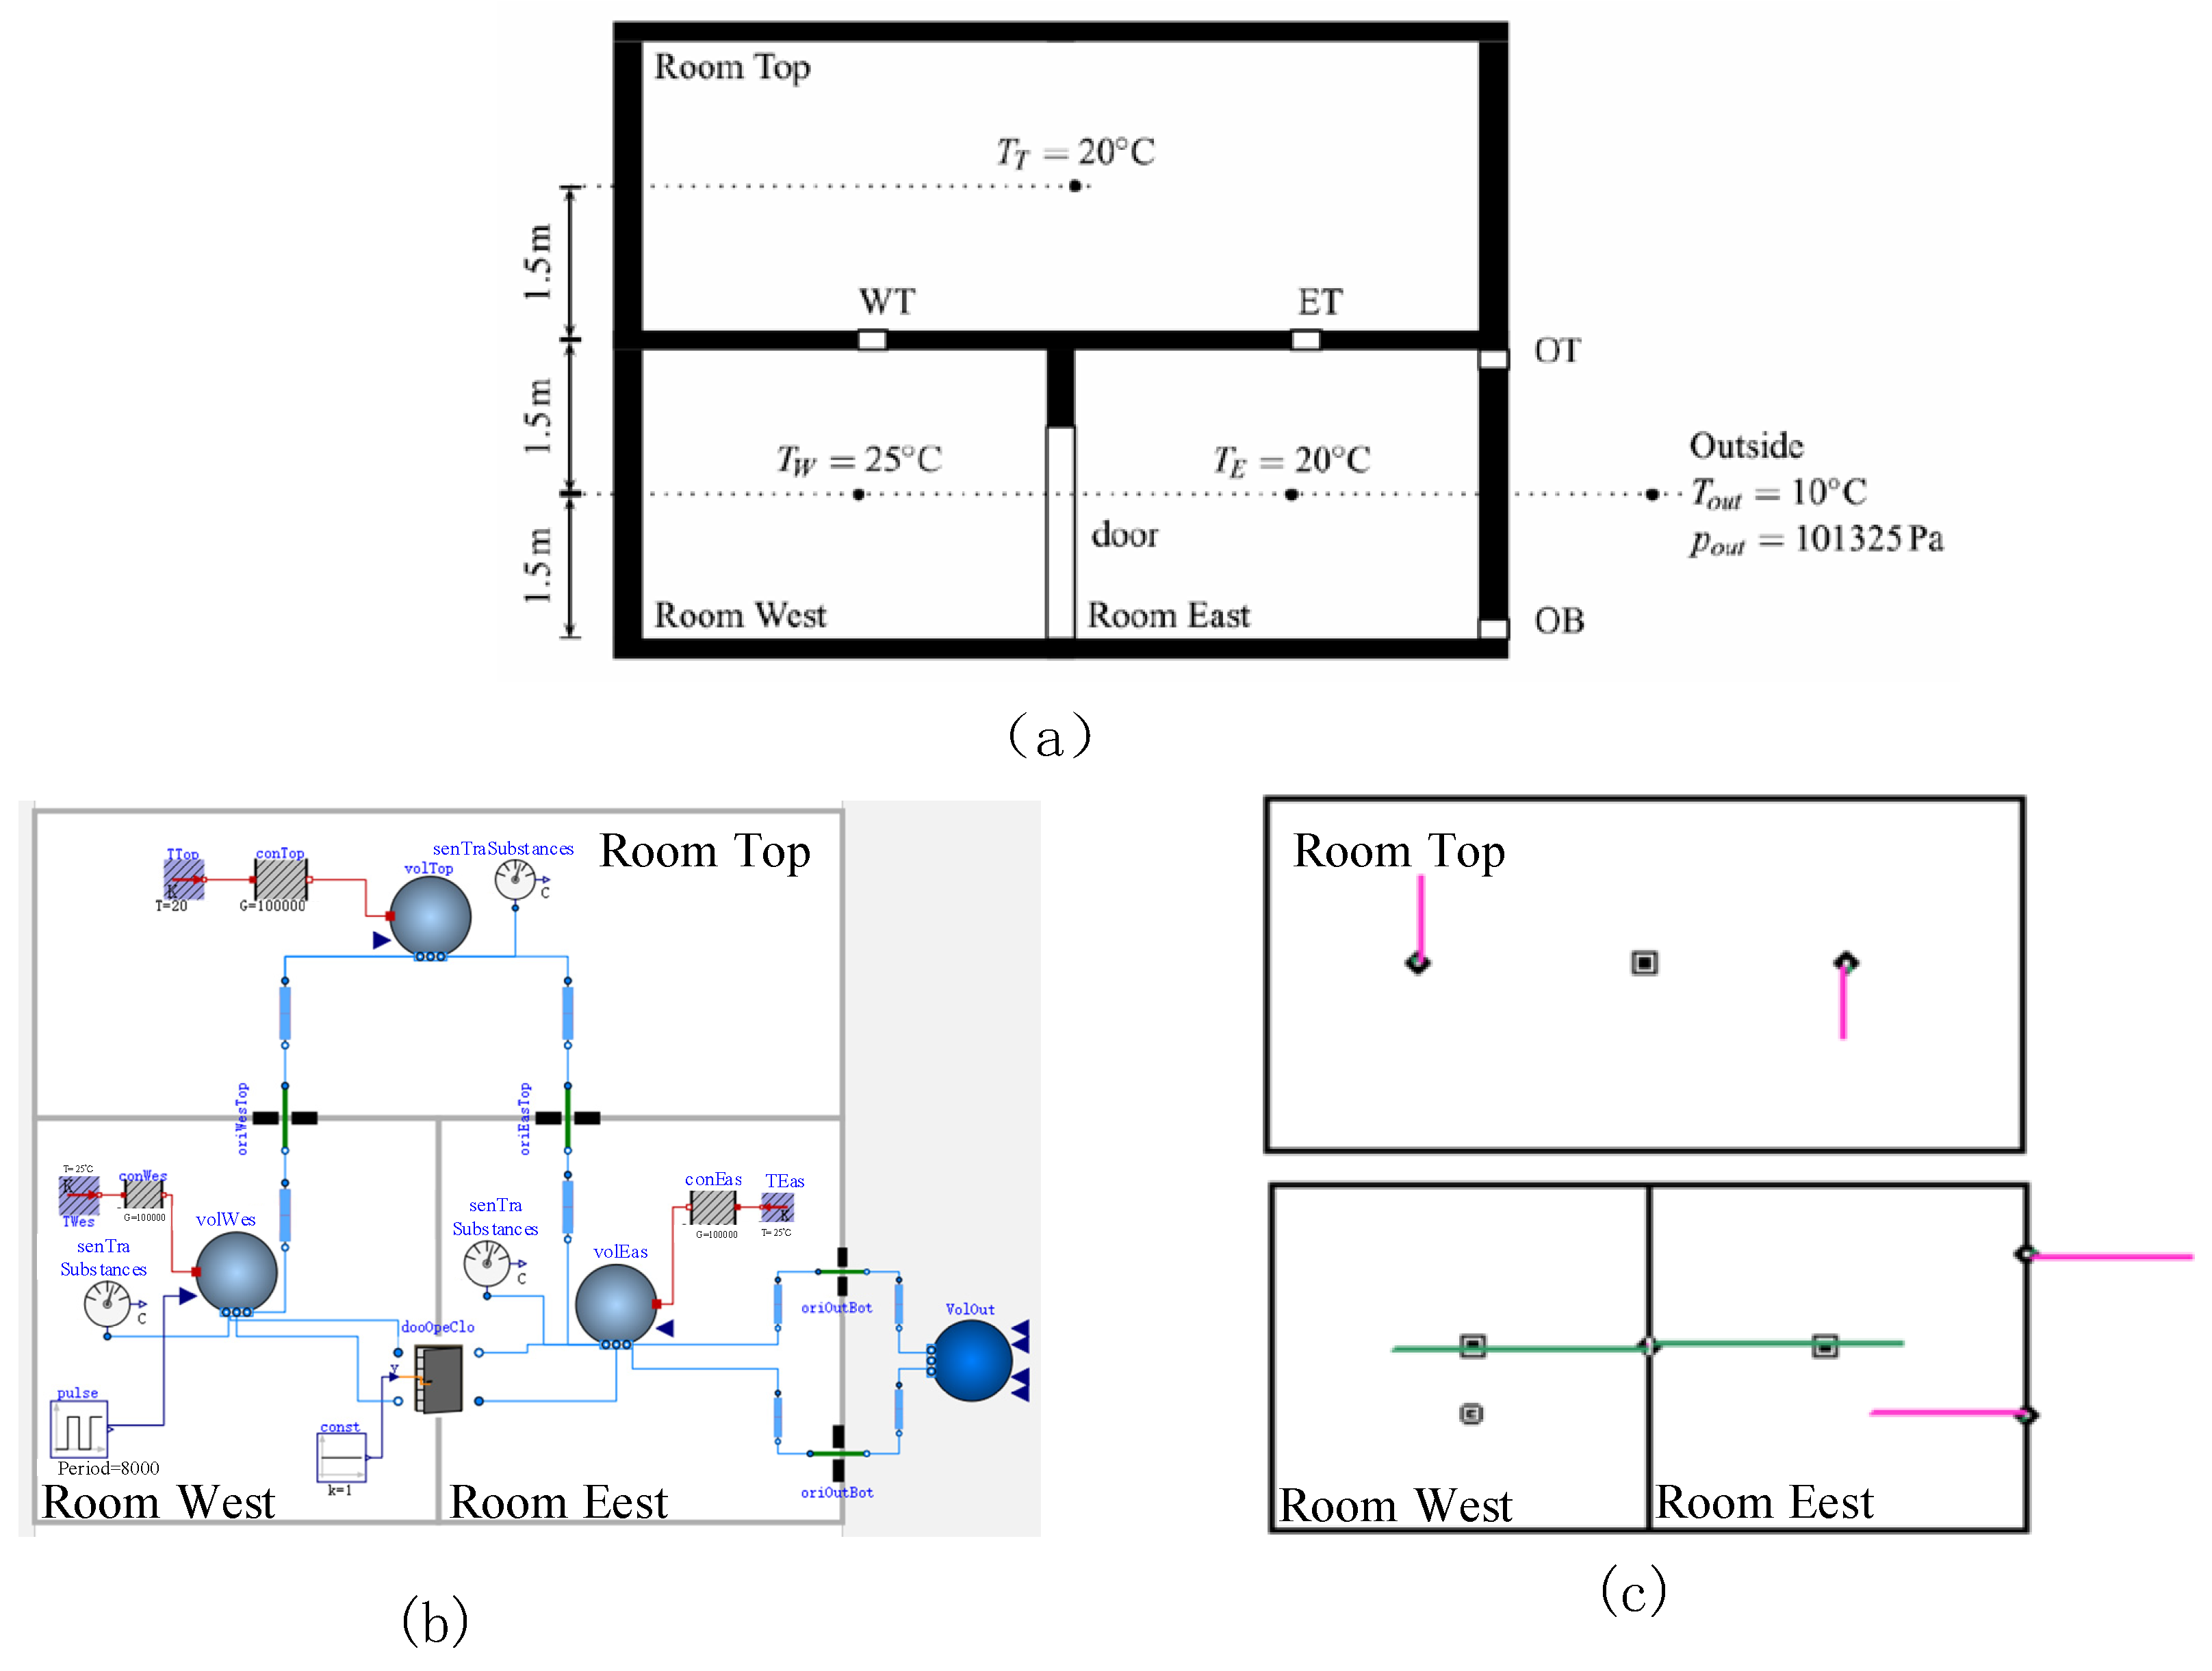
Since the accuracy of the CONTAM simulation has been widely recognized [46], this section is based on OpenModelica v1.18.1 and CONTAMW 3.4.0.3 for verification. The validation model was divided into two floors; the ground floor had two parallel small rooms, and the first floor was a large room, as shown in Figure 7a. The air was exchanged through a door with the area of 2.2 m2 from one room to the other, while the air was exchanged through the orifice from one floor to the other. Figure 7b,c shows the Modelica model and CONTAM model, respectively. Table 6 shows the ventilation and penetration parameters of doors and orifices setting according to the literature [28].
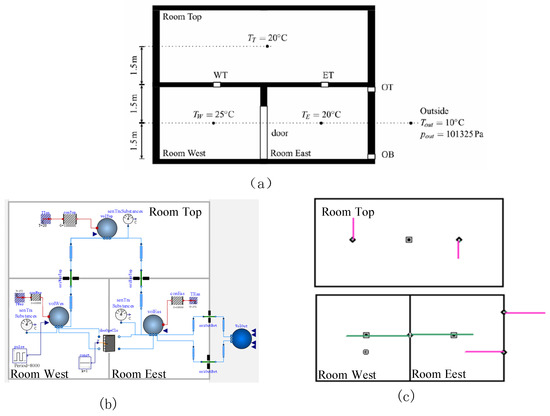
Figure 7.
The validation of ventilation rate. (a) Physical model. (b) Modelica model. (c) CONTAM model.
Table 6.
The parameters for ventilation and infiltration [28].
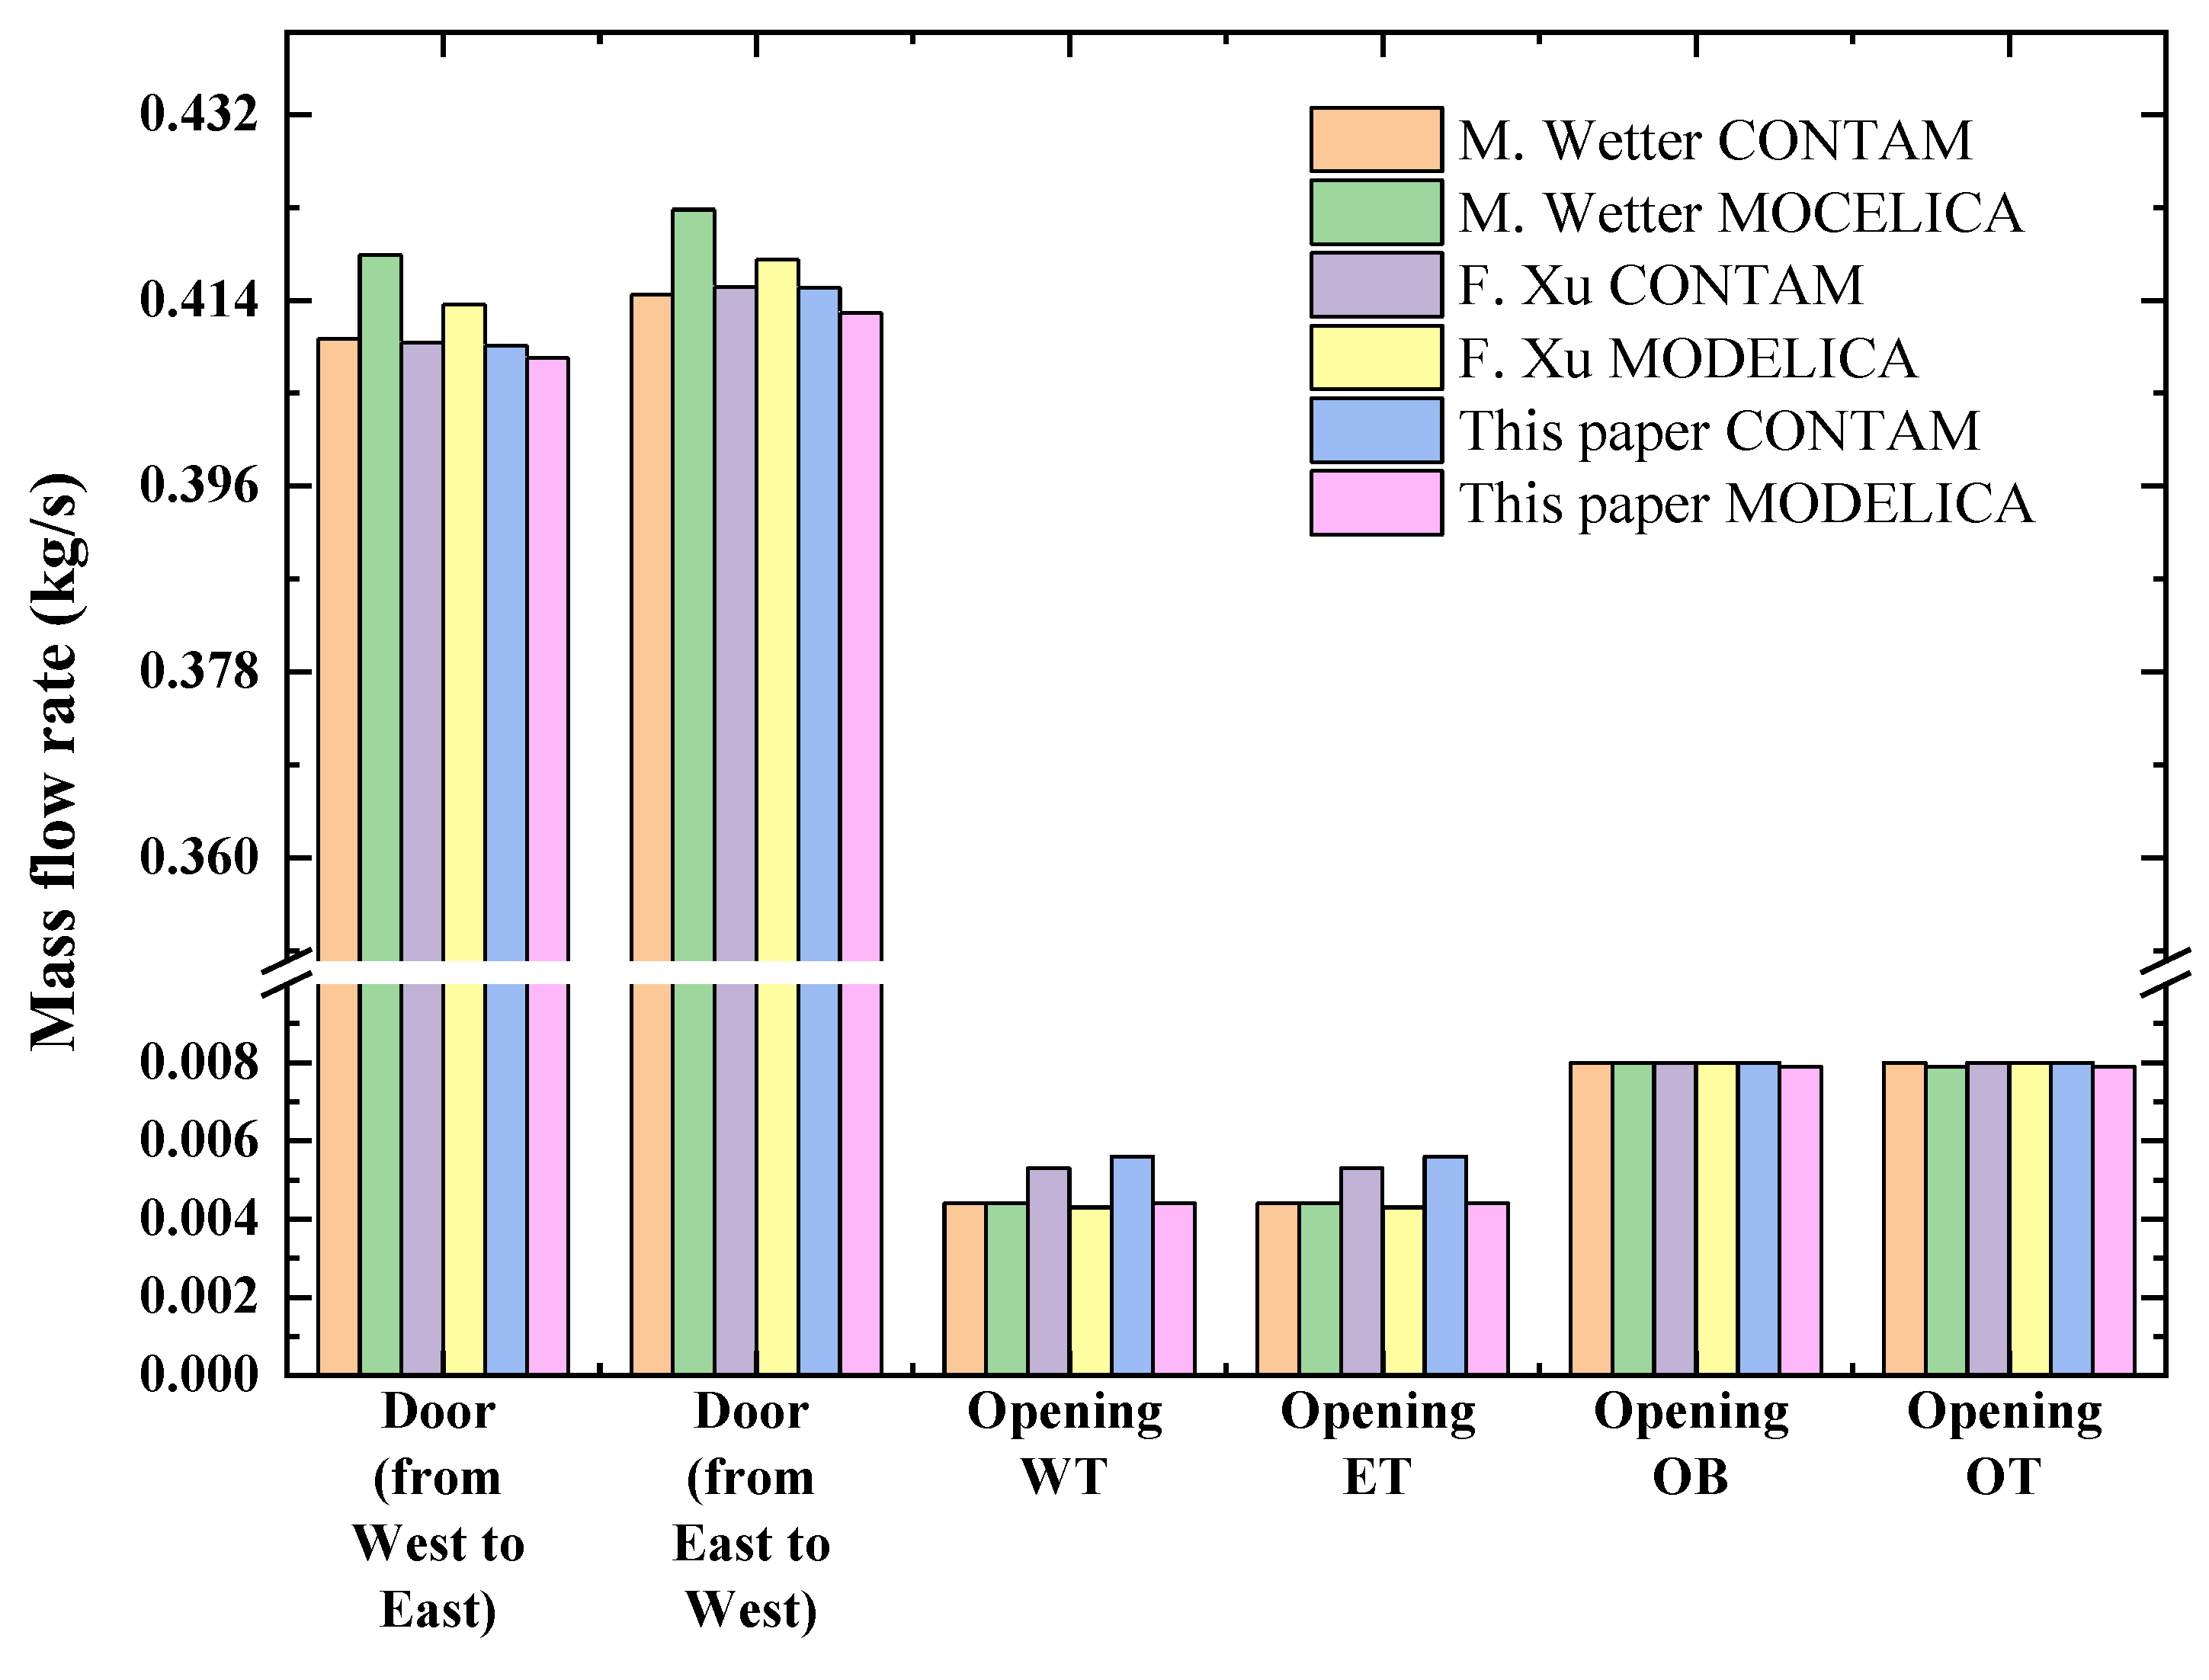
The verification results are showed in Figure 8. The ventilation rate difference of the doors on the ground floor between the simulation of CONTAM and Modelica was less than 1%. The mass flow rate between the orifices on the ground floor and the first floor was also in good consistency. Moreover, the simulation results of Modelica in this paper were basically consistent with the results of Wetter et al. [28] and F. Xu et al. [24]. The error in the orifice between two layers could be owing to the different versions of the CONTAM.
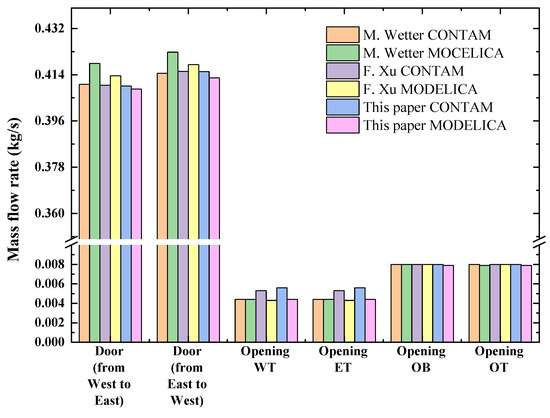
Figure 8.
Ventilation validation results [24,28].
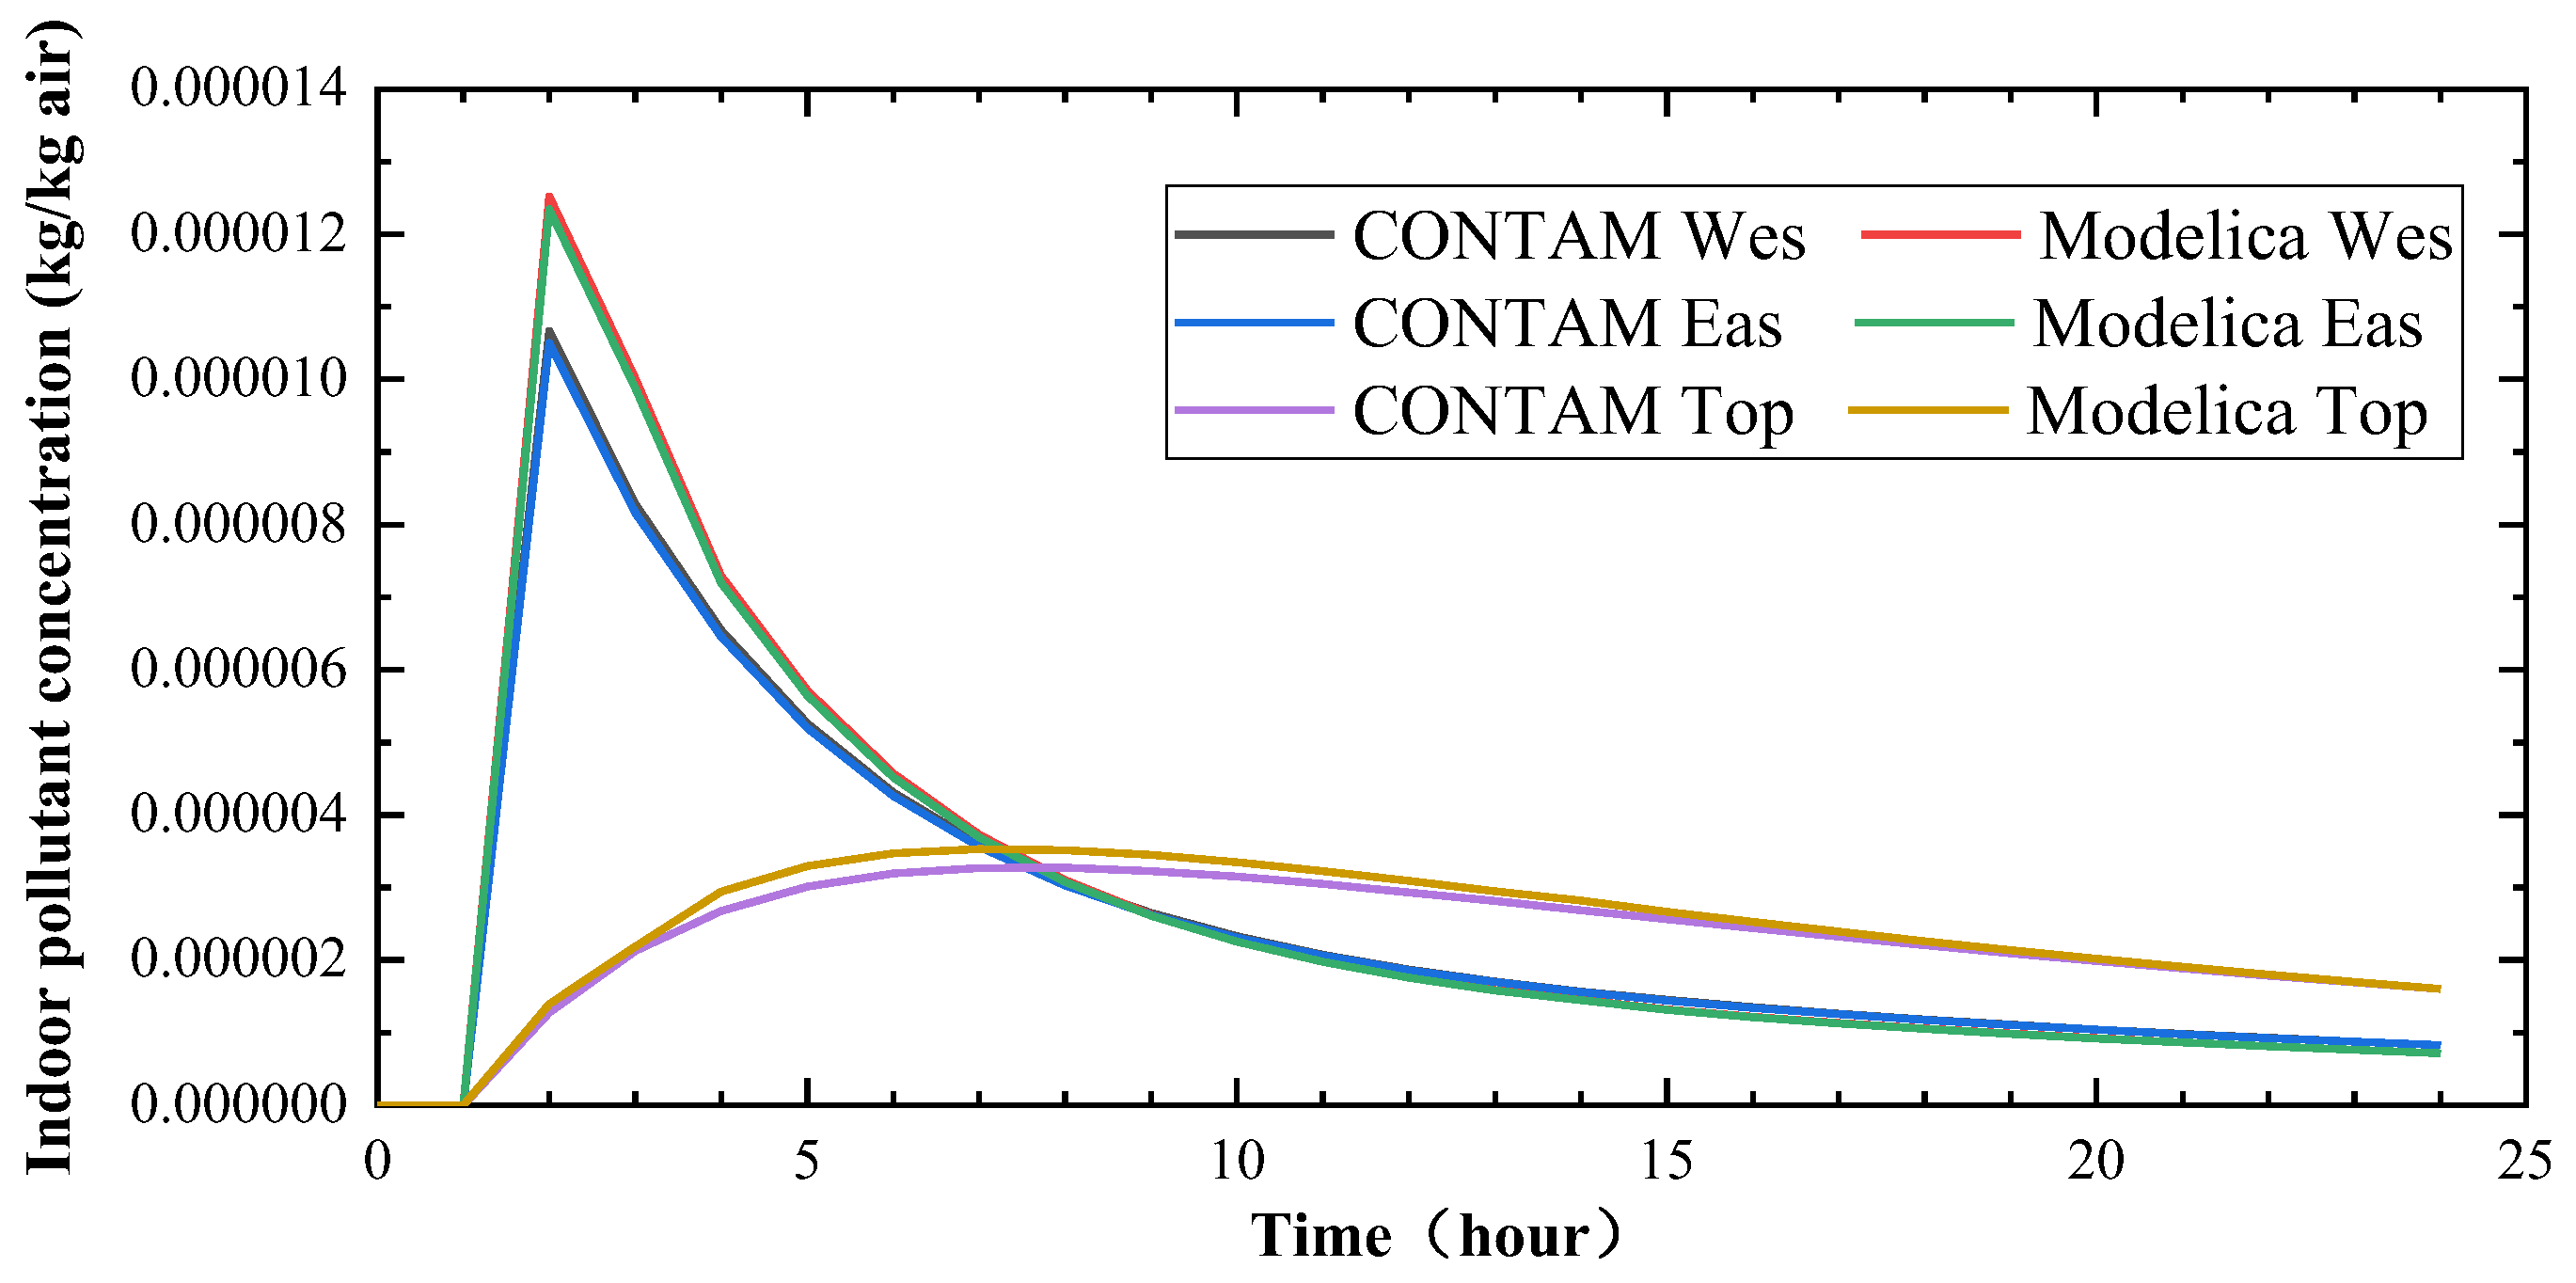
In addition, as the source of pollution was considered, the pollutant concentrations of each room simulated by the CONTAM and Modelica models were in good consistency, as shown in Figure 9. In general, it can be considered that the simulation results of Modelica were reliable.
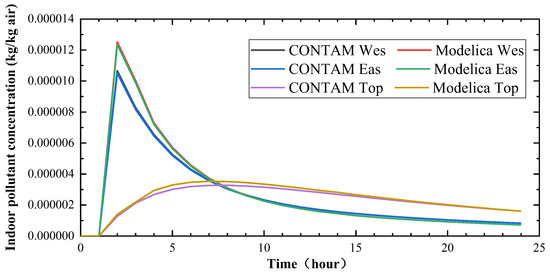
Figure 9.
Pollutant concentration verification results.
3. Results and Discussion
For the indoor design temperature of classrooms, international organizations, countries, and regions established standards based on the theory of thermal comfort research, such as those of the American Society of Heating, Refrigerating and Air-Conditioning Engineers (ASHRAE) [47], the Chartered Institution of Building Services Engineers, the International Standards Organization (ISO) [48], and the Association of European Operational Research Societies [49], as well as relevant standards in various countries and industries. The specific temperatures corresponding to the comfortable zone in each standard are shown in Table 7. The evaluation standard for the indoor environmental parameters of Chinese buildings, named the Design Code for Heating Ventilation and Air Conditioning of Civil Buildings (GB 50736-2012) [20], stipulated that the minimum design temperature to ensure the comfort of the indoor thermal environment of buildings was 18 °C.
Table 7.
Comfort zones under different standards.
However, due to the fact that the current research methods and evaluation models of thermal comfort are mainly based on the average comfort level of adults in the whole society, and for the particularity of the educational building group, the high individual density, the young age, and the differences between the thermal comfort requirements of students in a classroom and those of adults, the above standards cannot be fully applicable in Chinese universities.
A school building is mainly for student learning, and because of this special function, the determination of classroom environment design parameters should also fully account for their impact on thermal comfort and learning performance [18]. According to the previous study [18], the classroom temperature range required to meet the thermal demand of Chinese students was 13.0–15.0 °C and the learning efficiency of students reached the highest at 13.5 °C compared with the indoor temperature range in winter recommended by the current standard in China.
As a result, in this subsection, the simulation results of the ICC, indoor temperature, and fresh air energy consumption in the classroom are discussed. At the same time, the energy consumption results under different design temperatures are compared and analyzed. The usage of air conditioners in classrooms in winter is discussed in this paper. The influence of indoor air quality and thermal comfort in the classroom is discussed under these three different ventilation methods (FWM, SCM, ACM), as the design temperature T1 = 18 °C, in Section 3.1. While, in Section 3.2, the influence of the above three ventilation methods on the air quality of the classroom is discussed when the design temperature T2 = 13.5 °C. In Section 3.3, the effect of three different ventilation methods, the heat production of air conditioning, and total fresh air energy consumption under different design temperatures are analyzed. Considering air quality, thermal comfort, and fresh air energy consumption, the optimal ventilation strategy based on learning efficiency is given.
3.1. The Effect on IAQ and Thermal Comfort Based on the Regulations
In this subsection, according to the Design Code for Heating Ventilation and Air Conditioning of Civil Buildings (GB 50736-2012), the indoor temperature parameter of the classroom is set to 18 °C. The influence of indoor air quality and thermal comfort in the classroom under these three different ventilation methods are researched in this section.
3.1.1. The Effect of the Fixed Window-Opening Method
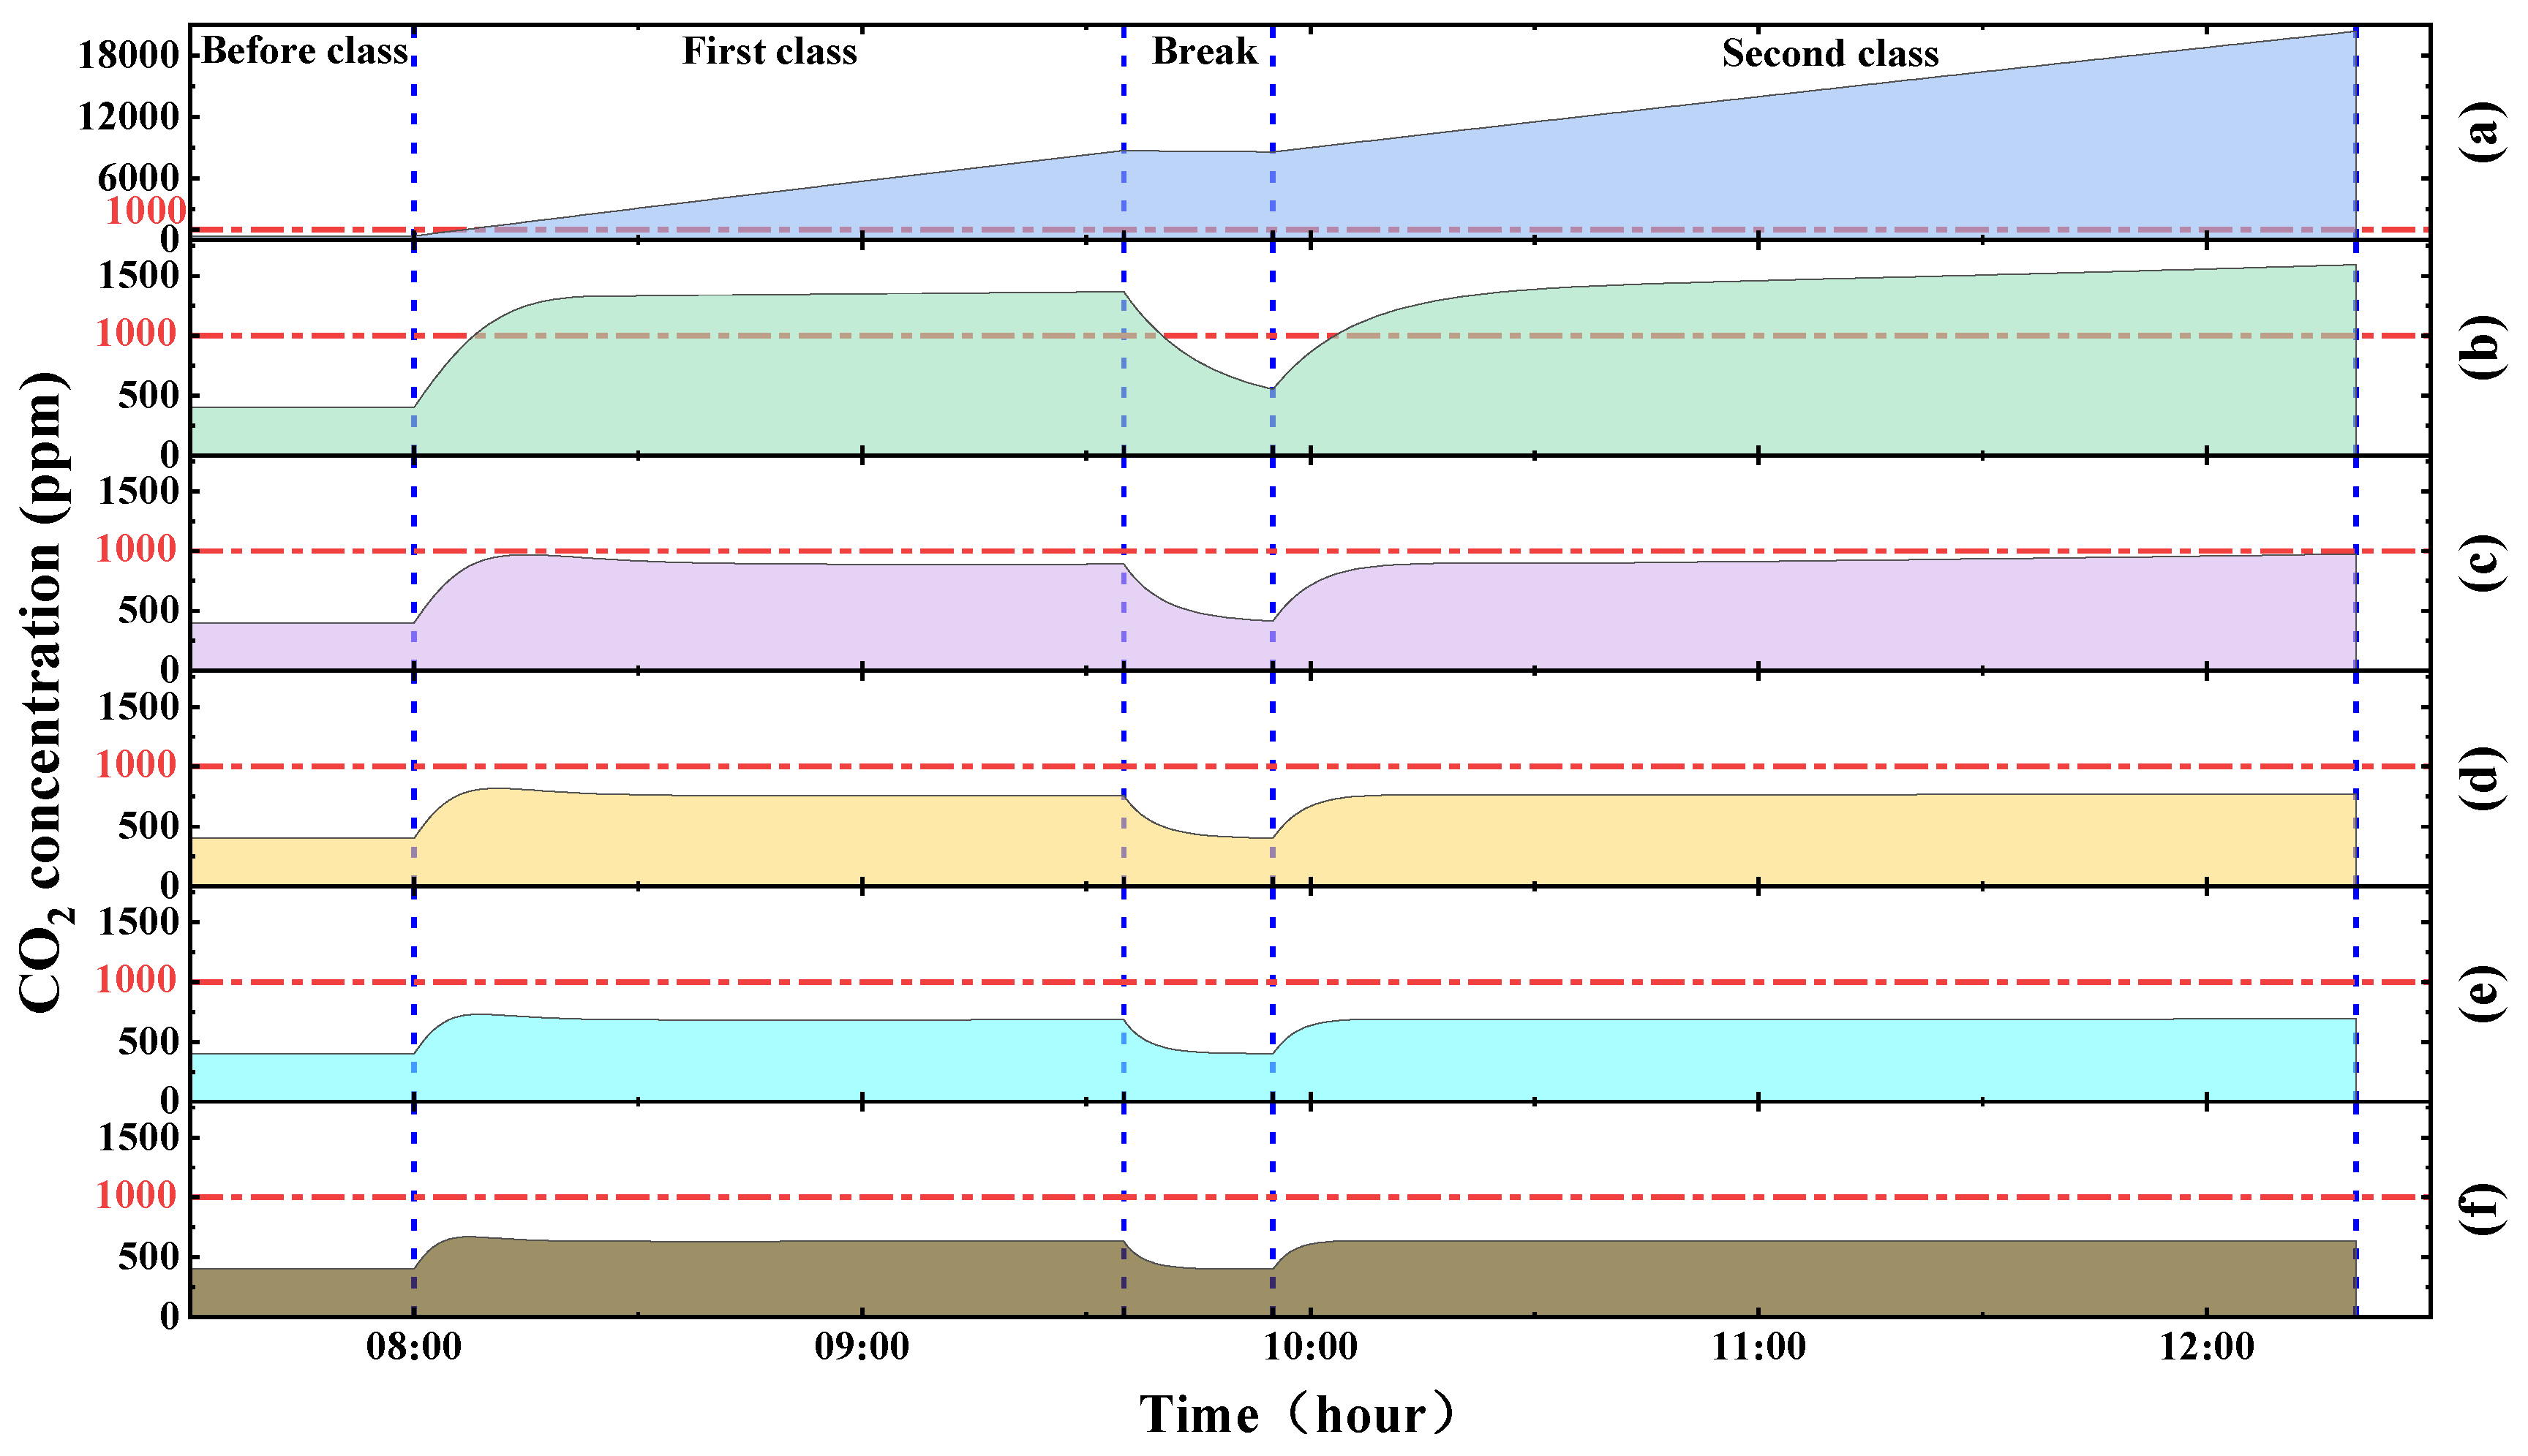
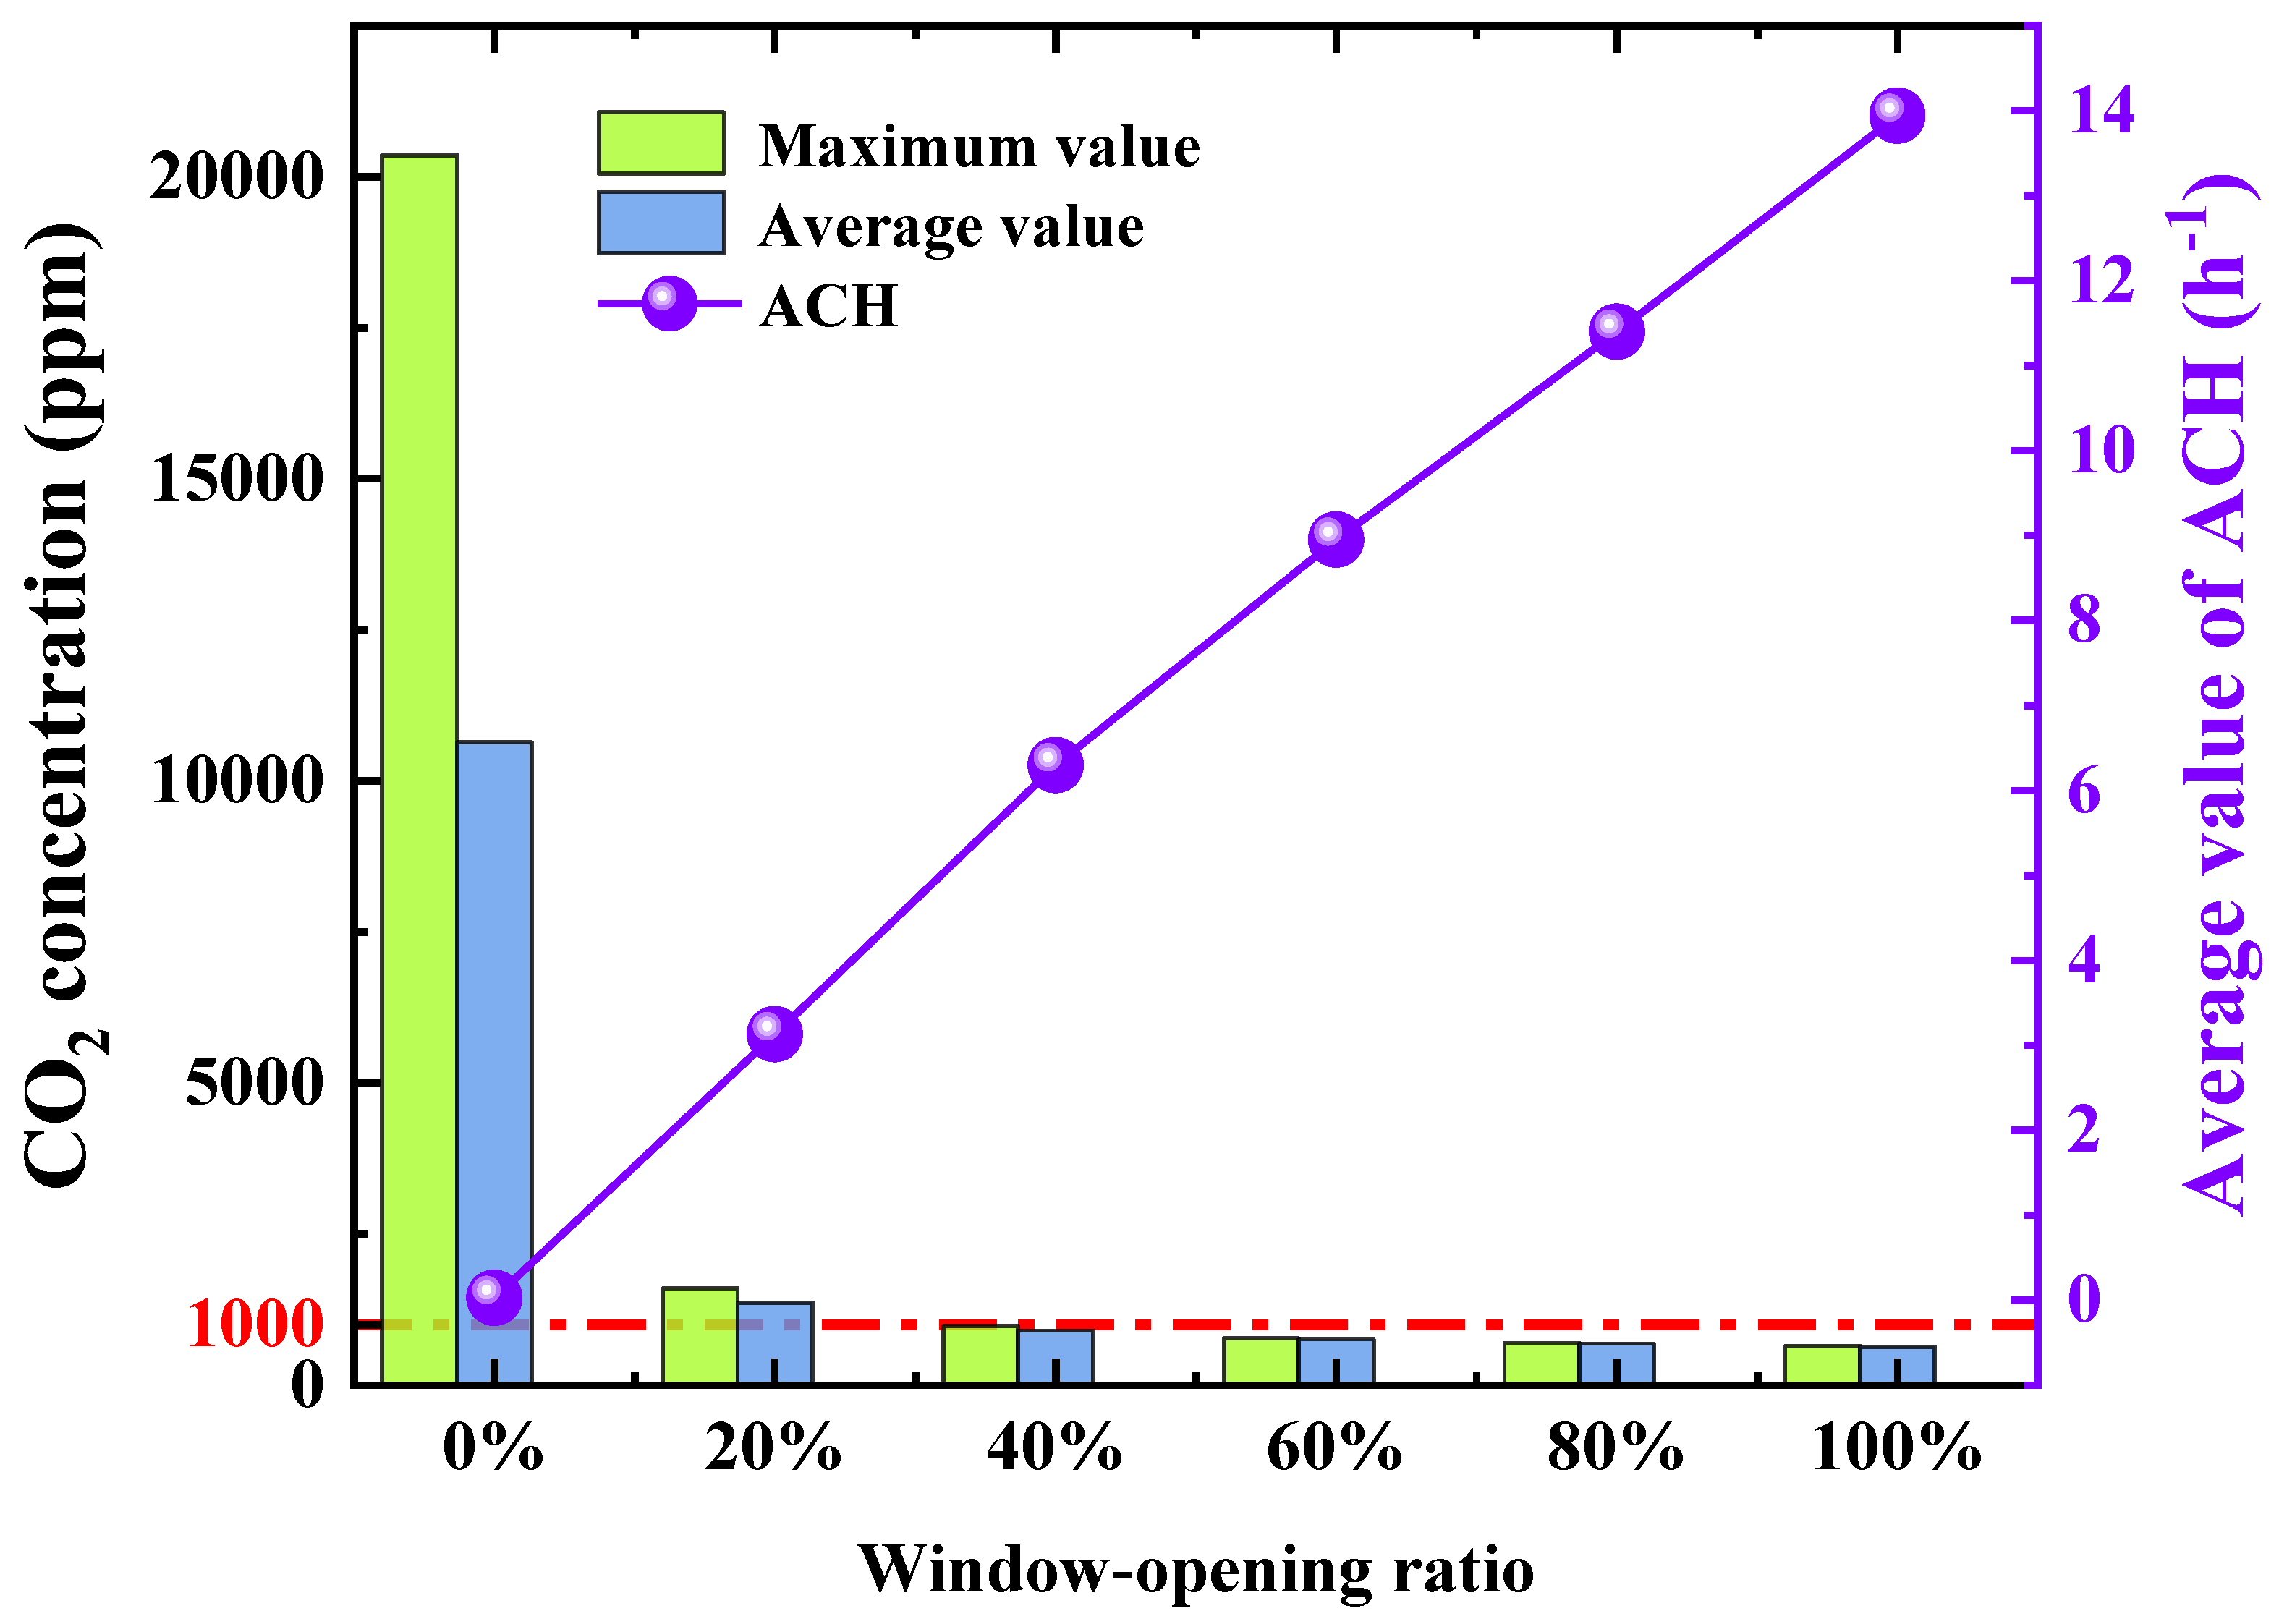
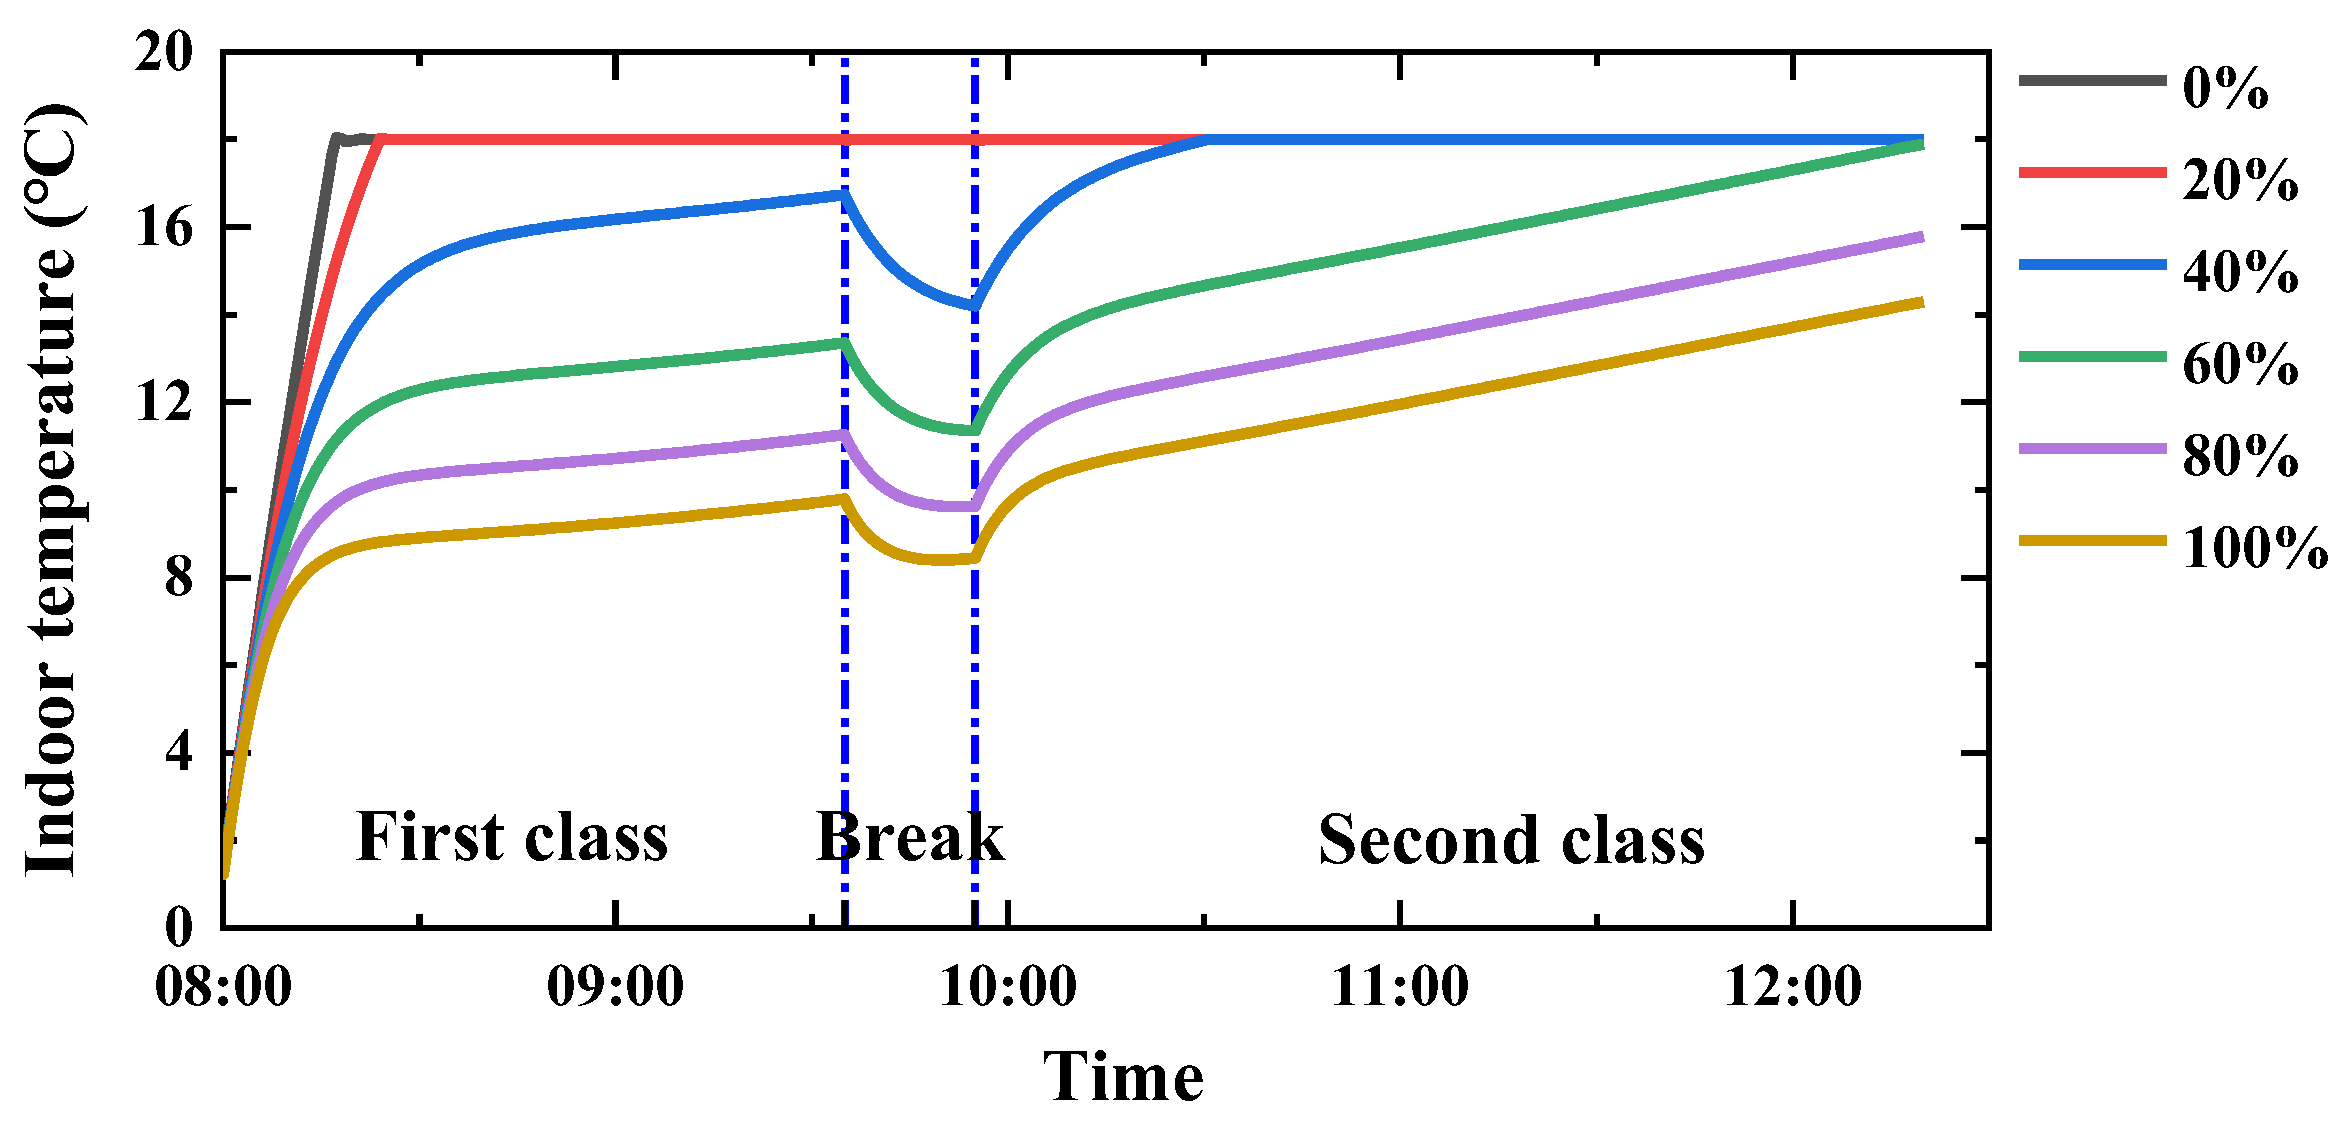
When the window was closed, indoor and outdoor air were only exchanged through the window gap, and the rate of indoor CO2 production was far higher than the rate of CO2 entering the room from the outside. Figure 10 shows the trend of the ICC under FWM with 0%, 20%, 40%, 60%, 80%, and 100% opening in winter. When the window-opening ratio was fixed at 0%, the ICC exceeded 1000 ppm at 8:07, as shown in Figure 10a. The ICC exceeded 3000 ppm at 8:29. At the end of the first lesson, the ICC reached 8720 ppm. At the beginning of the second lesson, the ICC dropped below 8591 ppm. But, at the end of the second lesson, the indoor CO2 reached a maximum of 20,355 ppm. During the whole class time, the duration time for the ICC to exceed 1000 ppm was 233.50 min, which occupied 97.29% of the whole class time. Moreover, the duration time when the ICC exceeded 3000 ppm was 211.08 min, which occupied 87.95%. As shown in Figure 10b–f, the results showed that, when the window-opening ratio was fixed at 20%, the ICC exceeded 1000 ppm at 8:08. The ICC reached 1370 ppm at 9:35. The ICC dropped below 553 ppm at 9:55. Meanwhile, the ICC reached the peak of 1594 ppm at 12:20. The time occupied 93.19% of the whole study period when the CO2 concentration in the classroom exceeded 1000 ppm, and it did not exceed 3000 ppm. When the window-opening ratio was fixed at 40%, 60%, 80%, and 100%, the ICC would not exceed 1000 ppm during the whole time. As shown in Figure 11, with the increase in window-opening ratio, the average and maximum CO2 concentration in the classroom would decrease, but the average hourly air change (ACH) would increase. During the whole class time, with six fixed window-opening ratios (0%, 20%, 40%, 60%, 80%, and 100%), the average ICCs in the classroom were 10,642 ppm, 1360 ppm, 900 ppm, 757 ppm, 684 ppm, and 633 ppm, respectively, and the maximum ICCs were 20355 ppm, 1594 ppm, 976 ppm, 770 ppm, 692 ppm, and 640 ppm, respectively. The ACH was 0.0267, 3.1291, 6.2953, 8.9500, 11.3997, and 13.9428, respectively. As shown in Figure 12, when the fixed window-opening ratios were 0% and 20%, the indoor temperature of the classroom would reach the set value of 18 ± 0.1 °C at 8:17 and 8:23, respectively. The capacity of indoor air conditioner to handle air load was reduced due to the break time. When the window-opening ratio increased again, the air conditioner was unable to handle the fresh air load, resulting in a certain degree of decline in indoor temperature. After the second class, the indoor temperature rose again after the air conditioning capacity recovered to the peak. Moreover, if the window-opening ratio increased to 60% or above again, the indoor temperature would not reach 18 °C during the whole calculation time. When the window-opening ratios were 60%, 80%, and 100%, the maximum indoor temperatures of the classroom were 17.90 °C, 15.79 °C, and 14.30 °C, respectively.

Figure 10.
Variation in ICC under FWM with (a) 0%, (b) 20%, (c) 40%, (d) 60%, (e) 80%, and (f) 100% opening.
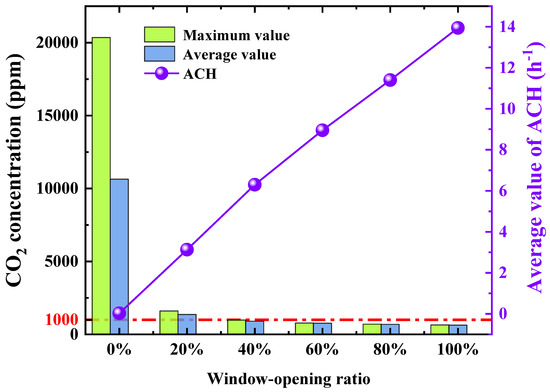
Figure 11.
Variation in ICC and average value of ACH under FWM.

Figure 12.
Variation in indoor temperature under FWM.
3.1.2. The Effect of the Switch Control Method
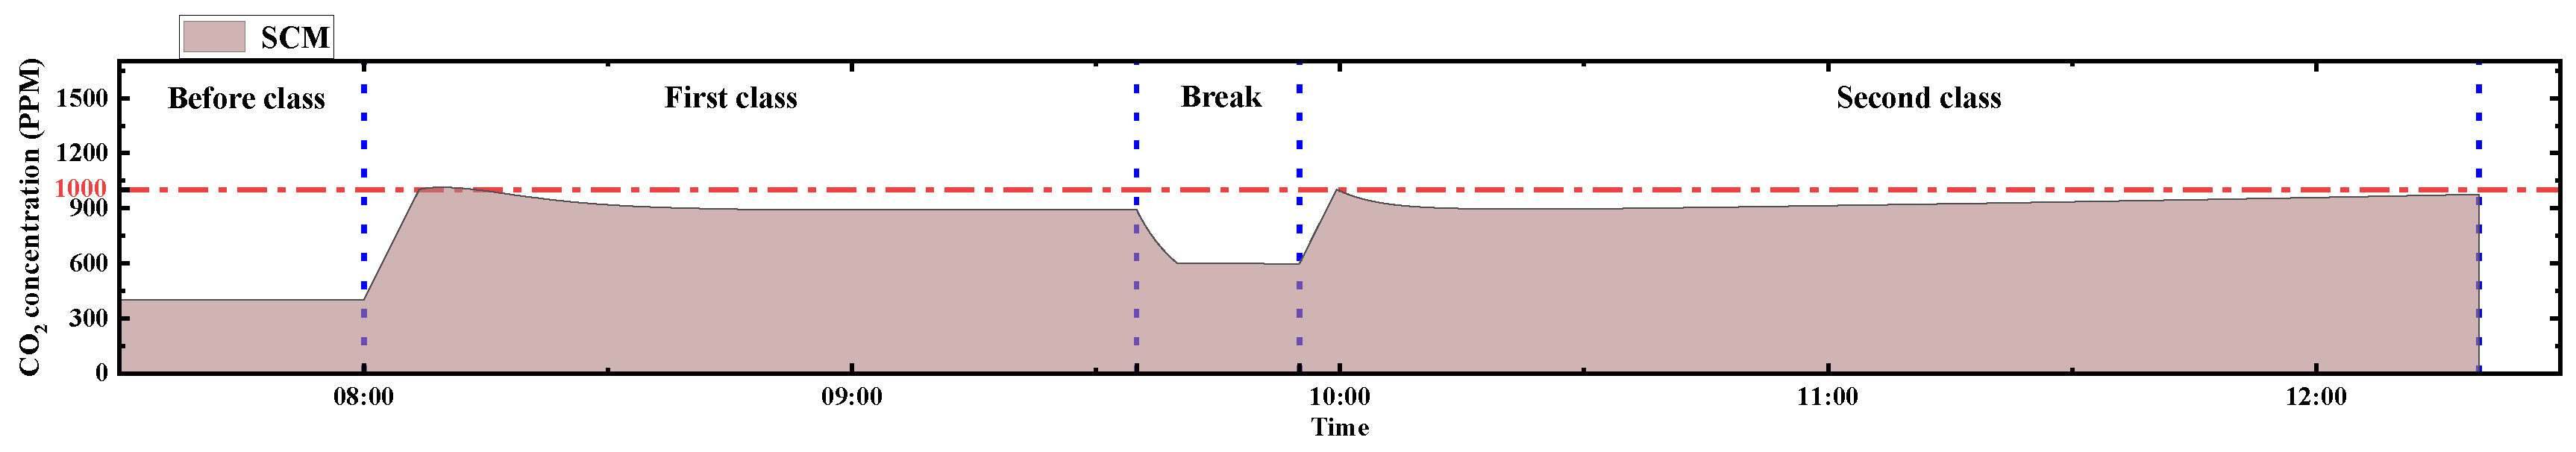
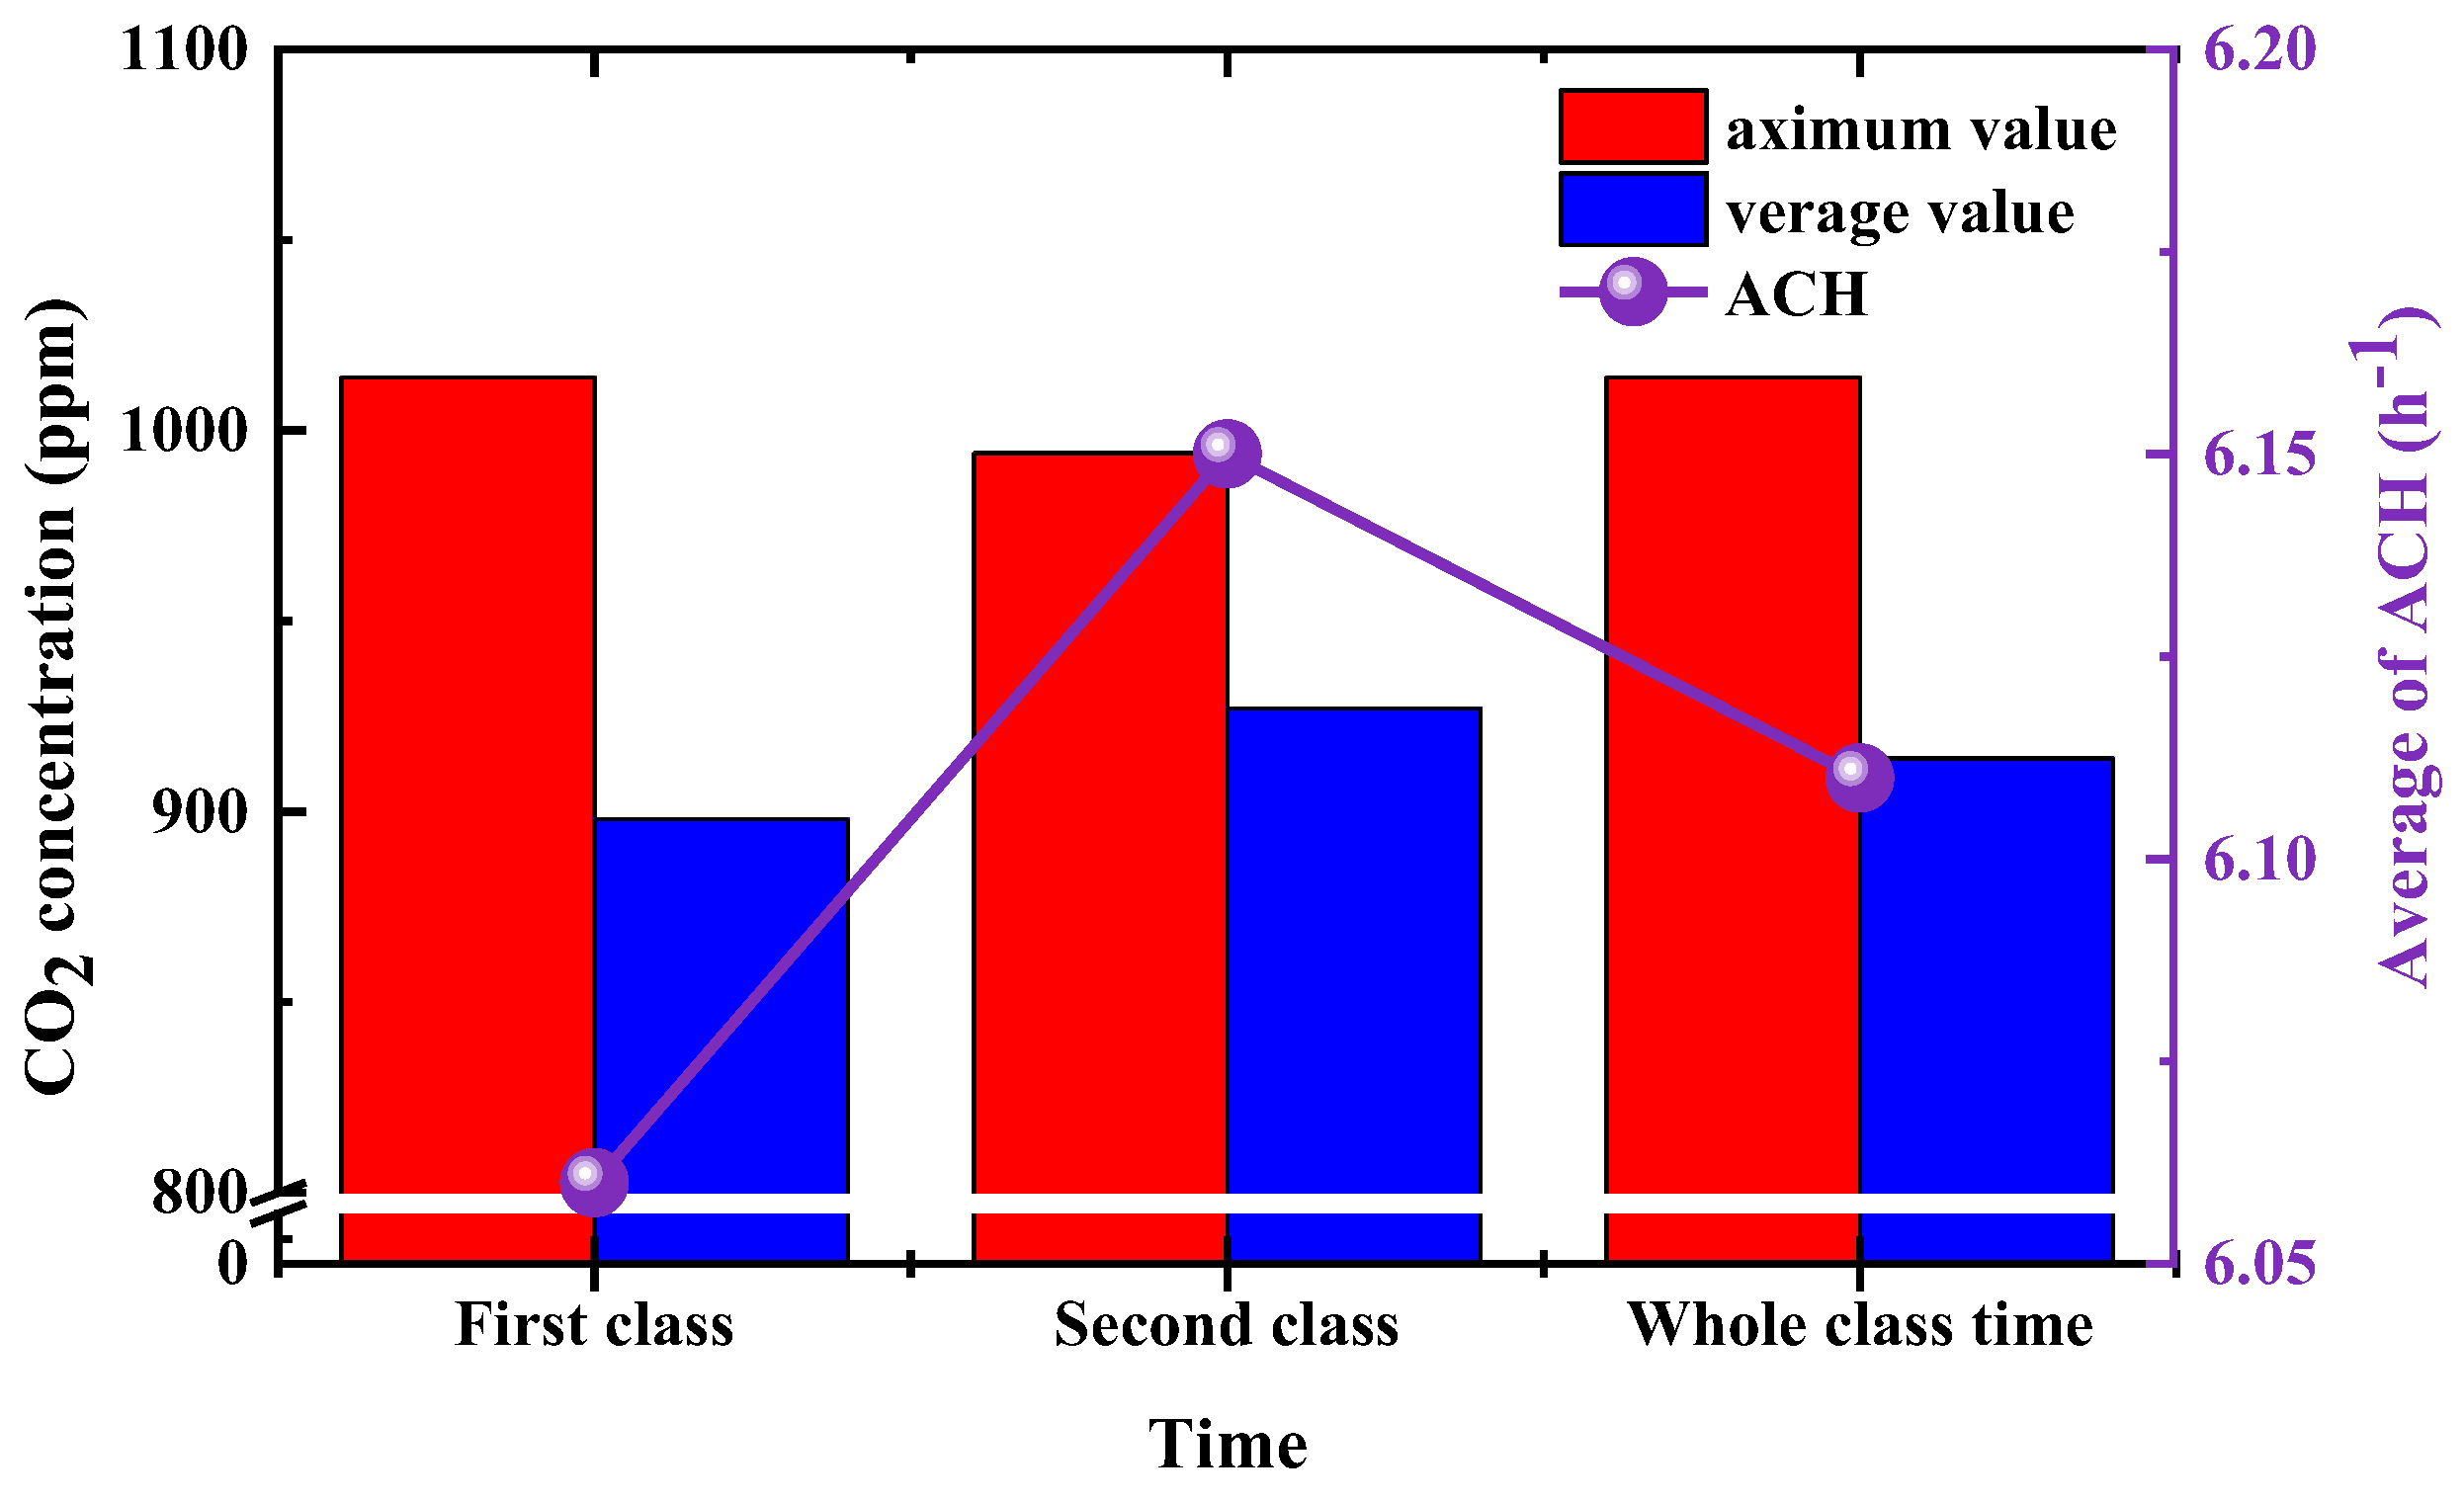
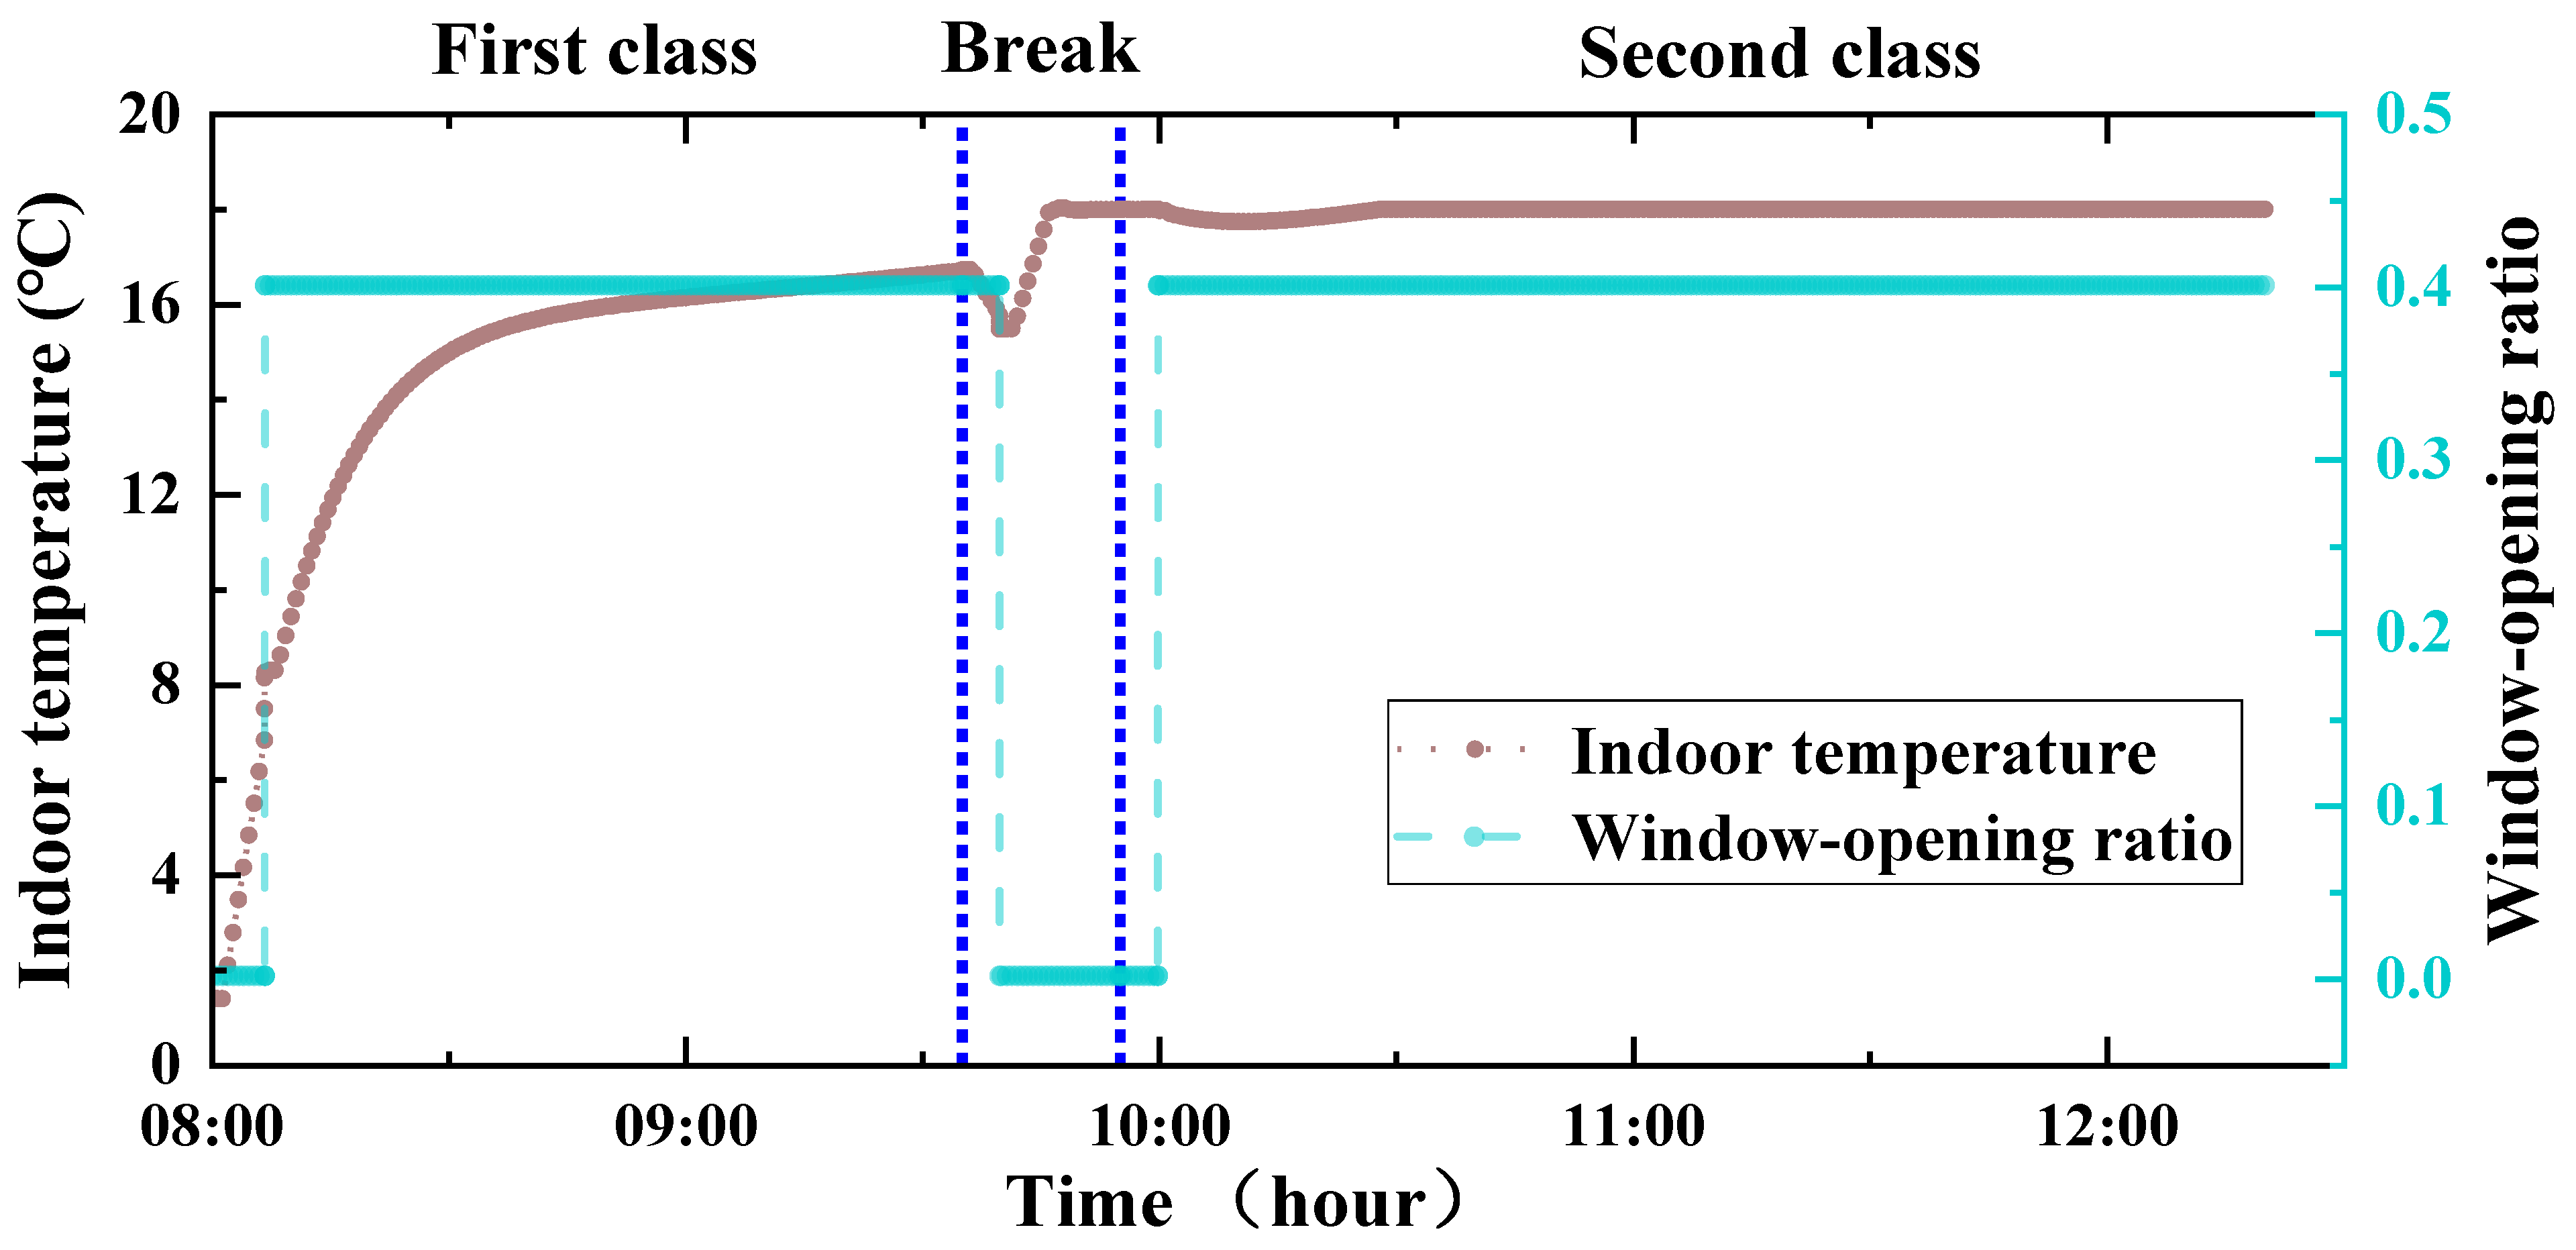
According to Section 2.3, the SCM was supposed to be set a fixed value. When the indoor CO2 exceeded 1000 ppm, the switch would open to control the window-opening ratio at the set value. As mentioned above, the ICC could not be controlled below 1000 ppm under the FWM with 20% opening. However, when the fixed window-opening ratio was 40%, the ICC could be well controlled. Thus, 40% was selected as the fixed window-opening ratio of the SCM. Figure 13 shows the trend of the ICC in the classroom under the SCM. It could be seen that the overall concentration in the classroom was below 1000 ppm. During whole class time, the duration time when the ICC exceeded 1000 ppm was 7.33 min, accounting for 3.01%. According to the simulation results, as shown in Figure 14, the average ICC in the first lesson was 898 ppm, the maximum concentration was 1014 ppm, and the average ACH was 6.06. At the same time, the average ICC in the second lesson was 927 ppm, the maximum concentration was 994 ppm, and the average ACH was 6.15. The average ICC of the two classes was 914 ppm, which did not exceed the limit of the classroom air quality standard, and the maximum value occurred at 8:10 in the first class. As shown in Figure 15, the switch was opened at 8:07, and the window-opening ratio of the classroom was fixed to 40% at 9:33. Then, the switch was closed, and the classroom window was completely closed. At 10:00, the switch was opened again. Meanwhile, the indoor temperature in the classroom reached the set value at 9:46. Then, from 10:00 to 10:27, the indoor temperature dropped slightly, higher than 17.5 °C, and then remained at 18 ± 0.1 °C. The average indoor temperature during the first class was 14.47 °C, and it was 17.95 °C during the second class, and the average indoor temperature of both classes was 16.58 °C. In the whole class time, the time for the indoor temperature to reach the set value was 123 min, accounting for 51.25%. In addition, the temperature in the first classroom would not reach the set value any more, and the indoor air had no good thermal comfort.

Figure 13.
Variation in ICC under SCM.
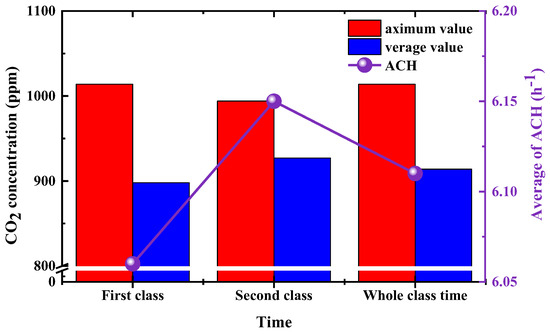
Figure 14.
Statistics of average and maximum concentrations of indoor CO2 and air changes in each class under SCM.
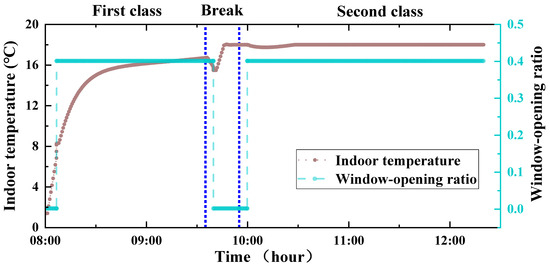
Figure 15.
Variation in indoor temperature and window-opening ratio under SCM.
3.1.3. The Effect of the Automatic Control Method
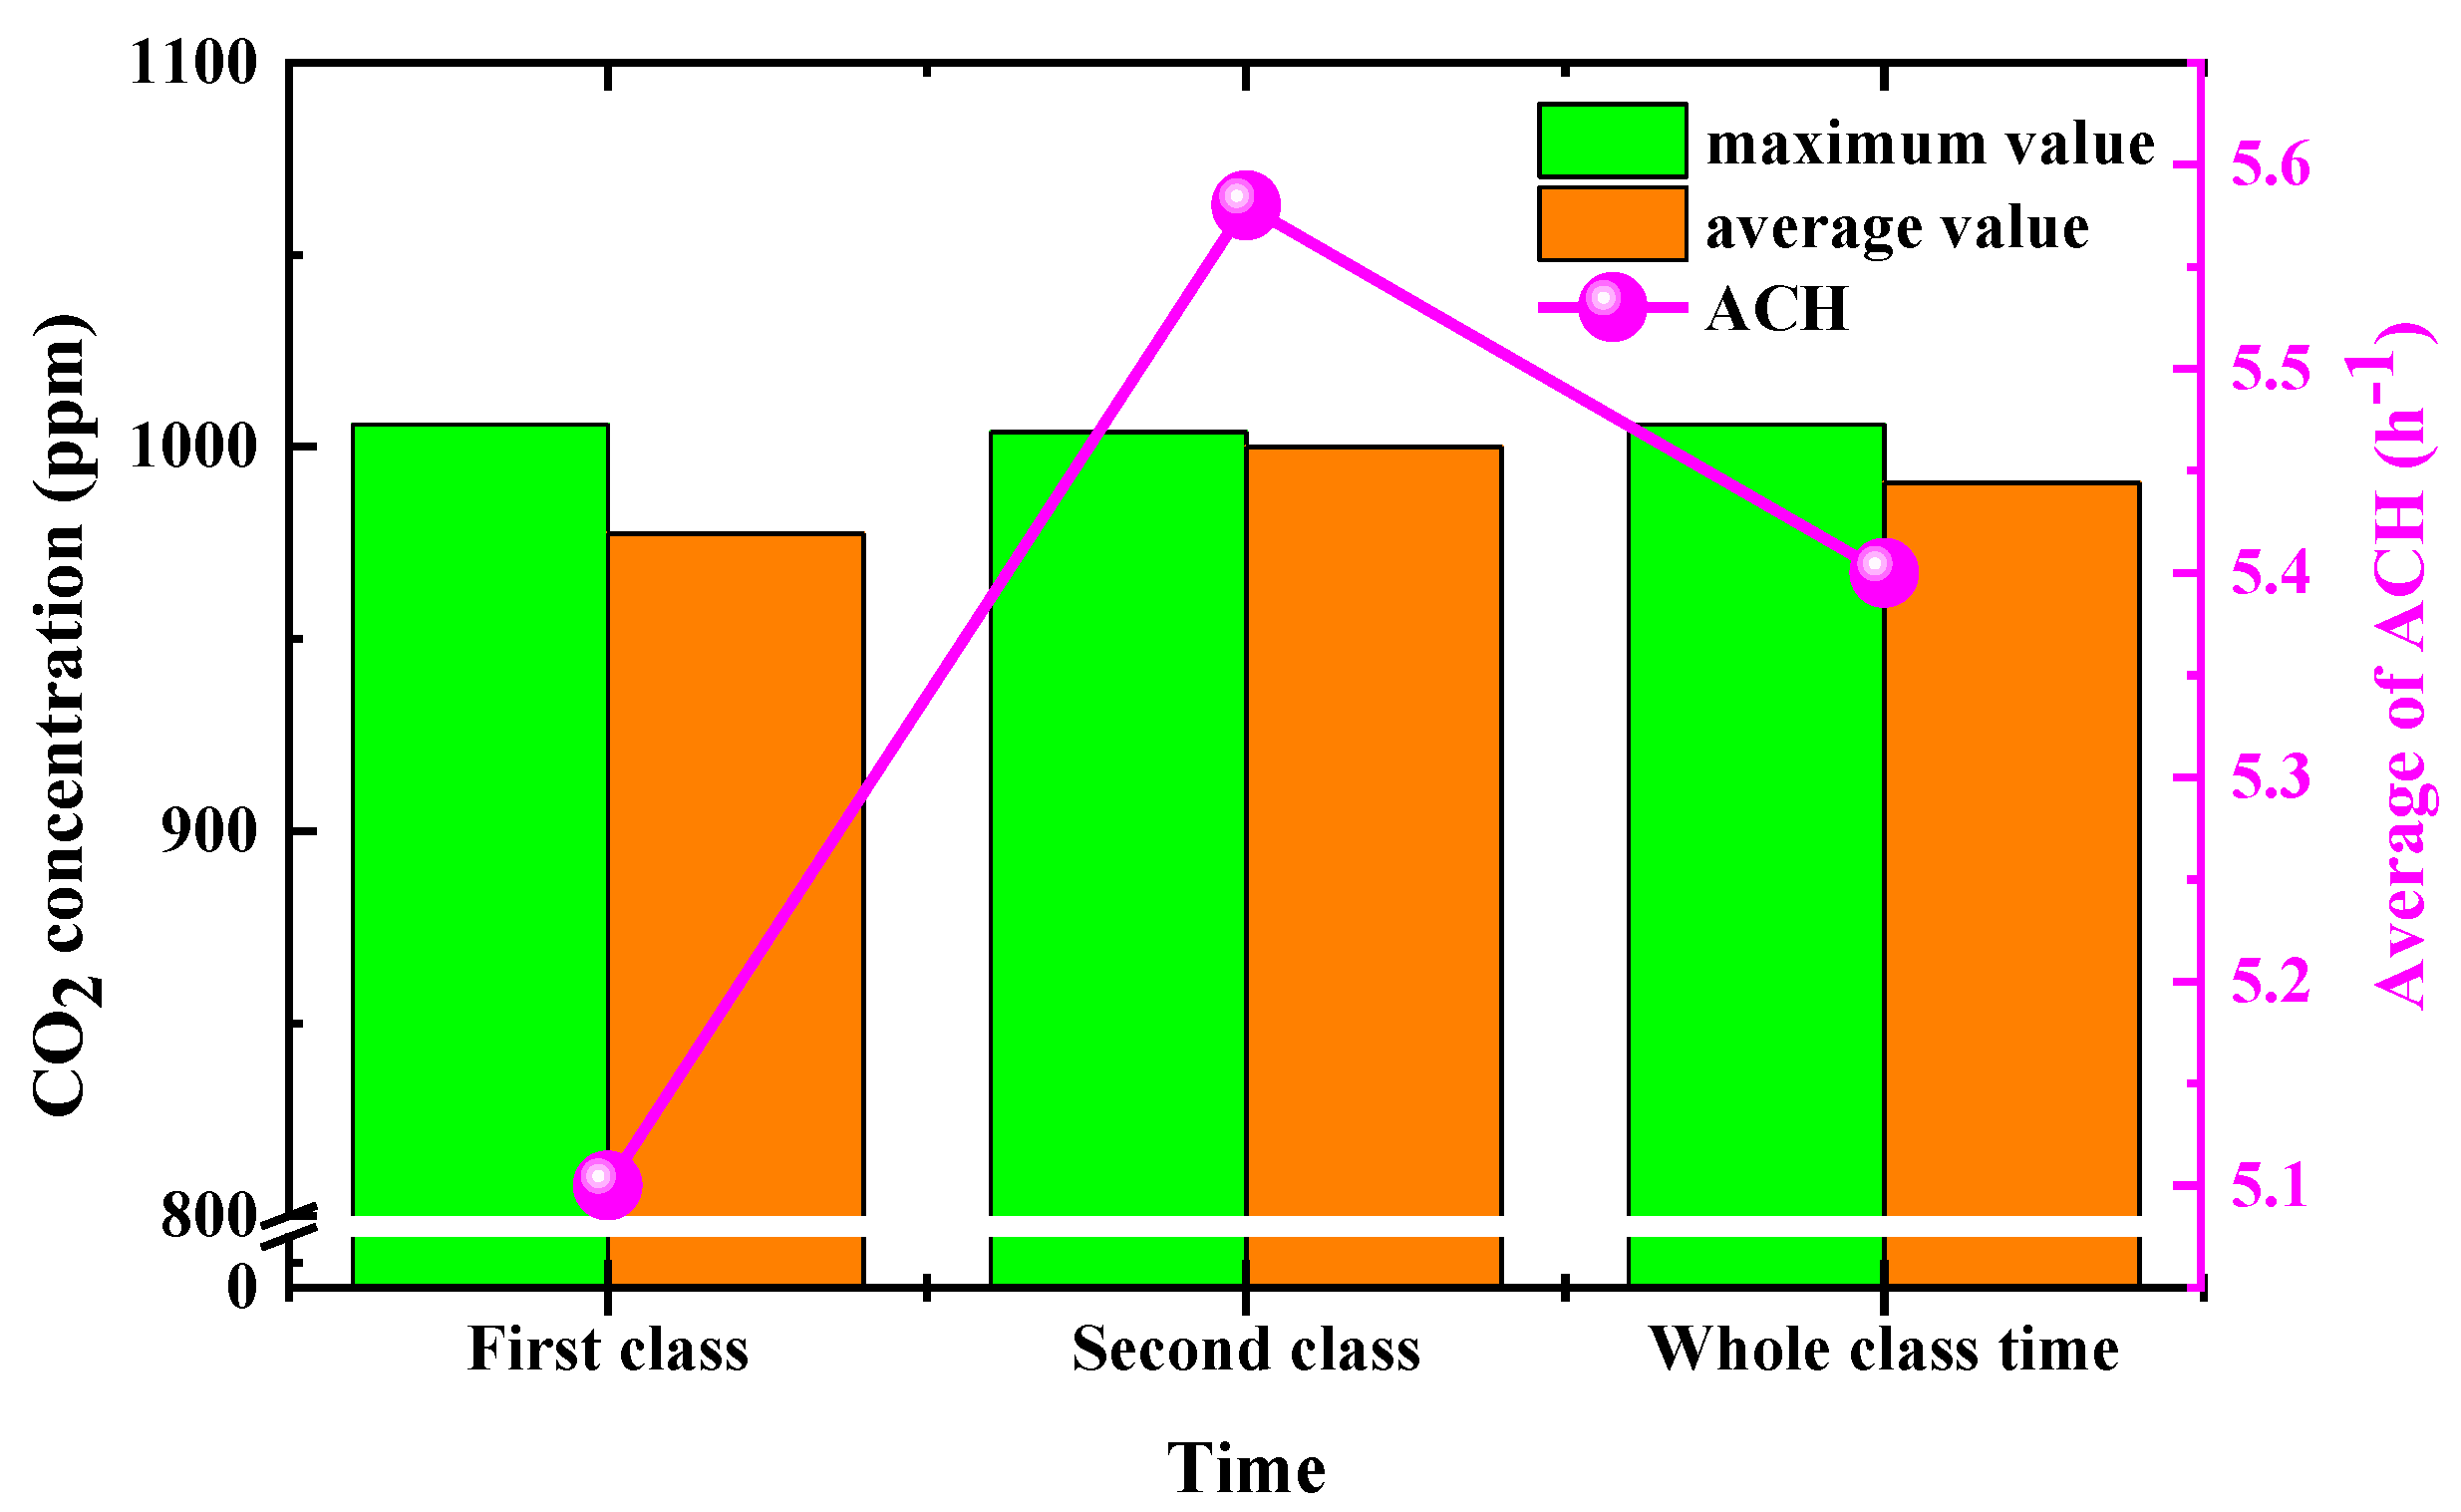
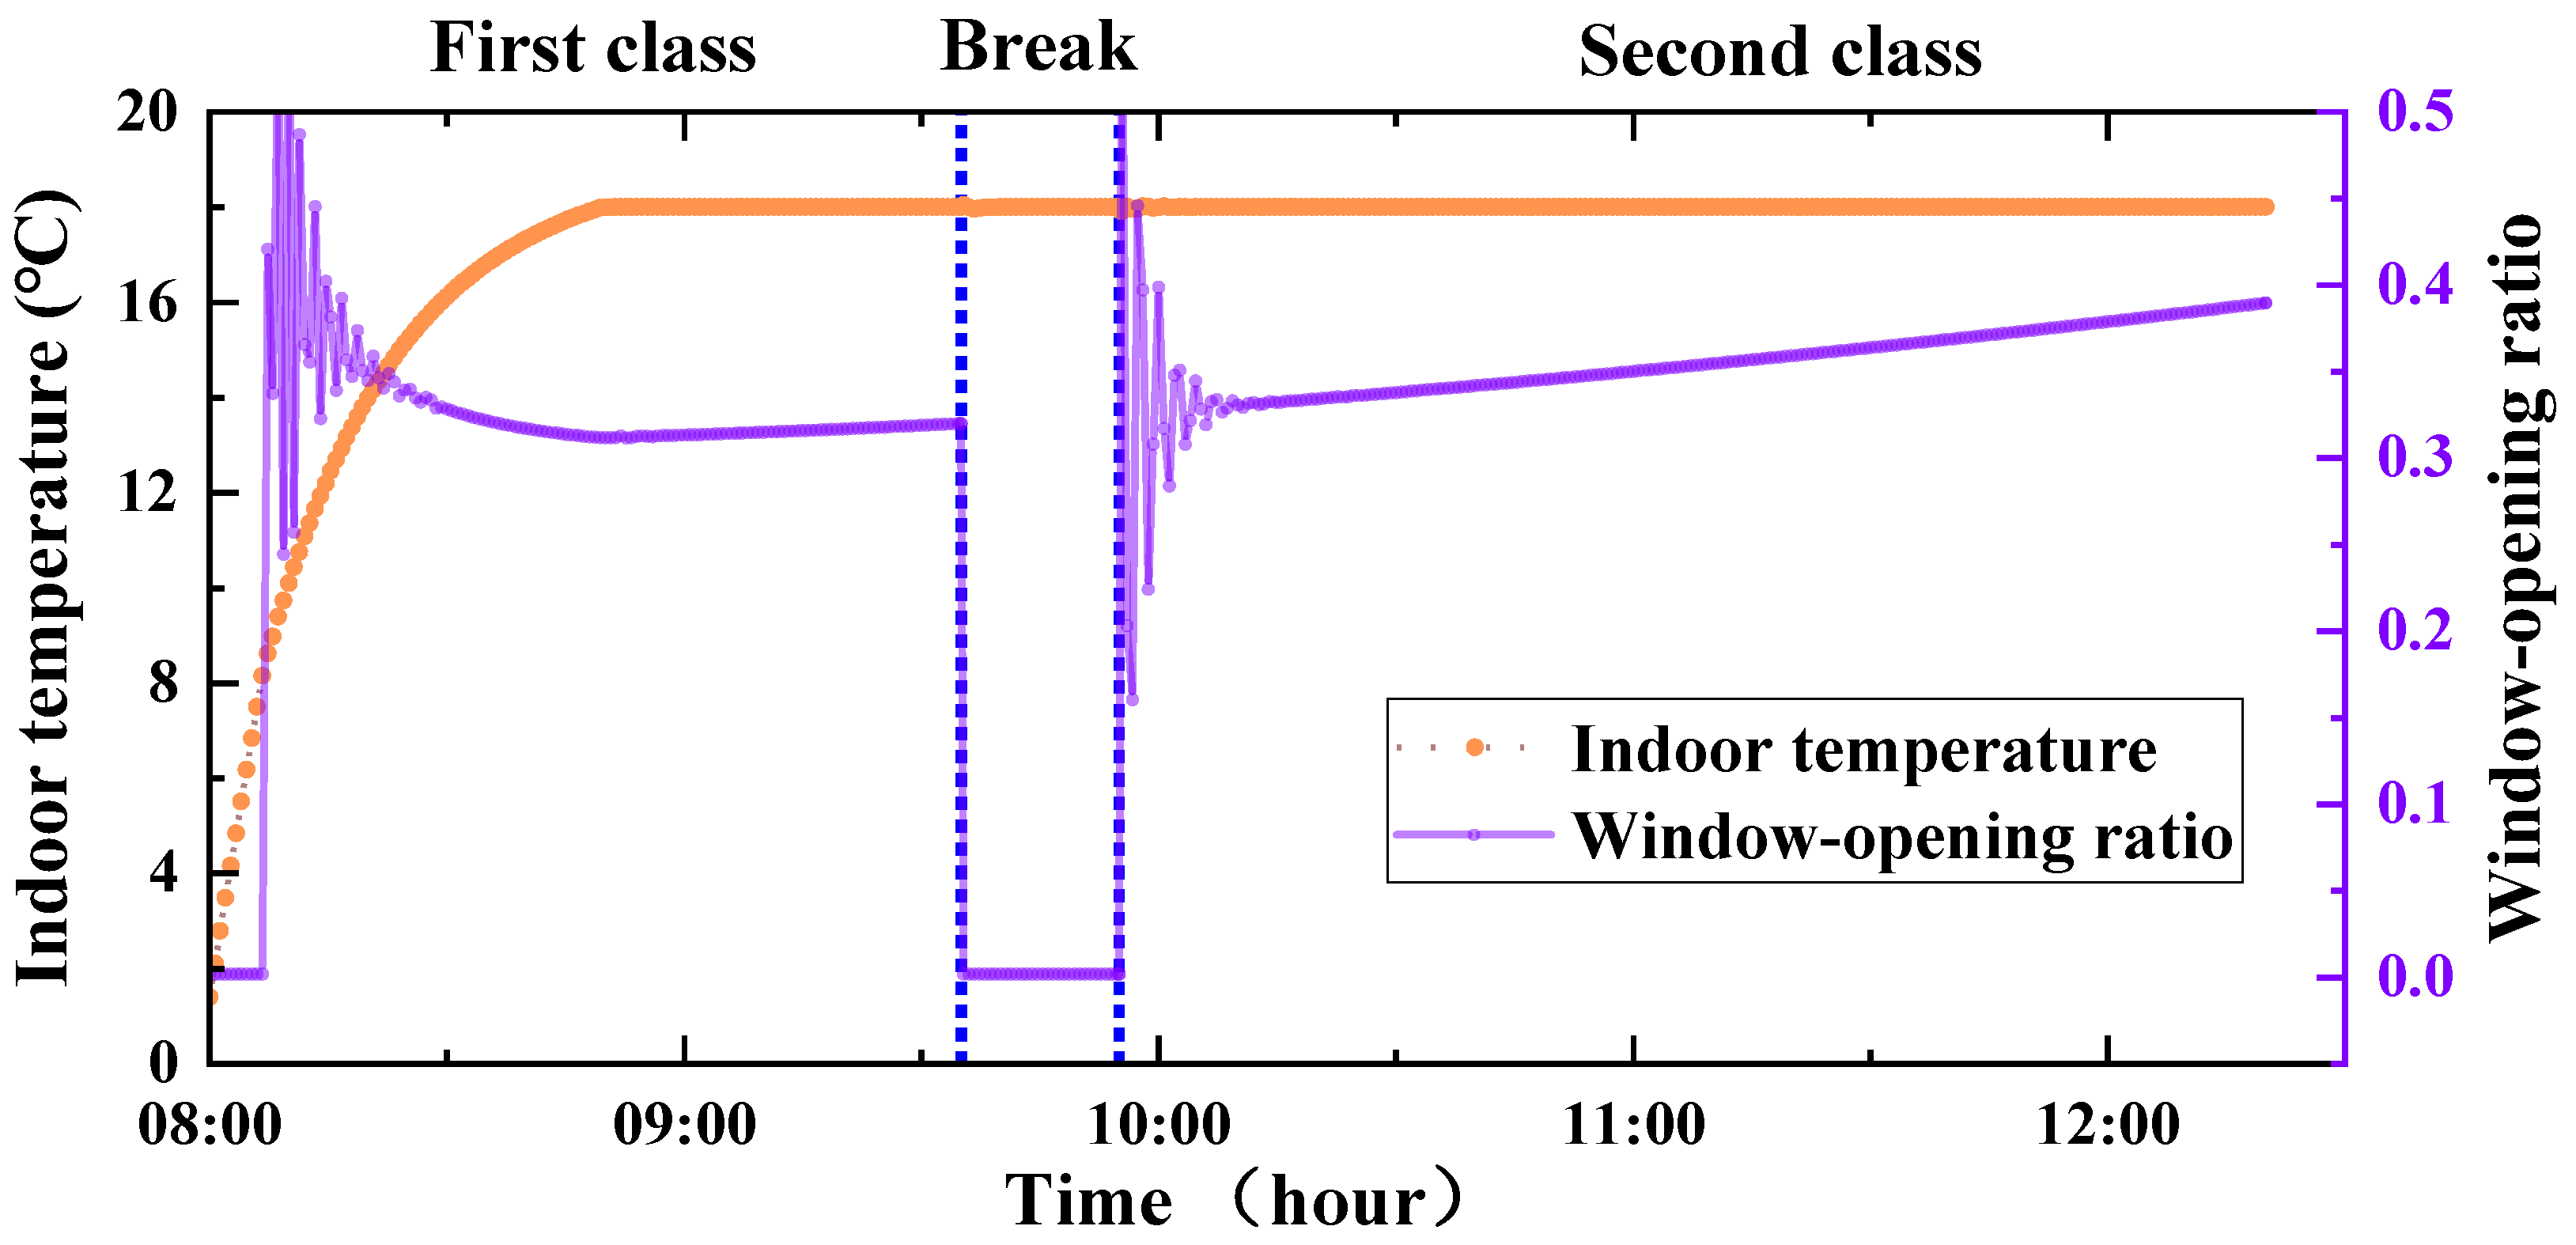
Compared with the SCM, the window-opening ratio was not a set fixed value when the ACM was adopted. When the indoor CO2 exceeded 1000 ppm, the window would open automatically, and the window-opening ratio would be time-variant. Figure 16 shows the trend of the ICC in the classroom under the ACM. It could be seen that the overall concentration of the classroom could always be maintained below 1000 ppm. During class time, the time interval when the ICC exceeded 1000 ppm was only 9.33 min, accounting for 3.89%. According to the simulation results, as shown in Figure 17, the average ICC in the first lesson was 977 ppm, the maximum concentration was 1006 ppm, and the average ACH was 5.10. At the same time, the average ICC in the second lesson was 1000 ppm, the maximum concentration was 1004 ppm, and the average ACH was 5.58. The average ICC of the two classes was 991 ppm, which did not exceed the limit of the classroom air quality standard, and the maximum value occurred at 8:07 in the first class. As shown in Figure 18, at 8:07, the window would open automatically and last for 96 min. After that, the window would keep closed for 20 min and then keep open until the end. In the whole class time, the average window-opening ratio was 33.49%. At the same time, the indoor temperature in the classroom reached the set value of 18 °C at 8:51, and then remained at 18 ± 0.1 °C. The average indoor temperature of the first class was 15.65 °C, it was 18 °C in the second class, and the average indoor temperature of both classes was 17.07 °C. In the whole class time, the time interval for the indoor temperature to reach the set value was 193.33 min, accounting for 80%.
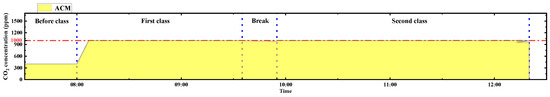
Figure 16.
Variation in ICC under ACM.

Figure 17.
Statistics of average and maximum concentrations of indoor CO2 and air changes in each class under ACM.

Figure 18.
Variation in indoor temperature and window−opening ratio under ACM.
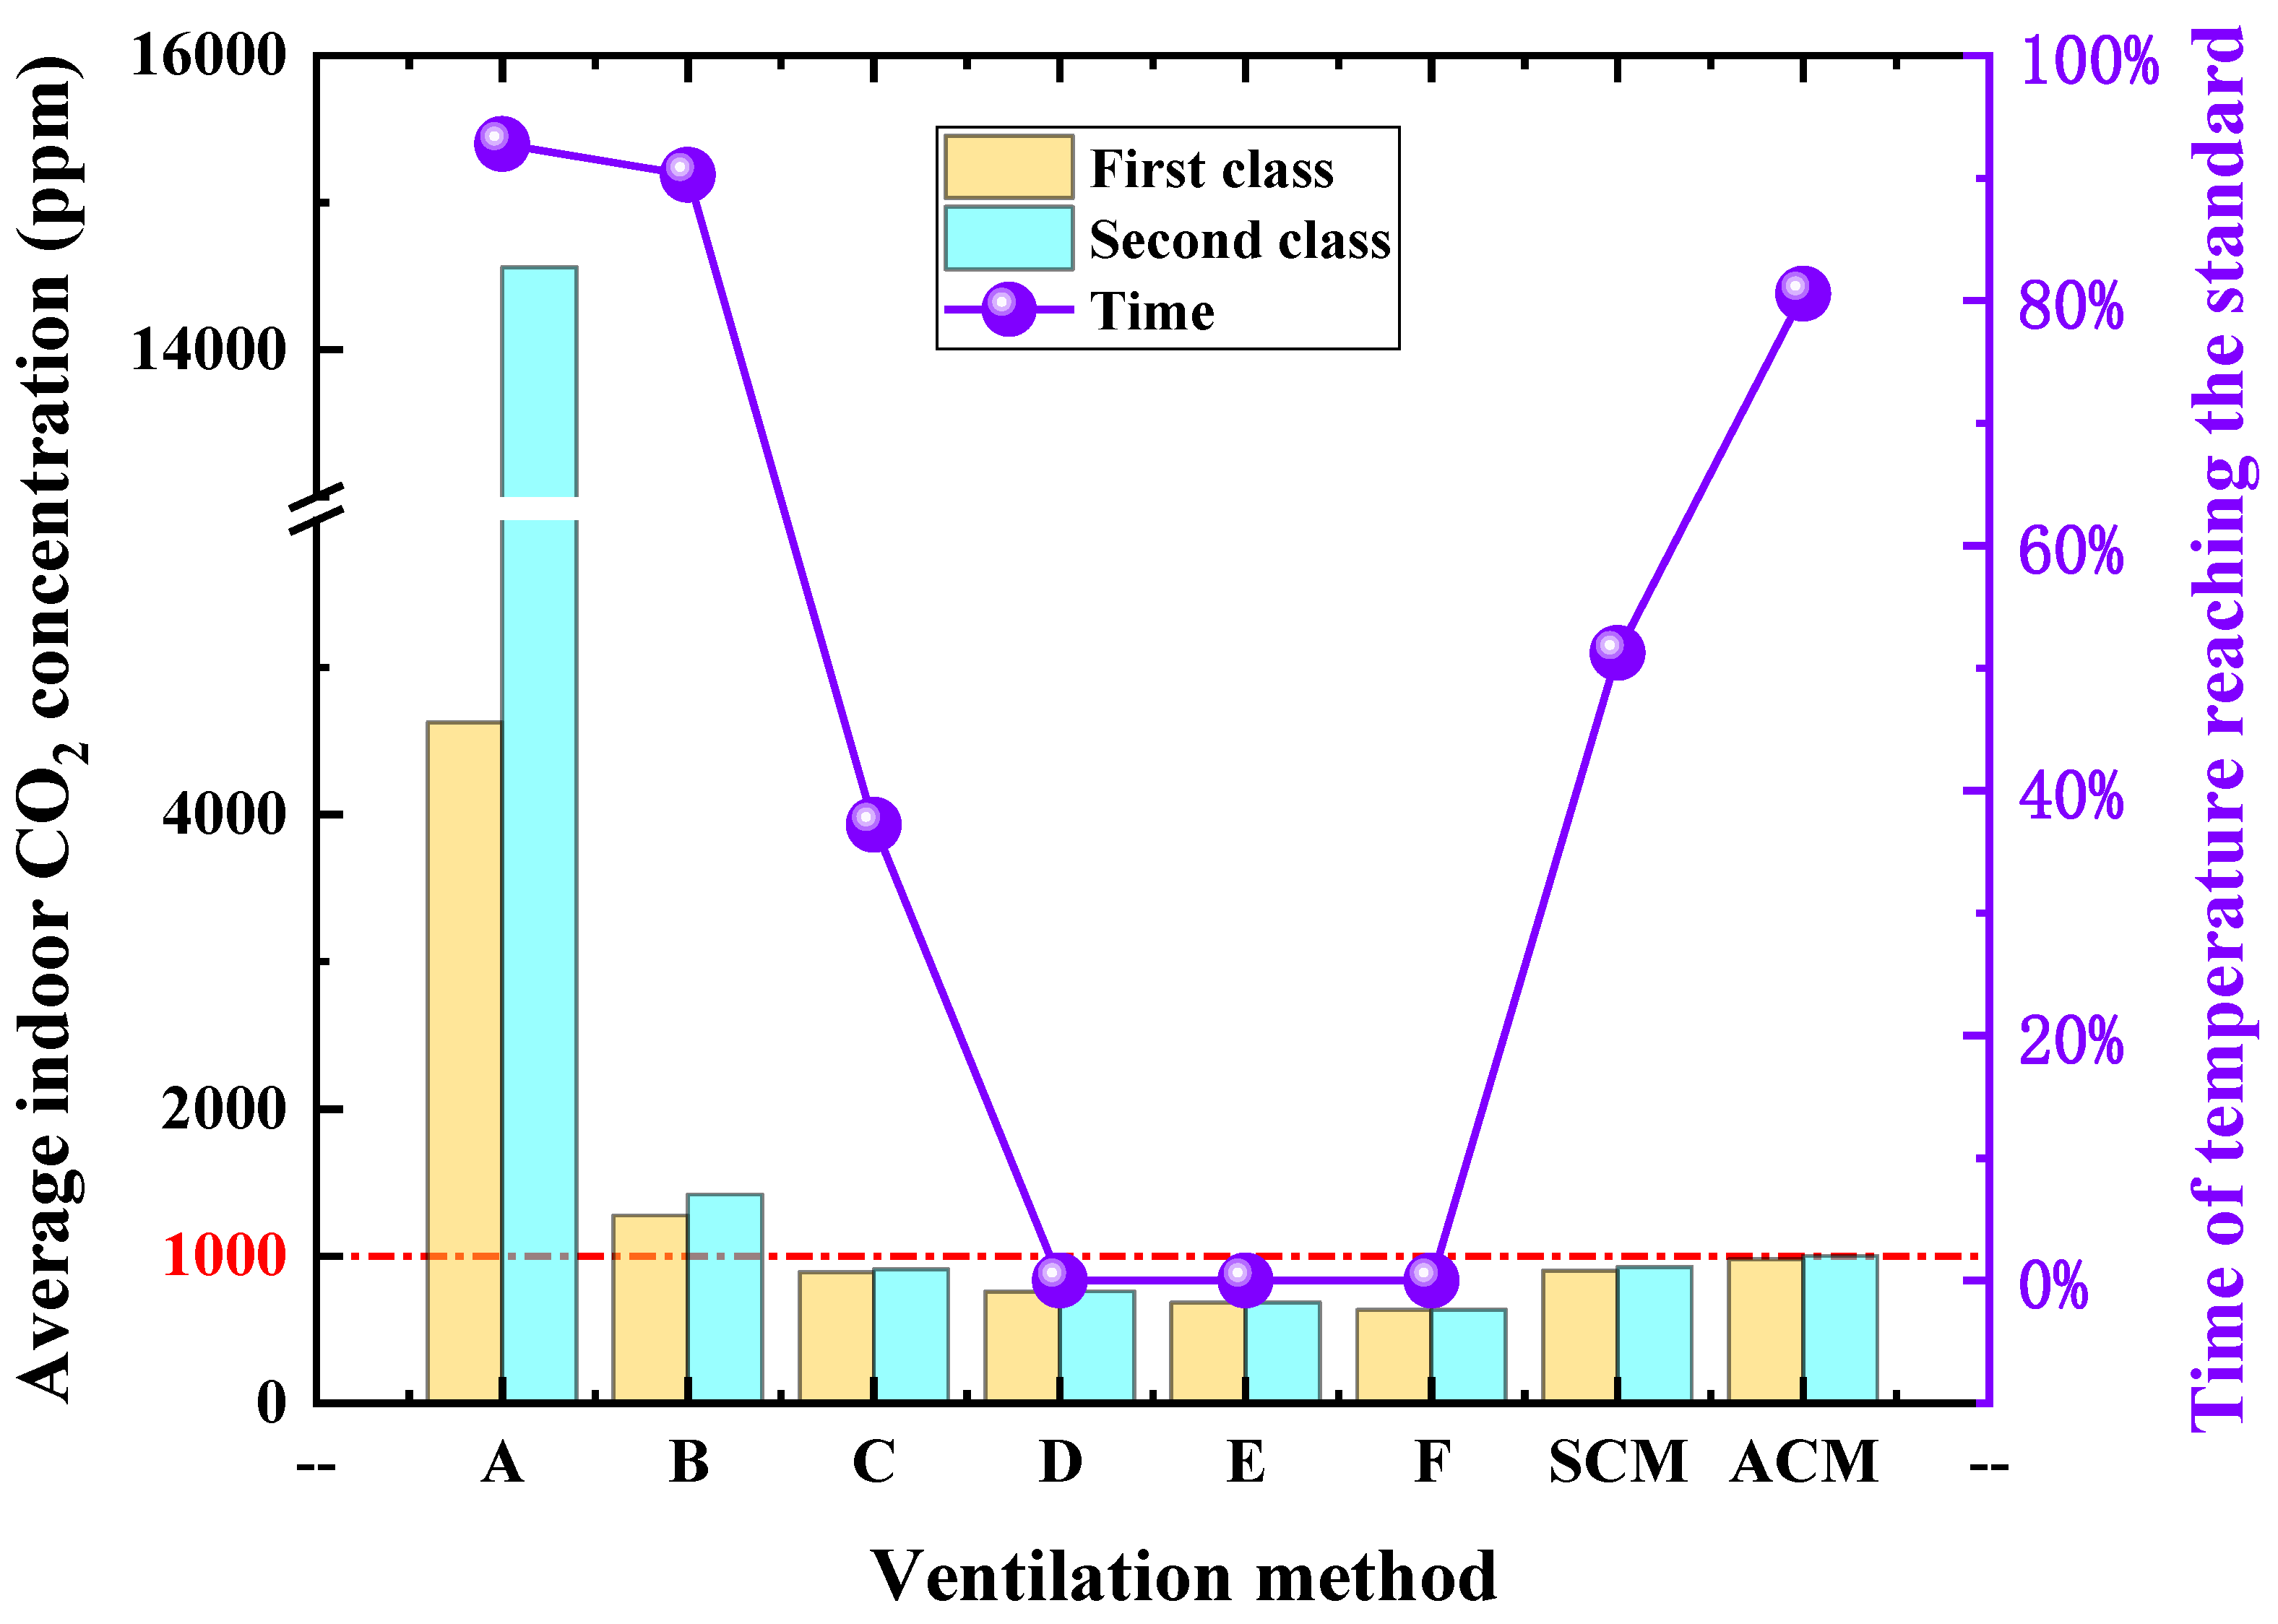
3.1.4. The Effect of Indoor Average CO2 Concentration and Temperature
The average ICC of the first class and the second class of the above eight ventilation methods and the proportion of time when the temperature reached the standard in the whole calculation time are shown in Figure 19. Wherein, A~F were different window-opening ratios of FWM (0%, 20%, 40%, 60%, 80%, 100%), respectively. It can be seen from Figure 20 that, when the classroom was ventilated by the FWM with 0% or 20% opening, the ICC was higher than the limit value of the classroom air quality standard, which seriously affected students’ learning efficiency and was harmful to students’ health. When the classroom was ventilated by the FWM with 40% opening or more, the air temperature could not be controlled at the set value of 18 ± 0.1 °C. The indoor air had no good thermal comfort and wasted a lot of energy. In general, the FWM in the classroom was not recommended in this paper, while both the SCM and ACM could maintain the average ICC of the two classes below 1000 ppm. It can be seen from Figure 20 that the ACM had a better thermal comfort than the SCM; thus, the ACM was recommended when considering indoor air quality and thermal comfort.
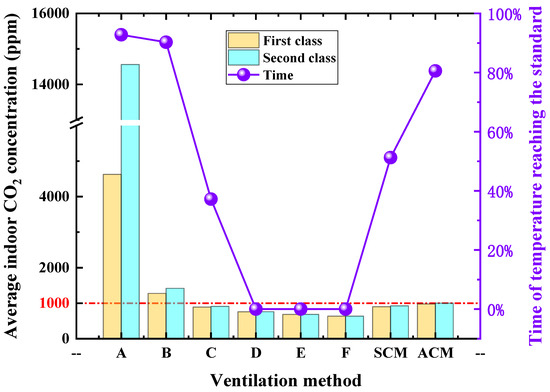
Figure 19.
Variation in ICC and temperature compliance under eight ventilation methods.
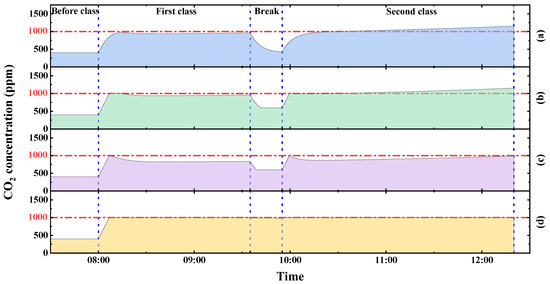
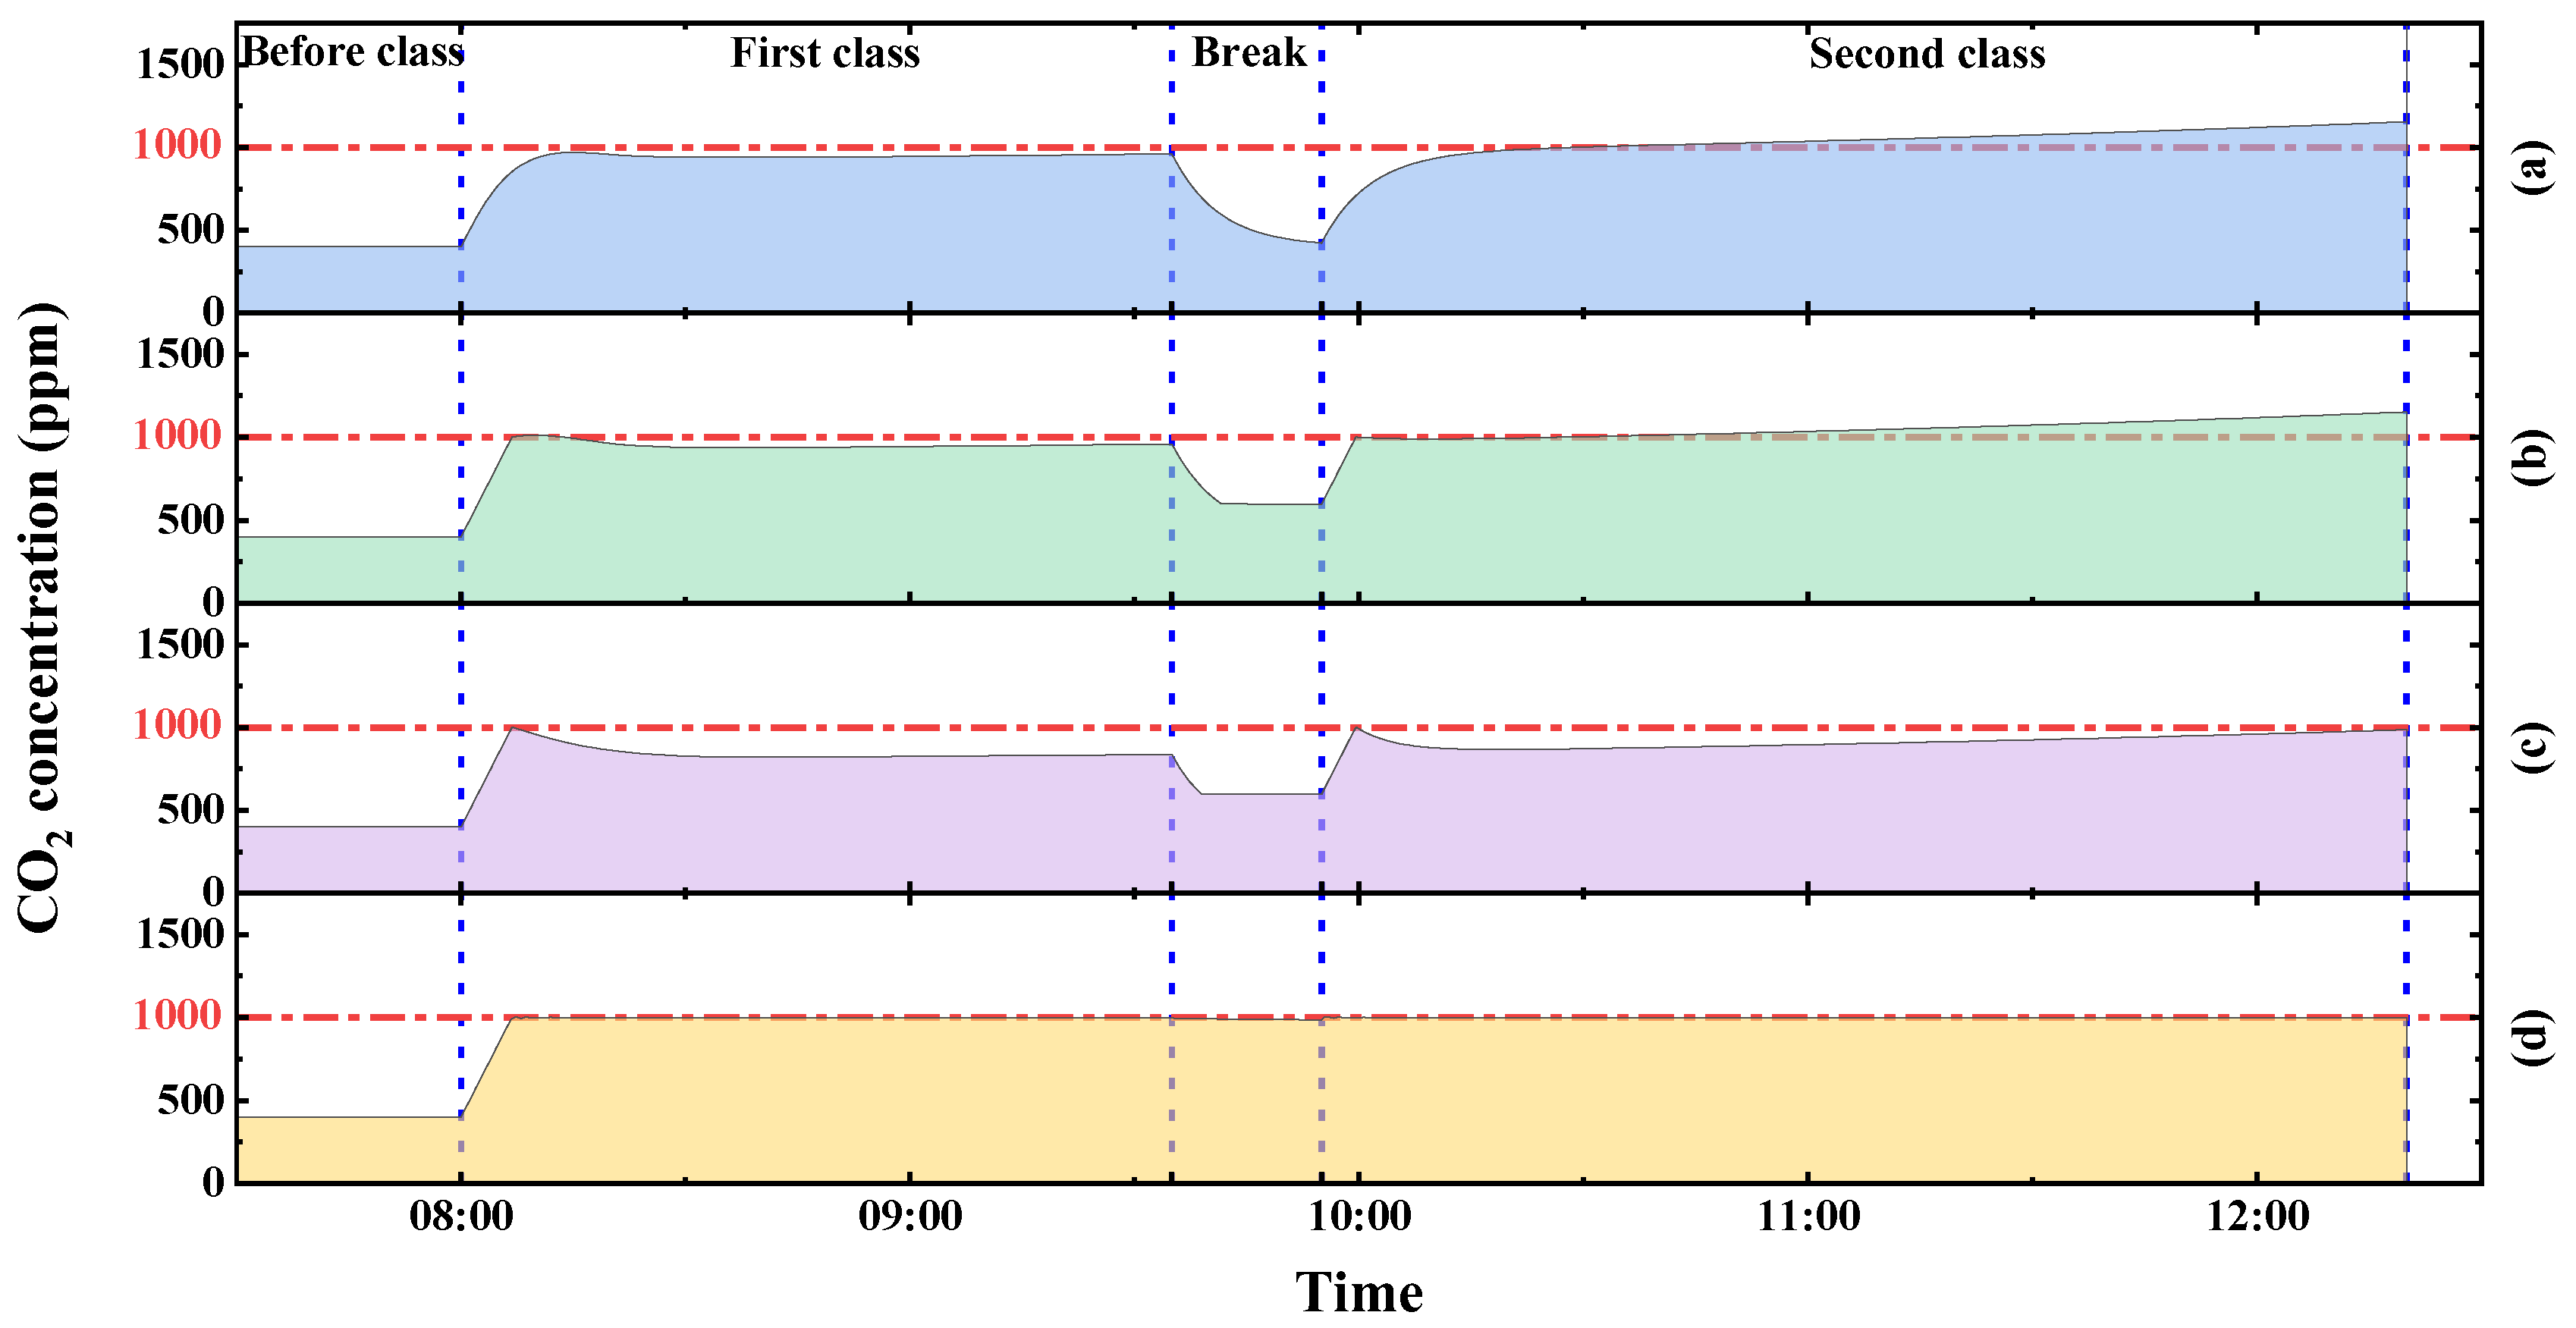
Figure 20.
Variation in pollutant concentration under (a) FWM with 40%, (b) SCM with 40%, (c) SCM with 50%, (d) ACM.
3.2. The Analysis of IAQ and Thermal Comfort Based on Learning Efficiency
Based on the temperature point of the highest learning efficiency studied by Jingjiang et al. [18], the design temperature was 13.5 °C. In this subsection, the indoor air temperature, CO2 concentration, and fresh air energy consumption of the three ventilation methods were compared and analyzed.
When the FWM was adopted, the CO2 concentration with 0% opening or 20% opening and the fresh air energy consumption with 60% opening or 80% opening were both too high, which were obviously unsuitable. Therefore, in this subsection, 40% opening by the FWM was selected to conduct the simulation. In the simulation process, it was found that the original SCM with 40% opening had no obvious positive effects on reducing the ICC, so the SCM with 50% opening was selected to conduct the simulation analysis together.
3.2.1. The Effect of the ICC
In this subsection, the four different ventilation methods were simulated and the results were analyzed, namely, the FWM with 40% opening, the SCM with 40% opening, the SCM with 50% opening, and the ACM. As shown in Figure 20, during the whole class time, their corresponding average ICCs were 985 ppm, 1003 ppm, 883 ppm, and 991 ppm, respectively. Furthermore, the highest concentrations were 1154 ppm, 1154 ppm, 987 ppm, and 1002 ppm, respectively. The duration time with the CO2 concentrations of more than 1000 ppm accounted for 58.52%, 48.26%, 0.03%, and 2.22% of the whole class time. Only the SCM with 50% opening and the ACM could ensure an acceptable CO2 concentration in the classroom.
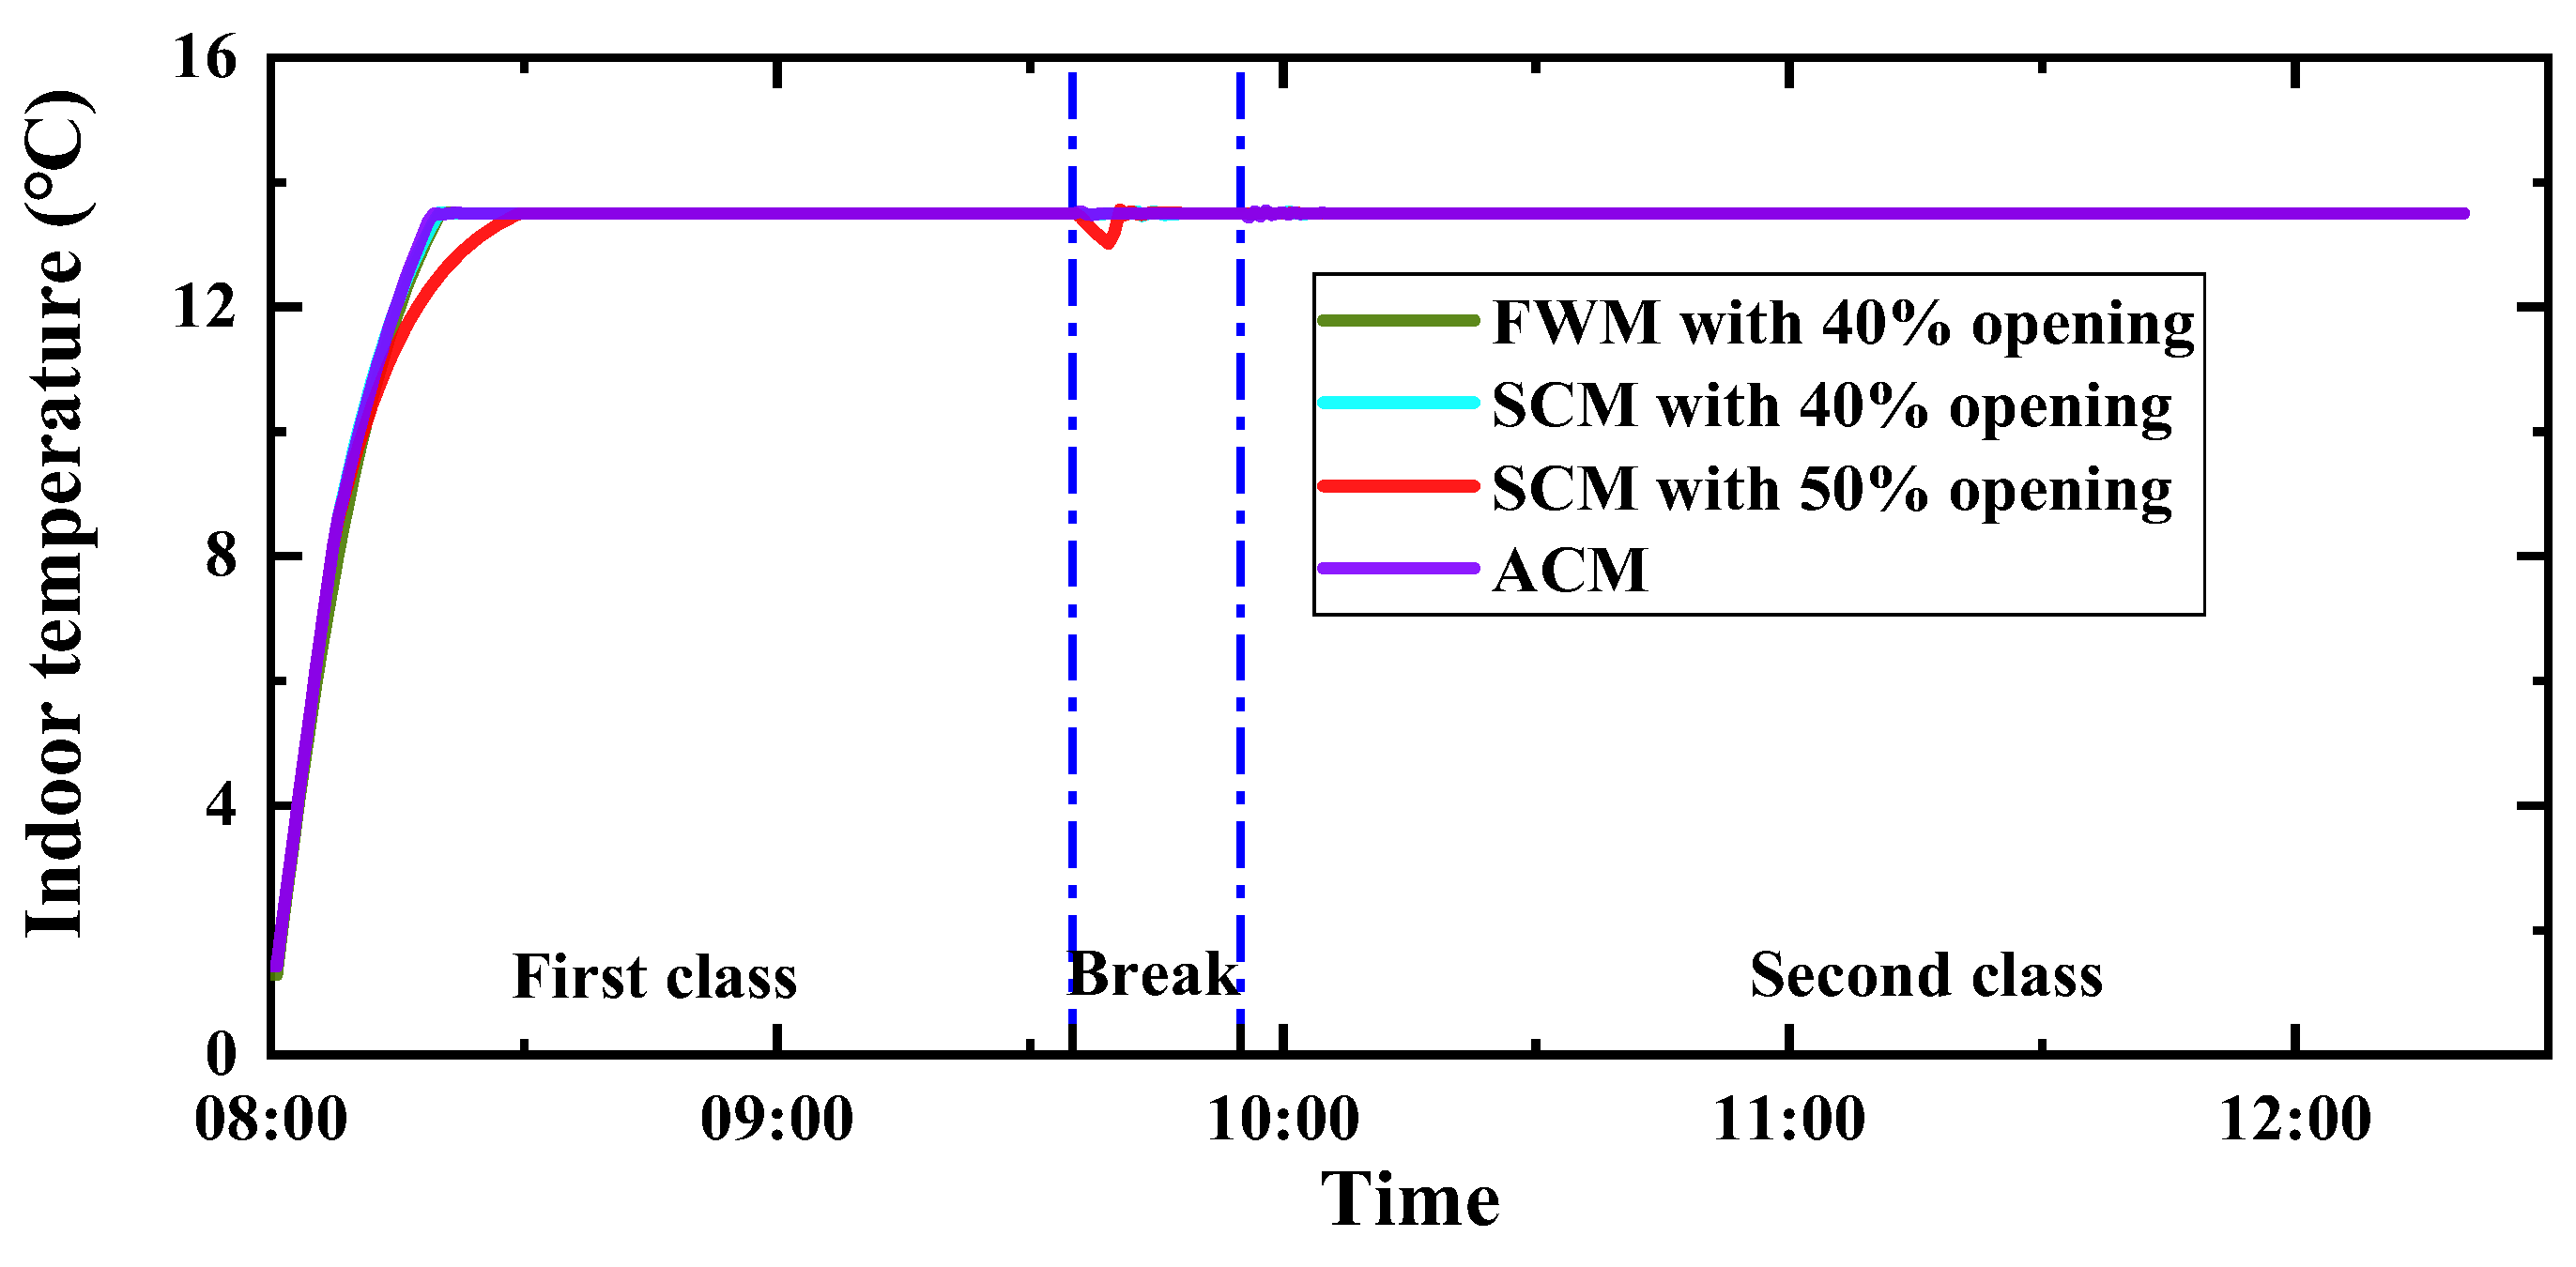
3.2.2. Indoor Temperature
Meanwhile, as shown in Figure 21, it took 1200, 1140, 1760, and 1120 s to reach the set indoor temperature value by the above different ventilation methods, respectively. Except the fact that the SCM with 50% opening produced a small vibration in the first five minutes of the break time, the four ventilation methods could always control the indoor temperature at the set value of 13.5 ± 0.1 °C. It could be observed that the four different ventilation methods could control the indoor temperature at the set value well.
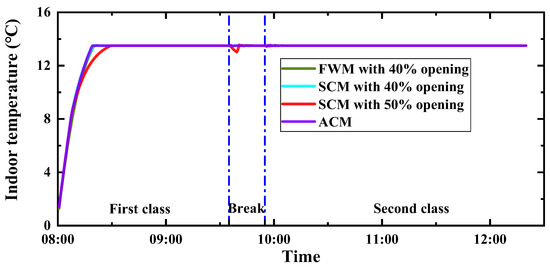
Figure 21.
Variation in indoor temperature under different ventilation methods.
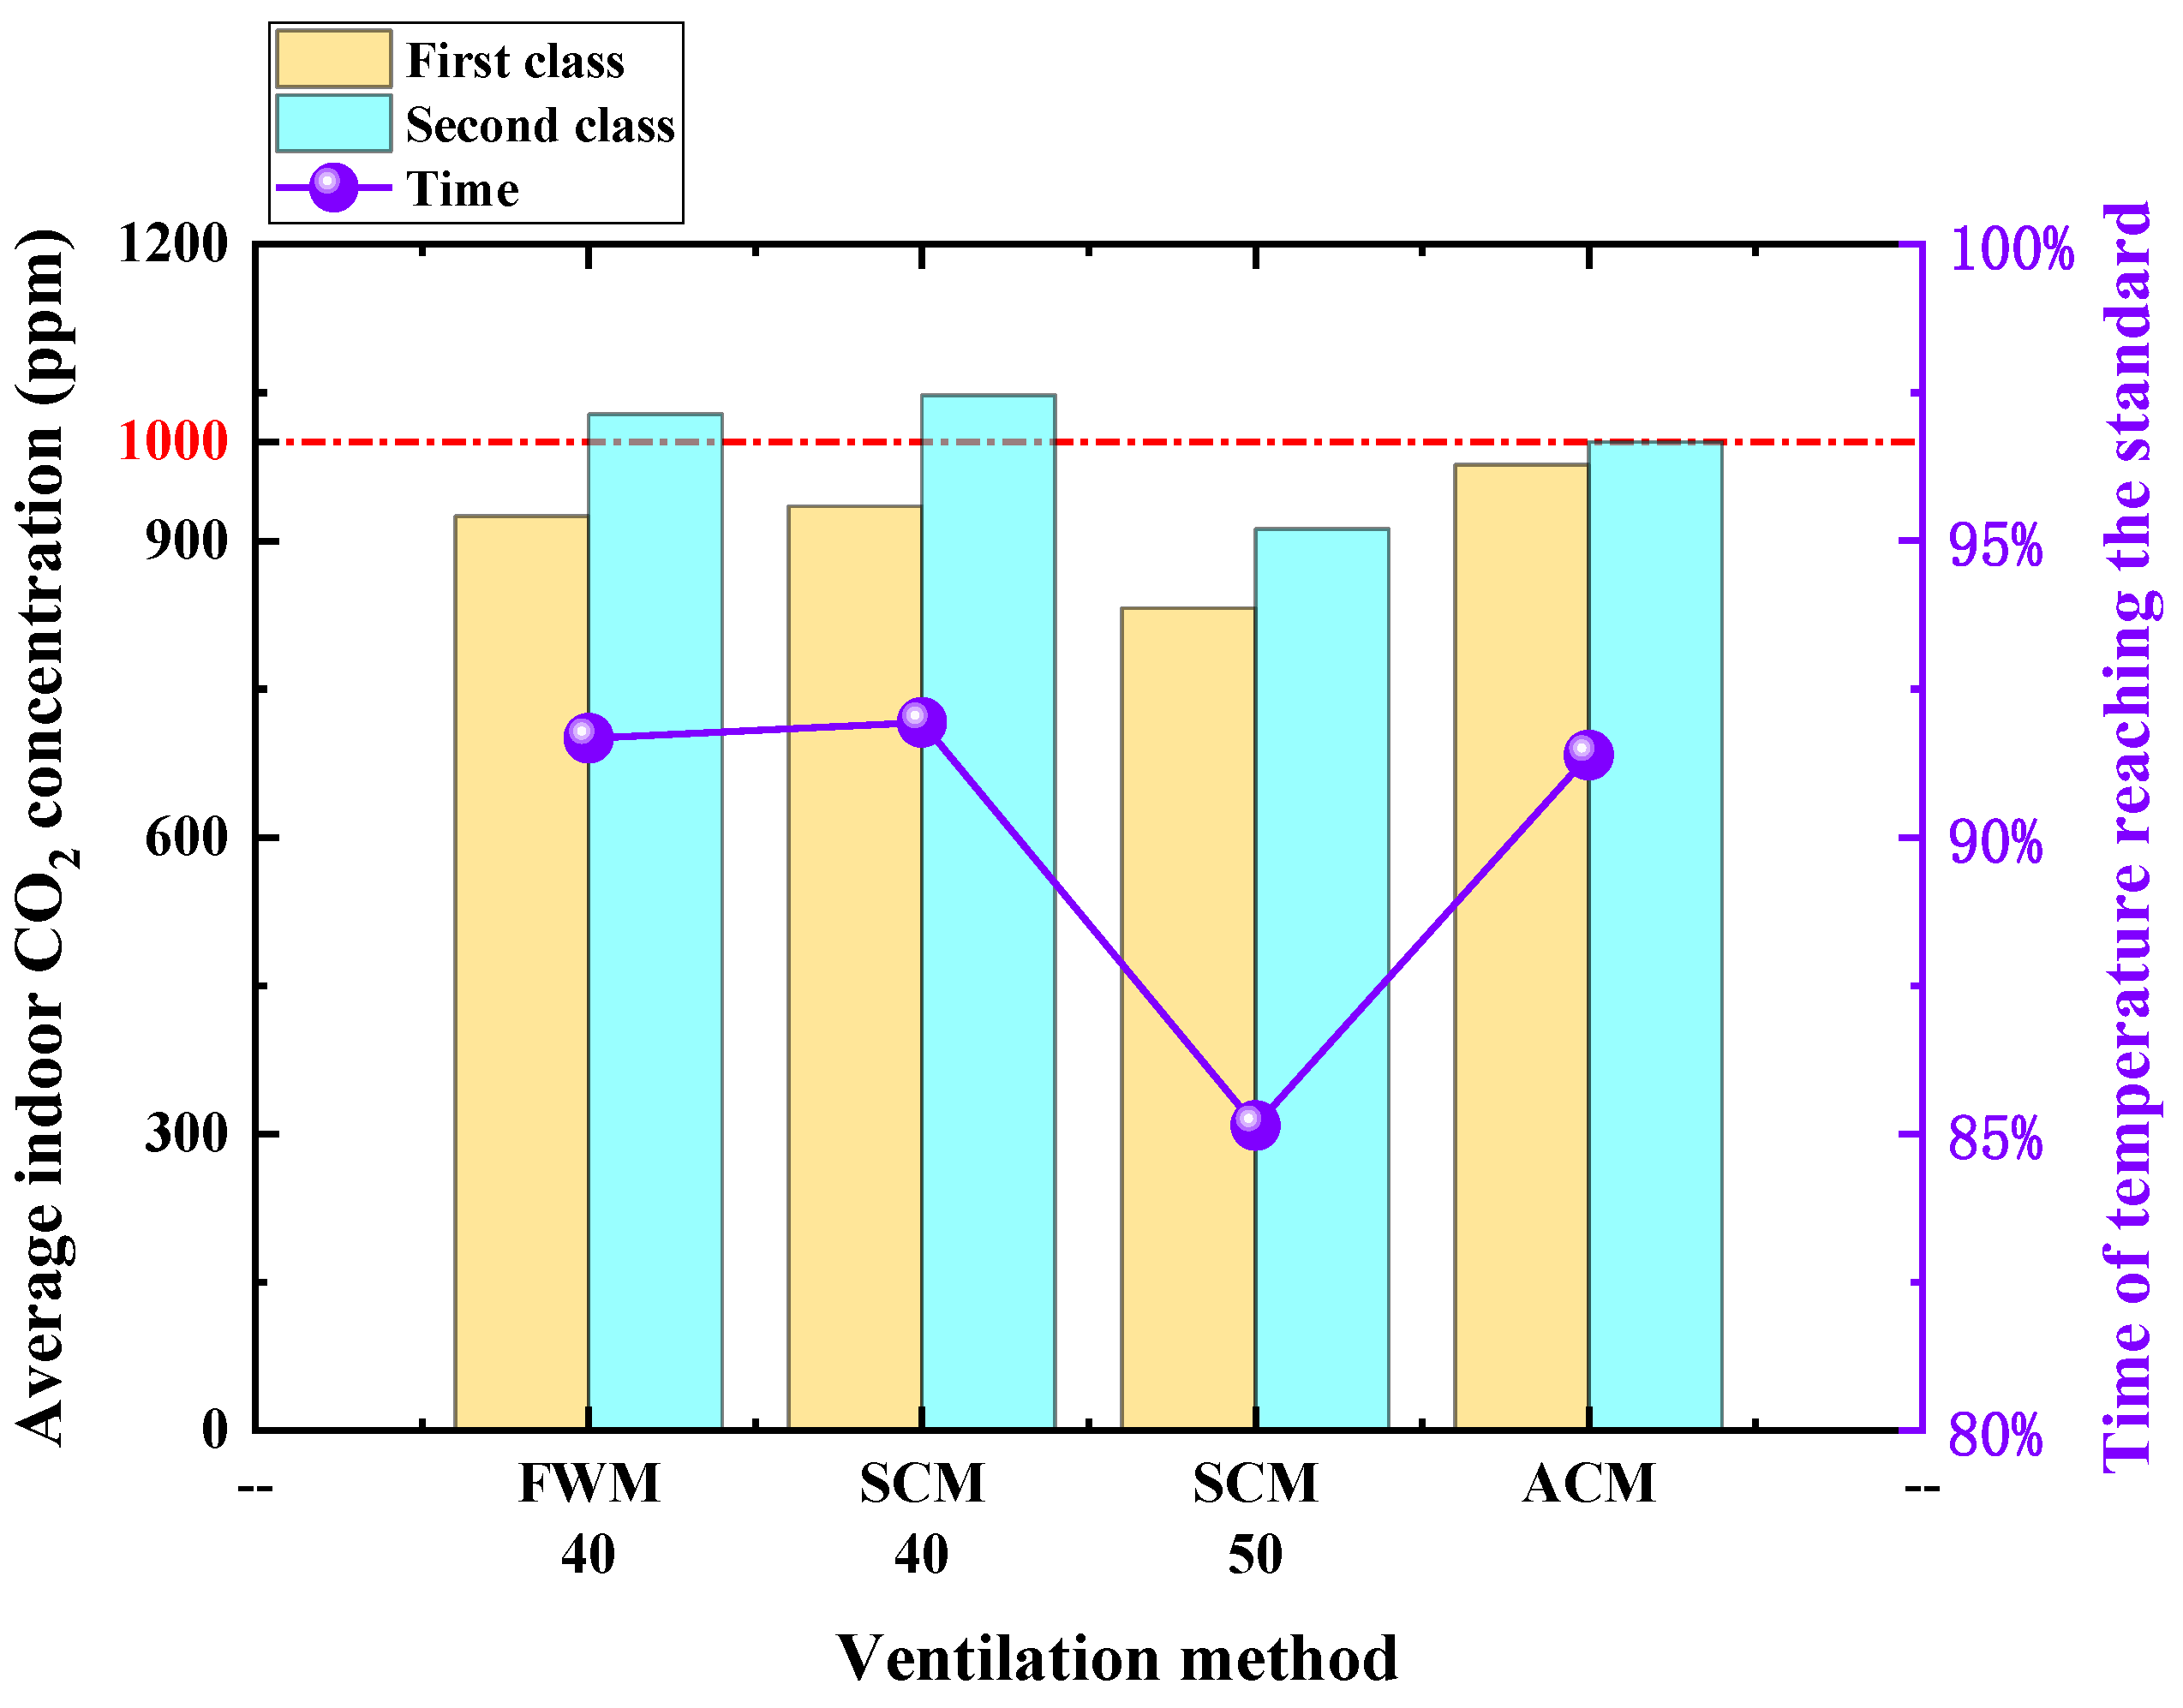
3.2.3. Comparison of Indoor Average CO2 Concentration and Temperature
The average ICC of the first class and the second class of the above four ventilation methods and the proportion of time when the temperature reached the standard in the whole calculation time are shown in Figure 22. It can be seen from Figure 23 that the average CO2 concentration in the second class was higher than the limit value of the classroom air quality standard when the classroom was ventilated with the FMW with 40% opening and the SCM with 40% opening. When the SCM with 50% opening was adopted, the thermal comfort of indoor air was worse than the other three methods. Therefore, when the design temperature was 13.5 °C, the ACM was recommended.
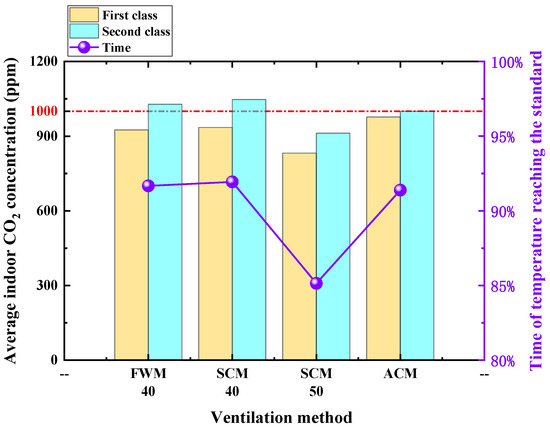
Figure 22.
Variation in ICC and temperature compliance under four ventilation methods.
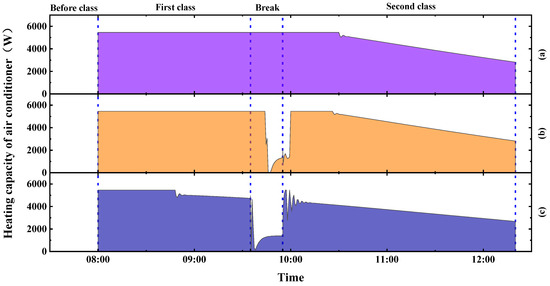
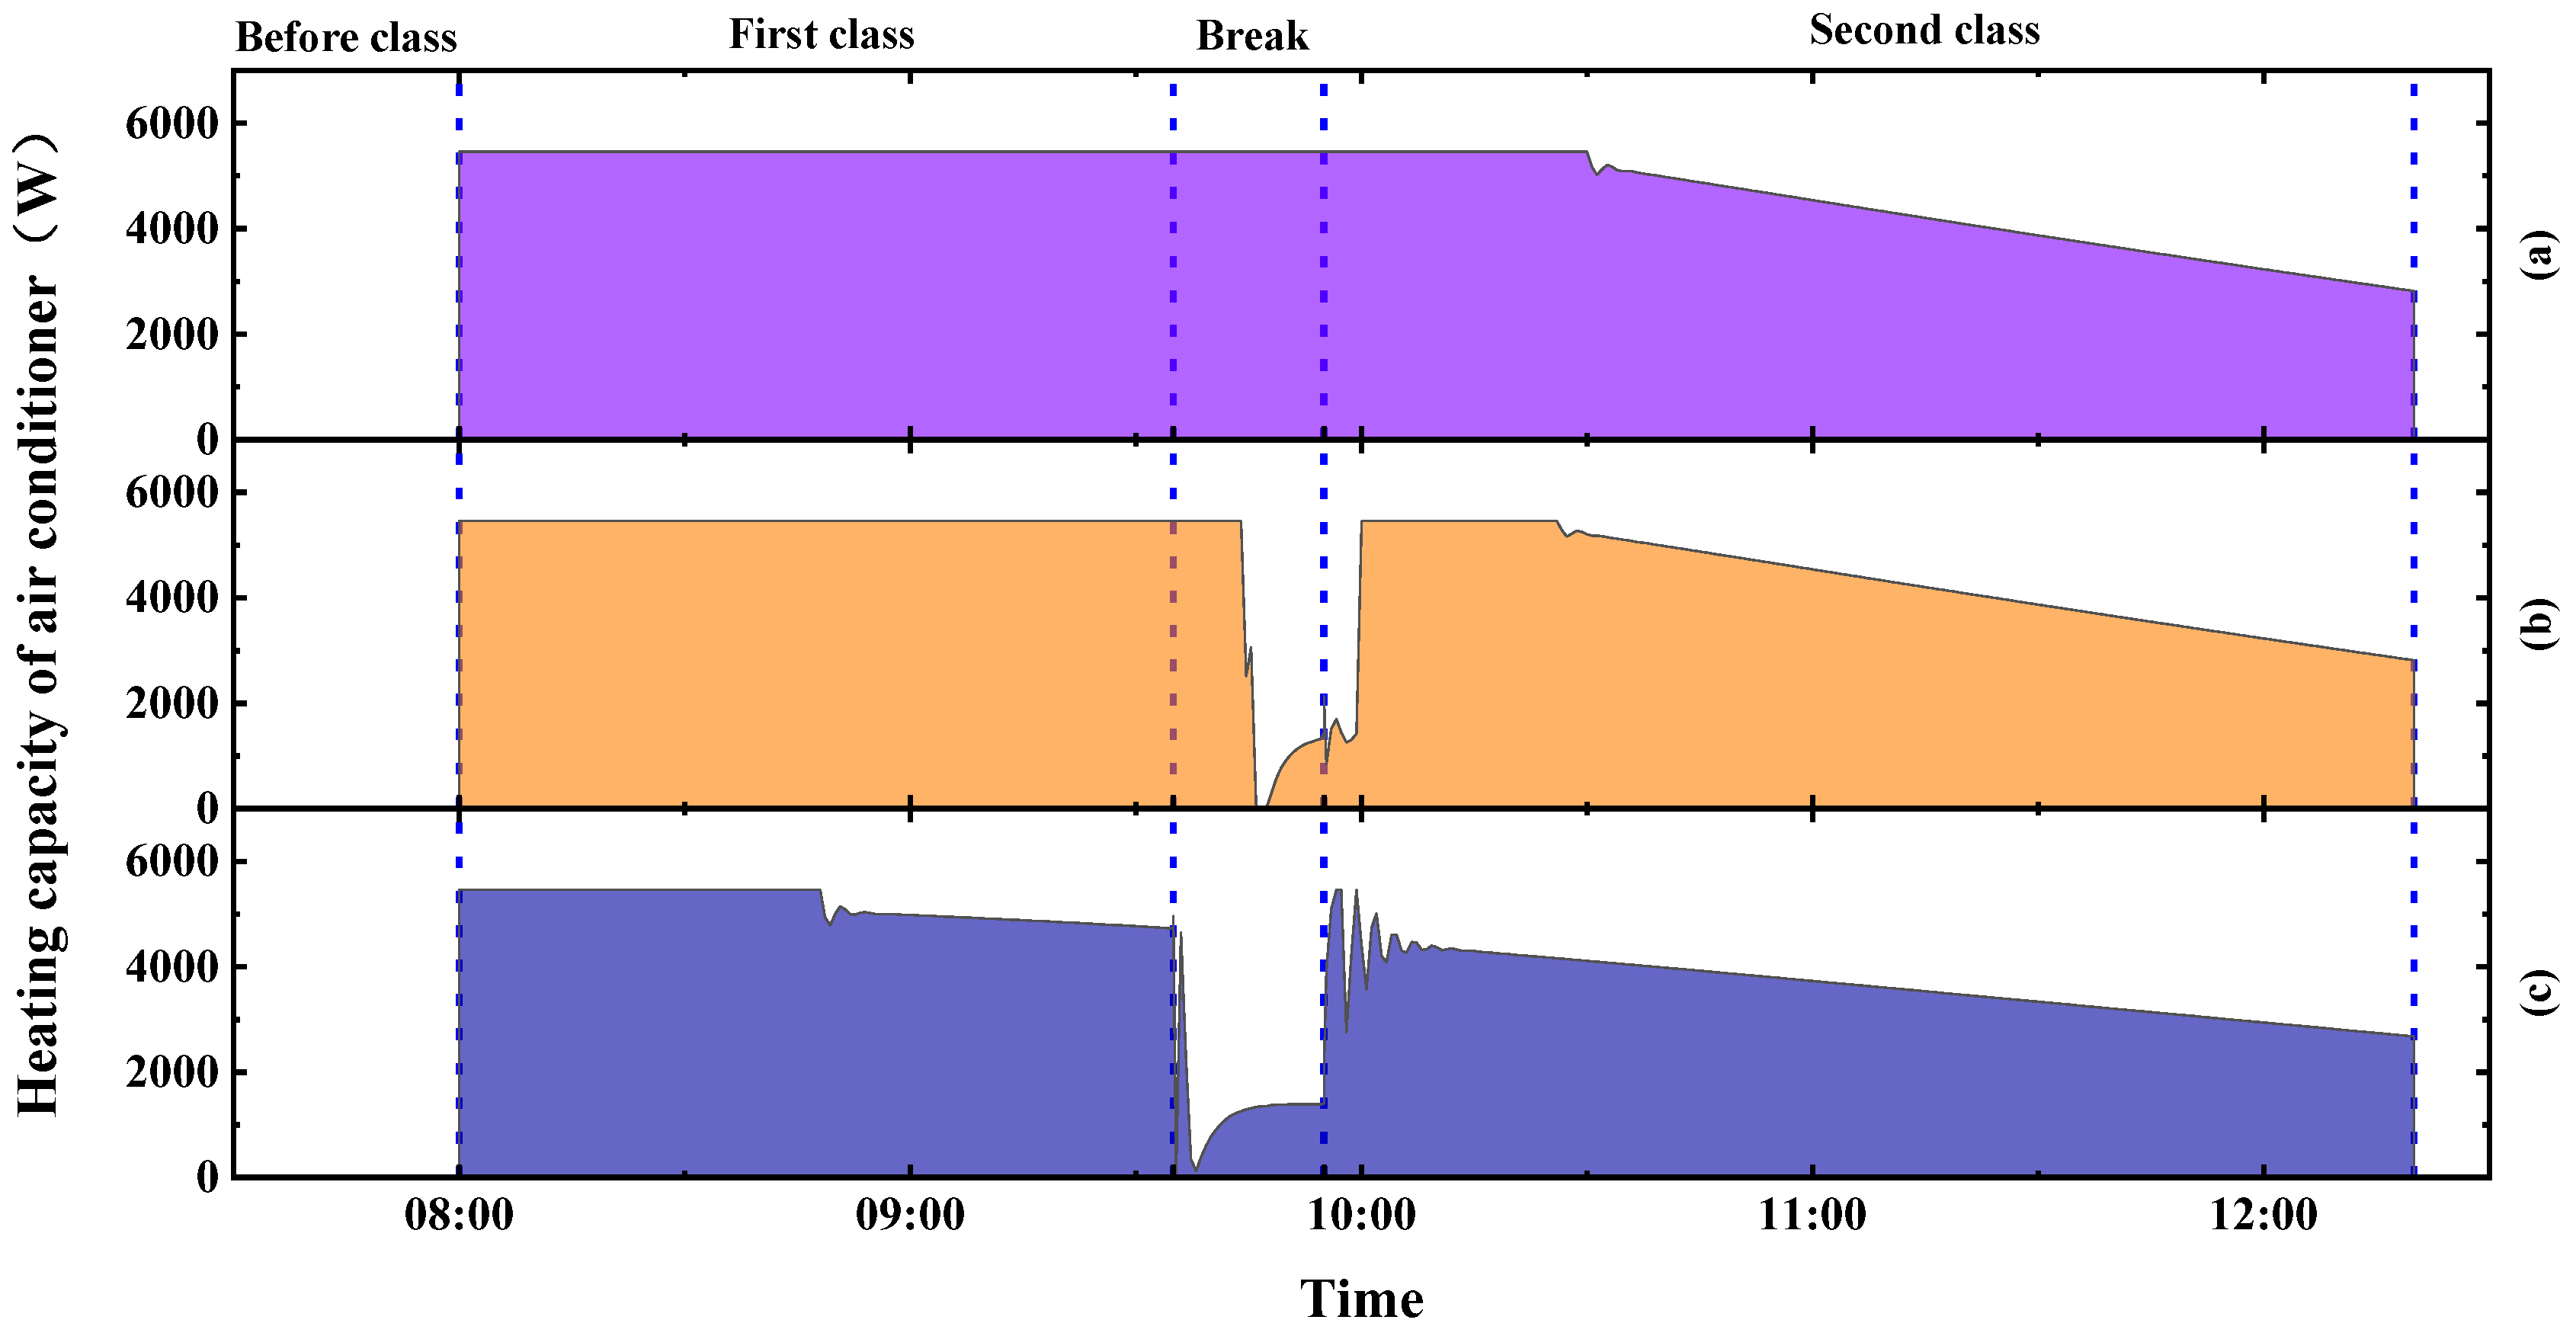
Figure 23.
Variation in heating capacity of air conditioner under (a) FWM with 40%, (b) SCM with 40%, and (c) ACM.
3.3. Analysis of Fresh Air Energy Consumption
In this subsection, the changes in the heating capacity of classroom air conditioning and the total energy consumption of fresh air under different design temperatures and three different ventilation methods were compared and analyzed.
3.3.1. Heating Capacity of Air Conditioning under the Temperature 18 °C
It could be concluded from Section 3.1.1 that, when the design temperature was 18 °C and the FWM was adopted, the window-opening ratio value of 40% could be selected to ensure a satisfactory CO2 concentration. The heating capacity of air conditioning under the design temperature 18 °C for the three ventilation methods, which were the FWM with 40% opening, the SCM with 40% opening, and the ACM, was compared in this subsection. According to Figure 23, when the window-opening ratio was fixed at 40%, from 8:00 to 10:30, the air conditioner maintained the maximum heating capacity, which was 5460 W/s, and then gradually decreased. In the whole morning, the average heating capacity of the air conditioner was 4838.83 W/s. When the SCM with 40% opening was adopted, the air conditioner maintained the maximum heating capacity and started to drop at 9:44. At 10:00, the heating capacity of the air conditioner recovered to the highest value again, and gradually decreased at 10:26. In the whole morning, the average heating capacity of the air conditioner was 4555.41 W/s. When the ACM was adopted, the air conditioner maintained the maximum heating capacity at 8:48 and started to decrease. Then, after a brief shock, the heating capacity of the air conditioner began to decrease continuously. Due to the absence of a CO2 source in the room during the break at 9:35, the window was completely closed, and the spatiotemporal modulated heat suddenly dropped to 0. The heating capacity of the air conditioner recovered to the maximum heating capacity of 5460 W/s again after a short shock at 9:55. After 80 s, it gradually decreased after a short shock. In the whole morning, the average heating capacity of the air conditioner was 4001.50 W/s.
3.3.2. Heating Capacity of Air Conditioning under the Temperature of 13.5 °C
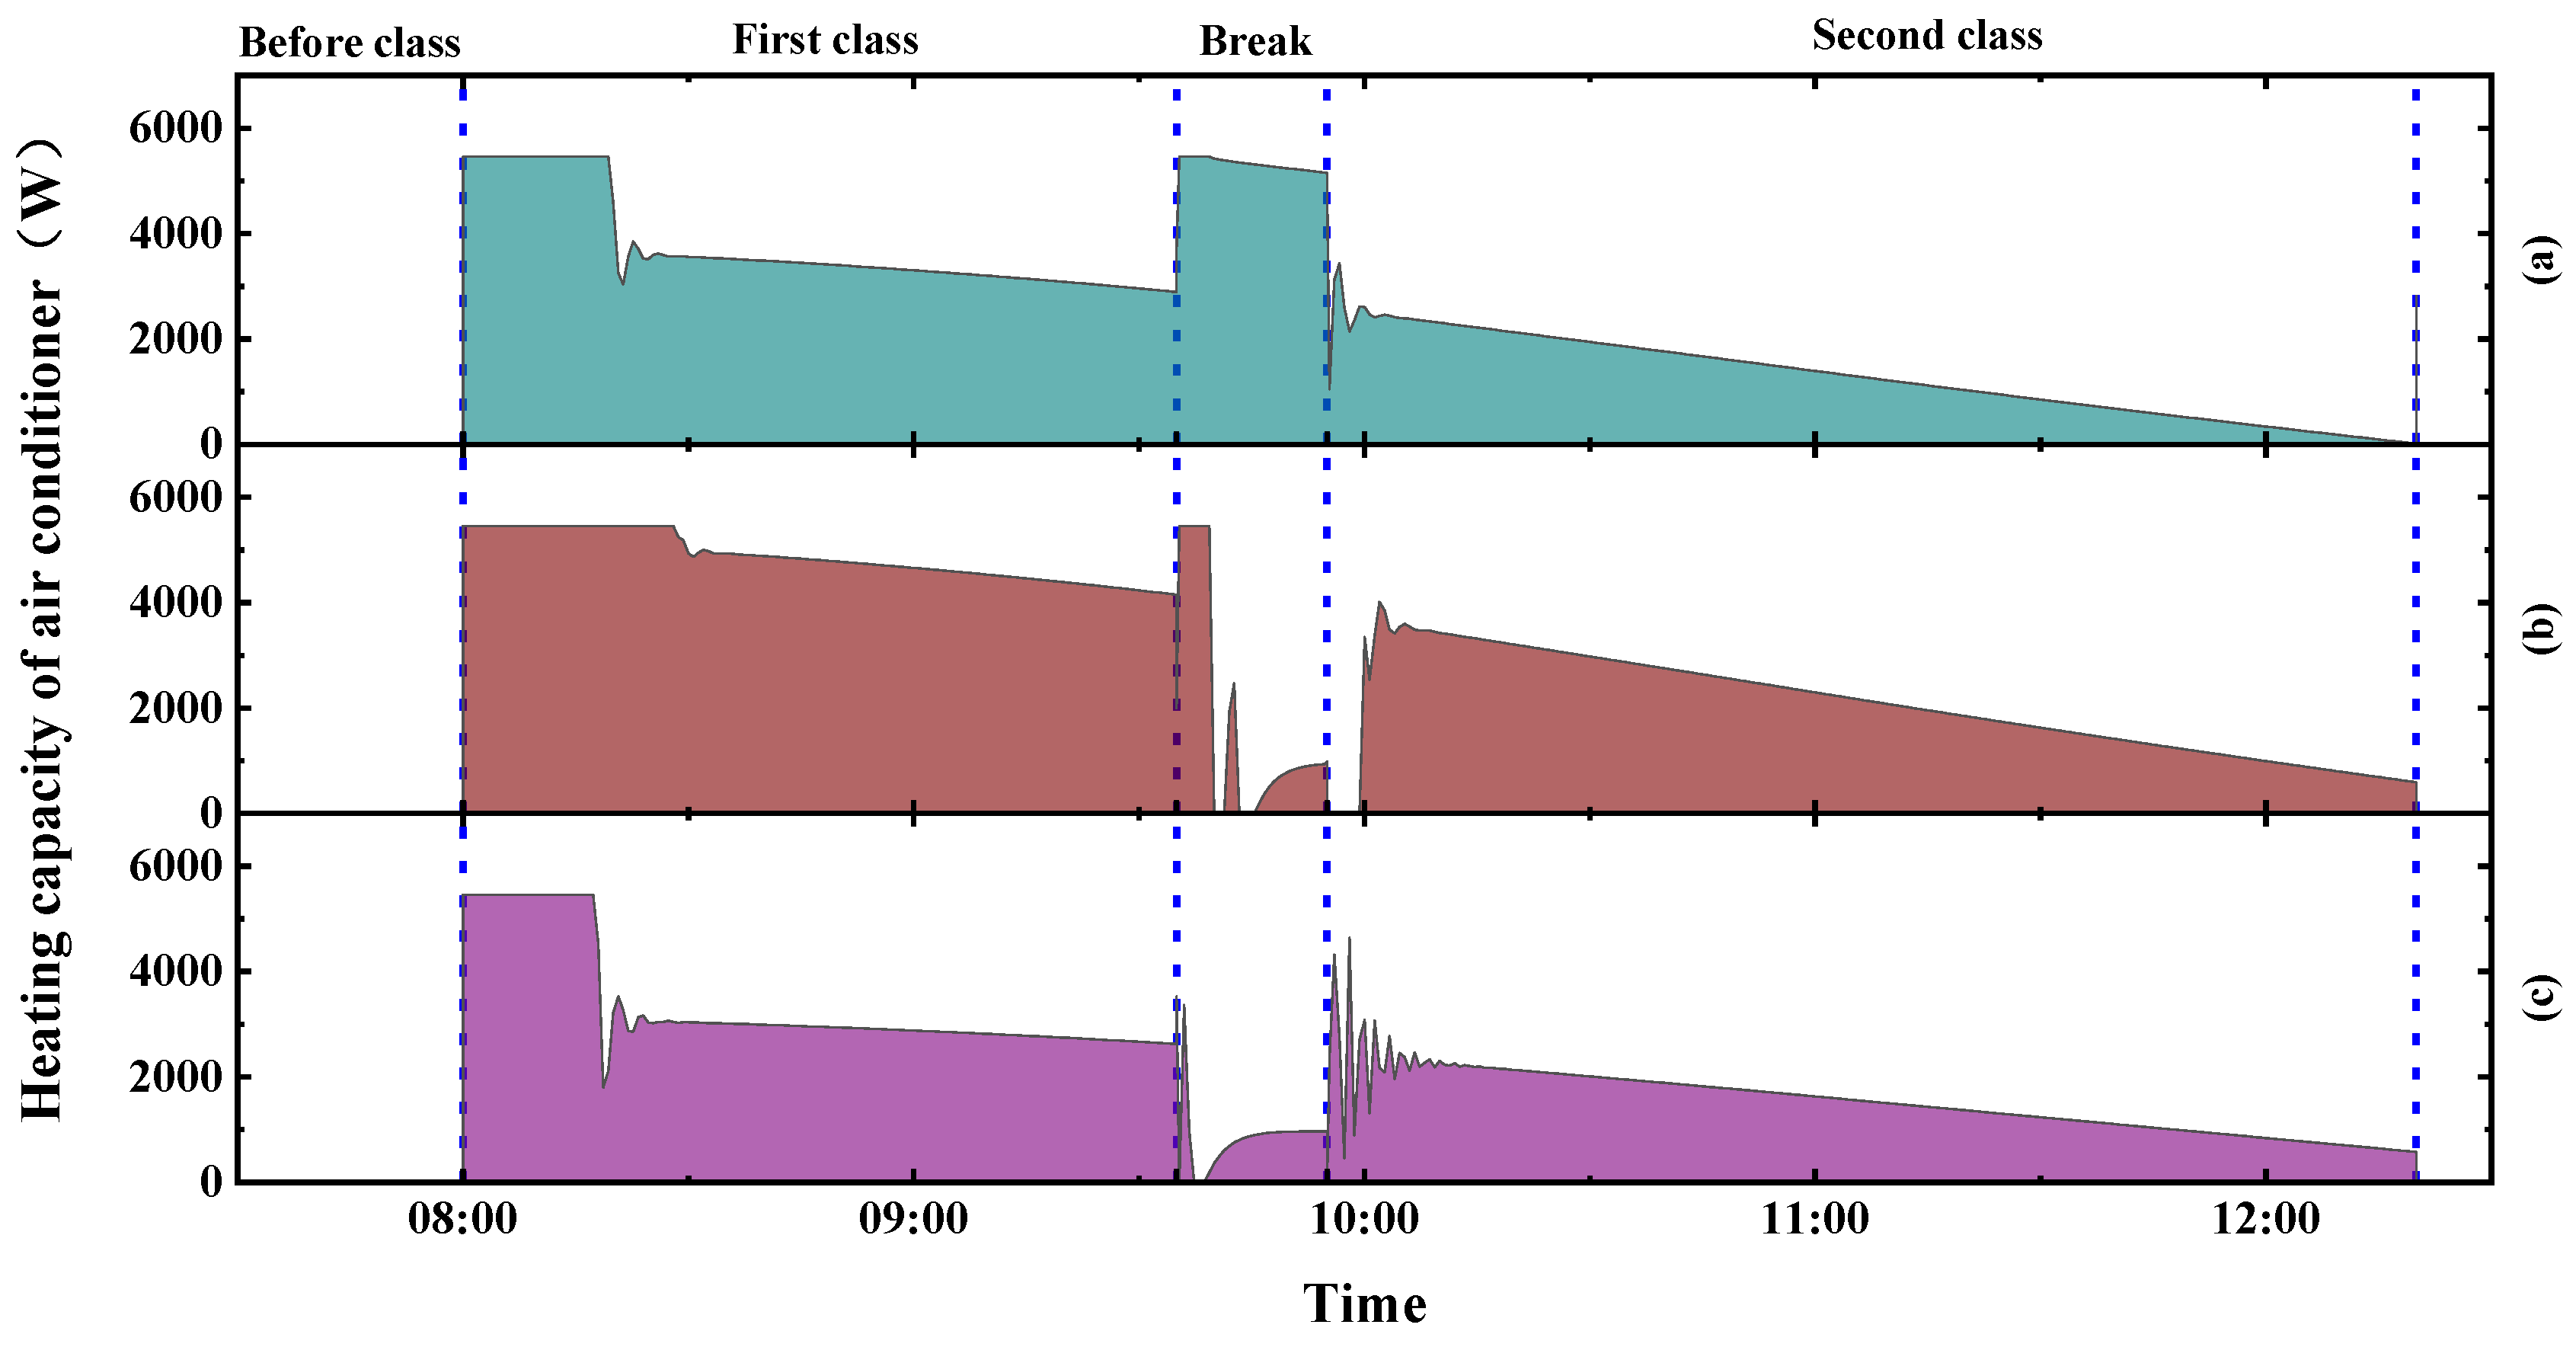
According to the analysis in Section 3.2, the ventilation methods that could be used to effectively control the ICC were the SCM with 50% opening and the ACM. The heating capacity of air conditioning under design temperature 13.5 °C for the three ventilation methods, which were the FWM with 40% opening, the SCM with 50% opening, and the ACM, was compared in this subsection. It can be seen from Figure 24 that, when the window-opening ratio was fixed at 40%, the maximum heating capacity of the air conditioner was 5460 W/s, from 8:00 to 8:19, and then gradually decreased. There were no students in the room during the break at 9:35, which caused the heat loss of the human body to become zero, resulting in a sharp rise in the building heat load. Moreover, the window-opening ratio did not change, so the heating capacity of the air conditioner suddenly increased to the highest, and then gradually decreased. At 9:55, the class started again, the building heat load decreased, and the heating capacity of the air conditioner suddenly decreased. After a period of shock, it continued to decline. In the whole morning, the average heating capacity of the air conditioner was 2499.65 W/s. When the SCM with 50% opening was adopted, the air conditioner maintained the maximum heating capacity and started to drop at 8:28. Owing to the break time, at 9:35, the heating capacity of the air conditioner recovered to the highest value, and dropped rapidly at 9:39. After 0.67 min, the heating capacity of the air conditioner dropped to 0, then reached the peak for 1.33 min. After that, it dropped to 0 again. At 9:46, the heating capacity of the air conditioner rose slowly until 9:55, then suddenly dropped to 0 again and lasted for 4.50 min. The heating capacity of the air conditioner rose rapidly at 10:00 and then decreased slowly. The reason why the heat load of the air conditioner would temporarily be 0 after the second class was the time lag of the SCM. After the second class began, the window had not been opened under the control of the switch, while the students’ heat dissipation could meet the heat load requirements of the classroom. In the whole morning, the average heating capacity of the air conditioner was 3023.37 W/s. When the ACM was adopted, the trend of air conditioning heat load was basically consistent with the ACM in Section 3.3.1. At the beginning, the air conditioner maintained the maximum heating capacity until 8:17. After a short shock, the heating capacity of the air conditioner started to decrease continuously. The heating capacity of the air conditioner suddenly dropped to 0 at 9:55. After 3.33 min, the heating capacity of the air conditioner kept rising. At 9:55, the heating capacity of the air conditioner decreased gradually after another 20 min shock. In the whole morning, the average heating capacity of the air conditioner was 2137.87 W/s.
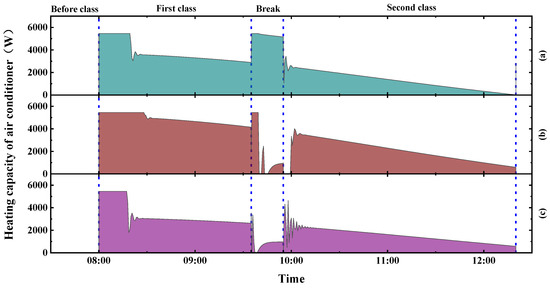
Figure 24.
Variation in heating capacity of air conditioner under (a) FWM with 40%, (b) SCM with 50%, and (c) ACM.
3.3.3. Comparison of Energy Consumption under the Design Temperatures
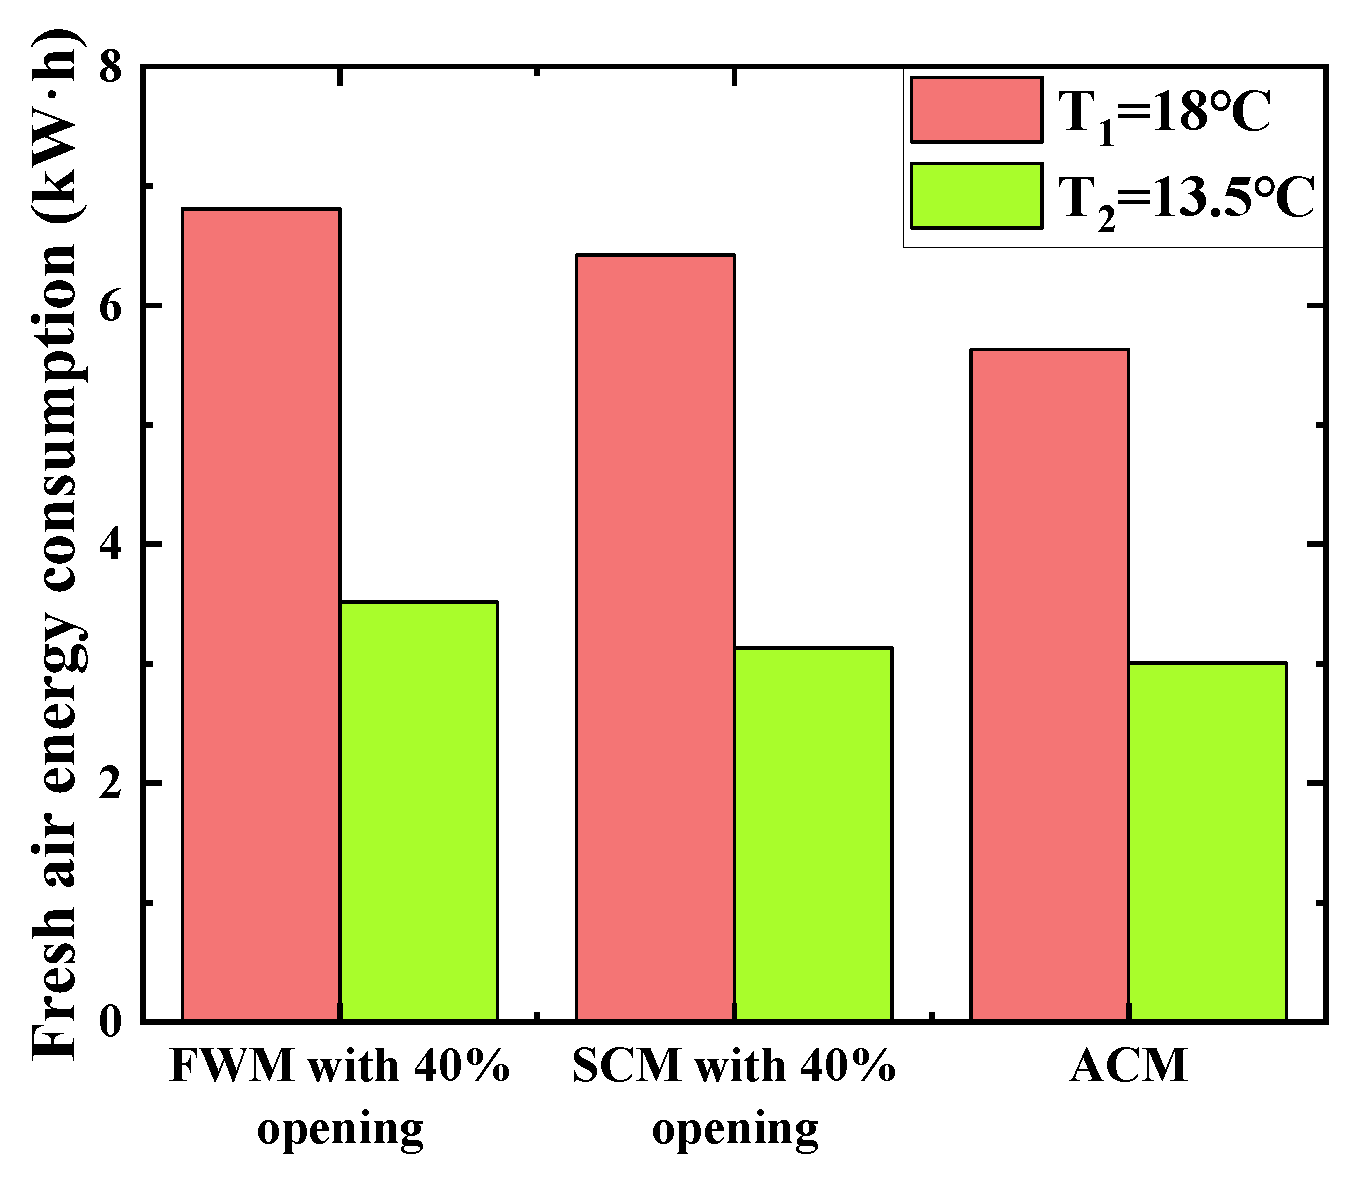
The fresh air energy consumption of the three ventilation methods (the FWM with 40% opening, the SCM with 40% opening, and the ACM under the design temperatures of 18 °C and 13.5 °C) throughout the morning is shown in Figure 25. When the set temperature was 18 °C, the total fresh air energy consumption of the FWM, SCM, and ACM was 6.81, 6.42, and 5.63, respectively. Under the FWM and SCM, the energy consumption of fresh air was 20.96% and 14.03% higher than that of the ACM, respectively. At a temperature of 13.5 °C, the total fresh air energy consumption of the FWM, SCM, and ACM was 3.52, 3.13, and 3.01 , respectively. Under the FWM and SCM, the energy consumption of fresh air was 16.94% and 3.99% more than that of the ACM, respectively. At the same time, when the design temperature was reduced from 18 °C to 13.5 °C, the total fresh air energy consumption was reduced by 48.38%, 51.26%, and 46.58%, respectively, by using the FWM, SCM, and ACM. Therefore, the natural ventilation system that automatically controlled the window-opening ratio to provide fresh air for the classroom was recommended to reduce the indoor design temperature of the classroom.

Figure 25.
Total fresh air energy consumption of different ventilation methods.
4. Conclusions
The simulation in this paper was conducted by Modelica to investigate the relationship between indoor air quality, thermal comfort, and fresh air energy consumption in Wuhan colleges in winter mornings through different ventilation methods under the highest learning efficiency, and provided suggestions for the selection of fresh air systems in college classrooms. The main research results and conclusions were as follows:
- (1)
- When the FWM was adopted with the design temperature of 18 °C, the ICC was too high when the window-opening ratio was 0 or 20%. When the window-opening ratio was 40%, the indoor temperature could only be controlled at 18 °C for a third of the whole class duration. Furthermore, the indoor temperature could not be controlled at 18 °C if the window-opening ratio was 60% or 80%. When the SCM was adopted, there was no good thermal comfort in the classroom. When the ACM was adopted, the classroom room could have good thermal comfort, while the ICC would be controlled within 1000 ppm. The results recommended that, when the design temperature was 18 °C, the ACM ventilation method should be adopted.
- (2)
- When the FWM with 40% opening and the SCM with 40% opening were adopted with the design temperature of 13.5 °C, the ICC was too high. When the ACM was adopted, the classroom room could have good thermal comfort, while the ICC was controlled within 1000 ppm. Therefore, the ACM ventilation method was better than the FWM and the SCM.
- (3)
- When the design temperature was 18 °C, the fresh air energy consumption of the ACM was 12.31% and 17.33% less than that of the SCM with 40% opening and the FWM with 40% opening. When the design temperature was 13.5 °C, the energy consumption of fresh air by the ACM, SCM with 40% opening, and FWM with 40% opening was 46.58%, 48.38%, and 51.26% lower than those at 18 °C.
Overall, the impact of different air supply methods on indoor air quality was evaluated in this paper and winter morning fresh air energy consumption in a Wuhan college classroom under different design temperatures was considered. Considered learning efficiency, 13.5 °C was proposed to be the recommended value as the indoor temperature of classrooms, and the ACM to provide fresh air for the classroom was proposed. The results of this paper can provide guidance for indoor air conditioning.
Author Contributions
Methodology, X.L.; Investigation, J.X.; Resources, Q.Z.; Writing—original draft, Q.W. All authors have read and agreed to the published version of the manuscript.
Funding
This research received no external funding.
Data Availability Statement
Data are contained within the article.
Conflicts of Interest
The authors declare no conflict of interest.
Nomenclature
| A | The opening area in validation () |
| The basal metabolic rate () | |
| The maximum fresh air load of the actual air conditioner () | |
| The opening flow coefficient in validation | |
| The maximum heating capacity of the air conditioner for fresh air () | |
| The rated heating capacity () | |
| h | The height in validation () |
| M | The variable () |
| The body mass () | |
| n | The flow exponent in validation |
| The number of interfaces in validation () | |
| The atmospheric pressure () | |
| QB | The calculation of building heat load excluding fresh air heat load () |
| QBE | The heat transfer of enclosure () |
| QEE | The heat dissipation of electrical equipment () |
| QH | The heat dissipation of classroom human body () |
| The respiratory quotient | |
| The air temperature () | |
| The O2 consumption rate () | |
| The CO2 generation rate () | |
| The Minimum velocity in validation () | |
| w | The width in validation () |
| Greek symbols | |
| The correction factor | |
| The parameters in formula | |
| The parameters in BMR formula | |
| The parameters in BMR formula | |
| Subscripts | |
| B | |
| BE | |
| EE | |
| FM | |
| H | |
| R | |
References
- Cattaneo, A.; Peruzzo, C.; Garramone, G.; Urso, P.; Ruggeri, R.; Carrer, P. Airborne particulate matter and gaseous air pollutants in residential structures in Lodi province, Italy. Indoor Air 2011, 21, 489–500. [Google Scholar] [CrossRef] [PubMed]
- OECD. How Long Do Students Spend in the Classroom; OECD Publishing: Paris, France, 2012. [Google Scholar]
- Trompetter, W.J.; Boulic, M.; Ancelet, T.; Garcia-Ramirez, J.C.; Davy, P.K.; Wang, Y.; Phipps, R. The effect of ventilation on air particulate matter in school classrooms. J. Build. Eng. 2018, 18, 164–171. [Google Scholar] [CrossRef]
- Ali, H.H.; Almomani, H.M.; Hindeih, M. Evaluating indoor environmental quality of public school buildings in Jordan. Indoor Built Environ. 2009, 18, 66–76. [Google Scholar] [CrossRef]
- Asif, A.; Zeeshan, M.; Jahanzaib, M. Indoor temperature, relative humidity and CO2 levels assessment in academic buildings with different heating, ventilation and air-conditioning systems. Build. Environ. 2018, 133, 83–90. [Google Scholar] [CrossRef]
- Jurado, S.; Bankoff, A.; Sanchez, A. Indoor air quality in Brazilian universities. Int. J. Environ. Res. Public Health 2014, 11, 7081–7093. [Google Scholar] [CrossRef]
- Bala, G. Digesting 400 ppm for global mean CO2 concentration. Curr. Sci. 2013, 104, 1471–1472. [Google Scholar]
- Khaled, A.; Dennis, L.; Nawaf, A. Impact of ventilation modes on carbon dioxide concentration levels in Kuwait classrooms. Energy Build. 2012, 47, 540–549. [Google Scholar] [CrossRef]
- Jacobson, T.A.; Kler, J.S.; Hernke, M.T.; Braun, R.K.; Meyer, K.C.; Funk, W.E. Direct human health risks of increased atmospheric carbon dioxide. Nat. Sustain. 2019, 2, 691–701. [Google Scholar] [CrossRef]
- Zhang, J.; Pang, L.; Cao, X.; Wanyan, X.; Wang, X.; Liang, J.; Zhang, L. The effects of elevated carbon dioxide concentration and mental workload on task performance in an enclosed environmental chamber. Build. Environ. 2020, 178, 106938. [Google Scholar] [CrossRef]
- Gilio, A.D.; Palmisani, J.; Pulimeno, M.; Cerino, F.; Cacace, M.; Miani, A.; Gennaro, G. CO2 concentration monitoring inside educational buildings as a strategic tool to reduce the risk of Sars-CoV-2 airborne transmission. Environ. Res. 2021, 202, 111560. [Google Scholar] [CrossRef]
- Satish, U.; Mendell, M.J.; Shekhar, K.; Hotchi, T.; Sullivan, D.; Streufert, S.; Fisk, W.J. Is CO2 an indoor pollutant Direct effects of low-to-moderate CO2 concentrations on human decision-making performance. Environ. Health Perspect. 2012, 120, 1671–1677. [Google Scholar] [CrossRef] [PubMed]
- Shendell, D.G.; Prill, R.; Fisk, W.J.; Apte, M.G.; Blake, D.; Faulkner, D. Association between CO2 concentrations and student attendance in Washington Idaho. Indoor Air 2004, 14, 333–341. [Google Scholar] [CrossRef] [PubMed]
- Snow, S.; Boyson, A.S.; Paas, K.H.W.; Gough, H.; King, M.; Barlow, J.; Noakes, C.J.; Schraefel, M.C. Exploring the physiological, neurophysiological and cognitive performance effects of elevated carbon dioxide concentrations indoors. Build. Environ. 2019, 156, 243–252. [Google Scholar] [CrossRef]
- de Dear, R.J.; Brager, G.S. Developing an adaptive model of thermal comfort and preference. Build. Eng. 1998, 104, 145–167. [Google Scholar]
- Humphreys, M.A.; Nicol, J.F. The validity of ISO-PMV for predicting comfort votes in every-day thermal environments. Energy Build. 2002, 34, 667–684. [Google Scholar] [CrossRef]
- Mors, S.T.; Hensen, J.L.M.; Loomans, M.G.L.C.; Boerstra, A.C. Adaptive thermal comfort in primary school classrooms: Creating and validating PMV-based comfort charts. Build. Environ. 2011, 46, 2454–2461. [Google Scholar] [CrossRef]
- Jiang, J.; Wang, D.; Liu, Y.; Di, Y.; Liu, J. A holistic approach to the evaluation of the indoor temperature based on thermal comfort and learning performance. Build. Environ. 2021, 196, 107803. [Google Scholar] [CrossRef]
- Wargocki, P.; Wyon, D.P. The Effects of Moderately Raised Classroom Temperatures and Classroom Ventilation Rate on the Performance of Schoolwork by Children (RP-1257). HVAC&R Res. 2007, 13, 193–220. [Google Scholar] [CrossRef]
- Ministry of Housing Urban-Rural Construction of the People’s Republic of China. Design Code for Heating Ventilation and Air Conditioning of Civil Buildings; China Architecture & Building Press: Beijing, China, 2012. [Google Scholar]
- ANSI/ASHRAE Standard 62.1-2013; Ventilation for Acceptable Indoor Air Quality. ASHRAE Standards Committee: Atlanta, GA, USA, 2013.
- Elsaid, A.M.; Mohamed, H.A.; Abdelaziz, G.B.; Ahmed, M.S. A critical review of heating, ventilation, and air conditioning (HVAC) systems within the context of a global SARS-CoV-2 epidemic. Process Saf. Environ. Prot. 2021, 155, 230–261. [Google Scholar] [CrossRef]
- Poirier, B.; Guyot, G.; Woloszyn, M.; Geoffroy, H.; Ondarts, M.; Gonze, E. Development of an assessment methodology for IAQ ventilation performance in residential buildings: An investigation of relevant performance indicators. J. Build. Eng. 2021, 43, 103140. [Google Scholar] [CrossRef]
- Xu, F.; Gao, Z. Study on indoor air quality and fresh air energy consumption under different ventilation modes in 24-hour occupied bedrooms in Nanjing, using Modelica-based simulation. Energy Build. 2022, 257, 111805. [Google Scholar] [CrossRef]
- Chenari, B.; Carrilho, J.D.; da Silva, M.G. Towards sustainable, energy-efficient and healthy ventilation strategies in buildings: A review. Renew. Sustain. Energy Rev. 2016, 59, 1426–1447. [Google Scholar] [CrossRef]
- Gao, J.; Wargocki, P.; Wang, Y. Ventilation system type, classroom environmental quality and pupils’ perceptions and symptoms. Build. Environ. 2014, 75, 46–57. [Google Scholar] [CrossRef]
- Zhou, Q.; Ooka, R. Implementation of a coupled simulation framework with neural network and Modelica for fast building energy simulation considering non-uniform indoor environment. Build. Environ. 2022, 211, 108740. [Google Scholar] [CrossRef]
- Wetter, M. Multizone Airflow Model in Modelica. In Proceedings of the Modelica Conference 2006, Vienna, Austria, 4–5 September 2006; The Modelica Association: Vienna, Austria, 2006; pp. 431–440. [Google Scholar]
- Zuo, W.D.; Wetter, M.; Tian, W.; Li, D.; Jin, M.G.; Chen, Q.Y. Coupling indoor airflow, HVAC, control and building envelope heat transfer in the Modelica Buildings library. J. Build. Perform. Simul. 2016, 9, 366–381. [Google Scholar] [CrossRef]
- Dols, W.S.; Emmerich, S.J.; Polidoro, B.J. Coupling the multizone airflow and contaminant transport software CONTAM with EnergyPlus using co-simulation. Build. Simul. 2016, 9, 469–479. [Google Scholar] [CrossRef]
- Fabian, P.; Adamkiewicz, G.; Levy, J.I. Simulating indoor concentrations of NO2 and PM2.5 in multifamily housing for use in health-based intervention modeling. Indoor Air 2012, 22, 12–23. [Google Scholar] [CrossRef]
- Barbosa, B.P.P.; Brum, N.D.C.L. Validation and assessment of the CFD-0 module of CONTAM software for airborne contaminant transport simulation in laboratory and hospital applications. Build. Environ. 2018, 142, 139–152. [Google Scholar] [CrossRef]
- Alonso, M.J.; Dols, W.S.; Mathisen, H.M. Using Co-simulation between EnergyPlus and CONTAM to evaluate recirculation-based, demand-controlled ventilation strategies in an office building. Build. Environ. 2022, 211, 108737. [Google Scholar] [CrossRef]
- Zuo, W.; Wetter, M.; Li, D.; Jin, M.; Tian, W.; Chen, Q. Coupled Simulation of Indoor Environment, HVAC and Control System by Using Fast Fluid Dynamics and the Modelica Buildings Library. In Proceedings of the 2014 ASHRAE/IBPSA-Building Simulation Conference, Atlanta, GA, USA, 10–12 September 2014; pp. 56–63. [Google Scholar]
- Wetter, M.; Zuo, W.D.; Nouidui, T.S.; Pang, X.F. Modelica Buildings library. J. Build. Perform. Simul. 2014, 7, 253–270. [Google Scholar] [CrossRef]
- Fu, Y.; Zuo, W.; Wetter, M.; VanGilder, J.W.; Han, X.; Plamondon, D. Equation-based object-oriented modeling and simulation for data center cooling: A case study. Energy Build. 2019, 186, 108–125. [Google Scholar] [CrossRef]
- Xu, L.; Guo, F.; Hoes, P.; Yang, X.; Hensen, J.L.M. Investigating energy performance of large-scale seasonal storage in the district heating system of chifeng city: Measurements and model-based analysis of operation strategies. Energy Build. 2021, 247, 111113. [Google Scholar] [CrossRef]
- Halimov, A.; Lauster, M.; Müller, D. Validation and integration of a latent heat storage model into building envelopes of a high-order building model for Modelica library AixLib. Energy Build. 2019, 202, 109336. [Google Scholar] [CrossRef]
- Mork, M.; Materzok, N.; Xhonneux, A.; Müller, D. Nonlinear Hybrid Model Predictive Control for building energy systems. Energy Build. 2022, 270, 112298. [Google Scholar] [CrossRef]
- Mahyuddin, N.; Awbi, H.B.; Essah, E.A. Computational fluid dynamics modelling of the air movement in an environmental test chamber with a respiring manikin. J. Build. Perform. Simul. 2014, 8, 359–374. [Google Scholar] [CrossRef]
- GB 50176-2016; Code for Thermal Design of Civil Building. China architecture Industry Press: Beijing, China, 2016.
- Persily, A.; de Jonge, L. Carbon dioxide generation rates for building occupants. Indoor Air 2017, 27, 868–879. [Google Scholar] [CrossRef]
- Lusk, G. Analysis of the oxidation of mixtures of carbohydrate and fat. J. Biol. Chem. 1924, 59, 41–42. [Google Scholar] [CrossRef]
- FAO. Human Energy Requirements. Report of a Joint FAO/WHO/UNU Expert Consultation; Food and Nutrition Technical Report Series 1; Food and Agriculture Organization of the United Nations: Geneva, Switzerland, 2001. [Google Scholar]
- Schofield, W. Predicting basal metabolic rate, new standards and review of previous work. Hum. Nutr. Clin. Nutr. 1985, 39 (Suppl. S1), 5–41. [Google Scholar]
- Wright, J.D.; Wang, C.-Y. Trends in Intake of Energy and Macronutrients in Adults from 1999–2000 through 2007–2008; Centers for Disease Control and Prevention, National Center for Health Statistics: Hyattsville, MD, USA, 2010. [Google Scholar]
- ASHRAE 55-2013; Thermal Environment Conditions for Human Occupancy. American Society of Heating, Refrigerating and Air Conditioning Engineers: Atlanta, GA, USA, 2013.
- ISO 7730-2005; Ergonomics of the Thermal Environment—Analytical Determination And Interpretation of Thermal Comfort Using Calculation of the PMV and PPD Indices and Local Thermal Comfort Criteria. ISO: Geneva, Switzerland, 2005; pp. 605–615.
- BS EN 16798-1-2019; Energy Performance of Buildings—Part 1: Indoor Environmental Input Parameters for Design and Assessment of Energy Performance of Buildings Addressing Indoor Air Quality, Thermal Environment, Lighting and Acoustics-Module M1-6. British Standards Institution: London, UK, 2019; pp. 18–33.


Disclaimer/Publisher’s Note: The statements, opinions and data contained in all publications are solely those of the individual author(s) and contributor(s) and not of MDPI and/or the editor(s). MDPI and/or the editor(s) disclaim responsibility for any injury to people or property resulting from any ideas, methods, instructions or products referred to in the content. |
© 2024 by the authors. Licensee MDPI, Basel, Switzerland. This article is an open access article distributed under the terms and conditions of the Creative Commons Attribution (CC BY) license (https://creativecommons.org/licenses/by/4.0/).