Abstract
The aim of the paper was to identify which European capitals are sustainable and smart, why, and what influences the ranking. The main research hypothesis was to indicate that cities in the ‘old’ E.U. countries (richer and with higher levels of economic development) are more sustainable and smart. Furthermore, sustainable smart cities, by definition, through the use of advanced and modern management tools and technological support, should contribute to community resilience. Sustainable energy plays a significant role in the measurement system. The study’s results showed the differences that exist across countries, as well as the leaders in each smart category and area. This is interesting and new; from a research point of view, there has been no study based on OECD research and data confronting and correlating the range of data with indicators found in the literature. The study results show that the concept of a smart city is comprehensive and that it is necessary to analyze in depth the various sub-categories included in the measurement and assessment of smartness offered by different indicators. This is because it turns out that an overall score and ranking do not always mean that a city is smart in every area and every element included in smart. Statistical methods and literature analysis are used for the study. The results represent a novel development and contribution to the science discipline and can be the basis for further scientific exploration in this area. The research gap and challenge indicate whether there is a link and correlation between the use of sustainable energy in E.U. countries and the implementation of smart concepts in European capitals in the context of the division into ‘new’ and ‘old’ E.U. capitals. An important element is the verification of the thesis that ‘old’ capitals are more advanced in the implementation of smart cities and make greater use of sustainable energy to meet social and economic needs. The thesis has been partly falsified and confirmed negatively; the results are not obvious. It means that the ‘new’ E.U. countries are very skillful in using financial, organizational, and common development policy opportunities to make their cities modern, intelligent, and friendly to their inhabitants.
1. Introduction
According to U.N. projections, 68% of the world’s population will live in cities by 2050 [1]. It means that cities require various decisions and concepts to be implemented, allowing them to grow while ensuring quality of life and environment. Today’s cities are dynamic entities that face many problems. To manage the limited resources in cities, including access to clean air and water, and to improve the quality of urban life, new and innovative smart approaches must be applied, which involve implementing smart city concepts. In this respect, the search for synergies and connections between the often conflicting goals of different interest groups and the combination of AI-based technological solutions with social and behavioral aspects requires appropriate indicators, metrics, and ways of evaluating cities. It is necessary to make cities liveable and, at the same time, to skillfully use technology to enhance the quality of life. The implementation of the smart city concept plays a fundamental role in creating the well-being of people living in urban areas [2]. The challenges facing cities require large investments in urban infrastructure to provide adequate services and meet the needs of city dwellers [3]. In addition, it is important to bear in mind that more than 80% of the world’s population lives in cities with high levels of pollution that exceed World Health Organization (WHO) guidelines, and seven million people die each year due to air pollution and related health problems [4]. It is, therefore, important to take an interest in the connection and interdependence between the implementation of smart cities and smart energy concepts.
This uses a transformational approach, often supported by good examples and indicator-based evaluation, to compare performance and assess a city’s health. A variety of measurement systems are used to define a smart city (economic, social, environmental elements, etc.), which at the same time form the basis for defining cities as sustainable and meeting sustainability principles.
Smart cities are cities supported by technology while meeting the requirements of sustainable development. Digital engineering is used to support social, economic, and environmental development. This support of smart cities contributes to creating smarter, cleaner, and more sustainable cities. Elements of digital engineering are included in the smart city indicators, reflecting areas related to virtually every pillar of a smart city. The extent of technology use (ICT, A.I.) can be found in the indicator measurement in each category. It forms the basis for creating the indicator measurement of smart cities.
Overcoming the problems beset by modern cities requires a systematic approach to increasing synergies and appropriately assessing cities using tools and indicators. Cities represent many benefits and opportunities for their beneficiaries; however, there are problems and challenges to overcome. Challenges include the economic, social, and environmental aspects of implementing sustainable development principles. Urban problems include not only air or water pollution, lack of sustainable management of energy consumption, consequent climate change, congestion, lack of accessibility to efficient transport systems and effective urban mobility, but also unsound land use, aging infrastructure, or lack of a coherent urbanization policy, as well as ineffective health care or lack of public safety [5]. A wide range of projects and smart city solutions are used to manage and monitor environmental, energy, and transport conditions in the context of individual and collective journeys and loads [6]. The broad conceptual scope indicates that evaluation tools should be used to assess implemented concepts that significantly impact cities, as their results and the city’s position in the rankings can be used to plan future development or assess the strengths and weaknesses of administrative units. A ranking position can also influence a city’s competitiveness or use in promotion. It is also important to attract direct foreign investment or tourists, which brings about rapid development of the city and influences its positive perception and better quality of life [7].
The purpose of the article is to assess the smart city rank of E.U. capitals in the context of the selected indicators using the methods of multivariate comparative analysis. The analysis used 27 smart city indicators divided into eight sub-criteria: safety and crime, overall satisfaction, service and amenities, environmental quality, economic well-being, public transport, the inclusive city, and local public administration. This study aims to show whether there are differences between the development and implementation of the smart city concept in capitals of highly developed countries with good economic indicators and a high level of economic and social development and whether the implementation of the smart city concept depends on other factors and city character. In particular, the following research questions were asked: Which capital cities are smart, and what does it depend on? Does smart mean the same for all cities? Whether city rankings are a reliable indicator for assessing the intelligence of cities
The main research hypothesis is to indicate that cities in the ‘old’ E.U. countries (richer and with higher levels of economic development) are smarter. Furthermore, smart cities, through advanced and modern management tools and technological support, should contribute to community resilience. The research gap and challenge indicate whether there is a link and correlation between the use of sustainable energy in E.U. countries and the implementation of smart concepts in European capitals in the context of the division into ‘new’ and ‘old’ E.U. capitals. An important element is the verification of the thesis that ‘old’ capitals are more advanced in the implementation of smart cities and make greater use of sustainable energy to meet social and economic needs.
The novelty of the research undertaken is the perspective—the context of European capitals. Until now, there has been no research of this kind to compare how the implementation of the smart city concept looks in the ‘old’ and ‘new’ capitals. By design, the ‘new’ E.U. capitals and their countries economically, socially, and environmentally had an immeasurable amount of catching up. It means that countries that did not have common sectoral policy objectives or financial resources have not been implementing advanced city logistics concepts or smart cities for some years now. In the 1990s, capitals such as Vienna, Rome, Berlin, and London were at the forefront of solutions to support modern technology in cities, particularly regarding urban passenger transport. E.U. funding was used to support modern infrastructure and solutions [8]. ICT technologies have allowed the development and implementation of smart city concepts in cities [9]. During this period, cities with a long E.U. tradition served as examples. The expansion and ubiquity of ICT solutions now being extended to include A.I. aspects show that nowadays, in some areas, it does not matter the size of the capital city (previously, many more solutions were implemented by large cities) or just the fact of how long the country has been in the structures of the European Union. Our research shows and is intended to show, that cities with less economic power, which are practically at the beginning of the road to change, consistently pursue common E.U. policy but also their own goals (including a better standard of living for their inhabitants), are successfully implementing smart city concepts. It would seem, and this is the research question that has been posed, that strong, traditional European economies will continue to set an example in terms of smart concepts. Research and publicly available statistics indicate that smaller capital cities (e.g., Warsaw) may be examples to follow in selected areas.
The article’s original research approach is reflected in the selection of the capitals for the study, the evaluation of the ranking position, the analysis of the individual criteria included in the evaluation, and, consequently, the position of smart.
2. Theoretical Background—Sustainable Cities, Sustainable Energy, and Smart City Indicators
The smart city concept is evolving and transforming and, thus, encompasses different dimensions with its definitions. In the initial stages of development, academic and practical discussions focused on using information and communication technologies, as well as their integration and data streams, to improve cities’ functioning, efficiency, and competitiveness [10,11]. The development of the concept was linked to the interest and implementation of sustainable development principles in smart city initiatives [12,13]. Smart cities are classified as technologically advanced metropolitan areas, supported by ICT, which aim to innovate to promote competitiveness, sustainability, and a high standard of living [14]; in addition, such cities should be green, have the organizational capacity to build physical infrastructure, and develop innovative services [15].
The evolution of the approach has led to a holistic and comprehensive approach to addressing environmental, social, and economic challenges through innovative technologies and data-driven solutions [16]. Taking a broad understanding of the concept, it should be pointed out that the smart city combines ICT-based solutions (classic approach) and creative urban planning with the inclusion of society in the planning process and the implementation of smart city objectives. Modern cities are expected to meet today’s challenges by using ICT to monitor and connect their infrastructure, optimize the use of resources, improve collaboration between city stakeholders, and enable the public and private sectors to develop innovative business models [17]. It should now be accepted that the concepts of sustainable and smart cities should be considered together, looking for commonalities. The measurement system must include indicators that assess both areas [18]. Smart indicators related to technology can support the pursuit of urban sustainability and the implementation of sustainability principles. Unfortunately, a measurement system that includes various indicators often does not take systemic interactions into account, failing to offer cities guidance on the direction in which they should develop to increase the extent of sustainability implemented and their ranking. This means that models and, with them, indicator methods for quantifying urban development should be systemic in order to fulfill different roles [19].
Smart cities can be assessed based on various indicators and models. Future research will focus on a framework for measuring smart city performance in specific smart categories [20]. The overall assessment will be based on established and accepted objective indicators. It should be pointed out that the concept of a smart city can be very subjective and ambiguous [21]. Different definitions, but also diversity related to the geographical location of the city, the emphasis on particular areas within smart city models, or the structure (e.g., greater importance of ICT systems or public involvement and participation of citizens) results in smart cities being interpreted, defined differently, and also using different systems and indices to evaluate the implemented concepts. Smart city indicators and measurement are the result of the work of not only academics but also of many institutions and organizations that, by publishing their data and results, including the indicated measurement methodologies, indicate that they effectively assess and compare cities in terms of their smart city performance [22,23]. The indices may differ from each other and emphasize different elements, e.g., the sustainability aspect (Europe), the use of technology (Asia), the city’s size, and the city’s role, character, and functions. However, they aim to improve competitiveness through a skillfully executed comparative analysis. Nevertheless, each city, for its purposes, can construct its solutions and consider the elements that demonstrate its innovation and intelligence.
Recent literature points out that quality of life aspects are the most important and beneficial indicators for citizens regarding the sustainability of smart cities [24]. Quality of life can be perceived differently depending on geographical areas, country specifics, or the levels and dimensions necessary to ensure the population’s comfort [25]. The digital transformation of cities simultaneously implies many economic and social complications, which are related to governance and the environment but can be supported by automation or artificial intelligence [26,27]. The smart city index also reflects sustainability indicators. Regardless of which indicator data sources are used, the components of an indicator are aspects related to the economy, society, and the environment. It can be concluded that the smart city index is a sustainable smart city. An in-depth analysis based on a literature review of sustainable city indicators can be found in [3]. In our paper, we focus on selecting the most relevant indicators in the context of the analyses presented.
By definition, smart cities use ICT for all their processes. These are modern and high-tech cities [28], and I design a safe and human-centered environment [29]. Technology is intended to improve the quality of life in the city and make it easier to function. Still, it is also intended to affect all stakeholders in the urban area and meet people’s needs more efficiently and effectively. A characteristic of smart cities is that they are dynamic and multidimensional, enabling the integrated management of complex urban systems [30,31]. Important from the point of view of measuring the intelligence of cities is the construction of an information infrastructure, which is inextricably linked to digital engineering. The effective structure and use of applications are among the elements that support the measures indicated, and they are also indicative of the digitalization of cities and the increasing accessibility of services to citizens. Smart city infrastructure, including roads, dams, bridges, railways, manufacturing plants, and pipelines, is supported by design practices that incorporate digital engineering [32,33]. Digital engineering in cities supports decision-making processes and allows faster and more efficient resolution of investment and infrastructure projects, which supports the creation and evaluation of smart cities [34].
According to the OECD approach [35], Smart City categories should refer to four pillars: well-being, resilience, inclusion, and sustainability. Within these pillars, eight tools can be distinguished (sub-categories are elements for measuring and assessing cities within the smart city framework). The eight tools/dimensions identified include connectivity, mobility, jobs and firms, housing and built environment, health and safety, education and skills, e-government, energy, water and waste. As envisaged by the OECD, measurements can be performed at each level by matching and analyzing appropriate measurement indicators. A smart city index can be based on different criteria and categories. The literature indicates that it is constructed by dividing it into different smart categories (Table 1). Often, the literature divides or details the categories, but some of the elements overlap, and several main aspects can be distinguished. These are presented in Figure 1, developed from [21,30,31,36,37]. The development of sustainable and smart cities is described in the UNESCO report [38], indicating three areas of urban development: Business City (Economy First), Eco City (Ecology First), and Citizens City (Humans First). Research in this area indicates that the best option and solution for today’s cities is to combine these three areas and look for trade-offs that ensure simultaneous development in all areas [39].
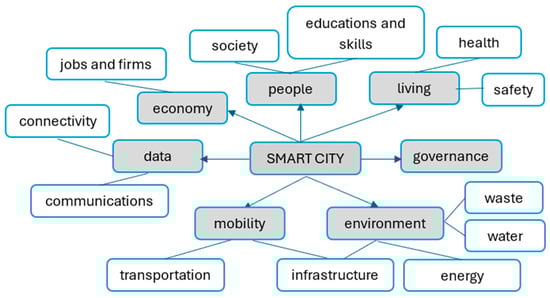
Figure 1.
Category of smart city dimensions. Source: own elaborations.
Lai and Cole [40] have reviewed the available smart city indicators, presenting a set of the 20 most frequently emerging indicators for assessing cities from a smart point of view. This collection is not a closed set but can be used for analysis both in the context of smart cities and the city. The selected elements are presented in Figure 2. Of course, there are many more indicators, but those indicated in Figure 2 seem to cover the widest range and are also developed based on widely collected data.
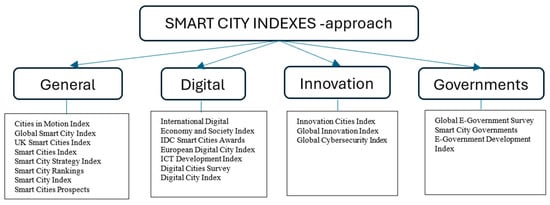
Figure 2.
Selected smart city indicators. Source: own elaborations based on [40].
A standardized approach can also be used to assess intelligence in cities—the International Organisation for Standardisation (ISO), the International Electrotechnical Commission (IEC), and the International Telecommunication Union (ITU) have published standards for urban intelligence, including 20 international standards for assessing urban intelligence, including addressing ICT support and use (ISO/IEC 30146:2019 [41]) and sustainable cities and communities—smart city indicators (ISO 31722:2019 [42]). The ISO has developed 19 Level 1 and 80 Level 2 indicators measuring the quality of urban services and life. The second type of assessment method is the so-called two-pillar approach, in which the capability pillar focuses on infrastructure readiness, and the performance pillar assesses the quality of different urban services [40].
Indicator measurement can be related to two dimensions. The measurement is based on key factors and assesses each dimension’s development level [43]. Basic indices developed on this basis (e.g., ‘Smart city wheel’) [44] form the basis of many subsequent indicator studies. In this respect, smartness is studied in terms of environment, mobility, government, economy, people, and life. Based on this study, the first comprehensive intelligence index for medium-sized cities in Europe was developed. The indicators are divided into levels 1, 2, and 3, including 6, 31, and 74 indicators [10,45]. Smart city indicators, according to the different approaches, are presented in Table 1.

Table 1.
Smart City indicators.
Table 1.
Smart City indicators.
| OECD Indicator Categories for the Smart City Survey | Categories for Measuring Quality of Life in European Commission Cities | Smart City Indicators Based on Bibliometric Analysis of Scientific Articles |
|---|---|---|
| 1st pillar smart city | Indicators | Dimension |
| Tools | Overall satisfaction | Economy |
|
|
|
| 2nd Pillar smart city | Services and amenities | People |
| Stakeholder engagement | ||
|
|
|
| 3rd pillar smart city | Environmental Quality | Environment |
| Well being | ||
|
|
|
| Resilience | Economic well-being | Governance |
|
|
|
| Inclusion | The inclusive city | Data |
|
|
|
| Sustainability | Public transport in the city | |
|
| |
| Local public administration | ||
| ||
| Trust and safety | ||
|
Source: own elaboration based on [35,46,47].
Despite the different areas and names for indicators or dimensions, each area of the smart city model appears in the analyzed documents (Table 2).
Table 2.
Matrix of links and commonalities Smart City Indicators Smart City performance.
An extremely important component of the indicator is the scope of sustainable energy. It is a multidimensional approach to measuring the use of sustainable energy. The literature does not clearly define sustainable energy indicators. However, when analyzing Eurostat resources [48], it should be noted that some of them are also reflected in smart indicators cities.
According to Eurostat data, the elements of sustainable energy include energy productivity, electricity price by type of user, market share of the largest generator in the electricity market, gross available energy by product, total energy supply by product, final energy consumption by product, final energy consumption by sector, final energy consumption in households by type of fuel, final energy consumption in transport by type of fuel, final energy consumption in road transport by type of fuel, final energy consumption in the industry by type of fuel, primary energy consumption, final energy consumption, final energy consumption in households per capita, the share of renewable energy in gross final energy consumption by sector, energy import dependency by-products, and population unable to keep home adequately warm by poverty status.
The concept of sustainable energy supply is within the scope of development constraints. It refers to using renewable sources while supporting the pillars of medical development—parity between three areas—economy, ecology, and social [49,50]. In the context of considerations, an analysis of sustainable energy use in cities is needed to demonstrate the connection between sustainable energy and the implementation of the smart city concept. The context of combining smart grid technologies with smart city initiatives and concepts undoubtedly brings tangible benefits. In this context, promoting energy efficiency by optimizing energy consumption or adjusting demand management strategies using appropriate energy use analysis is possible.
Linking smart city objectives with smart grids, including energy grids, contributes to achieving sustainable urban development goals, integrating renewable energy sources, and supporting clean transport options such as electric vehicles, thereby reducing carbon emissions and promoting environmental protection. In addition, relying on generated grid data can support the decision-making processes of urban planners and decision-makers, helping strategic investments in energy infrastructure, urban development strategies, and formulating environmental policies, thus supporting long-term sustainability and quality of life in smart cities [51]. The solutions identified regarding the context of sustainable energy use, renewable energy sources, and the coexistence of smart city concepts in this respect facilitate decision-making and support the resilience of urban ecosystems [52]. In the context of the deliberations, it is important to point out that technologies affect many areas of urban activity while fitting into the scope of increasing energy efficiency, moving towards a more sustainable supply of urban spaces, maximizing the use of renewable energy sources or optimizing resource management [53,54]. Changing urban power systems in the context of renewable energy use plays a key role in developing sustainable and smart cities. It increases reliability and safety and possibly reduces greenhouse gas emissions [55]. Research has confirmed the complex interplay between rapid urbanization, sustainable energy networks, and climate change challenges [56,57].
An important element of the sustainable smart city study is to indicate the scope of energy transformation in European Union countries, including the share of renewable energy in the total energy used in a given country. This is important because smart city indicators include energy-related elements. The organic nature of the data and access to official Eurostat data allows for the analysis of the share of renewable energy by country. However, this scope can be related to the place of the capital of a given country in the smart city ranking. Table 3 shows how the use of renewable energy is changing in the European Union countries.
Table 3.
Share of energy from renewable sources in % in the European Union.
Analyzing the data in the table should indicate that the Scandinavian countries of Denmark (over 60%), Finland, and Sweden (over 40%) have the highest level of use of renewable energy, and Estonia, Latvia, Austria, and Portugal have over 30% level of use, and Lithuania and Croatia have 29 and 27%, respectively. This is related to the general policy of the European Union, striving to create zero-emission economies, which affects society’s quality of life and supports the energy transformation. Notably, the greatest changes and increases in use occurred in Finland, Sweden, Portugal, the Netherlands, Estonia, Denmark, and Cyprus. The increase in the use of sustainable energy also contributes to the perception of cities in given countries as more sustainable and, therefore, smarter. The foundations of modern cities are based on technology, intelligent transport, advanced building systems, and complex control structures. The aim is to build the resilience and intelligence of the city. Therefore, the search for a relationship between smart city and smart energy seems most appropriate.
3. Materials and Methods
Different rankings have different frameworks so that the same cities can be in different positions. That is why it is worth pointing out the exact methodologies of the surveys, rankings, and ratings range when analyzing them. Our study relies on an independent, objective, and clear methodology-based study of the European Commission. As European capitals were used for the study, methodological correctness should be indicated. The data analyzed in the article come from the European Commission’s 2019 and 2023 surveys [58]. The 2019 and 2023 data are the only ones available (by city), as reported by the European Commission in its Quality of Life in European Cities reports. They are concerned with the quality of life in European cities, which are identified as elements that shape the Smart City. The data were collected using the following methods: CATI, Phone-to-web, and online interviews. The survey covers 83 cities across Europe and covers a total of more than 70,000 interviews. The article analyzed only the capitals of E.U. countries.
The research aims to assess the smart city rank of E.U. capitals in the context of the selected indicators using multivariate comparative analysis. The analysis used 27 smart city indicators divided into eight sub-criteria: safety and crime, overall satisfaction, service and amenities, environmental quality, economic well-being, public transport, the inclusive city, and local public administration. Only metric indicators are present in the set of characteristics. The MS EXCEL program was used to calculate and visualize the study results.
In empirical studies that analyze multiple entities described by more than one characteristic (as in the case of smart city indicators), methods of multidimensional comparative analysis can be used. The multidimensional comparative analysis makes it possible to evaluate complex objects and phenomena, i.e., those whose state and behavior are simultaneously influenced by multiple characteristics (variables) and factors. It constitutes a formally coherent set of statistical methods for the purposeful selection of information about the elements of a certain community and for detecting regularities in the interrelationships between them [59].
The research problem of multivariate comparative analysis includes the steps shown in Figure 3.
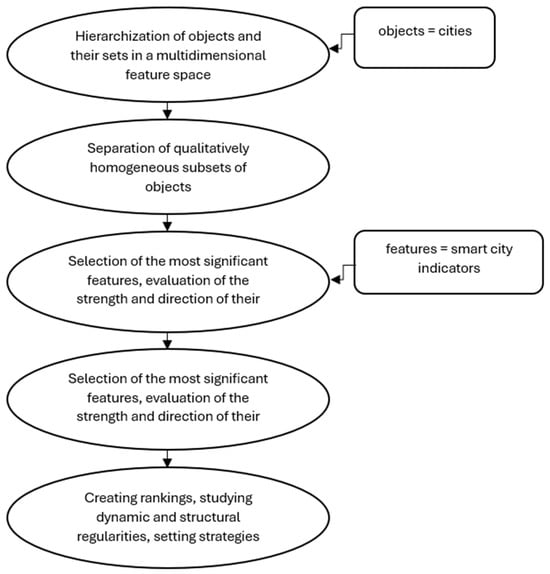
Figure 3.
Steps of multivariate comparative analysis. Source: own elaborations.
The primary goal of multivariate comparative analysis is the construction of a synthetic measure (aggregate indicator) that allows the comparison of elements of a set (objects) described by multiple variables (characteristics). Linear ordering methods are often used to achieve this. The tool of linear ordering is a certain function aggregating the partial information in individual variables determined for each object. Performing linear ordering requires the following assumptions [60]:
- -
- Each object has at least one neighbor and no more than two neighbors;
- -
- If object a is a neighbor of object b, then object b is a neighbor of object a;
- -
- There are only two objects with one neighbor;
- -
- The variables are preferential, i.e., the dominants, destimulants, and stimulants are distinguished among them and measured at least on an ordinal scale.
A critical step in linear ordering methods that use a synthetic variable is normalizing the diagnostic features and devising the method for constructing the aggregate synthetic variable. The literature contains many original ideas [61,62,63,64,65,66,67]. Linear ordering is based on an aggregate synthetic variable, whose values are estimated from observations of diagnostic variables that describe the objects under study. The synthetic variable is latent, meaning its values are not directly observed but inferred from measurable diagnostic variables. The values of the synthetic variable are estimated using feature aggregation functions, which can take various analytical forms. Hellwig [61] was the first to propose such a measure, constructing what is known as a synthetic measure of development to typologically divide countries by level of development and the stock and structure of skilled personnel. In this article, an aggregate measure was chosen, involving the calculation of the arithmetic mean of normalized diagnostic variables, expressed on a point scale ranging from 0 to 100. The formula for the aggregate measure is as follows:
where:
- n—number of features (criteria) taken into account;
- x’ij—normalized diagnostic variable.
A description of the properties of the methods and, more importantly, normalization formulas can be found, among others, in the works of [68,69,70]. The authors in [70] suggest that the choice of normalization formula should be combined with the choice of aggregation formula. From the analyses presented in the literature, the best formal properties are the classical normalization and the normalization methods, in which the distance of a given value from the observed “worst” value is divided by the gap. The latter method also satisfies the non-negativity condition postulated by some authors. Normalization follows the formulas:
For stimulants:
For destimulants:
where:
- -
- i—feature number;
- -
- j—the number of the feature;
- -
- max{xij} and min{xij} are searched in the set of objects for the given feature.
The advantage of this method over Hellwig’s measure is that it is the most popular in the literature. Hellwig [61] is because the postulated indicator is strictly normalized in the interval <0;100>, while Hellwig’s measure (in its classical form with double standard deviation) can take negative values.
4. Results
Figure 4 and Figure 5 show a comparison of all E.U. capitals due to the synthetic aggregate measure (Equation (1)). Given the design of the aggregate measure, the maximum score a city could obtain was 100 points. In 2023, the city that turned out to be the smartest, based on the indicators presented earlier, was Luxemburg (86), ahead of Copenhagen (82) and Helsinki and Stockholm (79).
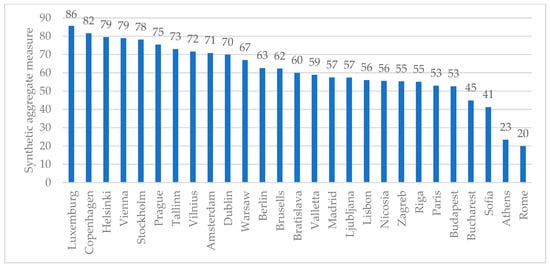
Figure 4.
Summary of analyzed cities (E.U. capitals) in the synthetic aggregate measure in 2023.
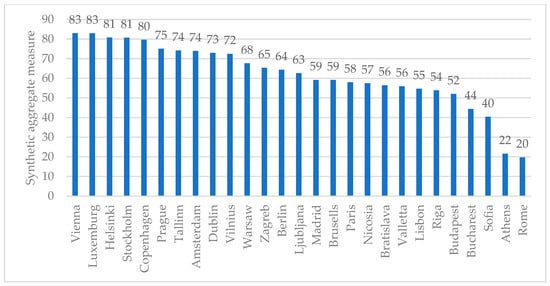
Figure 5.
Summary of analyzed cities (E.U. capitals) in the synthetic aggregate measure in 2019.
In Figure 4, it can be observed that in the ranking created according to the methodology given earlier, the highest ranking is achieved by the capitals of the Scandinavian and Benelux countries. On the other hand, the capitals of Central and Eastern European countries, such as Prague, Tallinn, Vilnius, and Warsaw, are also high in the ranking. It should be noted that they received higher rankings than the capitals of Western European countries, such as Berlin, Paris, and Rome.
In contrast, the smartest cities in 2019 were Vienna (83) and Luxemburg (83), ahead of Helsinki (81) and Stockholm (81). The two lists show obvious similarities—the rate’s beginning, middle, and end are similarly arranged with slight shifts. On the other hand, the overall ranking brings some interesting conclusions. Among the weakest scores, it is not surprising to see capitals of post-communist countries (Sofia, Bucharest, Budapest, Riga) or with economic problems (Athens) where smart city transformations may be slower. However, Rome’s last place here is not obvious. Similarly, the low position of Berlin and Paris (behind, for example, Warsaw and Vilnius).
Table 4 shows the smart city sub-criteria with the top five cities in each category in analyzed years. In most sub-categories, the capitals for 2019 and 2023 are the same, only changing places within the top five. It is dominated by the capitals that turned out to be the best in the overall ranking, but some interesting exceptions in individual categories can also be noted. Among others, Valetta, Ljubljana, and Tallinn are high in the safety and crime category in 2019 and 2023 (there are no Western European capitals here). Meanwhile, in the economic well-being category, it can be noted that central–eastern European capitals that are not likely to be associated with prosperity are in the top five—Sofia, Prague, Vilnius, Warsaw, and Tallinn. In all categories, one can see the dominance of Scandinavian capitals—Copenhagen, Stockholm, and Helsinki. Benelux countries such as Amsterdam, Brussels, Luxembourg, Berlin, Paris, and Madrid are often absent from all sub-criteria.
Table 4.
Smart city sub-criteria with top 5 cities in each category.
The next chart (Figure 6) shows the top five cities of 2023 in the overall ranking. The scores of these cities in each category are compared to the average score of all cities in these categories.
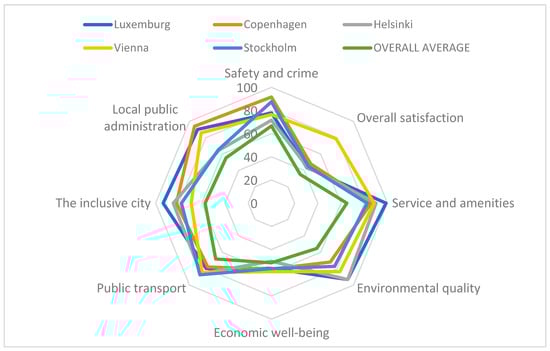
Figure 6.
Comparison of TOP5 Smart Cities in the analyzed sub-categories in 2023.
From the chart, it can be seen that the lowest scores in general are for the overall satisfaction category. Here, Vienna stands out positively, where residents’ feelings are clearly higher than in the other capitals of the top five. Luxembourg (the best smart city in 2023) has relatively higher scores in the categories of inclusive city, environmental quality, and service and amenities. However, scores close to the average of all capitals are for the economic well-being category.
Research results related to the smart city index can be correlated and show the relationship between environmental aspects and sustainable energy use. The smart city ranking includes Finland, Denmark, Sweden, and Austria’s capital cities. Scandinavian countries are also in the first position to use renewable energy to power their countries. This means that smart concepts are understood as a holistic approach, and elements related to sustainable energy support these concepts. At the bottom of the smart ranking are, among others, cities such as Rome, Bucharest, and Sofia. Analyzing the data on the use of renewable energy, be noted that in these countries, the increase in the level is very slight, e.g., Italy (increase in the use of sustainable energy compared to 2013 by over 2%), Bulgaria (0.19%), Romania (0.254%). In terms of smart ranking, Athens is quite distant. However, Greece is gradually increasing its share of renewable energy, and other factors probably influence this country’s use and implementation of the smart concept. It is also worth considering the results of research related to the use of renewable energy in Hungary; it is the only country that, compared to 2013, recorded a decrease in the use of renewable energy in 2022, and at the same time, is in 5th place from the bottom in the ranking smart city. Certainly, the lack of alternative renewable energy sources may contribute to this position.
5. Limitations, Conclusions, and Future Work
Not all rankings allow for international comparisons, so the most universal solutions should be sought to establish rankings globally. A general problem with this type of research and work is that no single set of indicators exists. In addition, the theoretical indicators reported in the literature are often not reflected and covered by publicly available urban statistics that would allow direct comparison. It is related to the different methodologies used to measure and assess cities in terms of their intelligence. Therefore, it is extremely difficult to directly compare the indicators extracted in the literature with business practice. The paper has managed to link smart city indicators to city data published by the OECD, thus developing a reasonably transparent way of comparing the intelligence of selected cities and showing the differences in individual indicators across European Union city capitals. In the overall ranking, considering all smart city indicators according to the methodology presented in the paper, the best performers are the capitals of the Scandinavian countries of the Benelux. However, there are significant differences in individual sub-categories.
In relating the results to the stated objectives of the questions and hypotheses, it should be pointed out that the results are often surprising, and this is due, among other things, to the extent of the construction of the indicators and the means of measurement. The indicators contain sub-categories that often determine the final score and ranking. This is particularly evident in sub-categories where good results are achieved by the capitals of the ‘youngest’ members of the European Union, and smaller capitals come out on top. Seemingly, the largest capitals with a well-established and long-standing position in the E.U. already have a number of solutions that were considered smart; however, capitals such as Prague, Tallinn, and Vilnius may be ahead of capitals such as Madrid, Berlin, or Paris because the capacity of the smart concept is extremely high, pointing to newer and newer solutions, which cities with a strong tradition of implementing smart city concepts or city logistics no longer implement because they are content with the level they have. Through the need to catch up in economic, social, and competitive development, the cities and capitals of the’ new’ Union are investing in the latest solutions. This brings a higher level of social satisfaction and modernity and allows cities to overtake those that were leaders only a few years ago as best examples of implementing the smart concept. The capacity of the smart concept, but also the breadth of practical solutions and the scope of definition, means that the main smart categories can be subdivided into more specific sub-categories, which often, with their specificity, allow smaller capitals to obtain good rankings, which can also be a good marketing exercise and show different cities from different angles and in a different light of the smart range. On the other hand, this is a difficulty and a limitation, as the different sub-categories may allow the results to be interpreted according to current needs without fully presenting a real, holistic, transparent, and objective approach and smart ranking.
Overall, when analyzing the study results, it can be pointed out that the capital cities of the Scandinavian and Benelux countries achieve the best results in terms of the smart elements studied. This may be due to a long tradition of providing a high quality of life for citizens, which is nowadays supported by various ICT tools, and the contribution made earlier by the City Logistics solutions now extended to the smart scope. The study’s biggest limitation is its restriction to refer only to European Union capitals, which may distort the picture of the concepts being implemented in Europe. Capital cities have specific administrative, political, and economic functions, and the extent to which infrastructural changes and financial support are introduced and implemented may influence the extent of change and the conceptual advancement of smart. However, presenting and confronting theory with empirical results in this way shows how much room for scientific and practical exploration remains. It opens the way for research from different angles and criteria for other cities. Further research should take into account not only the availability of OECD data but also other criteria for the selection of cities, their size, their functions, and the adaptation of the individual sub-criteria and criteria of the smart indicators to build a model for assessing cities most objectively and transparently so that they can be compared according to the same principles and elements.
A limitation and an element of the discussion is the need for more data on using renewable energy in the capitals of European cities. However, capitals are usually the largest centers, not only political but also economic, and the largest cities with the highest use of energy resources. Therefore, it seems that data on the use of renewable energy in individual countries allow for drawing correct conclusions and indicate that this element is extremely important for considering and ranking cities in the context of smart.
Despite its limitations, the paper shows the basis and possibilities of comparing cities according to Objectively Selected Criteria based on literature and available OECD statistics. The work becomes a foundation for further extensive research in assessing cities’ intelligence based on objective considerations. The research gap was to indicate whether there is a link between the use of sustainable energy and the implementation of the smart concept, and this is also the focus of the study, and whether the capitals of the old European Union, which by definition have been operating in linked systems for many years, are also the capitals of countries with better parameters and economic indicators, are more advanced in implementing the smart concept. The analysis has shown that this is not always the case. It shows that the new E.U. countries have been very quick to take advantage of the opportunities (including financial ones, which were not previously available to them, as well as technical and technological ones) and chances offered by being in the European Community and have made up for the infrastructural disadvantages in terms of implementing the smart concept. Studies have shown that the capitals of the new E.U. countries are often ahead of the large and old capitals in terms of individual indicators. It may turn out that the opportunities of being in the Community have been very well exploited shortly. This would probably not have been possible without financial support and E.U. programs, but one thing is clear: we no longer see differences in certain areas. Of course, the capitals and countries of the new E.U. still have much to do in renewable energy and the transition to a low-carbon economy in general. However, this area has also improved, which indicates a good social and environmental policy direction. The stereotypical thinking in the context of old (and often rich) European states and capitals being more advanced and having better, more modern, and more environmentally friendly tools and smart city concepts is not in line with the results of our study. It should be pointed out that the new E.U. states are doing an excellent job in this respect, which is not only in line with the policy of the entire E.U. but also bridges the economic and social gap between the E.U. capitals.
Smart cities are key to reducing emissions; an element of support is correlating energy and smart city goals [71]. Although smart cities have many creative solutions, such as smart transport systems, green buildings, renewable energy, and smart grids, solutions must be applied holistically to support achieving sustainable city goals. The examples of European capitals show that it is no longer important whether a city belongs to the ‘old’ or the ‘new’ members of the E.U. What is important is the common and continuous pursuit of established goals and compliance with E.U. policies that support the development of their units and the societies living in the cities.
Author Contributions
Conceptualization, B.T. and T.W.; methodology, B.T. and T.W.; validation, B.T. and T.W.; formal analysis, B.T. and T.W.; investigation, B.T. and T.W.; resources, B.T. and T.W.; data curation, B.T. and T.W.; writing—original draft preparation, B.T. and T.W.; writing—review and editing, B.T. and T.W.; visualization, B.T. and T.W. All authors have read and agreed to the published version of the manuscript.
Funding
This research was co-financed by the Minister of Science (Poland) under the “Regional Excellence Initiative”.
Data Availability Statement
The data presented in this study are available on request from the corresponding author.
Conflicts of Interest
The authors declare no conflicts of interest.
References
- Anderson, M. Smart Cities Examples: The Smart, The Not-So-Smart, And the Ugly. 2022. Available online: https://onekeyresources.milwaukeetool.com/en/smart-cities (accessed on 5 May 2024).
- Taş, M.A.; Alptekin, S.E. Evaluation of major cities in terms of smart cities: A developing country perspective. Procedia Comput. Sci. 2023, 225, 1717–1726. [Google Scholar] [CrossRef]
- Gazzeh, K. Ranking Sustainable Smart City Indicators Using Combined Content Analysis and Analytic Hierarchy Process Techniques. Smart Cities 2023, 6, 2883–2909. [Google Scholar] [CrossRef]
- Shahid, N.; Shah, M.A.; Khan, A.; Maple, C.; Jeon, G. Towards greener smart cities and road traffic forecasting using air pollution data. Sustain. Cities Soc. 2021, 72, 103062. [Google Scholar] [CrossRef]
- Vanli, T.; Akan, T. Mapping synergies and trade-offs between smart city dimensions: A network analysis. Cities 2023, 142, 104527. [Google Scholar] [CrossRef]
- Ang, K.L.M.; Seng, J.K.P.; Ngharamike, E.; Ijemaru, G.K. Geo-information, data analytics, and machine learning approaches are emerging technologies for smart cities’ transportation. ISPRS Int. J. Geo-Inf. 2022, 11, 85. [Google Scholar] [CrossRef]
- Patrão, C.; Moura, P.; Almeida, A.T.D. Review of smart city assessment tools. Smart Cities 2020, 3, 1117–1132. [Google Scholar] [CrossRef]
- Pulawska, S.; Starowicz, W. Ecological urban logistics in the historical centres of cities. Procedia-Soc. Behav. Sci. 2014, 151, 282–294. [Google Scholar] [CrossRef]
- Dameri, R.P. Smart City Implementation; Progress in I.S.; Springer: Genoa, Italy, 2017. [Google Scholar]
- Caragliu, A.; Del Bo, C.; Nijkamp, P. Smart cities in Europe. J. Urban Technol. 2011, 18, 65–82. [Google Scholar] [CrossRef]
- Mutambik, I. Unlocking the Potential of Sustainable Smart Cities: Barriers and Strategies. Sustainability 2024, 16, 5061. [Google Scholar] [CrossRef]
- Lombardi, P.; Giordano, S.; Farouh, H.; Yousef, W. Modelling the smart city performance. Innov. Eur. J. Soc. Sci. Res. 2012, 25, 137–149. [Google Scholar] [CrossRef]
- Albino, V.; Berardi, U.; Dangelico, R.M. Smart cities: Definitions, dimensions, performance, and initiatives. J. Urban Technol. 2015, 22, 3–21. [Google Scholar] [CrossRef]
- Myeong, S.; Kim, Y.; Ahn, M.J. Smart city strategies—technology push or culture pull? A case study exploration of Gimpo and Namyangju, South Korea. Smart Cities 2020, 4, 41–53. [Google Scholar] [CrossRef]
- Pinem, R.J.; Kustedjo, A.K.; Iskandar, Y.A.; Yahya, B.N. Investigation of Smart Sustainable City Indicators of Sustainable Development—A Case Study of the City of Suwon. Sustainability 2023, 15, 14283. [Google Scholar] [CrossRef]
- Hammoumi, L.; Maanan, M.; Rhinane, H. Characterising Smart Cities Based on Artificial Intelligence. Smart Cities 2024, 7, 1330–1345. [Google Scholar] [CrossRef]
- Bibri, S.E.; Krogstie, J. Smart, sustainable cities of the future: An extensive interdisciplinary literature review. Sustain. Cities Soc. 2017, 31, 183–212. [Google Scholar] [CrossRef]
- Huovila, A.; Bosch, P.; Airaksinen, M. Comparative analysis of standardised indicators for smart, sustainable cities: What indicators and standards should be used and when? Cities 2019, 89, 141–153. [Google Scholar] [CrossRef]
- Cai, M.; Kassens-Noor, E.; Zhao, Z.; Colbry, D. Are smart cities more sustainable? An exploratory study of 103 US cities. J. Clean. Prod. 2023, 416, 137986. [Google Scholar] [CrossRef]
- Hajek, P.; Youssef, A.; Hajkova, V. Recent developments in smart city assessment: A bibliometric and content analysis-based literature review. Cities 2022, 126, 103709. [Google Scholar] [CrossRef]
- Abu-Rayash, A.; Dincer, I. Development and application of an integrated smart city model. Heliyon 2023, 9, e14347. [Google Scholar] [CrossRef]
- Bosch, P.; Jongeneel, S.; Neumann, H.; Iglár, B. Recommendations for a Smart City Index. CITYkeys Project, Deliverable 3.3. Cities-Benchmarking Algorithm: A Meta-Ranking Exercise. 2016. Available online: https://www.researchgate.net/publication/326783291_Recommendations_for_a_smart_city_index (accessed on 15 August 2024).
- Fernandez-Anez, V.; Velazquez, G.; Perez-Prada, F.; Monzón, A. Smart city projects assessment matrix: Connecting challenges and actions in the Mediterranean region. J. Urban Technol. 2020, 27, 79–103. [Google Scholar] [CrossRef]
- Shao, Q.G.; Jiang, C.C.; Lo, H.W.; Liou, J.J. Establishing a sustainable development assessment framework for a smart city using a hybrid Z-fuzzy-based decision-making approach. Clean Technol. Environ. Policy 2023, 25, 3027–3044. [Google Scholar] [CrossRef]
- Chen, C.W. Can smart cities bring happiness to promote sustainable development? Contexts and clues of subjective well-being and urban livability. Dev. Built Environ. 2023, 13, 100108. [Google Scholar] [CrossRef]
- Kumar, V.; Pandey, A.; Singh, R. Project success and critical success factors of construction projects: Project practitioners’ perspectives. Organ. Technol. Manag. Constr. Int. J. 2023, 15, 1–22. [Google Scholar] [CrossRef]
- Kumar, V.; Singh, R.; Pandey, A. Multiple stakeholders’ critical success factors scale for success on large construction projects. Asian J. Civ. Eng. 2024, 25, 1691–1705. [Google Scholar] [CrossRef]
- Trindade, E.P.; Hinnig, M.P.F.; da Costa, E.M.; Marques, J.S.; Bastos, R.C.; Yigitcanlar, T. Sustainable development of smart cities: A systematic review of the literature. J. Open Innov. Technol. Mark. Complex. 2017, 3, 1–14. [Google Scholar] [CrossRef]
- Kim, S.C.; Hong, P.; Lee, T.; Lee, A.; Park, S.H. Determining strategic priorities for smart city development: Case studies of South Korean and international smart cities. Sustainability 2022, 14, 10001. [Google Scholar] [CrossRef]
- Sharifi, A. Urban sustainability assessment: An overview and bibliometric analysis. Ecol. Indic. 2021, 121, 107102. [Google Scholar] [CrossRef]
- Sharifi, A. A typology of smart city assessment tools and indicator sets. Sustain. Cities Soc. 2020, 53, 101936. [Google Scholar] [CrossRef]
- Aktan, A.E.; Bartoli, I.; Karaman, S.G. Technology leveraging for infrastructure asset management: Challenges and opportunities. Front. Built Environ. 2019, 5, 61. [Google Scholar] [CrossRef]
- Caldera, S.; Mohamed, S.; Mostafa, S.; Desha, C. Digital engineering for resilient road infrastructure outcomes: Evaluating critical asset information requirements. J. Sustain. Dev. Energy Water Environ. Syst. 2020, 10, 1–22. [Google Scholar] [CrossRef]
- Caldera, S.; Mostafa, S.; Desha, C.; Mohamed, S. Exploring the role of digital infrastructure asset management tools for resilient linear infrastructure outcomes in cities and towns: A systematic literature review. Sustainability 2021, 13, 11965. [Google Scholar] [CrossRef]
- OECD. A Territorial Approach to the Sustainable Development Goals: Synthesis Report, OECD Urban Policy Reviews; OECD Publishing: Paris, France, 2020. [Google Scholar]
- Sharifi, A. Resilient urban forms: A macro-scale analysis. Cities 2019, 85, 1–14. [Google Scholar] [CrossRef]
- Sharifi, A.; Kawakubo, S.; Milovidova, A. Urban Sustainability Assessment Tools: Toward Integrating Smart City Indicators. In Urban Systems Design; Elsevier: Amsterdam, The Netherlands, 2020; pp. 345–372. [Google Scholar]
- UNESCO. Smart Cities: Shaping the Society of 2030. 2019. Available online: https://unesdoc.unesco.org/ark:/48223/pf0000367762 (accessed on 10 September 2024).
- Riedmann-Streitz, C.; Streitz, N.; Antona, M.; Marcus, A.; Margetis, G.; Ntoa, S.; Rau, P.-L.P.; Rosenzweig, E. How to Create and Foster Sustainable Smart Cities? Insights on Ethics, Trust, Privacy, Transparency, Incentives, and Success. Int. J. Hum.-Comput. Interact. 2024, 1–32. [Google Scholar] [CrossRef]
- Lai, C.M.T.; Cole, A. Measuring progress of smart cities: Indexing the smart city indices. Urban Gov. 2023, 3, 45–57. [Google Scholar] [CrossRef]
- ISO/IEC 30146:2019; Information Technology—Smart City ICT Indicators, 1st ed. ISO/IEC: Geneva, Switzerland, 2019.
- ISO 31722:2019; Sustainable Cities and Communities—Indicators for Smart Cities. ISO (International Organization for Standardization): Geneva, Switzerland, 2019.
- Fang, Y.; Shan, Z. Optimising smart city evaluation: A people-oriented analysis method. IET Smart Cities 2024, 6, 41–53. [Google Scholar] [CrossRef]
- Cohen, B. What Exactly Is a Smart City? 2012. Available online: http://www.fastcoexist.com/1680538/what-exactly-is-a-smart-city (accessed on 5 July 2024).
- Giffinger, R.; Gudrun, H. Smart cities ranking: An effective instrument for the positioning of the cities? Arch. City Environ. 2010, 4, 7–26. [Google Scholar] [CrossRef]
- Quality of Life in European Cities 2023 Report and Data Collection; European Commission: Brussels, Belgium, 2023.
- Sharifi, A. Smart city indicators: Towards exploring potential linkages to disaster resilience abilities. APN Sci. Bull 2022, 12, 75–89. [Google Scholar] [CrossRef]
- Eurostat. Available online: https://ec.europa.eu/eurostat/web/main/data/database (accessed on 16 August 2024).
- Soliman, K.S. Education Excellence and Innovation Management: A 2025 Vision to Sustain Economic Development during Global Challenges. In Proceedings of the 35th International Business Information Management Association Conference (IBIMA 2020), Seville, Spain, 1–2 April 2020; International Business Information Management Association: Prussia, PA, USA, 2020. [Google Scholar]
- Zioło, M.; Bąk, I.; Spoz, A. Sustainable Energy Sources and Financial Development Nexus—Perspective of European Union Countries in 2013–2021. Energies 2024, 17, 3332. [Google Scholar] [CrossRef]
- Peteleaza, D.; Matei, A.; Sorostinean, R.; Gellert, A.; Fiore, U.; Zamfirescu, B.C.; Palmieri, F. Electricity consumption forecasting for sustainable smart cities using machine learning methods. Internet Things 2024, 27, 101322. [Google Scholar] [CrossRef]
- Bibri, S.E.; Huang, J.; Jagatheesaperumal, S.K.; Krogstie, J. The synergistic interplay of artificial intelligence and digital twin in environmentally planning sustainable smart cities: A comprehensive systematic review. Environ. Sci. Ecotechnol. 2024, 20, 100433. [Google Scholar] [CrossRef]
- Bibri, S.E.; Alexandre, A.; Sharifi, A.; Krogstie, J. Environmentally sustainable smart cities and their converging A.I., IoT, and big data technologies and solutions: An integrated approach to an extensive literature review. Energy Inform. 2023, 6, 1–39. [Google Scholar] [CrossRef]
- Cugurullo, F.; Caprotti, F.; Cook, M.; Karvonen, A.; McGuirk, P.; Marvin, S. (Eds.) Artificial Intelligence and the City: Urbanistic Perspectives on AI; Taylor & Francis: Abingdon, UK, 2023. [Google Scholar]
- Gautam, C.K.; Das, N.; Kumar, R.; Kulhar, K.S. Short Review of Solar Energy Markets and Policies for Smart Cities Development. E3S Web Conf. EDP Sci. 2024, 540, 04002. [Google Scholar] [CrossRef]
- Nyangon, J. Smart energy frameworks for smart cities: The need for polycentrism. In Handbook of Smart Cities; Springer: Cham, Switzerland, 2020; pp. 1–33. [Google Scholar]
- Salama, R.; Al-Turjman, F. Sustainable energy production in smart cities. Sustainability 2023, 15, 16052. [Google Scholar] [CrossRef]
- Available online: https://ec.europa.eu/regional_policy/information-sources/maps_en (accessed on 20 June 2024).
- Gorzelak, G. Statystyczna analiza porównawcza—Teoria a praktyka. Wiadomości Stat. 1981, 8, 16–19. [Google Scholar]
- Grabiński, T. Metody Taksonometrii; Wydawnictwo Akademii Ekonomicznej w Krakowie: Kraków, Poland, 1992. [Google Scholar]
- Hellwig, Z. Zastosowanie metody taksonomicznej do typologicznego podziału krajów ze względu na poziom ich rozwoju oraz zasoby i strukturę wykwalifikowanych kadr. Przegląd Stat. 1968, 4, 307–327. [Google Scholar]
- Wesołowski, W.J. Programowanie Nowej Techniki; PWN: Warszawa, Poland, 1975; pp. 45–54. [Google Scholar]
- Kukuła, K. Metoda Unitaryzacji Zerowanej; PWN: Warszawa, Poland, 2000; p. 77. [Google Scholar]
- Lira, J.; Wagner, W.; Wysocki, F. Mediana w Zagadnieniach Porządkowania Obiektów Wielocechowych, w: Statystyka Regionalna w Służbie Samorządu Lokalnego i Biznesu; Internetowa Oficyna Wydawnicza Centrum Statystyki Regionalnej: Poznań, Poland, 2002; pp. 87–99. [Google Scholar]
- Pawełek, B. Metody normalizacji zmiennych w badaniach porównawczych złożonych zjawisk ekonomicznych. Zesz. Nauk. Uniw. Ekon. 2008, 187, 200. [Google Scholar]
- Młodak, A. Analiza Taksonomiczna w Statystyce Regionalnej; Centrum Doradztwa i Informacji Difin: Warszawa, Poland, 2006; pp. 66–78. [Google Scholar]
- Walesiak, M. Przegląd formuł normalizacji wartości zmiennych oraz ich własności w statystycznej analizie wielowymiarowej. Przegląd Stat. 2014, 4, 363–372. [Google Scholar] [CrossRef]
- Borys, T. Metody normowania cech w statystycznych badaniach porównawczych. Przegląd Stat. 1978, 2, 227–239. [Google Scholar]
- Grabiński, T. Wielowymiarowa Analiza Porównawcza w Badaniach Dynamiki Zjawisk Ekonomicznych; Akademia Ekonomiczna Kraków: Kraków, Poland, 1984; pp. 45–48. [Google Scholar]
- Abrahamowicz, M. Porządkowanie Obiektów w Wielowymiarowych Przestrzeniach Zmiennych Diagnostycznych; Akademia Ekonomiczna Kraków: Kraków, Poland, 1985; pp. 54–58. [Google Scholar]
- Issa Zadeh, S.B.; Garay-Rondero, C.L. Enhancing Urban Sustainability: Unravelling Carbon Footprint Reduction in Smart Cities through Modern Supply-Chain Measures. Smart Cities 2023, 6, 3225–3250. [Google Scholar] [CrossRef]


Disclaimer/Publisher’s Note: The statements, opinions and data contained in all publications are solely those of the individual author(s) and contributor(s) and not of MDPI and/or the editor(s). MDPI and/or the editor(s) disclaim responsibility for any injury to people or property resulting from any ideas, methods, instructions or products referred to in the content. |
© 2024 by the authors. Licensee MDPI, Basel, Switzerland. This article is an open access article distributed under the terms and conditions of the Creative Commons Attribution (CC BY) license (https://creativecommons.org/licenses/by/4.0/).