
Numerical Analysis of Leakage and Diffusion Characteristics of In-Situ Coal Gas with Complex Components


Abstract
:1. Introduction
2. Methods
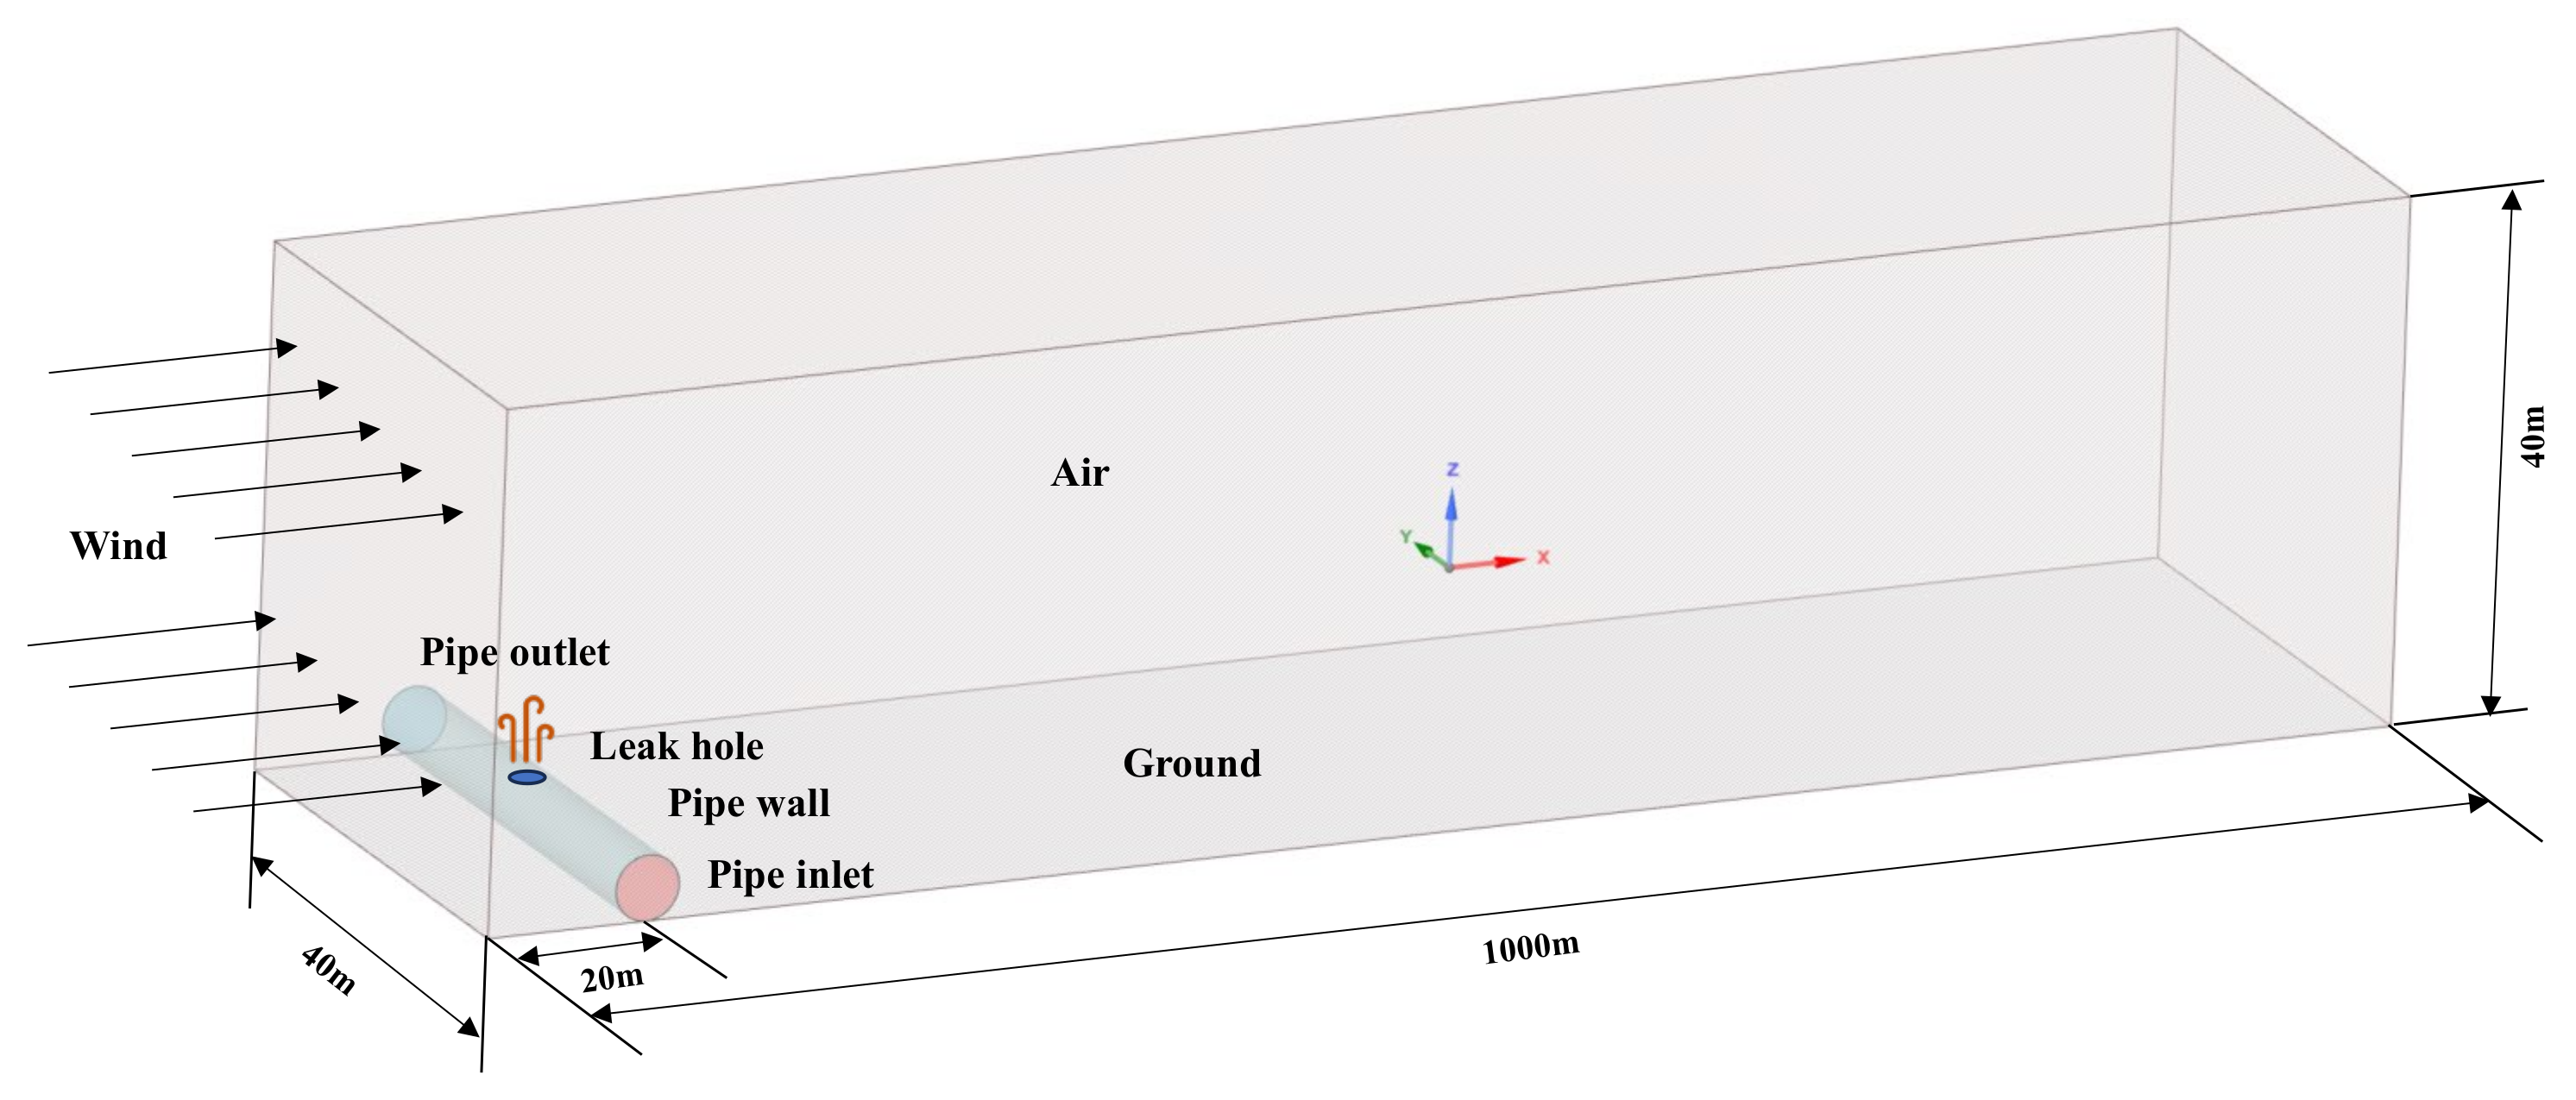
2.1. Physical Model
2.2. Mathematical Model
2.2.1. Control Equation
2.2.2. Component Transport Model
2.2.3. Turbulence Model
2.2.4. Pipe Leakage Model
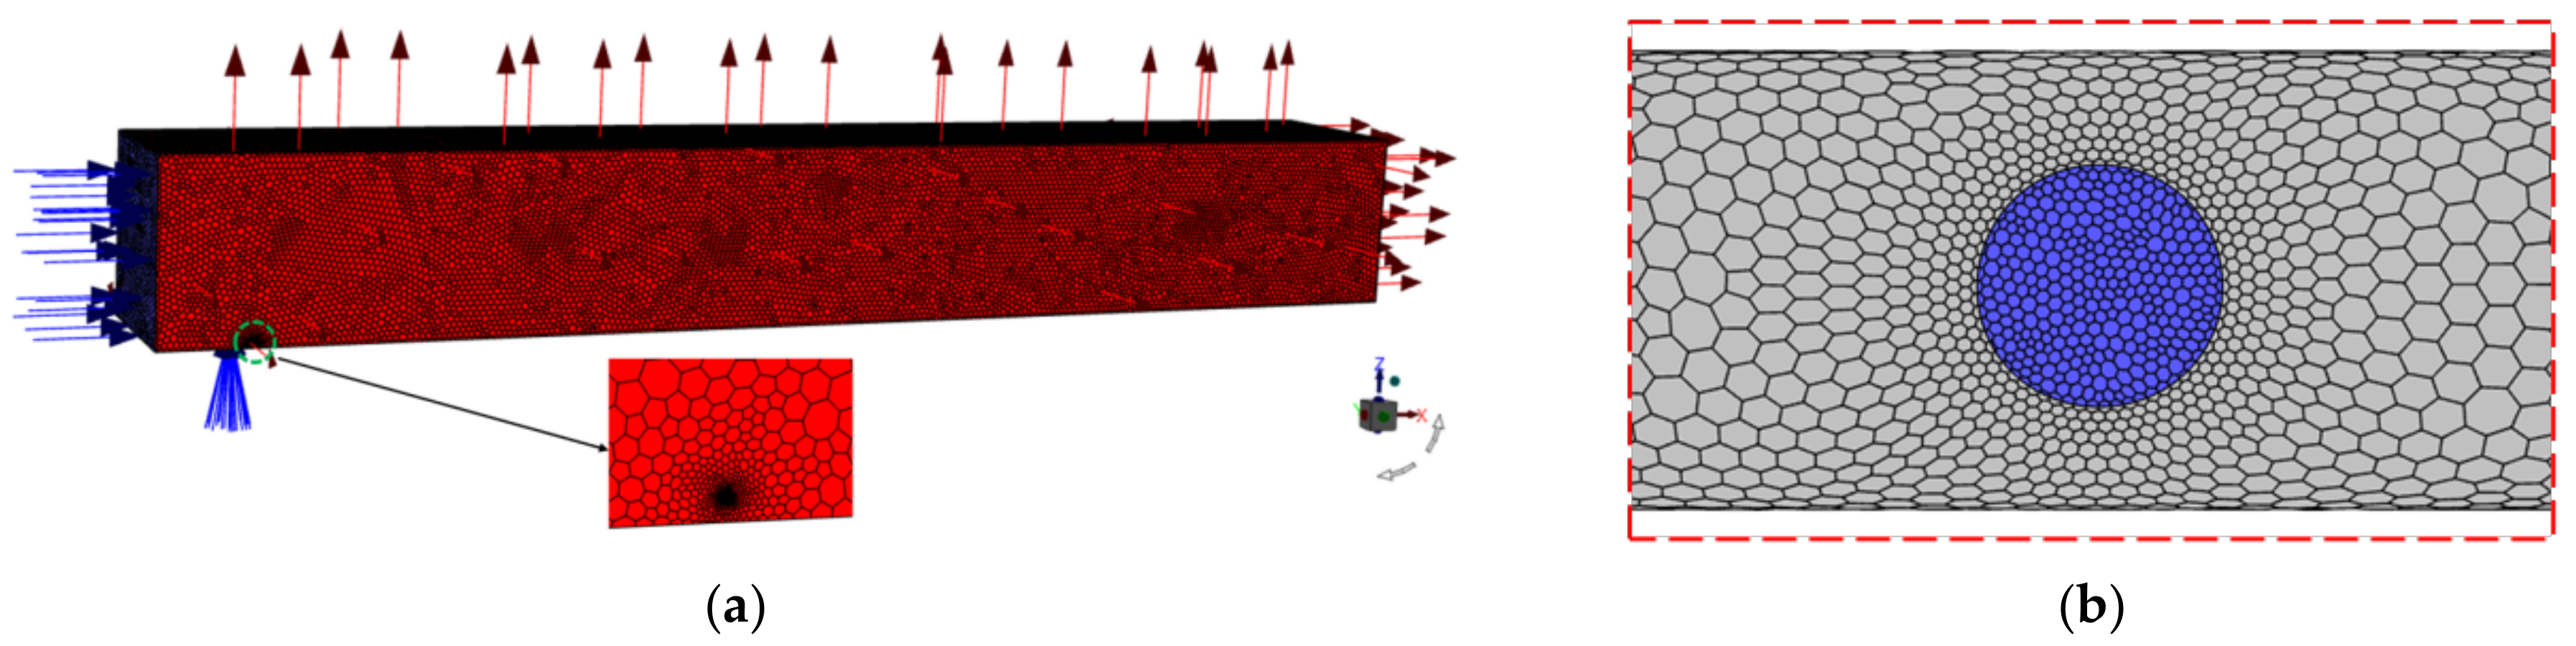
2.3. Boundary Conditions and Meshing
2.3.1. Boundary Conditions
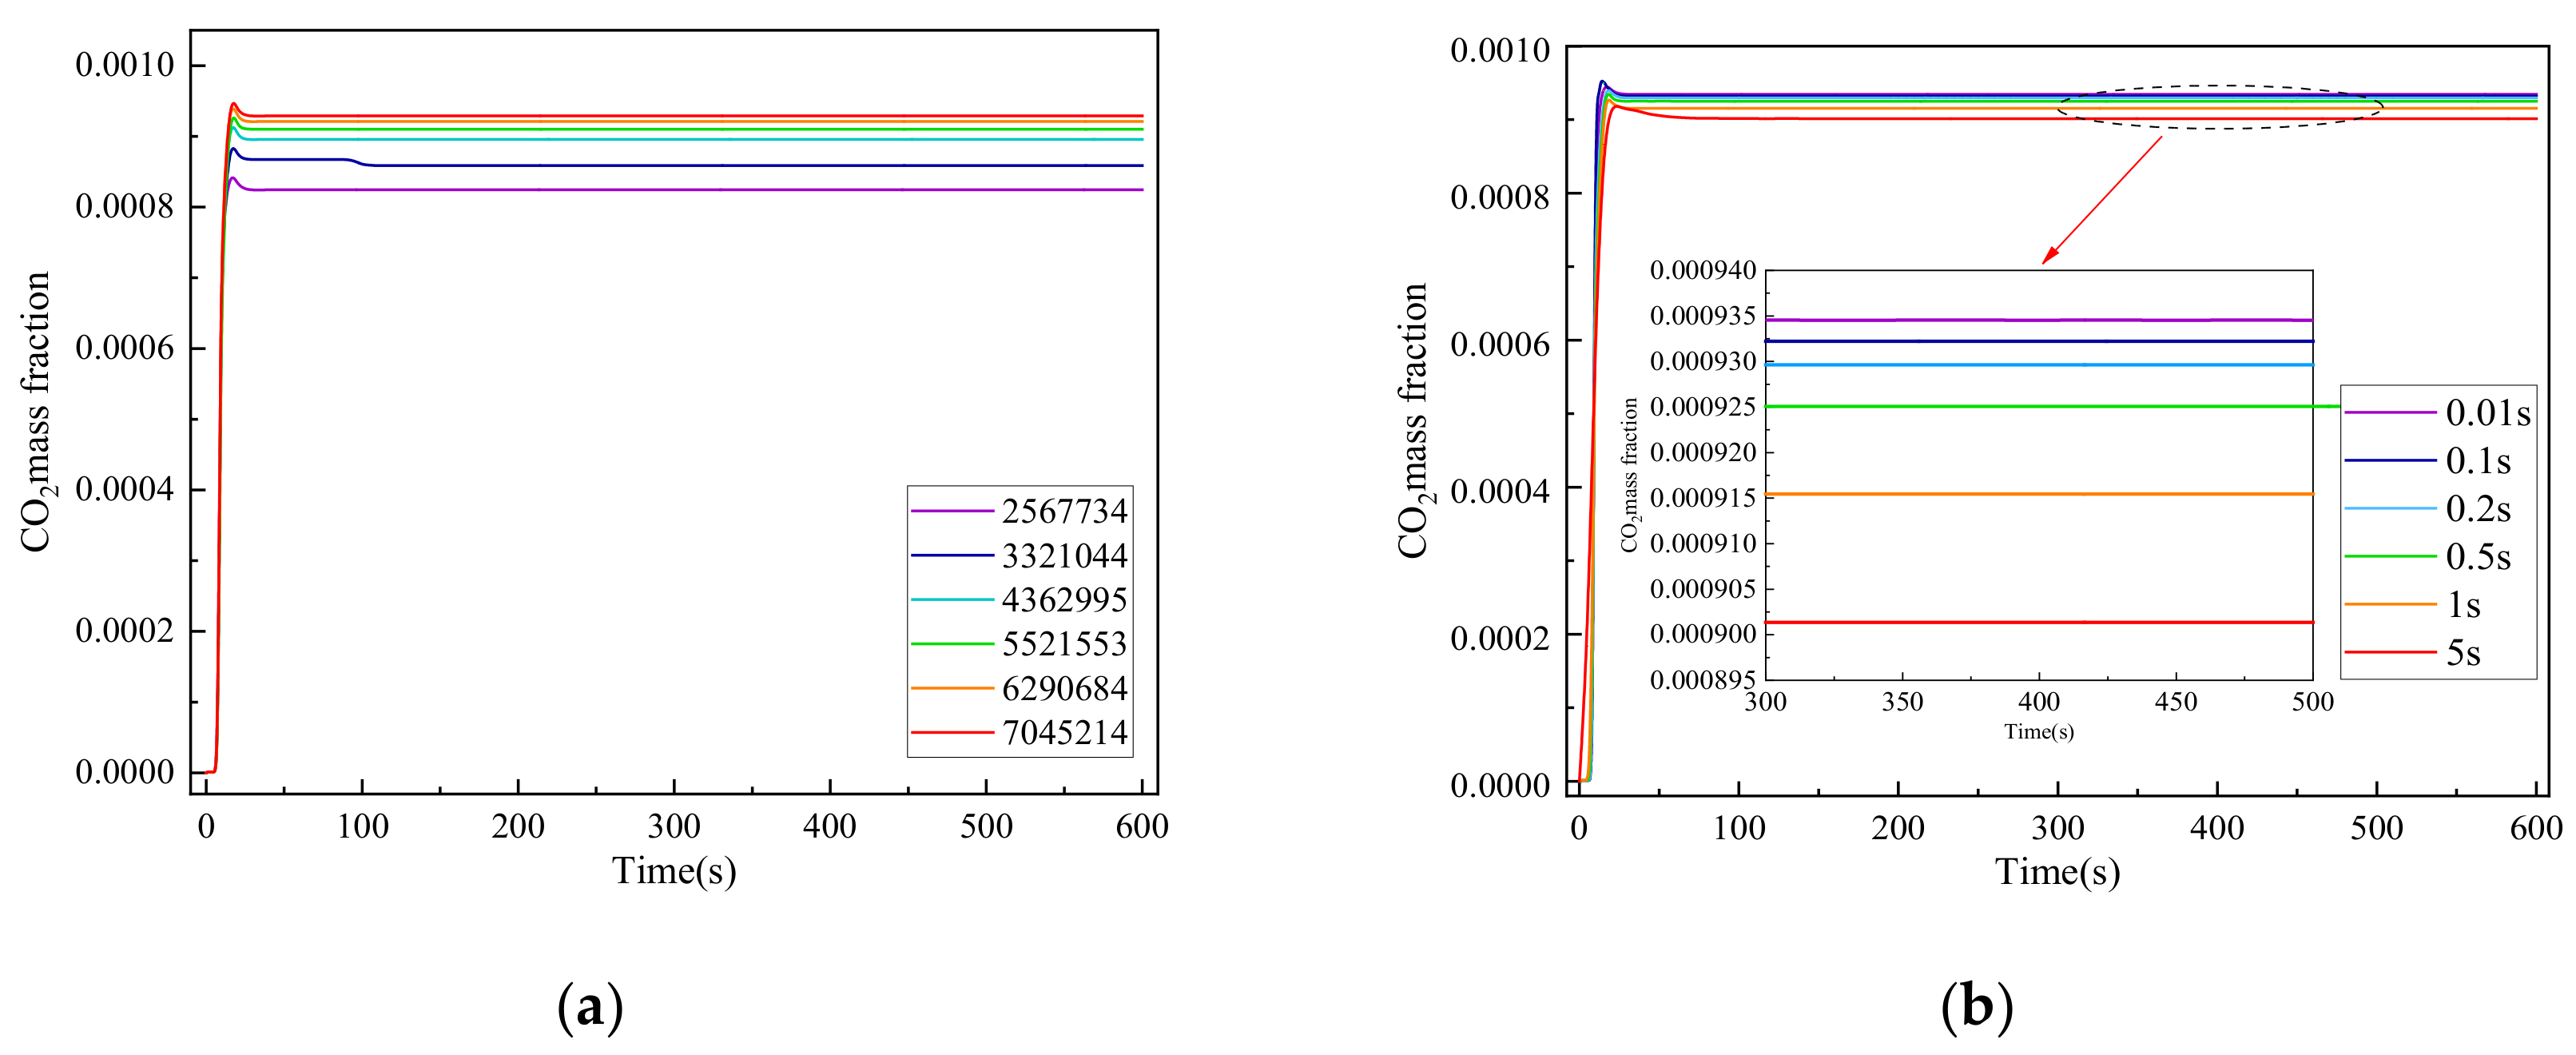
2.3.2. Grid Independent Verification
3. Results and Discussion
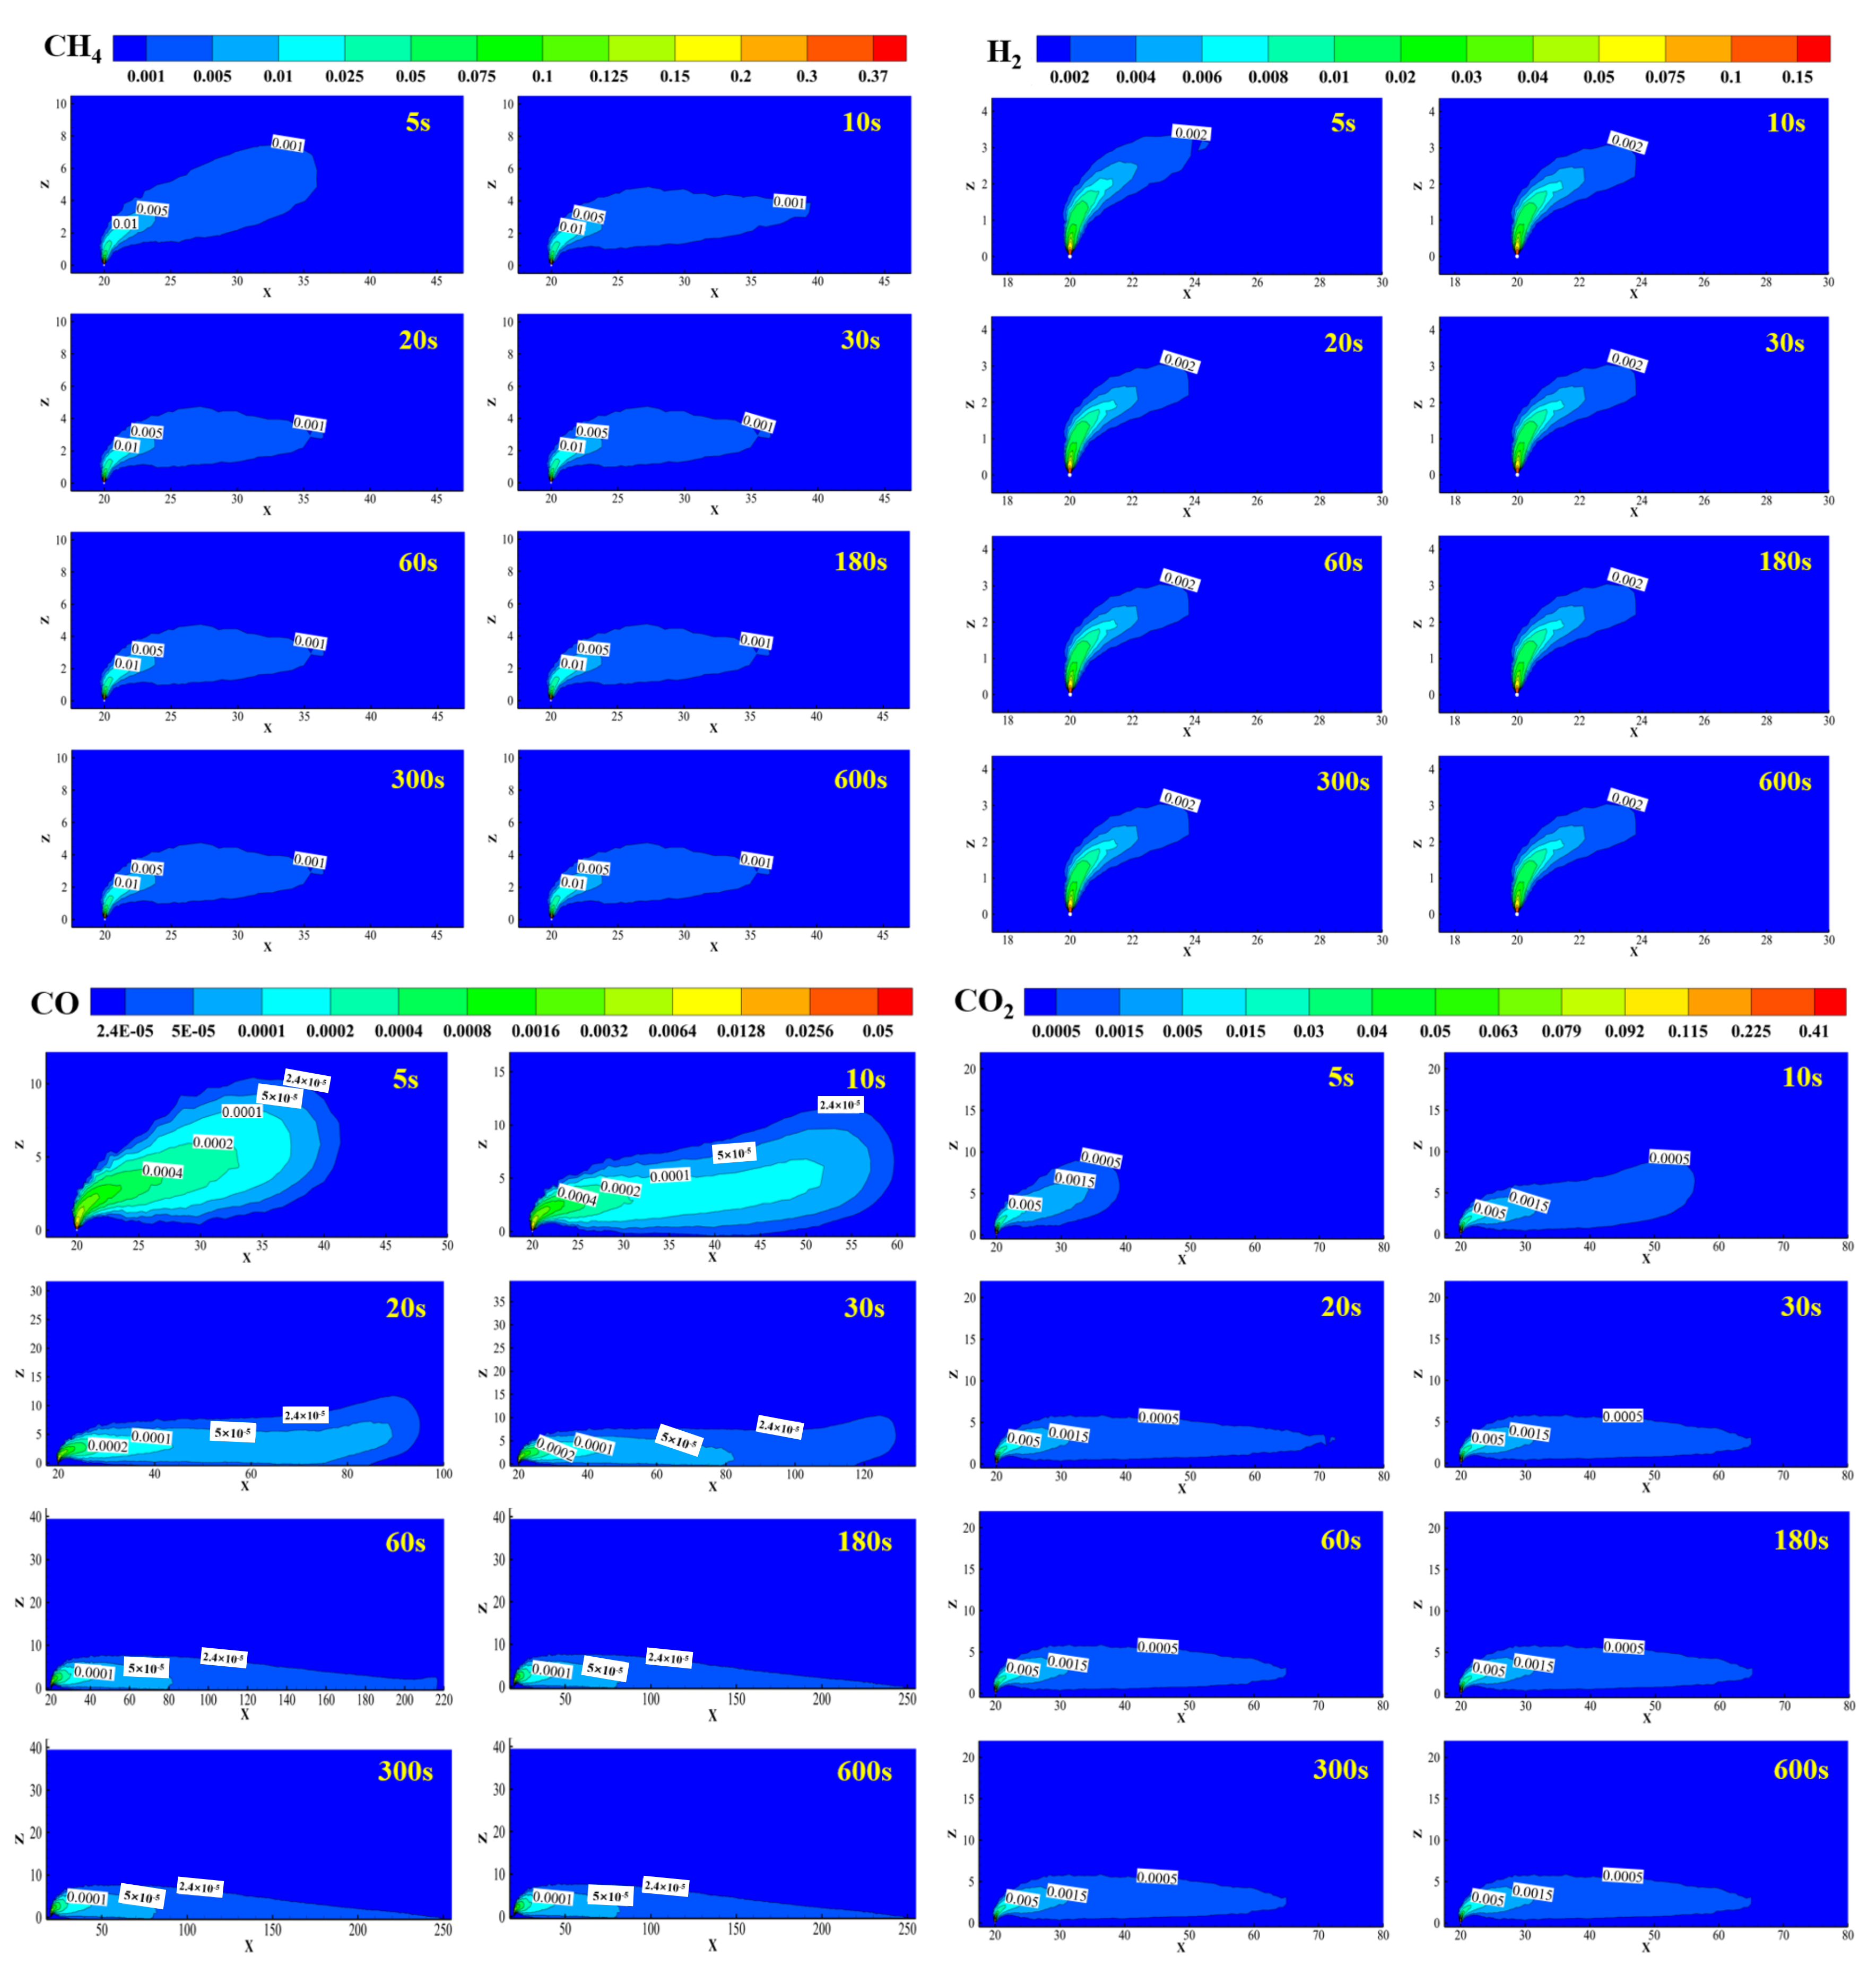
3.1. Investigation of the Diffusion Patterns in Standard Leakage Conditions
3.2. Influence of Wind Speed
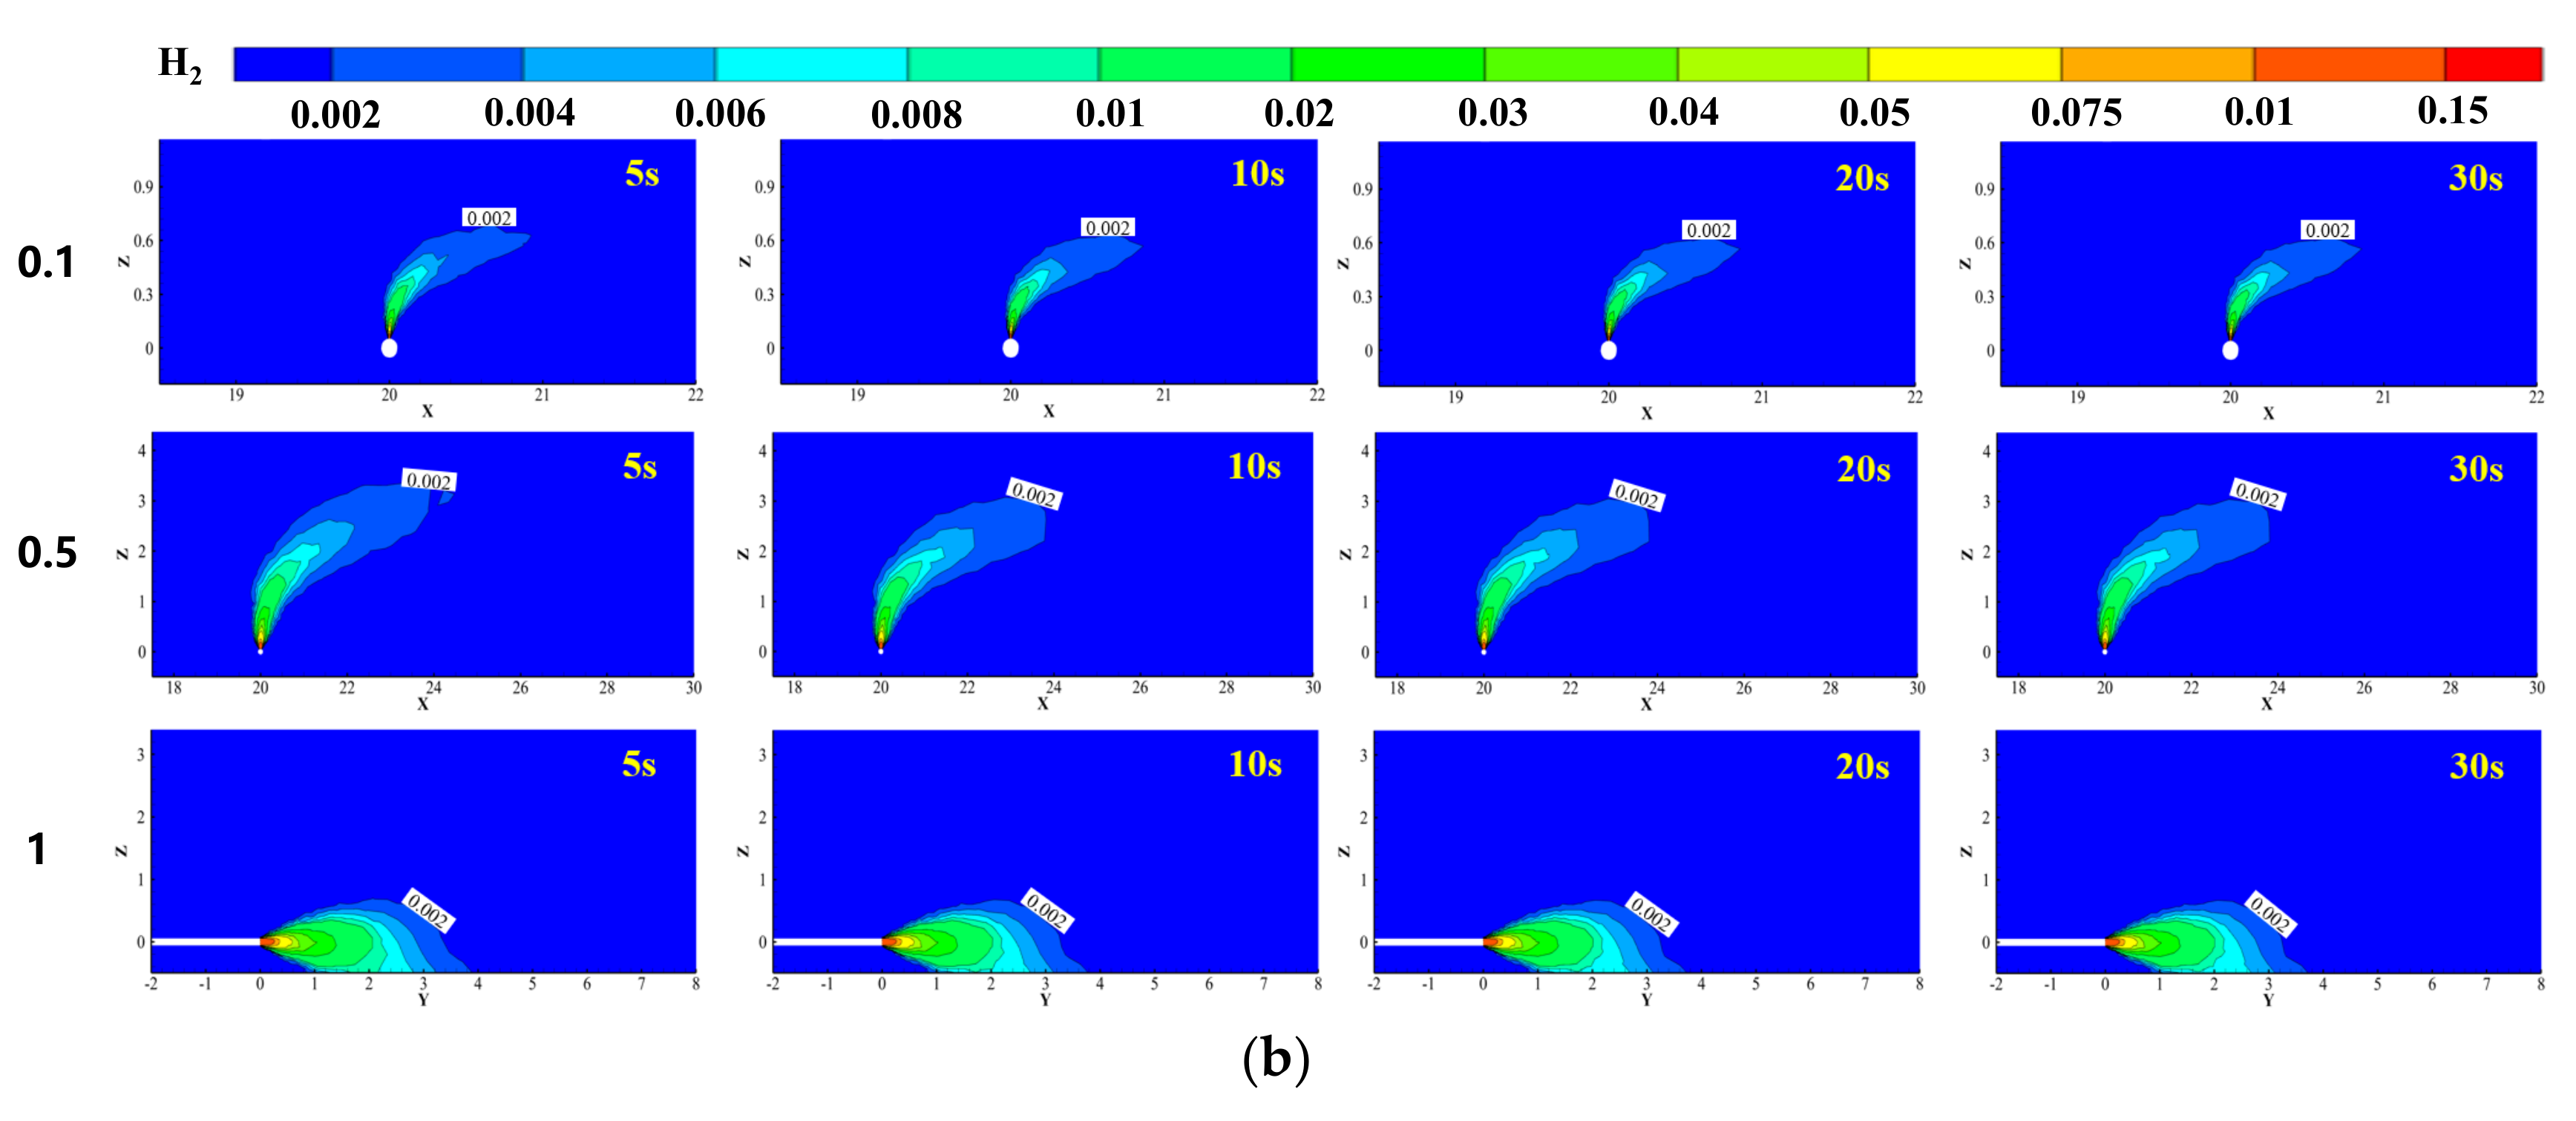
3.3. Influence of Leakage Direction
3.4. Influence of Temperature
3.5. Influence of Pipe Diameter
3.6. Influence of Leakage Aperture Ratio
4. Conclusions
Author Contributions
Funding
Data Availability Statement
Conflicts of Interest
Nomenclature
| Symbol | Meaning |
| ρ | Density |
| t | Time |
| ui | Velocity in the three directions of x, y, and z |
| E | Total energy of the microcluster |
| keff | Effective thermal conductivity |
| Jf | Diffusive flux of the components |
| Sk | Contribution from external heat sources |
| P | Operating pressure |
| g | Gravitational acceleration |
| Fi | Body force |
| Yi | Mass fraction of each component |
| Ri | Generation rate of each component |
| Diffusive flux of each component | |
| Gk | Turbulent kinetic energy induced by the mean velocity gradient |
| YM | Effect of the pulsating expansion of compressible turbulence on the total dissipation rate |
| Ti | Temperature at position i |
References
- Lau, H.C.; Wang, J.; Zhang, M. A flew Classification of Gas-Hydrate Deposits and Its Implications for Field-Development Potential. SPE J. 2021, 26, 3643–3667. [Google Scholar] [CrossRef]
- You, J.; Lee, K.J. The experimental investigation and data–driven modeling for thermal decomposition kinetics of Green River Shale. Fuel 2022, 320, 123899. [Google Scholar] [CrossRef]
- Ratnakar, R.R.; Gupta, N.; Zhang, K.; van Doorne, C.; Fesmire, J.; Dindoruk, B.; Balakotaiah, V. Hydrogen supply chain and challenges in large-scale LH2 storage and transportation. Int. J. Hydrogen Energy 2021, 46, 24149–24168. [Google Scholar] [CrossRef]
- Ren, X.; Dong, L.; Xu, D.; Hu, B. Challenges towards hydrogen economy in China. Int. J. Hydrogen Energy 2020, 45, 34326–34345. [Google Scholar] [CrossRef]
- Sun, Q.; Zhang, M.; Ertekin, T. The Design of Hydrogen Saline Aquifer Storage Processes Using a Machine-Learning Assisted Multiobjective Optimization Protocol. SPE J. 2024, 29, 2086–2105. [Google Scholar] [CrossRef]
- Delshad, M.; Alhotan, M.M.; Fernandes, B.R.B.; Umurzakov, Y.; Sepehrnoori, K. Modeling Flow and Transport in Saline Aquifers and Depleted Hydrocarbon Reservoirs for Hydrogen Energy Storage. SPE J. 2023, 28, 2547–2565. [Google Scholar] [CrossRef]
- Gillick, S.R.; Babaei, M. In-Situ Hydrogen Production from Natural Gas Wells with Subsurface Carbon Retention. SPE J. 2024, 29, 2119–2129. [Google Scholar] [CrossRef]
- You, J.; Lee, K.J. Pore-Scale Numerical Investigations of the Impact of Mineral Dissolution and Transport on the Heterogeneity of Fracture Systems during CO2-Enriched Brine Injection. SPE J. 2022, 27, 1379–1395. [Google Scholar] [CrossRef]
- Liu, Z.; Lin, X.; Wang, Z.; Zhang, Z.; Chen, R.; Wang, L.; Li, W. Modeling and experimental study on methane diffusivity in coal mass under in-situ high stress conditions: A better understanding of gas extraction. Fuel 2022, 321, 124078. [Google Scholar] [CrossRef]
- Baatar, L.; Mostaghimi, P.; Yuan, M.; Armstrong, R.T.; Adler, L.; Canbulat, I.; Si, G.; Gaidarov, B.; Jing, Y. Multiscale measurements of gas diffusion coefficient of coal using counter-diffusion and image-based methods. Int. J. Coal Geol. 2023, 265, 104155. [Google Scholar] [CrossRef]
- Wang, L.; Chen, J.; Ma, T.; Ma, R.; Bao, Y.; Fan, Z. Numerical study of leakage characteristics of hydrogen-blended natural gas in buried pipelines. Int. J. Hydrogen Energy 2024, 49, 1166–1179. [Google Scholar] [CrossRef]
- Shirazi, M.; Fuinhas, J.A. Portfolio decisions of primary energy sources and economic complexity: The world’s large energy user evidence. Renew. Energy 2023, 202, 347–361. [Google Scholar] [CrossRef]
- Nouri-Borujerdi, A.; Ziaei-Rad, M. Simulation of compressible flow in high pressure buried gas pipelines. Int. J. Heat Mass Transf. 2009, 52, 5751–5758. [Google Scholar] [CrossRef]
- Li, Y.; Wang, Z.; Shang, Z. Analysis and prediction of hydrogen-blended natural gas diffusion from various pipeline leakage sources based on CFD and ANN approach. Int. J. Hydrogen Energy 2024, 53, 535–549. [Google Scholar] [CrossRef]
- Berstad, T.; Dørum, C.; Jakobsen, J.P.; Kragset, S.; Li, H.; Lund, H.; Morin, A.; Munkejord, S.T.; Mølnvik, M.J.; Nordhagen, H.O.; et al. CO2 pipeline integrity: A new evaluation methodology. Energy Procedia 2011, 4, 3000–3007. [Google Scholar] [CrossRef]
- Morin, A.; Kragset, S.; Munkejord, S.T. Pipeline flow modelling with source terms due to leakage: The straw method. In Proceedings of the 6th Trondheim Conference on CO2 Capture, Transport and Storage (TCCS), Trondheim, Norway, 16–18 June 2012; pp. 226–235. [Google Scholar]
- Wu, T.; Jiang, N.; Zhou, C.; Luo, X.; Li, H.; Xia, Y. Dynamic response and safety assessment of buried gas pipe subjected to ground surface explosion. Int. J. Press. Vessel. Pip. 2021, 194, 104527. [Google Scholar] [CrossRef]
- Tong, S.; Li, X.; Ding, H.; Shuai, J.; Mei, Y.; Chan, S.H. Large-scale transient simulation for consequence analysis of hydrogen-doped natural gas leakage and explosion accidents. Int. J. Hydrogen Energy 2024, 54, 864–877. [Google Scholar] [CrossRef]
- Oke, A.; Mahgerefteh, H.; Economou, I.; Rykov, Y. A transient outflow model for pipeline puncture. Chem. Eng. Sci. 2003, 58, 4591–4604. [Google Scholar] [CrossRef]
- Ebrahimi-Moghadam, A.; Farzaneh-Gord, M.; Arabkoohsar, A.; Moghadam, A.J. CFD analysis of natural gas emission from damaged pipelines: Correlation development for leakage estimation. J. Clean. Prod. 2018, 199, 257–271. [Google Scholar] [CrossRef]
- Mahgerefteh, H.; Oke, A.; Atti, O. Modelling outflow following rupture in pipeline networks. Chem. Eng. Sci. 2006, 61, 1811–1818. [Google Scholar] [CrossRef]
- Scargiali, F.; Di Rienzo, E.; Ciofalo, M.; Grisafi, F.; Brucato, A. Heavy Gas Dispersion Modelling over a Topographically Complex Mesoscale: A CFD Based Approach. Process Saf. Environ. Prot. 2005, 83, 242–256. [Google Scholar] [CrossRef]
- Zhu, H.; Mao, Z.; Wang, Q.; Sun, J. The Influences of Key Factors on the Consequences Following the Natural Gas Leakage from Pipeline. Procedia Eng. 2013, 62, 592–601. [Google Scholar] [CrossRef]
- Liu, A.; Huang, J.; Li, Z.; Chen, J.; Huang, X.; Chen, K.; Xu, W.B. Numerical simulation and experiment on the law of urban natural gas leakage and diffusion for different building layouts. J. Nat. Gas. Sci. Eng. 2018, 54, 1–10. [Google Scholar] [CrossRef]
- Holborn, P.G.; Benson, C.M.; Ingram, J.M. Modelling hazardous distances for large-scale liquid hydrogen pool releases. Int. J. Hydrogen Energy 2020, 45, 23851–23871. [Google Scholar] [CrossRef]
- Wang, X.; Tan, Y.; Zhang, T.; Xiao, R.; Yu, K.; Zhang, J. Numerical study on the diffusion process of pinhole leakage of natural gas from underground pipelines to the soil. J. Nat. Gas. Sci. Eng. 2021, 87, 103792. [Google Scholar] [CrossRef]
- Zhu, J.; Pan, J.; Zhang, Y.; Li, Y.; Li, H.; Feng, H.; Chen, D.; Kou, Y.; Yang, R. Leakage and diffusion behavior of a buried pipeline of hydrogen-blended natural gas. Int. J. Hydrogen Energy 2023, 48, 11592–11610. [Google Scholar] [CrossRef]
- Lu, H.; Guo, B.; Chen, X.; Yao, J.; Liu, B. Numerical investigation on leakage and diffusion characteristics of buried hydrogen-blended natural gas pipelines. Int. J. Hydrogen Energy 2024, 59, 1491–1506. [Google Scholar] [CrossRef]
- Cao, Z.; Hu, Y.; Chen, L.; Yan, X.; Yu, S.; Yu, J. Experimental study of leakage characteristics and risk prediction of N2-containing dense-phase CO2 pipelines in real transportation conditions. Process Saf. Environ. Prot. 2024, 187, 1112–1125. [Google Scholar] [CrossRef]
- Zhang, B.; Chen, G.-m. Quantitative risk analysis of toxic gas release caused poisoning—A CFD and dose–response model combined approach. Process Saf. Environ. Prot. 2010, 88, 253–262. [Google Scholar] [CrossRef]
- Bagheri, M.; Alamdari, A.; Davoudi, M. Quantitative risk assessment of sour gas transmission pipelines using CFD. J. Nat. Gas. Sci. Eng. 2016, 31, 108–118. [Google Scholar] [CrossRef]
- Peng, S.; Zhang, Z.; Liu, E.; Liu, W.; Qiao, W. A new hybrid algorithm model for prediction of internal corrosion rate of multiphase pipeline. J. Nat. Gas. Sci. Eng. 2021, 85, 103716. [Google Scholar] [CrossRef]
- Liu, E.B.; Wang, X.J.; Zhao, W.W.; Su, Z.Y.; Chen, Q.K. Analysis and Research on Pipeline Vibration of a Natural Gas Compressor Station and Vibration Reduction Measures. Energy Fuels 2021, 35, 479–492. [Google Scholar] [CrossRef]
- Liu, E.; Lu, X.; Wang, D. A Systematic Review of Carbon Capture, Utilization and Storage: Status, Progress and Challenges. Energies 2023, 16, 2865. [Google Scholar] [CrossRef]
- Liu, E.-B.; Peng, Y.; Peng, S.-B.; Yu, B.; Chen, Q.-K. Research on low carbon emission optimization operation technology of natural gas pipeline under multi-energy structure. Pet. Sci. 2022, 19, 3046–3058. [Google Scholar] [CrossRef]
- Kou, B.; Liu, E.B.; Li, D.J.; Qiao, W.B.; Chen, R.L.; Peng, S.B. Research on Erosion Characteristics of the Sleeve-Type Blowdown Valve in the Shale Gas Gathering and Transportation Station. SPE J. 2024, 29, 328–345. [Google Scholar] [CrossRef]


| Component | CH4 | CO2 | CO | H2 | C2H6 |
|---|---|---|---|---|---|
| Mole fraction | 0.370 | 0.410 | 0.050 | 0.150 | 0.020 |
| Mass fraction | 0.226 | 0.686 | 0.530 | 0.012 | 0.023 |
| Location | Boundary Type |
|---|---|
| Hole | Velocity-Inlet |
| Pipeline | Wall |
| Left wall | Velocity-Inlet/Pressure-Outlet |
| Top wall | Pressure-Outlet |
| Right wall | Pressure-Outlet |
| Ground | Wall |
| Component | CH4 | C2H6 | H2 | CO | CO2 |
|---|---|---|---|---|---|
| LEL | 5% | 3% | 4% | 12.5% | - |
| OEL | - | - | - | 0.0024% | 0.05% |
| Threshold values for DEWB | 1% | 0.6% | 0.8% | 0.0024% | 0.05% |
Disclaimer/Publisher’s Note: The statements, opinions and data contained in all publications are solely those of the individual author(s) and contributor(s) and not of MDPI and/or the editor(s). MDPI and/or the editor(s) disclaim responsibility for any injury to people or property resulting from any ideas, methods, instructions or products referred to in the content. |
© 2024 by the authors. Licensee MDPI, Basel, Switzerland. This article is an open access article distributed under the terms and conditions of the Creative Commons Attribution (CC BY) license (https://creativecommons.org/licenses/by/4.0/).
Share and Cite
Liu, E.; Zhou, L.; Tang, P.; Kou, B.; Li, X.; Lu, X. Numerical Analysis of Leakage and Diffusion Characteristics of In-Situ Coal Gas with Complex Components. Energies 2024, 17, 4694. https://doi.org/10.3390/en17184694
Liu E, Zhou L, Tang P, Kou B, Li X, Lu X. Numerical Analysis of Leakage and Diffusion Characteristics of In-Situ Coal Gas with Complex Components. Energies. 2024; 17(18):4694. https://doi.org/10.3390/en17184694
Chicago/Turabian StyleLiu, Enbin, Lianle Zhou, Ping Tang, Bo Kou, Xi Li, and Xudong Lu. 2024. "Numerical Analysis of Leakage and Diffusion Characteristics of In-Situ Coal Gas with Complex Components" Energies 17, no. 18: 4694. https://doi.org/10.3390/en17184694