Article

Determination of the Temperature Development in a Borehole Heat Exchanger Field Using Distributed Temperature Sensing

GeoZentrum Nordbayern, Chair of Geology, Friedrich-Alexander-Universität Erlangen-Nürnberg, Schlossgarten 5, 91054 Erlangen, Germany
*
Author to whom correspondence should be addressed.
Energies 2024, 17(18), 4697; https://doi.org/10.3390/en17184697
Submission received: 2 September 2024 / Revised: 16 September 2024 / Accepted: 19 September 2024 / Published: 20 September 2024
(This article belongs to the Section H2: Geothermal)

Abstract

:
The use of geothermal borehole heat exchangers (BHEs) in combination with ground-source heat pumps represents an important part of shallow geothermal energy production, which is already used worldwide and becoming more and more important. Different measurement techniques are available to examine a BHE field while it is in operation. In this study, a field with 54 BHEs up to a depth of 120 m below ground level was analyzed using fiber optic cables. A distributed temperature sensing (DTS) concept was developed by equipping several BHEs with dual-ended hybrid cables. The individual fiber optics were collected in a distributor shaft, and multiple measurements were carried out during active and inactive operation of the field. The field trial was carried out on a converted, partly retrofitted, residential complex, “Lagarde Campus”, in Bamberg, Upper Franconia, Germany. Groundwater and lithological changes are visible in the depth-resolved temperature profiles throughout the whole BHE field.

1. Introduction

In order to improve the efficiency of a geothermal system, it is important to understand and monitor the thermal processes in the ground. In the case of borehole heat exchangers (BHEs), there are various options for analyzing the underground parameters. To determine the thermal conductivity for the planning of a BHE field, normal thermal response tests (TRTs) are generally used on single pilot BHEs. However, these only reflect the effective thermal conductivity of the entire BHE with one value and can be subject to errors if the lithology is heterogeneous or different groundwater conditions occur [1,2,3]. Other approaches can be laboratory tests on rocks and soil, e.g., by using a thermal conductivity scanner [4,5,6], thermal property analyzers with needle probes [7] or the usage of existing resources, e.g., [8,9,10], standards [11,12] or mapping tools [13,14] and tools of national Geological Surveys. Laboratory tests can be expensive and are not possible in many cases because sampling is not possible for reasons such as the chosen drilling method. The use of standards and reference values entails too much uncertainty in planning and should only be used for small systems with an output of less than 30 kW [12].

1.1. Thermal Properties

Knowledge of the undisturbed ground temperature is important for carrying out the TRT. This is usually determined using a pressure–temperature (P-T) data logger which is inserted into the borehole as in, e.g., [15]. The disadvantage here is that only a few measurements can be carried out on open BHEs before they are connected to a geothermal energy grid. In combination with the insufficient data on the effective thermal conductivity, the use of a distributed temperature-measuring chain within the borehole is advantageous. This method can be carried out in different ways, either with an external heating element and a fluid pump system together with a sensor-measuring chain system (e.g., Pt-100) [16] or by using a combined hybrid fiber optic cable that uses integrated copper wires as a heating source and enables in situ heating. Further innovative methods, e.g., Geowire, Geoball or GeoSniff® (enOware, Karlsruhe, Germany), are showing promising characteristics [17,18,19] but must be evaluated for each individual application. In the “Multisource” research project [20], we opted for fiber optics and were given the opportunity to carry out measurements using distributed temperature sensing (DTS) in an actively operated BHE. The use of this fiber optic cable technology for temperature measurements in a geothermal well was first carried out in the late 1980s in Hawaii [21] and was improved together with enhanced (geo)thermal response tests (eGRTs) in various studies [22,23,24,25,26,27] to provide a good basis for applied research.

1.2. District Heating Cooling Network of “Lagarde Campus”

The analyzed BHE field in Bamberg was fitted with hybrid fiber optic cables during the construction and transformation stage of a former military site into a residential complex. The examined BHE field delivers 200 kW of heating and 130 kW of cooling output and is part of a fifth-generation district heating cooling network (5GDHC) [28]. It is connected to further (geo)thermal systems such as a wastewater heat exchanger with 1 MW heat source output in dry discharge, 32,000 m2 of horizontal ground heat exchangers with 1.8 MW heat source output and two further BHE fields with 40 and 20 BHEs of 120 m length each in planning. The different systems are collected in an energy central to a bidirectional uninsulated DHC pipe, which is laid to the residential buildings, where the ground-source heat pumps (GSHPs) are placed. This decentralized system supplies a total of 1200 residential units and several commercial properties.

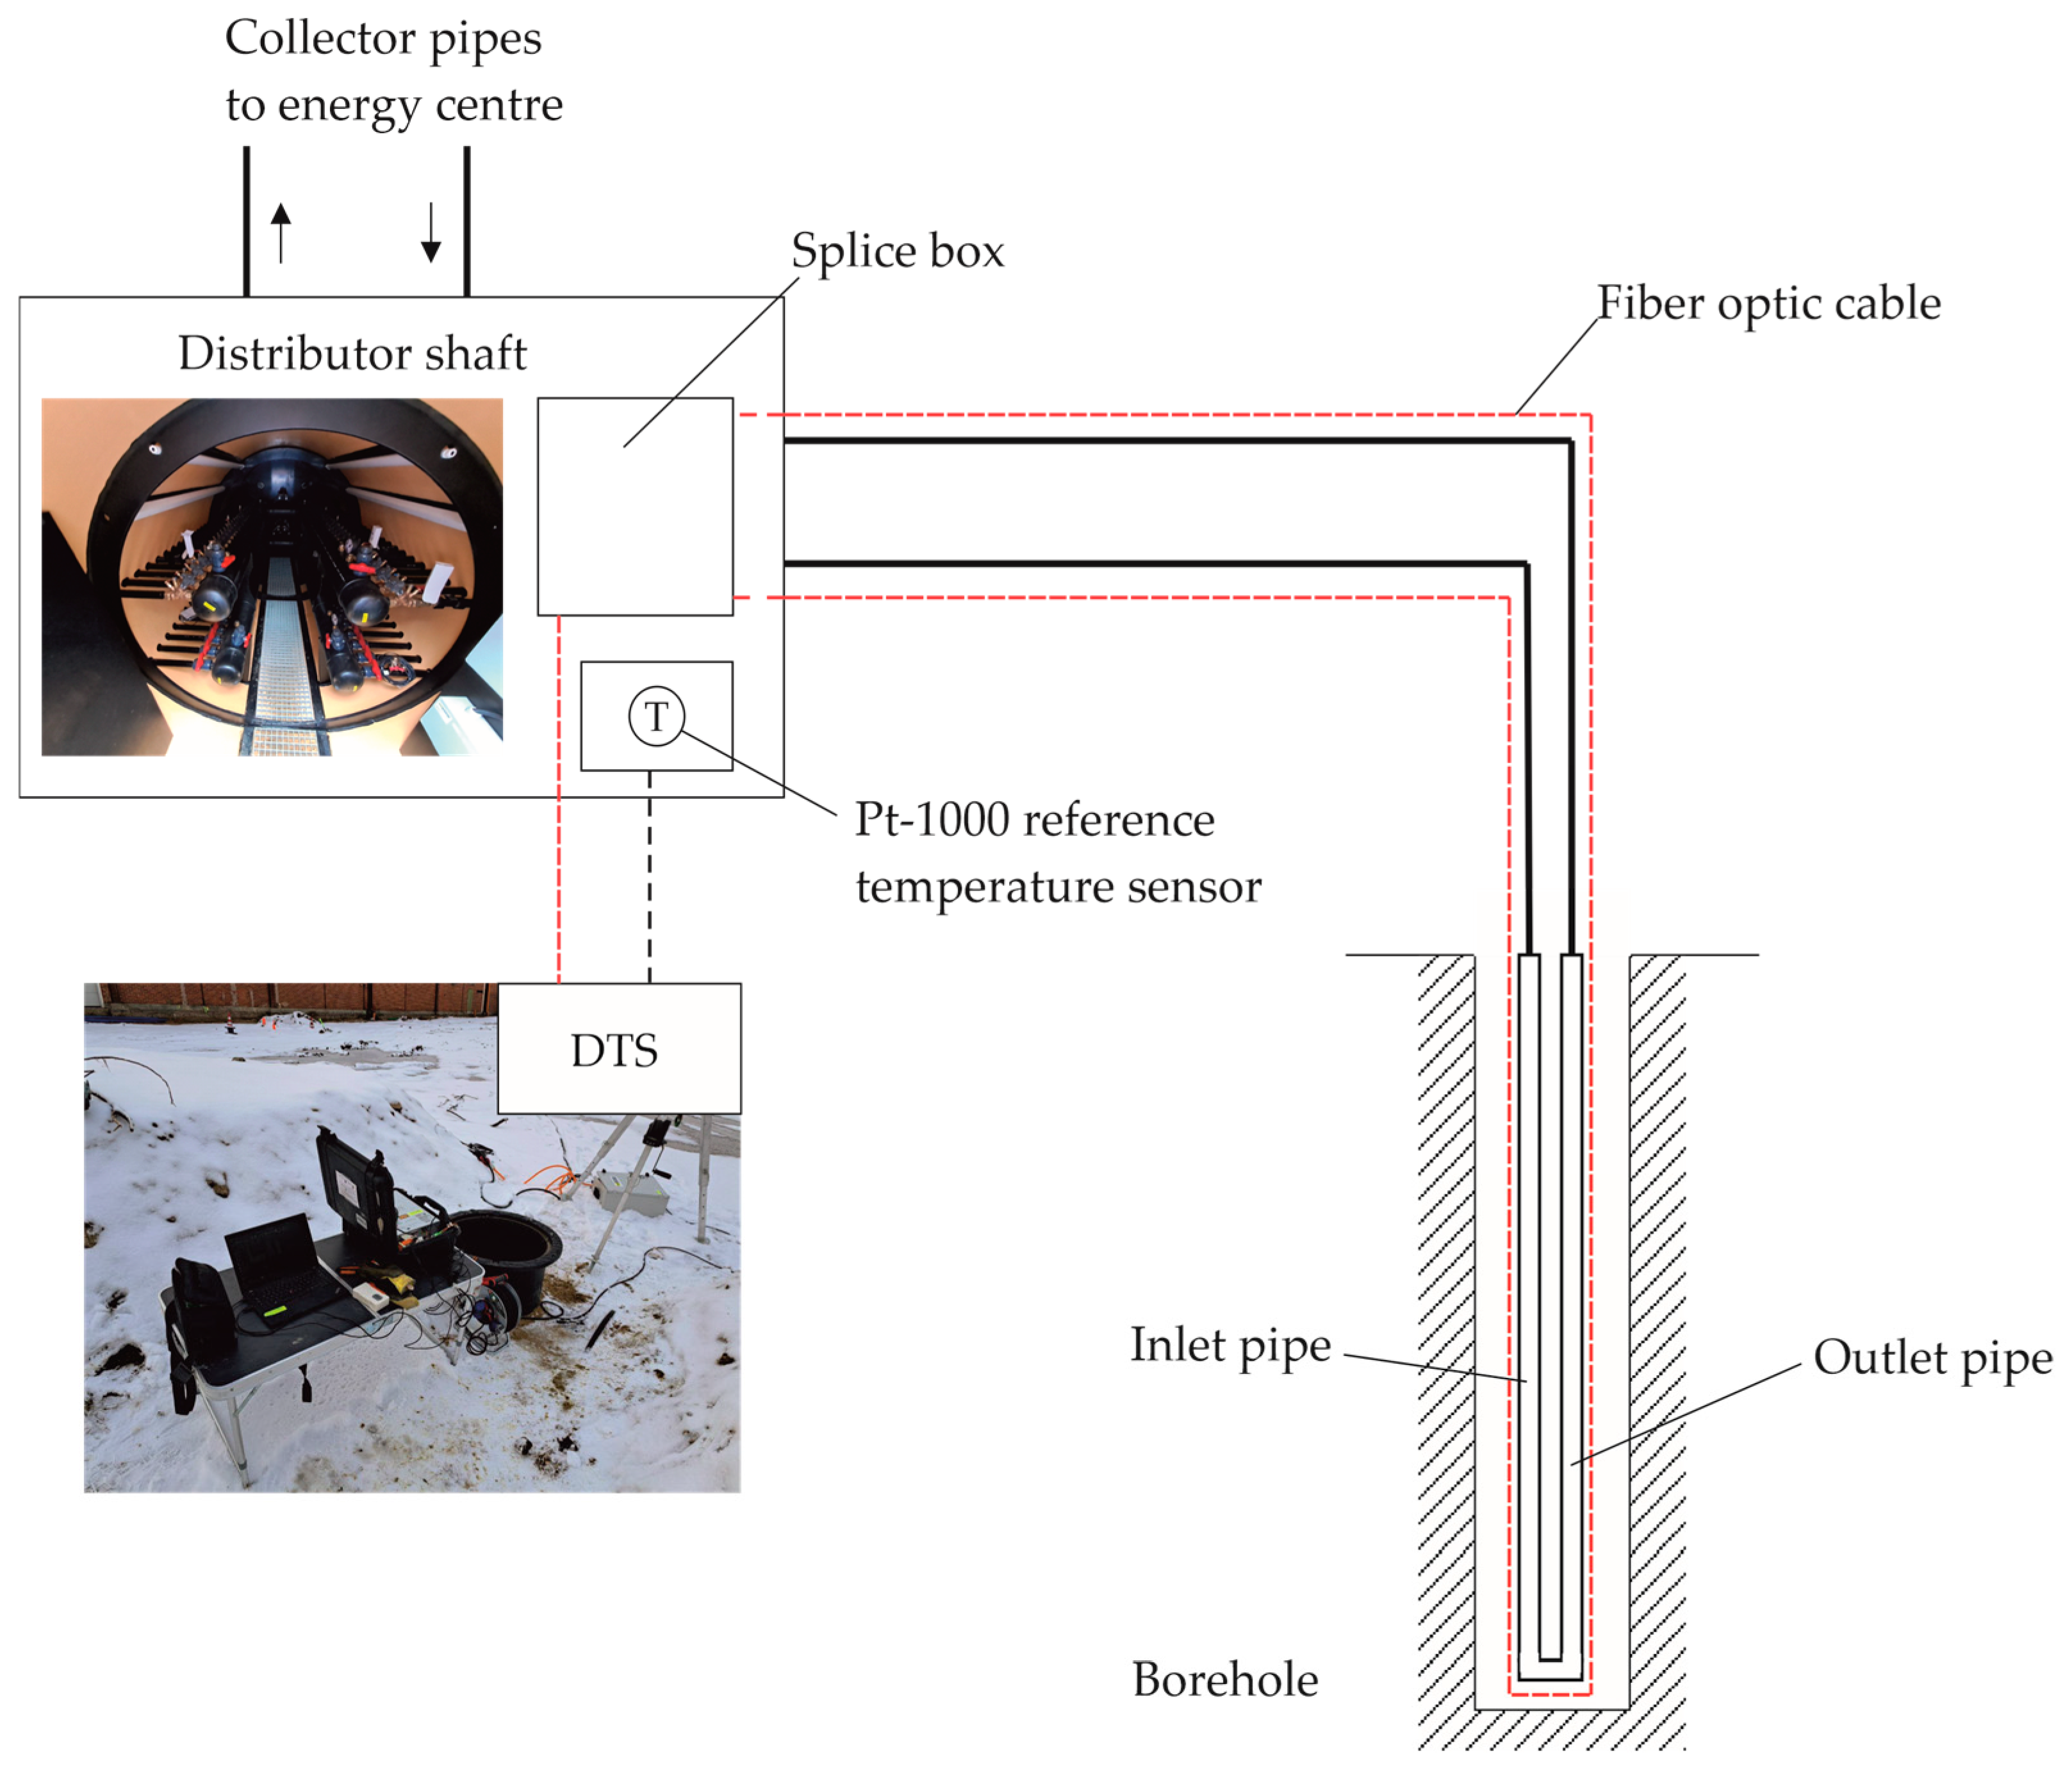
2. Monitoring Concept
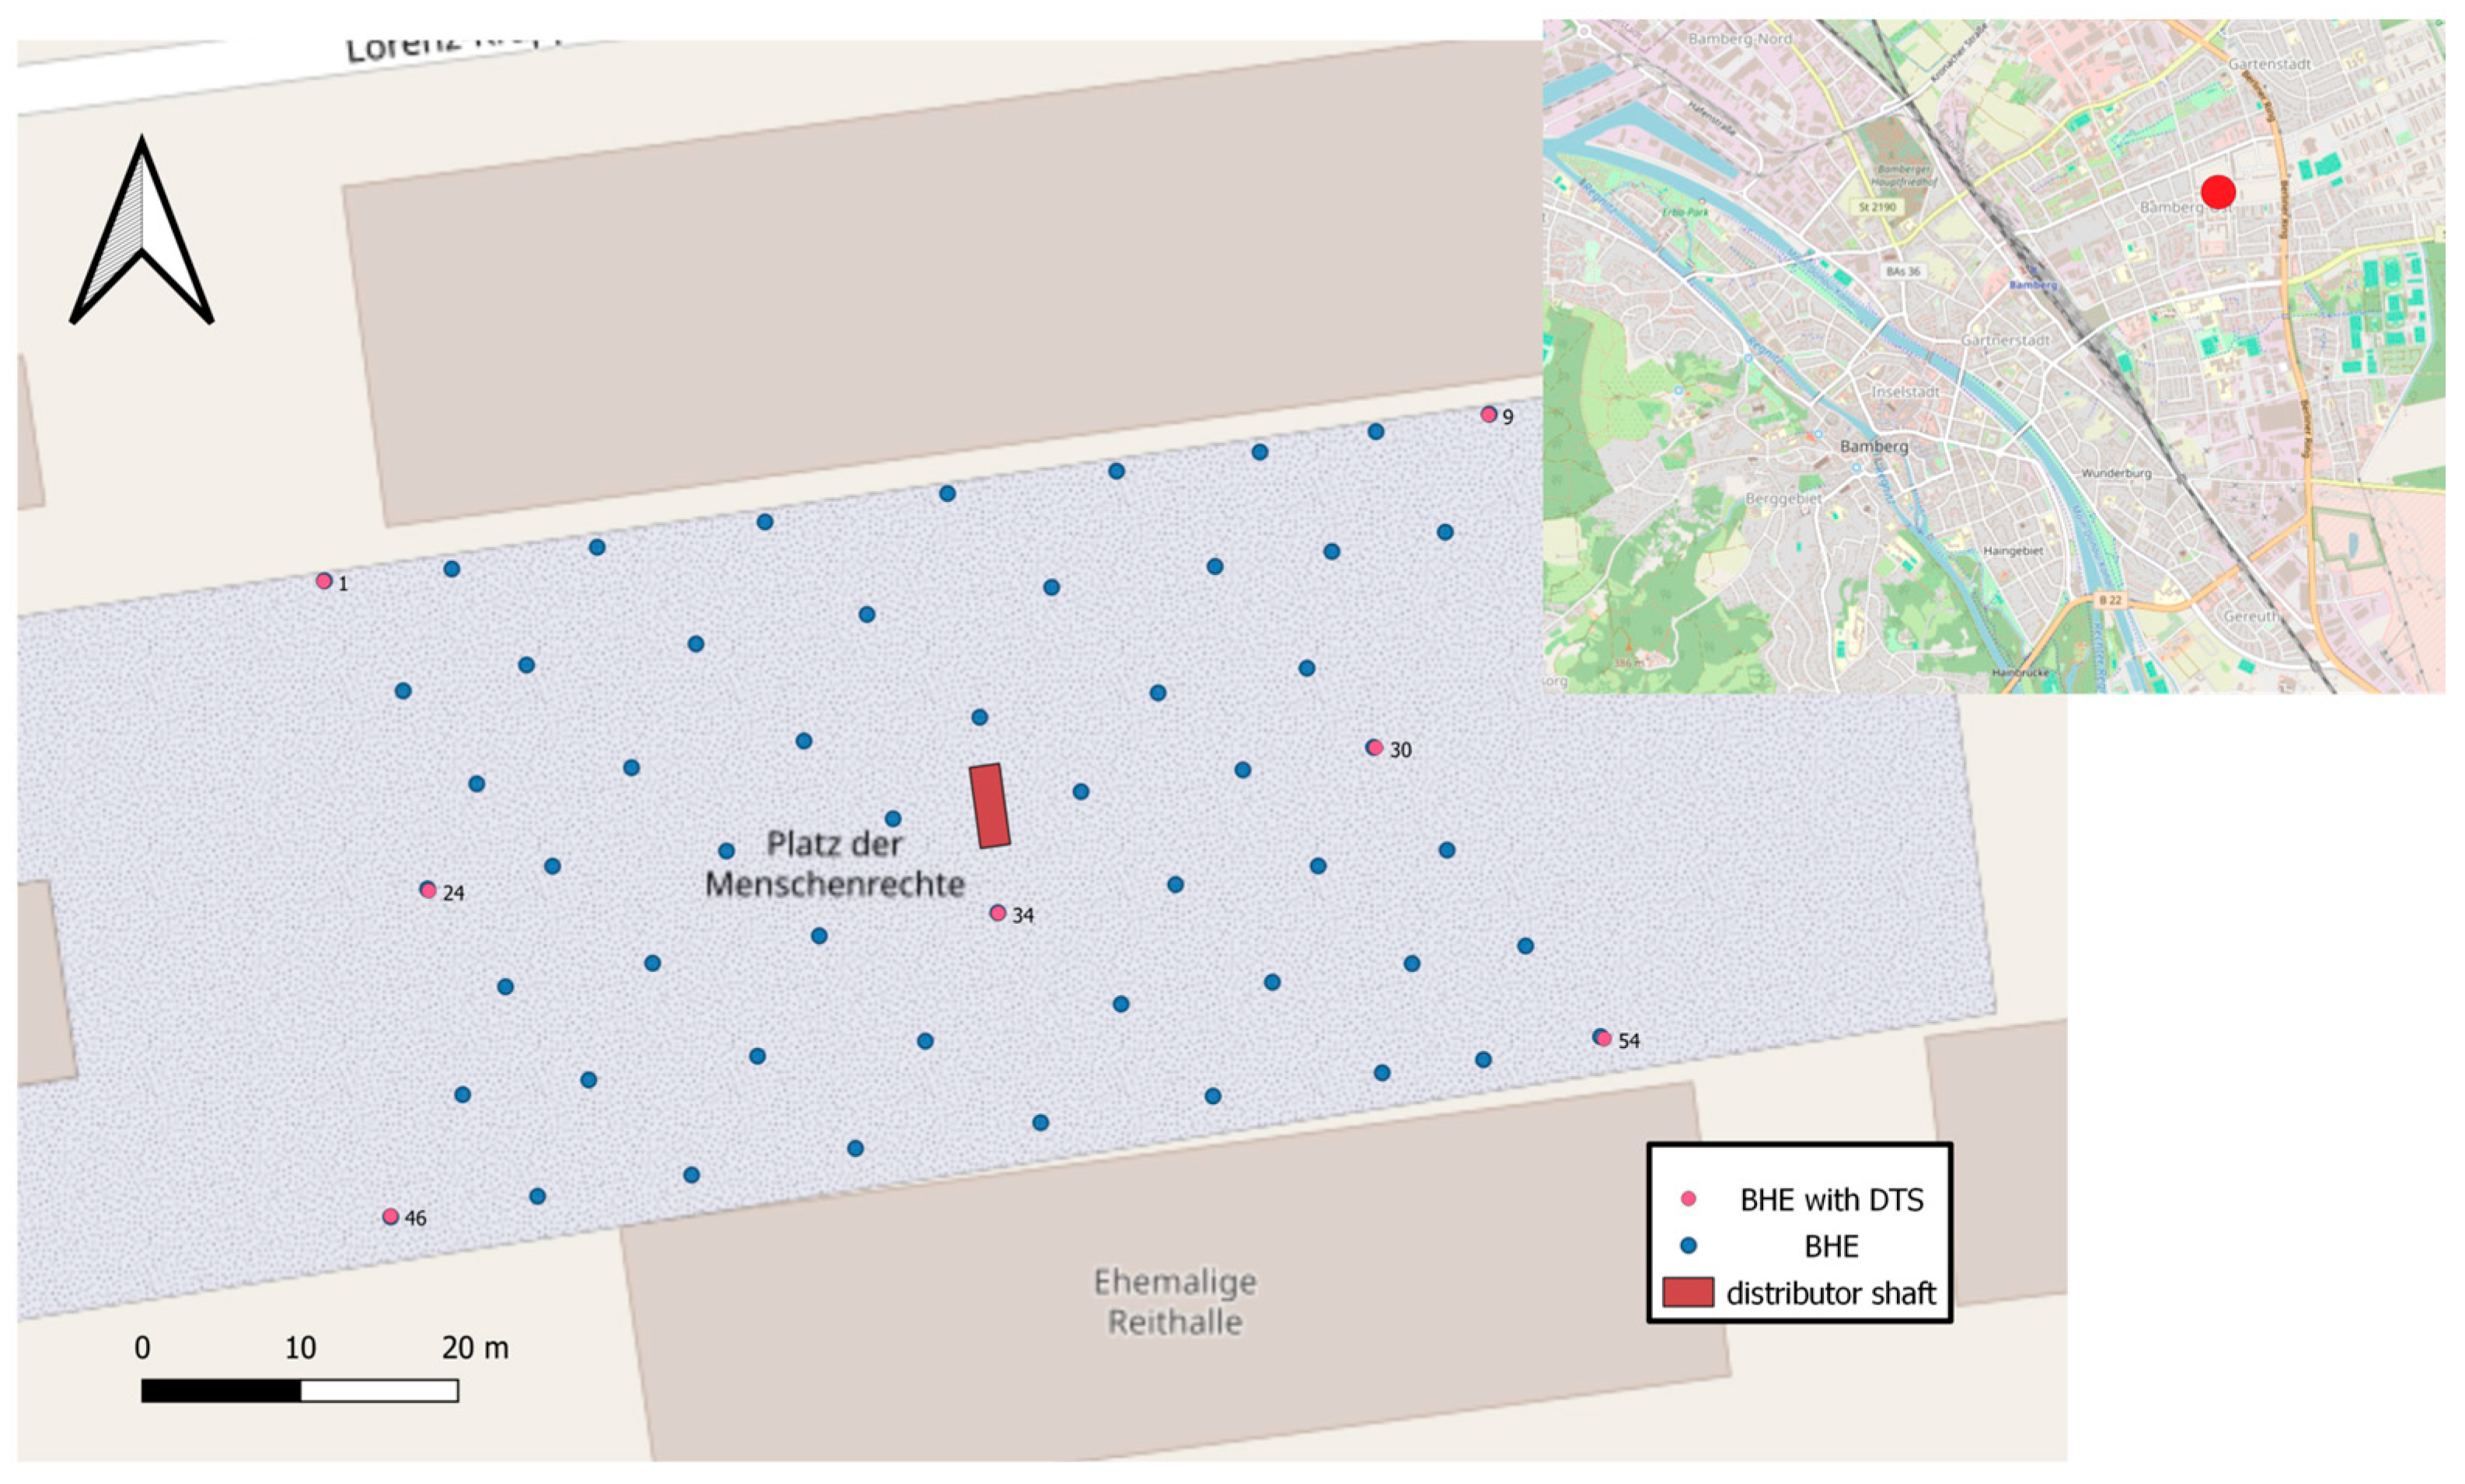
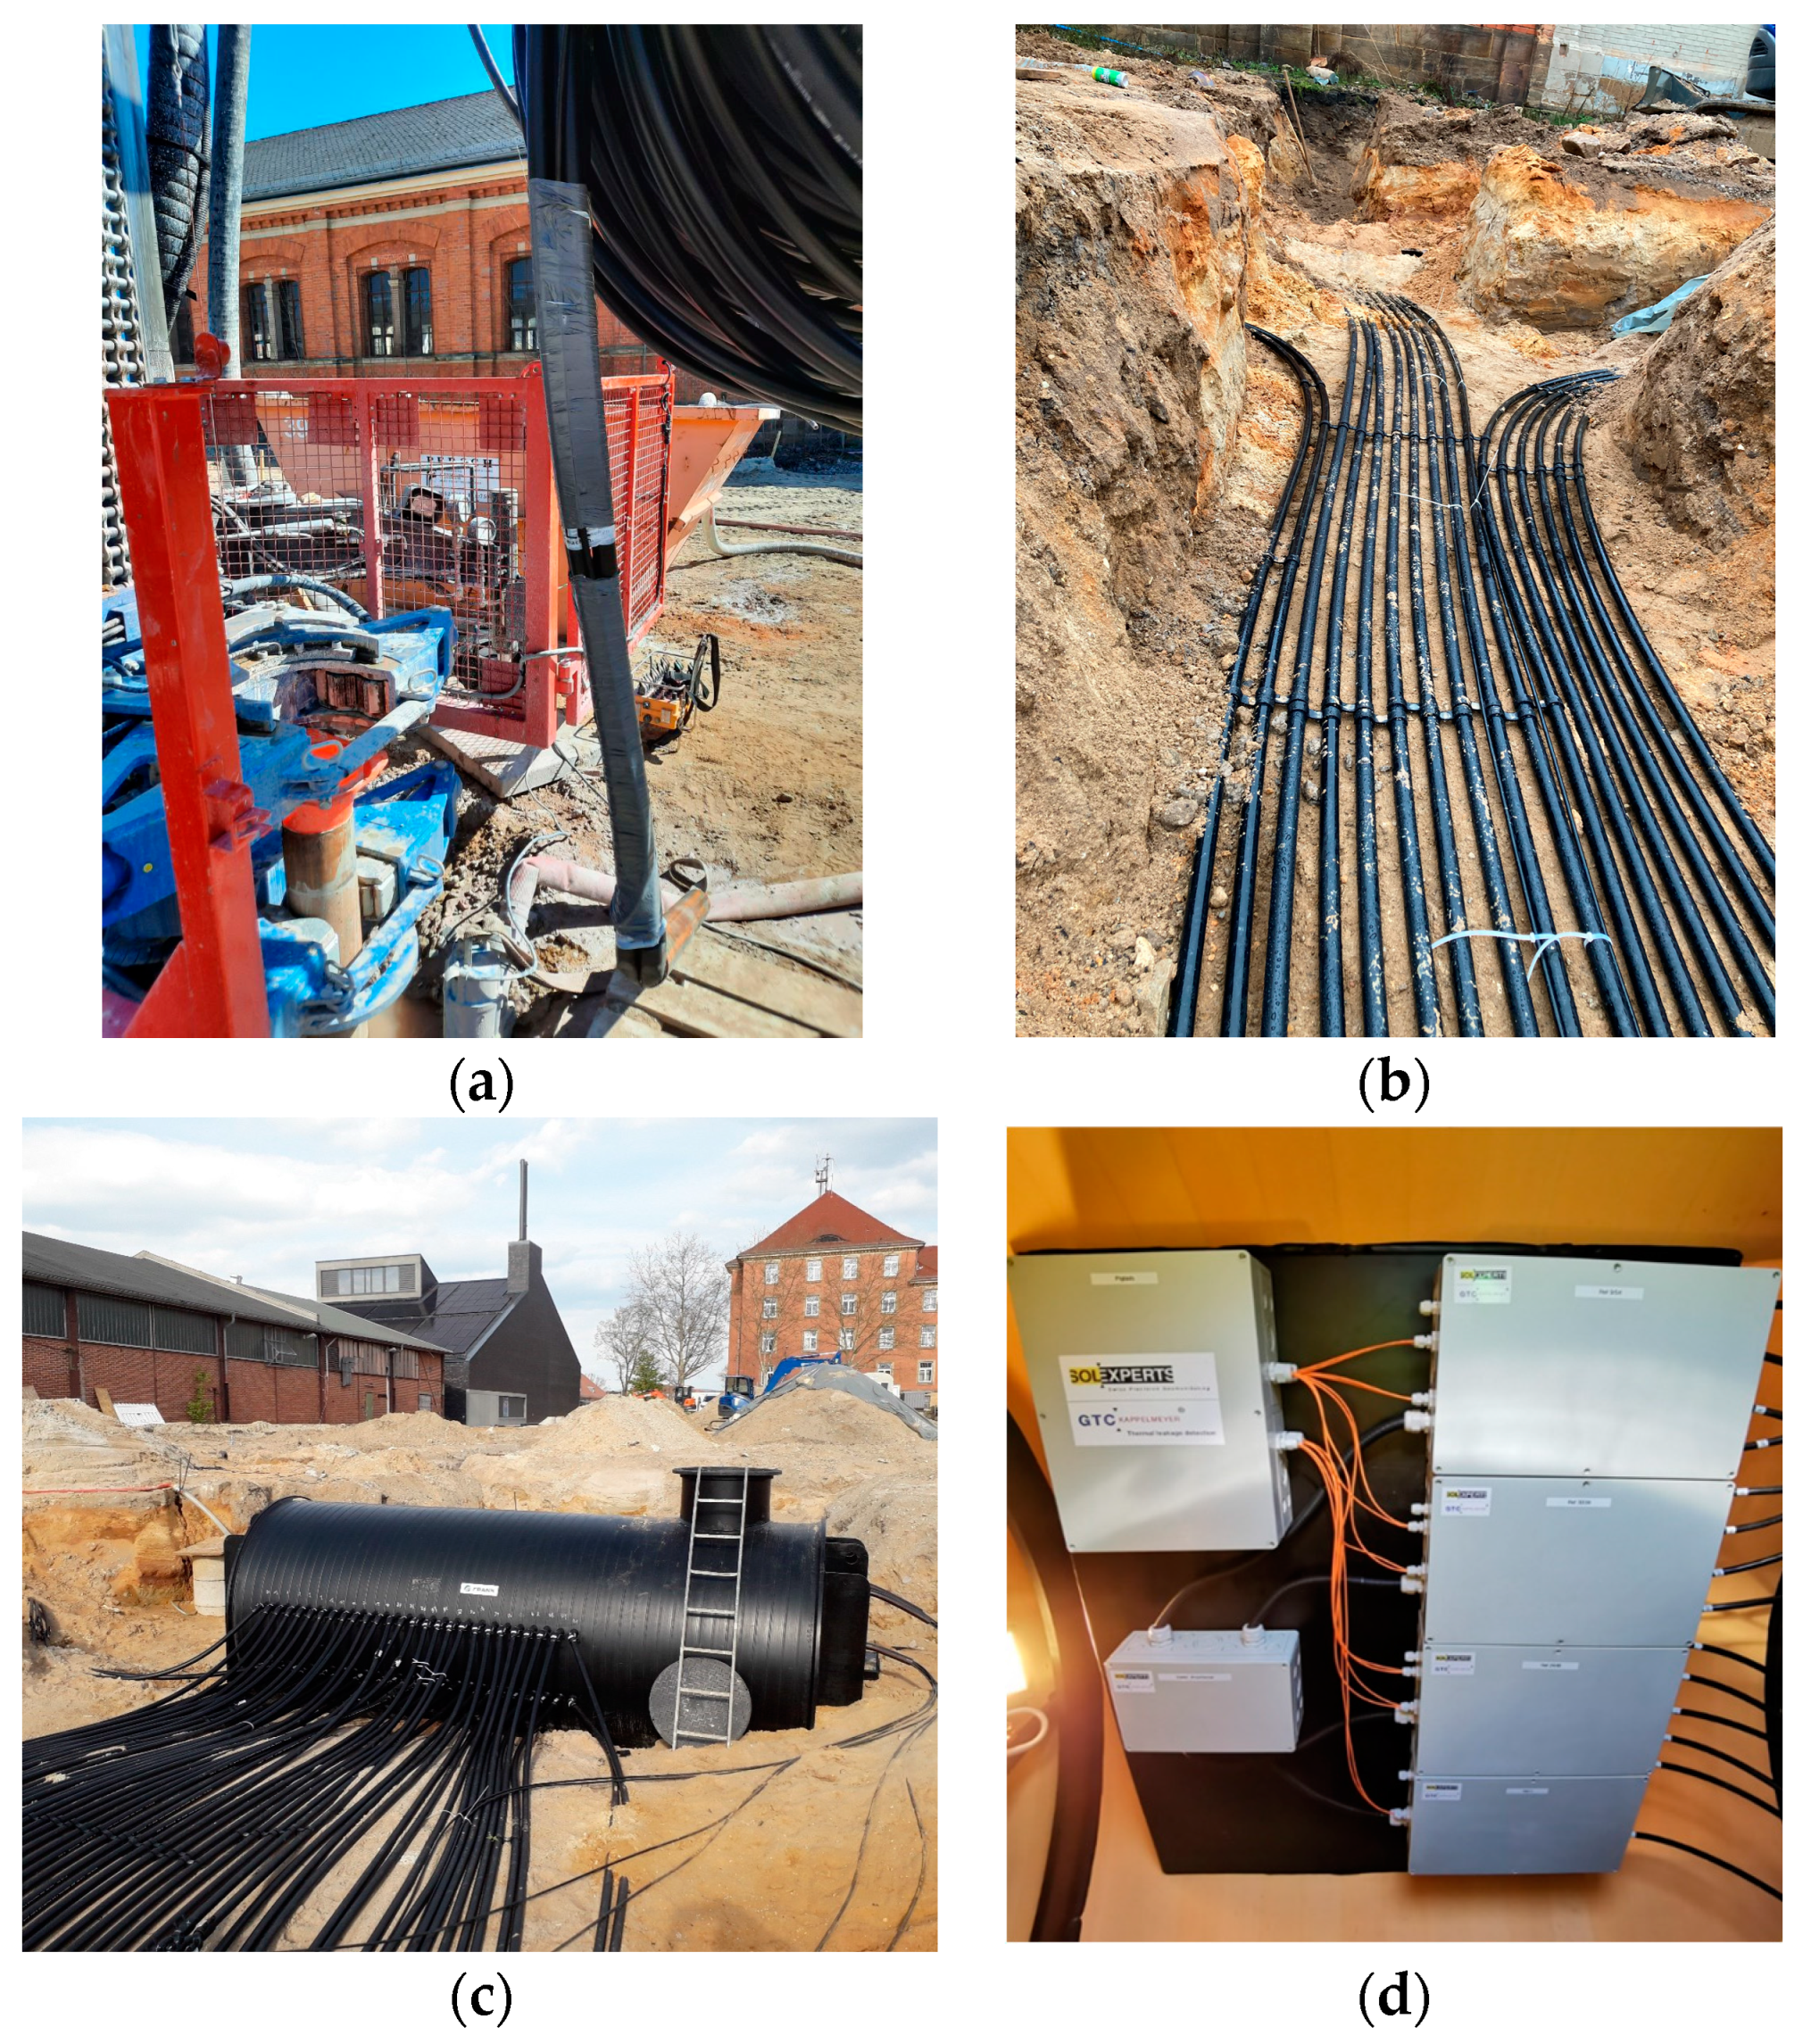
2.1. Test Site

The measurements were conducted on a BHE field in the Lagarde Campus, a former military ground which was converted into an urban residential district in Bamberg, Upper Franconia, Germany (49°54′17.0568′′ N, 10°54′52.1964′′ E). The BHE field includes 54 double-U-BHEs with a depth of 120 m below ground level (b. g. l.). The heat exchangers are made of PE-100 RC (polyethylene resistant-to-cracks) with 32 mm diameter and 3 mm wall thickness. Boreholes are drilled with 178 mm diameter to 32 m b. g. l. and 152 mm to 120 m b. g. l. The thermal conductivity of the grouting is 2.40 W/(m∙K). The BHE field is drilled in the lithostratigraphic area of Quaternary and middle Keuper [29,30], which consist of sedimentary rocks, mainly sandstones, claystones and siltstones. A further description of the in situ geology can be found in Suft and Bertermann, 2022 [31]. An overview of the BHE field is shown in Figure 1.

2.2. Distributed Temperature Sensing
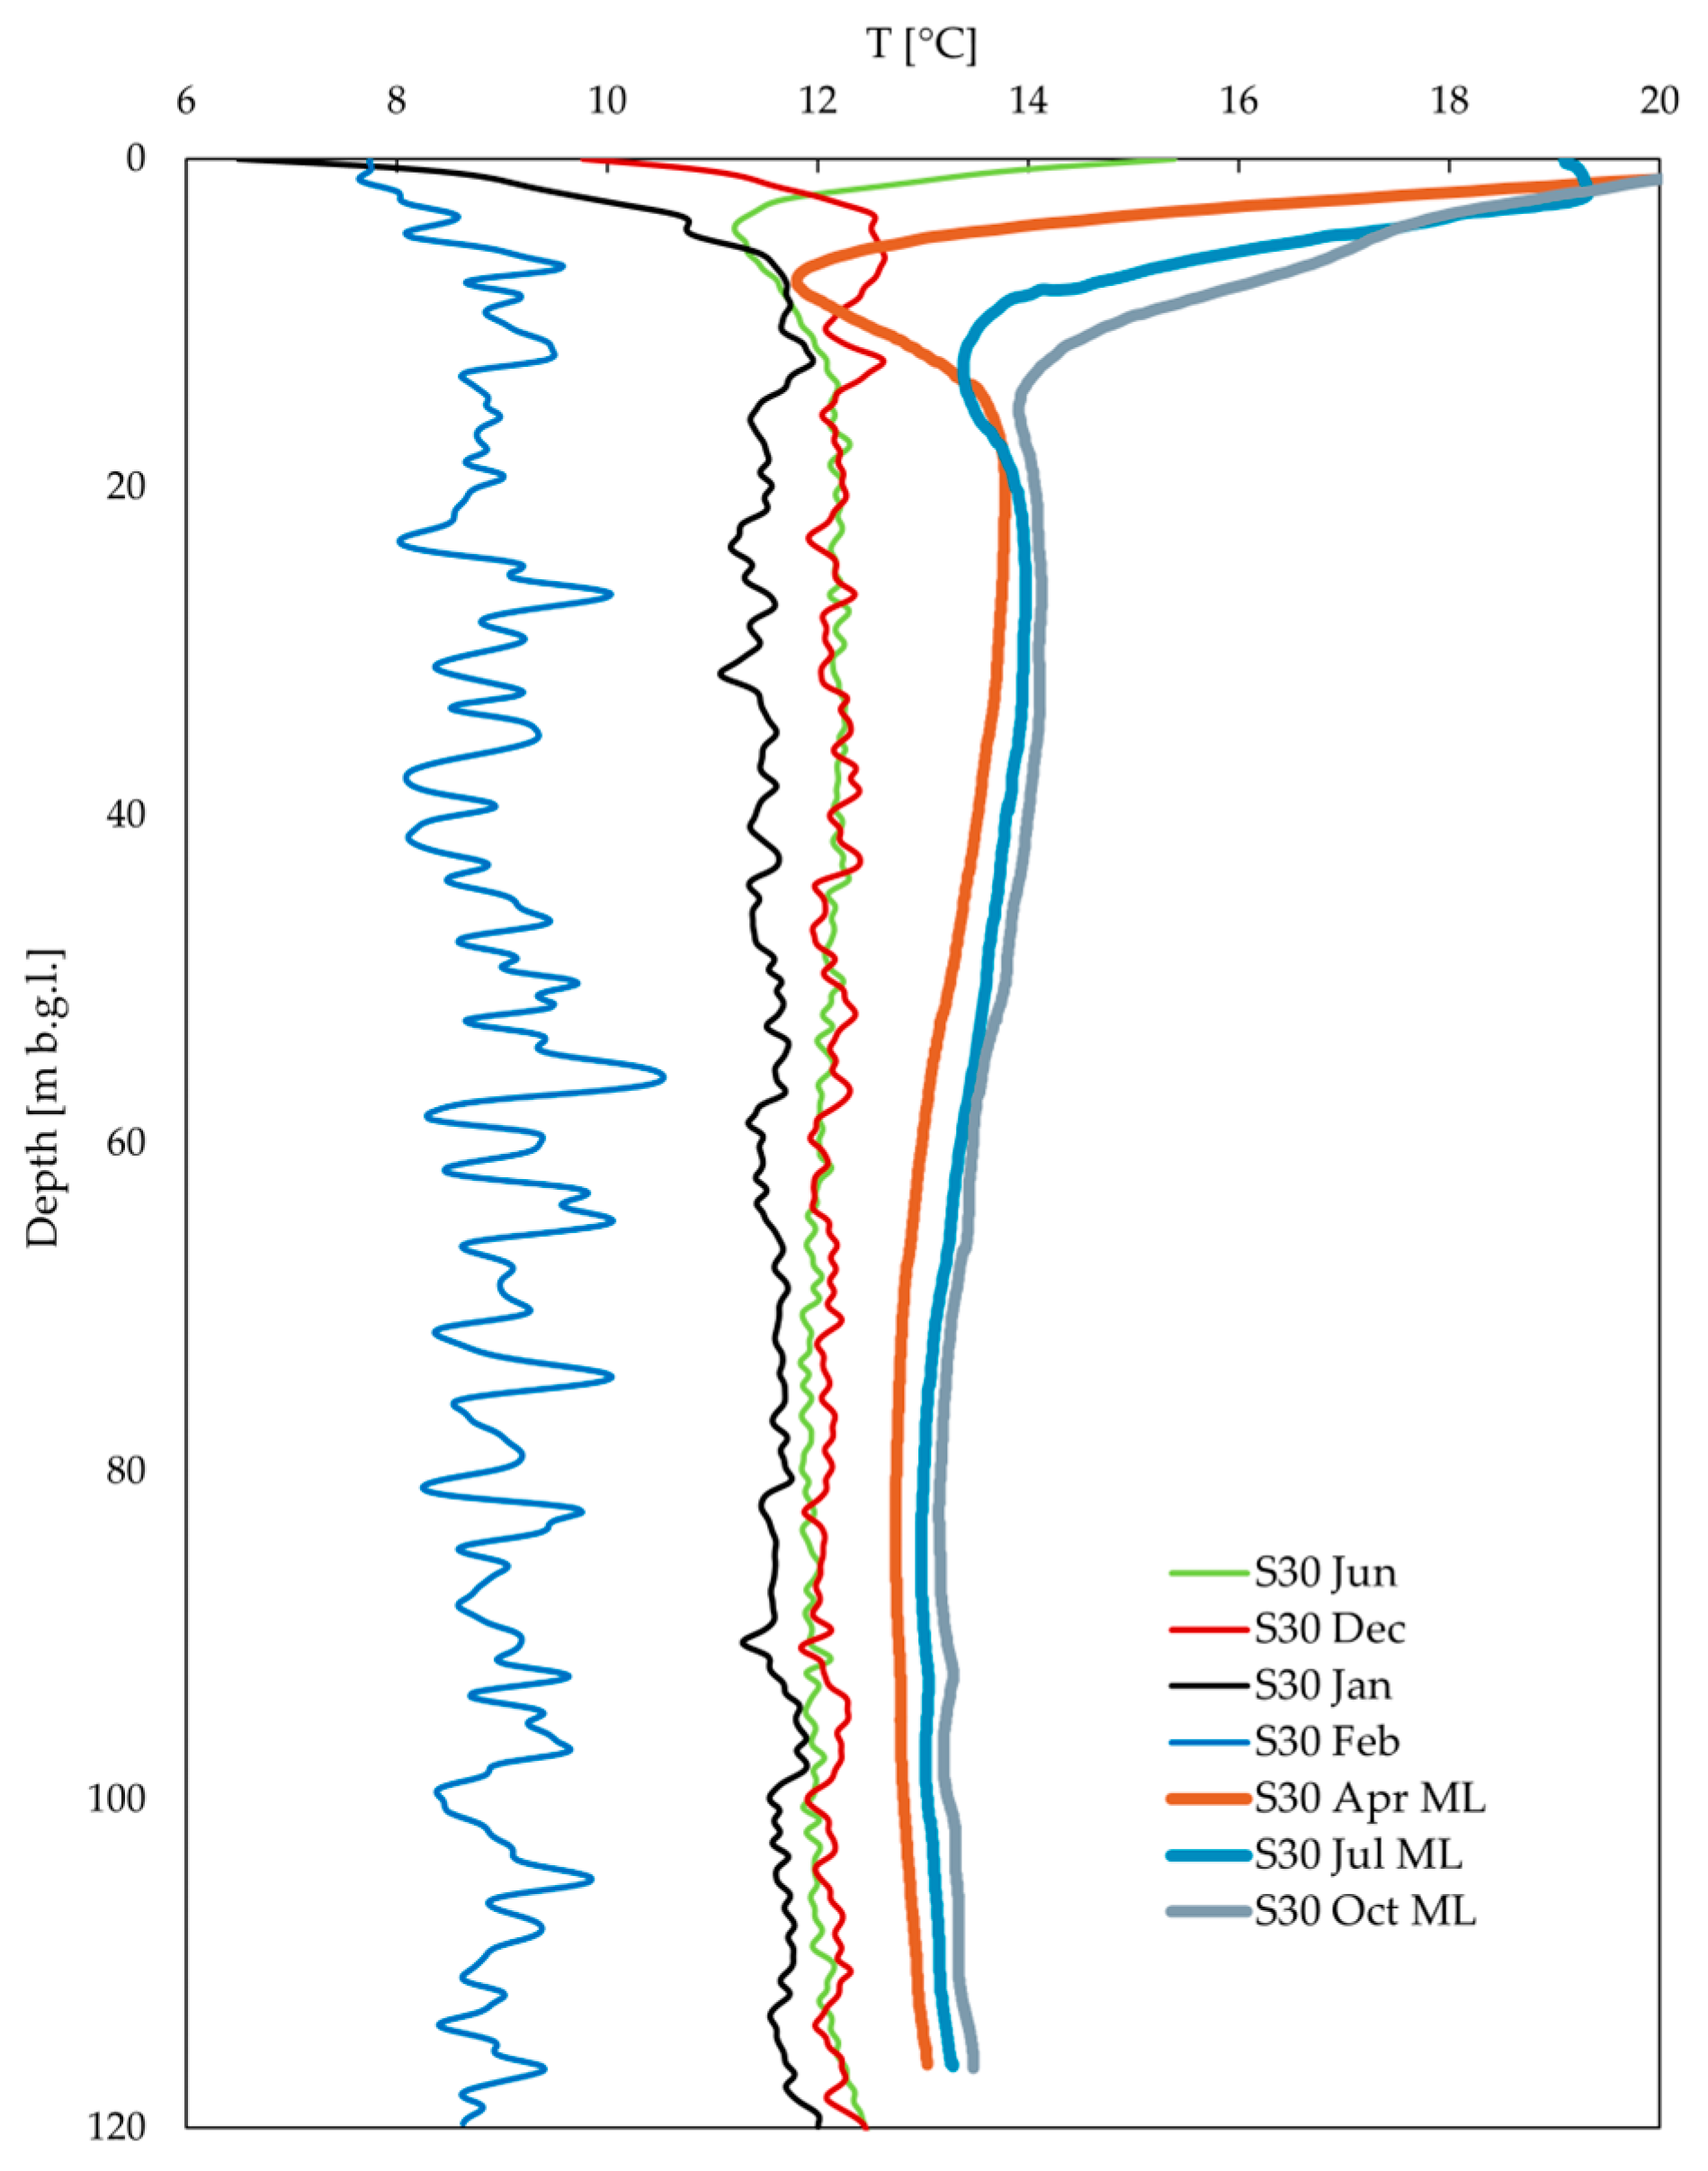
The temperature measurements were carried out by using an optical fiber cable. The DTS device is of the type APsensing Linear Pro Series N4386B. Its main specifications are displayed in Table 1. The fiber optic cables are part of the measurement technology that was installed in the course of the “Multisource” research project [20]. Our team installed optical fibers directly together with the pipes on seven of the 54 BHEs during the construction phase of the BHEs. The cables are routed along the outside of the pipes and fixed to the BHEs at short intervals with adhesive tape. This guarantees a reliable connection and prevents damage to the cables during insertion into the borehole. Furthermore, it was already observed that an installation inside the BHE pipe would greatly increase the error in the analyses due to the influence of vertical water convection [32,33]. Subsequently, the boreholes were filled with typical thermally improved grouting (Fischer GeoSolid 240 HS, Heilsbronn, Germany). The cables were routed to a central distribution shaft via the connection trenches of the BHE field and spliced to pigtail connections there. Figure 2 shows the installation steps and setup of the fiber optic measurement system. Figure 3 shows the schematic configuration of the measuring device. The splicing works between the top of the BHEs, the connection cables and the pigtail connection were carried out by the company Solexperts GmbH, Karlsruhe, Germany. For the calibration of the measurements, the device is connected to a Pt1000-sensor, which is inserted in a reference box in the distributor shaft together with a small part of the fiber optic. Both temperatures are recorded simultaneously during the measurement and processed with the programs AP Sensing DTS Configurator V4.1.52 and GTC-Solexperts Pro V3.1.

3. First Results

Four measurement campaigns were carried out as part of the commenced investigations. These took place in December 2023 and in January, February and June 2024. The maximum standard deviation of the temperature profile measurements was as follows: December 0.078, January 0.119, February 0.172 and June 0.105. Each campaign includes between 9 and 22 single measurements of 60 s for each borehole. The measurements in February show the highest average deviations due to the active operation of the system. The displayed results reflect values of each loop that are folded, except for February, where only one BHE limb is shown due to the fluid (inlet–outlet) circulation. The vertical entry and exit points along the pipe of each measuring chain are marked with so-called dryer marks. These marks are made with a conventional hair dryer during the installation. The strong heat effect of the dryer creates a deflection at this point, which can be recognized during the measurement and helps with finding the starting point during the evaluation. The four measurement campaigns are shown chronologically in Figure 4, where Figure 4a is December and Figure 4d is June. During inactive use of the BHE, the temperatures range from 10.1 °C in December to 14.7 °C in June in the undisturbed zone. In the shallow disturbed zone (approx. 0–20 m b. g. l.), the temperature values are disturbed by seasons and are, respectively, lower and higher. Colder seasonal temperatures were measured at shallow depths from December to February, ranging from 5.7 °C to 13.2 °C. The influence of geothermal gradient begins at a depth of approximately 100 m b. g. l. Temperatures during active fluid input in February are noticeably lower throughout the entire BHE’s length due to cold temperature inlet from the decentral heat pump DHC network from 6.7 °C to 10.9 °C.

4. Discussion

4.1. Positioning of the Fiber Optic Cable

The glass fiber that is used in this study is relatively robust due to its thicker coating and the optional copper wires. This allows for its installation on the outside of the BHE, even if it involves major risks. If the cable is damaged by scratches or kinks, the measurement can become defective or even no longer executable. This is particularly difficult because an initial test measurement to check the functionality can only be carried out once the grouting has been filled and hardened and the cable has been spliced. The more carefully the fiber optic cable is attached to the BHE pipes and the more shielding material, e.g., adhesive tape, against scratches from the borehole wall is used, the less likely it is that the cable will be damaged. No such problems arise if the cable is used inside of the double-U pipes, but this has other disadvantages, especially with regard to measurement data acquisition. On the one hand, the temperatures that are measured outside the pipe are much more sensitive to the surrounding soils and rocks [32]. We observed this phenomenon compared to a conventional pressure–temperature (P-T) data logger (type D+K Mikrolog2: dimensions 110 × 16 mm; measurement resolution 0.1 mbar, 0.1 mK) [31] inserted into the same borehole (see Figure 5). The temperature curve of the P-T logger is significantly smoother despite a comparable accuracy of the systems. The comparison between a data logger and the technology we use should be viewed with caution, as the cost of a DTS system is significantly higher than that of a simple logger. In addition, the use of such a P-T logger is usually intended for simple measurements in systems that are not in operation, e.g., temperature–depth profiles for TRTs. While the fiber optics on the outside of the pipe are installed permanently as they are embedded in grouting, a logger or a cable inside the pipes can potentially be reused. Nevertheless, an installation inside the tube influences its diameter and the flow rate enormously, which leads to faulty operation of the system. In addition, the measurement would be affected by the vertical convection of the fluid [32,33].

4.2. Interpretation of the Geological Surroundings

A correlation of temperatures and the lithological sequence is visible throughout all measured profiles. The geological situation of the BHE field is assumed to be laterally homogenous except for very small deviations in the stratification observed during the drilling. The geological correlation to temperature measurements at shallow depths is not performed here due to the highly likely influence of the urban heat island (UHI) effect [34,35]. An UHI in the underground of Bamberg is visible when compared to ground temperatures outside the urban agglomeration. The influence on the BHE field is insignificant considering the previously sparsely populated surroundings of the BHE field. The underlying Norian- and Rhaetian-stage (middle Keuper) rocks are solely of a sedimentary origin. The typical thermal conductivities range from 1.1 to 3.4 W/m∙K for clay/silt stones to 1.9–4.6 W/m∙K for sandstones with slightly higher values due to the convective contribution of groundwater flow to the heat transfer [12,36,37,38]. Previous TRTs showed values of the effective thermal conductivity of 2.9–3.1 W/m∙K for the displayed BHE 30 [31]. In comparison with the stratigraphic profile of the borehole (Figure 6), a trend in geological units of high and low thermal conductivity can be seen. Higher temperatures in the profiles result from a comparatively lower thermal conductivity and vice versa. Sandstones show a lower temperature in depths from 26 to 36 m b. g. l. and from 72 to 90 m b. g. l. In contrast, the typical clay (stone) layers (“Basisletten”) of the middle Keuper show an increased temperature at 36 to 40 m b. g. l., 90 to 94 m b. g. l. and 105 to 109 m b. g. l. Similar temperature observations were made in different geological units, e.g., mudstones sands, silts and clay [27,39]. Depending on the usage of the BHE, localized stratified differences in thermal properties can have an impact on the efficiency. Groundwater levels are fluctuating at 9 and 23 m b. g. l. and are visible through decreasing temperatures in all profiles, especially during active use of the BHEs in February. Temperature oscillations in sandstones below 72 m b. g. l. are caused by interbeddings of gray clay stone layers.
No significant influence of the on-site NE-SW moving groundwater flow is visible between the BHEs in inflow and outflow (BHEs S9 and S46), which may results from a low hydraulic gradient and low Darcy velocities of 3.3 × 10⁻⁷ to 4.4 × 10⁻⁷ m/s [31,41]. Groundwater flow improves the long-term operation conditions significantly [42], as it influences the thermal properties of the rocks and soil through which it flows, as shown in, e.g., [8,43,44]. In the context of BHEs, various studies showed that a DTS and eGRT application can reliably detect and correlate permeable zones and groundwater [16,23,39]. However, the test site in this study shows only a very small impact of groundwater flow.

4.3. Comparison with Exisiting Technology and Outlook for Further Research

The distributed temperature sensing technology is a reliable source for obtaining temperature data [16,21,23,27,45,46]. Previous studies compared DTS with a variety of temperature sensor instruments [17,18,47]. The main advantage of DTS is the constant depth-resolved measurement that can be used during active heating or cooling via a TRT/eGRT or in the operation of a GSHP. A disadvantage of the system is, depending on the application suggested in this study, a permanent installation in the grouting of the heat exchanger. A comparison with widely used P-T data loggers was carried out above but is not applicable for measuring temperatures when the construction phase of the BHE is finalized. A further benefit is the relatively good comparability of DTS systems, since the fiber optic technology provides similar specifications. The scaling of the cable can be from less than 1 meter up to more than 50 km, as in, e.g., [32].
Although several measurements have already been carried out, the “geothermal playground” at the Lagarde Campus offers further investigation possibilities. Due to the active building sites, a lot of possibilities must wait for technical solutions, such as a constant power supply for the application of eGRT with a heat pulse control unit or the integration of additional sensors for moisture and temperature in buildings, the energy center and along the DHC pipes. The knowledge of the depth-resolved thermal conductivity will give further insight into the area and will help to optimize BHE fields. We recommend the usage of DTS technology for other applications in shallow geothermal areas. Due to its capability of measuring temperatures simultaneously over long distances, the monitoring of heterogeneous and complex (hydro-)geological settings is possible. By using specific values for the thermal conductivity and borehole thermal resistance of each lithological unit, the drilling meters, installation and operation costs can be optimized [2]. Furthermore, when using multiple fiber optic cables on several BHEs, potential differences in the hydraulic and thermal connection can become visible.

5. Conclusions

Our study shows an innovative approach to data collection in an active BHE field with a monitoring system that is relatively easy to install and operate. The key measurement parameter is temperature. Our conclusions are as follows:
  • The usage of distributed temperature sensing via fiber optic cables is a good method for determining ground temperatures independently of the progress of the construction of the BHE field.
  • Installation of the fiber optics outside of the BHEs is recommended, as this provides more sensitive and less faulty data. The collected data reflect the surrounding borehole and lithology much better.
  • An influence of the geological units and the groundwater can be seen in the case of the BHE field in Bamberg. Larger differences in thermal conductivity amplify this observation.

Author Contributions

Conceptualization, D.B. and O.S.; methodology, O.S. software, O.S.; validation, O.S.; formal analysis, O.S.; investigation, O.S.; resources, D.B.; data curation, O.S.; writing—original draft preparation, D.B. and O.S.; writing—review and editing, D.B. and O.S.; visualization, O.S.; supervision, D.B.; project administration, D.B. and O.S.; funding acquisition, D.B. All authors have read and agreed to the published version of the manuscript.

Funding

This research was funded as part of the project “MultiSource” by the Federal Ministry for Economic Affairs and Climate Action (BMWK), Grant No. 03EN3057D.

Data Availability Statement

The data presented in this study are available on request from the corresponding author. The data are not publicly available due to privacy restrictions.

Acknowledgments

We would like to express our thanks to Stadtwerke Bamberg, who provided administrative support for our work and gave us the opportunity to work on the Lagarde Campus, as well as to the scientific team of the MultiSource project, including Technische Hochschule Nürnberg and Technische Universität Dresden. In addition, thanks to the members of the shallow geothermal working group at Friedrich-Alexander-Universität Erlangen-Nürnberg, especially Jan Wagner and Mario Rammler, for help with the measurements and valuable discussion. Finally, we would like to thank Solexperts GmbH for technical support with the DTS system.

Conflicts of Interest

The authors declare no conflicts of interest.

Nomenclature

(5G)DHC(Fifth generation) district heating cooling
BHEBorehole heat exchanger
DTSDistributed temperature sensing
eGRTEnhanced (geo)thermal response test
GWLGroundwater level
P-TPressure–temperature
PE100-RC Polyethylene, resistant to cracks
TRTThermal response test

References

  1. Luo, J.; Rohn, J.; Xiang, W.; Bertermann, D.; Blum, P. A review of ground investigations for ground source heat pump (GSHP) systems. Energy Build. 2016, 117, 160–175. [Google Scholar] [CrossRef]
  2. Wilke, S.; Menberg, K.; Steger, H.; Blum, P. Advanced thermal response tests: A review. Renew. Sustain. Energy Rev. 2020, 119, 109575. [Google Scholar] [CrossRef]
  3. Acuña, J.; Palm, B. Distributed thermal response tests on pipe-in-pipe borehole heat exchangers. Appl. Energy 2013, 109, 312–320. [Google Scholar] [CrossRef]
  4. Popov, Y. Theoretical models of the method of determination of the thermal properties of rocks on the basis of movable sources. Geol Razved (Geol Prospect.) 1983, 9, 97–105. [Google Scholar]
  5. Popov, Y.; Tertychnyi, V.; Romushkevich, R.; Korobkov, D.; Pohl, J. Interrelations between thermal conductivity and other physical properties of rocks: Experimental data. In Thermo-Hydro-Mechanical Coupling in Fractured Rock; Birkhäuser: Basel, Switzerland, 2003; pp. 1137–1161. [Google Scholar] [CrossRef]
  6. Popov, Y.A.; Pribnow, D.F.; Sass, J.H.; Williams, C.F.; Burkhardt, H. Characterization of rock thermal conductivity by high-resolution optical scanning. Geothermics 1999, 28, 253–276. [Google Scholar] [CrossRef]
  7. Bertermann, D.; Schwarz, H. Laboratory device to analyse the impact of soil properties on electrical and thermal conductivity. Int. Agrophysics 2017, 31, 157–166. [Google Scholar] [CrossRef]
  8. Clauser, C.; Huenges, E. Thermal Conductivity of Rocks and Minerals. Rock Phys. Phase Relat. 1995, 3, 105–126. [Google Scholar]
  9. Franz, C.; Schulze, M. Bestimmung thermischer Eigenschaften der Gesteine des Unteren und Mittleren Buntsandsteins. Grundwasser 2016, 21, 47–58. [Google Scholar] [CrossRef]
  10. Long, M.; Murray, S.; Pasquali, R. Thermal conductivity of Irish rocks. Ir. J. Earth Sci. 2018, 36, 63–80. [Google Scholar] [CrossRef]
  11. VDI 4640-5; Thermal Use of the Underground—Part 5: Thermal-Response-Test (TRT). VDI: Düsseldorf, Germany, 2020.
  12. VDI 4640-1; Thermal Use of the Underground—Part 1: Fundamentals, Approvals, Environmental Aspects. VDI: Düsseldorf, Germany, 2010.
  13. Bertermann, D.; Klug, H.; Morper-Busch, L. A pan-European planning basis for estimating the very shallow geothermal energy potentials. Renew. Energy 2015, 75, 335–347. [Google Scholar] [CrossRef]
  14. Bertermann, D.; Bialas, C.; Morper-Busch, L.; Klug, H.; Rohn, J.; Stollhofen, H.; Psyk, M.; Jaudin, F.; Maragna, C.; Einarsson, G.M.; et al. ThermoMap—An Open-Source Web Mapping Application for Illustrating the very Shallow Geothermal Potential in Europe and selected Case Study Areas. In Proceedings of the European Geothermal Congress, Pisa, Italy, 3–7 June 2013. [Google Scholar]
  15. Koubikana Pambou, C.H.; Raymond, J.; Lamarche, L. Improving thermal response tests with wireline temperature logs to evaluate ground thermal conductivity profiles and groundwater fluxes. Heat Mass Transf. 2019, 55, 1829–1843. [Google Scholar] [CrossRef]
  16. Li, P.; Dou, B.; Guan, P.; Zheng, J.; Tian, H.; Duan, X. Thermophysical and Heat Transfer Characteristics Based on Thermal Response and Thermal Recovery Test of a U-Pipe Borehole Heat Exchanger. J. Eng. Thermophys. 2023, 32, 117–137. [Google Scholar] [CrossRef]
  17. Aranzabal, N.; Martos, J.; Steger, H.; Blum, P.; Soret, J. Temperature measurements along a vertical borehole heat exchanger: A method comparison. Renew. Energy 2019, 143, 1247–1258. [Google Scholar] [CrossRef]
  18. Aranzabal, N.; Martos, J.; Stokuca, M.; Mazzotti Pallard, W.; Acuña, J.; Soret, J.; Blum, P. Novel instruments and methods to estimate depth-specific thermal properties in borehole heat exchangers. Geothermics 2020, 86, 101813. [Google Scholar] [CrossRef]
  19. Martos, J.; Montero, Á.; Torres, J.; Soret, J.; Martínez, G.; García-Olcina, R. Novel wireless sensor system for dynamic characterization of borehole heat exchangers. Sensors 2011, 11, 7082–7094. [Google Scholar] [CrossRef]
  20. Meyer, J.; Zeh, R.; Schmid, M.; Stockinger, V. Innovative Wärmeversorgung im innerstädtischen Quartier: Wärme-und Monitoringkonzept; HAWK, Hochschule für angewandte Wissenschaft und Kunst Hildesheim/Holzminden/Göttingen-Bibliothek: Hildesheim, Germany, 2023. [Google Scholar] [CrossRef]
  21. Sharma, W.S.; Seki, A.; Angel, S.; Garvis, D. Field testing of an optical fiber temperature sensor in a geothermal. Geothermics 1990, 19, 285–294. [Google Scholar] [CrossRef]
  22. Fujii, H.; Okubo, H.; Itoi, R. Thermal response tests using optical fiber thermometers. In Proceedings of the GRC 2006 Annual Meeting: Geothermal Resources-Securing Our Energy Future, San Diego, CA, USA, 10–13 September 2006; pp. 545–551. [Google Scholar]
  23. Fujii, H.; Okubo, H.; Nishi, K.; Itoi, R.; Ohyama, K.; Shibata, K. An improved thermal response test for U-tube ground heat exchanger based on optical fiber thermometers. Geothermics 2009, 38, 399–406. [Google Scholar] [CrossRef]
  24. Michalski, A.; Klitzsch, N. First field application of temperature sensor modules for groundwater flow detection near borehole heat exchanger. Geotherm. Energy 2019, 7, 37. [Google Scholar] [CrossRef]
  25. Cultrera, M.; Boaga, J.; Di Sipio, E.; Dalla Santa, G.; De Seta, M.; Galgaro, A. Modelling an induced thermal plume with data from electrical resistivity tomography and distributed temperature sensing: A case study in northeast Italy. Hydrogeol. J. 2017, 26, 837–851. [Google Scholar] [CrossRef]
  26. Acuña, J. Improvements of U-Pipe Borehole Heat Exchangers; KTH: Stockholm, Sweden, 2010. [Google Scholar]
  27. Ma, Y.; Zhang, Y.; Cheng, Y.; Zhang, Y.; Gao, X.; Shan, K. A case study of field thermal response test and laboratory test based on distributed optical fiber temperature sensor. Energies 2022, 15, 8101. [Google Scholar] [CrossRef]
  28. Zeh, R.; Ohlsen, B.; Philipp, D.; Bertermann, D.; Kotz, T.; Jocić, N.; Stockinger, V. Large-Scale Geothermal Collector Systems for 5th Generation District Heating and Cooling Networks. Sustainability 2021, 13, 6035. [Google Scholar] [CrossRef]
  29. Lang, M. Geologische Karte von Bayern 1:25000 6131 Bamberg Süd; Bayerisches Geologisches Landesamt: Augsburg, Germany, 1970. [Google Scholar]
  30. Lang, M.; Bader, K. Erläuterungen zur Geologischen Karte von Bayern 1: 25 000 Blatt Nr. 6131 Bamberg Süd; Bayerisches Geologisches Landesamt: Augsburg, Germany, 1970. [Google Scholar]
  31. Suft, O.; Bertermann, D. One-Year Monitoring of a Ground Heat Exchanger Using the In Situ Thermal Response Test: An Experimental Approach on Climatic Effects. Energies 2022, 15, 9490. [Google Scholar] [CrossRef]
  32. Cao, D.; Shi, B.; Zhu, H.-H.; Wei, G.; Bektursen, H.; Sun, M. A field study on the application of distributed temperature sensing technology in thermal response tests for borehole heat exchangers. Bull. Eng. Geol. Environ. 2019, 78, 3901–3915. [Google Scholar] [CrossRef]
  33. Bertermann, D.; Rammler, M. Suitability of Screened Monitoring Wells for Temperature Measurements Regarding Large-Scale Geothermal Collector Systems. Geosciences 2022, 12, 162. [Google Scholar] [CrossRef]
  34. Menberg, K.; Bayer, P.; Zosseder, K.; Rumohr, S.; Blum, P. Subsurface urban heat islands in German cities. Sci. Total Environ. 2013, 442, 123–133. [Google Scholar] [CrossRef]
  35. Hemmerle, H.; Ferguson, G.; Blum, P.; Bayer, P. The evolution of the geothermal potential of a subsurface urban heat island. Environ. Res. Lett. 2022, 17, 084018. [Google Scholar] [CrossRef]
  36. Dalla Santa, G.; Galgaro, A.; Sassi, R.; Cultrera, M.; Scotton, P.; Mueller, J.; Bertermann, D.; Mendrinos, D.; Pasquali, R.; Perego, R.; et al. An updated ground thermal properties database for GSHP applications. Geothermics 2020, 85, 101758. [Google Scholar] [CrossRef]
  37. Eppelbaum, L.; Kutasov, I.; Pilchin, A.; Eppelbaum, L.; Kutasov, I.; Pilchin, A. Thermal properties of rocks and density of fluids. In Applied Geothermics; Springer: Berlin/Heidelberg, Germany, 2014; pp. 99–149. [Google Scholar] [CrossRef]
  38. Midttømme, K.; Roaldset, E.; Aagaard, P. Thermal conductivity of selected claystones and mudstones from England. Clay Miner. 1998, 33, 131–145. [Google Scholar] [CrossRef]
  39. Dalla Santa, G.; Pasquier, P.; Schenato, L.; Galgaro, A. Repeated ETRTs in a Complex Stratified Geological Setting: High-Resolution Thermal Conductivity Identification by Multiple Linear Regression. J. Geotech. Geoenviron. Eng. 2022, 148, 04022007. [Google Scholar] [CrossRef]
  40. DIN 4023; Geotechnische Erkundung und Untersuchung—Zeichnerische Darstellung der Ergebnisse von Bohrungen und Sonstigen Direkten Aufschlüssen. DIN: Berlin, Germany, 2004.
  41. Kus, G. Hydrogeologische Karte von Bayern 1:50000 L 6130 Bamberg Blatt 1: Grundlagen; Bayerisches Landesamt für Umwelt: Augsburg, Germany, 2008. [Google Scholar]
  42. Capozza, A.; De Carli, M.; Zarrella, A. Investigations on the influence of aquifers on the ground temperature in ground-source heat pump operation. Appl. Energy 2013, 107, 350–363. [Google Scholar] [CrossRef]
  43. Brigaud, F.; Vasseur, G. Mineralogy, porosity and fluid control on thermal conductivity of sedimentary rocks. Geophys. J. 1989, 98, 525–542. [Google Scholar] [CrossRef]
  44. Alishaev, M.G.; Abdulagatov, I.M.; Abdulagatova, Z.Z. Effective thermal conductivity of fluid-saturated rocks. Eng. Geol. 2012, 135–136, 24–39. [Google Scholar] [CrossRef]
  45. Soto, M.; Sahu, P.; Faralli, S.; Bolognini, G.; Di Pasquale, F.; Nebendahl, B.; Rueck, C. Distributed temperature sensor system based on Raman scattering using correlation-codes. Electron. Lett. 2007, 43, 862. [Google Scholar] [CrossRef]
  46. He, H.; Dyck, M.F.; Horton, R.; Li, M.; Jin, H.; Si, B. Distributed temperature sensing for soil physical measurements and its similarity to heat pulse method. Adv. Agron. 2018, 148, 173–230. [Google Scholar] [CrossRef]
  47. Aranzabal, N.; Martos, J.; Steger, H.; Blum, P.; Soret, J. Novel instrument for temperature measurements in borehole heat exchangers. IEEE Trans. Instrum. Meas. 2018, 68, 1062–1070. [Google Scholar] [CrossRef]
Figure 1. BHE field in Bamberg, Germany. Blue dots depict the 54 BHEs, red dots depict the BHEs equipped with fiber optic cables. The central red square is the distributor shaft where the BHE connections are brought together; base map source: OpenStreetMaps.
Energies 17 04697 g001
Figure 2. Installation steps and setup of the fiber optic measurement system. (a) Base of the BHE before insertion into the borehole with attached fiber optic cable; (b) trench for the connection of the BHEs with the distributor shaft, where fiber optic cables are fixed with zip ties; (c) distributor shaft on site before burying; (d) measuring boxes for fiber optic connection (left) and reference boxes for determination of the reference temperatures (right) in the distribution shaft.
Energies 17 04697 g002
Figure 3. Schematic illustration of the components for distributed temperature sensing, pictures showing the inside of the distributor shaft and the above-ground measurement setup in winter conditions; DTS: distributed temperature sensing interrogator.
Energies 17 04697 g003
Figure 4. Depth-resolved temperature profiles for the seven 120 m below-ground-level (b. g. l.) BHEs. Each line indicates one fiber optic cable. (a) December 2023, no active fluid input; (b) January 2024, no active fluid input; (c) February 2024, active fluid input; (d) June 2024, no active fluid input.
Energies 17 04697 g004
Figure 5. DTS temperature profiles of BHE 30 (S30) compared with measurements of a conventional P-T-data logger, D+K MikroLog 2 (ML), on the same borehole.
Energies 17 04697 g005
Figure 6. DTS temperature profile of central BHE 34 (S34) with lithological units of Quaternary and middle Keuper drilled on site; textures according to DIN 4023 [40]; GWL: groundwater level.
Energies 17 04697 g006
Table 1. Main specifications of the distributed temperature sensing (DTS) device and the hybrid fiber optic cable.
DTS DeviceParameters
Distance measurement range2 km
Temperature resolutionSingle-ended 0.05 °C
Dual-ended (loop) 1 0.04 °C
Minimum sampling interval0.15 m
Minimum spatial resolution0.7 m
Temperature repeatability0.11 °C
Measurement time (this study)10 s to 24 h (60 s)
Optical connectorE2000 APC 8° angled;
50/125 μm graded index MM
Communication protocolSCPI; Modbus TCP
Power consumption21–60 W
Optical fiber cableParameters
TypeHybrid cable for outdoor use 2
4 multimode fibers
Diameter11 mm ± 0.5 mm
Quantity of elements1× Tube fiber optic, 4 CU wires
1 In this study, only dual-ended fiber optic loops were used. 2 Hybrid cable with copper wires for heating along the cable for enhanced Geothermal Response Test (eGRT).
Disclaimer/Publisher’s Note: The statements, opinions and data contained in all publications are solely those of the individual author(s) and contributor(s) and not of MDPI and/or the editor(s). MDPI and/or the editor(s) disclaim responsibility for any injury to people or property resulting from any ideas, methods, instructions or products referred to in the content.

