Abstract
As the Ethiopian energy demand urges for fuel options, it is essential to identify biomass fuels and estimate their energy potential. This study quantified the agricultural residues’ biomass resources and their energy potential. Further analyzed and characterized the potential nature through quantitative and qualitative methodologies with descriptive, comparative, explanatory, and exploratory studies. Five-year crop yield data of 27 crops were collected from the Central Statistical Agency of Ethiopia. Conversion factors into energy were surveyed from the literature. Subsequently, the residues available and their energy potentials were estimated. Mathematical and statistical analysis methods were considered in an Excel sheet. A new measure of natural potential capacity for energy was defined in two views (resource and application). Accordingly, their potential capacities were rated and prioritized comparatively. The gross energy potential of all the residues was estimated to be 494.7 PJ. With 30% collecting efficiency, it corresponds to the imported petroleum fuel in 2018. Five major crops contributed to 80% of this gross potential. Maize and sorghum presented the highest potential due to their superior yields and good natural potential capacities. They are also well distributed in all the regions. Cotton and maize’s natural potential capacities are the best in both views. Generally, commercial crops presented better capacities than the major cereal crops. However, major crops’ energy potentials dominated due to their yields. These resources need mobilization into modern and commercially accessible fuel forms that await intervention. Densified and carbonized forms of consumption in nearby industries and households are most viable for the Ethiopian case.
1. Introduction
Biomass contributes to more than 86% of the Ethiopian final energy consumption, which is at a higher rate than the African average of 51% (2022) [1,2]. The consumption is 103 million metric tons/year, and it is the major source [2]. Next to biomass, imported petroleum and electricity contribute substantial portions. The population of 105 million (2019) is second in Africa. More than 93 million (88%) of this population rely on solid biomass for cooking, mainly from the forest [1]. The residue consumption for energy is 4.9 million metric tons (approximately 13%) of the total exploitable potential of 38 million tons. Studies of consumption vary, and an estimate of 30% is given in other literature [3]. In both cases, it is much lower than the woody biomass consumption rate of 81% [1].
Fast population rises and industrialization caused a rise in energy demand that sought additional fuel options as well as their quantity. According to the National Biogas Program Ethiopia, it is projected to be 527 TWh by 2030. In the current case, a low electricity access rate and dependence on traditional biomass resulted in energy poverty and low life standards for the majority of the population [4,5]. Per capita electricity, 100 kWh (2018), is lower than the African average energy consumption of (521 kWh) [3,6].
Therefore, securing as much biomass supply from the source side is a concern to resolve for sustaining the green fuel supply and overall energy security. Thus, it anticipates an enhancement of the electrification rate and filling the fuel deficit by sourcing from all renewable resources. Further, modernizing biomass to save fuel, especially in households, scaling the electrification rate as well as its range, and saving electric energy by a wise offset in sectors enables the saving of spare energy for use in energy-scarce sectors like some industries and households. Thus, they are prominent means to get spare fuel to fill the fuel deficit in general and to alleviate petroleum fuel in industries.
In accordance with this, identifying and estimating the potential of biomass resources is essential to achieving fuel quantity addition by having additional resource options and enhancing quantity. Further, it is leading the resource to get attention for utilization and the related management. Information, for successive years of longer period, for each residue resource, by the regional distributions, and with their natural characteristics analyses, is crucial for mobilizing these resources and realizing the interventions so that to exploit them sustainably. The annual trends of the potentials are useful for follow-up plans and predictions. While segregated and refined estimates of the residues and crops’ energy potentials are useful for mobilizing each resource discretely, an analysis of their nature clears some of the application- and management-related concerns. Natural potential capacity levels also contribute to selective and prioritized consumption for sectorial interests, economic analyses, and prioritizing these resources in general.
Together with their quantity, the overall potential is revealed, contributes to a wise intervention, and paves a way to advance into consumption. Concurrently, directive recommendations on the measures of resource consumption and how they could be exploited and benefited from to the most are crucial to present to policymakers and energy institutions. Better arguments and justified recommendations are critical for better intervention measures of mobilization as well as utilizing the resources. Accordingly, the resource nature for energy use and the preferred routes in a universal sense, concerning the Ethiopian case, need to be rationalized and associated with better mobilization.
The previous literature did not address the natural property-related potentials and their characterizations. The regional energy potential distributions are also critical for regional interests, policies, and mobilization and have not been adequately addressed in the literature for a range of years. Gabisa and Gheewala estimated a total biomass energy potential of 750 PJ for 2015 from livestock waste, agricultural and forest residues, at 19%, 34% (550 PJ), and 47%, respectively [7]. Tollesa also estimated an average of 827 PJ from all the agricultural residues available for energy (57.23 million metric tons) in the year 2021 and included regional potential [8]. The corresponding crop residue potential, excluding fruit crops, root crops, and vegetables, was 721 PJ. The residue biomass resource is approximately 52 million metric tons. Whereas Gabisa and Gheewala estimated the resource quantity to be approximately 40 million metric tons in the year 2015.
Previous studies by Gabisa and Gheewala and most of the other literature do not include regional distributions. While the study by Tolessa included the regional distributions. However, it is not adequate, especially for the trend study, as the period of the data is one year. As much data for a range of wide periods has to be presented for the trend analyses and for the predictions. As the crops types and yield trend varies with time, it is crucial to have a longer period data of 15 to 20 years for the trend information and an average representative estimate, of each specific residue resources.
This study aimed to further investigate the discrete residues’ biomass fuel resource quantities, their respective energy potentials, the inclusion of additional crops, the regional distributions, fulfilling the information for a range of years not addressed in the literature, and including the natural characteristics analyses, so as to extend the information on these resources and their sources.
Accordingly, crop yield data filtering, annual crop yield comparisons, quantifying and comparing the residue biomass potentially available for energy, estimating energy potentials by residues and crops with proportions, regional energy potentials, analyzing and characterizing their natural characteristics, rating their natural potential capacity levels, and prioritizing residues and crops accordingly. Finally, an inference of the resource route to utilization was implied for the Ethiopian case.
Outline of the Content and Structure
The introduction presents the importance of the information about the resource, both qualitatively and quantitatively, as a fuel resource, its energy, and its nature. The methods section presents the overall methodology, the research types followed, and the methods for each of the four objectives. The results section presents the resource quantity, its nature, the thermochemical energy potential, and the nature of the potential in association with the resource nature and the agricultural practice-based yield quantity. Further, it discusses the consumption for energy through the better way of the thermochemical route to Ethiopia, for which this study intends. In addition, the results section reflects on and presents insights into the other ways and means of depositing the residues and the other methods of conversion routes to energy through their upgraded fuel form options. The thermochemical route is detailed on the ways to consume the resources efficiently based on the literature and includes an analysis of the overall nature of the resource by including the Ethiopian case. The conclusion section summarizes the overall resource nature, consumption direction, and the need for attention to the resources to contribute to the overall energy security.
2. Materials and Methods
2.1. Methodology and Research Design
Quantitative and qualitative methodologies were followed discretely or in a mixed approach for a comparative and descriptive study. Observatory, exploratory, and explanatory analyses of the data and the results, either separately or together, were carried out through analytical methods for describing the data, the results, their interrelationships, and characterizing the residues’ nature as well as their potential. For the tailed discussion of the inference of resource consumption in the case of Ethiopia, a descriptive, observatory, and explanatory study is followed based on a literature survey and situation analysis of the case.
2.2. Data Collection
- I.
- Crop Yields and Factors
In a five-year period (2014–2018), crop yield data for 27 crops (11 crops and 2 crop groups with 8 crops each) were collected from the Central Statistical Agency (CSA) of Ethiopia. Sugar cane data incorporates additional information from the Sugar Corporation of Ethiopia to include sugar industry yield data. Cotton data is at the national level only and is from the literature. All staple foods and commercial crops are based on the Central Statistical Agency data. Data filtering was carried out before the analysis. Sesame is separated from the oil seeds, which are named oilseeds out of sesame (OSOS) since they are cultivated in concentrated locations for mass farming.
- II.
- Conversion Factors
Conversion factors to energy for the residues were surveyed from the literature, as presented in Appendix A. Selected ones (highlighted in bold) were considered for analysis in this study. Repeated, mean, and middle values are the focus of the collected data for a rational selection of the factors for the analysis to get a better estimate and are presented in the remark column.
The factors are residue-to-product ratio (RPR), surplus availability factor (SAF), and lower heating values (LHV). RPR is the ratio of the residue weight to a given parent crop yield. SAF is a factor for the portion of the residue possible to collect for energy as a surplus after basic consumptions (animal feed and soil fertility).
These factors entail aspects of nature and agricultural practices (species, harvest practices, and residue use) [9,10]. They vary slightly with locations. Harmonized values are considered to estimate the energy potential. The soil organic carbon (SOC) requirement also limits the residue harvest. SAF includes a portion of SOC that is retained with the portion for soil fertility. It is beyond this study’s scope to account for all SOC factors.
The conversion factors that were not taken directly from the literature were estimated by Equations (1) and (2) based on literature data on crop yield per hectare (Y), respective residues (R), and the surplus left for energy after basic uses (Rs). The RPR factor implies for both field and process [11].
2.3. Biomass Energy Potential Assessment Methods
The potential assessments are basically of four types by availability and three by motivation, as respective are (theoretical, available, technical, and economical), and (demand- or resource-focused, and integrated) [9,12]. This study estimated the resource-focused, theoretical, and available potentials. The available and technically available potentials are considered to be different in some of the literature, and both are the same in others. In this study, the available potential includes the technical potential.
2.4. Data Analysis and Characterizing Method
The data was analyzed through statistical and mathematical analytical methods. A quantitative analysis of the data and the results, independently or together, was carried out to describe and characterize the potential and its nature.
The analysis methods for estimating the energy potentials described in the next section are similar to those from previous studies. However, a new analysis method, measure, and view were defined for describing and characterizing the residues as well as crops’ natures by their conversion factors. In addition, a wider period of data and additional crops were considered for the analysis of the variations in the years and the addition of fuel options.
Accordingly, the information in the data, conversion factors, data analysis results, and/or combinations were described and compared. Natural potential levels of the residues and crops were rated, compared, and prioritized by defining measures. The nature and practice contributions to the potentials were also analyzed and characterized for a comparative description of the potentials and the implications of the nature and practice.
2.4.1. Residue Biomass Resource and Its Energy Potential
To determine the energy potential of a residue, first, the residue amount potentially available for energy (RAPA) is estimated by Equation (3) from the parent crop yield Yj (collected data) and the respective i-th residue conversion factors RPRri and SAFri. Then, the energy potential of each i-th residue (Eri) of a given crop is obtained by the i-th residue LHVri, as given in Equation (4). While the energy potential of a crop from its residues is the sum of its residues’ energy potentials.
Annual yield, RAPA, and energy potentials, variations, and increments were also examined by standard deviations, coefficient of variations (CoV), and % of increment in the final year relative to the base year.
2.4.2. Categorizing the Residues and Crops by Their Nature
The crops and residues were also categorized and compared based on an analysis of their factors as indicators of nature for their total natural residue quantities and total available residue for energy. Further, by analyzing the RAPA quantities compared to their respective crop yields, their natures were characterized, and their natural quantity contributions to the energy potential were described.
2.4.3. Residues and Crops Natural Potential (Capacity) for Energy
- I.
- Natural Potential
The natural potential capacity for energy of a residue or a crop is a measure of the capacity for energy determined by their nature, suitability, and abundance, irrespective of the crop yield by practice. As identified and defined in this study, this capacity describes quantitatively the resource level of the potential capacity for energy. It is a capacity that represents a residue amount per given crop yield naturally, its availability for energy per given residue, and its energy (fuel value) per given residue cumulatively.
- II.
- Potential Value for Energy Assigning and Prioritizing
Potential value for energy (PVE) is a numerical value for the comparative level of potential capacity for energy. It is determined and assigned to a residue or crop based on the conversion factors. It reflects all the natural properties together. Accordingly, the residue and crop capacity levels were rated as well as ranked to prioritize them. It is useful to select wisely the best of these resources amongst them or, as compared to others not included in this study, by assigning the values similarly.
This potential value for energy (PVE) is described from two perspectives (resource and application perspectives). In both cases, the higher the PVE, the better the capacity.
Resource perspective PVE of any i-th residue, (PVERri), is analyzed and determined from all the factors (RPR, SAF, and LHV). Naturally, the residue amounts per crop yield (natural quantity potential) are fixed by RPR, irrespective of the final portion for energy. SAF and LHV are also basic factors that determine the availability of fuel and energy potential. Thus, the PVERri is defined by the product of the three factors as given in Equation (5). The higher value means a higher capacity as a fuel resource per given crop yield and residue. Then, a crops’ PVER (PVERc) is the sum of its residues (PVERri).
Application perspective PVE of any ith residue (PVEAri) is also identified and defined by analyzing two factors, (residues’ surplus availability factors SAF and their fuel values by LHV). Together, they determine the residue availability for energy and fuel values. Therefore, based on the factors, their product is taken to be the indicator of the PVEA, as given in Equation (6). The higher the value, the better the residue as a fuel from an application perspective. This value is a useful indicator for sectors that act on consumption (like industries) for their selection interests and related economic analyses. It measures the availability and its energy together per given crop yield and residue. Then, the crop PVEA (PVEAC) is the sum of its residues (PVEAri).
2.5. Implications of Contemplation of the Resource Route to Consumption
Analyses and reflections of authors based on observation and knowledge input of the Ethiopian case were considered for the implications of the resource’s directions, recommended routes, and interventions. Insights from industry surveys and household energy situations, together with the authors’ knowledge of the Ethiopian situation and literature based universal facts of the subject, were considered.
3. Results and Discussion
3.1. Annual Crop Yield Trend and Comparisons
Annual crop yields, the gross yield of all the crops, five-year average yields, the shares (proportions) of crop yields in the gross yield, and the increments in the yields over the five years are presented in Table 1. The five-year average gross yield is 29.54 million metric tons.

Table 1.
Annual and Five-Year Mean Crop Yields in Metric Tons with Proportions and Increments.
Seven major crops contribute to 90% of the gross crop yield. Five of these major crops (maize, teff, sorghum, wheat, and pulses) also dominate the yield, contributing 81% of the gross yield. Their proportions are also greater than 10%. Following these five crops, the next two major crops are barley and finger millet, which together contributed to a 9% share.
Crop yield is a major contributor to the residue amounts potentially available for energy and to the energy potential. Crop yield increment rates for these seven crops are also substantial in the next five years. The lowest rate in the group is 7% for barley and more than 18% for others. In general, these seven crops are the major ones with mass yields, and the first five are also the dominant.
Further, it can be deduced that there is a general increase in the yield, except in the case of sugarcane and cotton, whose yields decreased by 4% and 4.9% in 2018 from 2014. For others, their collective yield increased by 21.7% in the five years. The overall collective increment of gross yield is 20.33%, with a per crop normalized increment rate of 18.7%. This rate of increment in gross yield is also similarly reflected in the energy potential. Cotton and sugarcane yields decreased due to restraint in cultivation caused by the delay of industry projects for which they were optimistically intended to be consumed.
3.2. Characterizing and Grouping by RPR and SAF
Source-side residue amount per crop yield (biomass resource) is fixed by the crop total RPR (RPRc). It is the sum of all of the residue RPR factors (RPRri) of a crop. Thus, based on this crop total RPRc the crops were grouped into two.
Group I comprises (coffee, maize, teff, sorghum, wheat, finger millet, rice, cotton, and OSOS). They have RPR values of (1.5–3). Thus, they produce a higher quantity of residues than their crop. Hence, their natural quantity-based potential capacity for energy is higher as compared to Group II, which discounts competing demands.
Group II comprises crops with an RPR of less than 1.5 (sesame, sugarcane, barley, and pulses). These crops have a lower residue quantity than their crop yields. Thus, the amount-based potential capacities for energy of these crops are lower than those of Group I.
The potential of the residues in the RAPA (residue amounts potentially available for energy) depends on the SAF and RPR. Inspecting SAF values reveals that fourteen residues have SAF values of (0.8–1), of which eight of these residues have SAF values of 1. This means that all their residues can be considered for energy. Thus, based on their SAF values, the residues were categorized into three groups.
Group I is composed of eight residues with SAF values of one (oilseed stalk, sugarcane bagasse, cotton stalk, cotton husk, cotton ball and shell, maize husk, maize cobs, and coffee husk). They have the highest availability.
Group II is for the next six residues with virtuous availability (SAF values of [0.8–0.85]). These are sugar cane tops and leaves, maize stalks, sorghum stalks, finger millet stalks, sesame stalks, and rice husks.
Group III is composed of the remaining six residues with low availability of energy (SAF values of less than 0.5). These residues include wheat straw, husk, barley straw, pulse’s stalk, teff straw, and rice straw.
3.3. Residue Amounts Potentially Available for Energy
Residue amounts potentially available for energy (RAPA) are presented in Table 2. The gross national RAPA (mean of the five years) from the thirteen crops is approximately 35 million metric tons. The previous estimate by Gabisa and Gheewala (2018) [7] was approximately 40 million metric tons for the year 2015. The estimate in recent literature by Tollessa was approximately 52 million metric tons for the year 2021 [13].
Table 2.
Five-Year Mean Residues Amounts Potentially Available for Energy (RAPA) and Proportions.
Proportions of the maize residues, 44.4%, and of the sorghum, 20.4%, are the highest of all the crops. These crops’ RAPA proportions are also higher than their respective crop yield proportions of 25% and 15.17%. This is due to their residues’ nature, as they are naturally rich per crop yield. Sorghum’s RAPA share of 20.4% is twice teff’s RAPA share (9.42%), despite a higher teff’s crop yield share (16.21%) than that of sorghum (15.17%). Thus, sorghum’s natural potential for energy in its natural quantity is more than double of teff’s natural potential capacity. Similarly, finger millet yield and RAPA proportion compared to the proportions of wheat were revealed to be higher in the case of RAPA. The yield proportion of finger millet was 3.22% (one-fifth as compared to the wheat 14.59%). While its RAPA proportion is three-fifths of the wheat RAPA. The same improvement was revealed in the energy potential share, which became three-fifths of the wheat energy potential. Again, as compared to barley, finger millet yield share was 50% of barley yield share. However, its RAPA was folded in reverse to be twice the barley RAPA share.
Overall, the seven crops contribute to 91.55% of the gross RAPA, which is the total residue biomass. They are the major staple food crops in Ethiopia. From these seven, the first five contribute to 84.75% of the gross RAPA. Again, the first three of these major crops (maize, sorghum, and teff) share 74.31%, making them the dominant ones in Ethiopia. Following these three, the next two prominent RAPAs are from wheat and pulses, which together contribute 10.44%. The last two of the seven major crops are finger millet and OSOS, with a combined share of 6.8%. Coffee, barley, and sugar cane follow from 2.45 to 2.18 and 1.98% to contribute a share of 6.61% together. The rest, 1.84%, is a total from sesame, rice, and cotton, with respective RAPA shares of less than 1%.
Comparisons of the discrete crops’ yields to their respective total RAPA are also given in Table 2. It reveals that, for some crops, RAPA is lower than their yields and higher for others. It is depicted to be less than the yield, in the cases of barley 39%, teff 69%, wheat 50%, pulses 53%, and sugarcane 49%. While those crops with RAPA higher than their yield are cotton 508%, maize 210%, OSOS 200%, coffee 200%, sorghum 160%, finger millet 140%, sesame 117%, and rice 104%.
3.4. Gross Energy Potential and Annual Variations
Annual and five-year mean energy potentials by crops, residues, and gross are given in Table 3.
Table 3.
Annual and Mean Energy Potentials with Proportions, Rise, and Annual Variation.
The five-year mean gross energy potential from all the crops’ residues is estimated to be 494.71 PJ. This is equivalent to 11.8/16.9 million tons of oil/coal. It is approximately 3.5 times all the conventionally imported fuel, or 50 times the (oil and coal) imported in 2018.
This study’s gross energy potential estimate is lower than the previous study by E. W. Gabisa and S. H. Gheewala for the year 2015 [7]. Annual yields increased every year, and additional crops were included in this study, so a higher potential was expected. However, the previous study’s estimate of 550 PJ was higher. For the same year (2015), it is 482.5 PJ in this study, which reveals a considerable difference. The major difference is in the coffee potential (70 PJ), caused by a major difference in the conversion factor. This is also a major cause of the difference in the gross potential. As compared to the study by Tollosa, the possible productivity increase contributed to the potential rise of the crops compared to this study.
The annual variability of the gross energy potential is 7.7% COV and 37.98 PJ standard deviation. The increase in energy potential from 2014 to 2018 was 25%. Both the variations and increments in the five years are substantial, which indicates a possible future rise in the potential because of expected productivity enhancement and scaling cultivation areas. Scaling agricultural areas and productivity will have a great contribution to the future potential. This could be the reason for the potential increment, which was also revealed in recent research by Tolesa [8].
3.5. Energy Potentials of Crops and Residues
Crops’ and residues’ energy potentials and respective proportions % in the gross energy potentials are presented in Table 3. Annual potentials are given for the crops only. While the mean five-year energy potentials are both for the residues and crops. The proportions reveal that maize stalks’ energy potential dominance at 35.3%. Next to the maize stalk stands sorghum stalk (17.95%) 2nd, teff straw (9.35%) 3rd, maize cob (6.96%) 4th, wheat straw (5.9%) 5th, pulse stalk (4.46%) 6th, finger millet stalks (4.17%) 7th, maize husk (3.78%) 8th, and oilseed stalk (3.2%) 9th. These nine residues from the seven major crops are the major resources and contribute to 91% of the gross energy.
Stalks of pulses, finger millet, and sorghum are better resources than straws from teff, wheat, and barley. They possess a better natural potential, and together with their relatively moderate practiced quantity (yield) in Ethiopia, they present a good potential as a result of the combination. Teff’s potential is mainly due to its practiced quantity. Its yield share of 16.21% is greater than the sorghum yield share of 15.17%. However, sorghum stalks energy potential is twice the teff energy potential due to its nature. Similarly, sorghum’s energy potential is more than twice of wheat’s energy potential, despite a comparable yield proportion. Similar to teff the wheat straw and barley straws energy potentials are mainly from their practiced yield quantity. The barley straw yield proportion was twice that of finger millet, but on the contrary, the finger millet energy potential proportion is twice of that of the barley. A crop with a relatively good energy potential in both yield and nature is rice. While the level of the yield of cotton was lower as compared to rice, its natural potential capacity for energy is much higher. Thus, even though rice potential is at a good level, the cotton energy potential is better and 1.5 times the rice energy potential. Rice’s superior yield proportion over cotton’s yield, which is threefold that of cotton’s yield proportion, was overwhelmed by cotton’s energy potential.
The crop-wise energy potential contribution to gross energy shows that the maize share is also the highest and dominant at 46.26%. Crops’ energy potential contribution shares to the gross national energy potential are illustrated in Figure 1. The seven major crops (maize, sorghum, teff, wheat, pulses, finger millet, and OSOS) together contribute to approximately 92% of the gross energy potential. This share is also similar to the RAPA share of these seven crops. Thus, as expected, the only cause for the difference between the crops’ RAPA shares and their energy potential shares is their LHV. From these seven major crops, the first five major crops—maize, sorghum, teff, wheat, and pulses—also dominate the group, taking an 84.6% share. The first three are also the most dominant, at 73.3%. While the rest two crops of the seven major crops that contribute the least to the group are finger millet and oilseeds. Their respective shares are 4.2 and 3.2%, and together they contribute 7.4%. Out of these seven major crops, the remaining crops that collectively contribute to 8% are coffee 2.2%, barley 2%, and sugarcane 1.9%, which collectively contribute to 6.1%. The rest of the 2% is a total share from sesame 0.9%, rice 0.7%, and cotton 0.4%.
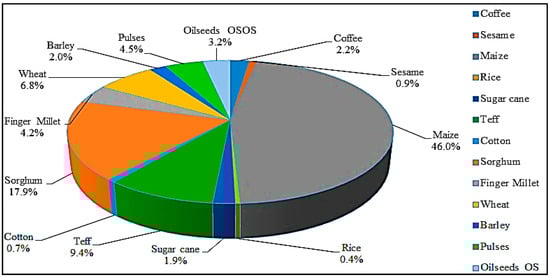
Figure 1.
Shares of the crop’s energy potentials with the gross national potential.
Commercial crops (coffee, sesame, sugarcane, and cotton) combined contribution is 5.7%. It is low, as compared to the major staple food crops (maize, teff, sorghum, wheat, pulses, and F. millet) contribution of approximately 89%. However, they are important ones that are located in concentrated, large mechanized farmlands. It is easier to collect and manage these crops’ residues than those of major crops that are obtained from more scattered and distributed locations throughout the country’s regions and individual farmers’ farmlands. While commercial crops like sugar cane are cultivated on relatively more concentrated, large farmlands. Sugarcane is mainly related to the sugar industries, and they are found close to the industries. Similarly, sesame and other commercial crops like cotton are cultivated on large and concentrated farmlands. Further, as the commercial interests for these crops rise with industrialization and further enhanced commercialization, their yield and energy potentials are expected to rise. In accordance with and together with their relatively better application perspective and potential capacities as described in Section 3.7, they are potential biomass resources for fuel.
3.6. Regional Energy Potential Distributions and Shares
Distributions of the crops’ energy potentials in the regional states and the regional land areas are presented in Table 4. Whereas the regions’ contribution shares in the gross national energy potential are illustrated in Figure 2. The regional potentials are influenced by the regional area, agricultural activity and suitability, and agricultural practice culture. Oromiya, Amhara, SNNP (South Nations Nationalities and Peoples), and Tigray, regions are orderly favored for agricultural productions and so are ordered accordingly by their energy potential. Respective contributions are 50%, 30%, 11%, and 5.71%. The contributions from the Gambela, Benshangul, Somalia, and Afar regions are very small, as shown in Figure 2. Despite their large areas, their farming practices and population densities resulted in lower crop yields and energy potentials. Somalia and Afar regions have larger areas compared to Tigray, but have lower shares.
Table 4.
Crop-wise Energy Potential Distributions in the Regions (PJ/Year).
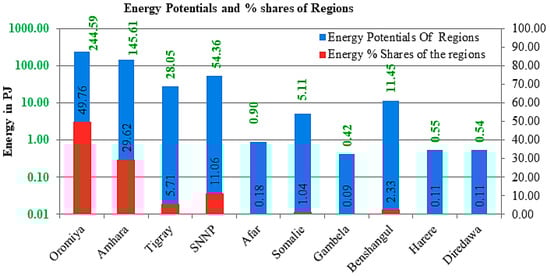
Figure 2.
Regional energy potentials and their share % to gross national potential.
The Gambela and Benshangul Gumuz regions have suitable farmland areas. However, the population density and farming activities are low. The potential is expected to increase in these regions, with particular attention to agriculture. Diredawa and Harare are small in terms of their area shares, and their potential is proportional to their area. The potential of all the regions, especially those with low yields, is expected to increase with the expansion of irrigation, an increase in farmlands, and farming practices.
3.7. Potential Value (Capacity) for Energy
Resource perspective potential value for energy (PVER) of the residues (PVERr) is presented in Table 5 and of the crops (PVERc) in Table 6. In both cases, the values show the rated level of potential capacity and a comparative ranking among them. Thus, the rated level values and ranks show a cumulative value that shows a better capacity for energy by the combined effect of either their better residue quantity amount by nature per crop yield, or their better availability for energy by a lower competing demand, and a better fuel value. This is a universal measure, irrespective of crop yield quantity or agricultural practice. It is useful for comparing and choosing the resources from a resource perspective. It acts as an overall resource capacity indicator and as a focal indicator, since it also integrates the energy application side within it. This capacity also adds value to a crop’s value based on its agricultural position from an energy perspective.
Table 5.
Potential Value (Capacity) for Energy of the Residues {Resource Perspective}.
Table 6.
Potential Value (capacity) for Energy of the Crops (Resource Perspective).
Among the residues, cotton and OSOS stalks have the highest PVER values. Crop-wise cotton, maize, OSOS, coffee, and finger millet have the highest PVER. These values, together with the practiced quantity of the crops, imply the overall energy potential.
The application perspective potential value for the energy of residues (PVEAri) and crops (PVEAc) is presented in Table 7 and Table 8. This indicator rates the residues’ resource capacities for energy from an application interest perspective and is concerned with prioritizing use in the sense of the better resource first. It compares the residues and crops by their residue resources, in the sense of the better residue amount available and accessible for energy, with a higher fuel value per given residue per given crop yield.
Table 7.
Potential Value (Capacity) for Energy of the Residues (Application Perspective).
Table 8.
Potential Values (Capacity) for Energy of the Crops (Application Perspective).
By residues, cotton residues have the highest PVEA, which also led cotton to possess the best PVEA crop-wise. On the contrary, those residues with the lowest PVEA of approximately four are straws of barley, teff, and wheat. Residues of moderate PVEA (10–5) are sorghum straws, rise straws, and pulse stalks.
Crop-wise, the highest capacity is in cotton 51.2, then maize 39.9, sugarcane 23.6, rice 19.8, oilseeds 15, coffee 12.8, finger millet 12.4, and sesame 11.5. Moderate PVEA is revealed in sorghum. While barley, teff, wheat, and pulses have the lowest PVEA.
Crop-wise and residue-wise comparisons of PVEA are not the same, both in values and meaning. However, both imply a residue biomass resource. Both are useful to value the residue resource for fuel by residue and by crop. It also implicates crop values from an energy perspective.
The PVE of cotton is the highest in both perspectives, which means that it is the best biomass fuel resource for thermochemical energy by nature as compared to others in this study. Maize, oil seeds, coffee, and finger millet, are crops that have the next best PVE. Generally, these natural measures, in both views, are decisive for comparison, prioritizing, and selection of residue for energy utilization. They are also important values for the crops, as they add value to the general crop values from an energy perspective. Both quantity and quality are crucial from a resource perspective, almost at a similar rate of 50/50. While application-side interest is dominated by quality and ease of availability. The amount is also always important since fuel feedstock demand is naturally much beyond the sustainable biomass resource amount. Thus, it implies that any available resource is worthy, irrespective of quality, though the prioritized use is wiser. Further, the cost related to the energy value of the crops needs to be accounted for in the economic analyses of their residue consumption and cultivation.
In this case, these values are also crucial for determining their costs by inter-relating with other factors and mainly by interpolating based on PVEA for economic analyses of their fuel use and related projects.
3.8. Summary of the Crop’s Nature and Hypothesis
The hypotheses were general and universal to these resources’ natures and their expected potential. The first expectation was that the energy potential of a given crop from its residues is proportional to its yield. This is revealed to be true in all the crops as viewed in a discrete crop separately. Their energy potential increments are proportional to their respective yield increments. However, this proportionality of increment in potential by yield is not the same across crops.
The second hypothesis is that crop yield is the major contributor to the crop’s overall energy potential. This was true for some of the crops, but not for others. In some of the crops’ cases, it was revealed that their contribution to the energy potential is mainly influenced by their nature rather than the practice’s (cultivation yield) contribution. Their conversion factors’ (nature) contributions were more influential in folding the energy potential at a higher rate than the yield increment. This is shown in those crops with a crop total RPR greater than 1.25 and a SAF of 0.8 to 1. Their energy potentials were enhanced by their factors rate in a proportion higher than one (the yield increment rate). Their nature contributed to their higher energy potentials than the practiced crop yield as owed naturally.
The third hypothesis is similar to the previous one and expects the proportions of crops’ energy potentials in the gross potential to be mainly affected by the yield. This is partially true, as is revealed in similar nature crops with similar residues (straw-straw or stalk-stalk), where yield is the major influencing parameter in their share of gross energy. However, this was not true among the different crops with different residue types (straws vs. stalks). The crops with stalks have better natural potential (PVE) that scales their energy potential shares to the gross energy potential.
Typical examples were sorghum and finger millet, which were revealed to have energy potential shares of greater magnitude than their crop yield shares, caused by their natural positive effect on their capacity for energy that naturally scales the residue amount for energy and the energy potential at a higher rate than the practiced yield increment rate.
3.9. Inference of the Resource Route to Energy
The better and recommended route to consume these resources for thermal energy is through pyrolysis (carbonization) and mechanical densification, or together [14,15,16]. Further, economic collection and transport are essential. Their enhanced and economic consumption depends on an optimized treatment and conversion through these routes together with low transport costs. Carbonization and densification increase the heating value by 40% [16]. Densification removes biomass moisture, increases uniformity, and maximizes the material and bulk density to upgrade its fuel properties, like energy density (fuel value). Thus, it is a critical route for better combustion efficiency as well as emission performance during conversion into energy and for a lower cost of transport and handling. Its transport cost is reduced to a similar level as the densification rate. Its uniformity and density also improve the handling and processing of feeding, which enables better control, simplified feeding technology, and a smooth process of conversion, to energy.
Carbonization (pyrolysis) removes part of the biomass’s oxygen content, moisture, and light volatiles to enhance its energy density and thus its fuel value. This treatment minimizes the major components that release smoke and soot and contributes to an efficient combustion and cleaner flue gas. The heating values of the carbonized residues are approximately 28–40% higher than the raw sources [16]. Both carbonization and densification can also be considered to produce better fuel-value carbonized briquettes or briquettes of carbonized residues [17,18]. Torrefaction is also a light pyrolysis with a better fuel-property product than the raw biomass. It produces a softer and more brittle product, which is a good property for size reduction and better combustion [18]. It reduces the energy required for size reduction by 80%, which lowers the cost of the resulting powdered fuel or the pellets and briquettes produced [18]. Torrefied pellets and briquettes are also of better fuel values and ability to ground and are essential for pulverized co-firing [19]. The energy for milling the briquette or pellet is minimized, which reduces the energy needed and lowers the cost of co-firing with coal. Thus, torrefying and carbonization are essential for economic and scaled biomass consumption by cofiring. The LHV of raw biomass varies between 8 MJ/kg and 20 MJ/kg, while the torrefied forms have a superior LHV that is scaled up to 58% [5,19]. The hydrophobicity and friability are also improved for better handling, efficient conversion, lower pollutants, and the ash effect [14,19,20].
Residue sizes are large for direct co-firing and are also of low energy density, for which they need densification and size reduction. Higher energy density and much smaller sizes are essential for co-firing with coal. The combustion rate and efficiencies are enhanced to be comparable with coal in terms of the uniformity of combustion and reduced particulate emissions. For co-firing in pulverized combustion, biomass sizes of 212–300 μm were revealed to be suitable and comparably good with coal sizes of 75–90 μm [21]. Thus, size reductions, either through chipping, milling, pelleting to less than 7 mm in diameter and 30 mm in height, and milling the pellets, are crucial treatments for cofire, especially in pulverized and fluidized bed reactors.
In addition to regular carbonization, hydrothermal carbonization or liquefaction (HTL/HTC) are more advanced and effective pyrolysis methods for producing biochar, bio-oils, and gases [22,23]. Through HTC/HTL, the oxygen content of biomass (40–60%) is extracted by dehydration as water or by decarboxylation as carbon dioxide [24]. They are better than regular pyrolysis and are effective routes to biochar and bio-oil. They can easily handle critical issues like, high moisture, heterogeneity, low density, and higher contaminations to which residues are prone [15]. In addition, mixtures of organic feedstocks (different residues) and residues with other biomasses and wastes like MSW and SS are easily treated through HTL, which is difficult in regular pyrolysis [15].
Bio-oil which can be produced up to 60% of the raw sources’ mass are of much higher energy density than their raw sources [22]. Higher fuel value bio-oils are achieved through enhancement methods that include Ball milling of raw biomass to decrease cellulose activation energy, microwave pretreatment (180 °C for 7 min) to maintain solid-liquid forms and water extraction at 160 °C enhances hemicellulose degradation by fast pyrolysis, which improves the resulting bio-oil fuel value [22]. The advantages of HTL outweigh the regular charring pyrolysis and HTC. However, the latter two are preferred for their cost and ease of production at lower pressure and temperature [23].
Thus, the densified, torrefied, and carbonized forms by regular pyrolysis and HTC are preferred and need attention to develop their technologies locally. These upgraded forms are suitable for better and more economical energy transport, facilitation of their consumption by simplifying and enhancing the conversion process, enabling the suitability for their commercialization as well as the handling in the supply chain, and for their modern and efficient conversion in combustion reactors. Raw residues are common inputs to the pellet industries after which the pellets are consumed in households and industries [24]. These densified fuel forms improve stove efficiency twice [25]. Hence, it is essential to the overall national biomass use efficiency in Ethiopia as stoves consume 80% of the biomass. Thus, to slacken the burden on other biomass, especially on the forest biomass to contribute to its sustenance.
Realizing small-scale decentralized carbonization and densification requires optimized technology to limit the process’s energy and technology effect on the final pellet cost. In this regard, carbonization by regular pyrolysis or torrefaction is better. In addition, densification rate, technology, and resulting fuel quality beyond moderate and regular use are not desired as they scale the fuel cost [26]. Their production costs are added to the fuel cost at a higher rate than the benefit from the resulting upgraded one. In the Ethiopian case, the main use of biomass fuel is for household stoves and industrial consumption in pulverized co-firing, packed bed reactors, furnaces, and burners. Hence, regular pellets and briquettes are enough in most cases. Hence, for transport cost and regular combustion advantage, low to moderate-quality pellets are recommended.
Thus, optimized economic densification is the concern to be addressed for a suitable level of densification by a less sophisticated technology for transport and regular applications, the medium quality is acceptable at 250 kg/m3 to 300 kg/m3 especially if transport and storage are the major concerns. To optimize these concerns, imagining a relatively lower-quality pellet or briquette with a simpler technology is the solution for economic densification. Thus, needs to be implemented in the locations of biomass collecting centers. In this regard, briquettes are also preferred over pellets as they are simpler, and can accommodate larger sizes (chopped) residues [26]. Low-pressure briquette from chopped residues with binders (starch, molasses, maize stalk, and bagasse) by a simple press technology is a means for simple and low-cost briquette production at the source. A decentralized briquetting treatments at the source locations are critical to reach the resources to upgrade at the source and to benefit the local farmers from the business.
The upgraded fuel is also strongly recommended to be consumed in improved, efficient stoves or reactors in existing industries. In industries, it is better to be consumed either as pre-conventional utility biomass reactors or by regular co-firing with coal. When considered in biomass reactors before conventional boilers or burners, the heat generation fluctuations caused by low-quality fuel (briquettes) and feed intermittency are compensated by the conventional utility reactors through their fuel-feeding auto-regulators. Further fluctuations due to biomass supply intermittency, biomass type changes, and possible halts of biomass reactors due to supply shortages are compensated and handled by the conventional reactors to keep the process unaffected.
Hence, biomass reactors are better to implement before the existing conventional fuel reactors in industries or parallel to them rather than to replace them. This approach also allows simple integration at a low investment cost by retaining the existing process unaffected while implementing biomass reactors. Thus, helps to act quickly and economically to intervene in consuming these resources through this simplified approach of utilization for enhanced and locational biomass consumptions on the respective source locations to facilitate the interventions and reaching the source to exploit the resources. In accordance, the biomass variety nature and the low-grade residues fuel are handled to be consumed so that to benefit the most and economically. These pre-conventional biomass reactors can be sized at lower capacities of approximately 50–60% of the conventional utility boilers, burners, or furnace power capacities to alleviate portions of the oil or coal.
In energy-intensive industries like cement, steel, and particleboards, it is economical to co-fire directly as commonly practiced. However, other means could also be considered to avoid size reductions for co-firing. A possible option is to couple a packed bed gasifier or combustion reactors in parallel. Typical interventions exist in different different industries at different locations to consume respective resources. Maichew particle board factory in Northern Ethiopia consumes a sawdust byproduct in a burner that supplies flue gas to dry wood chips flakes. A packed bed gasifier or combustion reactor of a lower capacity at approximately 60% by heat can be coupled in parallel to supplement the burner by consuming branches cuttings of the eucalyptus wood logs processed for particle board production or residues from nearby towns in briquette forms. Thus, syngas or flue gas output from this reactor can be supplied to the top of the burner together with a secondary air supply aligned to this inlet to burn the syngas or unburned components of flue gas before the burner exits. Thus, to be mixed with the burner’s regular flue gas output and supplied together to the drier for drying wood chip flakes. Supplementing the oil fuels by biomass fuel the furnace oil consumption could be minimized to more than 50%, especially with additional reactors keeping the process controlled by the oil. Similarly in the cement industry, a packed bed or a Fluidized bed Gasifier reactor can be coupled to supply syngas to the kiln inlet through the clinker exit hub or to the Calciner exit to kiln. A packed bed gasifier reactor that considers the briquette of these resources (residues) is a possible option to consume them in the cement industries to supplement the industries’ fuel needs. Accordingly, the syngas output can be supplied to the Clinker with the hot air inlet and or to the calciner. In addition, torrefied pellets milled to smaller sizes can be cofired in the built-in pulverized coal-biomass cofiring in the Calciner. Similarly the coal feeding can regulate the fluctuation of the additional reactors to be implemented and the co-firing.
Co-firing of low-quality fuels like residues is favored and is simpler for large-scale combustors as compared to small scales [20]. Thus, different residues can be burned cofired in the industries’ burners, large furnaces, and Calciners by just shredding. However, high volatile content needs enough air supply and control to avoid fast combustion and prevent them from producing CO, Hydrocarbons, and PAH in the flue gas [26].
The respective locational consumptions in vicinity households and industries are recommended based on the fact that the quantities of these resources in most cases are not even enough for use in the vicinity households and industries. It is not feasible to consider them for a separate and new stand-alone biomass-based reactor that depends on these resources only. This is because; it is economical to consume them in the existing ones rather than investing in a new one to use this resource which is not even enough for the existing industries and households. Their distribution throughout locations is also a nature that promotes a similar distributed consumption approach in the respective locations. Only in rare cases, if the available resource is beyond and enough for additional reactors it is feasible to transport for other locations households, and industries. Then again, only if it is beyond this, it can be considered for additional new reactors and small-scale decentralized electric power generation. Power generated could be for local use or grid integration as a better means of transporting the resource to longer distances. Even though converting to electricity and consuming it in households is a modern form of energy use and preferred even over modern biomass stoves, different factors limit the implementation. It depends on the economy and commercialization which is dictated by the collection, conversion technology, and the grid network suitability for decentralized locational power plants. This is because it is better to consider small-scale power generation for economic transport of the resource energy through an existing grid and to get the resource in a more cleaner and efficient consumption route.
Collection Efficiency is a major factor in exploiting these resources due to transport and collecting challenges [26,27]. Essential aspects are the collection technology, storing, upgrading for energy density, transporting, modernizing, and commercializing to connect with end-use. Hence government and private sector involvement are vital. As inferred, a decentralized and prioritized approach to satisfy nearby communities and industries is critical for economic consumption. Local use in processing industries where the residue is produced is more economical than transporting it as a major fuel for power generation [20,26,28]. In the Ethiopian case, there exists plenty of potential for electric power from other renewables like Hydropower potential at 45 GW [6]. In addition, solar, wind, and geothermal, potentials are available for future taping and are preferred over residue biomass for electric power generation.
Initiations by the industries to co-fire biomass are intensified as caused by environmental concerns and cost rises of imported petroleum/coal. Thus, it is compelling for the industries to hunt biomass by their initiations as there is no commercial biomass fuel supply. As surveyed by the researchers’ industry visits some of the northern Ethiopia Industries have built-in or integrated biomass co-firing running at a lower capacity of the design. They are suffering from biomass fuel supply shortages. Maichew particle board and Messobo cement industry are typical industries in Northern Ethiopia that co-fire biomass in their burner and Calciner respectively.
Therefore, a modern and commercialized system of sustainable biomass supply in general and an upgraded form of these resources is required especially for households and industries. Together with an efficient utilization approach these resources also need attention by targeting these two (households and industries) major biomass consumers in Ethiopia. In accordance, and as a major emphasis to the collection, small-scale locational rural central treatments in proximity to sources are required to upgrade these resources at their source and minimize the transport cost. These centers are recommended at (10–15 km radius) up to 25 km of road equivalent as a first stage. Owing to rural infrastructure limitations the transport, in this case, is by animals (camels, donkeys, and carts) based on residue forms. Then, treated forms of these residues are recommended to be transported to the next sub-central stocks at 100 km diameter from the source (40–75 km road equivalent) from the first stage local centers. Further treatment or consumption, at an additional 100–150 km radius distance is admissible to allow coverage of a total and maximum distance of 250 km road distance. Upgrading is costlier than transport cost for the close-distance consumption [14]. At a critical distance of 275 km, the costs of pellets and raw residues are similar, but it is lower for pellets at greater distances [24].
For applications at close distances of less than 50 km from the sources, raw residues or mildly treated forms by low-cost treatments are recommended which include (open-air dried forms, solar-dried forms, and solar mild pyrolysis or Torrefaction treatments). These methods are preferred to cut unnecessary upgrading costs.
Other conversion routes to energy use are, anaerobic digestion to get biogas as fuel and digestate (byproduct) as a fertilizer, aerobic digestion process to get bioethanol, and pyrolysis of lignin for bio-oil, and lipids portions to biodiesel production that all can contribute to a sustainable energy mix [29]. Some of the residues, like rice husk or sugarcane bagasse, maize stalk, and Maize husk, are suitable for bioethanol and biogas. Some of the residues can also be used as raw materials for paper making and construction materials. Residue type, Soil type, climate and Economic factors of the deposition methods, and the potential value of the residues determine the route. Biomethane is a flexible renewable energy carrier and is possible to be obtained without interruptions. It is also applicable in the heating, transport, and chemical industry sectors due to its suitability to store and be transported through piping or storage containers.
Ligno-cellulosic biomass has challenging structures that resist anaerobic degradation. Only treatments like steam explosion, alkali treatments, and enzymatic hydrolysis can enhance the accessibility of the biomass components and facilitate the breakdown of complex polymers for microbial conversion to improve bio-methane yields [29].
Physical, chemical, and biological pretreatment methods break complex structures, remove impurities, and improve enzymatic hydrolysis efficiency, size reduction enhances the surface area and the cellulose and hemicellulose exposure to enzymes. Chemical methods also disengage the lignin matrix to solubilize hemicellulose, facilitating enzymatic hydrolysis all of which are essential for subsequent biodiesel production [29].
Compositions of different residues suitable for biogas and bio-ethanol productions are provided with the feed compositions for conversion [29,30]. Approximately 40–50% of the agro-industrial residues composition is Cellulose an insoluble homopolysaccharide composed of sugars and formed via-D-pyranose units with glycosidic bonds, while approximately 40% of the composition is hemicellulose, which contains pentoses, hexoses, and uronic acids.
Fermentation of sucrose crops as the first generation of ethanol is facing challenges of controversy for sustainability due to its combat over food security [31]. Thus, residues considered as second-generation sources of bio-ethanol are important feedstocks for the future [29,31]. Some of the residues are suitable for bioethanol. Rice husks with high concentrations of cellulose and hemicelluloses, rice straw, wheat straw, and corn husk are potentially good sources of biofuels through hydrolysis or saccharification (converting higher carbohydrates like cellulose) into mono-saccharides (lower sugars) by reacting (water with an acid or enzyme that breaks up carbon molecules), and then the fermentation process (anaerobic glucose breakdown) [29,30]. Bagase that contains cellulose (33–36%), hemicellulose (28–30%), and lignin 22% is rich in polysaccharides. Even though it is used for electricity production directly through combustion, it can also be converted into ethanol through pretreatment before fermentation to convert easily the polysaccharides into simple sugars for enhanced ethanol production of 90% compared to the production without treatment at 20% [30].
A combination of bioethanol and biogas production is also considered as an option for a higher potential and output of the biomass resource, to improve mass and energy balances of the discrete processes to enhance the overall conversion especially, through the bioethanol production [31].
Other forms of depositions also compute with energy use. These include on-the-farm and off-the-farm uses. On the farm, residues mix with soil to enhance soil structure, organic content, and water retention capacity, and act as a shield to prevent, soil moisture, soil erosion, and weeds. In addition, further composting in the soil amends the nutrient content which is a crucial deposition but with methane emission drawbacks. Thus, the consideration for energy need not adversely compute the soil condition, and special attention is required to every respective location during harvesting. Partially the soil conditions are maintained by considering the availability factor. However, not accurately addressed to each of the locations because of the normalized value nature in the potential assessment which needs to be specific location oriented.
Off the farm, uses include converting the residues based on their composition into different forms and materials for different applications which include 1. Bio-based chemicals (organic acids, furans, and phenolic compounds) useful for pharmaceuticals, food, and cosmetics, 2. Biodegradable polymers, (cellulose acetate from extracted cellulose) are products preferred over regular plastics, 3. As basic inputs into nutritious feed through enrichment, 4. biochar, a soil conditioner to improve soil fertility, for sustainable agriculture, and 5. Biocomposites produced by combining with biopolymers can be used in construction, automotive, and packaging replacing conventional composites [30].
3.10. Limitations of the Study
The estimates in this study are based on harmonized factors, despite the variations in the species and locations. Optimized literature values, and in some cases, when available, the values related to Africa and Ethiopia were considered to minimize effects. Average and middle values were considered to be applicable for a better estimate. Some literature provides a range of highest to lowest values of the factors and the energy potentials [8,9,32]. This study preferred a single value to represent a better estimate with its limitations.
The inference of the resource route to consumption for energy and recommendations on the interventions are given based on literature by associating with the Ethiopian case.
4. Conclusions
The information from this study is crucial to sectors that act on biomass utilization and to the government’s attention in setting policies for mobilizing the resource. The plans for target consumption, and related management need to rely on the information. Regional governments and industries have to consider their closest, most abundant, best potential, and of better potential capacity resources. It is highly recommended to consumes the resources in close proximity for overall efficiency and to reach the resources to exploit them. All resources have to be exploited sequentially, as long as they are available. Only their availability can have a negative impact on their consumption. Otherwise, fuel quality is secondary in the case of Ethiopia, with unsecured energy and a fuel shortage. However, sequential consumption is crucial for a scaled-up fuel addition to the energy sector, economic management, and quick intervention. Consuming the better resources that have a better potential from the combination of the highest natural potential capacity and the practice-based quantity is critical to filling the fuel resource shortage quickly and to benefit the most from the recent intervention. Major resources are maize, coffee, cotton, finger millet, oil seeds, and sorghum residues that need to be mobilized quickly to supplement the deficit and to benefit the utmost from their overall potential for energy.
Maize and sorghum residues need to be given attention since they present the highest potential and distribution in all regions. Their distributed availability ensures that every region should consider them. Additionally, maize has a high PVE (capacity for energy) from both perspectives, revealing it to be the best resource in combination with its quantity. Cotton residues also have the highest natural potential capacity (PVE) from both perspectives, meaning that its capacity as a fuel resource is the highest even though its yield amount left it to be at a lower level in its energy potential contribution to the national potential. On the other hand, oil seeds, coffee, sesame, finger millet, and sorghum are of better potential capacities in both perspectives. Of these, Sorghum and finger millet also have better quantity by practice and better practice-based energy potential that in combination presented a better contribution to the national gross energy potential. Both the highest potential resources (maize, sorghum, finger millet, teff, wheat, barley, and pulses) due to their quantity and the better potential capacity resources (cotton, maize, sugarcane, rice, oilseeds, coffee, finger millet, and sesame) for their availability and application interest need attention to be exploited quickly in accordance with their nature and availability orders.
Teff, wheat, barley, and pulse-derived straws and stalks, respectively, have better contributions to the national potential due to their yields but are of low natural potential capacities due to their low availability as fuel. Competing demands, from which animal feed is a major cause for their low availability as fuel and thus affected their potential levels by lower natural capacities despite their superior yield quantity.
All these resources are not readily accessible due to practical collection and transport limitations. If managed at 30% collection efficiency (by reference and noting Ethiopia’s situation), a supply of 148.4 PJ can be ensured, which is equivalent to 15 fold of the coal and oil imports in 2018. It is so substantially large that, even at a low collecting rate of 5%, it corresponds to 2.5 times of the (coal and oil) imported in 2018. In addition, other sustainability factors like specific location-based residue retention for maintaining soil and its organic carbon content levels would decrease the next level (sustainable) potential and the final portion for energy.
Having in mind, the imported coal and oil burden on the country and the curiosity to fill the fuel deficit with renewables, this resource is a substantial substitute for a major portion of conventional fuel. Government involvement in the utilization routes and taking the experience of other countries are crucial to realizing the benefit. Practices for their commercialization through enhanced fuel forms need to be implemented. Collecting and upgrading technology from the sources is required to transport upgraded fuels for economic transport and efficient consumption, which are critical factors for these resources. Their low density entails uneconomic transport without upgrades, especially for longer distances. It is preferred to be consumed at approximately 50 km to a maximum of 100 km radius (a 200 km road) for cost advantages.
In a recent view, modern commercialized use of the resources through low-cost densification, carbonization, and combinations of these two treatments in inter-reversible treatments are the best routes to energy in the case of Ethiopia. Further, an approach to involving the rural community in commercializing the resource are essential by creating awareness and providing incentives is crucial to realizing this modern consumption route and commercial system.
Industries need to endure their initiations of hunting residues, focusing on closer proximity residues with the highest energy potentials and potential capacities. Thus, we need to continue to co-fire residues with coal through the stated treatments until commercialization is realized. The recommendation of this resource consumption either by co-firing and/or biomass reactor coupling together with the existing conventional reactors is mainly for the interest of economic utilization, easy integration, and based on the nature of the resource in association with its actual situation. It is by noting, its quantity insufficiency, its distributed nature, and the Ethiopian situation. Further, the fuel quality compared to coal and oil is considered in the inference of the application of thermochemical conversion. Fuel quality and nature are major factors that affect the processes when co-fired with coal, including fuel handling, fuel feeding, and the output gas and ash.
Comparing energy potentials to the collection and consumption rates, regionally, crop-wise, and residue-wise, is vital for the intervention to target their collection rates and exploit them at a better level. Thus, it infers the need to study both of these rates, which is recommended for future research.
Author Contributions
All authors contributed to conceptualization, method, analysis, and interpretation. The first author played a major role in data collection and analysis. All authors have read and agreed to the published version of the manuscript.
Funding
This research is funded by ICP Phase IV, a collaboration project of MU, HU, and NMBU universities. The authors acknowledge the grant support for this research.
Data Availability Statement
The datasets used and/or analyzed in the study are available from the corresponding author upon request.
Conflicts of Interest
The authors have no competing interests to declare concerning this article’s production.
Appendix A
Table A1.
Crop Residues Conversion Factors.
Table A1.
Crop Residues Conversion Factors.
| Crops/Crop Group/Residue | Residue to Product Ratio (RPR) | Surplus Availability Factor (SAF) | Lower Heating Value (LHV) (MJ/Kg) | Selection Remark R(Repeat), M(Mean), Mi(Middle) |
|---|---|---|---|---|
| Sesame | ||||
| Stalk | 1.47 [33],1.2 [34] | 0.8 [33] | 14.35 [34], 17.37 [17] | RPR RMi, SAF RMi |
| Coffee | ||||
| Husk, pulp | 2.1 [35],1.65 [27], 1.4 [36] | 1 [7] | 12.8 [7], 12.38 [35], 12.2 [27] | |
| Maize | ||||
| Husk | 0.2 [35,37] 0.6 [7] | 1 [7,37] | 12.6 [37], 12 [7], 15.5 [10] | RPR R, SAF R, LHV M and R |
| Cobs | 0.27 [10,37], 0.25 [38], 0.47 [35] 0.3 [33] | 1 [7,37,39], 0.67 [38] | 16.63 [38], 12.6 [37], 15.46 [35], 15.2 [7] | RPR M, SAF R R, LHV MM |
| Stalk | 2 [7,33,37], 1.59 [39] | 0.8 [7,37,39] | 14.7 [37], 15 [7], 16.67 [34] | RPR R, SAF R, LHV M |
| Sugar Cane | ||||
| Bagasse | 0.29 [7,35], 0.25 [38], 0.33 [33,34] | 1 [7,37] | 6.43 [38], 11 [35], 13 [7], 12.5 [27], 17.9 [37], 20 [34] | RPR RMi, SAF R, LHV Mi |
| Tops/leaves | 0.175 [35], 0.3 [35], 0.32 [7,37] | 0.8 [7,37,39], 0.98 [38] | 6.8 [38], 15.8 [7,37], 16.6 [35], 20 [34] | RPR MiR, SAF R, LHV MiR |
| Teff | ||||
| Straw | 2.3 [25] | 0.67 [25] | 15 [25] consideration | SAF calculated. |
| Sorghum | ||||
| Straw | 1.75 [7,10], 1.5 [25], 2 [37,39] | 0.8 [7,37,39] | 12.38 [7], 14.4 [10], 17.24 [37] | RPR RMi, SAF R, LHV Mi |
| Wheat | ||||
| Husk/pod | 0.23 [7,37], 0.3 [34,40] | 0.29 [7,37] | 12.9 [7,37], 17.4 [34], 15 [M] | RPR R, LHV M |
| Straw/stalk | 1.3 [37], 1.5 [33,34], 1.75 [7] | 0.29 [7,37] | 14.9 [35], 15.6 [37], 16.4 [7], | RPR RMi, LHV Mi |
| Barley | ||||
| Straw | 1.2 [35] Mi,1.3 [25,34],1.75 [7] | 0.29 [7], 0.3 [25] | 12.65 [35]M, 18.16 [34] | RPR Mi, LHV Mi,R RPR |
| Finger Millet | ||||
| Stalk | 1.75 [35]MiR [10], 2 [37] 1.3 [25], 1.83 [39] | 0.8 [7,37,39] | 12.39 [35], 15.51 [37], 15.56 [10], 18.16 [34] | RPR RMi LHV Mi |
| Rice | ||||
| Husk | 0.267 [35]M, 0.275 [7], 0.26 [39] 0.2 [33,34] | 0.83 [7],1 [39], 0.75 [33] | 14.39 [35]Mi,13.24 [41],15.54 [34], 16 [7] | RPR M,Mi, SAF Mi, LHV Mi |
| Straw | 1.87 [35]M, 1.75 [7], 1.5 [33,34], 1.66 [39] | 1 [7], 0.25 [39],0.5 [33] | 16 [35]R, 15.54 [34], 13.45 [7] | |
| Cotton | ||||
| Stalk | 3.5 [35]R, 2.1 [37], 2.2 [27] 3.23 [38], 2.88 [39], 3.8 [34], 2.75 [36] | 1 [37,38], 0.8 [39] | 16.2 [35]M, 13.07 [38], 25 [37], 17.4 [34,36] | RPR Mi, SAF R, LHV Mi,Mi |
| Husk | 1.1 [34,37] | 1 [34,42] | 16.7 [34,37] | |
| Balls/Shells | 1.1 [34,37] | 1 [34,42] | 18.3 [34,37] | |
| Pulses | ||||
| Stalk | 1.4 [37], 1.8 [33,34], 1.3 [40] | 0.38 [37], 0.49 [42] | 12.8 [11],14.7 [37], 16 [34]Mi | RPR Mi, SAF R, LHV Mi,R |
| Oilseeds (OSOS) | ||||
| Stalk | 2 [24,40] | 1 [42] | 15.38 [34]M |
Appendix B
Table A2.
Scientific Names of Crops in this Study.
Table A2.
Scientific Names of Crops in this Study.
| Crop/Category | Scientific Name | |
|---|---|---|
| 1 | Sesame | Sesamum indicum |
| 2 | Coffee | Coffea Arabica |
| 3 | Maize | Zea mays |
| 4 | Sugarcane | Saccharumof ficinarum |
| 5 | Teff | Eragrostis tef |
| 6 | Sorghum | Sorghum bicolor |
| 7 | Wheat | Triticum aestivum |
| 8 | Barley | Hordeum vulgare |
| 9 | Finger millet | Eleusine coracana |
| 10 | Rice | Oryza sativa |
| 11 | Cotton | Gossypiumhirsutum |
| 12 | Pulses | Fabaceae (Leguminos) |
| Legumes (Faba Beans) | Vicia faba | |
| Field peas | Pisum sativum | |
| White haricot beans | Phaseolus vulgaris | |
| Red Haricot beans | Phaseolus vulgaris | |
| Chickpeas | Cicer arietinum | |
| Lentils | Lens culinaris | |
| Grass Peas | Lathyrus sativus | |
| Soya beans | Glycine max | |
| 13 | Oil Seeds (OSOS) | |
| Neug | Ricinus communis | |
| Linseed (common flax) | Linum usitatissimum | |
| Groundnut or peanut | Arachis hypogaea | |
| Sunflower | Helianthus annuus | |
| Rapeseed | Brassica napus | |
| Fenugreek | Trigonella foenum-graecum | |
| Mung bean | Vigna radiate | |
| Gibto | Tragopogon pratensis |
References
- Benti, N.E.; Gurmesa, G.S.; Argaw, T.; Aneseyee, A.B.; Gunta, S.; Kassahun, G.B.; Aga, G.S.; Asfaw, A.A. Biotechnology for Biofuels the current status, challenges and prospects of using biomass energy in Ethiopia. Biotechnol. Biofuels 2021, 14, 209. [Google Scholar] [CrossRef]
- Yalew, A.W. Environmental and economic accounting for biomass energy in Ethiopia. Energy. Sustain. Soc. 2022, 12, 30. [Google Scholar] [CrossRef]
- Hailu, A.D.; Kumsa, D.K. Ethiopia renewable energy potentials and current state. AIMS Energy 2020, 9, 1–14. [Google Scholar] [CrossRef]
- Kaygusuz, K. Energy for sustainable development: A case of developing countries. Renew. Sustain. Energy Rev. 2012, 16, 1116–1126. [Google Scholar] [CrossRef]
- Toklu, E. Biomass energy potential and utilization in Turkey. Renew. Energy 2017, 107, 235–244. [Google Scholar] [CrossRef]
- Yalew, A.W. The Ethiopian energy sector and its implications for the SDGs and modeling. Renew. Sustain. Energy Transit. 2022, 2, 100018. [Google Scholar] [CrossRef]
- Gabisa, E.W.; Gheewala, S.H. Potential of bio-energy production in Ethiopia based on available biomass residues. Biomass Bioenergy 2018, 111, 77–87. [Google Scholar] [CrossRef]
- Tolessa, A. Bioenergy potential from crop residue biomass resources in Ethiopia. Heliyon 2023, 9, e13572. [Google Scholar] [CrossRef]
- Ciria, P.; Barro, R. 3—Biomass resource assessment. In Biomass Supply Chains for Bioenergy and Biorefining; Woodhead Publishing: Sawston, UK, 2016. [Google Scholar] [CrossRef]
- Jekayinfa, S.O.; Scholz, V. Potential availability of energetically usable crop residues in Nigeria. Energy Sources Part A Recover. Util. Environ. Eff. 2009, 31, 687–697. [Google Scholar] [CrossRef]
- Halder, P.K.; Paul, N.; Beg, M.R.A. Assessment of biomass energy resources and related technologies practice in Bangladesh. Renew. Sustain. Energy Rev. 2014, 39, 444–460. [Google Scholar] [CrossRef]
- Rettenmaier, N.; Schorb, A.; Köppen, S.; Berndes, G.; Christou, M.; Dees, M.; Domac, J.; Eleftheriadis, I.; Goltsev, V.; Kajba, D.K.; et al. Status of Biomass Resource Assessments Version 3. 2010, pp. 1–205. Available online: https://www.ifeu.de/fileadmin/uploads/BEE_D3.6_Status_of_biomass_resource_assessments_V3_1_04906.pdf (accessed on 16 June 2024).
- Tolessa, A. Bioenergy Production Potential of Available Biomass Residue Resources in Ethiopia. J. Renew. Energy 2023, 1, 2407300. [Google Scholar] [CrossRef]
- Ibitoye, S.E.; Jen, T.C.; Mahamood, R.M.; Akinlabi, E.T. Densification of agro-residues for sustainable energy generation: An overview. Bioresour. Bioprocess. 2021, 8, 75. [Google Scholar] [CrossRef]
- Wang, T.; Zhai, Y.; Zhu, Y.; Li, C.; Zeng, G. A review of the hydrothermal carbonization of biomass waste for hydrochar formation: Process conditions, fundamentals, and physicochemical properties. Renew. Sustain. Energy Rev. 2018, 90, 223–247. [Google Scholar] [CrossRef]
- Series, C. Biomass Utilization of Some Agricultural Wastes as Alternative Fuel in Indonesia Biomass Utilization of Some Agricultural Wastes as Alternative Fuel in Indonesia. J. Phys. Conf. Ser. 2019, 1175, 012271. [Google Scholar] [CrossRef]
- Gebresas, A.; Asmelash, H.; Berhe, H.; Tesfay, T. Briquetting of Charcoal from Sesame Stalk. J. Energy 2015, 2015, 757284. [Google Scholar] [CrossRef]
- Tumuluru, J.S.; Sokhansanj, S.; Wright, C.T.; Boardman, R.D.; Yancey, N.A. A review on biomass classification and composition, co-firing issues and pretreatment methods. In Proceedings of the American Society of Agricultural and Biological Engineers International Meeting 2011, ASABE 2011, Louisville, Kentucky, 7–10 August 2011; Volume 3, pp. 2053–2083. [Google Scholar] [CrossRef]
- Chew, J.J.; Doshi, V. Recent advances in biomass pretreatment—Torrefaction fundamentals and technology. Renew. Sustain. Energy Rev. 2011, 15, 4212–4222. [Google Scholar] [CrossRef]
- Park, C.S.; Raju, A.S.K. Current developments in thermochemical conversion of biomass to fuels and chemicals. In Valorization of Lignocellulosic Biomass in a Biorefinery: From Logistics to Environmental and Performance Impact; IntechOpen: London, UK, 2016; pp. 171–184. [Google Scholar] [CrossRef]
- Panahi, A.; Tarakcioglu, M.; Schiemann, M.; Delichatsios, M.; Levendis, Y.A. On the particle sizing of torrefied biomass for co-firing with pulverized coal. Combust. Flame 2018, 194, 72–84. [Google Scholar] [CrossRef]
- Elalami, D.; Barakat, A. State of the Art of Energy Production from Agricultural Residues Using Thermochemical and Biological Processes, 1st ed.; Elsevier Inc: Amsterdam, The Netherlands, 2021. [Google Scholar] [CrossRef]
- Nizamuddin, S.; Baloch, H.A.; Griffin, G.J.; Mubarak, N.M.; Bhutto, A.W.; Abro, R.; Mazari, S.A.; Ali, B.S. An overview of effect of process parameters on hydrothermal carbonization of biomass. Renew. Sustain. Energy Rev. 2017, 73, 1289–1299. [Google Scholar] [CrossRef]
- Purohit, P.; Chaturvedi, V. Biomass pellets for power generation in India: A techno-economic evaluation. Environ. Sci. Pollut. Res. 2018, 25, 29614–29632. [Google Scholar] [CrossRef]
- Tucho, G.T.; Nonhebel, S. Bio-wastes as an alternative household cooking energy source in Ethiopia. Energies 2015, 8, 9565–9583. [Google Scholar] [CrossRef]
- Werther, J.; Saenger, M.; Hartge, E.U.; Ogada, T.; Siagi, Z. Combustion of agricultural residues. Prog. Energy Combust. Sci. 2000, 26, 1–27. [Google Scholar] [CrossRef]
- Terrapon-Pfaff, J.C. Linking energy- and land-use systems: Energy potentials and environmental risks of using agricultural residues in Tanzania. Sustainability 2012, 4, 278–293. [Google Scholar] [CrossRef]
- Edwards, R.; Šúri, M.; Huld, T.A.; Dallemand, J.F. GIS-based assessment of cereal straw energy resource in the European Union. In Proceedings of the 14th European Biomass Conference & Exhibition. Biomass for Energy, Industry and Climate Protection, Paris, France, 17–21 October 2005; pp. 17–21. [Google Scholar]
- Blasi, A.; Verardi, A.; Lopresto, C.G.; Siciliano, S.; Sangiorgio, P. Lignocellulosic Agricultural Waste Valorization to Obtain Valuable Products: An Overview. Recycling 2023, 8, 61. [Google Scholar] [CrossRef]
- Ginni, G.; Kavitha, S.; Kannah, Y.; Bhatia, S.K.; Kumar, A.; Rajkumar, M.; Kumar, G.; Pugazhendhi, A.; Chi, N.T.L. Valorization of agricultural residues: Different biorefinery routes. J. Environ. Chem. Eng. 2021, 9, 105435. [Google Scholar] [CrossRef]
- Cesaro, A.; Belgiorno, V. Combined biogas and bioethanol production: Opportunities and challenges for industrial application. Energies 2015, 8, 8121–8144. [Google Scholar] [CrossRef]
- Fischer, G.; Prieler, S.; van Velthuizen, H.; Berndes, G.; Faaij, A.; Londo, M.; de Wit, M. Biofuel production potentials in Europe: Sustainable use of cultivated land and pastures, Part II: Land use scenarios. Biomass Bioenergy 2010, 34, 173–187. [Google Scholar] [CrossRef]
- Hiloidhari, M.; Baruah, D.C. Crop residue biomass for decentralized electrical power generation in rural areas (part 1): Investigation of spatial availability. Renew. Sustain. Energy Rev. 2011, 15, 1885–1892. [Google Scholar] [CrossRef]
- Hiloidhari, M.; Das, D.; Baruah, D.C. Bioenergy potential from crop residue biomass in India. Renew. Sustain. Energy Rev. 2014, 32, 504–512. [Google Scholar] [CrossRef]
- Koopmans, A.; Koppejan, J. Agricultural and Forest Residues—Generation, Utilization and Availability. FAO. Available online: https://www.fao.org/4/AD576E/AD576E00.htm (accessed on 18 June 2024).
- Seboka, Y.; Getahun, M.A.; Haile-meskel, Y. Biomass Energy for Cement Production: Opportunities in Ethiopia:United Nations Development Program. 2009. Available online: https://www.ieabioenergy.com/wp-content/uploads/2018/01/EA-Bioenergy-Task-43-TR2016-05.pdf (accessed on 14 May 2021).
- Shane, A.; Gheewala, S.H.; Fungtammasan, B.; Silalertruksa, T.; Bonnet, S.; Phiri, S. Bioenergy resource assessment for Zambia. Renew. Sustain. Energy Rev. 2016, 53, 93–104. [Google Scholar] [CrossRef]
- Sajjakulnukit, B.; Yingyuad, R.; Maneekhao, V.; Pongnarintasut, V.; Bhattacharya, S.C.; Salam, P.A. Assessment of sustainable energy potential of non-plantation biomass resources in Thailand. Biomass Bioenergy 2005, 29, 214–224. [Google Scholar] [CrossRef]
- Kemausuor, F.; Kamp, A.; Thomsen, S.T.; Bensah, E.C.; Stergård, H. Assessment of biomass residue availability and bioenergy yields in Ghana. Resour. Conserv. Recycl. 2014, 86, 28–37. [Google Scholar] [CrossRef]
- Dasappa, S. Potential of biomass energy for electricity generation in sub-Saharan Africa. Energy Sustain. Dev. 2011, 15, 203–213. [Google Scholar] [CrossRef]
- Mhilu, C.F. Analysis of Energy Characteristics of Rice and Coffee Husks Blends. ISRN Chem. Eng. 2014, 2014, 196103. [Google Scholar] [CrossRef]
- Awalgaonkar, N.; Saxena, H.; Venkatesan, A.; Natarajan, R. Assessment of Surplus Agricultural Residues Available for Biomass Briquetting in India. In ICREGA’14—Renewable Energy: Generation and Applications; Springer: Berlin/Heidelberg, Germany, 2014; pp. 23–35. [Google Scholar] [CrossRef]
Disclaimer/Publisher’s Note: The statements, opinions and data contained in all publications are solely those of the individual author(s) and contributor(s) and not of MDPI and/or the editor(s). MDPI and/or the editor(s) disclaim responsibility for any injury to people or property resulting from any ideas, methods, instructions or products referred to in the content. |
© 2024 by the authors. Licensee MDPI, Basel, Switzerland. This article is an open access article distributed under the terms and conditions of the Creative Commons Attribution (CC BY) license (https://creativecommons.org/licenses/by/4.0/).