Abstract
This article estimates the weighted average cost of capital (WACC) for the energy sector in Ecuador, a country with a dollarized economy and illiquid stock markets. Thus, reference companies in the region were taken, and at the same time combined with characteristics of national companies, establishing a useful methodology, which makes sense with the acceptable discount rates in the Ecuadorian economy. For the above, four estimation alternatives were used. In method one, the traditional WACC formula was applied using interest rates and risk premiums from the U.S. market, which resulted in an overestimation due to the double penalty of the country risk and the U.S. market premium. Method two adjusted the market risk premium to consider only the Ecuador-specific risk premium, thus avoiding the double penalty. In method three, the credit default swap (CDS) was used to calculate the country risk premium, and the CDS was excluded from the nominal interest rate, avoiding redundancies. Finally, method four combined the U.S. interest rate with the CDS directly to calculate the market risk premium, more accurately reflecting local economic conditions in a dollarized economy. The WACC results range from 12.63% to 29.70%. In addition, a dummy variable was controlled for during the pandemic period. This article highlights the need for methodologies adapted to emerging markets, since traditional approaches would overestimate the WACC.
1. Introduction
The energy sector has a strategic role in the economy, being related to economic growth and employment [1], and there is a trend towards renewable energy production [2]. From supporting industrial production to basic household needs [3], it is the core of modern infrastructure. Thus, in the case of Ecuador, this sector is even more critical considering the difficulties in satisfying demand and the recent power outages [4]. Consequently, investment in the electricity sector is paramount. However, it is necessary to have reference indicators of the costs involved, expressed in terms of the rates of return that investors may demand. This paper contributes to this by asking the following: What is the weighted average cost of capital (WACC) of the electricity sector in the case of Ecuador? The answer will allow for not harming either investors or consumers and will mark the way towards a potential private investment, contributing to its sustainability through the respective tariffs, which are expected to be equitable, affordable, and at the same time allow for the recovery of operating and investment costs [5]. In effect, the WACC influences the electricity tariffs set by regulators [6] with a positive relationship.
The above is indispensable, even more so, considering that since the signing of the Paris Agreement in 2015, the world demand for electricity has grown by 2.7% per year, with developing countries being the ones that have grown the most [7]. In the case of Ecuador, this went from a per capita consumption of 1622 KwH in the year 1965 to one of 12,150 KwH by the year 2022 [8]. Incidentally, this trend shows a growth [9], although still insufficient, towards renewable energies [10,11]. This transition adds a new dimension, with implications for both economic growth and environmental sustainability [12].
In the case of Ecuador, significant progress has been made, diversifying towards renewable sources and with efficiency policies [3], expanding the electric grid and building renewable energy plants [13], and improving installed capacity [14]; thus, renewable energy sources represent more than 90% of the country’s electricity sources [15]. However, there is still work to be undertaken regarding productivity and efficiency in generation [3]. Energy sovereignty implies facing both technical and financial restrictions, especially considering that the energy sector is capital intensive [16] and especially those from renewable sources [1].
Thus, as mentioned, one of the main factors to consider is the cost of capital (WACC). This is a key evaluation indicator [17,18] for investment decisions [19], reflecting the opportunity cost [6] and the inherent risks, also allowing a valuation [20] if required. In this sense, emerging technologies and markets with higher perceived risks can raise the WACC [17,21,22], while supportive policies and stable regulatory frameworks reduce it [23,24]. Likewise, in the case of Ecuador, oil is an influential aspect. A reduction in its price would have a mixed effect on the electricity WACC. On the one hand, it could reduce operating costs for oil-dependent companies, thus reducing the perceived risk and potentially the WACC. On the other hand, since the economy is strongly linked to oil revenues, a decrease could increase economic uncertainty, which would increase the WACC [25]. Another aspect to consider is the increase in borrowing costs in developing countries, which leads investors to demand higher risk premiums, thus increasing the WACC [26].
In this area, the heterogeneity between regions and nations implies variability in the risk factors [27] and opportunities that companies face, causing differences in WACC rates [6], which can even be influenced by the type of technology used [27] or the quality of future revenues [28]. Thus, for example, Germany, with a WACC of 3.5%, has a relatively low risk perception, while Greece, with a WACC of 12%, has a considerably higher one [21]. Also at the Latin American level, similar patterns of variability are identified, Brazil presents a rate of 11.13% [29], and in contrast, Colombia, according to [19], has a lower WACC of 5.28% for the electricity sector. It can be said, therefore, that the discount rate becomes a vital barometer to measure both the risk and the potential return [30].
Notwithstanding the importance of the WACC, there is a lack in the literature regarding the specific and quantitative analysis of this variable in the Ecuadorian energy sector, despite some attempts [31,32]. The present article provides a solution to this problem, and along the way, faces its own challenges in the calculation methodology, derived from the specificities of Ecuador. For example, the WACC is influenced by the maturity of the financial markets [33], making it unavoidable to consider that the Ecuadorian stock markets are illiquid and not very diversified. Another aspect to consider is the absence of a financial instrument that could be considered risk-free—something indispensable under the most accepted methodology for calculating the cost of equity [34]. Finally, since 2000, the Ecuadorian economy has adopted the dollar as its own currency, discarding the sucre, which adds the nuance of calculating the WACC for a dollarized economy. Advantageously, some outputs have already been established by Maquieira and Espinosa [35], and others have been proposed by the authors; the latter is precisely one of the additional useful contributions to the literature. This is by no means a deviation from the concepts but rather an adaptation to the call to develop useful methodological frameworks for emerging and illiquid markets [36], reinforcing the idea that there are no guiding principles for the estimation of sector WACC [37].
Due to the period of pandemic that the country (and the world) went through, a control variable is introduced, which makes it possible to show its effect on the WACC. The necessary information was gathered both from private suppliers and from the Superintendence of Companies of Ecuador [30], etc. This study contributes significantly to the academic literature in the field of estimating the cost of capital in emerging markets and is established as a methodological reference. It also serves in public policy decision making, helping policy makers to align sector investments and regulations with Ecuador’s sustainable and economic development objectives [38].
Based on the above, there are two research questions to be solved:
RQ1. What is the weighted average cost of capital (WACC) for the energy sector in Ecuador?
RQ2. How do the different WACC calculation methodologies affect the estimation of the cost of capital in the Ecuadorian energy sector?
To facilitate the understanding of the process and results of this study, the article has been structured in different sections. In the second section, the materials and methods used are described, clarifying the empirical strategy used. The fourth and fifth sections present the results obtained and the conclusions derived from the research, respectively.
2. Materials and Methods
Descriptive statistics were used to analyze and summarize the main characteristics of the data. These statistics include measures of central tendency and dispersion, such as mean, median, standard deviation and interquartile ranges, which help to understand the distribution and variability of the variables. The python program was used. Table 1 lists the variables used; however, the main ones are described below:

Table 1.
Variables used in WACC calculation.
Risk-Free Rate (rf): the U.S. Treasury bond rate was used as a proxy due to the lack of an equivalent rate in Ecuador. This rate represents the return on a risk-free investment, essential for calculating the cost of equity and debt. It is a fundamental component of the CAPM model and other financial valuation methodologies.
Market Risk Premium (MRP): The additional premium that investors expect to receive for taking the risk of investing in the stock market rather than opting for a risk-free investment, such as Treasury bonds. The MRP is calculated as the difference between the expected return of the market as a whole and the risk-free rate of return.
Unlevered Beta (): It measures a company’s sensitivity to market movements. The unlevered beta allows for comparing the inherent risk of different companies regardless of their financial leverage.
Debt Beta (): It measures the risk associated with the company’s debt. In markets where debt is not risk-free, it is important to consider the debt beta to adequately reflect the financial risk in the WACC calculation.
Market Value of Debt (D): Market Value of the Company’s Debt.. This value is used to weight the cost of debt in the WACC.
Market Value of Equity (P): It is the market value of the company’s equity. Similar to the value of debt, this value is used to weigh the cost of equity in the WACC.
Tax Rate (T): It is used to adjust the after-tax cost of debt. Interest on debt is tax deductible, which reduces the effective cost of debt. This adjustment is essential to reflect the tax benefit of leverage.
Cost of Debt (): It is the interest rate the company pays on its debt. It is a direct component of the WACC and reflects the real cost of debt financing.
Cost of Equity Capital (): It is calculated using the capital asset pricing model (CAPM). The cost of equity capital represents the return required by investors to invest in the company’s equity.
In this context, the issue of illiquid markets and the difficulty in calculating the relevant betas was solved by using comparable companies. Indeed, in environments where markets are not liquid, as in Ecuador, the use of comparable companies to estimate the betas in the WACC calculation is crucial. Walker [39], with respect to emerging markets, emphasizes the adaptation of methodologies to reflect local conditions, arguing that comparable companies in regions with similar economic and market characteristics provide a more realistic basis for estimating betas, which is in line with Maquieira and Espinosa [35]. In fact, according to Schlegel [40], this practice is fundamental in the financial literature to ensure the relevance and accuracy of discount rates in financial evaluations. Furthermore, Schlegel et al. [41] highlight the importance of properly selecting these companies to capture appropriate market conditions and mitigate the risks associated with WACC estimation in illiquid markets.
Regarding the risk-free rate, the US rate was used; this rate is widely used in the literature [40,42,43,44,45]. However, in the case of Ecuador, it is also justified by the following: It does not have a risk-free rate, given its historical default characteristic, which calls into question the fulfillment of its sovereign debt obligations, making it unfeasible to use any government bond or bill from the Ecuadorian treasury or central bank. However, the adoption of the US dollar as the official currency in Ecuador has deepened its economic dependence on US monetary policies [46,47,48], which has a direct impact on its economy due to the synchronization of economic and financial cycles between the two countries. This relationship allows the use of US risk-free assets, such as Treasury bonds, in Ecuadorian financial models [44]. That is, for the calculation of the weighted average cost of capital (WACC), the risk-free rate can be naturally aligned with US Treasury bond rates due to the dollarization policy.
Evidently, this poses a special situation for neighboring economies such as Colombia, Perú, Chile, etc., which, by having their own currency, even consider the issue of exchange rate risk, or the expectations derived from a currency that is not as stable as the USD.
Considering the above aspects contribute to the correct valuation of the cost of capital in Ecuador in energy sector. This is an essential task for various strategic purposes, including decision making in investment, financing, and business valuation [19,20]. In the case of unlisted companies with debt in their financial structure, the valuation of the firm and the evaluation of the WACC acquire additional complexity [49].
Thus, according to data from the Superintendency of Companies, Ecuadorian companies that are not listed on the stock exchange represent 99.68% of the country’s business fabric [50]. These companies often operate under economic and financial dynamics in which the market value of their capital structure is unknown [30]. The lack of available market information adds further complexity to the calculation of the WACC.
The methodology employed in this study is based on the calculation of the equation ex-pressed in (1), which has been used in numerous previous studies [20]. In addition, the comprehensive approach proposed by [35] is adopted to calculate the WACC of unlisted companies. The adaptation of the WACC methodology to this group of companies requires the careful consideration of several factors such as the estimation of the cost of debt, the cost of equity, and the risk premium in Ecuador.
Equation (1) is used to calculate the WACC, which represents the weighted average cost of capital of company i. and measure the cost of equity and the cost of debt respectively, T corresponds to the income tax rate in the country, and and represent the capital structure of the company divided between equity and debt ratio, respectively [51].
2.1. Data
The unit of analysis is composed of Ecuadorian companies that operate with some activity in the energy sector. The data comes from the balance sheet corresponding to the year 2022, obtained from the Superintendence of Companies. Initially, information was available for 629 companies in the sector. However, a data cleaning process was carried out in which companies whose net worth was equal to zero were excluded, resulting in a set of 569 companies for the analysis.
In this research, a series of key variables were used for the analysis, and these, together with their respective sources, are detailed in Table 1. This table provides an overview of the key measures and indicators that were used to calculate the WACC of companies in the energy sector in accordance with the methodology described above.
2.2. Calculation of the Cost of Equity
The calculation of the cost of equity for company i is performed using Equation (2). In this equation, measures the real risk-free rate for Ecuador, which is calculated by eliminating the effect of expected inflation from the nominal risk-free rate () as shown in Equation (3). In turn, the nominal risk-free rate for the country is determined by Equation (4). Following the methodology of Maquieira and Espinosa [35], the U.S. yield () is included along with a penalty for default on the country’s debt (credit default swap—CDS)
where
In some markets with low liquidity, the illiquidity risk premium (L) is incorporated in the calculation of the cost of capital to consider the additional risk associated with the difficulty of selling an investment immediately, without incurring losses, as reflected in Equation (2). Finally, the market risk premium (MRP) generally known as the equity risk premium (ERP) is calculated using Equation (5) [30]. This value considers, like the risk-free rate, a part of the US risk premium, in addition to a specific risk premium for the country under analysis (country risk premium—CRP).
- Country risk premium
Within Equation (2), the component refers to the leveraged equity beta and evaluates the operational and financial risk of the firm, considering the business risk related to the debt incurred [50]. If , it means that the operating and financial risk, considering debt, is higher or more volatile compared to the market in general, while if , it implies that the company is less volatile or risky than the market in general. The calculation of is carried out using [51] which is expressed by Equation (6).
where
and represent the benchmark sector’s unlevered equity beta and debt beta, respectively. The former measures the operating risk inherent to the benchmark sector, while the latter assesses the risk associated with the debt.
2.3. Enterprise Operational Risk Benchmarking
To calculate the unlevered equity beta referring to the sector, represented by , it is necessary to apply a benchmarking procedure that allows obtaining a specific reference value for the sector. This process involves the use of information relative to companies of the same sector in external foreign economies through the Expression (10).
In this equation, and represent the value of the foreign firms’ debt and equity (e) respectively, and is the income tax rate in the foreign country. In addition, corresponds to the debt beta of the foreign firms, and represents the levered equity beta of the benchmark foreign firm.
Prior to estimating Equation (7), it is first required to estimate through which is obtained by estimating Equation (8).
where represents the change in the last share price of the benchmark foreign company (e) in period t, while denotes the market return measured through the change in the last price at the benchmark foreign country level in the same period t. In addition, the variable is included to control the estimates during the pandemic period, being a dummy variable that takes the value of one during the pandemic and zero otherwise. The coefficients , , and represent the regression parameters, where measures the effect of country, the foreign firm performance, and measures the effect of covid. The parameter of interest is , which represents . The estimation of this equation is carried out by applying ordinary least squares with robust standard errors and is calculated n times, where n is the number of foreign firms used.
Once per firm is obtained, it is corrected following the method by Blume [52] to obtain . Subsequently, after estimating (7) and (8), the benchmark unlevered equity beta for the sector is calculated by a weighted average of of the foreign companies, where the weights are determined based on the book value of each company. With this information, the cost of capital and WACC are calculated for each Ecuadorian company. Finally, the WACC of the sector is obtained as the weighted average of the WACCs of the Ecuadorian companies, using their book values as weights.
2.4. Cost of Debt
The proportion of interest paid on debt in each period is a proxy used to measure the cost of debt. According to Maquieira and Espinosa [35], both the cost of debt () and the cost of capital or equity () are calculated using the financial asset pricing model (CAPM). Therefore, the cost of debt is measured through Equation (9).
The component is obtained by solving Equation (10) and is part of the company’s debt risk estimate.
2.5. Calculation Strategy
The WACC calculation strategy is broken down into four main phases, outlined in Figure 1. This graphical representation provides a clear overview of the methodology used to determine the WACC. The first phase consists of developing the benchmarking process, for which information from foreign companies listed on the stock exchange in countries that are not in default, such as Chile, Mexico, Brazil, Peru, and Colombia, was used. The data were extracted from the financial statements of each company, covering the period of 2018–2022.
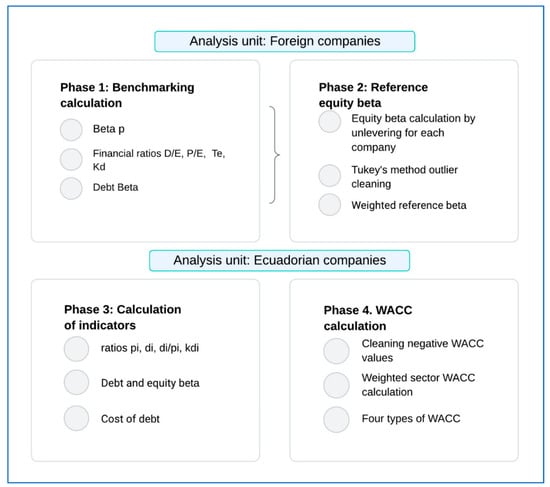
Figure 1.
Phases for the calculation of the WACC of the energy sector.
The selection of comparable companies for the cost of capital analysis is based on several key arguments that ensure the relevance and accuracy of the results obtained. First, companies were chosen that operate in Latin American markets with economic and financial characteristics similar to those of Ecuador, such as Chile, Colombia, Brazil, Peru, and Mexico. These countries share comparable market dynamics and economic risks, which allows for a more accurate estimation of the beta and cost of capital applicable to Ecuadorian conditions.
Second, companies belonging to the energy sector were selected. Sectorial representativeness is crucial, since the capital structure and inherent risks are specific to this sector. Choosing companies from the same sector ensures that the betas obtained are directly applicable to energy companies in Ecuador, providing a solid basis for the analysis. The selected companies are listed on stock exchanges, which guarantees the necessary data to perform a robust analysis and obtain meaningful betas. In other words, the selection of comparable companies is based on sector representativeness, availability of reliable data, rigorous statistical criteria, and adjustments to local conditions, thus ensuring the relevance and accuracy of the analysis of the cost of capital in Ecuador’s energy sector.
In this process, data was collected from 15 leading companies within the sector. During the calculation of the equity beta of the companies, a linear regression was performed to evaluate their financial performance according to Equation (8). However, not all regressions presented statistically significant coefficients. Therefore, the number of foreign companies used in the analysis was filtered. Following the methodology of Maquieira and Espinosa [35], the results of the regressions that met the following conditions were selected: (1) coefficient of determination greater than 3%; (2) a minimum number of 30 observations; (3) estimated coefficients significant at a 95% confidence level; and (4) estimated coefficients with positive values. After applying these criteria, six of these companies were identified as meeting the above requirements and were therefore considered in the analysis.
In the second phase, aimed at calculating the benchmark unlevered beta for the sector, refinement processes were conducted to obtain an accurate and representative measure. In this context, the Tukey method was applied to both the cost of debt ratio () and the unlevered beta. This methodology is based on the elimination of outliers by using the interquartile range. As a result of this process, five foreign companies that met the established criteria were identified and retained.
In the third phase, various financial ratios and indicators are calculated for Ecuadorian companies, using as a basis the reference indicator obtained in the previous phase. During this stage, refinements were applied, which consisted of excluding those companies whose debt beta () and cost of equity () resulted in values below zero. This led to a set of 480 companies that met the analysis criteria.
Finally, in the last phase of the process, the WACC was calculated for each individual company. These values were then aggregated to obtain an indicator at the sector level. The aggregation was conducted by applying weights determined since the book value of each company, which ensured an accurate representation of the cost of capital for the sector as a whole.
This analysis incorporates four values of the WACC, and these differ according to the risk-free rate and market risk premium indicators used, as detailed in Table 2. These differences, among the different WACC values are significant and require careful consideration when making financial and strategic decisions.
Table 2.
Methods for estimating the WACC.
Method one (WACC1) replicates the standard theory for calculating the risk rate and market risk premium by applying Equations (4) and (5). In this method, both the risk rate and the market risk premium are penalized using U.S. rates. However, this approach does not consider that Ecuador has adopted the U.S. dollar as its currency. Therefore, these rates, which may be high, do not reflect the returns that economic agents in Ecuador would be willing to pay.
Method two (WACC2) considers the nominal risk rate described in Equation (4) but avoids the double penalty of the market premium. This method considers only the Ecuador-specific country risk premium (CRP), without reapplying the U.S. risk premium. Since the Ecuadorian economy is dollarized, this approach avoids redundancy in the penalty and provides a more accurate picture of local conditions.
Method three (WACC3) uses the CDS to calculate Ecuador’s CRP and adjusts for the relative volatility of emerging markets. However, by using the CDS as the basis for the CRP and considering it in the nominal risk rate (rf nominal), the impact of the CDS would be doubled. To avoid this redundancy, method 3 excludes the CDS in the calculation of the nominal rf for Ecuador.
Method four (WACC4), like method 3, also uses the CDS to calculate the CRP, but introduces a key difference in the market risk premium (MRP). Instead of using the adjusted CRP, the CDS is used directly. This avoids double consideration of the CDS in the nominal rf. This approach is particularly relevant for a dollarized economy such as Ecuador’s, as it focuses on recovering investment values internally and more closely reflects local economic conditions.
It is important to note that at the international level, the traditional formula may be applicable, as it reflects the returns that external agents would expect if they were to invest in Ecuador. However, for domestic applications in Ecuador, method four is more viable, since it considers the reality of the dollarized economy and seeks to reflect how local economic agents would be willing to pay as a return within the country.
2.6. Company Segmentation
In order to identify underlying patterns and group companies with similar financial characteristics, unsupervised learning methods, such as clustering techniques, were used on a dataset containing financial information of several companies in the energy sector in Ecuador. These data come from the corporate ranking published by the Superintendence of Companies in the year 2022. The selection of variables for this analysis included critical financial indicators such as acid test, sales turnover, average collection indicator, expense impact indicator, financial burden impact indicator, return on assets (ROA), equity strength as well as the previously calculated WACC. In addition, company characteristics such as number of employees, province, company type, and size classification were added.
To evaluate the quality of the clusters and select the most appropriate method, the Silhouette Score, Calinski–Harabasz Score and Davies–Bouldin Score indicators were used. The method that yielded the highest Silhouette Score and Calinski–Harabasz Score and the lowest Davies–Bouldin Score was chosen in order to obtain groupings that are significant and representative of the financial similarities between the companies in the sector.
The Silhouette Score measures the coherence within clusters and the separation between clusters. Each point has a silhouette value ranging from −1 to 1, where a value close to 1 indicates that the point is well clustered. This method provides a clear interpretation of cluster quality by assessing both cluster compactness and cluster spacing, which is crucial to ensure that the data are well clustered. The Calinski–Harabasz Criterion, also known as the inter-cluster variance index, calculates the ratio of the total dispersion between clusters to the dispersion within clusters. A higher value indicates a better definition of the clusters. This method was chosen because it provides a robust measure of cluster separability and compactness and is especially useful for assessing cluster structure in terms of variance. The Davies–Bouldin Score evaluates the dispersion of clusters and the distance between clusters. A lower value of the coefficient indicates better cluster formation. This method was selected for its ability to assess the relationship between the dispersion within clusters and the proximity between clusters, which helps to identify well-defined and separate clusters.
The combination of these three methods allows a robust validation of the clusters formed, ensuring that the results of the analysis are reliable and useful for decision making. Furthermore, these methods are widely recognized and used in the academic and professional literature, supporting their relevance and effectiveness in the context of this study. This choice is based on their ability to provide a comprehensive and complementary assessment of the clusters, ensuring the consistency and robustness of the analysis presented in this article.
3. Results
The results of the financial analysis of the Ecuadorian energy sector are presented below. This study focuses on the evaluation of several key financial metrics, including capital structure, operating risk, and weighted average cost of capital (WACC) as well as the segmentation of companies in the sector using clustering techniques. These results provide a detailed understanding of the financial dynamics and market conditions in this sector.
3.1. Descriptive Statistics
The descriptive analysis reveals certain significant trends and variabilities to understand the financial dynamics of this sector. In general, there is a high dispersion in the values of the proportion of equity and debt among the companies, indicated by a high standard deviation in both components (see Table 3). This suggests significant diversity in the capital structures among the companies in the sector. A significant proportion of firms (88.91%) are observed to use equity financing without the use of debt.
Table 3.
Descriptives of the WACC components.
The descriptive statistics reveal important implications for their financing needs and credit market conditions. The average equity/asset ratio is high (95.12%), with a low standard deviation, indicating that most firms rely almost exclusively on equity to finance their assets. This preference suggests that companies seek to avoid the risks associated with debt, possibly due to the strict and costly credit conditions in Ecuador. In fact, the average debt/asset ratio is only 4.88%, with most firms having no debt at all, reinforcing the idea of minimal reliance on debt. This situation reflects a generalized aversion to financial risk and a lack of access to favorable borrowing conditions.
The average cost of debt of 58.14% is extremely high and reflects a difficult credit environment for companies in the Ecuadorian energy sector. This high rate could be related to both a perception of high risk on the part of lenders and a lack of control over the financial data reported by the companies. It is possible that companies manipulate the cost of debt figures to reduce their tax burden, which generates a significant disparity in the reported rates. This could also occur at the maximum value of . In both cases, it is a potential manipulation.
In this context, it is important to consider that the use of the lending rate as a reference for calculating the cost of debt (Kd) provides a more realistic and stable view of the cost of financing. The lending rate better reflects market conditions, including factors such as inflation and economic expectations, providing a more reliable basis than potentially manipulated domestic rates. This duality of causes (risk perception and potential data manipulation) justifies the use of the lending rate, avoiding distortions and providing a more accurate assessment of the credit environment faced by companies.
3.2. Operational Risk of the Company
The results obtained by foreign companies in the energy sector, considered in benchmarking, show us that the beta coefficient of equity varies between 0.5 and 0.8, which is significant at 5% (see Appendix A—Table A1). After applying the correction according to Blume [52] and weighting the results, an unlevered equity beta of the sector of 0.8564 was obtained. This indicates significantly lower risk and volatility compared to the overall market.
According to the results, the average leveraged equity beta of the Ecuadorian energy sector is 1.18, which reflects a higher operational and debt risk than the market in general. Once the different risk rates and market risk premiums for Ecuador are applied, different debt beta and cost of capital are obtained. Generally, they are higher the higher the risk rate and the higher the MRP.
3.3. Weighted Average Cost of Capital
The number of companies evaluated varies according to the WACC calculation method, given that in certain cases, those with negative debt beta coefficients or equity cost are excluded, as shown in Table 4. The data indicate that when using the traditional method (WACC 1) to calculate the WACC, a value of 31.77% is obtained. This percentage seems to penalize Ecuador in both the risk rate and the market risk premium. This figure begs the following question: Does this level of WACC reflect an accurate representation of Ecuador’s internal financial reality?
Table 4.
Nominal WACC and real WACC.
It should be noted that discount rates of such magnitude are rarely used. Instead, the practical approach is to use the opportunity cost of capital for equity, considering the benchmark passive rate, the cost of debt, and the benchmark lending rate. Given that these values vary between 6.48% (passive rate − term one year or more) and 9.54% within the productive business sector (active rate), the resulting discount rate is not even half of the WACC calculated using the traditional method. Therefore, it could be inferred that the traditional WACC calculation tends to overestimate both the expected return and the inherent risk of the Ecuadorian economy.
Likewise, inflation adjustment is crucial in countries with high inflation, such as Colombia, where these adjustments are essential to obtain accurate WACC estimates. The results of several studies [19] show how high inflation in Colombia requires sophisticated methodologies, such as the TD-4 multifactor model, which adjusts the discount rate considering inflation expectations [53,54,55]. This avoids overestimations of the cost of capital and excessive tariffs for consumers. Mehta [56] also highlight the importance of adjusting discount rates in high inflation environments to adequately reflect risks. Moro [57] stresses the need to mitigate inflation risk in project finance investments in such contexts.
However, this approach is not appropriate for Ecuador due to its dollarized economy and low and stable inflation rates, registering single digit inflation since 2002. Price stability in Ecuador makes it possible to dispense with continuous inflation adjustments in the calculation of the WACC, facilitating more accurate and consistent forecasts. Therefore, alternative methods two, three, and four were explored as viable options for Ecuador, where low inflation makes the complex adjustments used in Colombia and similar countries unnecessary.
It is worth mentioning that method four is presented as a reasonable option, given that it applies an interest rate equivalent to that of the United States, in congruence with that proposed by Damodaran [30] for the calculation of sector betas in other economies. The market risk premium of method four integrates the country’s debt default penalty, using the credit default swap (CDS), in line with the methodology proposed by Grabowski [58]. When compared to the traditional method, which already integrates an additional U.S. premium, an overvaluation is evident. Therefore, the use of the CDS value provides a more accurate estimate of the exclusive risk of the Ecuadorian market. Using method four, a weighted nominal WACC of 14.43% and a weighted real WACC of 12.63% is obtained.
This assessment highlights the need to review and adapt the WACC calculation methodologies to economic contexts, such as Ecuador’s, to ensure that estimates are consistent with the economic and financial situation of the country in question.
3.4. Financial Segmentation of Companies in the Energy Sector
This study conducted a clustering based on various financial metrics of companies in the energy sector. The objective is to segment the companies into homogeneous groups to better understand the financial trends, behaviors, and challenges within the sector. Table 5 presents descriptive statistics for several key financial variables of energy sector companies in Ecuador, providing a detailed view of their distribution and variability. Since the presence of extreme values can affect the quality and precision of the clustering, we chose to use logarithms for the variables, except for the WACC. The WACC shows a mean of 15.8% with a low standard deviation (0.011), indicating that the cost of capital is relatively consistent across companies in the sector. The acid ratio (Lacid), with a mean of 0.870 and a standard deviation of 1.399, suggests moderate liquidity but with high variability, indicating that some companies have a significantly higher or lower capacity to cover their current liabilities with liquid assets.
Table 5.
Descriptive statistics of financial indicators.
The sales ratio (LrotSales) and return on assets (Lroa) have means of 0.410 and 0.087 respectively, with standard deviations of 0.685 and 0.197, reflecting variability in sales and profitability levels between companies. The collection period (Lcollectiom) has a mean of 0.126 and a high standard deviation of 0.845, indicating large differences in collection cycles. Selling and administrative expenses (Lspending), with a mean of 0.149 and a standard deviation of 0.672, and financial burden (Lburden), with a mean of 0.027 and a standard deviation of 0.233, also show significant variability across firms. Finally, equity strength (Lstrength) has a mean of 0.459 and a standard deviation of 0.400, suggesting differences in the financial strength of the companies. These statistics highlight the need for customized approaches to financing and management policies to address the diverse financial conditions within the Ecuadorian energy sector.
After the application of three different clustering methods, each was evaluated using three different metrics to determine which method is the most appropriate for this analysis. The results of these metrics are presented in Table 6.
Table 6.
Clustering Evaluation.
Although DBSCAN showed the clearest and most defined clustering structure, reflected by the highest Silhouette Score of 0.6412, K-Means proved to be superior in terms of cluster separation and density, with a Calinski–Harabasz Score of 166.8955. However, Hierarchical Clustering had the best Davies–Bouldin Score of 0.6331, indicating greater separation between clusters.
When considering the balance between all metrics, Hierarchical Clustering was selected as the most appropriate method for this analysis, as it provides a balance between the clarity of the clustering structure and the density and the separation of the clusters. Therefore, this study employed Hierarchical Clustering to determine the conglomerates of companies with different financial and operational profiles, reflected in their respective WACCs. The clusters were characterized using the harmonic mean WACC, offering a more robust approach to interpreting variations in this crucial indicator.
According to Figure 2, the identified conglomerates present substantial differences in financial and operating indicators. The intrinsic specificities of the companies in each cluster, including liquidity, profitability, and operating efficiency, together with type or size, and location, play a fundamental role in the definition of the WACC, reflecting variations in the perception of risk and the cost of capital in different business environments.
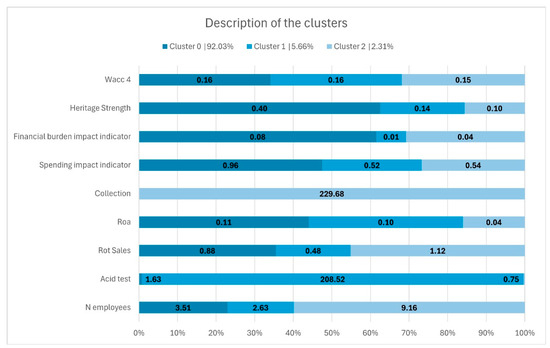
Figure 2.
Estimated clusters.
The results are in line with other studies that highlight the importance of considering the specific conditions of the local market to obtain more accurate estimates of the cost of capital [56,59,60]. The results of the present article are supported by, or are in the same direction as, other studies. For example, Li [18] highlights that traditional methods such as the CAPM may not be appropriate in all contexts, highlighting the need for specific adjustments to better reflect local economic realities [18]. In addition, Coutsiers and Gea [36] found that the WACC in renewable energy projects in Latin America varies significantly between countries due to factors such as country risk, which resonates with our findings on the importance of adjusting methodologies to the Ecuadorian context [36]. Steffen et al. [33] also notes that context-specific adjusted approaches, such as CDS integration, can improve the accuracy of WACC estimates [18]. Finally, these studies underline the need for the continuous evaluation and adjustment of the methodologies used to calculate the cost of capital in different economic and financial environments, reaffirming the validity of the adjusted methods proposed in this study for the Ecuadorian energy sector.
Thus, the hierarchical clustering analysis has revealed the existence of three distinct groups within the sector. Of these, cluster 0 is the most prominent, comprising 92% of the firms in the sector. Cluster 0 is characterized by a harmonic mean WACC of 0.1568. Firms in this group tend to have higher ratios of administrative and selling expenses to revenues. This can be interpreted as a sign that these firms are possibly incurring higher costs in these areas. Similarly, these companies also show a higher financial impact, suggesting that they may be facing higher financial costs in proportion to their sales. A positive feature of this group is their robustness in terms of equity. It indicates that the ratio of equity to total equity is higher compared to other groups. This can be interpreted as a sign of financial soundness and solvency, as it shows that these companies have a stronger capital base.
Finally, cluster 2, with 2.31% of the firms, has a harmonic mean WACC of 0.1465. The firms in this group tend to operate in medium-to-large market segments. This indicates that these firms have considerable presence in their respective markets, either in terms of market share or geographic reach. Although these firms have a long average collection period, which may suggest potential challenges in managing receivables or negotiating terms with customers, this factor does not appear to adversely affect their financial performance. A notable characteristic of cluster 2 is their high level of profitability. This indicates that these firms can generate significant profits relative to their investments and assets. Despite their profitability, the companies in this group show reduced equity strength. This suggests that they have a lower capital base relative to their total equity or that they may have higher levels of debt relative to their equity.
The identified clusters demonstrate that there is no single financial and risk profile that represents the sector. Investors will be interested in investing in those companies that represent the lowest risk, which in this case is represented by the larger companies.
4. Discussion
In line with the present study, it is important to note that project-specific characteristics-such as project risk, capital structure, and the economic and regulatory environment-can lead to significant variations in the WACC calculated for different projects, even within the same industry or country. For example, in KPMG’s study [61] on the cost of capital by industry, it was observed that the WACC varies considerably between different sectors due to factors such as regulatory risks and technological changes that impact business models, which is in accordance with [62].
Indeed, the results of this study indicate that the WACC values range between 12.63% and 29.70% depending on the method used. The traditional method presents the highest value, while the combined method offers a more reasonable estimate adjusted to local conditions with a nominal weighted WACC of 14.43% and an actual weighted WACC of 12.63%. These findings also underscore the importance of adapting WACC calculation methodologies to specific economic contexts.
This study aligns with previous research that highlights the need for specific adjustments to traditional WACC calculation methods to better reflect local economic realities. For example, Ref. [27] highlights that the accuracy of WACC estimation can be significantly improved by adapting methodologies to local market conditions. In addition, Refs. [25,33] suggest that factors such as country risk and economic stability have a substantial impact on the cost of capital, which is consistent with the findings of the present article.
In addition, this study covers a key aspect of the Ecuadorian economy: its dollarization. According to Steffen et al. [33], the use of methodologies that accurately incorporate country risk, such as the use of CDS, can provide a more realistic estimate and avoid overvaluation of risk. On the other hand, Pierret [25] highlights the importance of adjusting discount rates to adequately reflect risks in emerging and dollarized economies, supporting the relevance of the combined method used in this study. Also, Noothout [21] emphasize the need for methodologies adapted to illiquid and emerging markets to avoid significant distortions in investment decisions.
In this sense, recent literature suggests that the use of multifactor models can provide a more complete and accurate assessment of the cost of capital in emerging markets. Thus, Bedoya et al. [19] proposed a multifactor model for power transmission system operators in Colombia, showing that additional factors such as regulatory risk and interest rates can better explain variations in returns. Franc [6] also support the incorporation of multiple risk factors, especially in the energy sector, where idiosyncratic risks can be significant. Hashemi et al. [63] emphasize the importance of properly assessing the costs of power outages, as these can significantly increase operating costs and uncertainty for industrial firms in developing economies. Fares and King [64] also underline the relevance of sector-specific risks and the need for tailored methodologies to assess the cost of capital in contexts of high volatility and risk.
5. Conclusions, Implications and Limitations
This study posed two key research questions: What is the weighted average cost of capital (WACC) for the energy sector in Ecuador? How do different WACC calculation methodologies affect the estimation of the cost of capital in the Ecuadorian energy sector?
The answers to these questions were clearly determined. Regarding the first question, it was found that the appropriate WACC for the energy sector in Ecuador, considering the particularities of its economy, is best represented by method four, which combines the U.S. interest rate with the credit default swap (CDS) to accurately reflect the country’s debt default risk. This method resulted in a WACC of 12.63% in real terms and 14.43% in nominal terms, in contrast to the traditional method which overestimates the WACC at 31.77%.
Regarding the second question, this study showed that the different WACC calculation methodologies significantly affect the estimation of the cost of capital. While the traditional method overestimates the WACC due to the double penalty of country risk and the U.S. market premium, adjusted methods that consider the specific conditions of the Ecuadorian economy, such as the use of CDS to calculate the market risk premium, provide more accurate and useful estimates. This underscores the importance of adapting WACC calculation methodologies to local economic conditions to obtain realistic and applicable results for strategic and investment decision-making in the Ecuadorian energy sector.
In addition, the financial segmentation analysis revealed the existence of three distinct financial profiles among companies in the energy sector, underscoring the diversity of the sector and the need for customized approaches to financial management and investment. These findings not only effectively answer the research questions posed but also provide a solid foundation for future research and strategic decisions in the sector. Ultimately, this study highlights the importance of adopting financial approaches that consider local economic particularities, allowing companies and investors to make more informed decisions that are strategically aligned with Ecuadorian market conditions.
Likewise, the results of this study have important implications for financial management and strategic decision making in the Ecuadorian energy sector. The adoption of more accurate methodologies, such as the combined use of the U.S. interest rate and the credit default swap (CDS), provides companies and investors with more reliable tools to evaluate the cost of capital. This allows for better alignment of investment decisions with local economic realities, optimizing resource allocation and improving the profitability of energy projects. Furthermore, these findings suggest that traditional models need to be adjusted to specific market conditions, which is crucial for the development of effective regulatory frameworks and financial tools.
However, this study has several limitations. The reliance on historical and projected data from the U.S. market may introduce biases that do not fully reflect the dynamics of the Ecuadorian market. In addition, variability in CDS values and interest rates may affect the accuracy of WACC estimates over time. The methodology, although adjusted, is still a simplification of the complex and multifaceted economic reality. Finally, although the results are applicable to the Ecuadorian energy sector, specific studies in other sectors and regions are needed to validate the applicability of the proposed methodologies in different economic contexts.
Author Contributions
Conceptualization, F.N. and F.C.; methodology, F.C.; software, F.C.; validation, V.A., F.N. and F.C.; formal analysis, V.A.; investigation, F.N.; resources, F.N.; data curation, F.C.; writing—original draft preparation, Víctor Aguilar; writing—review and editing, V.A.; visualization, F.N.; supervision, V.A.; project administration, V.A.; funding acquisition, F.N. All authors have read and agreed to the published version of the manuscript.
Funding
This research was funded by Corporación Ecuatoriana para el Desarrollo de la Investigación y la Academia CEDIA, and Universidad de Cuenca grant number I+D+I-XVII-2022-51 and The APC was funded by Corporación Ecuatoriana para el Desarrollo de la Investigación y la Academia CEDIA.
Data Availability Statement
Data available on request due to restrictions: The databases associated with this research are not public due to rights issues with CEDIA, the institution that funded the research. However, the corresponding author can be contacted if access is required.
Conflicts of Interest
The authors declare no conflict of interest.
Nomenclature
| WACC | Weighted Average Cost of Capital |
| CAMP | Capital Asset Pricing Model |
| MRP | Market Risk Premium |
| CRP | Country Risk Premium |
| CDS | Credit Default Swap |
| ERP | Equity Risk Premium |
Appendix A
Table A1.
Foreign companies commonly used during benchmarking.
Table A1.
Foreign companies commonly used during benchmarking.
| Country | Name | City/Country | Beta r | p Value | Rsquared | Filter_Beta_p | Beta | Debt Beta | Beta Des | Selection |
|---|---|---|---|---|---|---|---|---|---|---|
| Chile | AES Andes S.A | Santiago, Chile | 0.5914 | 0.0000 | 0.1768 | 1.0000 | 0.7262 | 1.8638 | 1.1201 | Yes |
| Colombia | Celsia | Bogotá, Colombia | 0.3068 | 0.0003 | 0.1059 | 1.0000 | 0.5356 | −0.3449 | No | |
| Brazil | Centrais Elétricas Brasileiras S.A | Sai Paulo, Brasil | 1.2940 | 0.0000 | 0.3924 | 1.0000 | 1.1970 | −0.2523 | No | |
| Chile | Colbún | Santiago, Chile | 0.8323 | 0.0000 | 0.2560 | 1.0000 | 0.8877 | −20.7753 | No | |
| Chile | Enel Chile | Santiago, Chile | 0.9420 | 0.0000 | 0.3240 | 1.0000 | 0.9611 | −0.2526 | No | |
| Peru | Enel Perú | Lima, Perú | 0.5996 | 0.0000 | 0.1213 | 1.0000 | 0.7317 | 52.7686 | 1.9786 | No |
| Brazil | Energias do Brasil | Sau Paulo, Brasil | 0.7088 | 0.0000 | 0.3931 | 1.0000 | 0.8049 | 2.5731 | 1.0110 | Yes |
| Brazil | Eneva | Sau Paulo, Brasil | 0.7137 | 0.0000 | 0.2772 | 1.0000 | 0.8082 | −2.4494 | No | |
| Brazil | Engie Brasil Energia | Sau Paulo, Brasil | 0.5242 | 0.0000 | 0.3209 | 1.0000 | 0.6812 | −0.2208 | No | |
| Chile | Engie Energía Chile | Santiago, Chile | 0.7058 | 0.0000 | 0.2044 | 1.0000 | 0.8029 | 2.4954 | 0.9634 | Yes |
| Peru | Engie Energía Perú | Lima, Perú | 0.2619 | 0.0002 | 0.0815 | 1.0000 | 0.5054 | 1.8048 | 0.6579 | Yes |
| Mexico | IEnova | México DF, México | 0.8915 | 0.0000 | 0.2898 | 1.0000 | 0.9273 | −1.0644 | No | |
| Colombia | Interconexión Eléctrica S.A | Bogotá, Colombia | 0.4041 | 0.0002 | 0.0800 | 1.0000 | 0.6007 | 1.2035 | 0.7000 | Yes |
| Peru | Luz del Sur | Lima, Perú | 0.2857 | 0.0120 | 0.0276 | 0.0000 | 0.5214 | −0.3597 | No | |
| Mexico | Vista Oil & Gas S.A | México DF, México | 0.3003 | 0.3307 | 0.0199 | 0.0000 | 0.5312 | No |
References
- Samaniego, J.L.; Galindo, L.M.; Mostacedo, S.J.; Ferrer Carbonell, J.; Alatorre, J.E.; Reyes, O. El Cambio Climático y El Sector de Energía En América Latina; Publicación de las Naciones Unidas: Santiago, Chile, 2017. [Google Scholar]
- Stoenoiu, C.E.; Birou, I.; Cristea, C.; Serban, F.M. Renewable Energy in European Countries, Retrospective Analysis. IOP Conf. Ser. Earth Environ. Sci. 2021, 664, 012019. [Google Scholar] [CrossRef]
- MERNR. Energía, Sociedad y Ambiente; Ministerio de Energía y Minas: Quito, Ecuador, 2020. [Google Scholar]
- Español, C. en. Los Cortes de Energía Continuarán en Todo Ecuador, Informa el Gobierno. Available online: https://cnnespanol.cnn.com/2024/04/22/cortes-energia-continuaran-ecuador-orix/ (accessed on 6 January 2024).
- Dubrovsky, H.; Di Sbroiavacca, N.; Nadal, G.; Lisperguer, R.C. Rol y Perspectivas Del Sector Eléctrico En La Transformación Energética de América Latina; Publicación de las Naciones Unidas: Santiago, Chile, 2019. [Google Scholar]
- Franc-Dabrowska, J.; Madra-Sawicka, M.; Milewska, A. Energy Sector Risk and Cost of Capital Assessment—Companies and Investors Perspective. Energies 2021, 14, 1613. [Google Scholar] [CrossRef]
- Wiatros, M.; Jones, D.; Broadbent, H.; Fulghum, N.; Bruce, C.; Dizon, R.; Macdonald, P.; Moore, C.; Candlin, A.; Lee, U.; et al. Global Electriciy Review 2023; Ember: London, UK, 2023; Volume 5. [Google Scholar]
- Ritchie, H.; Rosado, P. Energy. Available online: https://ourworldindata.org/energy (accessed on 5 February 2022).
- Stoenoiu, C.E.; Balan, M.C.; Serban, F.M.; Cristea, C. Evolution of Renewable Energy Consumption in the European Countries. IOP Conf. Ser. Earth Environ. Sci. 2021, 664, 012018. [Google Scholar] [CrossRef]
- Financial Times. Financing the Energy Transition. Available online: https://white-and-case.ft.com/article/financing-the-energy-transition (accessed on 10 December 2023).
- IEA. Energy Investment in 2023. Available online: https://www.iea.org/reports/world-energy-investment-2023/introduction (accessed on 19 December 2023).
- International Energy Agency. World Energy Outlook; International Energy Agency: Paris, France, 2023. [Google Scholar]
- Barnes, D.F.; Samad, H.; Rivas, S. Meeting Challenges, Measuring Progress: The Benefits of Sustainable Energy Access in Latin America and the Caribbean; Inter-American Development Bank: Washington, DC, USA, 2018. [Google Scholar] [CrossRef]
- Ministerio de Energía y Minas. Transformación y Situación Actual Del Sector Eléctrico; Ministerio de Energía y Minas: Quito, Ecuador, 2020. [Google Scholar]
- Ministerio de Energía y Minas. En 2021 el Sector Eléctrico Dinamizó la Economía Nacional con un 93.2 % de Generación Renovable y la Exportación de Más de 500 GWh. Available online: https://www.recursosyenergia.gob.ec/en-2021-el-sector-electrico-dinamizo-la-economia-nacional-con-un-93-2-de-generacion-renovable-y-la-exportacion-de-mas-de-500-gwh/ (accessed on 13 February 2023).
- Casilda Béjar, R. Energía y Desarrollo Económico En América Latina. Boletín Económico ICE 2002, 2750, 31–44. [Google Scholar]
- Martín, H.; Coronas, S.; Alonso, À.; De La Hoz, J.; Matas, J. Renewable Energy Auction Prices: Near Subsidy-Free? Energies 2020, 13, 3383. [Google Scholar] [CrossRef]
- Li, H. Cost of Capital: Literatures Review about Calculation Methods and Influencing Factors. J. Serv. Sci. Manag. 2019, 12, 360–370. [Google Scholar] [CrossRef]
- Bedoya-Cadavid, J.A.; Lanzas-Duque, Á.M.; Salazar, H. WACC for Electric Power Transmission System Operators: The Case of Colombia. Energies 2023, 16, 964. [Google Scholar] [CrossRef]
- Dobrowolski, Z.; Drozdowski, G.; Panait, M.; Apostu, S.A. The Weighted Average Cost of Capital and Its Universality in Crisis Times: Evidence from the Energy Sector. Energies 2022, 15, 6655. [Google Scholar] [CrossRef]
- Noothout, P.; de Jager, D.; Tesnière, L.; van Rooijen, S.; Karypidis, N.; Brückmann, R.; Jirouš, F.; Breitschopf, B.; Angelopoulos, D.; Doukas, H.; et al. The Impact of Risks in Renewable Investments and the Role of Smart Policies; European Commission: Brussels, Belgium, 2016. [Google Scholar]
- Đukan, M.; Kitzing, L. A Bigger Bang for the Buck: The Impact of Risk Reduction on Renewable Energy Support Payments in Europe. Energy Policy 2023, 173, 113395. [Google Scholar] [CrossRef]
- DeCotis, P.A. Importance of Energy-Sector Investment in Technology and Infrastructure. Nat. Gas Electr. 2020, 36, 24–27. [Google Scholar] [CrossRef]
- Steffen, B. Estimating the Cost of Capital for Renewable Energy Projects. Energy Econ. 2020, 88, 104783. [Google Scholar] [CrossRef]
- Pierret, D. The Systemic Risk of Energy Markets. SSRN 2013. [Google Scholar] [CrossRef]
- Buhr, B.; Murinde, V.; Volz, U.; Pullin, N.; Donovan, C.; King, G.; Lo, Y. Climate Change and the Cost of Capital in Developing Countries: Assessing the Impact of Climate Risks on Sovereign Borrowing Costs; Imperial College London: London, UK; SOAS University of London: London, UK; UN Environment: Nairobi, Kenya, 2018; p. 32. [Google Scholar]
- Bachner, G.; Mayer, J.; Steininger, K.W. Costs or Benefits? Assessing the Economy-Wide Effects of the Electricity Sector ’s Low Carbon Transition—The Role of Capital Costs, Divergent Risk Perceptions and Premiums. Energy Strateg. Rev. 2019, 26, 100373. [Google Scholar] [CrossRef]
- Paper, E.W.; Gohdes, N.; Simshauser, P. Renewable Entry Costs, Project Finance and the Role of Revenue Quality in Australia’s National Electricity Market; University of Cambridge: Cambridge, UK, 2022. [Google Scholar]
- Moreira, L.; Junior, C.; Junior, A.; Castro, R.; Mello, O.; Hugo, V.; Pinheiro, R.B.; Sousa, W.L. Empirical Evidence of the Cost of Capital under Risk Conditions for Thermoelectric Power Plants in Brazil. Energies 2022, 15, 4313. [Google Scholar] [CrossRef]
- Damodaran, A. Investment Valuation: Tools and Techniques for Determining the Value of Any Asset, 3rd ed.; Wiley: Hoboken, NJ, USA, 2012. [Google Scholar]
- Adriana, G.O.L.; Maritza, T.I.K. Desarrollo de Una Herramienta de Cálculo para la Determinación del Costo Nivelado de Energía en el Contexto Ecuatoriano; Universidad Técnica de Cotopaxi: Latacunga, Ecuador, 2022. [Google Scholar]
- Masabanda, V. Modelo Económico para la Incorporación de Generación con Fuentes Renovables No Convencionales. Bachelor’s Thesis, Universidad Politécnica Salesiana, Cuenca, Ecuador, 2015. [Google Scholar]
- Steffen, B.; Waidelich, P. Determinants of Cost of Capital in the Electricity Sector Progress in Energy OPEN ACCESS. Prog. Energy 2022, 4, 033001. [Google Scholar] [CrossRef]
- Ionici, O.; Small, K.; D’Souza, F. Cost of Capital. An Introduction. In Capital Budgeting Valuation: Analysis for Today’s Investment Projects; Wiley: Hoboken, NJ, USA, 2011; pp. 339–362. [Google Scholar]
- Maquieira, C.; Espinosa, C. Valoración de Empresas, 1st ed.; LAINU: Santiago, Chile, 2019. [Google Scholar]
- Coutsiers, E.; Gea, M.; Rodríguez, R. Estimación de La Tasa de Costo de Capital Para Proyectos de Energía Renovable En Latinoamérica. Av. En Energías Renov. Y Medio Ambiente AVERMA 2022, 26, 369–379. [Google Scholar]
- Lonergan, K.E.; Egli, F.; Osorio, S.; Sansavini, G.; Pahle, M.; Schmidt, T.S.; Steffen, B. Improving the Representation of Cost of Capital in Energy System Models. Joule 2023, 7, 469–483. [Google Scholar] [CrossRef]
- Bank, T.W. RISE—Regulatory Indicators for Sustainable Energy. Available online: https://www.worldbank.org/en/topic/energy/publication/rise---regulatory-indicators-for-sustainable-energy (accessed on 6 January 2024).
- Walker, E. Cost of Capital in Emerging Markets: Bridging Gaps between Theory and Practice. Lat. Am. J. Econ. 2016, 53, 111–147. [Google Scholar]
- Schlegel, D. Cost-of-Capital in the Finance Literature. In Contributions to Management Science; Springer: Berlin/Heidelberg, Germany, 2015; pp. 9–70. [Google Scholar] [CrossRef]
- Bruner, R.; Eades, K.; Harris, R.; Higgins, R. “Best Practices” in Estimating the Cost of Capital: An Update. J. Appl. Financ. 2013, 23, 15. [Google Scholar]
- Schlegel, D. A Comparison of Global Empirical Results on Company Cost-of-Capital Practices. Int. J. Bus. Glob. 2014, 12, 53–62. [Google Scholar] [CrossRef]
- Fama, E.F.; French, K.R. Size, Value, and Momentum in International Stock Returns. J. Financ. Econ. 2012, 105, 457–472. [Google Scholar] [CrossRef]
- Yemba, B.P. User Cost of Foreign Monetary Assets under Dollarization. Financ. Res. Lett. 2022, 49, 103023. [Google Scholar] [CrossRef]
- Perold, A. The Capital Asset Pricing Model. J. Econ. Perspect. 2017, 18, 47–49. [Google Scholar] [CrossRef]
- Cohen, B. America’s Interest in Dollarization; UC Santa Barbara, Global Studies: Santa Barbara, CA, USA, 2004; pp. 5–24. [Google Scholar]
- Soto, R. Dollarization, Economic Growth, and Employment. Econ. Lett. 2009, 105, 42–45. [Google Scholar] [CrossRef][Green Version]
- Castillo-Ponce, R.A.; Truong, B.; De, M.; Rodriguez-Espinosa, L. Dollarization and Economic Interdependence: The Case of Ecuador Dolarizacion E Interdependencia Economica: El Caso De Ecuador. Rev. Análisis Económico 2021, 36, 85–108. [Google Scholar] [CrossRef]
- Maiella, M.; Ramírez, D. Valoración Económica Financiera Con Base En Evidencia de Laboratorios de Producción Farmacéutica. Actual. Contab. Faces 2022, 1, 34–52. [Google Scholar] [CrossRef]
- de Compañias, S. Ranking de Compañias. Superintendencia de Compañías, Valores y Seguros del Ecuador. Available online: https://appscvsmovil.supercias.gob.ec/ranking/reporte.html (accessed on 6 January 2024).
- Rubinstein, M.E. A mean-variance synthesis of corporate financial theory. J. Financ. 1973, 28, 167–181. [Google Scholar]
- Blume, M. Betas and Their Regression Tendencies. J. Financ. 1975, 30, 785–795. [Google Scholar] [CrossRef]
- Beltrame, F.; Cappelletto, R.; Toniolo, G. Estimating SMEs Cost of Equity Using a Value at Risk Approach, 1st ed.; Springer: Berlin/Heidelberg, Germany, 2014. [Google Scholar]
- Agustini, A.T. The Effect of Firm Size and Rate of Inflation on Cost of Capital: The Role of IFRS Adoption in the World. Procedia Soc. Behav. Sci. 2016, 219, 47–54. [Google Scholar] [CrossRef][Green Version]
- The Centre for International Economics. Inflation and WACC Prepared; The Centre for International Economics: Canberra, Australia, 2020. [Google Scholar]
- Mehta, D.R.; Curley, M.D.; Fung, H.G. Inflation, Budgeting Cost of Capital, and Procedures. Financ. Manag. 1984, 13, 48–54. [Google Scholar] [CrossRef]
- Moro, R. Inflation Risk Management in Project Finance Investments. Int. J. Financ. Account. 2012, 2012, 198–207. [Google Scholar]
- Grabowski, R.J.; Harrington, J.P.; Nunes, C. International Valuation Handbook-Guide to Cost of Capital; Wiley: Hoboken, NJ, USA, 2015. [Google Scholar]
- Dolbnya, E.A.; Vasilyeva, M.K.; Lyukina, A.Y. Analysis of Methods for Calculating the Weighted Average Cost of Capital of a Company on the Example of an Industrial Enterprise. Adv. Econ. Bus. Manag. Res. 2020, 128, 2803–2807. [Google Scholar]
- Fama, E.F.; French, K.R. The Capital Asset Pricing Model: Theory and Evidence. J. Econ. Perspect. 2004, 18, 25–46. [Google Scholar] [CrossRef]
- KPMG. Cost of Capital Study 2023; KPMG: Berlin, Germany, 2023. [Google Scholar]
- Damodaran, A. Cost of Equity and Capital (US). Available online: https://pages.stern.nyu.edu/~adamodar/New_Home_Page/datafile/wacc.html (accessed on 29 May 2024).
- Hashemi, M.; Jenkins, G.P.; Jyoti, R.; Ozbafli, A. Evaluating the Cost to Industry of Electricity Outages. Energy Sources Part B Econ. Plan. Policy 2018, 13, 340–349. [Google Scholar] [CrossRef]
- Fares, R.L.; King, C.W. Trends in Transmission, Distribution, and Administration Costs for U.S. Investor-Owned Electric Utilities. Energy Policy 2017, 105, 354–362. [Google Scholar] [CrossRef]


Disclaimer/Publisher’s Note: The statements, opinions and data contained in all publications are solely those of the individual author(s) and contributor(s) and not of MDPI and/or the editor(s). MDPI and/or the editor(s) disclaim responsibility for any injury to people or property resulting from any ideas, methods, instructions or products referred to in the content. |
© 2024 by the authors. Licensee MDPI, Basel, Switzerland. This article is an open access article distributed under the terms and conditions of the Creative Commons Attribution (CC BY) license (https://creativecommons.org/licenses/by/4.0/).