Article

Terrestrial Heat Flow and Lithospheric Thermal Structure Characteristics in Nanping City of Hainan

1
Hainan Key Laboratory of Marine Geological Resources and Environment, Haikou 570206, China
2
Institute of Hydrogeology and Environmental Geology, Chinese Academy of Geological Sciences, Shijiazhuang 050061, China
3
Technology Innovation Center for Geothermal & Hot Dry Rock Exploration and Development, Ministry of Natural Resources, Shijiazhuang 050061, China
4
Hainan Geological Survey Institute, Haikou 570206, China
*
Author to whom correspondence should be addressed.
Energies 2024, 17(19), 4824; https://doi.org/10.3390/en17194824
Submission received: 20 August 2024 / Revised: 11 September 2024 / Accepted: 24 September 2024 / Published: 26 September 2024
(This article belongs to the Section J: Thermal Management)

Abstract

:
The Nanping geothermal field in Hainan is situated within the Wuzhi Mountain fold belt of the South China fold system based on its geotectonic units. Although there is abundant surface heat detected and widespread distribution of Late Mesozoic granite in the area, the geological background of geothermal resources remains unclear. In this article, we collected core samples from boreholes within the Nanping geothermal field to conduct testing and analysis on rock thermal conductivity and heat-production rate. By combining these results with temperature logging data, we discuss a method for diterming the heat flow background of convective geothermal system. Furthermore, the study analyzed the geothermal flux and deep thermal structure of the research area. The results demonstrate that the average radioactive heat production rate of the Baocheng rock mass in the study area is 3.16 μW/m³, primarily attributed to the decay heat of Th and U, while the heat contribution of K is negligible. The thermal conductivity values of the rocks are relatively high, ranging from 2.29 to 3.75 W/(mK), slightly exceeding the average thermal conductivity of the upper crust. The study area represents a typical convective geothermal field influenced by groundwater convection, exhibiting a high geothermal temperature gradient. Using the groundwater-correction method, the geothermal flux in the study area is calculated to be 89–108.27 mW/m², of which the thermal conduction component is 73.17 mW/m² and the convective component is 15.83–35.1 mW/m². Among these components, heat generated from radioactive decay of crustal radioactive elements contributes 35.44 mW/m² to thermal conduction, while deep mantle conduction accounts for a heat flux is 37.73 mW/m², with a ratio of 1:1.07 between them. The difference between crustal and mantle heat fluxes is minimal in this region, indicating an approximation towards a “crust-mantle heat source balance zone”. Furthermore, the thickness of the “hot” lithosphere in the study area ranges from 42 to 46 km, indicating significant characteristics of extension-thinning.

1. Introduction

Surface heat flow represents the amount of heat transferred from the Earth’s interior to the surface per unit of area per unit of time [1,2], which can be measured. The surface display of the energy balance of the numerous dynamic processes inside the Earth provides a wealth of geologic and geodynamic information [3], also a key parameter for evaluating the potential of geothermal resources. According to the types of heat-transfer modes, geothermal systems are mainly categorized into two types, namely conduction and convection [4,5]. The surface heat flow of these two types exhibits distinct structural differences. Conductive geothermal systems demonstrate a simplistic structure, while convection geothermal systems primarily rely on convective as the main mechanism for heat transfer, the heat flow measured at the surface includes the heat transferred from the Earth’s interior and that transferred by convection of groundwater within the geothermal system [6].
Heat in the Earth’s interior mainly comes from the decay of radioactive elements in crustal rocks (crustal heat flow) and from the deep Earth (mantle heat flow) [7]. The proportions of the crustal and mantle heat flows, as well as the distribution of the deep Earth’s temperature field, reflect the lithospheric thermal structure characteristics [8,9]. The lithospheric thermal structure characteristics are a response to the thickness, temperature, and formation evolution of the lithosphere [10,11], which provides geodynamic information such as the tectonic deformation evolution of the lithosphere, and it is also the core of the study of the heat source mechanism of geothermal systems [12,13,14]. Therefore, it is of great significance to study the measurement and calculation of the geothermal heat flow and to establish the lithospheric thermal structure model, both for the study of the regional geothermal geological background and the process of tectonic thermal evolution.
Currently, five geothermal heat-flow measurement stations have been established in Hainan province: one in Chengmai County and four in Wanning City, whose heat flow is 63.2–82 mW/m2 [15,16]. The heat flow is 65.8 mW/m2 in the northern area and 73.17 mW/m2 in the southern area, higher than the average 61 mW/m2 of the Chinese mainland. In the southern part of Hainan lie many open-air hot springs with abundant geothermal resources. Nanping hot spring, distributed on Baocheng rock mass, has the largest single spring water flow in Hainan, with a maximum single-eye water flow of 51.2 m3/h and a water temperature of 77 °C. The Qixianling hot spring, which is also distributed on the Baocheng rock mass, has the highest water temperature of 97 °C. Therefore, the thermal geological condition of the Baocheng rock mass is good, and it has better conditions for geothermal resources development. However, the geodetic heat-flow measurement data in the area are all collected in early time, and only one data quality reaches grade A. The representativeness of the data is relatively bad, and the geothermal geological background is still unclear, which restricts the research, development, and utilization of regional geothermal resources. Therefore, this paper selects the Baocheng rock body distribution area with better geothermal geological conditions and more typical rock-body distribution as the study area to calculate the geodetic heat flow of the area, analyzes its background, and preliminarily establishes the lithospheric thermal structure model. In addition, for convective geothermal systems, it is usually impossible to calculate the heat-flow background by general methods, and it is impossible to judge the heat-flow contribution of heat-flow agents. The calculation method of the heat-flow background and convective component of convective geothermal systems in this paper provides basic data and theoretical reference for the heat flow research of convective geothermal systems.

2. Study Area

Lingshui area is located in the southern part of Hainan, which belongs to the Wujishan fold belt of the South China fold system in terms of geotectonic position. The research area is located between two east–west and one north–east deep tectonic zones (Figure 1a), which correspond to the north–east Yacheng–Gangbei tectonic zone, and the near-east–west Jiusuo–Lingshui tectonic zone, and the Jianfeng–Diaoluo tectonic zone, respectively. The formation of east–west fault zones decides the distribution of hot springs in many places. For instance, the hot springs of the Nanping geothermal field are roughly distributed in an EW directional manner along the bed of the Lingshui River, which means that they are brought by east–west sub-fractures.
In multi-phase tectonic movements, the Yanshan movement is mainly characterized by large-scale intrusion and eruption of acidic magma. The magmatic rocks exposed in Lingshui area are mainly the Baocheng rock mass, with small areas of Permian–Triassic and Jurassic granites exposed in the peripheral areas, and the magmatic rock associated with the geothermal system is the Baocheng rock mass [17], which is located in the north–eastern part of the Jiusuo–Lingshui tectonic belt in Southeastern Hainan, developed in the Late Yanshan period [18], spreading in a near-EW direction and spatially located in close relationship with the EW-oriented Jiusuo–Lingshui tectonic belt [19], with a total area of about 783 km2. The lithological types of the Baocheng rock massif include mainly diorite, granodiorite, granodiorite, quartz diorite, quartz diorite, and granite diorite. The main lithological types of the Baocheng rock mass include monzonitic granite, granodiorite, quartz diorite, granite porphyry, and granodiorite porphyry, accompanied by many other veins, such as granodiorite, microlite, lamprophyre, quartz, diorite, and doleritic dyke.
Figure 1. (a) Geological framework of Southeast Asia [20]; (b) regional geological map of Hainan Island [21,22]; (c) the location of the geothermal well and regional geological map of the study area.
Energies 17 04824 g001

3. Materials and Methods

3.1. Sample Collection and Testing

In this study, the data were collected from the core of five boreholes of Nanping geothermal field. The boreholes were numbered ZK1–ZK5, the borehole depth was 400–700 m, and the bottom hole temperature was 67–84 °C. Rock samples were collected from ZK1–ZK5 borehole cores, and the rock types mainly included biotite monzonitic granite and diabase, basically covering the main reservoir types in the study area. A total of 24 rock samples were tested for thermal conductivity parameters, 19 rock samples were tested for content of U, Th, and K, and the sampling depths and test results are shown in Table 1. The tests of thermal conductivity were conducted at the Institute of Hydrogeology and Environmental Geology of the Chinese Academy of Geological Sciences.

3.2. Borehole Temperature Measurement

Geothermal temperature measurement is the basis for the study of geothermal heat flow and the thermal structure of the lithosphere. Geothermal temperature logging was conducted in five boreholes in the Nanping geothermal field. The Z1-1000 double-speed logging winch logging system with PPS25 electronic probe which made by Pioneer Petrotech Services Inc. (Calgary, AB, Canada),was used to measure the temperature of the boreholes, with a measurement range of 0.1–177 °C, an accuracy of 0.5 °C, and a temperature resolution of 0.01 °C. The method of well temperature measurement adopted is down-test continuous temperature measurement, with the winch controller pulling up at a uniform velocity controlled at 10 m/min. The checkpoint measurement is conducted every 200 m. The ground temperature measurement conforms to DZ/T0080-2010 [23].
The measurement was conducted 1 year after the completion of the well building, and the well temperature was basically restored to a steady state and a quasi-steady state [24]. The measurement data were close to those measured when the borehole reached the thermal equilibrium, and the temperature inside the well was close to the true formation temperature. The distribution of temperature-measured boreholes in the study area is shown in Figure 1b.

3.3. Thermal Conductivity Coefficient Test

Thermal conductivity, which represents the ability of a rock mass to conduct heat, is a basic parameter for calculating terrestrial heat flow, and its value is closely related to the lithology, mineral composition, and internal structure, as well as the in situ external environment. The external environment is mainly affected by temperature, pressure, water content, and other factors. The difference in water content of rocks is related to the porosity. With the increase in water content, the thermal conductivity of rocks tends to increase. For the dense granite rock in the study area, the porosity is mostly lower than 3%, and the influence of water content on the thermal conductivity of rocks can be ignored [25]. Pressure has a certain degree of influence on the thermal conductivity, but for every 1 MPa increase in pressure, the thermal conductivity is only increased by 1–2% [26]. The thermal conductivity is greatly affected by temperature and generally decreases with the increase in temperature [27]. The buried depth of the layer involved in heat-flow calculation in the study area is less than 1 km, and the influence of formation pressure is far less than that of temperature [28,29]. Therefore, only temperature correction of the thermal conductivity value was conducted in this study.
Vosteen and Schellschmidt analyzed the correlation between thermal conductivity and temperature of crystalline rocks (volcanic rocks, metamorphic rocks) and sedimentary rocks, and they conducted tests for crystalline rocks in the range of 0–500 °C and sedimentary rocks in the range of 0–300 °C. They concluded that the correlation between thermal conductivity and temperature is different in crystalline rocks and sedimentary rocks due to the essential differences in the genesis and mineralogical composition of these two types. They developed correlation equations for the calibration of the thermal conductivity collected in the laboratory [30].
λ T = λ ( 0 ) 0.99 + T a b / λ ( 0 )
λ 0 = 0.53 λ 25 + 1 2 1.13 λ 25 2 0.42 λ 25
In the equation, λ (0) and λ (25) correspond to the thermal conductivity with the external environment at 0 °C and 25 °C, respectively. λ (T) corresponds to the thermal conductivity of the rock at the in situ temperature, λ ’s unit as W/(m·K), T’s unit as °C. The constants a = 0.003 and b = 0.0042 in crystalline rocks, and constants a = 0.0034 and b = 0.0039 in sedimentary rocks.
The thermal conductivity was measured by an automatic thermal conductivity scanner (TCS) at 25 °C, with a measuring range of 0.2~25 W/(mK) and an accuracy of ±3%.

3.4. Heat-Generation Rate

The radioactive heat generation of rocks represents the ability of the radioactive elements in the rock to release heat by decay, for the core samples collected, is usually calculated using the proportions of Uranium (U), Thoriu (Th), and Kalium (K) in rock components in conjunction with the density of the rock [31], as follows:
A = ρ × ( 0.0952 × C U + 0.0348 × C K + 0.0256 × C Th )
In the equation, A refers to radioactive heat generation of rocks (μw/m3), ρ refers to rock density (g/m3), and CU, CTh, and CK are the content of uranium (μg/g), thorium (μg/g), and kalium (wt%) in the rock, respectively.
For rocks deep in the Earth’s crust that cannot be accessed by drilling, Rybach and Buntebarth proposed a Vp-A formula bounded by the age of the geologic body through extensive experimental measurements [32]:
lnA = 13.7 − 2.17VP
A is the radioactive heat-generation rate, and the unit is μW/m3; Vp is the seismic wave velocity, expressed in km/s.
U and Th were tested by ICP-MS with an uncertainty ranging from 1% to 10%. K was tested by XRF with an uncertainty ranging from 1% to 2%. The data of seismic primary waves’ velocity were measured by the Lingshui seismic station [33].

3.5. Surface Heat-Flow Calculation

The vertical convective activity of groundwater is one of the major disturbing factors in heat-flow calculations [34,35]. The temperature-depth curve presents an “upward convex” type when the hot water upwells at depth, and a “downward concave” type when the groundwater seeps down from the upper part of the groundwater. The shape and magnitude of the upward convexity and downward concavity depend on the rate of groundwater upwelling or seepage (Figure 2). To calculate reliable heat-flow values, groundwater transport needs to be corrected [36].
Nanping geothermal field belongs to the convective geothermal system, and its Earth heat flow includes the heat conducted inside the earth and that carried by groundwater convection in the geothermal system. In the center of the geothermal field where underground hot water upwells along the fracture intersection site, the groundwater convection largely influences the heat flow. In the area far away from the geothermal center with weak groundwater activity, the influence of groundwater convection is gradually weakened.
The temperature measurement curve of the boreholes of the geothermal field presents data in an upward convex type, indicating a strong vertical movement of underground water at this level [6], which can be corrected by the bellowing formula.
Q = ρ c v z Δ T + ρ c v z × T Z T 1 e ρ c v z λ z 2 z 1 e ρ c v z λ z 2 z 1 1
v z = 4 λ z 2 z 1 c ρ 1 T z T 1 T 2 T 1
In the formula, ρ   a n d   c refer to the density (kg/m3) and specific heat (kJ/kg·K) of the water, respectively. T1, T2, and Tz refer to the temperature at the depth of z1 and z2, and the middle. υ z is the upwelling vertical velocity (m/s) of the hot water.

4. Results

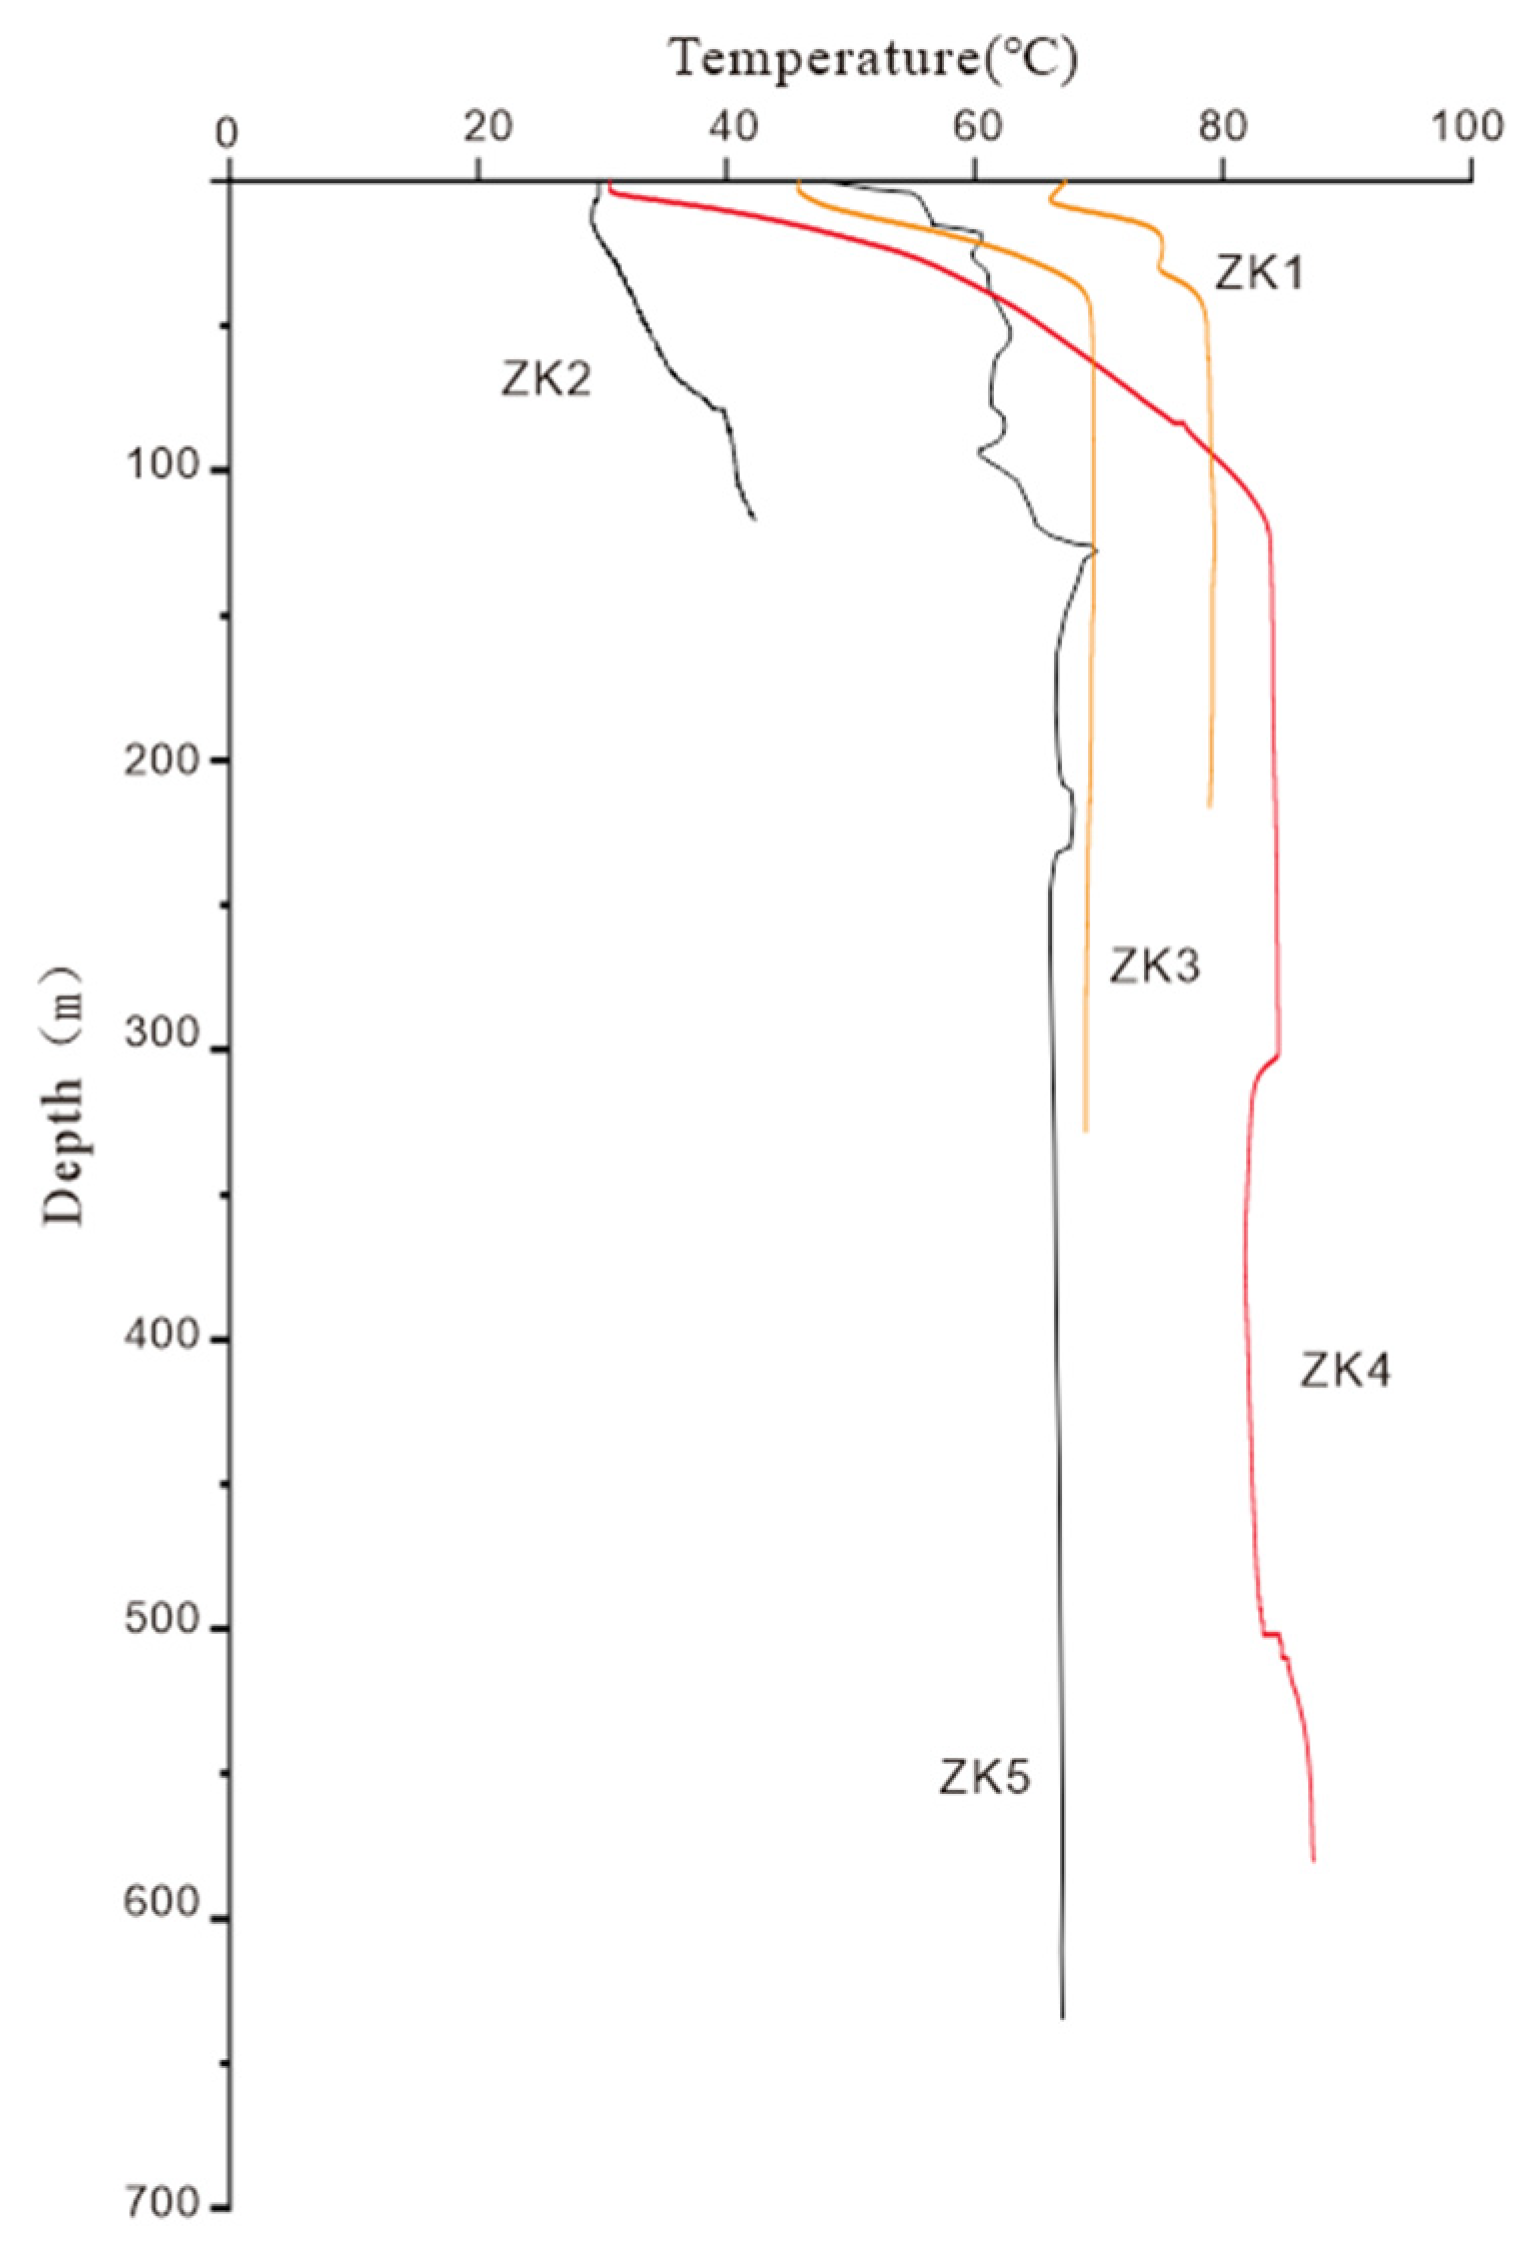
4.1. Distribution Characteristics of the Vertical Geothermal Field

According to the performance of borehole cores in the Nanping geothermal field, the thermal reservoir lithology is mainly biotite monzonite granite, visible diabase (gabbro), diorite porphyry, carbonate, and other dyke rocks. Rock compression and fragmentation are strong, with hydrothermal alteration phenomena and obvious traces of groundwater activities.
Figure 3 shows the temperature–depth distribution of the boreholes. The temperature distribution of the boreholes in the Nanping studied area is quite uniform, showing a trend of upward convexity of the temperature curves in the shallower part above the 100 m point, which may be affected by the upwelling of hot water. In the deeper part of the boreholes below the 100 m point, the temperature is almost maintained by the development of the fissures in the granite core exposed in the boreholes, with the gradient of the geothermal temperature basically remaining unchanged. Corresponding to the lithology of the stratum exposed by the drill holes, the temperature increases rapidly with a large gradient before the drill holes expose the water storage structure, while after passing through the water storage structure, the temperature increase slows down and the gradient decreases.
Taking the ZK4 borehole in Nanping as an example, the fracture zone at 274.0–509.0 m exposed by the borehole develops fissures, mostly chloritization or epidotization and potash feldspathization. The geothermal distribution in this area is divided into several layers. (1) In the 0–120 m layer, the geothermal temperature increases rapidly, and the temperature measurement curve shows a convex trend, which can reach 320 °C/km. (2) In the 120–300 m layer, the formation temperature increases steadily and slowly with the depth increasing. The average geothermal gradient is 4.44 °C/km. (3) In the 300–500 m layer, the geothermal gradient has a negative growth, probably due to the mixing of cold water caused by local crushing. (4) In the 500–580 m layer, the temperature curve shows a convex trend. From the wellhead exposed by the ZK5 borehole to 263 m, the overall core breakage, fissure development, and temperature-measurement curve show an irregular jagged shape from 0 to 263 m, which is closely related to local fissure development and hydraulic connection. Below 263 m, the deep formation temperature increases steadily and slowly with the depth increasing, and the average geothermal gradient is 2.59 °C/km. In order to compare with the ground temperature distribution in the Nanping area, the borehole temperature-measurement data of the Qixianling area, which is located in the northern part of the Baocheng rock mass, were collected to reveal the regional heat-flow background [37]. The ground temperature in the Qixianling research area presents a sectional trend of convective growth. (1) The ground temperature increases rapidly in 20–160 m, and the temperature-measurement curve presents an upward trend. (2) The temperature-measurement curve presents an upward trend in the 160–464 m layer. (3) The ground temperature at the 464–532 m horizon shows a conductive geothermal trend, and the average geothermal gradient is 31.6 °C/km (Figure 4).

4.2. Thermal Conductivity Characteristics

The samples in this test mainly consist of biotite monzonitic granite and diabase (Table 2). Due to the fragmentation of moderately weathered granite rock mass, the porosity is 2.96–8.61%, with an average of 5.16%. The porosity of biotite monzonitic granite with a low weathering degree is 1.82–3.35%, with an average of 2.34%. Porosity has a negative effect on the thermal conductivity of rock samples. That is, the thermal conductivity tends to decrease with the increase of porosity (Figure 5). Therefore, biotite monzonitic granite and moderately weathered biotite monzonitic granite are discussed separately in this paper.
The temperature of the rock samples was corrected, and the thermal conductivity after correction was shown in the figure and table. The corrected thermal conductivity ranges from 1.27 to 3.75 W/(mK), among which the granite thermal conductivity ranges from 2.29 to 3.75 W/(mK), with an average of 2.72 W/(mK). The moderately weathered biotic monzonite granite thermal conductivity ranges from 1.47–3.02 W/(mK), with an average of 1.69 W/(mK). The thermal conductivity of diorite ranges from 1.27 to 2.72 W/(mK), with an average of 1.99 W/(mK). The thermal conductivity of each lithology increases as the depth increases, and decreases as the temperature increases, with an average decrease rate of 5.04% (Figure 6).

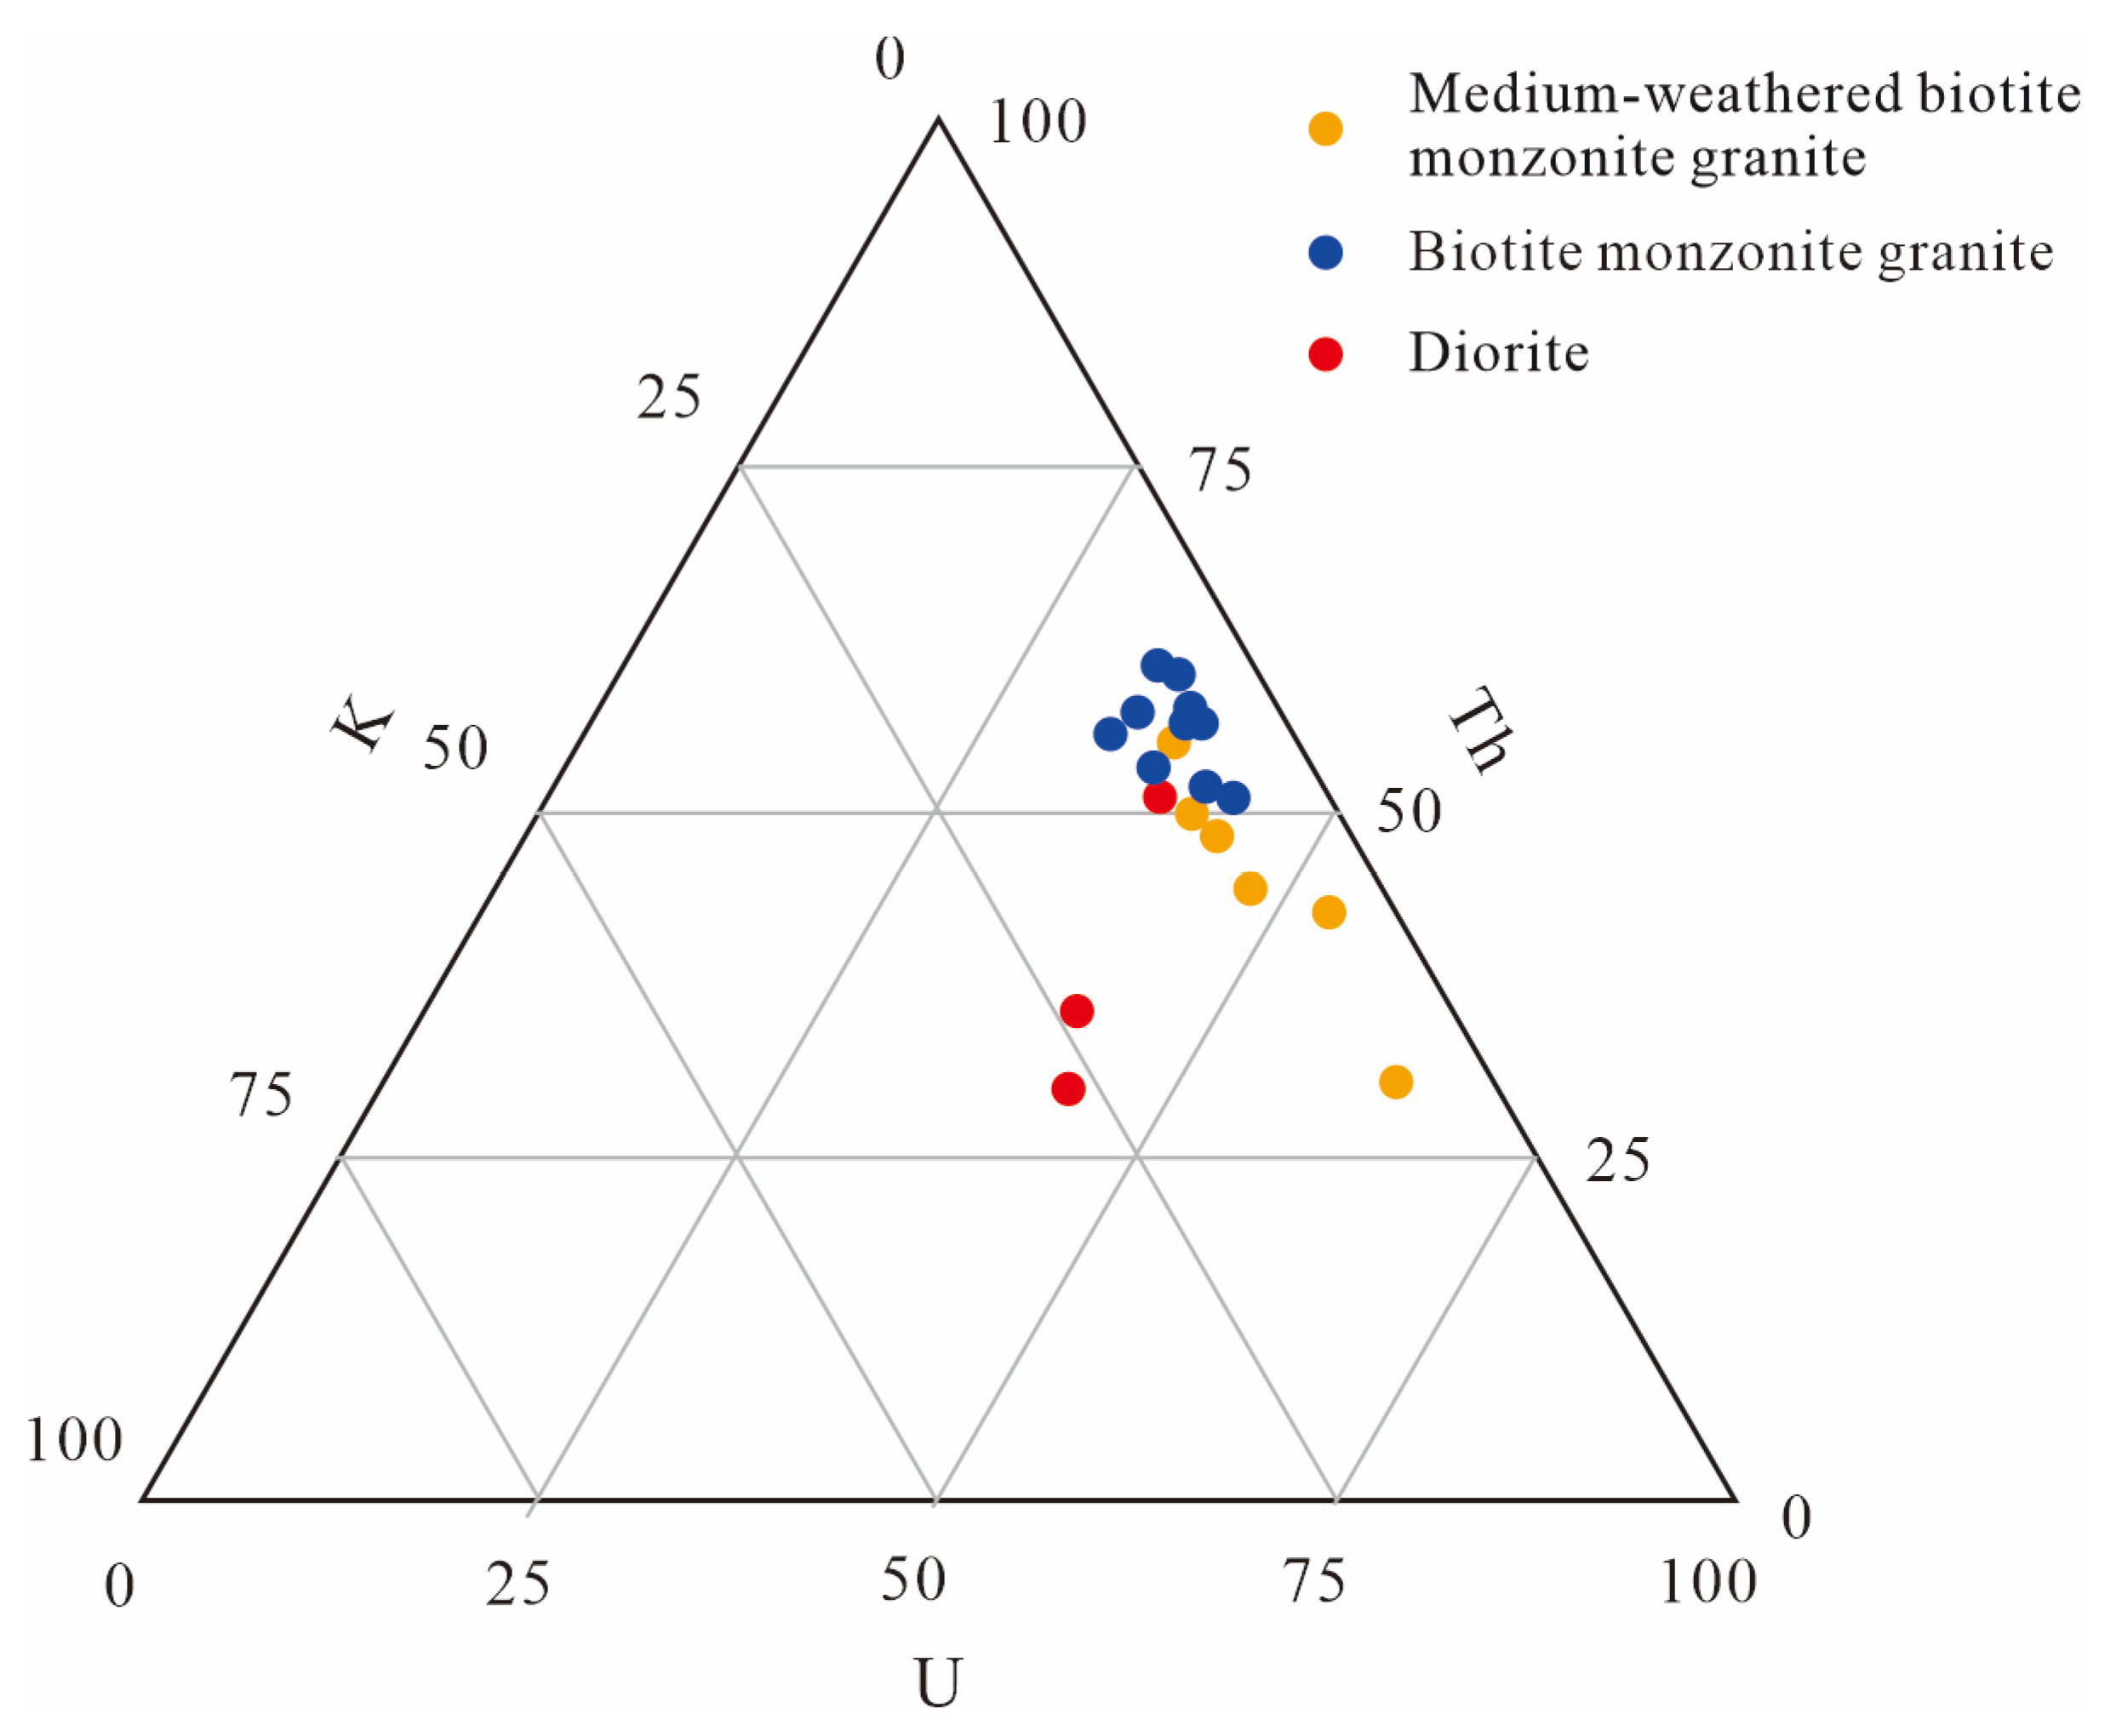
4.3. Heat-Generation-Rate Characteristics

For the samples of all three radio-genetic elements analyzed (Table 2), the ternary diagram of Th-U-K relative to their respective heat production constants shows that Th and U are the main heat-producing elements of the Baocheng rock mass. For granites with a low weathering degree, the heat-generation rate varies from 2.24 to 4.07 μW/m3, with an average of 3.16 μW/m3. This contribution to the heat-generation rate is 51.2 to 60.8%, which is dominant, followed by U contributing 33.17 to 43.14%. K’s contribution is negligible.
The heat-generation rate of medium-weathered granite ranges from 2.29 to 4.43 μW/m3, 2.86 μW/m3 on average. The contribution of U to the heat-generation rate increases gradually, with the heat-generation rate from 37.28 to 63.35%. The contribution of Th is 30.59 to 55.04%, and the contribution of K is negligible. All of these show that granite heat generation is driven by Th (Figure 7).
The heat-generation rate of diorite is low, 0.64–0.98 μW/m3. The contribution of U, Th, and K to the heat-generation rate is 38.41–43.51%, 30.16–51.33%, and 10.26–26.33%, respectively.
The heat-generation rate of the granite in a geothermal reservoir in the research area is slightly higher than that of the world-wide average rate of 2.5 μW/m3 [38]. Using magnetotelluric sounding technology, the depth of the Baocheng rock body can be up to 8 km [39], so the heat-generation rate of granite bodies above the 8 km point is represented by less weathered biotite diorite granite.
For the heat-generation rate of rock mass below the 8 km point, through the collected seismic P-wave velocity Vp data in the research area, the heat-generation rate of each rock layer deep in the crust is calculated as shown in the table. It can be seen that the value of the rock heat-generation rate decreases as the depth increases (Table 3).

4.4. Heat-Flow Calculation

The heat-flow value was calculated from the borehole data of the Nanping geothermal field. After the borehole bore through the sedimentary cover (7 m), it entered the granite body, and the lithology is mainly biotite monzonite granite. The average thermal conductivity (2.72 W/(mK)) of biotite monzonitic granite of the low weathering degree was selected as the representative for calculation.
The calculation results are shown in Table 4. The hot water upwelling rates of ZK4 and ZK5 boreholes in the Nanping geothermal field are 9.56 × 10⁻⁸ m/s and 4.2 × 10⁻⁸ m/s, respectively. The surface flux is 89–92.9 mW/m2.
The hot water upwelling rate of the ZK11 borehole in the Qixianling geothermal field is 5.8 × 10⁻⁸ m/s in the upper section and 1.3 × 10⁻⁸ m/s in the middle section. The calculated heat-flow value is 96.23 mW/m2 in the upper section and 96.61 mW/m2 in the middle section. The lower section adopts the calculation method of the conduction heat-flow value, and the heat-flow value is 108.27 mW/m2. By using the thickness-weighted average method, the surface flux of the borehole is 99.23 mW/m2. In conclusion, the Baocheng rock mass area has a high heat-flow background.

5. Discussion

5.1. Heat-Flow Composition Analysis

The crustal structure can be stratified according to the important VP velocity interface [40], with VP = 6.0 km/s, 6.2 km/s, and 6.7 km/s as the interfaces of the upper crust top, upper crust bottom, and middle crust bottom, respectively (Editorial Committee of Geoscience Section, China Earthquake Administration, 1992).
Using the Moho depth map of the whole country and geophysical prospecting results [17], we can conclude that the thickness of the Baocheng rock mass is 8 km, and below the 8km point, there is metamorphic batholith with a thickness of 3 km, followed by upper crust with a thickness of 3 km, middle crust with a thickness of 6 km, and lower crust with a thickness of 14 km [17]. In this study, the average measured data are taken as the heat-generation rate of the Baocheng rock mass, and the VP-A relationship is used for that below the Baocheng rock mass to obtain the heat-generation rate of the corresponding layer. In the calculation process, the seismic wave velocity at the depth of 8 km is not measured, so the wave velocity curves of the upper and lower sections are used to find the corresponding values. The average value of the two ends of each section is used to represent the heat-generation rate of each section for those below 8 km.
The heat energy generated by radioactive elements in each layer is calculated separately. The results show that the heat energy generated by the decay of radioactive elements in the crust below the Moho surface (0–34 km) in the research area is 35.44 mW/m2; that is, the crustal heat flow is 35.44 mW/m2. Since systematic measurements of terrestrial heat flow have not been conducted in the research area, the average value of heat flow in Southern Hainan is 73.17 mW/m2 as the heat-flow background and the conduction component of geothermal flux in this area, which mainly consists of crustal heat flow and mantle heat flow [20,41]. The mantle heat flow in this area can be estimated to be 37.73 mW/m2. It is further estimated that the ratio of heat flow between the inner crust and mantle is 1:1.07, and there is little difference between the crustal source heat flow and the mantle heat flow, which can be approximately regarded as the “crust and mantle heat source equilibrium zone”.
Concluding the above analysis, the surface heat flux of 89–99.23 mW/m2 in the distribution area of the Baocheng rock mass in Hainan is composed of three parts of heat: the convective component of 15.83–26.06 mW/m2, the heat generated by the decay of radioactive elements in the crust of 35.44 mW/m2, and the heat flow in the deep mantle of 37.73 mW/m2. The heat carried by the deep water during the upwelling process accounts for 17.8–26.26% of the total surface heat flux (Figure 8).

5.2. The Thickness of Thermal Lithosphere

The lithosphere, including the crust and upper mantle, is a rigid layer floating on the partially molten mantle asthenosphere, while the thermal lithosphere refers to the rock layer defined by geothermal methods. Heat flow is transferred by heat conduction in the upper part of the thermal lithosphere and by heat convection in the lower part [42]. In the studies of the lithosphere, the thickness of the thermal lithosphere is an important parameter to characterize the thermal structure of the lithosphere, reflecting the thermal action of the lithosphere in terms of time scale. It has scientific significance for the study of geological tectonic action, mantle material upwelling, volcanic origin, and its dynamic mechanism in volcanic regions [39].
Lachenbruch (1970) proposed that the solid phase line of mantle material can be approximated by the dry basalt solid phase line (BDS) [8]. Rudnick et al. (1998) proposed that the depth corresponding to the intersection point of the geothermal curve and BDS equals the thickness of the thermal lithosphere [43]. Artemieva and Mooney (2001) put forward that there exists a boundary layer in the contact zone between the thermal lithosphere and its lower layer, which has the properties of heat conduction and convection, and proposed two adiabat, which serve as the upper and lower limit of the interface temperature of the thermal lithosphere, whose depth range corresponding to the intersection point of the geothermal curve is the depth range of the thermal lithosphere [44].
Upper limit: T1 = 1200 °C + 0.5(°C/km) × Z(km)
Lower limit: T2 = 1300 °C + 0.4(°C/km) × Z(km)
Due to objective reasons, the temperature data from the deep crust to the mantle cannot be measured and collected. The vertical distribution curve of the temperature in the crust and upper mantle can be deduced by the one-dimensional heat-conduction formula.
T z = T 0 + Q 0 Z λ A Z 2 2 λ
In the formula, T0 refers to the temperature (°C) of the constant temperature zone, which, in the calculation, is the annual average temperature of the research area 24.5 °C. Q0 refers to heat flow (mW/m2). Z is the depth (km), A is the heat-generation rate (μW/m3), and λ is the thermal conductivity of the calculation section, expressed in W/(mk). Based on the measured results in this paper and the previous research data, it is necessary to consider the influence of temperature on the thermal conductivity of unsampled rocks in the upper crust and middle crust of the lithosphere; that is, λ (T,Z) = λ 0/(1 + αT). In this formula, α is the temperature-effect parameter, 1 × 10⁻³ °C−1. λ 0 of the upper crust is 2.9 W/(m·K), and that of the middle crust is 2.3 W/(m·K). The thermal conductivity of the lower crust and mantle rocks of the lithosphere can be taken as a constant 2.5 in the study without considering the influence of temperature [45] (Table 5).
The calculated shallow Earth temperature curve is quite in line with the temperature obtained through boreholes, and the temperature reaches 150 °C at the depth of 5 km in hot water circulation, which is consistent with the calculated heat reservoir temperature. The inner temperature of the granite is 585 °C at the depth of 22 km, which is consistent with the conclusion of the inner depth (22–23 km) in the Nanping area [46]. The temperature at the Moho surface at a depth of 30 km is 787 °C, which is consistent with the conclusion calculated by Tang (2018) that the temperature at the Moho surface in South China is 600–800 °C [47].
According to the above temperature and adiabatic curves, the thickness range of the thermal lithosphere in the research area is 42–46 km (Figure 9). It belongs to the region with a thin thickness of thermal lithosphere and high temperature of the Moho surface, which indicates that this area is subjected to strong mantle heat action and crustal extension and thinning on the oceanic side. There is little difference between the thickness of the “thermal” lithosphere and that of the seismic lithosphere, which may indicate that the thickness of the rheological boundary layer in this area is small [47].

6. Conclusions

(1)
The test analysis reveals that the thermal conductivity of the Baocheng rock mass in Nanping exhibits an increasing trend with depth while gradually decreasing with higher degrees of weathering. The thermal conductivity values for lower weathered biotite granites range from 2.29 to 3.75 W/(m·K), with an average value of 2.72 W/(m·K), and that of moderately weathered biotite granites ranges from 1.47 to 3.02 W/(m·K), with an average value of 1.69 W/(m·K).
(2)
Borehole temperature measurements indicate that hot water migration in this area is significantly influenced by convection processes. By applying groundwater correction, the surface heat flux is calculated to be 89–99.23 mW/m2, reflecting the good geothermal geological background in this region.
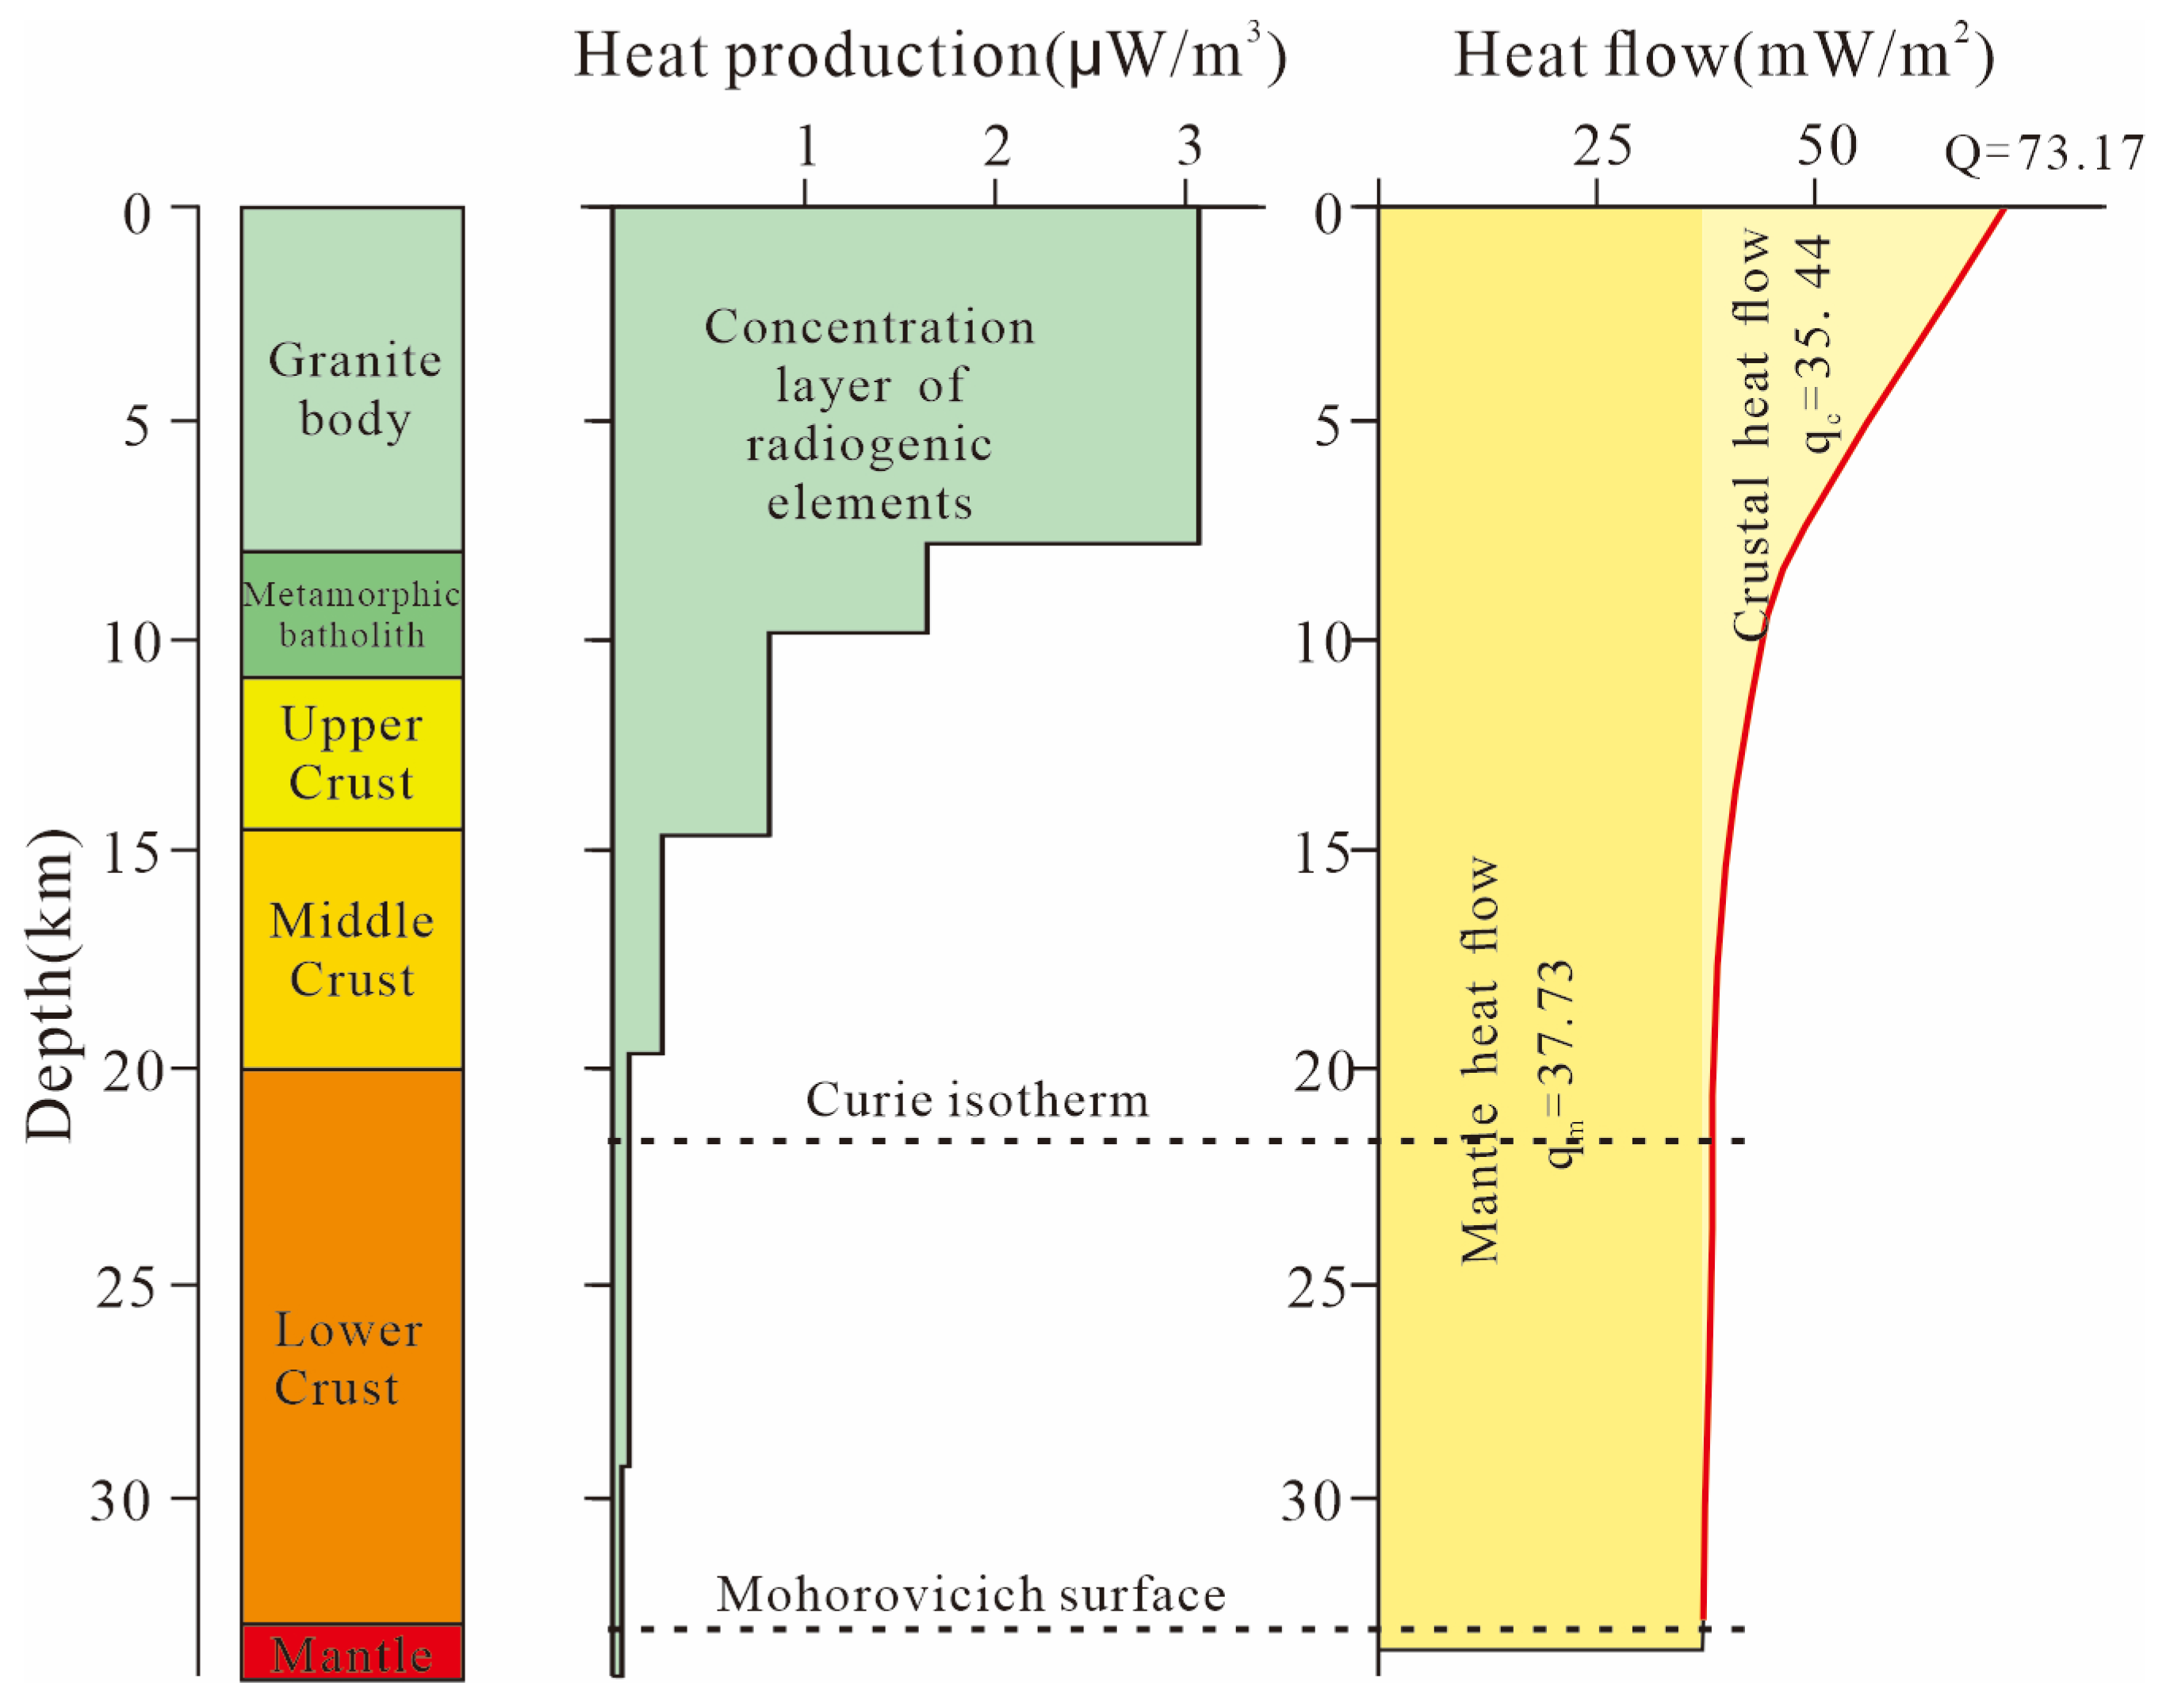
(3)
Based on the measured rock mass heat-generation rates and calculations using seismic wave velocity, the distribution pattern of heat flow across different layers within the research area can be determined. The surface heat flux includes both conduction dissipation (73.17 mW/m2) and convective transport by groundwater (15.83–26.06 mW/m2). Groundwater convection contributes approximately 17.8–26.26% to the total heat flow in this area. In the conduction heat, the crustal and mantle heat flows have a division ratio close to 1:1.07. The thermal structure of the lithosphere belongs to the crust and mantle heat-source equilibrium zone.
(4)
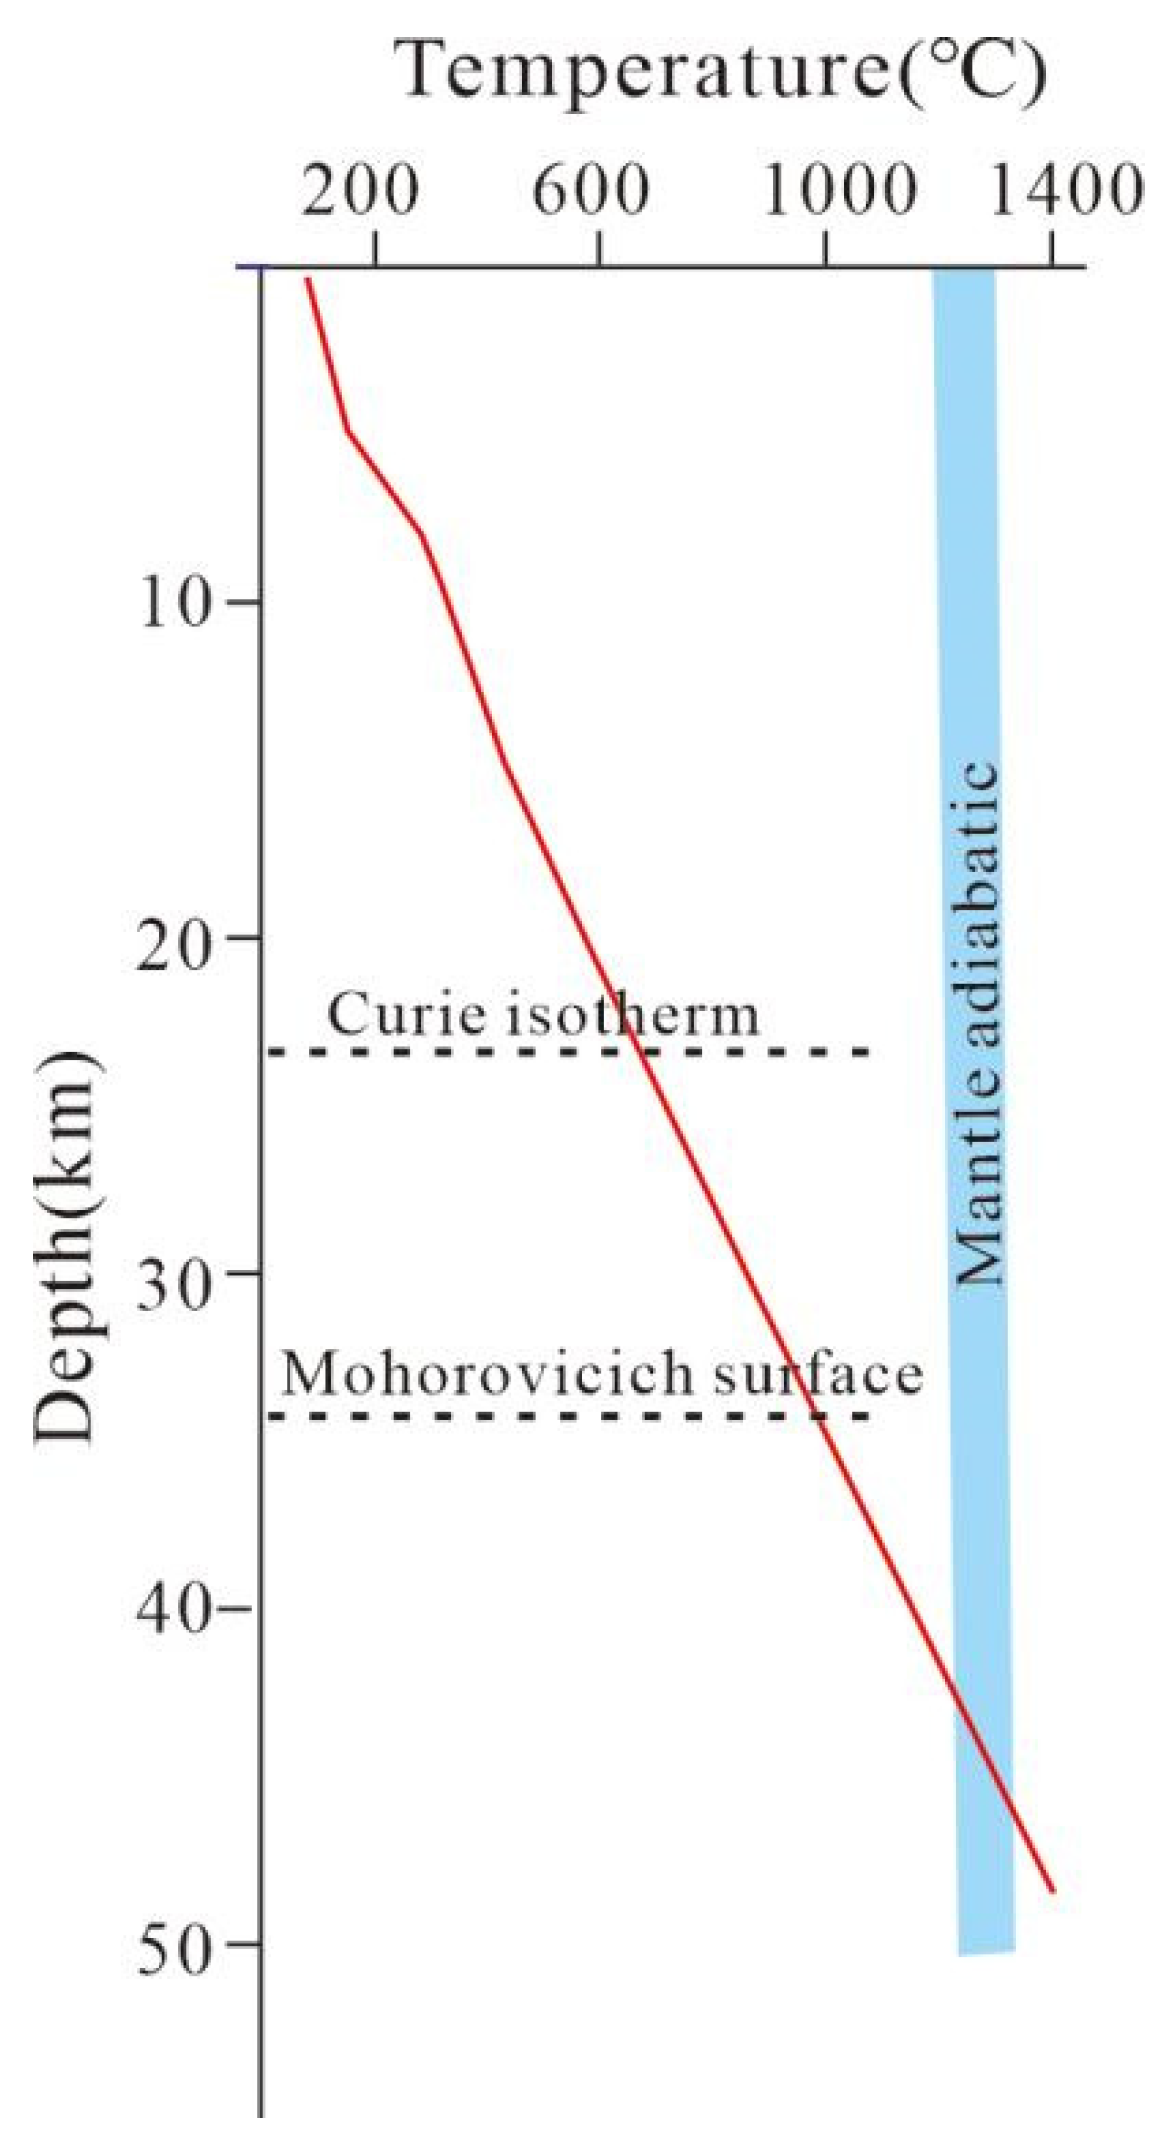
The thickness of the hot lithosphere is only 42–46 km, and a Moho surface temperature reaches as high as 787 °C. This suggests a strong influence from mantle heating action, along with crustal extension and thinning toward the ocean.

Author Contributions

Formal analysis, R.Y.; Investigation, R.Y. and F.Y.; Writing—original draft, X.Y.; Writing—review & editing, X.W.; Funding acquisition, X.W. and G.X. All authors have read and agreed to the published version of the manuscript.

Funding

This work was supported by the project of Independent project of Hainan Key Laboratory of Marine Geological Resources and Environment (NO.23-HNHYDZZYHJZZ007), the China Geological Survey (Grant NO. DD20221676), Hainan Department of Finance Project (NO. HNDZDC-2023-1).

Data Availability Statement

The original contributions presented in the study are included in the article, further inquiries can be directed to the corresponding author.

Conflicts of Interest

The authors declare no conflict of interest.

References

  1. Wang, J.Y.; Huang, S.B. Compilation of heat flow data for continental area of China. Sci. Geol. Sin. 1988, 2, 196–204. [Google Scholar]
  2. Jiang, G.; Hu, S.; Shi, Y.; Zhang, C.; Wang, Z.T.; Hu, D. Terrestrial heat flow of continental China: Updated dataset and tectonic implications. Tectonophysics 2019, 753, 36–48. [Google Scholar] [CrossRef]
  3. Davies, J.H. Global map of solid Earth surface heat flow: Global Surface Heat Flow Map. Geochem. Geophys. Geosyst. 2013, 14, 4608–4622. [Google Scholar] [CrossRef]
  4. Wang, G.L.; Lin, W.J. Main hydro-geothermal systems and their genetic models in China. Acta Geol. Sin. 2020, 94, 1923–1937. [Google Scholar]
  5. Muffler, L.J.P. Tectonic and Hydrologic Control of the Nature and Distribution of the Second United Nations Symposium on the Development and Use of Geothermal Resources; Government Printing Office: Washington, DC, USA, 1976; pp. 499–507.
  6. Xiong, L.P.; Wang, J.Y.; Pang, Z.H. Convective and Conductive Heat Flows in Zhangzhou Geothermal Field, Fujian Province, China. ACTA Geophys. Sin. 1990, 33, 702–711. [Google Scholar]
  7. Roy, R.F.; Blackwell, D.D.; Birch, F. Heat generation of plutonic rocks and continental heat flow provinces. Earth Planet. Sci. Lett. 1968, 5, 1–12. [Google Scholar] [CrossRef]
  8. Lachenbruch, A.H. Crustal temperature and heat production: Implications of the linear heat-flow relation. J. Geophys. Res. 1970, 75, 3291–3300. [Google Scholar] [CrossRef]
  9. Furlong, K.P.; Chapman, D.S. Heat Flow, Heat Generation, and the Thermal State of the Lithosphere. Annu. Rev. Earth Planet. Sci. 2013, 41, 385–410. [Google Scholar] [CrossRef]
  10. Qiu, N.S.; Hu, S.B.; He, L.J. Geothermics in Sedimentary Basins; China University of Petroleum Press: Beijing, China, 2019. [Google Scholar]
  11. Wang, G.L.; Liu, F.; Lin, W.J.; Zhang, W.; Yuan, R.; Xi, Y.F.; Wei, S.C.; Liao, Y.Z.; Wang, Y.R. The crustal heat production rate and crustal and mantle heat flow distribution in the land areas of China. Chin. J. Geophys. 2023, 66, 5041–5056. [Google Scholar]
  12. Qiu, N.S.; Tang, B.N.; Zhu, C.Q. Deep thermal background of hot spring distribution in the Chinese continent. Acta Geol. Sin. 2022, 96, 195–207. [Google Scholar]
  13. Liao, Y.Z.; Zhang, W.; Rong, Y.W.; Liu, F.; Wei, S.C.; Li, L.; Zhao, Z.R.; Li, M. A high geothermal setting in the Linyi geothermal field: Evidence from the lithospheric thermal structure. Energy Explor. Exploit. 2023, 41, 1899–1918. [Google Scholar] [CrossRef]
  14. Wei, S.C.; Liu, F.; Zhang, W.; Wang, G.L.; Yuan, R.X.; Liao, Y.Z. Research on the characteristics and influencing factors of terrestrial heat flow in Guizhou Province. J. Groundw. Sci. Eng. 2022, 10, 166–183. [Google Scholar]
  15. Hu, S.B.; He, L.J.; Wang, J.Y. Compilation of heat flow data in the China continental area(3rd edition). Chin. J. Geophys. 2001, 44, 611–626. [Google Scholar]
  16. Chen, M.X.; Xia, S.G.; Yang, S.Z. Local geothermal anomalies and their formation mechanisms on Leizhou peninsula, South China. Sci. Geol. Sin. 1991, 4, 369–383. [Google Scholar]
  17. Zhang, Q.; Wu, X.J.; Xie, S.S.; Han, Z.; Zhang, Z. The Application of Comprehensive Geophysical Methods to Exploration of Hot Dry Rock Resources in Lingshui Area of Hainan. Chin. J. Eng. Geophys. 2015, 12, 477–483. [Google Scholar]
  18. Yuan, X.B.; Fang, N.J.; Dong, H.L. Geochronology, Geochemistry and Tectonic Significance of Gaofeng and Baocheng Granite Batholiths in Hainan Island. Geoscience 2019, 33, 85–97. [Google Scholar]
  19. Yun, P.; Wu, Y.B.; Xie, S.Z. Origin of rock-forming minerals from some late Yanshanian granite bodies in Hainan island. Geol. Miner. Resour. South China 2004, 4, 1–8. [Google Scholar]
  20. Liu, Y.H.; Mao, J.W.; Qiu, K.F.; Hu, J.; Wang, L.; Xu, D.M. Extensional Setting of Hainan Island in Mesoproterozoic: Evidence from Granitic Intrusions in the Baoban Group. Acta Geol. Sin. (Engl. Ed.) 2022, 96, 1199–1212. [Google Scholar] [CrossRef]
  21. Zhang, F.F.; Wang, Y.J.; Chen, X.Y.; Fan, W.M.; Zhang, Y.H.; Zhang, G.W.; Zhang, A.M. Triassic high-strain shear zones in Hainan Island (South China) and their implications on the amalgamation of the Indochina and South China Blocks: Kinematic and 40Ar/39Ar geochronological constraints. Gondwana Res. 2011, 19, 910–925. [Google Scholar]
  22. Yu, J.H.; O’Reilly, S.Y.; Zhou, M.F.; Griffin, W.L.; Wang, L.J. U-Pb geochronology and Hf–Nd isotopic geochemistry of the Badu Complex, Southeastern China: Implications for the Precambrian crustal evolution and paleogeography of the Cathaysia Block. Precambrian Res. 2012, 222–223, 424–449. [Google Scholar] [CrossRef]
  23. DZ/T0080-2010; Specifications for Geophysical Logging of Coal. Ministry of Land and Resources of the People’s Republic of China: Beijing, China, 2010.
  24. He, L.J.; Hu, S.B.; Huang, S.P.; Yang, W.C.; Wang, J.Y.; Yuan, Y.S.; Yang, S.C. Heat flow study at the Chinese Continental Scientific Drilling site: Borehole temperature, thermal conductivity, and radiogenic heat production. J. Geophys. Res. Solid Earth 2008, 113, 113–129. [Google Scholar]
  25. Wang, J.; Wang, J.A.; Shen, J.Y.; Qiu, N.S. Heat Flow in Tarim Basin. Earth Sci.-J. China Univ. Geosci. 1995, 20, 399–403. [Google Scholar]
  26. Zhao, Y.X.; Yang, S.Z.; Zhang, W.R.; Lian, X.R.; Ma, L. An experimental study of rock thermal conductivity under different temperature and pressure. Prog. Geophys. 1995, 10, 104–113. [Google Scholar]
  27. Seipold, U. Temperature dependence of thermal transport properties of crystalline rocks—A general law. Tectonophysics 1998, 291, 161–171. [Google Scholar] [CrossRef]
  28. Song, J.J.; Wang, G.L.; Xing, L.X.; Lu, C.; Qian, J.Y. Influence of rock thermal conductivity correction on the calculated value of terrestrial heat flow—A case study of Jizhong Depression, Bohai Bay Basin. Geol. Rev. 2023, 69, 1349–1364. [Google Scholar]
  29. Pribnow, D.; Williams, C.F.; Sass, J.H.; Keating, R. Thermal conductivity of water-saturated rocks from the KTB Pilot Hole at temperatures of 25 to 300°C. Geophys. Res. Lett. 1996, 23, 391–394. [Google Scholar] [CrossRef]
  30. Vosteen, H.D.; Schellschmidt, R. Influence of temperature on thermal conductivity, thermal capacity and thermal diffusivity for different types of rock. Phys. Chem. Earth Parts A/B/C 2003, 28, 499–509. [Google Scholar] [CrossRef]
  31. Rybach, L. Radioactive heat production in rocks and its relation to other petrophysical parameters. Pure Appl. Geophys. 1976, 114, 309–317. [Google Scholar] [CrossRef]
  32. Rybach, L.; Buntebarth, G. The variation of heat generation, density and seismic velocity with rock type in the continental lithosphere. Tectonophysics 1984, 103, 335–344. [Google Scholar] [CrossRef]
  33. Xin, H.L.; Zhang, H.J.; Kang, M.; He, R.Z.; Gao, L.; Gao, J. High-Resolution Lithospheric Velocity Structure of Continental China by Double-Difference Seismic Travel-Time Tomography. Seismol. Res. Lett. 2019, 90, 229–241. [Google Scholar] [CrossRef]
  34. Uchida, Y.; Sakura, Y.; Taniguchi, M. Shallow subsurface thermal regimes in major plains in Japan with reference to recent surface warming. Phys. Chem. Earth Parts A/B/C 2003, 28, 457–466. [Google Scholar] [CrossRef]
  35. Huang, S.; Pollack, H.N.; Shen, P.Y. Temperature trends over the past five centuries reconstructed from borehole temperatures. Nature 2000, 403, 756–758. [Google Scholar] [CrossRef]
  36. Zhang, J.; Huang, S.P.; Zuo, Y.H.; Zhou, Y.S.; Liu, Z.; Duan, W.T.; Wei, X. Terrestrial heat flow in the baiyinchagan sag, erlian Basin, northern China. Geothermics 2020, 86, 101799. [Google Scholar] [CrossRef]
  37. Geological Team of Hainan. Hydrogeological Exploration Report of Hot Water Area New Village Baoting, Hainan Island; Guangdong Geological Bureau: Guangzhou, China, 1973. [Google Scholar]
  38. McLaren, S.; Sandiford, M.; Hand, M.; Neumann, N.; Wyborn, L.; Bastrakova, I. The hot southern continent: Heat flow and heat production in Australian Proterozoic terranes. In Evolution and Dynamics of the Australian Plate; Geological Society of America: Boulder, CO, USA, 2003. [Google Scholar]
  39. Zhang, L.; Hu, Y.L.; Qin, M.; Duan, Y.; Duan, Y.Z.; Peng, H.C.; Zhao, H. Study on crustal and lithosphere thicknesses of Tengchong volcanic area in Yunnan. Chin. J. Geophys. 2015, 58, 1622–1633. [Google Scholar]
  40. Fullea, J.; Muller, M.R.; Jones, A.G.; Afonso, J.C. The lithosphere–asthenosphere system beneath Ireland from integrated geophysical–petrological modeling II: 3D thermal and compositional structure. Lithos 2014, 189, 49–64. [Google Scholar] [CrossRef]
  41. Jaupart, C.; Mareschal, J.C. Heat flow and thermal structure of the lithosphere. In Treatise on Geophysics; Schubert, G., Ed.; Elsevier: New York, NY, USA, 2007; Volume 6, pp. 217–252. [Google Scholar]
  42. An, M.J.; Shi, Y.L. Review on lithospheric thickness research of the Chinese continent. Earth Sci. Front. 2006, 13, 23–30. [Google Scholar]
  43. Rudnick, R.L.; McDonough, W.F.; O’Connell, R.J. Thermal structure, thickness and composition of continental lithosphere. Chem. Geol. 1998, 145, 395–411. [Google Scholar] [CrossRef]
  44. Artemieva, I.M.; Mooney, W.D. Thermal thickness and evolution of Precambrian lithosphere: A global study. J. Geophys. Res. Solid Earth 2001, 106, 16387–16414. [Google Scholar] [CrossRef]
  45. Chapman, D.S.; Pollack, H.N. Regional geotherms and lithospheric thickness. Geology 1977, 5, 265. [Google Scholar] [CrossRef]
  46. Xiong, S.Q.; Yang, H.; Ding, Y.Y.; Li, Z.K. Characteristics of Chinese continent curie point isotherm. Chin. J. Geophys. 2016, 59, 643–657. [Google Scholar]
  47. Tang, X.Y.; Huang, S.P.; Zhang, G.C.; Yang, S.C.; Hu, S.B. Lithospheric thermal structure of the Pearl River Mouth Basin, northern South China Sea. Chin. J. Geophys. 2018, 61, 3749–3759. [Google Scholar]
Figure 2. Effect of groundwater convection on geothermal distribution.
Energies 17 04824 g002
Figure 3. Relationship between borehole temperature and depth in the studied area.
Energies 17 04824 g003
Figure 4. Geothermal and lithologic distribution of Nanping borehole ZK5 (a) and Qixianling borehole ZK11 (b).
Energies 17 04824 g004
Figure 5. Relationship between borehole thermal conductivity and porosity in the research area.
Energies 17 04824 g005
Figure 6. Thermal conductivity vertical distribution.
Energies 17 04824 g006
Figure 7. Th-U-K ternary diagram.
Energies 17 04824 g007
Figure 8. Conceptual model of lithospheric thermal structure in the research area.
Energies 17 04824 g008
Figure 9. Thermal lithospheric thickness in the research area.
Energies 17 04824 g009
Table 1. The distribution of core sampling in study area.
Drilling IDDrilling Depth (m)Groundwater Level
(m)
Sample IDLithologyDepth
(m)
Heat ConductivityHeat Generation Rate
1NPZK013003.9NPZK01-1Medium-weathered biotite monzogranite125
2NPZK1-Y10Diorite197-
3NPZK01-2Diorite211
4NPZK024003.6NPZK02-1Medium-weathered biotite monzogranite95
5NPZK2-Y10Diorite203.1-
6NPZK02-2Medium-weathered biotite monzogranite254
7NPZK02-3Diorite347
8NPZK034001.1NPZK03-1Medium-weathered biotite monzogranite127-
9NPZK03-2Medium-weathered biotite monzogranite246-
10NPZK03-3Medium-weathered biotite monzogranite344-
11NPZK03-Y12Diorite372.9-
12NPZK03-Y13Monzogranite392.7-
13NPZK046004.8NPZK04-1Biotite monzogranite129
14NPZK04-2Biotite monzogranite315
15NPZK04-3Biotite monzogranite462
16NPZK04-4Biotite monzogranite585
17NPZK057003NPZK05-1Biotite monzogranite114
18NPZK05-2Biotite monzogranite224.5
19NPZK05-3Diorite300
20NPZK05-4Biotite monzogranite416
21NPZK05-5Biotite monzogranite500
22NPZK05-6Biotite monzogranite605
23NPZK05-7Biotite monzogranite690
24NPZK05-Y13Diorite699.5-
Table 2. Heat conductivity and heat-generation rate of rocks in the study area.
PorosityHeat ConductivityCorrected Heat ConductivityDensityUThKHeat Generation Rate
(%)(W/mK)(W/m)(g/cm3)ppmppm%μW/m3
1NPZK01-13.371.4891.472.684.9216.53.062.67
2NPZK01-21.411.2421.272.781.012.382.150.64
3NPZK1-Y102.122.6412.44-----
4NPZK02-12.961.5171.512.724.4913.63.262.42
5NPZK02-22.961.7331.712.575.5614.23.62.62
6NPZK02-32.851.5021.492.631.162.22.610.68
7NPZK2-Y102.142.8072.72
8NPZK03-17.041.6241.592.664.5818.53.512.74
9NPZK03-28.611.791.732.654.1213.83.452.29
10NPZK03-35.992.2612.142.6210.5232.934.43
11NPZK03-Y121.782.3072.18-----
12NPZK03-Y132.183.2813.04-----
13NPZK04-12.973.5173.172.655.24222.973.09
14NPZK04-23.352.7382.522.626.3420.63.073.24
15NPZK04-31.853.6053.262.594.3316.54.32.55
16NPZK04-42.972.6692.442.644.621.15.783.11
17NPZK05-11.863.1352.932.676.630.63.234.07
18NPZK05-22.893.2152.992.556.2625.23.523.48
19NPZK05-31.822.9832.792.731.65.851.590.98
20NPZK05-42.232.9472.762.565.1617.63.362.71
21NPZK05-51.872.652.492.693.3915.53.222.24
22NPZK05-62.222.4232.292.656.2930.93.694.02
23NPZK05-71.864.0713.752.595.4422.23.553.13
24NPZK05-Y132.111.91.83-----
Table 3. Heat produced by the decay of radioactive elements of different depths in the research area.
Depth (km)VpA
04.77130.798
55.4634.625
105.9211.318
156.3850.369
206.7080.153
307.1010.052
407.2550.034
607.7870.008
807.9280.005
1007.7470.009
1207.7370.009
1507.7790.008
Table 4. Heat flux of geothermal well in the study area.
LocationIDMeasuring
Section
(m)
Temperature Range
(°C)
Vz
(m/s)
K
W/(m·K)
Q
(mW/m2)
NanpingZK10–12130.6–83.69.56 × 10−82.7289
ZK567–63447.86–67.064.2 × 10−82.7292.9
QixianlingZK1119–16034–44.25.8 × 10−81.9996.2399.23
160–46470.5–95.61.3 × 10−81.9996.61
464–53295.6–99.3 1.99108.27
Table 5. Stratified structure and thermophysical properties of lithosphere in Nanping geothermal field.
Heat Flux
(mW/m2)
Lithology
(km)
Heat Conductivity
(W/m·K)
73.17Baocheng granite body0–82.72
Metamorphic batholith8–112.9
Upper crust11–142.9
Middle crust14–202.3
Lower crust20–342.5
Mantle>342.5
Disclaimer/Publisher’s Note: The statements, opinions and data contained in all publications are solely those of the individual author(s) and contributor(s) and not of MDPI and/or the editor(s). MDPI and/or the editor(s) disclaim responsibility for any injury to people or property resulting from any ideas, methods, instructions or products referred to in the content.

