
Inclusive Growth, Energy Poverty and Digital and Social Development: Cross-Country Analysis of the European Union


Abstract
1. Introduction
2. Literature Background
2.1. Inclusive Growth
2.2. Energy Poverty
2.3. Digital and Social Economy
2.4. Sustainable Development Goals
2.5. Renewable Energy
3. Material and Methods
- Y—inclusive growth,
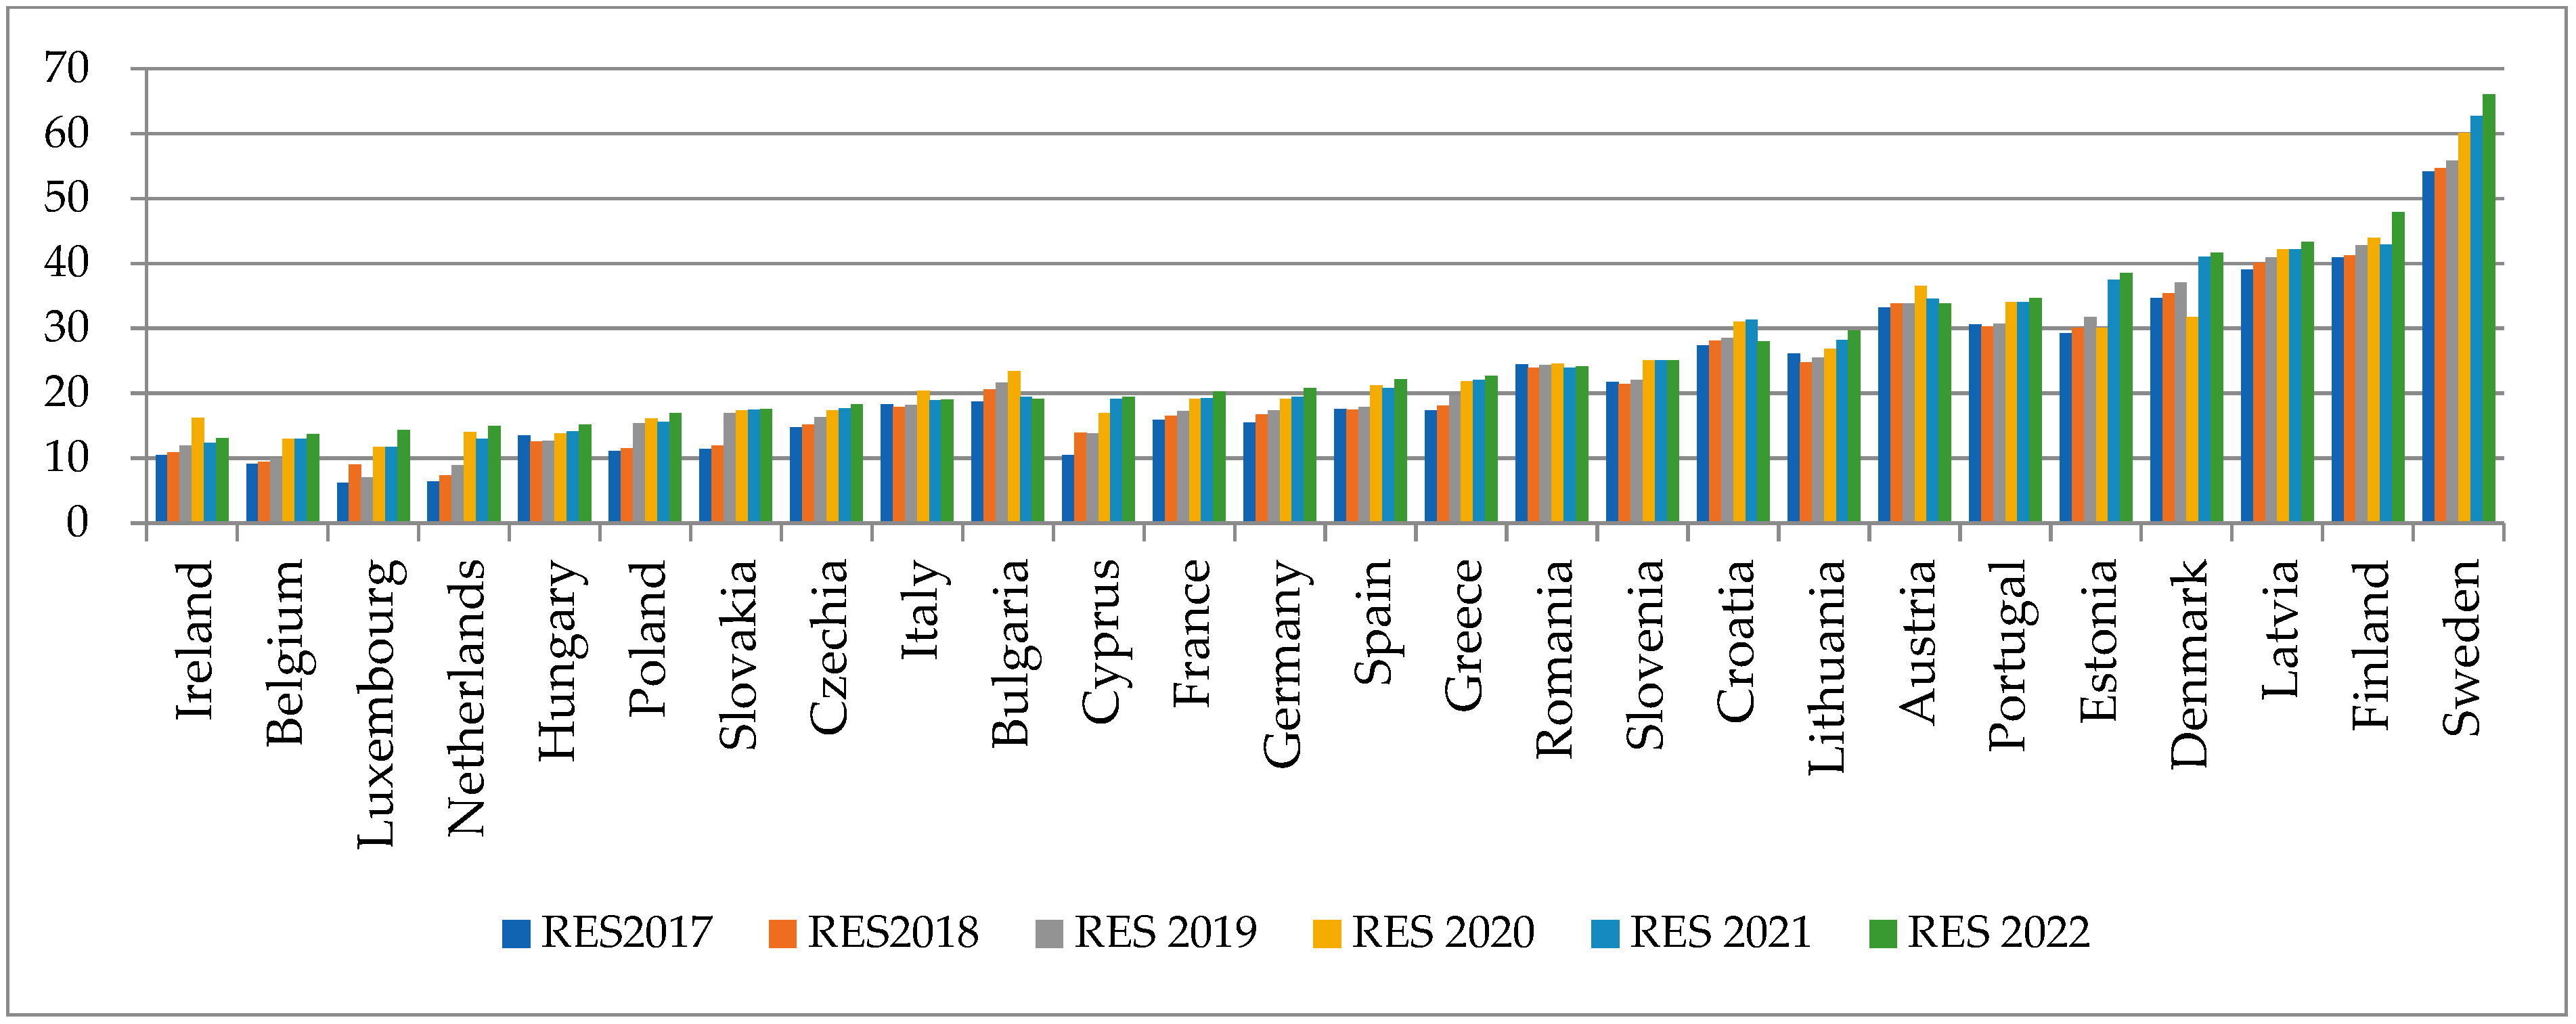
- X1—the share of the energy from renewable sources,
- X2—(energy poverty) arrears on utility bills (% of population),
- X3—(energy poverty) expenditure of households on energy (housing, water, electricity, gas, fuels),
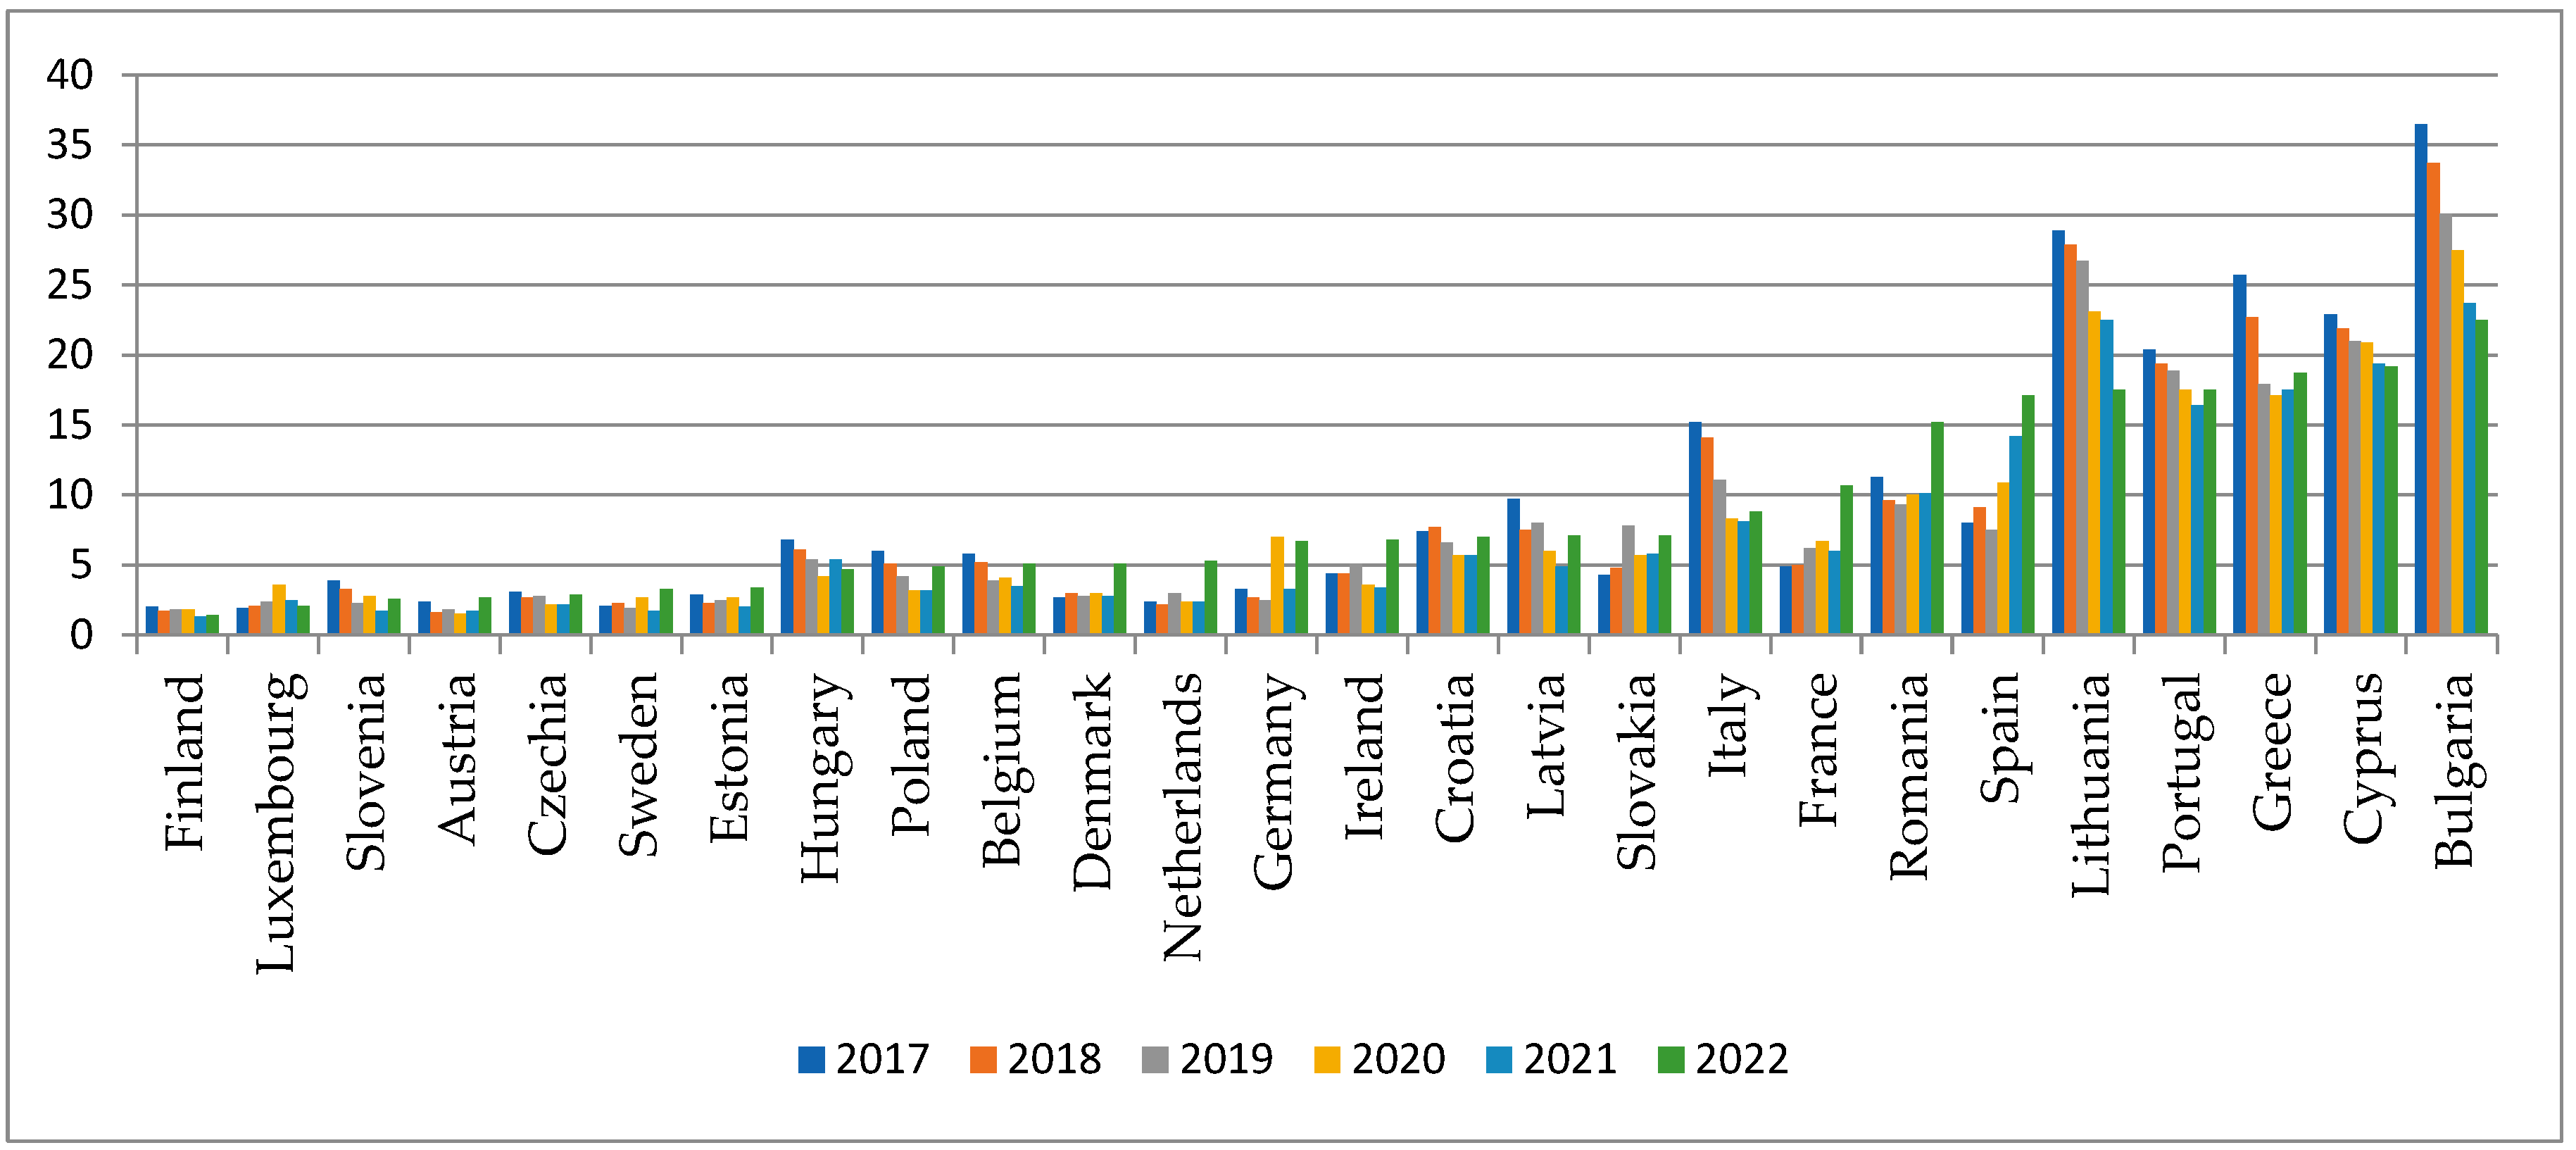
- X4—(energy poverty) inability to keep home adequately warm (% od population),
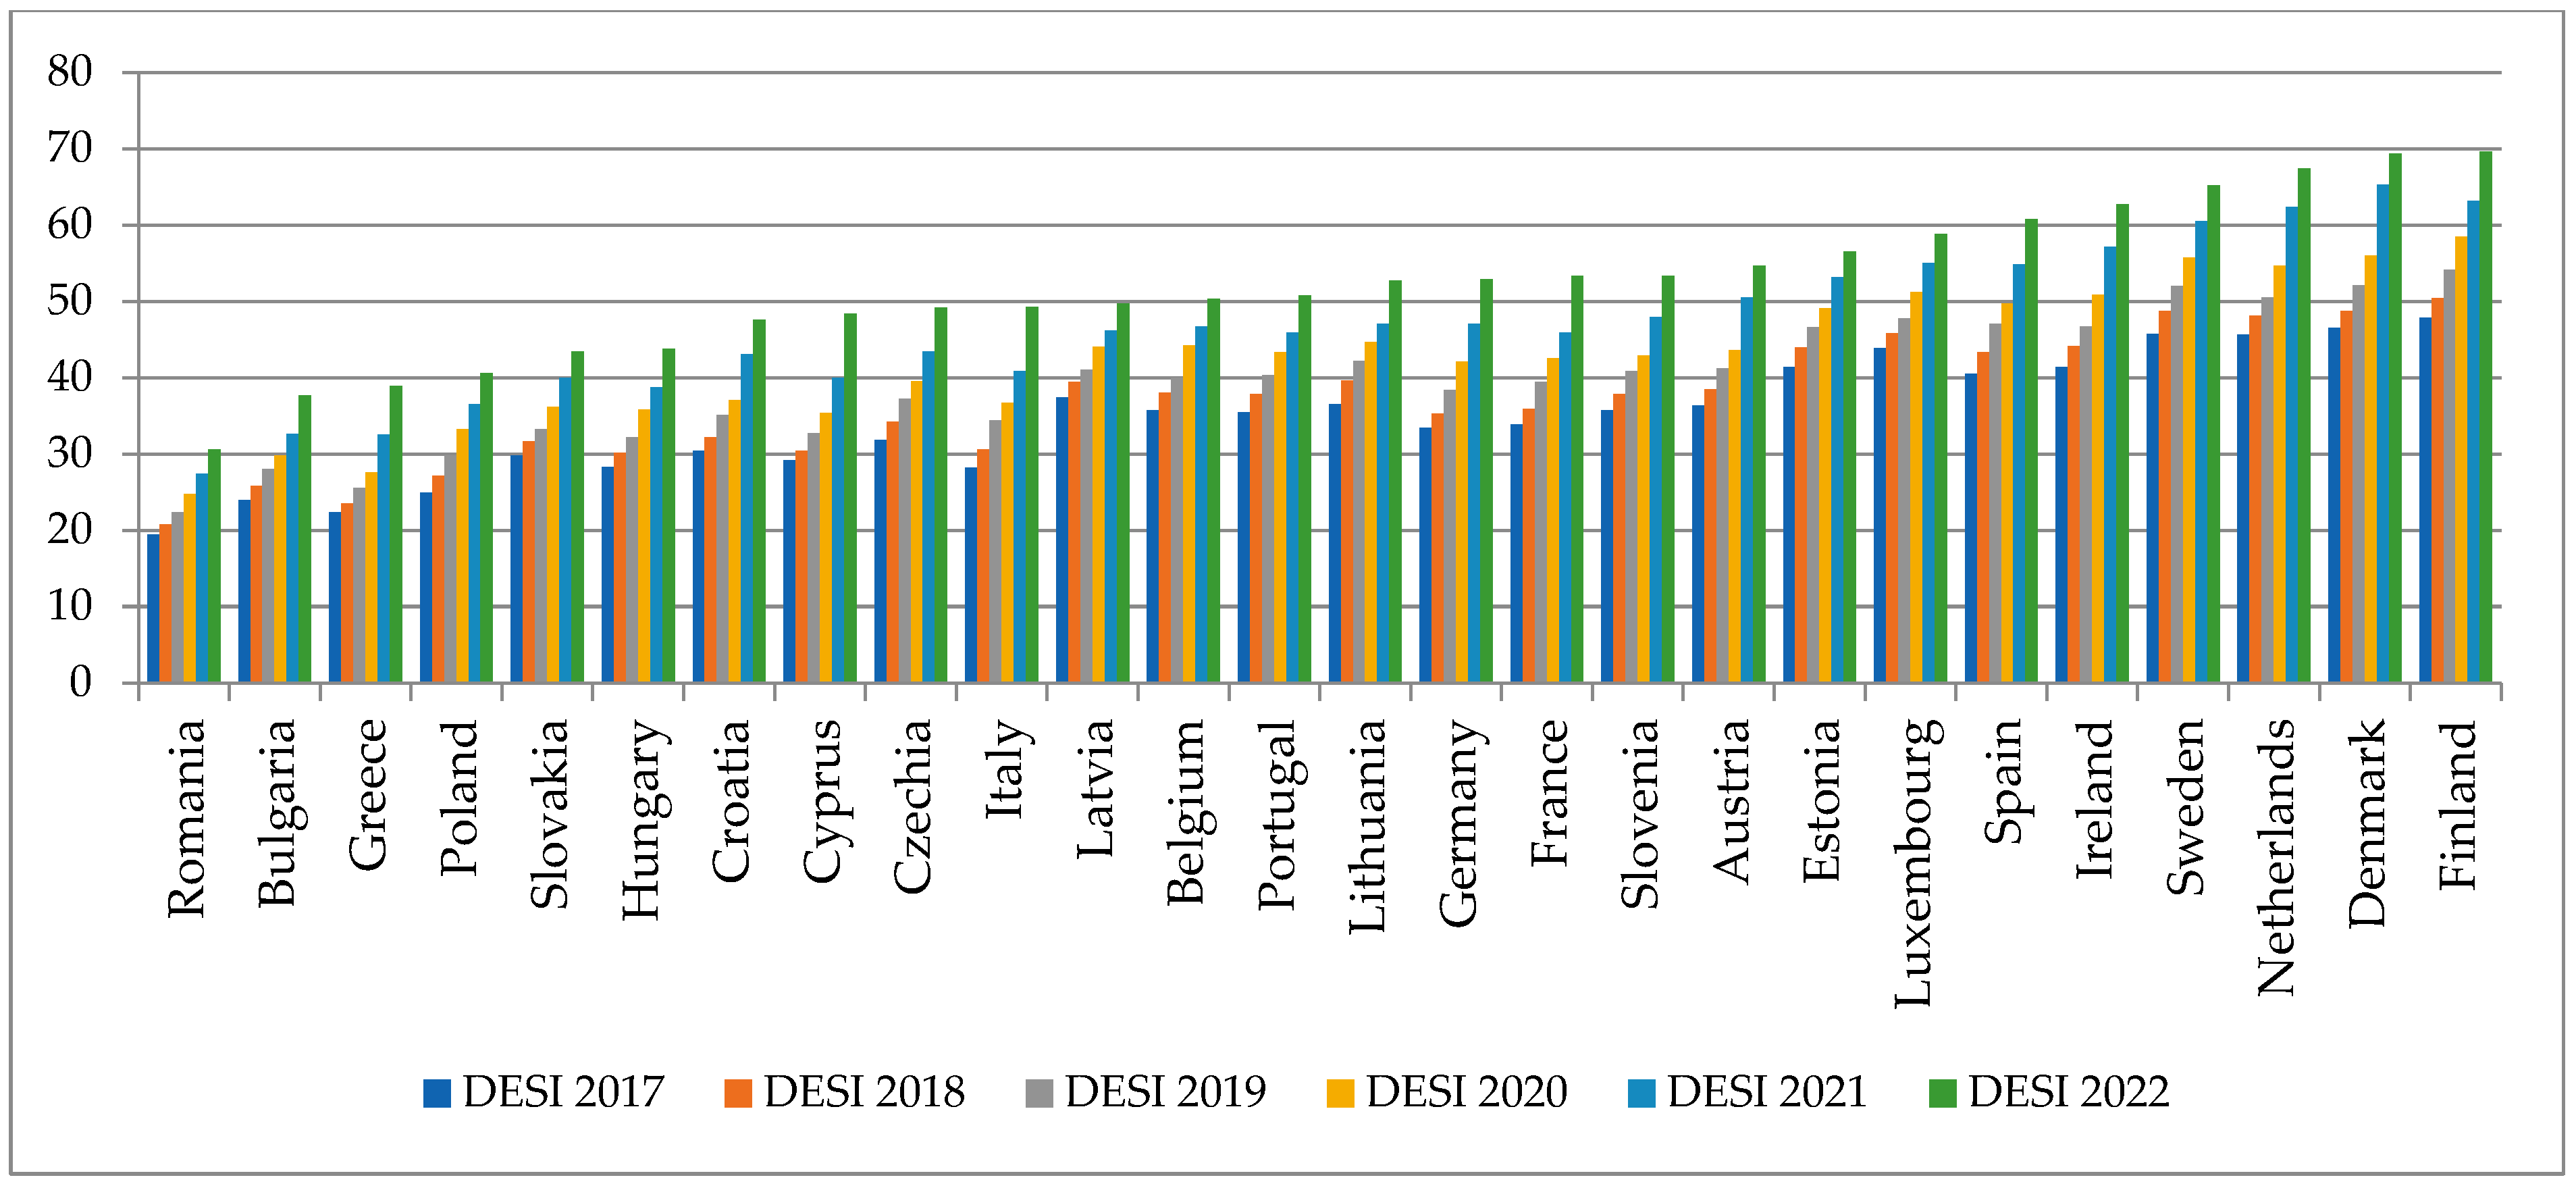
- X5—social and digital development DESI (Digital Economy and Society Index).
4. Data Analysis and Modeling
5. Conclusions, Limitations and Discussion
6. Summary
Author Contributions
Funding
Data Availability Statement
Conflicts of Interest
References
- Rusu, R.; Oprean-Stan, C. The impact of digitalisation and sustainability on inclusiveness: Inclusive growth determinants. Econ. Comput. Econ. Cybern. Stud. Res. 2023, 57, 209–224. [Google Scholar]
- Koukoufikis, G.; Schockaert, H.; Paci, D.; Filippidou, F.; Caramizaru, A.; Della Valle, N.; Uihlein, A. Energy Communities and Energy Poverty; JRC134832; Publications Office of the European Union: Luxembourg, 2023. [Google Scholar]
- Aras, M. The Concept of Energy Communities as per the Clean Energy for All Europeans Package: Contribution to the Energy Transition in France. In The Palgrave Handbook of Zero Carbon Energy Systems and Energy Transitions; Springer International Publishing: Cham, Switzerland, 2022; pp. 1–23. [Google Scholar]
- Renewable Energy Statistics. Available online: https://ec.europa.eu/eurostat/statistics-explained/index.php?title=Renewable_energy_statistics (accessed on 30 July 2024).
- Zioło, M.; Bąk, I.; Spoz, A. Sustainable Energy Sources and Financial Development Nexus-Perspective of European Union Countries in 2013–2021. Energies 2024, 17, 3332. [Google Scholar] [CrossRef]
- Khanchaoui, I.; El Moudden, A.; El Aboudi, S. Empirical investigation on the impact of public expenditures on inclusive economic growth in Morocco: Application of the autoregressive distributed lag approach. Int. J. Adv. Comput. Sci. Appl. 2020, 11, 171–177. [Google Scholar] [CrossRef]
- Kwilinski, A.; Lyulyov, O.; Pimonenko, T. Inclusive economic growth: Relationship between energy and governance efficiency. Energies 2023, 16, 2511. [Google Scholar] [CrossRef]
- Ghouse, G.; Aslam, A.; Bhatti, M.I. The Impact of Environment, Digital-Social Inclusion, and Institutions on Inclusive Growth: A Conceptual and Empirical Analysis. Energies 2022, 15, 7098. [Google Scholar] [CrossRef]
- Corrado, G.; Corrado, L. Inclusive finance for inclusive growth and development. Curr. Opin. Environ. Sustain. 2017, 24, 19–23. [Google Scholar] [CrossRef]
- De Haan, A. Inclusive growth: Beyond safety nets? Eur. J. Dev. Res. 2015, 27, 606–622. [Google Scholar] [CrossRef]
- Gupta, J.; Pouw, N.R.; Ros-Tonen, M.A. Towards an elaborated theory of inclusive development. Eur. J. Dev. Res. 2015, 27, 541–559. [Google Scholar] [CrossRef]
- Ali, I.; Son, H.H. Measuring Inclusive Growth. Asian Dev. Rev. 2007, 24, 11–31. [Google Scholar] [CrossRef]
- Klasen, S. Measuring and monitoring inclusive growth in developing and advanced economies: Multiple definitions, open questions and some constructive proposals. In Reframing Global Social Policy; Reframing Global Social Policy; Policy Press: Bristol, UK, 2017; pp. 123–144. [Google Scholar] [CrossRef]
- Ofori, I.K.; Freytag, A.; Asongu, S.A. Economic globalisation and Africa’s quest for greener and more inclusive growth: The missing link. Int. Econ. 2024, 178, 100509. [Google Scholar] [CrossRef]
- Boarini, R.; Murtin, F.; Schreyer, P. Inclusive Growth: The OECD Measurement Framework. 2015. Available online: https://www.oecd-ilibrary.org/economics/inclusive-growth_5jrqppxjqhg4-en (accessed on 30 July 2024).
- Dantas, T.E.; De-Souza, E.; Destro, I.; Hammes, G.; Rodriguez, C.; Soares, S. How the combination of Circular Economy and Industry 4.0 can contribute towards achieving the Sustainable Development Goals. Sustain. Prod. Consum. 2021, 26, 213–227. [Google Scholar] [CrossRef]
- Kjøller-Hansen, A.O.; Lindbjerg Sperling, L. Measuring inclusive growth experiences: Five criteria for productive employment. Rev. Dev. Econ. 2020, 24, 1413–1429. [Google Scholar] [CrossRef]
- Awan, A.; Abbasi, K.R.; Rej, S.; Bandyopadhyay, A.; Lv, K. The impact of renewable energy, internet use and foreign direct investment on carbon dioxide emissions: A method of moments quantile analysis. Renew. Energy 2022, 189, 454–466. [Google Scholar] [CrossRef]
- Ranieri, R.; Almeida Ramos, R. Inclusive Growth: Building up a Concept; Working Paper No. 104; International Policy Centre for Inclusive Growth (IPC-IG): Brasilia, Brazil, 2013. [Google Scholar]
- Belk, R.W.; Eckhardt, G.M.; Bardhi, F. (Eds.) Handbook of the Sharing Economy; Edward Elgar Publishing: Cheltenham, UK, 2019. [Google Scholar]
- Achrol, R.S.; Kotler, P. Marketing in the network economy. J. Mark. 1999, 63, 146–163. [Google Scholar] [CrossRef]
- McLaren, D.; Bullock, S.; Yousuf, N. Tomorrow’s World: Britain’s Share in a Sustainable Future; Routledge: London, UK, 2013; Volume 15. [Google Scholar]
- Siksnelyte-Butkiene, I.; Streimikiene, D.; Lekavicius, V.; Balezentis, T. Energy poverty indicators: A systematic literature review and comprehensive analysis of integrity. Sustain. Cities Soc. 2021, 67, 102756. [Google Scholar] [CrossRef]
- Bouzarovski, S.; Petrova, S. A global perspective on domestic energy deprivation: Overcoming the energy poverty-fuel poverty binary. Energy Res. Soc. Sci. 2015, 10, 31–40. [Google Scholar] [CrossRef]
- Streimikiene, D.; Kyriakopoulos, G.L.; Lekavicius, V.; Siksnelyte-Butkiene, I. Energy poverty and low carbon just energy transition: Comparative study in Lithuania and Greece. Soc. Indic. Res. 2021, 158, 319–371. [Google Scholar] [CrossRef]
- Streimikiene, D. Energy poverty and impact of COVID-19 pandemics in Visegrad (V4) countries. J. Int. Stud. 2022, 15, 9–25. [Google Scholar] [CrossRef]
- Dogan, B.; Trabelsi, N.; Khalfaoui, R.; Ghosh, S.; Shahzad, U. Role of ethnic diversity, temperature changes, and socio-economic conditions for residential energy use and energy expenditures: Evidence from the United States. Energy Build. 2022, 276, 112529. [Google Scholar] [CrossRef]
- Tran, L.N.; Cai, G.; Gao, W. Determinants and approaches of household energy consumption: A review. Energy Rep. 2023, 10, 1833–1850. [Google Scholar] [CrossRef]
- Tete, K.H.S.; Soro, Y.M.; Coulibaly, S.F.A.; Jones, R.V.; Sidibé, S.D.S. Terminants of urban residential electricity consumption in Burkina Faso: A study of dwelling, household, socio-economic and appliance-related factors. Buildings 2024, 14, 683. [Google Scholar] [CrossRef]
- Najeeb, A.; Sridharan, S.; Rao, A.B.; Agnihotri, S.B.; Mishra, V. Determinants of residential electricity consumption in South, East and South East Asia: A systematic review. Renew. Sustain. Energy Rev. 2024, 198, 114400. [Google Scholar] [CrossRef]
- Abubakar, I.R.; Alola, A.A.; Bekun, F.V.; Onifade, S.T. Investigating the determinants of household energy consumption in Nigeria: Insights and implications. Energy Sustain. Soc. 2024, 14, 29. [Google Scholar] [CrossRef]
- Imran, M.; Liu, X.; Wang, R.; Saud, S.; Zhao, Y.; Khan, M.J. The influence of digital economy and society index on sustainable development indicators: The case of European union. Sustainability 2022, 14, 11130. [Google Scholar] [CrossRef]
- Jiao, S.; Sun, Q. Digital economic development and its impact on econimic growth in China: Research based on the prespective of sustainability. Sustainability 2021, 13, 10245. [Google Scholar] [CrossRef]
- Ahmed, E.M. Modelling Information and Communications Technology Cyber Security Externalities Spillover Effects on Sustainable Economic Growth. J. Knowl. Econ. 2021, 12, 412–430. [Google Scholar] [CrossRef]
- Corejova, T.; Chinoracky, R. Assessing the potential for digital transformation. Sustainability 2021, 13, 11040. [Google Scholar] [CrossRef]
- Pradhan, R.P.; Arvin, M.B.; Nair, M.; Bennett, S.E.; Bahmani, S. Some determinants and mechanics of economic growth in middle-income countries: The role of ICT infrastructure development, taxation and other macroeconomic variables. Singap. Econ. Rev. 2024, 69, 297–333. [Google Scholar] [CrossRef]
- Verbrugge, B.; Gillis, D. Public procurement and human rights. Opportunities, obstacles, and policy pathways. In Public Procurement and Human Rights-Opportunities, Obstacles, and Policy Pathways; KU Leuven HIVA—Research Institute for Work and Society: Leuven, Belgium, 2022. [Google Scholar]
- Martín, M.I.M.; Rodríguez, N.G.; Sánchez, R.S. La Economía Social en el emprendimiento de base tecnológica en España. Un análisis cualitativo. CIRIEC-España Rev. de Econ. Pública Soc. y Coop. 2019, 96, 65–90. [Google Scholar] [CrossRef]
- Zuo, S.; Zhao, Y.; Zheng, L.; Zhao, Z.; Fan, S.; Wang, J. Assessing the influence of the digital economy on carbon emissions: Evidence at the global level. Sci. Total Environ. 2024, 946, 174242. [Google Scholar] [CrossRef]
- Dong, K.; Liu, Y.; Wang, J.; Dong, X. Is the digital economy an effective tool for decreasing energy vulnerability? A global case. Ecol. Econ. 2024, 216, 108028. [Google Scholar] [CrossRef]
- Wang, Y.; Wang, Y.; Shahbaz, M. How does digital economy affect energy poverty? Analysis from the global perspective. Energy 2023, 282, 128692. [Google Scholar] [CrossRef]
- Lyu, Y.; Wu, Y.; Wu, G.; Wang, W.; Zhang, J. Digitalization and energy: How could digital economy eliminate energy poverty in China? Environ. Impact Assess. Rev. 2023, 103, 107243. [Google Scholar] [CrossRef]
- Sun, L.; Cui, W.; Li, Y.; Luo, Y. Understanding the energy poverty in China: Chronic measurement and the effect of the digital economy. Environ. Dev. Sustain. 2024, 1–32. [Google Scholar] [CrossRef]
- United Nations. Transforming Our World: The 2030 Agenda for Sustainable Development. 2015. Issue 1. Available online: https://sustainabledevelopment.un.org/content/documents/7891Transforming2020World.pdf (accessed on 15 August 2024).
- Zhou, X.; Moinuddin, M.; Renaud, F.; Barrett, B.; Xu, J.; Liang, Q.; Zhao, J.; Xia, X.; Bosher, L.; Huang, S.; et al. Development of an SDG interlinkages analysis model at the river basin scale: A case study in the Luanhe River Basin, China. Sustain. Sci. 2022, 17, 1405–1433. [Google Scholar] [CrossRef]
- Motta, R.D.P.S.D. The sustainable development goals and 1.5 °C climate change. World Rev. Sci. Technol. Sustain. Dev. 2019, 15, 123–144. [Google Scholar] [CrossRef]
- Pham-Truffert, M.; Metz, F.; Fischer, M.; Rueff, H.; Messerli, P. Interactions among Sustainable Development Goals: Knowledge for identifying multipliers and virtuous cycles. Sustain. Dev. 2020, 28, 1236–1250. [Google Scholar] [CrossRef]
- Kroll, C.; Warchold, A.; Pradhan, P. Sustainable Development Goals (SDGs): Are we successful in turning trade-offs into synergies? Palgrave Commun. 2019, 5, 140. [Google Scholar] [CrossRef]
- Lusseau, D.; Mancini, F. Income-based variation in Sustainable Development Goal interaction networks. Nat. Sustain. 2019, 2, 242–247. [Google Scholar] [CrossRef]
- Wang, Y.L. Research on the relationship between green energy use, carbon emissions and economic growth in Henan province. Front. Energy Res. 2021, 9, 701551. [Google Scholar] [CrossRef]
- Cui, L.; Weng, S.; Song, M. Financial inclusion, renewable energy consumption, and inclusive growth: Cross-country evidence. Energy Effic. 2022, 15, 43. [Google Scholar] [CrossRef] [PubMed]
- Zhe, L.; Yüksel, S.; Dinçer, H.; Mukhtarov, S.; Azizov, M. The positive influences of renewable energy consumption on financial development and economic growth. Sage Open 2021, 11, 21582440211040133. [Google Scholar] [CrossRef]
- Fankhauser, S.; Jotzo, F. Economic growth and development with low-carbon energy. Wiley Interdiscip. Rev. Clim. Chang. 2018, 9, e495. [Google Scholar] [CrossRef]
- Ofori, I.K.; Gbolonyo, E.Y.; Ojong, N. Towards Inclusive Green Growth in Africa: Critical energy efficiency synergies and governance thresholds. J. Clean. Prod. 2022, 369, 132917. [Google Scholar] [CrossRef]
- Razzaq, A.; Sharif, A.; Ozturk, I.; Skare, M. Asymmetric influence of digital finance, and renewable energy technology innovation on green growth in China. Renew. Energy 2023, 202, 310–319. [Google Scholar] [CrossRef]
- Koengkan, M.; Fuinhas, J.A.; Silva, N. Exploring the capacity of renewable energy consumption to reduce outdoor air pollution death rate in Latin America and the Caribbean region. Environ. Sci. Pollut. Res. 2021, 28, 1656–1674. [Google Scholar] [CrossRef] [PubMed]
- Eurostat. Available online: https://ec.europa.eu/eurostat/EU-SILCsurvey (accessed on 30 July 2024).
- Digital Economy and Society Index. Available online: https://digital-decade-desi.digital-strategy.ec.europa.eu/datasets/desi-2022/metadata (accessed on 30 July 2024).
- European Environment Agency Dataset. Available online: https://www.eea.europa.eu/ (accessed on 30 July 2024).
- United Nations Trade and Development Dataset. Available online: https://unctad.org/ (accessed on 30 July 2024).
- World Bank Dataset. Available online: https://databank.worldbank.org/ (accessed on 30 July 2024).
- Inclusive Growth Dataset. Available online: https://unctadstat.unctad.org/datacentre/reportInfo/US.InclusiveGrowth (accessed on 30 July 2024).
- Kouton, J. The impact of renewable energy consumption on inclusive growth: Panel data analysis in 44 African countries. Econ. Chang. Restruct. 2021, 54, 145–170. [Google Scholar] [CrossRef]
- Xu, H.; Ahmad, M.; Aziz, A.L.; Uddin, I.; Aljuaid, M.; Gu, X. The linkages between energy efficiency, renewable electricity, human capital and inclusive growth: The role of technological development. Energy Strategy Rev. 2024, 53, 101414. [Google Scholar] [CrossRef]
- Available online: https://www.un.org/sustainabledevelopment/economic-growth/ (accessed on 30 July 2024).
- Wu, H.; Hao, Y.; Ren, S.; Yang, X.; Xie, G. Does internet development improve green total factor energy efficiency? Evid. China. Energy Policy 2021, 153, 112247. [Google Scholar] [CrossRef]
- Stan, S.E.; Oprean-Stan, C.; Țîțu, A.M. Digitalization-Sustainable Development Convergence: Metrics and Effects in Romania. Manag. Sustain. Dev. 2020, 12, 10–16. [Google Scholar] [CrossRef]
- Ayyoub, M.; Wörz, J. Inflation-growth nexus in developing economies: New empirical evidence from a disaggregated approach. Int. J. Financ. Econ. 2021, 26, 241–257. [Google Scholar] [CrossRef]
- Xie, F.; Liu, Y.; Guan, F.; Wang, N. How to coordinate the relationship between renewable energy consumption and green economic development: From the perspective of technological advancement. Environ. Sci. Eur. 2020, 32, 71. [Google Scholar] [CrossRef]
- Hay, C.; Hunt, T.; McGregor, J.A. Inclusive growth: The challenges of multidimensionality and multilateralism. Camb. Rev. Int. Aff. 2022, 35, 888–914. [Google Scholar] [CrossRef]


| Pilar 1. Economy | GDP National income Power consumption Employment Trade |
| Pillar 2. Living condition | Social and health conditions Logistics and finance |
| Pillar 3. Equality | Labour participation Income inequality School enrolment Political participation Gender socio-reproduction |
| Pillar 4. Environment | Natural capital protection (water, land, gas emissions) Energy intensity |
| Pilar 1. Human capital | Internet user skills Advanced skills and development |
| Pillar 2. Connectivity | Fixed broadband take-up Fixed broadband coverage Mobile broadband Broadband prices |
| Pillar 3. Integration of digital technology | Digital intensity Digital technologies for businesses e-Commerce |
| Pillar 4. Digital public services | e-Government |
| Austria | ||||||||
| Mean | St. Dev. | RES | bills | exp | inability | DESI | inclusive growth | |
| RES | 34.26 | 1.207 | 1.000000 | 0.049917 | 0.744941 | −0.598384 | 0.193288 | −0.826708 |
| bills | 2.75 | 0.497 | 0.049917 | 1.000000 | −0.103526 | 0.311300 | −0.428128 | −0.495560 |
| exp | 23.70 | 1.594 | 0.744941 | −0.103526 | 1.000000 | −0.230393 | 0.688175 | −0.623750 |
| inability | 1.95 | 0.485 | −0.598384 | 0.311300 | −0.230393 | 1.000000 | 0.317643 | 0.476389 |
| DESI | 44.14 | 7.120 | 0.193288 | −0.428128 | 0.688175 | 0.317643 | 1.000000 | 0.099364 |
| inclusive growth | 37,158.33 | 1029.280 | −0.826708 | −0.495560 | −0.623750 | 0.476389 | 0.099364 | 1.000000 |
| R = 0.82670836 R2 = 0.68344671 Adjusted R2 = 0.60430839 F(1,4) = 8.6361 p < 0.04244 | ||||||||
| Coefficients | St. Dev. | p-Statistic | p-Value | |||||
| constant | 61,316.40 | 8224.844 | 7.45502 | 0.001730 | ||||
| RES | −0.826708 | 0.281315 | −705.07 | 239.924 | −2.93872 | 0.042443 | ||
| Belgium | ||||||||
| Mean | St. Dev. | RES | bills | exp | inability | DESI | inclusive growth | |
| RES | 11.38 | 2.088 | 1.000000 | −0.844535 | 0.978255 | −0.455743 | 0.962454 | 0.246234 |
| bills | 3.77 | 0.606 | −0.844535 | 1.000000 | −0.795304 | 0.465286 | −0.856396 | −0.481000 |
| exp | 24.62 | 0.900 | 0.978255 | −0.795304 | 1.000000 | −0.377725 | 0.895021 | 0.086796 |
| inability | 4.60 | 0.894 | −0.455743 | 0.465286 | −0.377725 | 1.000000 | −0.429723 | −0.063433 |
| DESI | 42.50 | 5.546 | 0.962454 | −0.856396 | 0.895021 | −0.429723 | 1.000000 | 0.491095 |
| inclusive growth | 35,671.67 | 1046.946 | 0.246234 | −0.481000 | 0.086796 | −0.063433 | 0.491095 | 1.000000 |
| Bulgaria | ||||||||
| Mean | St. Dev. | RES | bills | exp | inability | DESI | inclusive growth | |
| RES | 20.451 | 1.7514 | 1.000000 | −0.019674 | 0.694824 | −0.030187 | −0.128359 | −0.313725 |
| bills | 24.833 | 5.4724 | −0.019674 | 1.000000 | 0.630625 | 0.979382 | −0.928941 | −0.797745 |
| exp | 19.450 | 0.6091 | 0.694824 | 0.630625 | 1.000000 | 0.638713 | −0.789255 | −0.874357 |
| inability | 29.000 | 5.5162 | −0.030187 | 0.979382 | 0.638713 | 1.000000 | −0.956339 | −0.862333 |
| DESI | 29.648 | 4.9801 | −0.128359 | −0.928941 | −0.789255 | −0.956339 | 1.000000 | 0.957242 |
| inclusive growth | 6685.000 | 563.8706 | −0.313725 | −0.797745 | −0.874357 | −0.862333 | 0.957242 | 1.000000 |
| R = 0.95724208 R2 = 0.91631240 Adjusted R2 = 0.89539050 F(1,4) = 43.797 p < 0.00270 | ||||||||
| Coefficients | St. Dev. | p-Statistic | p-Value | |||||
| constant | 3471.663 | 491.2264 | 7.067339 | 0.002115 | ||||
| DESI | 0.957242 | 0.144644 | 108.383 | 16.3772 | 6.617916 | 0.002703 | ||
| Croatia | ||||||||
| Mean | St. Dev. | RES | bills | exp | inability | DESI | inclusive growth | |
| RES | 29.00 | 1.711 | 1.000000 | −0.618872 | 0.542210 | −0.929518 | 0.346111 | −0.022985 |
| bills | 16.10 | 2.731 | −0.618872 | 1.000000 | −0.088178 | 0.681305 | −0.656223 | −0.423515 |
| exp | 16.77 | 1.520 | 0.542210 | −0.088178 | 1.000000 | −0.460236 | −0.413635 | −0.777101 |
| inability | 6.68 | 0.847 | −0.929518 | 0.681305 | −0.460236 | 1.000000 | −0.434785 | −0.072204 |
| DESI | 37.53 | 6.595 | 0.346111 | −0.656223 | −0.413635 | −0.434785 | 1.000000 | 0.893816 |
| inclusive growth | 12,848.33 | 1154.754 | −0.022985 | −0.423515 | −0.777101 | −0.072204 | 0.893816 | 1.000000 |
| R = 0.89381647 R2 = 0.79890788 Adjusted R2 = 0.74863485 F(1,4) = 15.891 p < 0.01631 | ||||||||
| Coefficients | St. Dev. | p-Statistic | p-Value | |||||
| constant | 6973.804 | 1492.477 | 4.672638 | 0.009500 | ||||
| DESI | 0.893816 | 0.224216 | 156.510 | 39.261 | 3.986400 | 0.016314 | ||
| Cyprus | ||||||||
| Mean | St. Dev. | RES | bills | exp | inability | DESI | inclusive growth | |
| RES | 15.59 | 3.480 | 1.000000 | −0.940426 | 0.792064 | −0.959948 | 0.886011 | 0.833220 |
| bills | 10.45 | 2.123 | −0.940426 | 1.000000 | −0.787302 | 0.943291 | −0.858867 | −0.815410 |
| exp | 16.20 | 1.631 | 0.792064 | −0.787302 | 1.000000 | −0.661916 | 0.577248 | 0.369507 |
| inability | 20.88 | 1.425 | −0.959948 | 0.943291 | −0.661916 | 1.000000 | −0.910905 | −0.936586 |
| DESI | 35.99 | 7.181 | 0.886011 | −0.858867 | 0.577248 | −0.910905 | 1.000000 | 0.907836 |
| inclusive growth | 25,305.00 | 1495.069 | 0.833220 | −0.815410 | 0.369507 | −0.936586 | 0.907836 | 1.000000 |
| R = 0.83322016 R2 = 0.69425583 Adjusted R2 = 0.61781979 F(1,4) = 9.0828 p < 0.03940 | ||||||||
| Coefficients | St. Dev. | p-Statistic | p-Value | |||||
| constant | 19,722.71 | 1890.302 | 10.43363 | 0.000477 | ||||
| RES | 0.833220 | 0.276471 | 358.01 | 118.790 | 3.01377 | 0.039404 | ||
| Czechia | ||||||||
| Mean | St. Dev. | RES | bills | exp | inability | DESI | inclusive growth | |
| RES | 16.56 | 1.3938 | 1.000000 | −0.675901 | 0.454088 | −0.514732 | 0.952491 | 0.537054 |
| bills | 1.88 | 0.2229 | −0.675901 | 1.000000 | −0.571828 | 0.637876 | −0.559408 | −0.620610 |
| exp | 26.83 | 1.0463 | 0.454088 | −0.571828 | 1.000000 | −0.979298 | 0.202653 | −0.101622 |
| inability | 2.65 | 0.3728 | −0.514732 | 0.637876 | −0.979298 | 1.000000 | −0.289628 | −0.064492 |
| DESI | 39.21 | 6.3209 | 0.952491 | −0.559408 | 0.202653 | −0.289628 | 1.000000 | 0.614187 |
| inclusive growth | 18,325.00 | 453.3321 | 0.537054 | −0.620610 | −0.101622 | −0.064492 | 0.614187 | 1.000000 |
| Denmark | ||||||||
| Mean | St. Dev. | RES | bills | exp | inability | DESI | inclusive growth | |
| RES | 36.9 | 3.831 | 1.000000 | −0.583734 | −0.027358 | 0.548557 | 0.751865 | 0.979802 |
| bills | 3.8 | 0.759 | −0.583734 | 1.000000 | 0.006554 | −0.091430 | −0.521519 | −0.572310 |
| exp | 28.6 | 0.402 | −0.027358 | 0.006554 | 1.000000 | 0.634590 | 0.545802 | 0.058490 |
| inability | 3.2 | 0.922 | 0.548557 | −0.091430 | 0.634590 | 1.000000 | 0.693123 | 0.520267 |
| DESI | 56.3 | 9.192 | 0.751865 | −0.521519 | 0.545802 | 0.693123 | 1.000000 | 0.786345 |
| inclusive growth | 137,142.7 | 2510.268 | 0.979802 | −0.572310 | 0.058490 | 0.520267 | 0.786345 | 1.000000 |
| R = 0.97980190 R2 = 0.96001177 Adjusted R2 = 0.95001471 F(1,4) = 96.029 p < 0.00061 | ||||||||
| Coefficients | St. Dev. | p-Statistic | p-Value | |||||
| constant | 113,451.7 | 2428.415 | 46.71841 | 0.000001 | ||||
| RES | 0.979802 | 0.099985 | 642.0 | 65.517 | 9.79946 | 0.000608 | ||
| Estonia | ||||||||
| Mean | St. Dev. | RES | bills | exp | inability | DESI | inclusive growth | |
| RES | 32.81 | 4.083 | 1.000000 | −0.736369 | 0.959460 | 0.133823 | 0.915779 | 0.787556 |
| bills | 5.58 | 1.258 | −0.736369 | 1.000000 | −0.809262 | −0.109591 | −0.814011 | −0.754561 |
| exp | 19.45 | 1.850 | 0.959460 | −0.809262 | 1.000000 | 0.349613 | 0.957780 | 0.715341 |
| inability | 2.63 | 0.489 | 0.133823 | −0.109591 | 0.349613 | 1.000000 | 0.222176 | −0.320658 |
| DESI | 48.44 | 5.684 | 0.915779 | −0.814011 | 0.957780 | 0.222176 | 1.000000 | 0.829506 |
| inclusive growth | 83,735.67 | 3988.994 | 0.787556 | −0.754561 | 0.715341 | −0.320658 | 0.829506 | 1.000000 |
| R = 0.82950623 R2 = 0.68808058 Adjusted R2 = 0.61010072 F(1,4) = 8.8238 p < 0.04112 | ||||||||
| Coefficients | St. Dev. | p-Statistic | p-Value | |||||
| constant | 55,540.22 | 9546.158 | 5.818071 | 0.004345 | ||||
| DESI | 0.829506 | 0.279249 | 582.12 | 195.968 | 2.970492 | 0.041124 | ||
| Finland | ||||||||
| Mean | St. Dev. | RES | bills | exp | inability | DESI | inclusive growth | |
| RES | 42.3 | 1.270 | 1.000000 | −0.469375 | 0.859196 | −0.323429 | 0.796449 | −0.777216 |
| bills | 7.2 | 0.856 | −0.469375 | 1.000000 | −0.744095 | 0.886693 | −0.894499 | 0.320021 |
| exp | 29.3 | 0.930 | 0.859196 | −0.744095 | 1.000000 | −0.508851 | 0.875059 | −0.699994 |
| inability | 1.7 | 0.259 | −0.323429 | 0.886693 | −0.508851 | 1.000000 | −0.805676 | 0.387355 |
| DESI | 54.8 | 6.153 | 0.796449 | −0.894499 | 0.875059 | −0.805676 | 1.000000 | −0.619082 |
| inclusive growth | 123,908.3 | 1014.275 | −0.777216 | 0.320021 | −0.699994 | 0.387355 | −0.619082 | 1.000000 |
| France | ||||||||
| Mean | St. Dev. | RES | bills | exp | inability | DESI | inclusive growth | |
| RES | 18.0 | 1.748 | 1.000000 | 0.444563 | 0.502846 | 0.805893 | 0.956743 | −0.627693 |
| bills | 6.3 | 0.701 | 0.444563 | 1.000000 | −0.153265 | 0.424721 | 0.583542 | −0.001488 |
| exp | 26.8 | 0.912 | 0.502846 | −0.153265 | 1.000000 | −0.043676 | 0.237252 | −0.872621 |
| inability | 6.6 | 2.135 | 0.805893 | 0.424721 | −0.043676 | 1.000000 | 0.903873 | −0.253477 |
| DESI | 41.8 | 7.122 | 0.956743 | 0.583542 | 0.237252 | 0.903873 | 1.000000 | −0.403587 |
| inclusive growth | 128,054.6 | 3284.057 | −0.627693 | −0.001488 | −0.872621 | −0.253477 | −0.403587 | 1.000000 |
| R = 0.87262123 R2 = 0.76146781 Adjusted R2 = 0.70183476 F(1,4) = 12.769 p < 0.02330 | ||||||||
| Coefficients | St. Dev. | p-Statistic | p-Value | |||||
| Constant | 212,147.6 | 23,544.39 | 9.01053 | 0.000840 | ||||
| exp | −0.872621 | 0.244199 | −3143.7 | 879.74 | −3.57341 | 0.023305 | ||
| Germany | ||||||||
| Mean | St. Dev. | RES | bills | exp | inability | DESI | inclusive growth | |
| RES | 18.1 | 1.978 | 1.000000 | 0.814377 | 0.654486 | 0.706895 | 0.971100 | 0.480918 |
| bills | 3.2 | 0.731 | 0.814377 | 1.000000 | 0.539151 | 0.661866 | 0.849316 | 0.607980 |
| exp | 24.6 | 0.745 | 0.654486 | 0.539151 | 1.000000 | 0.572257 | 0.551721 | 0.144918 |
| inability | 4.3 | 2.041 | 0.706895 | 0.661866 | 0.572257 | 1.000000 | 0.620745 | −0.129438 |
| DESI | 41.5 | 7.407 | 0.971100 | 0.849316 | 0.551721 | 0.620745 | 1.000000 | 0.634676 |
| inclusive growth | 121,270.6 | 1394.645 | 0.480918 | 0.607980 | 0.144918 | −0.129438 | 0.634676 | 1.000000 |
| Greece | ||||||||
| Mean | St. Dev. | RES | bills | exp | inability | DESI | inclusive growth | |
| RES | 20.24 | 2.245 | 1.000000 | −0.739059 | 0.208724 | −0.855050 | 0.879044 | −0.601980 |
| bills | 32.53 | 4.585 | −0.739059 | 1.000000 | −0.504808 | 0.858635 | −0.392277 | 0.702522 |
| exp | 20.42 | 1.422 | 0.208724 | −0.504808 | 1.000000 | −0.196639 | −0.159510 | −0.826418 |
| inability | 19.93 | 3.479 | −0.855050 | 0.858635 | −0.196639 | 1.000000 | −0.578174 | 0.636181 |
| DESI | 28.40 | 6.278 | 0.879044 | −0.392277 | −0.159510 | −0.578174 | 1.000000 | −0.204541 |
| inclusive growth | 89,868.68 | 3440.339 | −0.601980 | 0.702522 | −0.826418 | 0.636181 | −0.204541 | 1.000000 |
| R = 0.82641774 R2 = 0.68296628 Adjusted R2 = 0.60370786 F(1,4) = 8.6170 p < 0.04258 | ||||||||
| Coefficients | St. Dev. | p-Statistic | p-Value | |||||
| constant | 130,694.1 | 13,935.74 | 9.37834 | 0.000720 | ||||
| exp | −0.826418 | 0.281529 | −1999.6 | 681.19 | −2.93546 | 0.042581 | ||
| Hungary | ||||||||
| Mean | St. Dev. | RES | bills | exp | inability | DESI | inclusive growth | |
| RES | 13.65 | 0.993 | 1.000000 | −0.466271 | 0.827344 | −0.483964 | 0.849890 | 0.428687 |
| bills | 10.63 | 1.820 | −0.466271 | 1.000000 | −0.767905 | 0.784321 | −0.860722 | −0.956746 |
| exp | 21.33 | 1.152 | 0.827344 | −0.767905 | 1.000000 | −0.825586 | 0.937722 | 0.657750 |
| inability | 5.43 | 0.935 | −0.483964 | 0.784321 | −0.825586 | 1.000000 | −0.735497 | −0.659944 |
| DESI | 34.81 | 5.801 | 0.849890 | −0.860722 | 0.937722 | −0.735497 | 1.000000 | 0.812697 |
| inclusive growth | 78,264.06 | 2736.312 | 0.428687 | −0.956746 | 0.657750 | −0.659944 | 0.812697 | 1.000000 |
| R = 0.81269725 R2 = 0.66047683 Adjusted R2 = 0.57559604 F(1,4) = 7.7812 p < 0.04934 | ||||||||
| Coefficients | St. Dev. | p-Statistic | p-Value | |||||
| 64,918.78 | 4839.172 | 13.41527 | 0.000179 | |||||
| DESI | 0.812697 | 0.291343 | 383.35 | 137.428 | 2.78949 | 0.049338 | ||
| Ireland | ||||||||
| Mean | St. Dev. | RES | bills | exp | inability | DESI | inclusive growth | |
| RES | 12.5 | 2.04 | 1.000000 | −0.355155 | 0.960748 | −0.135150 | 0.465487 | 0.482365 |
| bills | 8.8 | 0.98 | −0.355155 | 1.000000 | −0.554876 | 0.722838 | −0.226979 | −0.360158 |
| exp | 26.0 | 1.38 | 0.960748 | −0.554876 | 1.000000 | −0.236898 | 0.569751 | 0.615635 |
| inability | 4.6 | 1.23 | −0.135150 | 0.722838 | −0.236898 | 1.000000 | 0.395136 | 0.259204 |
| DESI | 50.5 | 8.16 | 0.465487 | −0.226979 | 0.569751 | 0.395136 | 1.000000 | 0.988926 |
| inclusive growth | 214,643.0 | 24,227.65 | 0.482365 | −0.360158 | 0.615635 | 0.259204 | 0.988926 | 1.000000 |
| R = 0.98892570 R2 = 0.97797403 Adjusted R2 = 0.97246754 F(1,4) = 177.60 p < 0.00018 | ||||||||
| Coefficients | St. Dev. | p-Statistic | p-Value | |||||
| 66,463.28 | 11,239.39 | 5.91343 | 0.004095 | |||||
| DESI | 0.988926 | 0.074206 | 2936.14 | 220.32 | 13.32681 | 0.000183 | ||
| Italy | ||||||||
| Mean | St. Dev. | RES | bills | exp | inability | DESI | inclusive growth | |
| RES | 18.7 | 0.910 | 1.000000 | 0.699807 | 0.949515 | −0.735486 | 0.437191 | −0.614969 |
| bills | 5.2 | 0.838 | 0.699807 | 1.000000 | 0.800936 | −0.726338 | 0.384174 | −0.253323 |
| exp | 23.5 | 1.103 | 0.949515 | 0.800936 | 1.000000 | −0.842392 | 0.623366 | −0.406064 |
| inability | 10.9 | 3.091 | −0.735486 | −0.726338 | −0.842392 | 1.000000 | −0.804735 | 0.067549 |
| DESI | 36.6 | 7.630 | 0.437191 | 0.384174 | 0.623366 | −0.804735 | 1.000000 | 0.389528 |
| inclusive growth | 127,338.5 | 4254.656 | −0.614969 | −0.253323 | −0.406064 | 0.067549 | 0.389528 | 1.000000 |
| Latvia | ||||||||
| Mean | St. Dev. | RES | bills | exp | inability | DESI | inclusive growth | |
| RES | 41.25 | 1.572 | 1.000000 | −0.651013 | 0.607318 | −0.723304 | 0.975409 | 0.768782 |
| bills | 7.63 | 1.447 | −0.651013 | 1.000000 | −0.518551 | 0.465495 | −0.785173 | −0.882334 |
| exp | 21.50 | 0.807 | 0.607318 | −0.518551 | 1.000000 | −0.894160 | 0.569763 | 0.432195 |
| inability | 7.20 | 1.657 | −0.723304 | 0.465495 | −0.894160 | 1.000000 | −0.682851 | −0.585589 |
| DESI | 42.95 | 4.568 | 0.975409 | −0.785173 | 0.569763 | −0.682851 | 1.000000 | 0.872169 |
| inclusive growth | 74,026.19 | 3653.948 | 0.768782 | −0.882334 | 0.432195 | −0.585589 | 0.872169 | 1.000000 |
| R = 0.87216925 R2 = 0.76067919 Adjusted R2 = 0.70084899 F(1,4) = 12.714 p < 0.02347 | ||||||||
| Coefficients | St. Dev. | p-Statistic | p-Value | |||||
| 44,064.72 | 8442.291 | 5.219521 | 0.006430 | |||||
| DESI | 0.872169 | 0.244602 | 697.64 | 195.655 | 3.565665 | 0.023467 | ||
| Lithuania | ||||||||
| Mean | St. Dev. | RES | bills | exp | inability | DESI | inclusive growth | |
| RES | 26.79 | 1.815 | 1.000000 | −0.753860 | 0.937789 | −0.924102 | 0.881634 | 0.840944 |
| bills | 8.05 | 2.960 | −0.753860 | 1.000000 | −0.748546 | 0.844135 | −0.880531 | −0.949843 |
| exp | 15.45 | 0.589 | 0.937789 | −0.748546 | 1.000000 | −0.974168 | 0.921179 | 0.822458 |
| inability | 24.43 | 4.259 | −0.924102 | 0.844135 | −0.974168 | 1.000000 | −0.983483 | −0.900254 |
| DESI | 43.77 | 5.741 | 0.881634 | −0.880531 | 0.921179 | −0.983483 | 1.000000 | 0.941133 |
| inclusive growth | 89,530.47 | 5152.232 | 0.840944 | −0.949843 | 0.822458 | −0.900254 | 0.941133 | 1.000000 |
| R = 0.94113316 R2 = 0.88573163 Adjusted R2 = 0.85716454 F(1,4) = 31.005 p < 0.00510 | ||||||||
| Coefficients | St. Dev. | p-Statistic | p-Value | |||||
| 52,556.91 | 6687.495 | 7.858983 | 0.001416 | |||||
| DESI | 0.941133 | 0.169018 | 844.65 | 151.690 | 5.568241 | 0.005096 | ||
| Luxembourg | ||||||||
| Mean | St. Dev. | RES | bills | exp | inability | DESI | inclusive growth | |
| RES | 10.0 | 3.134 | 1.000000 | 0.862007 | −0.230241 | 0.324472 | 0.931176 | −0.709452 |
| bills | 3.1 | 0.967 | 0.862007 | 1.000000 | −0.513602 | −0.010132 | 0.789152 | −0.535895 |
| exp | 22.7 | 0.958 | −0.230241 | −0.513602 | 1.000000 | 0.681037 | −0.443807 | −0.118836 |
| inability | 2.4 | 0.612 | 0.324472 | −0.010132 | 0.681037 | 1.000000 | 0.201611 | −0.756239 |
| DESI | 50.4 | 5.742 | 0.931176 | 0.789152 | −0.443807 | 0.201611 | 1.000000 | −0.616138 |
| inclusive growth | 279,172.4 | 3545.067 | −0.709452 | −0.535895 | −0.118836 | −0.756239 | −0.616138 | 1.000000 |
| Netherlands | ||||||||
| Mean | St. Dev. | RES | bills | exp | inability | DESI | inclusive growth | |
| RES | 10.8 | 3.658 | 1.000000 | −0.603288 | 0.357754 | 0.541971 | 0.897933 | 0.050079 |
| bills | 1.6 | 0.295 | −0.603288 | 1.000000 | −0.412500 | −0.094590 | −0.618823 | −0.101522 |
| exp | 24.6 | 1.019 | 0.357754 | −0.412500 | 1.000000 | −0.572403 | 0.039432 | −0.728620 |
| inability | 3.0 | 1.183 | 0.541971 | −0.094590 | −0.572403 | 1.000000 | 0.700811 | 0.624377 |
| DESI | 54.8 | 8.528 | 0.897933 | −0.618823 | 0.039432 | 0.700811 | 1.000000 | 0.477578 |
| inclusive growth | 127,336.8 | 2875.326 | 0.050079 | −0.101522 | −0.728620 | 0.624377 | 0.477578 | 1.000000 |
| Poland | ||||||||
| Mean | St. Dev. | RES | bills | exp | inability | DESI | inclusive growth | |
| RES | 14.43 | 2.482 | 1.000000 | −0.886185 | 0.677507 | −0.705476 | 0.875430 | 0.828499 |
| bills | 5.83 | 1.469 | −0.886185 | 1.000000 | −0.572067 | 0.739187 | −0.847084 | −0.812349 |
| exp | 18.58 | 0.637 | 0.677507 | −0.572067 | 1.000000 | −0.655394 | 0.735939 | 0.503671 |
| inability | 4.43 | 1.115 | −0.705476 | 0.739187 | −0.655394 | 1.000000 | −0.514085 | −0.379595 |
| DESI | 32.02 | 5.895 | 0.875430 | −0.847084 | 0.735939 | −0.514085 | 1.000000 | 0.952876 |
| inclusive growth | 82,212.75 | 5402.883 | 0.828499 | −0.812349 | 0.503671 | −0.379595 | 0.952876 | 1.000000 |
| R = 0.82849917 R2 = 0.68641088 Adjusted R2 = 0.60801360 F(1,4) = 8.7555 p < 0.04160 | ||||||||
| Coefficients | St. Dev. | p-Statistic | p-Value | |||||
| 56,187.78 | 8903.014 | 6.311097 | 0.003223 | |||||
| RES | 0.828499 | 0.279995 | 1803.82 | 609.611 | 2.958977 | 0.041597 | ||
| Portugal | ||||||||
| Mean | St. Dev. | RES | bills | exp | inability | DESI | inclusive growth | |
| RES | 32.35 | 2.066 | 1.000000 | −0.184171 | 0.545999 | −0.874331 | 0.902914 | 0.008681 |
| bills | 4.65 | 0.748 | −0.184171 | 1.000000 | −0.393204 | 0.229660 | −0.171957 | 0.423315 |
| exp | 18.20 | 1.259 | 0.545999 | −0.393204 | 1.000000 | −0.574844 | 0.196649 | −0.805243 |
| inability | 18.35 | 1.473 | −0.874331 | 0.229660 | −0.574844 | 1.000000 | −0.846066 | 0.006621 |
| DESI | 42.27 | 5.577 | 0.902914 | −0.171957 | 0.196649 | −0.846066 | 1.000000 | 0.381014 |
| inclusive growth | 82,898.42 | 2401.296 | 0.008681 | 0.423315 | −0.805243 | 0.006621 | 0.381014 | 1.000000 |
| Romania | ||||||||
| Mean | St. Dev. | RES | bills | exp | inability | DESI | inclusive growth | |
| RES | 24.18 | 0.271 | 1.000000 | 0.470297 | 0.607978 | 0.045773 | −0.270928 | −0.492071 |
| bills | 13.83 | 3.551 | 0.470297 | 1.000000 | 0.396593 | 0.575012 | −0.098509 | −0.233059 |
| exp | 18.68 | 1.052 | 0.607978 | 0.396593 | 1.000000 | 0.141499 | −0.528166 | −0.567365 |
| inability | 10.92 | 2.207 | 0.045773 | 0.575012 | 0.141499 | 1.000000 | 0.639292 | 0.567986 |
| DESI | 24.21 | 4.243 | −0.270928 | −0.098509 | −0.528166 | 0.639292 | 1.000000 | 0.951232 |
| inclusive growth | 84,843.25 | 8415.324 | −0.492071 | −0.233059 | −0.567365 | 0.567986 | 0.951232 | 1.000000 |
| R = 0.95123243 R2 = 0.90484313 Adjusted R2 = 0.88105392 F(1,4) = 38.036 p < 0.00351 | ||||||||
| Coefficients | St. Dev. | p-Statistic | p-Value | |||||
| 39,176.77 | 7498.791 | 5.224412 | 0.006408 | |||||
| DESI | 0.951232 | 0.154238 | 1886.62 | 305.905 | 6.167321 | 0.003509 | ||
| Slovakia | ||||||||
| Mean | St. Dev. | RES | bills | exp | inability | DESI | inclusive growth | |
| RES | 15.42 | 2.907 | 1.000000 | −0.255855 | 0.791013 | 0.770483 | 0.786512 | 0.844065 |
| bills | 6.25 | 1.540 | −0.255855 | 1.000000 | −0.757272 | 0.334033 | −0.441581 | −0.065007 |
| exp | 29.63 | 1.362 | 0.791013 | −0.757272 | 1.000000 | 0.231201 | 0.780032 | 0.611098 |
| inability | 5.92 | 1.332 | 0.770483 | 0.334033 | 0.231201 | 1.000000 | 0.519554 | 0.732670 |
| DESI | 35.72 | 5.204 | 0.786512 | −0.441581 | 0.780032 | 0.519554 | 1.000000 | 0.831798 |
| inclusive growth | 77,991.54 | 1628.859 | 0.844065 | −0.065007 | 0.611098 | 0.732670 | 0.831798 | 1.000000 |
| R = 0.84406547 R2 = 0.71244651 Adjusted R2 = 0.64055814 F(1,4) = 9.9105 p < 0.03458 | ||||||||
| Coefficients | St. Dev. | p-Statistic | p-Value | |||||
| 70,699.44 | 2350.418 | 30.07951 | 0.000007 | |||||
| RES | 0.844065 | 0.268120 | 472.90 | 150.220 | 3.14809 | 0.034578 | ||
| Slovenia | ||||||||
| Mean | St. Dev. | RES | bills | exp | inability | DESI | inclusive growth | |
| RES | 23.33 | 1.835 | 1.000000 | −0.900207 | 0.493285 | −0.610585 | 0.838656 | 0.559550 |
| bills | 10.27 | 2.955 | −0.900207 | 1.000000 | −0.109465 | 0.762992 | −0.973866 | −0.832676 |
| exp | 19.23 | 0.843 | 0.493285 | −0.109465 | 1.000000 | 0.147143 | −0.019513 | −0.440053 |
| inability | 2.77 | 0.769 | −0.610585 | 0.762992 | 0.147143 | 1.000000 | −0.674600 | −0.814009 |
| DESI | 43.12 | 6.576 | 0.838656 | −0.973866 | −0.019513 | −0.674600 | 1.000000 | 0.874297 |
| inclusive growth | 95,098.52 | 3279.654 | 0.559550 | −0.832676 | −0.440053 | −0.814009 | 0.874297 | 1.000000 |
| R = 0.83267605 R2 = 0.69334941 Adjusted R2 = 0.61668676 F(1,4) = 9.0442 p < 0.03965 | ||||||||
| Coefficients | St. Dev. | p-Statistic | p-Value | |||||
| 104,587.3 | 3262.268 | 32.05968 | 0.000006 | |||||
| Bills | −0.832676 | 0.276880 | −924.2 | 307.324 | −3.00735 | 0.039654 | ||
| Spain | ||||||||
| Mean | St. Dev. | RES | bills | exp | inability | DESI | inclusive growth | |
| RES | 19.5 | 2.098 | 1.000000 | 0.917398 | 0.616607 | 0.884023 | 0.898483 | −0.841609 |
| bills | 8.2 | 1.354 | 0.917398 | 1.000000 | 0.779295 | 0.790405 | 0.711079 | −0.912486 |
| exp | 23.0 | 1.559 | 0.616607 | 0.779295 | 1.000000 | 0.277077 | 0.305081 | −0.942533 |
| inability | 11.1 | 3.800 | 0.884023 | 0.790405 | 0.277077 | 1.000000 | 0.936433 | −0.558223 |
| DESI | 49.4 | 7.477 | 0.898483 | 0.711079 | 0.305081 | 0.936433 | 1.000000 | −0.588103 |
| inclusive growth | 106,963.2 | 4116.080 | −0.841609 | −0.912486 | −0.942533 | −0.558223 | −0.588103 | 1.000000 |
| R = 0.84160889 R2 = 0.70830552 Adjusted R2 = 0.63538190 F(1,4) = 9.7130 p < 0.03564 | ||||||||
| Coefficients | St. Dev. | p-Statistic | p-Value | |||||
| 139,148.6 | 10,376.93 | 13.40942 | 0.000179 | |||||
| RES | −0.841609 | 0.270044 | −1651.3 | 529.85 | −3.11657 | 0.035645 | ||
| Sweden | ||||||||
| Mean | St. Dev. | RES | bills | exp | inability | DESI | inclusive growth | |
| RES | 58.9 | 4.827 | 1.000000 | 0.739881 | −0.159903 | 0.531752 | 0.984898 | 0.866103 |
| bills | 2.5 | 0.553 | 0.739881 | 1.000000 | −0.485416 | 0.854864 | 0.727907 | 0.553645 |
| exp | 25.8 | 0.410 | −0.159903 | −0.485416 | 1.000000 | −0.166713 | −0.140137 | −0.414322 |
| inability | 2.3 | 0.585 | 0.531752 | 0.854864 | −0.166713 | 1.000000 | 0.483143 | 0.149800 |
| DESI | 54.6 | 7.335 | 0.984898 | 0.727907 | −0.140137 | 0.483143 | 1.000000 | 0.884583 |
| inclusive growth | 123,884.9 | 3275.506 | 0.866103 | 0.553645 | −0.414322 | 0.149800 | 0.884583 | 1.000000 |
| R = 0.86610268 R2 = 0.75013386 Adjusted R2 = 0.68766732 F(1,4) = 12.009 p < 0.02569 | ||||||||
| Coefficients (α) | St. Dev. | p-Statistic | p-Value | |||||
| 89,267.26 | 10,017.61 | 8.911037 | 0.000877 | |||||
| RES | 0.866103 | 0.249933 | 587.73 | 169.60 | 3.465339 | 0.025692 | ||
Disclaimer/Publisher’s Note: The statements, opinions and data contained in all publications are solely those of the individual author(s) and contributor(s) and not of MDPI and/or the editor(s). MDPI and/or the editor(s) disclaim responsibility for any injury to people or property resulting from any ideas, methods, instructions or products referred to in the content. |
© 2024 by the authors. Licensee MDPI, Basel, Switzerland. This article is an open access article distributed under the terms and conditions of the Creative Commons Attribution (CC BY) license (https://creativecommons.org/licenses/by/4.0/).
Share and Cite
Tundys, B.; Bretyn, A. Inclusive Growth, Energy Poverty and Digital and Social Development: Cross-Country Analysis of the European Union. Energies 2024, 17, 4830. https://doi.org/10.3390/en17194830
Tundys B, Bretyn A. Inclusive Growth, Energy Poverty and Digital and Social Development: Cross-Country Analysis of the European Union. Energies. 2024; 17(19):4830. https://doi.org/10.3390/en17194830
Chicago/Turabian StyleTundys, Blanka, and Agnieszka Bretyn. 2024. "Inclusive Growth, Energy Poverty and Digital and Social Development: Cross-Country Analysis of the European Union" Energies 17, no. 19: 4830. https://doi.org/10.3390/en17194830
APA StyleTundys, B., & Bretyn, A. (2024). Inclusive Growth, Energy Poverty and Digital and Social Development: Cross-Country Analysis of the European Union. Energies, 17(19), 4830. https://doi.org/10.3390/en17194830