Article

Nano-Water-Alternating-Gas Simulation Study Considering Rock–Fluid Interaction in Heterogeneous Carbonate Reservoirs †

1
Department of Energy and Mineral Resources Engineering, Kangwon National University, Samcheok 25913, Republic of Korea
2
Department of Integrative Engineering for Hydrogen Safety, Kangwon National University, Chuncheon 24431, Republic of Korea
3
Department of Energy Resources and Chemical Engineering, Kangwon National University, Samcheok 25913, Republic of Korea
*
Author to whom correspondence should be addressed.
This article is a revised and expanded version of a paper entitled Jang, H.C.; Ko, S.M.; Park, H.R. Novel WAG Method with Nanotechnology in a Heterogeneous Carbonate Reservoir. In Proceedings of the SPE EOR Conference at Oil and Gas West Asia, Muscat, Oman, 22–24 April 2024.
Energies 2024, 17(19), 4846; https://doi.org/10.3390/en17194846
Submission received: 21 August 2024 / Revised: 13 September 2024 / Accepted: 24 September 2024 / Published: 27 September 2024
(This article belongs to the Special Issue Enhanced Oil Recovery: Numerical Simulation and Deep Machine Learning)

Abstract

:
In carbonate reservoirs, nanoparticles can adhere to rock surfaces, potentially altering the rock wettability and modifying the absolute permeability. In the water-alternating-gas (WAG) process, the introduction of nanoparticles into the water phase, termed nano-water-alternating gas (NWAG), is a promising approach for enhancing oil recovery and CO2 storage. The NWAG process can alter rock wettability and absolute permeability through the adsorption of nanoparticles on the rock surface. This study investigated the efficiency of the NWAG method, which utilizes nanofluids in CO2-enhanced oil recovery (EOR) processes to simultaneously recover oil and store CO2 using 1D core and 3D heterogeneous reservoir models. The simulation results of the 1D core model showed that applying the NWAG method enhanced both oil recovery and CO2 storage efficiency by increasing to 3%. In a 3D reservoir model, a Dykstra–Parsons coefficient of 0.4 was selected to represent reservoir heterogeneity. Additionally, the capillary trapping of CO2 during WAG injection was computed using Larsen and Skauge’s three-phase relative permeability hysteresis model. A sensitivity analysis was performed using the NWAG ratio, slug size, injection period, injection cycle, and nanofluid concentration. The results confirmed an increase of 0.8% in oil recovery and 15.2% in CO2 storage compared with the conventional WAG process. This mechanism suggests that nanofluids can enhance oil recovery and expand CO2 storage, improving the efficiency of both the oil production rate and CO2 storage compared to conventional WAG methods.

1. Introduction

To effectively implement the water-alternating-gas (WAG) method, various factors such as the volume of water and gas injected, timing of injections, and well management must be carefully considered [1,2]. Effective parameters play a crucial role in influencing oil recovery such as decreased miscibility pressure. Although CO2 injection causes gas segregation and viscous fingering, increasing the dissolved CO2 content in water can enhance CO2 storage capabilities. The injected CO2 tends to accumulate near the top of the reservoir, whereas water and oil predominantly flow near the bottom, particularly in larger reservoirs with significant vertical heterogeneity. Differences in density between gas and water/oil, influenced by reservoir conditions such as temperature, pressure, and gas type, exacerbate gas segregation, potentially impacting CO2 storage outcomes. CO2-WAG is a method for enhanced oil recovery (EOR), designed to capture and store CO2 generated from industrial processes or produced underground. This technique involves alternately injecting water and CO2, which improves solubility, residual oil recovery, and CO2 storage efficiency [3,4].
Research aimed to optimize the efficiency of CO2-WAG has led to the development of nano-water-alternating gas (NWAG), representing a considerable advancement. Jia et al. [5] reported that NWAG, which uses nanofluids, enhances oil recovery efficiency by addressing the viscosity concerns typical of conventional CO2-WAG methods. Nanoparticles incorporated into the fluids modify the interfacial tension with oil, alter the contact angles with rock surfaces, shift endpoint saturations in relative permeability, and enhance oil recovery [6]. Furthermore, nanoparticles contribute to the management of CO2 solubility, control of its flow dynamics, and optimization of its structural integrity, thereby enhancing the initial CO2 injection and storage capacities. Typically, carbonate reservoirs exhibit characteristics such as heterogeneous rock properties and oil-wet conditions due to their geological features. Figure 1 shows the change in oil recovery due to wettability alteration. A nanofluid injected into an oil-wet reservoir creates a disjoining pressure through spreading forces and interfacial tension reduction that cause wettability alteration [7,8]. Consequently, the critical water saturation increases and the residual oil saturation decreases. Thus, wettability alteration increases the oil recovery. These effects were efficient on a carbonate reservoir, because it has a characteristic oil-wet rock surface. Therefore, the NWAG process is expected to increase oil recovery when applied to carbonate reservoirs.
The WAG method has been widely implemented across different fields, including in Wasson in the USA, Rumaith in the UAE, and Weyburn in Canada [9]. When a simulation study of the WAG method is conducted, types of reservoirs rock should be considered. Modeling for a carbonate reservoir typically formed oil-wet rock surface and heterogenous characteristics such as variable permeability and porosity, unlike clastic rock reservoirs. The optimum conditions for achieving the highest oil recovery in sandstone reservoirs involve a WAG ratio of 2:1, as determined through reservoir simulations [10]. Abdurrahman et al. [11] conducted reservoir simulations of the CO2-WAG process in the Sumatera oil field in Indonesia and found that the effectiveness of the CO2-WAG process depended significantly on the chosen WAG ratio, as shown in Figure 2. Lower-viscosity oil can improve the oil production rate but reduces CO2 storage. In summary, although WAG has demonstrated success in enhancing oil recovery and CO2 storage efficiency in various reservoir types, its application must consider specific reservoir conditions and challenges, such as rock wettability and crude oil properties.
Matroushi et al. [12] conducted a simulation to compare the WAG and NWAG methods. The NWAG involved a ratio of 2:1 and injection of a nanofluid containing a 0.63% hydrocarbon pore volume (HCPV) and 0.32% HCPV CO2 over a six-month cycle. The results indicated that the NWAG method maintains higher oil production levels than the WAG method, as shown in Figure 3. Øyvind Eide et al. investigated the stability of nanoparticles in CO2-EOR with nanoparticles under challenging reservoir conditions, in that the stability of nanoparticles considering chemical reactions and pH changes under high-temperature and high-salinity conditions of carbonate reservoirs. They also reported that nanoparticles affected the viscosity of the injected fluid and oil recovery [13]. Additionally, Cao et al. [14] experimentally compared the oil recovery between waterflooding and nanofluid flooding and demonstrated that nanofluid flooding achieved higher oil recovery rates and accelerated recovery than waterflooding.
This study proposes a method to simultaneously enhance oil recovery and CO2 storage using the NWAG technique. By utilizing the NWAG method, the wettability of the rock can be improved, and the solubility between fluids can be enhanced, maximizing both oil recovery and CO2 storage. The 1D and 3D models were constructed using CMG’s commercial simulator to compare and analyze the efficiency of the CO2-WAG and NWAG methods. In a 1D core model, the applicability of the NWAG method in both oil recovery and CO2 storage was studied. In the case of a 3D reservoir model, various scenarios of NWAG were compared and analyzed for oil recovery and CO2 storage by setting the NWAG ratio, slug size, and nanoparticle concentration. Additionally, to more accurately understand the changes occurring during the actual operation process, a model reflecting heterogeneity and hysteresis was constructed. From the constructed model, operational parameters for maximizing the efficiency of the NWAG method were derived, and the oil recovery and CO2 storage efficiency were compared and analyzed.

2. Simulation Model

2.1. Fluid Modeling

The fluid properties were modeled using W3 oil from the Weyburn oil field located in Saskatchewan in Canada, by applying waterflooding production and CO2-WAG processes. For the EOR, CO2 was purchased from the North Dakota Gasification Plant and transported by a gas pipeline [15]. Table 1 lists the fluid model using the Peng–Robinson equation of state (PR-EOS) to calculate the Weyburn W3 components and compositions. The PR-EOS was used to calculate the critical pressure and temperature of the oil. The fluid model was examined in a comparison between the fluid model and Weyburn W3 parameters including the American Petroleum Institute (API) and saturation pressure in Table 2. The phase behavior was compared with that reported in a previous study, as shown in Figure 4. Based on these results, the fluid model generated in this study is similar to that of Weyburn W3 [16,17].

2.2. Description of a 1D Core Model

A 1D core simulation model incorporating nanoparticle flow was constructed with dimensions of 50 × 1 × 1, a horizontal length of approximately 10 cm, porosity of 18%, and permeability of 50.0 md, as listed in Table 3. Simulations were conducted using CMG-GEM and CMOST. While CMG-GEM did not include nanoparticle adsorption, variations in oil recovery were observed for different WAG ratios and slug sizes. The CMOST module was used to consider rock–fluid interactions by nanoparticle adsorption, resulting in oil residual saturation shifting in relative permeability curves and permeability reduction by pore plugging. Optimizing the nanoparticle adsorption process was performed by randomly setting the nanofluid concentration in 20 cases from 0 to 1 wt.% and adjusting wettability changes with nanoparticle input, thereby influencing the endpoint of relative permeability and absolute permeability.

2.3. Description of a 3D Core Model

In the results from the 1D core model, improved oil recovery and CO2 storage were observed using both the WAG and NWAG methods. However, hysteresis effects were not considered, and CMG-GEM was used without incorporating nanoparticle adsorption. CMG-STARS was used to simulate a 3D reservoir model that included nanoparticle adsorption. This model incorporates the hysteresis effects of relative permeability and was designed to consider oil-wet conditions and heterogeneity specific to carbonate reservoirs. The 3D model was based on the properties of the Weyburn Reservoir, where the CO2-WAG operations are ongoing, as detailed in Table 4. The simulation scenario included pre-waterflooding for one year, followed by five years of NWAG, and concluded with one year of post-waterflooding. The CO2 dissolution changed by nanoparticle injection was not included in the model, as the monitoring period of six years was relatively short for solubility trapping to occur. In this study, to determine the optimal operating conditions for NWAG, the effective parameters selected were the WAG ratio, slug size, and nanoparticle concentration.
The NWAG simulation is a complex system, because it comprises incompressible and three phase fluids consisting of oil, water, and CO2. The governing equations used the mass/molar balance and Darcy’s equations. Neglecting the dispersion between the phase and gravity effects and applying Darcy’s equation, the following can be obtained:
· ρ o K k r o μ o p o x + q o = t ( ρ o s o )
· ρ g K k r g μ g p g x + q g = t ( ρ g s g )
· ρ w K k r w μ w p w x + q w = t ρ w s w
where the subscripts o, g, and w denote the oil, gas, and water phases, respectively; ρ is the density; K and k r are absolute permeability and relative permeability, respectively; and μ is the fluid viscosity. q is the production or injection rate; t is the injection period; and x is the spatial location. and s are the rock porosity and saturation, respectively [18].
To account for the heterogeneity commonly observed in carbonate reservoirs, we targeted a Dykstra–Parsons coefficient of 0.4, based on well data. The porosity was randomly generated using a Gaussian geological simulation. The permeability, which was calculated using porosity of each grid block, ranged from 31 to 75 md, effectively capturing the heterogeneity of the carbonate rock, as illustrated in Figure 5. Because the WAG method involves the alternating injection of water and CO2, considering the behavior of the relative permeability is crucial. During the drainage and imbibition processes, the fluid often does not reach complete residual conditions, necessitating a correction for relative fluid permeability using residual gas saturation. To address this issue, we applied the Carlson method, based on Land’s theory [19]. The critical gas saturation was set to 0.3.
To incorporate the adsorption phenomenon of the nanoparticles, we employed the Langmuir adsorption isotherm to determine the adsorption amount based on the derived mole fraction. The maximum adsorption capacity was set at 2.5 gmol/m3, with a residual adsorption value of 1 gmol/m3. Furthermore, as the wettability of the rock changed from an initial state of no adsorption to maximum adsorption, a relative permeability model adjusted for nanoparticle adsorption was designed, as shown in Figure 6. To implement the NWAG method effectively, we selected the NWAG ratio, slug size, and nanoparticle concentration based on the parameters listed in Table 5. The method was then performed accordingly. Additionally, we analyzed the efficiency of the NWAG method by focusing on the oil recovery rates and subsurface storage capacity of CO2.

3. Results and Discussion

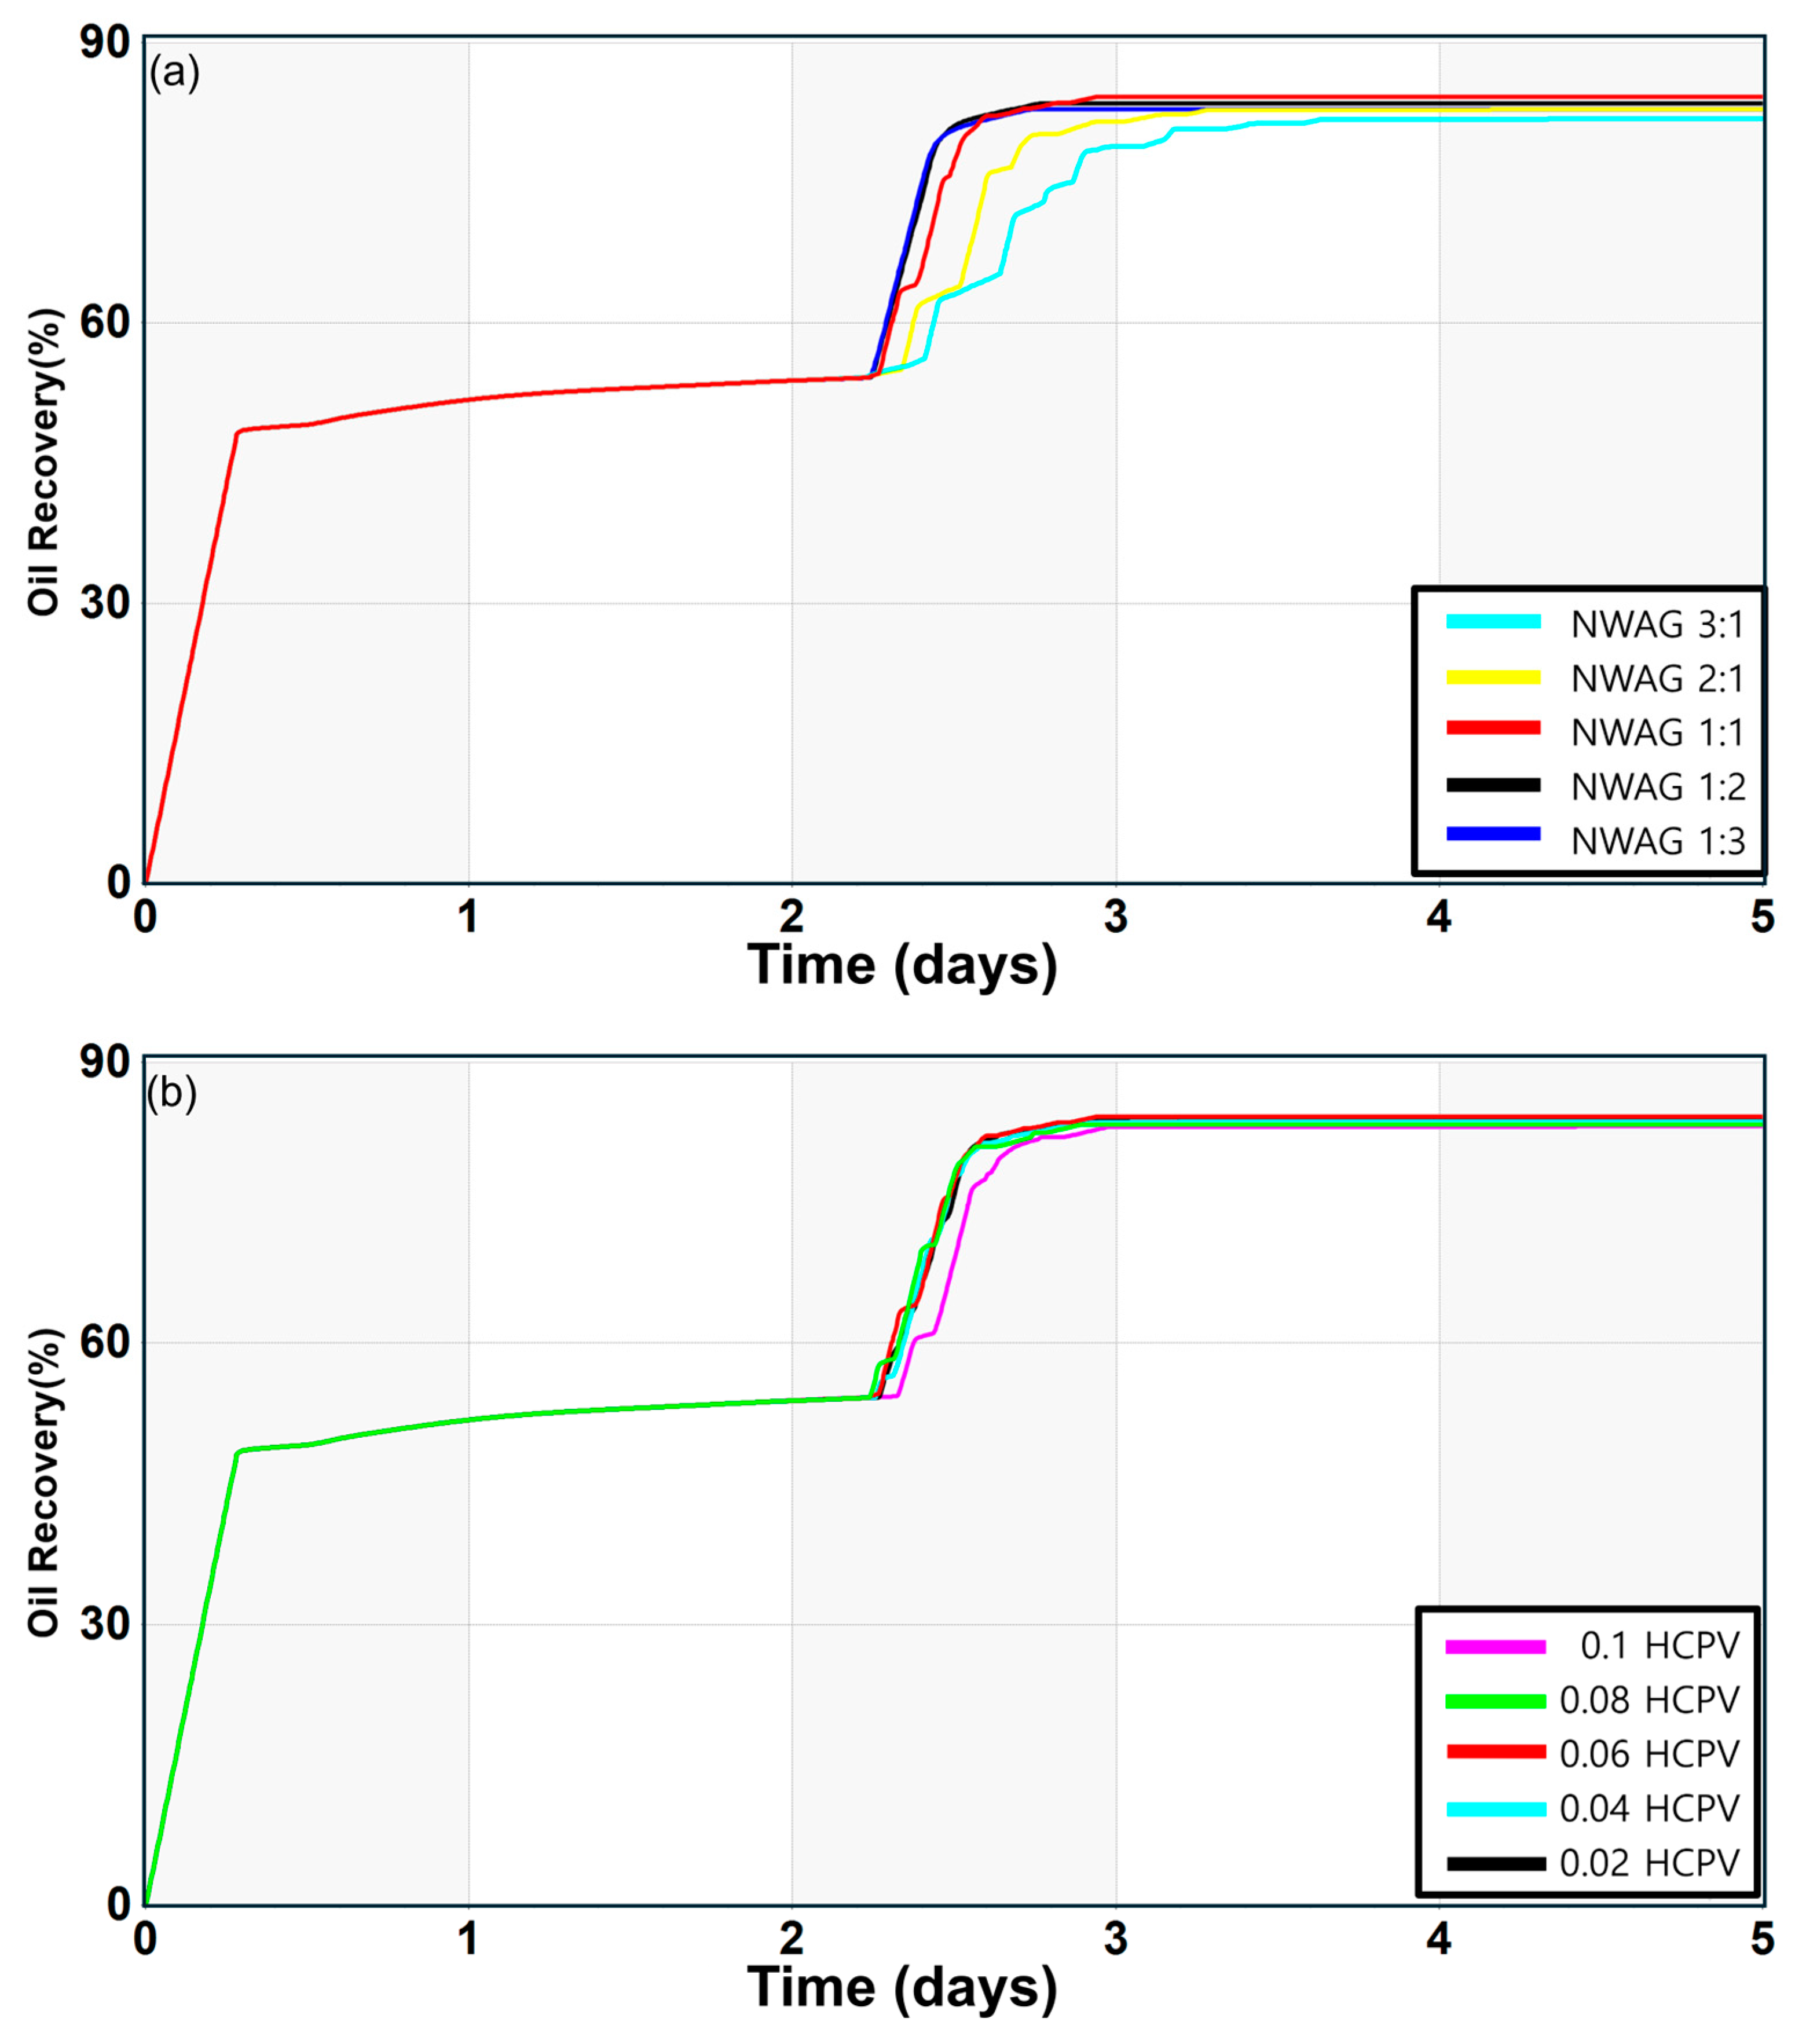
3.1. Results of 1D Simulations

From Figure 7, it is evident that nanofluids can enhance oil recovery and increase CO2 storage, leading to an improvement of over 5% in both oil production and CO2 storage compared to that in the conventional WAG process. The lowest oil recovery was achieved at a WAG ratio of 3:1, whereas the highest (81.86%) was observed at a WAG ratio of 1:1. An oil recovery of 84.23% was noted for a slug size of 0.02 PV in the 1:1 WAG ratio simulation.
CMOST was used to simulate the impact of the nanoparticle concentration on oil recovery. The effect of the wettability alteration by the implemented nanoparticle concentration shifted the critical gas saturation. As a result, oil-wet reservoirs were altered to water-wet reservoirs by applying a nanofluid, resulting in a 5% improvement in oil recovery at the nanofluid concentration of 0.85 wt.% compared with that in conventional WAG. These results confirm that a nanoparticle concentration increase results in a change in the relative permeability endpoint, thus improving oil recovery.
This study confirmed that controlling the WAG ratio, slug size, and nanoparticle concentration influences oil recovery. However, the simulation was conducted on a 1D core model that did not consider the inherent heterogeneity and hysteresis effects of carbonate rocks or nanoparticle adsorption on reservoir particles. Therefore, subsequent simulations were performed on a 3D model incorporating the unique heterogeneity and hysteresis effects of carbonate rocks.

3.2. Results of 3D Simulations

Figure 8 illustrates the relative gas permeability and gas saturation in the central grid block at (11, 11, 3) during NWAG. These parameters remained unchanged during the waterflooding. However, during NWAG, the maximum points alter relative gas permeability and gas saturation. Consequently, these variations result in subtle changes in the relative fluid permeability of the gas. In addition, the hysteresis effects impact the residual saturation of CO2, indicating that maximum points may affect the subsurface storage capacity of CO2 in the context of the NWAG method.
Figure 9 shows the adsorption capacity of SiO2 nanoparticles within the reservoir. Figure 9a illustrates the distribution of SiO2 injection, highlighting the high levels of nanoparticle adsorption concentrated around the injection well. Figure 9b displays the adsorption capacity of SiO2 nanoparticles following waterflooding, showing residual adsorption across most grid blocks. Based on the adsorption data, changes in the wettability were observed, which led to potential shifts in the relative fluid permeability. These shifts contribute to reduce the residual oil saturation, thereby enhancing additional oil recovery. Furthermore, the results indicate an increase in the saturation of water and gas, while excluding oil, thereby supporting the increase in the CO2 storage capacity, as previously discussed.

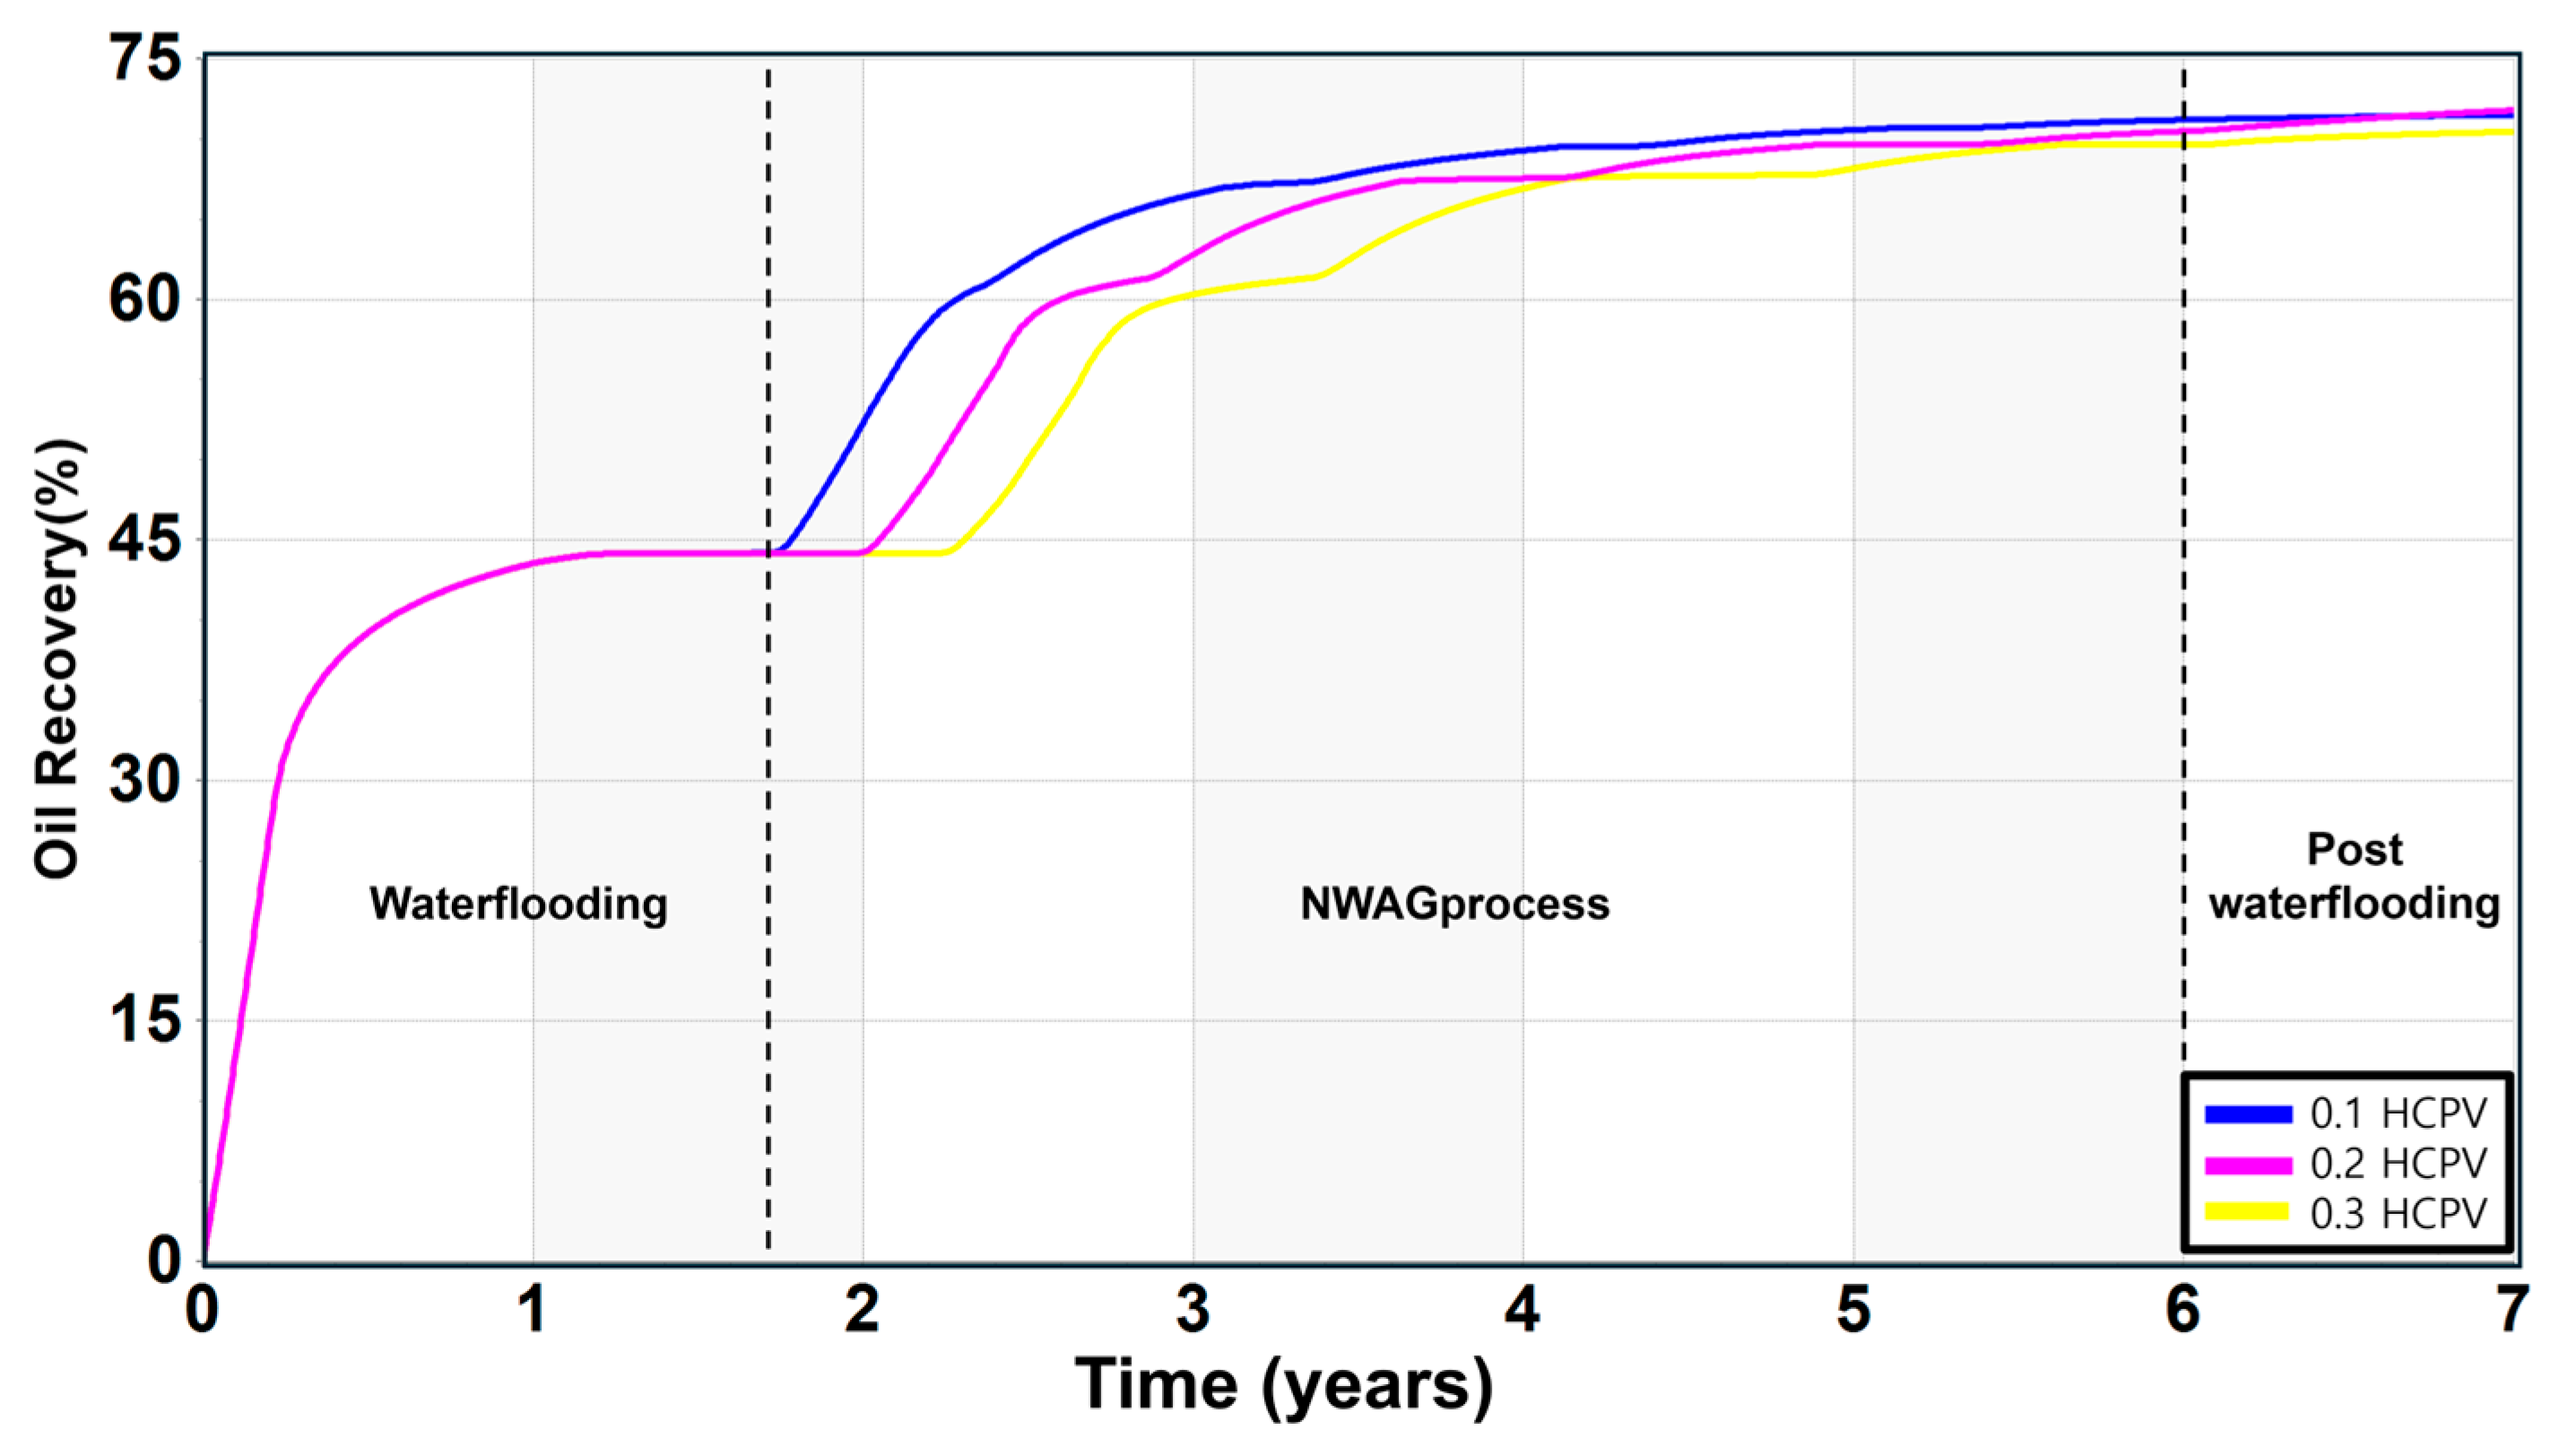
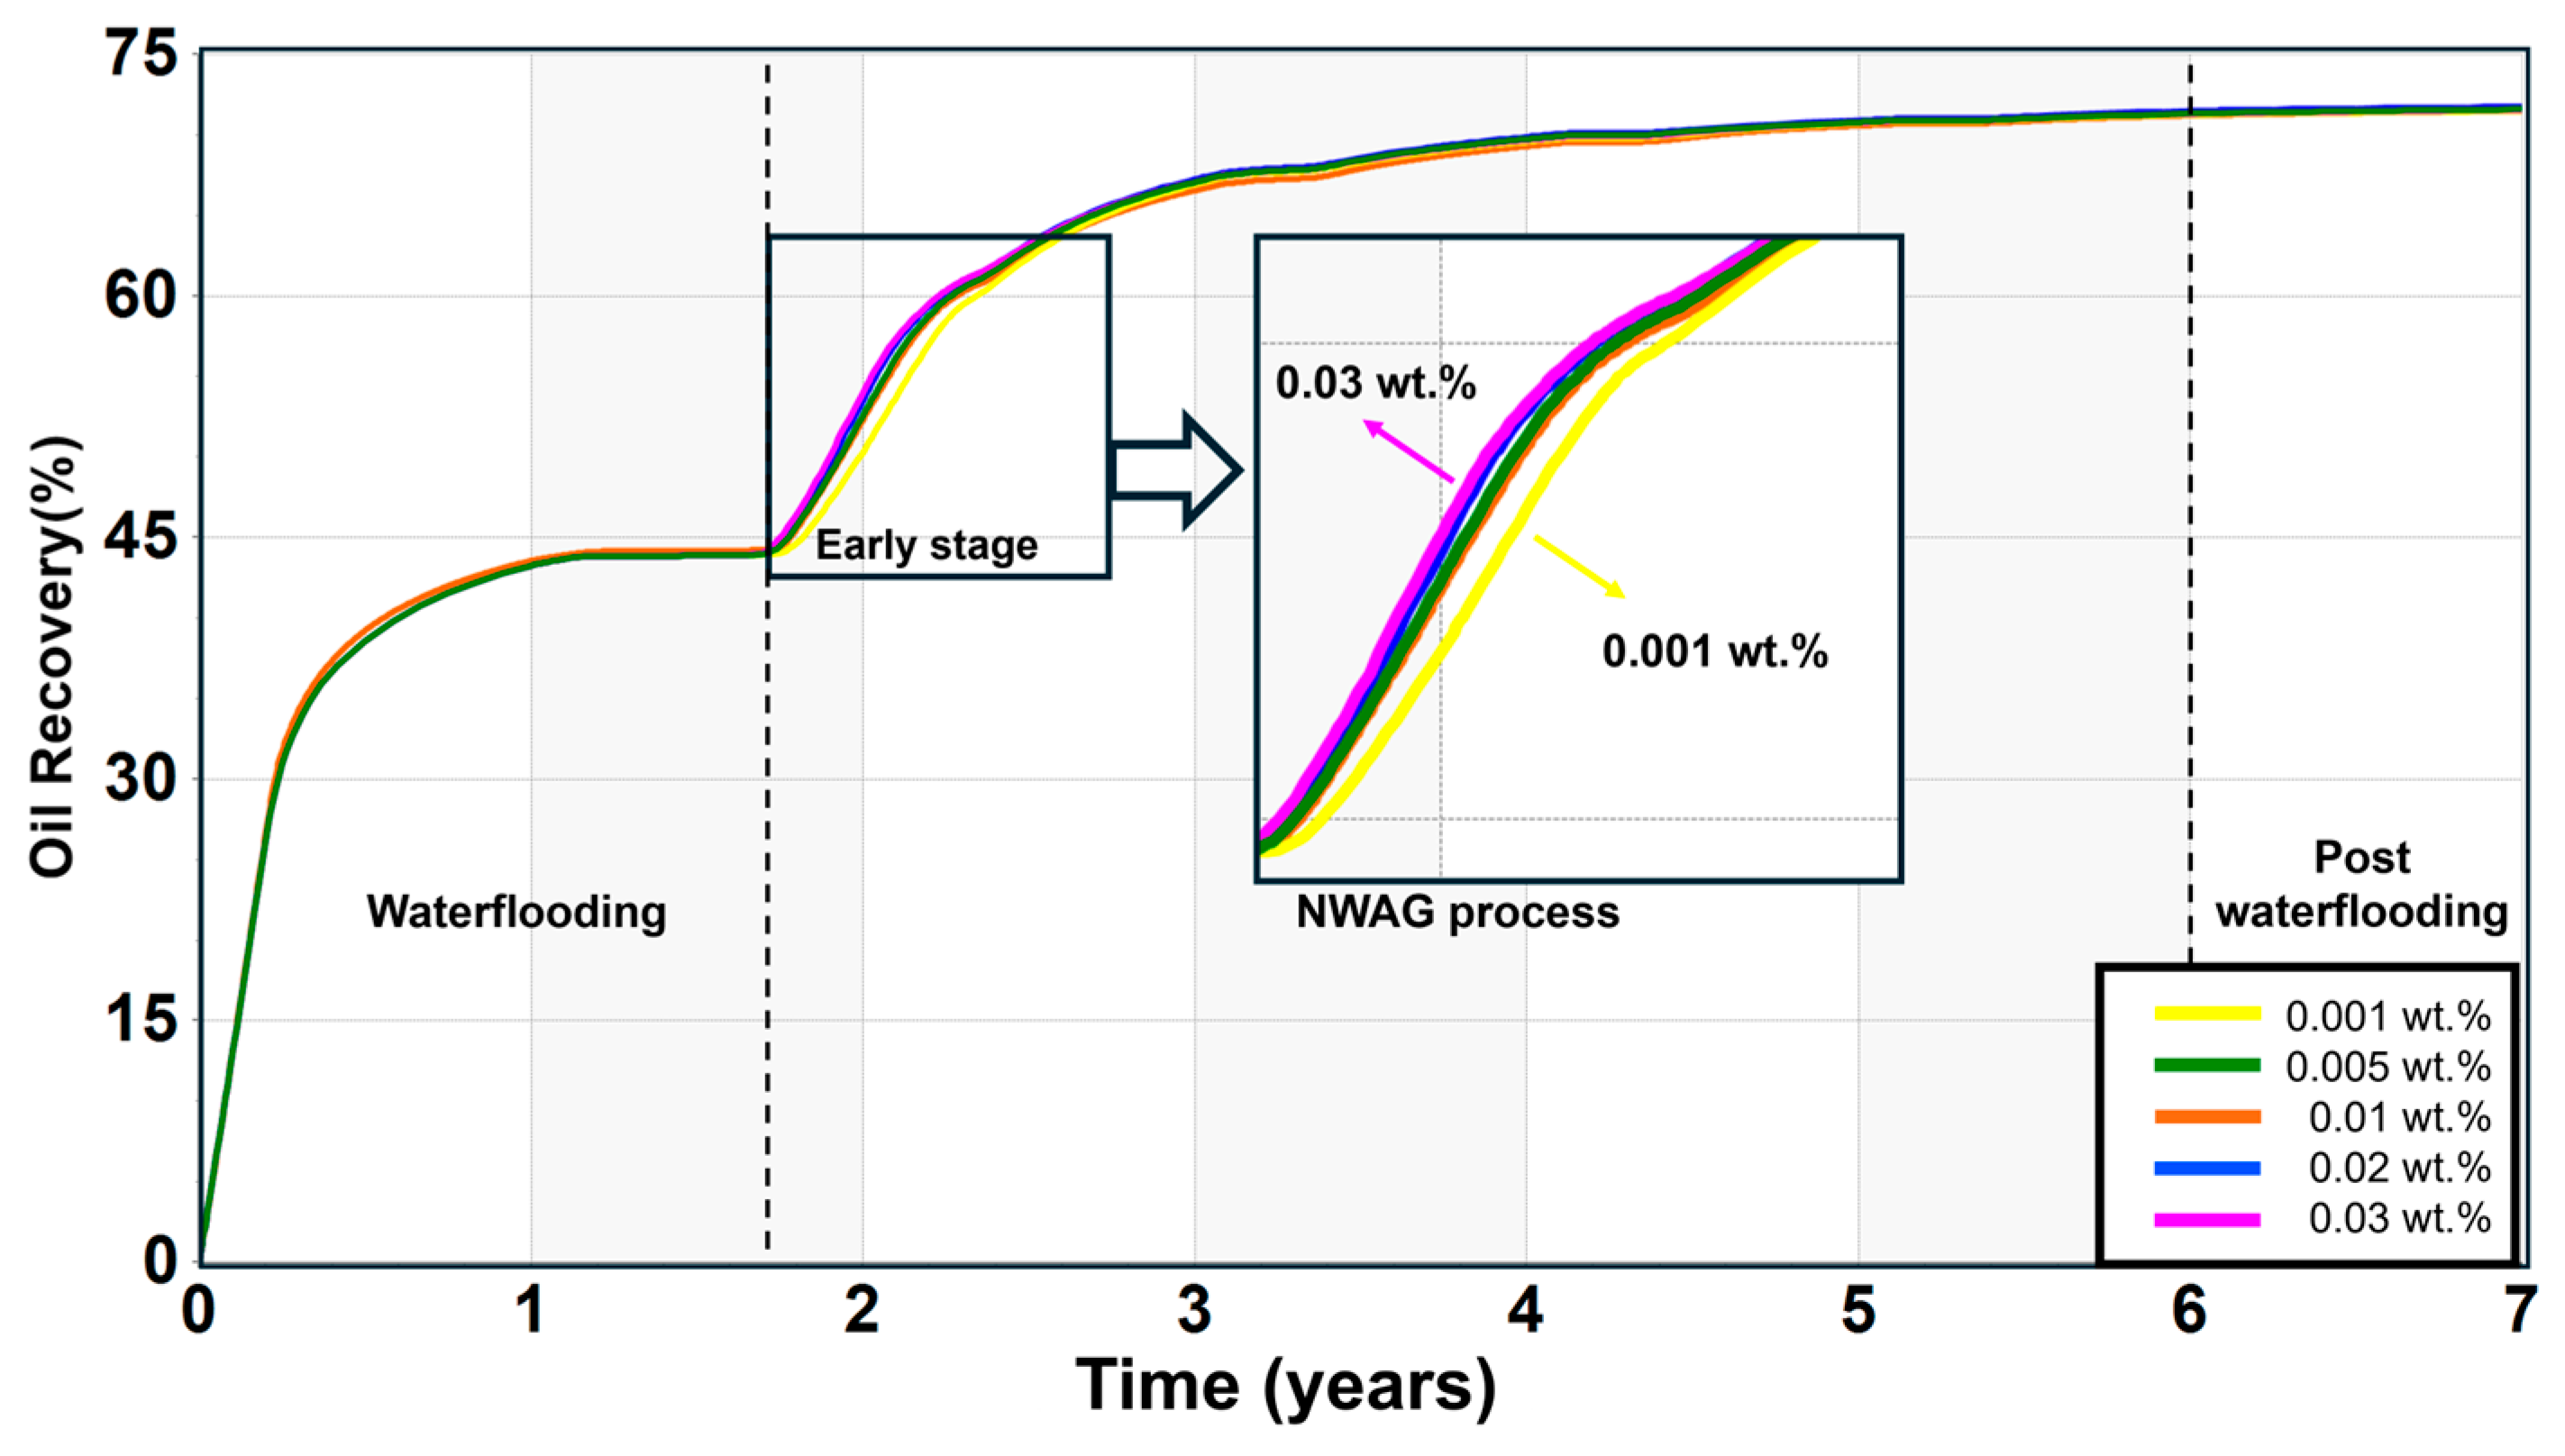
3.2.1. Results of Oil Recovery by NWAG

In the NWAG simulation, the effect of the WAG ratio, slug size, and nanoparticle concentration were examined sequentially. The WAG ratio had the greatest impact on oil recovery compared to the other factors, followed by slug size and nanoparticle concentration, based on previous studies [10,11,12]. These were adjusted in a specified order, and the scenario producing the best outcome was selected as the base case for a further analysis. Figure 10 shows the oil production and recovery rates relative to the NWAG ratio. The findings show the alternating injection of CO2 and nanofluids after one year of water injection, followed by post-waterflooding once the cycle was completed. Initially, a high production rate was sustained; however, it decreased after the water injection stopped. Subsequently, the NWAG implementation resulted in increased oil production, leading to a higher cumulative oil yield. The timing of SiO2 injection, based on the NWAG ratio, influences the point at which oil production increases, and this timing difference affects the final recovery rate. At an NWAG ratio of 3:1, the oil recovery rate peaked at 71.53%, which is approximately five percentage points higher than the lowest value of 66.7% at a ratio of 1:2. These results demonstrated the effect of the NWAG ratio on oil recovery.
Simulations were conducted using an NWAG ratio of 3:1, and the size of the slug was varied; results are illustrated in Figure 11. Different outcomes were explored by varying the CO2 ratio from 0.1 to 0.3 HCPV. After the injection phase, the oil recovery rate reached its peak at 71.85% with a slug size of 0.2 HCPV. However, a slug size of 0.1 HCPV was selected based on the superior initial production rate, resulting in the recovery rate of 71.53%. This suggests that, regardless of the CO2 injection volume, a higher SiO2 fluid injection effectively enhances the oil recovery rates. This can be attributed to the improvements in rock wettability and fluid mobility resulting from nanofluid injection properties.
Figure 12 shows the simulations conducted with an NWAG ratio of 3:1, utilizing a constant slug size of 0.1 and varying nanoparticle concentrations. The greatest increase in the initial production occurred at a nanoparticle concentration of 0.03 wt.%. In the early stage of simulation, higher nanoparticle concentrations cause increased oil production rates because the effect of nanoparticle adsorption on rock surfaces is more active than lower nanoparticle concentration. Over time, similar or comparable recovery rates were consistently observed. Because during the NWAG processes, nanoparticle adsorption attained maximum capacity, oil recovery at the end of simulation is therefore similar in each simulation. Therefore, in the later stages of the process, marginally better oil recovery was observed at lower nanoparticle concentrations. Despite the slower onset of oil recovery effects at lower concentrations owing to adsorption dynamics, these concentrations, which are characterized by a relatively low density, suggest an expanded adsorption area within the reservoir. Even in scenarios where the initial oil recovery rates are favorable, assessing the economic implications of increasing nanoparticle concentrations is crucial. Therefore, further economic evaluations are necessary to facilitate informed decisions regarding factors such as nanoparticle concentration.

3.2.2. Results of CO2 Storage by NWAG

The simulation model categorized CO2 storage into three primary mechanisms, structural, residual, and solution forms, with a focus on structural and residual storage. The solution-phase changes in CO2 were not included in the analysis. The total amount of stored CO2 was calculated by subtracting the produced CO2 from the injected amount, and the stored quantity was evaluated based on the specific parameters applied in each method. Figure 13 illustrates the cumulative injected CO2 amount based on various WAG ratios, highlighting the variability in the total CO2 injection and its impact on the storage capacity. The WAG ratio significantly influenced CO2 storage, with a peak observed at a specific ratio. Notably, the 1:2 WAG ratio resulted in a higher amount of injected CO2 than the nanofluid. A slug size of 0.1 HCPV exhibited the highest storage capacity at 11,318 tons.
Alternate injection cycles enhanced CO2 storage, indicating increased residual CO2 saturation and water volume, suggesting the possibility of a soluble CO2 phase. Nanoparticle concentration also affected the CO2 storage capacity, which increased at higher concentrations. The reservoir pressure increased due to the high-density fluid injection. Nanoparticles adsorb onto the rock surface through mass transfer; however, once the rock surface reaches its maximum adsorption capacity, the remaining nanoparticles contribute to an increase in reservoir pressure. Therefore, with the same volume of CO2 injected into the reservoir, higher pressure allows for more CO2 to be trapped. And SiO2 nanoparticle adsorption changed the contact angle of the rock surface, which altered wettability and relative fluid permeability. It was attributed to the critical gas saturation influence [21,22]. The critical gas saturation increased as the concentration of the injected outgassing particles increased owing to a change in the wetting phase. Moreover, nanoparticles reduce CO2–oil minimum miscibility pressure (MMP) [23]. An increased nanoparticle concentration caused more CO2 dissolution in the oil. The mechanism of CO2 dissolving in oil is similar to that of solubility trapping in carbon capture and storage.
In conclusion, optimal conditions for expanding CO2 storage were observed at a WAG ratio of 1:2, a slug size of 0.1 HCPV, and higher nanoparticle concentrations at 11,397 tons, as shown in Figure 13. These findings highlight the influence of the hysteresis effect, such as critical saturation changes that significantly impact the CO2 storage capacity, and underscore the role of nanoparticle concentration in enhancing residual CO2 retention. Rahmatmand et al. [24] confirmed the adsorption of CO2 onto nanoparticles when injecting SiO2 nanoparticles. It is expected that the difference in CO2 storage due to the increase in nanoparticle concentration will be even greater if future studies consider the adsorption of CO2 onto SiO2.

4. Conclusions

In this study, the efficiency of the NWAG method, which utilizes nanofluids in CO2-EOR processes to recover oil and store CO2 simultaneously, was investigated. Various influencing factors were identified and used to establish the injection scenarios for the comparison and analysis. The objective was to determine the optimal conditions for maximizing oil recovery rates and CO2 storage capacity. The following conclusions were drawn:
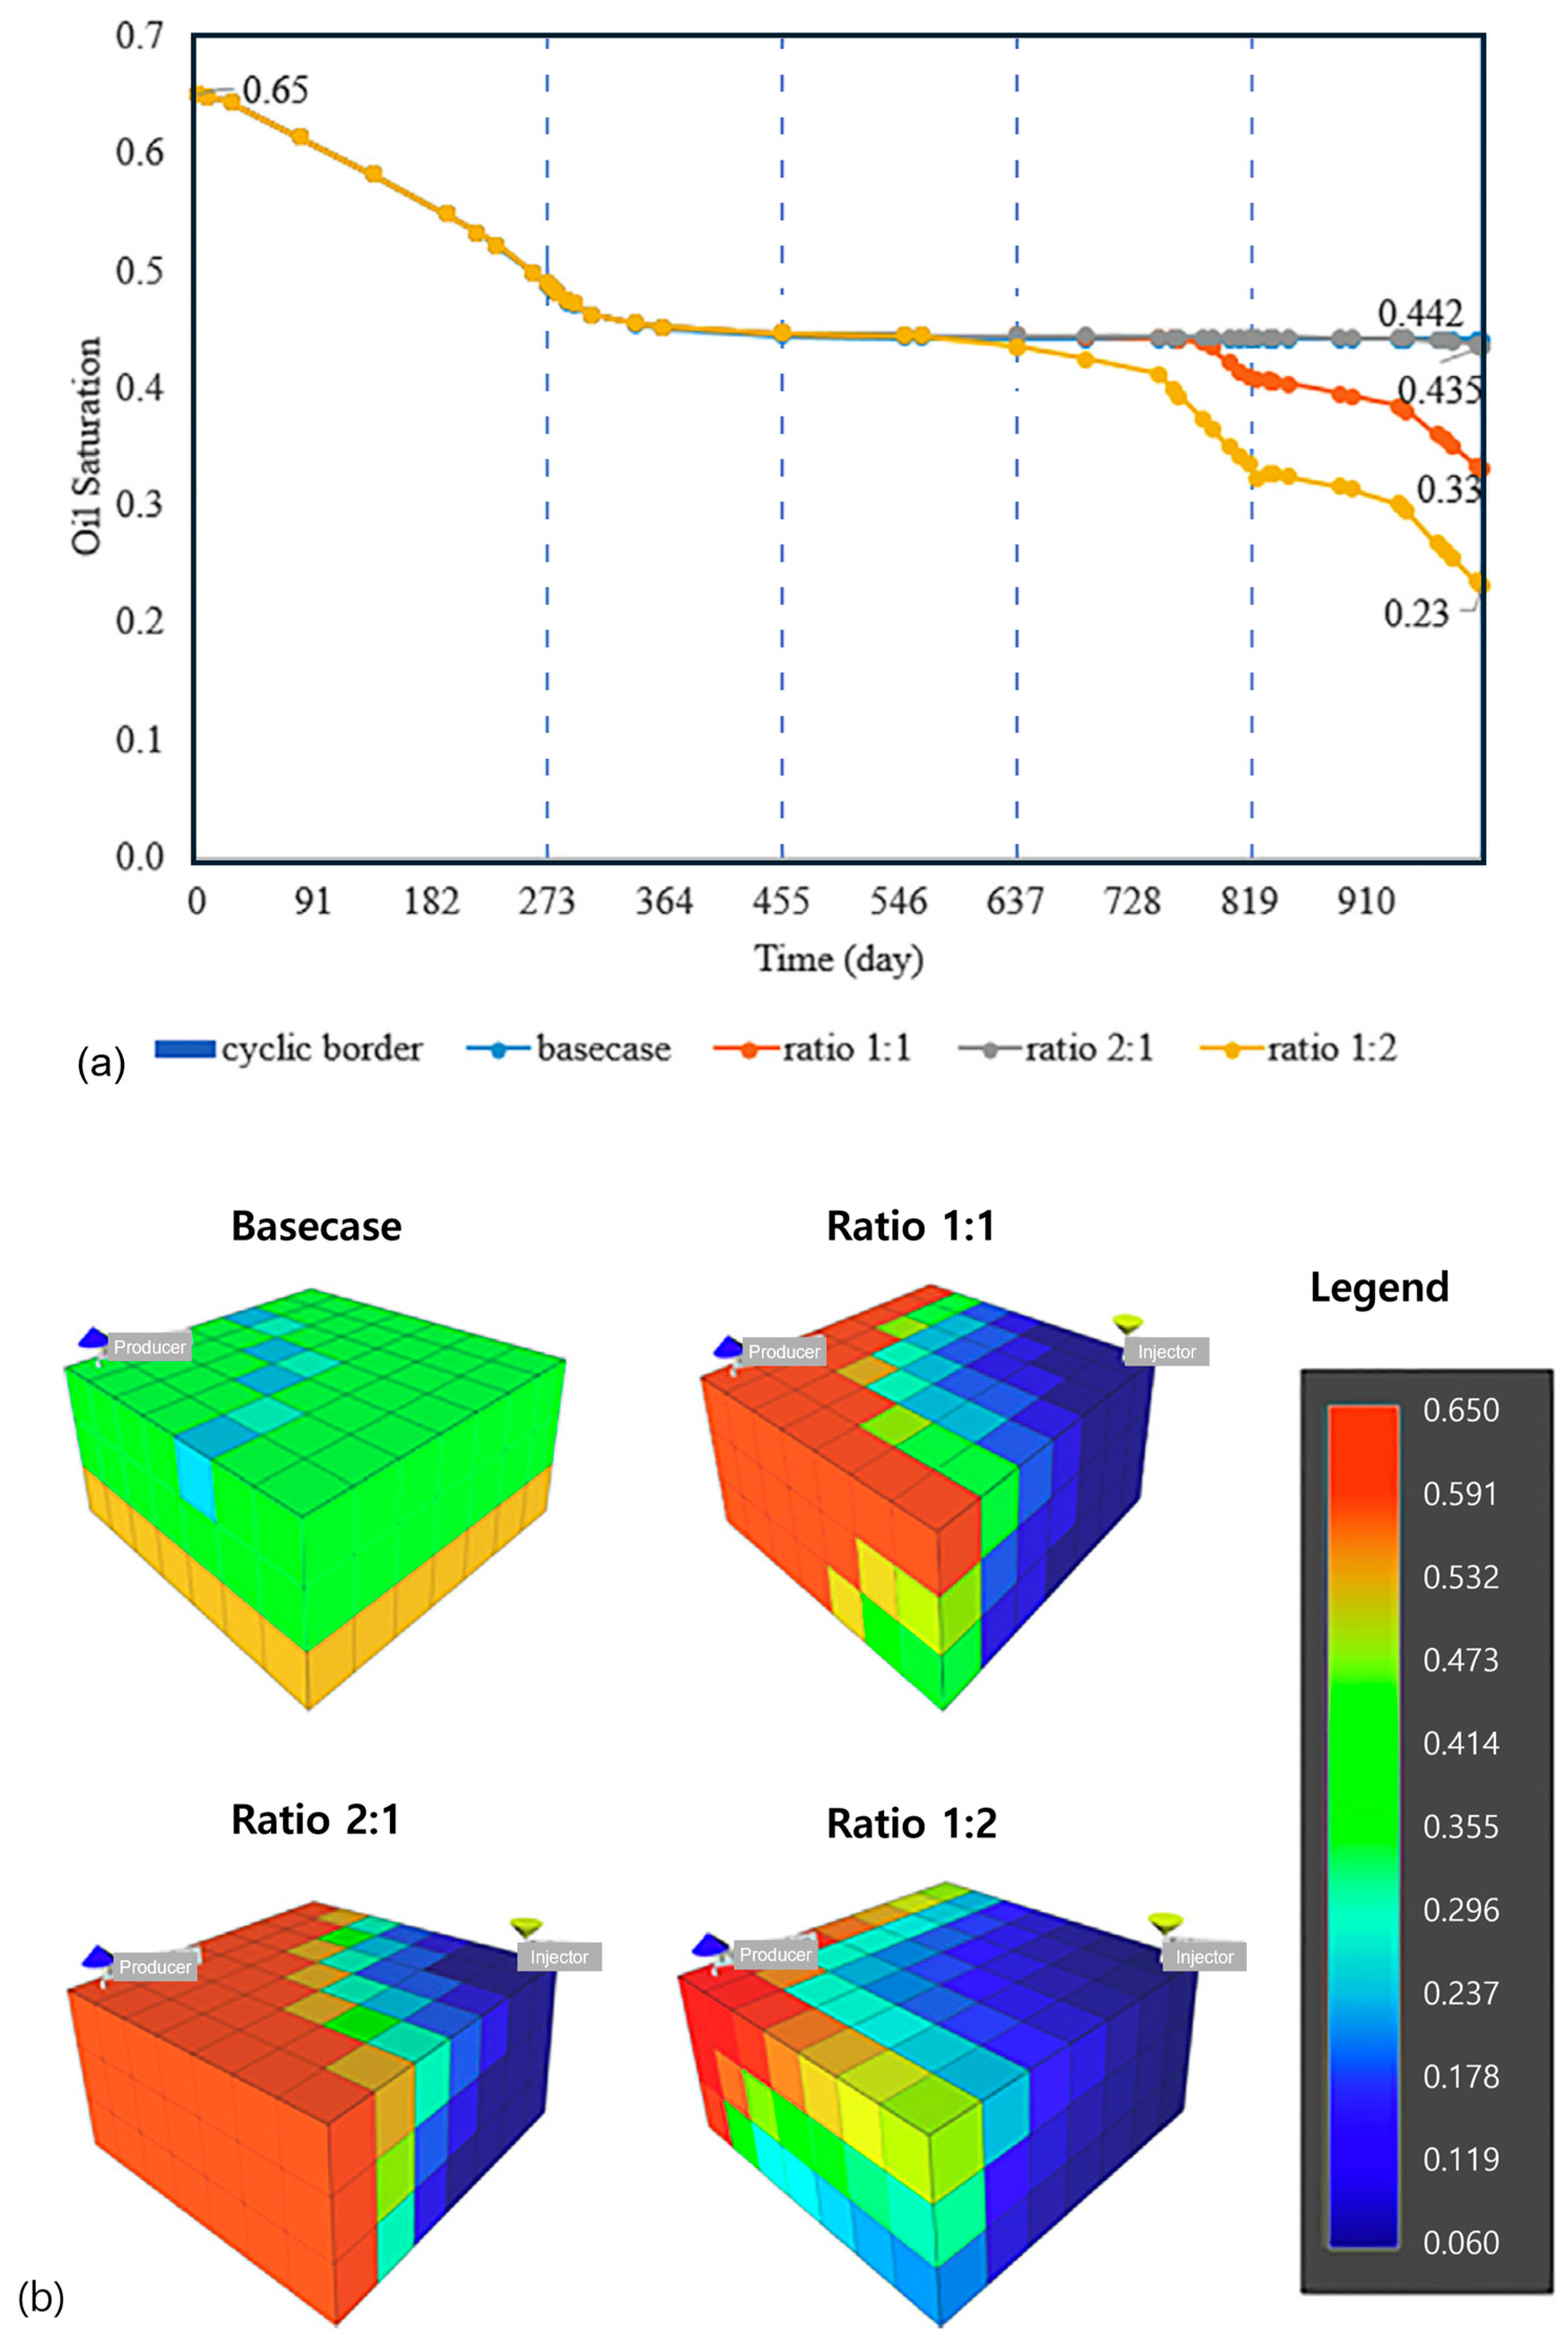
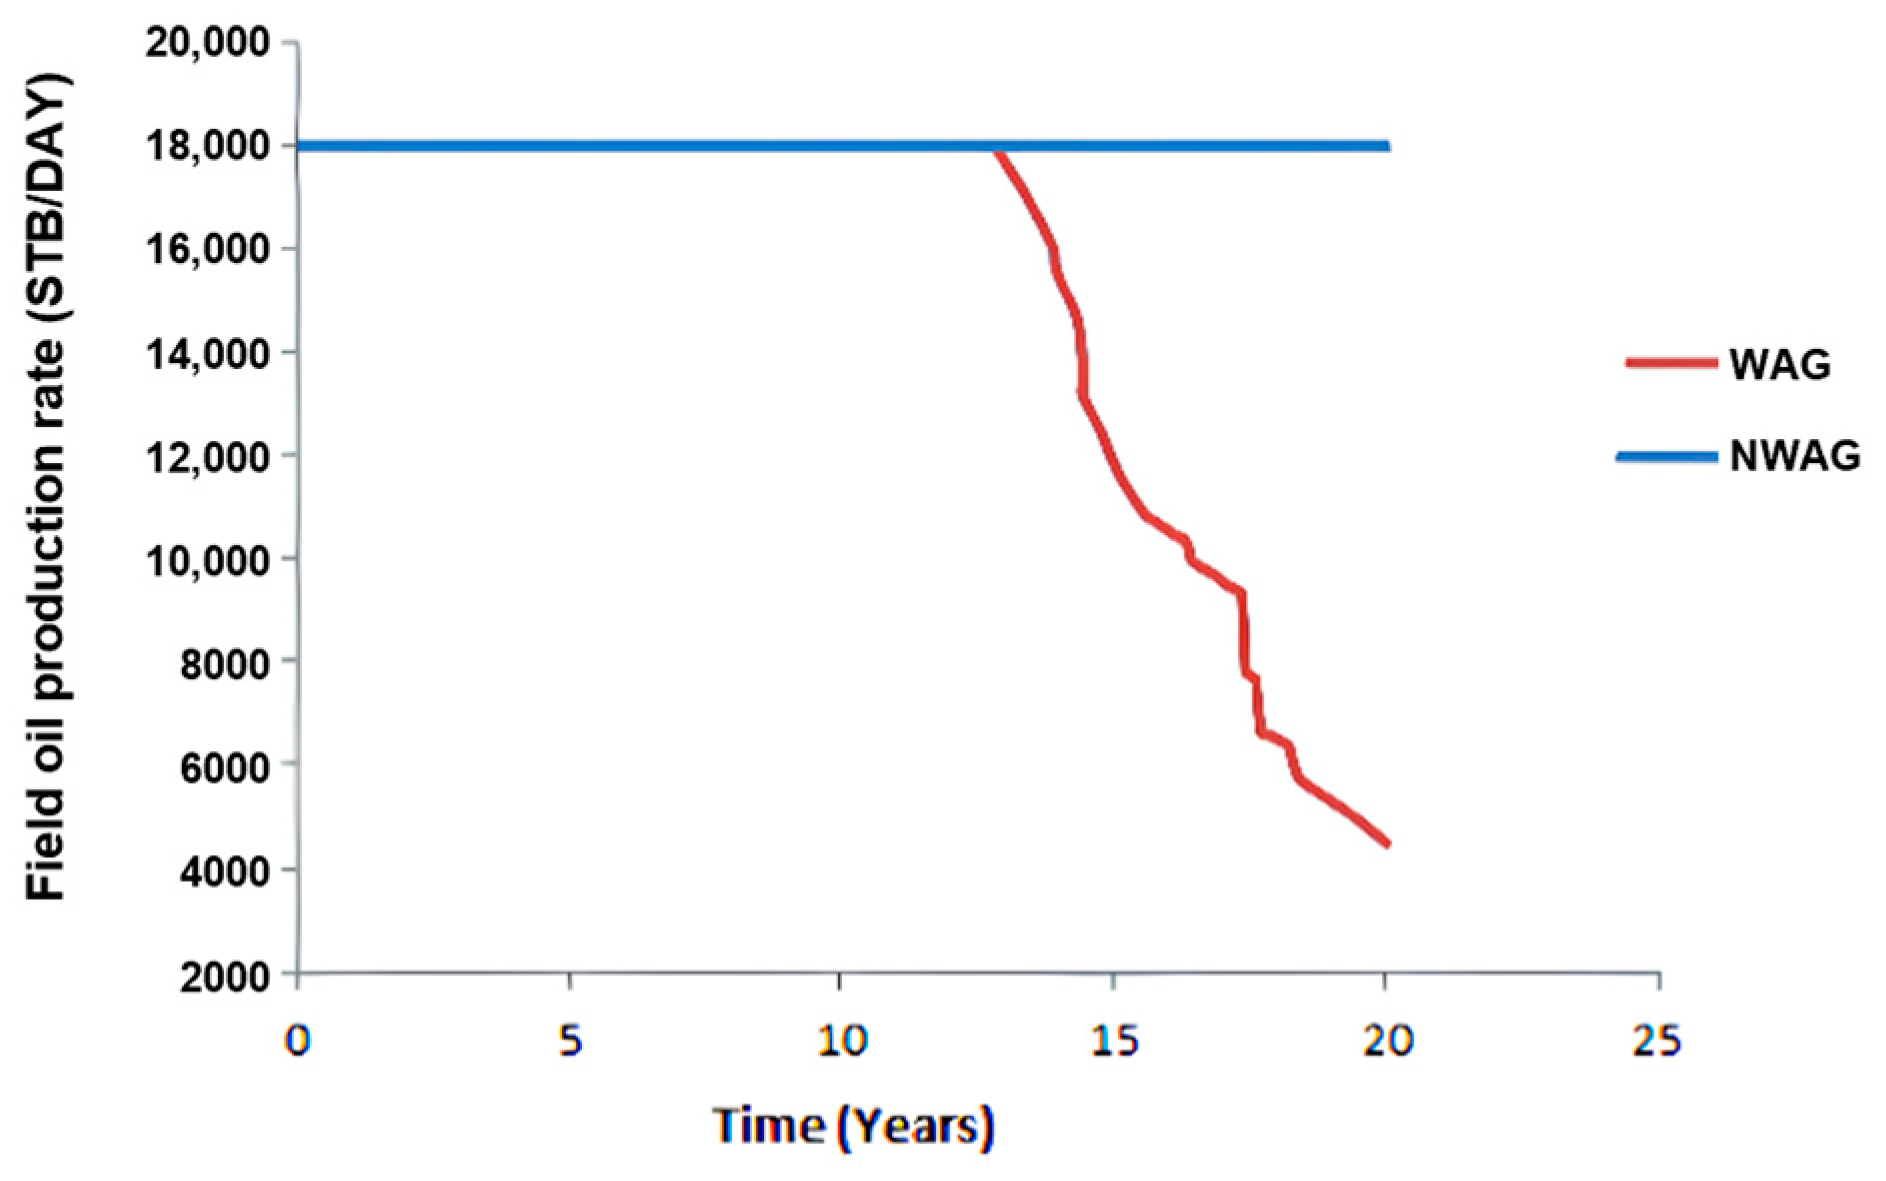
  • The 1D core models based in CMG-GEM were simulated to evaluate the applicability of the NWAG method, and 1D core models based on CMG-GEM were simulated. Sensitivity analyses were conducted on the factors influencing WAG, followed by the incorporation of the effects of nanoparticles on wettability improvement and absolute permeability reduction using CMOST. The results confirmed that applying the NWAG method enhanced both oil recovery and CO2 storage efficiency.
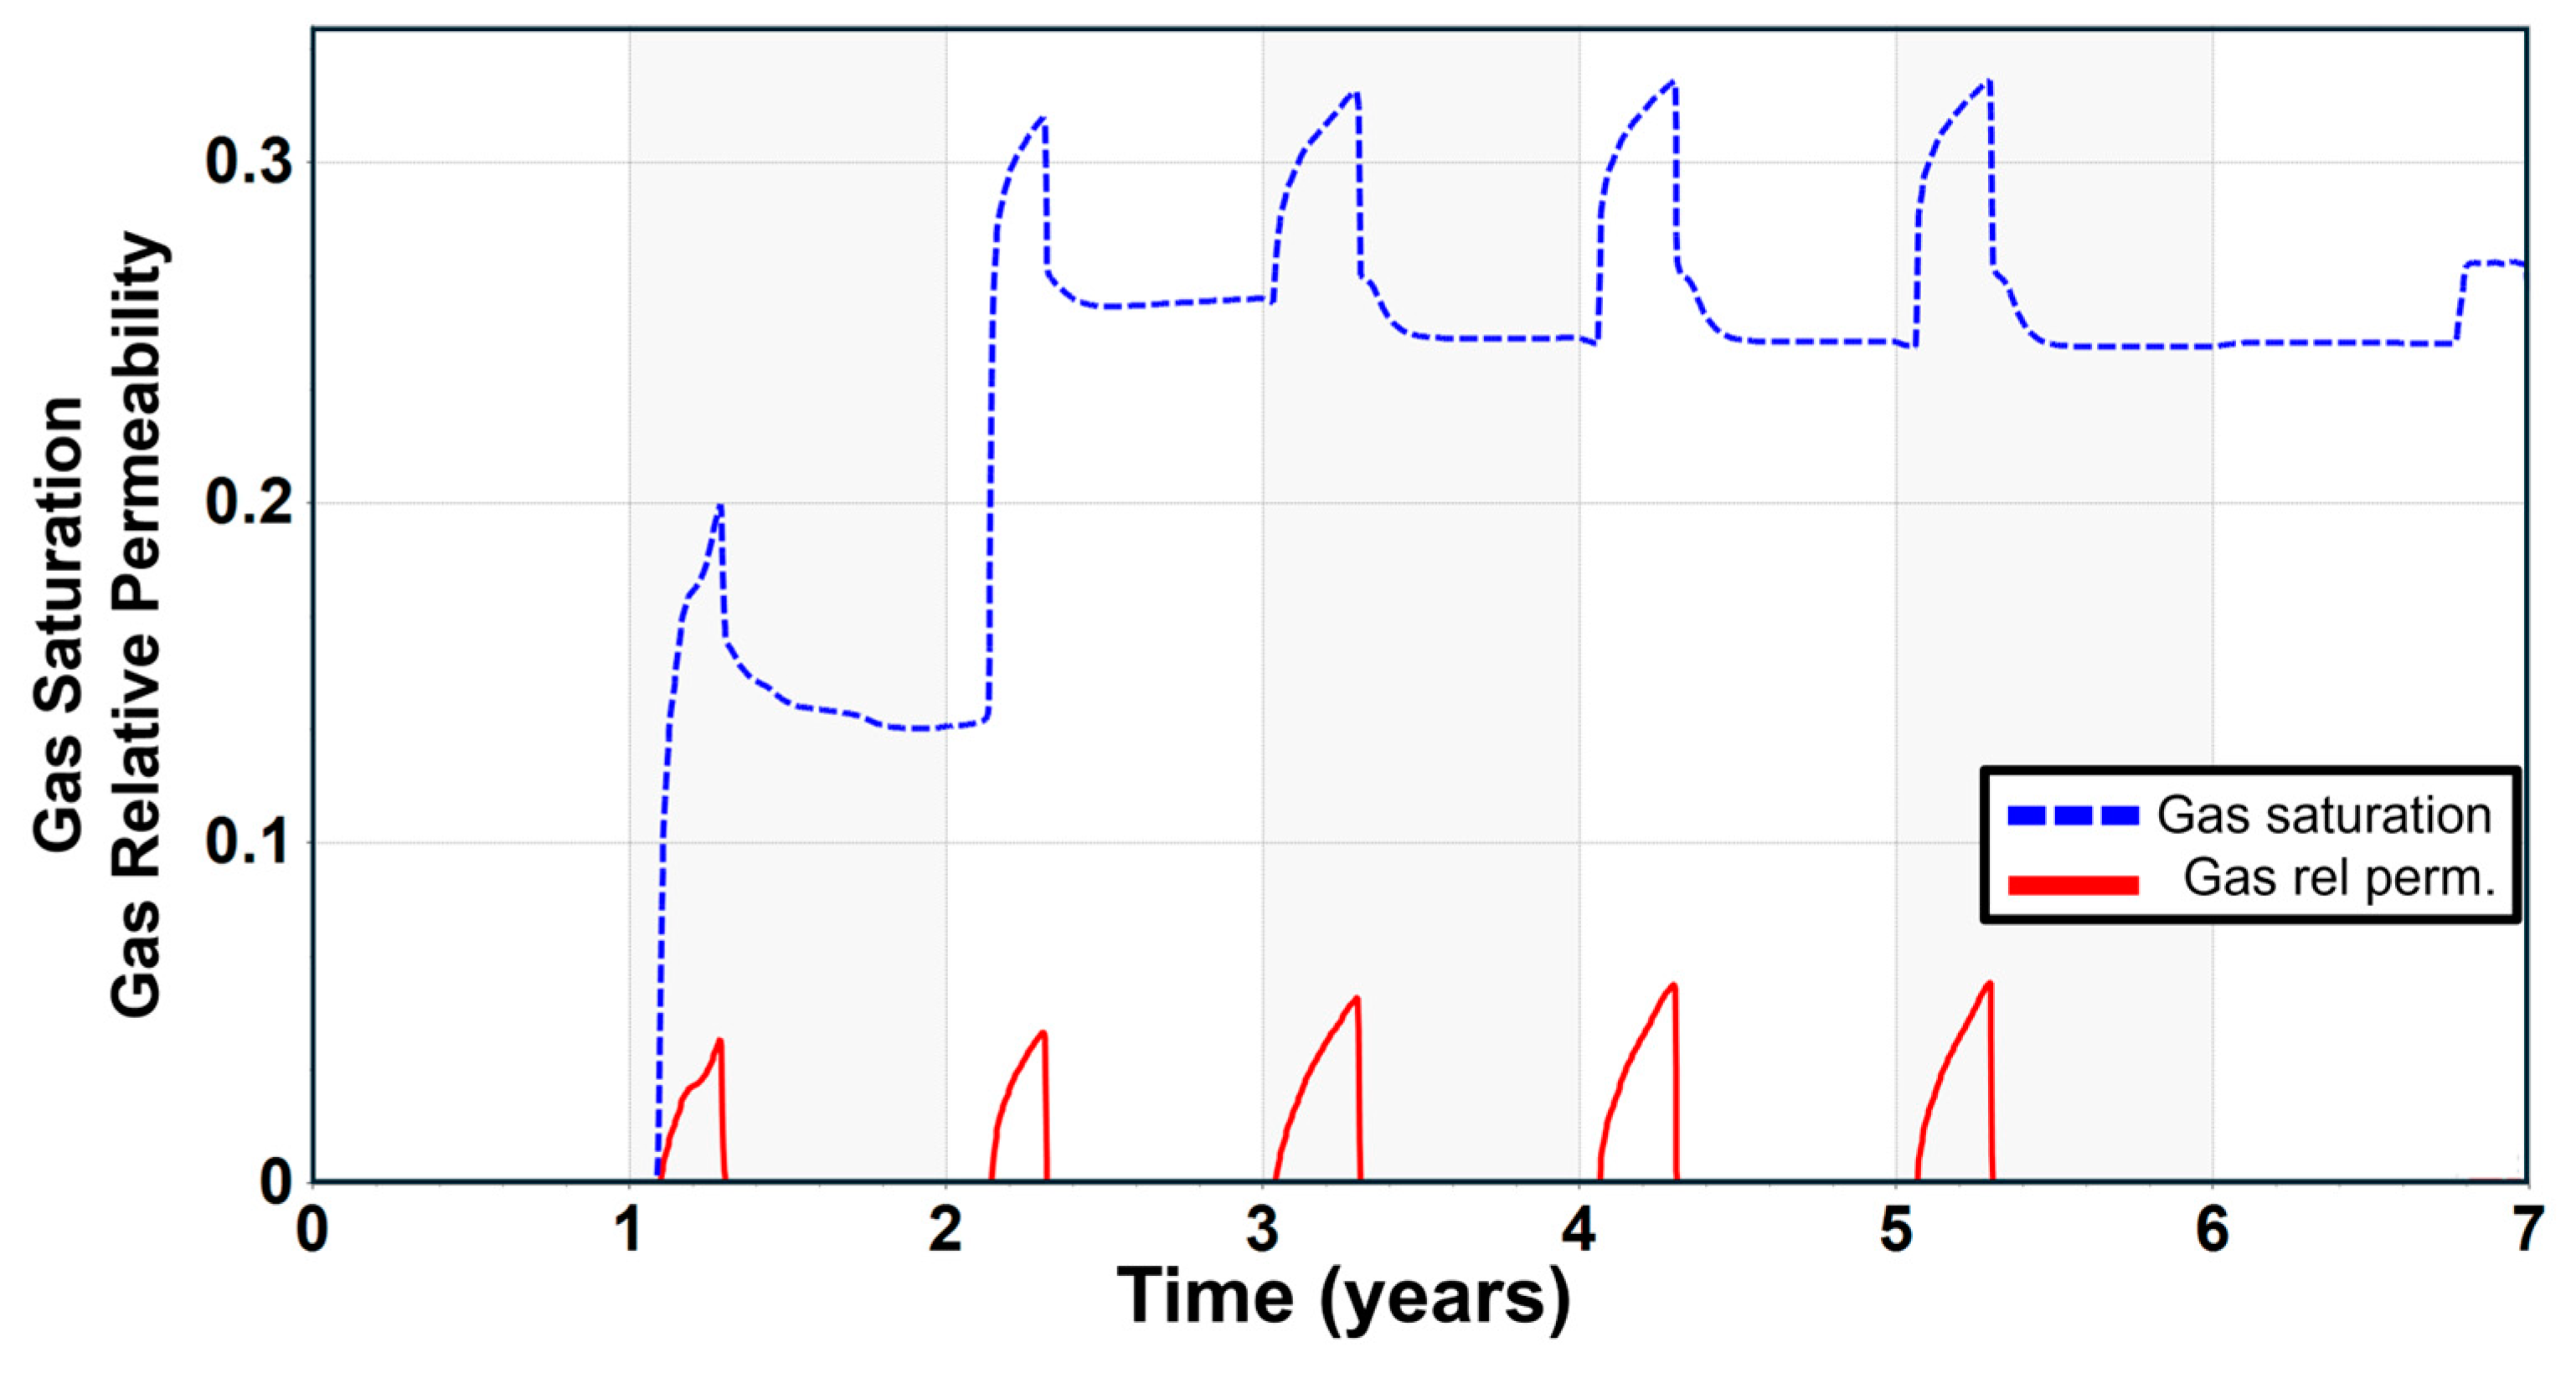
  • To construct a 3D reservoir model, a Dykstra–Parsons coefficient of 0.4 was set for heterogeneity, and Carlson’s relative permeability curve with a gas saturation threshold of 0.3 was applied to incorporate history matching. Applying the NWAG method to the 3D model considering heterogeneity and history matching yielded results for oil recovery and CO2 storage capacity based on each influencing factor.
  • The optimal conditions for oil recovery were determined to be an NWAG ratio of 3:1, slug size of 0.1 HCPV, and SiO2 mole fraction of 0.001, achieving approximately 71.8% oil recovery. Optimal CO2 storage conditions were found with an NWAG ratio of 1:2, slug size of 0.1 HCPV, and SiO2 mole fraction of 0.03, resulting in 11,397 tons of CO2 storage.
  • Increasing the SiO2 concentration rapidly increased oil recovery in the initial stages. Therefore, using a higher concentration of nanofluids can initially lead to quick oil recovery, whereas a lower concentration of nanofluids expands the adsorption area, resulting in long-term effectiveness. CO2 storage tended to plateau after reaching a certain range. Additionally, higher nanoparticle concentrations were found to increase the reservoir pressure and alter the wettability, thereby enhancing the CO2 storage effectiveness.

Author Contributions

S.K.: Conceptualization, Writing—original draft, Visualization, Validation. H.P.: Conceptualization, Writing—original draft, Validation. H.J.: Supervision, Writing—review and editing, Validation. All authors have read and agreed to the published version of the manuscript.

Funding

This work was supported by the Energy and Mineral Resources Development Association of Korea (EMRD) grant funded by the Korea government (MOTIE) (2021060001, Data science-based oil/gas exploration consortium) and (2) the Korea Institute of Energy Technology Evaluation and Planning (KETEP) and the Ministry of Trade, Industry and Energy (MOTIE) of the Republic of Korea (No. 20224000000080).

Data Availability Statement

Data will be made available on request.

Conflicts of Interest

The authors declare that they have no known competing financial interests or personal relationships that could have appeared to influence the work reported in this paper.

Abbreviations

APIAmerican Petroleum Institute
CMGComputer modeling group
EOREnhanced oil recovery
HCPVHydrocarbon pore volume
NWAGNano-water-alternating gas
OOIPOriginal oil in place
PR-EOSPeng–Robinson equation of state
WAGWater-alternating gas
WOCWater oil contact
SNPSilica nanoparticle

References

  1. Shokufe, A.; Nima, R.; Sohrab, Z. A comprehensive review on Enhanced Oil Recovery by Water Alternating. Fuel 2018, 227, 216–246. [Google Scholar] [CrossRef]
  2. Jang, H.C.; Ko, S.M.; Park, H.R. Novel WAG Method with Nanotechnology in a Heterogeneous Carbonate Reservoir. In Proceedings of the SPE EOR Conference at Oil and Gas West Asia, Muscat, Oman, 22–24 April 2024. [Google Scholar]
  3. Stern, D. Mechanisms of Miscible Oil Recovery: Effects of Pore-Level Fluid Distribution. In Proceedings of the SPE Annual Technical Conference and Exhibition, Dallas, TX, USA, 5–9 October 1991. [Google Scholar] [CrossRef]
  4. Vladimir, V.; Baghir, S.; Ahmad, S.; Eldar, Z. Primer on Enhanced oil Recovery; Gulf Professional Publishing: Houston, TX, USA, 2020; pp. 53–63. [Google Scholar] [CrossRef]
  5. Jia, B.; Tsau, J.; Barati, R. A review of the current progress of CO2 injection EOR and carbon storage in shale oil reservoirs. Fuel 2019, 236, 404–427. [Google Scholar] [CrossRef]
  6. Jang, H.; Lee, W.S.; Lee, J. Performance evaluation of surface-modified silica nanoparticles for enhanced oil recovery in carbonate reservoirs. Colloids Surf. A Physicochem. Eng. Asp. 2024, 681, 132784. [Google Scholar] [CrossRef]
  7. Xiao, H.; Amir, Z.; Mohd Junaidi, M.U. Development of Microbial Consortium and Its Influencing Factors for Enhanced Oil Recovery after Polymer Flooding: A Review. Processes 2023, 11, 2853. [Google Scholar] [CrossRef]
  8. Kapanichuk, I.V.; Vanin, A.A.; Brodskaya, V.N. Disjoining pressure and structure of a fluid confined between nanoscale surface. Colloids Surf. A Physicochem. Eng. Asp. 2017, 527, 42–48. [Google Scholar] [CrossRef]
  9. Han, B.; Lee, J. Investigation on the Technical Characteristics and Field Cases of CO2 Enhanced Oil recovery. J. Korean Soc. Miner. Energy Resour. Eng. 2014, 51, 597–609. [Google Scholar] [CrossRef]
  10. Pancholi, S.; Negi, G.S.; Agarwal, J.R.; Bera, A.; Shah, M. Experimental and simulation studies for optimization of water-alternation-gas (CO2) flooding for enhanced oil recovery. Pet. Res. 2020, 5, 227–234. [Google Scholar] [CrossRef]
  11. Abdurrahman, M.; Hidayat, F.; Husna, U.Z.; Arsad, A. Determination of optimum CO2 water alternating gas (CO2-WAG) ratio in Sumatera Light Oilfield. Mater. Today Proc. 2021, 39, 970–974. [Google Scholar] [CrossRef]
  12. Al Matroushi, M.; Pourafshary, P.; Al Wahaibi, Y. Possibility of Nanofluid/Gas Alternating Injection as an EOR Method in an Oil Field. In Proceedings of the Abu Dhabi International Petroleum Exhibition and Conference, Abu Dhabi, United Arab Emirates, 9–12 November 2015. [Google Scholar] [CrossRef]
  13. Øyvind, E.; Tore, F.; Eldri, S.; Arthur, R.; Martin, F. Nanoparticle Stabilized Foam in Harsh Conditions for CO2 EOR. In Proceedings of the Abu Dhabi International Petroleum Exhibition and Conference, Abu Dhabi, United Arab Emirates, 12–15 November 2018. [Google Scholar] [CrossRef]
  14. Cao, C.; Song, Z.; Su, S.; Tang, Z.; Xie, Z.; Chang, X.; Shen, P. Water-Based Nanofluid-Alternating-CO2 Injection for Enhancing Heavy Oil Recovery: Considering oil-nanofluid emulsification. J. Pet. Sci. Eng. 2021, 205, 108934. [Google Scholar] [CrossRef]
  15. Sribastaba, R.K.; Huang, S.S.; Dong, D. Laboratory Investigation of Weyburn CO2 Miscible Flooding. J. Can. Pet. Technol. 2000, 39, PETSOC-00-02-04. [Google Scholar] [CrossRef]
  16. Lee, H.-S.; Cho, J.; Lee, Y.-W.; Lee, K.-S. Compositional Modeling of Impure CO2 Injection for Enhanced Oil Recovery and CO2 Storage. Appl. Sci. 2021, 11, 7907. [Google Scholar] [CrossRef]
  17. Choi, Y. Economic Analysis of Enhanced Oil Recovery and Carbon Storage for DME-Impure CO2 Injection to Heterogeneous Reservoir. Master’s Thesis, Hanyang University, Seoul, Republic of Korea, February 2024. [Google Scholar]
  18. Afzli, S.; Ghamartale, A.; Rezaei, N.; Zendeboudi, S. Mathematical modeling and simulation of water-alternating-gas(WAG) process by incorporating capillary pressure and hysteresis effect. Fuel 2020, 263, 116362. [Google Scholar] [CrossRef]
  19. Carlson, F.M. Simulation of Relative Permeability Hysteresis to the Nonwetting Phase. In Proceedings of the SPE Annual Technical Conference and Exhibition, San Antonio, TX, USA, 4–7 October 1981. [Google Scholar] [CrossRef]
  20. Chen, Y.; Wu, S.; Zhou, D.; Chawathe, A. Impact of Relative Permeability Hysteresis on Water-Alternating-GAS WAG Injectivity: Modeling and Experimental Study. In Proceedings of the SPE Annual Technical Conference and Exhibition, San Antonio, TX, USA, 9–11 October 2017. [Google Scholar]
  21. Al-Anssari, S.; Wang, S.; Barifcani, A.; Lebedev, M.; Iglauer, S. Effect of temperature and SiO2 nanoparticle size on wettability alteration of oil-wet calcite. Fuel 2017, 206, 34–42. [Google Scholar] [CrossRef]
  22. Rahman, T.; Lebedev, M.; Barifcani, A.; Iglauer, S. Residual trapping of supercritical CO2 in oil-wet sandstone. J. Colloid Interface Sci. 2016, 469, 63–68. [Google Scholar] [CrossRef] [PubMed]
  23. Wang, Z.; Liu, T.; Liu, S.; Jia, S.; Yao, J.; Sun, H.; Yang, Y.; Zhang, L.; Delshad, M.; Sepehrnoori, K.; et al. Adsorption effects on CO2-oil minimum miscibility pressure in tight reservoirs. Energy 2024, 288, 129815. [Google Scholar] [CrossRef]
  24. Rahmatmand, B.; Keshavars, P.; Ayatollahi, S. Study of Absorption Enhancement of CO2 by SiO2, Al2O3, CNT, and Fe3O4 Nanoparticles in Water and Amine Solutions. J. Chem. Eng. Data 2016, 61, 1378–1387. [Google Scholar] [CrossRef]
Figure 1. Effect of wettability alteration on oil recovery [7].
Energies 17 04846 g001
Figure 2. Effects of oil saturation by WAG ratio: (a) comparison of oil saturation by WAG ratio in the graph, (b) comparison of oil saturation by WAG ratio using 3-D models [12], Materials Today: Proceedings; published by Elsevier in 2021.
Energies 17 04846 g002
Figure 3. Comparison of oil production rate for WAG and NWAG methods [12], Abu Dhabi International Petroleum Exhibition and Conference; published by Society of Petroleum.
Energies 17 04846 g003
Figure 4. Comparison of PVT graph of fluid model and that reported in previous study: (a) fluid model in this study and (b) Weyburn field model [17].
Energies 17 04846 g004
Figure 5. Three-dimensional reservoir model and Larsen and Skauge’s three-phase relative permeability hysteresis model: (a) heterogeneity of permeability and (b) hysteresis effect of relative permeability [20].
Energies 17 04846 g005
Figure 6. Shifting of oil–water relative permeability owing to nanoparticle adsorption.
Energies 17 04846 g006
Figure 7. Comparison of oil recovery factor of 1D core model with NWAG method: (a) WAG ratio; (b) slug size.
Energies 17 04846 g007
Figure 8. Mole fraction of CO2, gas relative permeability, and gas saturation in (11, 11, 3) grid block (center point of 3D reservoir model).
Energies 17 04846 g008
Figure 9. Amount of nanoparticle adsorption on rock surface: (a) during SiO2-waterflooding period; (b) after post-waterflooding period.
Energies 17 04846 g009
Figure 10. Production performance during the NWAG processes with different WAG ratios.
Energies 17 04846 g010
Figure 11. Production performance during the NWAG process with different slug sizes.
Energies 17 04846 g011
Figure 12. Production performance during the NWAG process with different nanoparticle concentrations.
Energies 17 04846 g012
Figure 13. CO2 storage capacity in NWAG method. Effect of (a) WAG ratio; (b) slug size; (c) nanoparticle concentration.
Energies 17 04846 g013
Table 1. Components and composition of Weyburn W3 fluid [16].
ComponentMole
Fraction
Molecular WeightCritical
Pressure
(Atm)
Critical
Temperature
(K)
ParachorAcentric
Factor
N22.0728.0133.5126.2410.040
CO20.7444.0172.8304.2780.225
H2S0.1234.0888.2373.2800.100
CH47.4916.0445.4190.6770.008
C2H64.2230.0748.2305.41080.098
C3H87.8544.1041.9369.81500.152
NC46.5558.1237.5425.21860.193
NC54.5972.1533.3469.62280.251
C6–921.55102.5029.8556.42970.331
C10–1722.02184.0019.9692.35080.584
Table 2. The comparison of the data for Weyburn fluid and the fluid model.
ParametersW3Fluid Model in This Study
API (°)3129.3
Saturation pressure (psi)714700
Oil density at Pc (kg/m3)806.4816
Table 3. The description of the 1D core model.
ParametersValues
Number of grid blocks 50 ( I ) ×   1 ( J ) × 1(K)
Length10 cm
Diameter3.14 cm
Porosity0.18
Permeability50.0 md
Rock compressibility5.8 × 10−7 1/kPa
Pressure17,340 kPa
Temperature85.6 °C
Bulk volume77.3 cm3
Pore volume13.9 cm3
Initial oil saturation0.7
Original oil in place (OOIP) 6.13 × 10⁻⁵ bbl
Table 4. The description of the 3D reservoir model.
ParametersValues
Number of grids 21 ( I ) ×   21 ( J ) × 5(K)
Thickness50 m
WOC depth1050 m
Reference pressure15,000 kPa
Grid top1000 m
Porosity21.9–28%
Permeability31–75 md
Pressure15 MPa
Temperature37 °C
Initial oil saturation0.8
Table 5. NWAG design for sensitivity analysis of oil recovery and CO2 storage.
NWAG RatioSlug SizeNanoparticle Conc. (wt.%)
1:3 0.001
0.1 HCPV
1:2 0.005
1:1 0.01
0.2 HCPV
2:1 0.02
3:10.3 HCPV0.03
Disclaimer/Publisher’s Note: The statements, opinions and data contained in all publications are solely those of the individual author(s) and contributor(s) and not of MDPI and/or the editor(s). MDPI and/or the editor(s) disclaim responsibility for any injury to people or property resulting from any ideas, methods, instructions or products referred to in the content.

