Article

Monte Carlo Modeling of Isotopic Changes of Actinides in Nuclear Fuel of APR1400 Pressurized Water Reactor

1
Department of Nuclear Energy and Radiochemistry, Faculty of Energy and Fuels, AGH University of Krakow, al. Mickiewicza 30, 30-059 Krakow, Poland
2
Department of NPP Engineering, KEPCO International Nuclear Graduate School, 658-91 Haemaji-ro, Seosaeng-myeon, Ulju-gun, Ulsan 45014, Republic of Korea
*
Author to whom correspondence should be addressed.
Energies 2024, 17(19), 4864; https://doi.org/10.3390/en17194864
Submission received: 6 September 2024 / Revised: 20 September 2024 / Accepted: 25 September 2024 / Published: 27 September 2024
(This article belongs to the Special Issue Advanced Technologies in Nuclear Engineering)

Abstract

:
The aim of this paper is to present the isotopic changes in nuclear fuel during the first reactor cycle of the Korean Advanced Power Reactor 1400 (APR1400). The neutron transport and burnup calculations were performed using the Monte Carlo continuous energy burnup code—MCB. The three-dimensional numerical model consisting of the reactor pressure vessel with core internals was developed using available geometrical and material data as well as the reactor’s operating conditions. The reactor core was divided into 11 axial and 22 radial burnup zones in order to recreate the spatial distribution of the fuel burnup. The isotopic changes due to the nuclear transmutations and decays were calculated in each burnup zone until the desired average burnup of 17.571 GWd/tHMint was reached. The calculations include changes in the boric acid concentration at defined time steps and the burnout of the gadolinia burnable absorber embedded in the nuclear fuel. This study shows the spatial distribution of minor and major actinides at the end of the reactor cycle as well as the depletion of uranium, the build-up of plutonium, and the formation of neptunium, americium, and curium during the reactor’s operation.

1. Introduction

The Korean Advanced Power Reactor 1400 (APR1400) is a commercial nuclear reactor with an electric power output of 1400 MWel. The reactor was developed based on the previous design of the Optimized Power Reactor 1000 (OPR1000) [1,2]. The APR1400 is characterized by improved passive and active safety systems including seismic resistance features [3,4]. The first APR1400 constructed in South Korea at the Saeul Nuclear Power Plant (NPP) began its commercial operation in December 2016. At present, there are four APR1400 reactors in operation in South Korea (Saeul: 1–2, Shin-Hanul: 1–2) and four under construction (Saeul: 3–4, Shin-Hanul: 2–4). In addition, the United Arab Emirates (UAE) decided to construct four APR1400 units at Barakah NPP. Three units are operational (Barakaha: 1–3), and one unit is being commissioned (Barakah: 4) [5,6]. The export of Korean nuclear technology to the UAE was a breakthrough point for the Korean nuclear industry. Currently, many countries are considering the implementation of Korean nuclear reactors in their power systems. This trend is especially visible in Central Europe, where Poland is considering the construction of APR1400 nuclear reactors, and the Czech Republic—the APR1000. Therefore, scientific groups in Central Europe and the Republic of Korea have initiated common research initiatives on nuclear technologies.
The calculations of the isotopic changes in matter due to nuclear transmutations and decays are necessary for the estimation of the isotopic composition of the nuclear fuel at a defined time point and in a defined burnup zone. The isotopic changes in nuclear fuel influence mutually neutron flux, neutron spectrum, reaction rates, and thus the formation of isotopes, and finally, the criticality of the nuclear reactor during its operation [7]. In addition, knowledge about spent fuel isotopic composition and other related parameters such as activity or decay heat allows for planning spent nuclear fuel transportation, short-term storage, long-term disposal, or reprocessing strategies [8]. The main reason for the present scientific research was to enhance our knowledge about the spatial and temporal distribution of actinides formed in nuclear fuel during the operation of the APR1400. The main novelty of the present research is the application of real reactor operational and construction data for numerical model development, the construction of a numerical model at the level of the Reactor Pressure Vessel (RPV), and the application of this numerical tool validated using real spent fuel assay data (Monte Carlo continuous energy burnup code (MCB)). In addition, previous studies on the APR1400 considered many physical and technical aspects related to the design of the reactor core, but to the best of our knowledge, they did not focus on the comprehensive actinide inventory calculations for the first reactor cycle as the main scientific topic.
Alhattawi et al. and Alrwashdeh et al. presented a neutronic analysis of accident-tolerant fuel for the APR1400 [9,10]. The analysis shows the formation of 239Pu in the individual Fuel Assemblies (FAs) with different Fuel Rods’ (FRs) cladding materials. In addition, the second study presents the formation of activation products in the cladding materials, which is important for the dismantling and decommissioning of the reactor vessel. Salam and Hah performed a comprehensive comparative analysis between the APR1400 operating on UO2 and Mixed Oxide Fuel (MOX) fuels [11]. The main efforts were made to calculate reactivity-related parameters, such as the moderator temperature coefficient, the fuel temperature coefficient, and the shutdown margin. Do et al. proposed an APR1400 core with a very low born concentration, while Alrwashdeh and Alemari presented a core without soluble boron, for an extended reactor cycle of 24 months [12,13]. The calculations investigate mainly reactivity and neutronic parameters as well as power distribution in the designed reactor core. The neutronics of the 24-month reactor cycle were also investigated by Khalefih et al. [14,15], who proposed higher enrichments in 235U of 5.2–5.9% for the equilibrium reactor cycle. Considering the numerical tools used for the APR1400 modeling, Alnaqbi et al. prepared an advanced neutronic analysis using three different tools, especially KOMODO software [16]. The APR1400 numerical models were also used for the benchmarking and verification of MPACT and DeCART codes, which were shown, respectively, by Barr et al. [17] and Yuk et al. [18]. A multiphysics approach to APR1400 modeling was introduced by Lee et al. for the estimation of the departure from nucleate boiling ratio, which is one of the crucial safety parameters [19]. The study by Al Awad et al. considers a criticality analysis of the APR1400 spent fuel assemblies. The authors present the average actinide and fission product inventory for PLUS7 and CE 16 × 16 fuel assemblies placed in the spent fuel rack [20]. In the former study by Oettingen and Kim, the problem of the possible formation and detection of power shift anomalies in the numerical modeling of the APR1400 was investigated [21]. The burnup calculations were applied for the estimation of the concentration of 135Xe and its influence on the power density.
It is worth noting that many studies on the burnup calculations for the Pressurized Water Reactor (PWR) have already been performed. However, the studies usually focused on the simplified numerical models of the reactor considering either the fuel pin or fuel assembly, not the whole core. In the current research, the RPV-level heterogeneous model of the reactor was developed for Monte Carlo neutron transport and burnup calculations using the MCB code, which is the advancement in the numerical modeling of APR1400. The study by Du Toit and Naicker shows the problem of burnup instabilities in the Monte Carlo modeling of the European Pressurized Reactor (EPR) [22]. The calculations of isotopic changes were performed using Serpent code with North-West University Reactor code suite. The authors investigated differences in isotopic concentrations of fission products and actinides for various test simulations with different input parameters. The paper by Al Zain et al. focuses on the validation of novel deterministic code for burnup calculations using a pin-cell PWR benchmark [23]. The calculated isotopic compositions were compared with the reference results obtained using CASMO-4 and MCODES codes. El Bakkari et al. presented a Monte Carlo burnup code validation using PWR fuel assembly with MOX [24]. The authors outlined the mathematical methods introduced for burnup calculations and compared the obtained isotopic inventory with the inventory obtained using different burnup codes but the same benchmark specification. Morrison et al. conducted fuel-assembly-level burnup calculations for standard and reduced moderation PWRs using the WIMS code. The influence of the changing isotopic inventory mainly on the moderator temperature coefficient and fully voided reactivity was presented [25]. Li et al. presented the coupling methods of the Monte Carlo neutron transport code with a burnup solver [26]. The international PWR VERA benchmark was used for test calculations. The obtained concentrations of chosen isotopes were compared among applied coupling methods.

2. Materials and Methods

2.1. Numerical Model

For the Monte Carlo modeling of neutron transport, a heterogonous three-dimensional numerical model of the reactor core was developed using available public geometrical and operational data. Table 1 presents crucial materials from the neutronic point of view, used for the reconstruction of the structural components in the numerical model. The specification of materials plays a key role in the numerical modeling, because their neutron cross-sections influence neutron flux and spectrum and thus the formation of new isotopes. The isotopic composition of materials corresponds to their natural abundance except for the uranium fuel, where different enrichments in 235U were applied, which is shown in Table 2. The content of 234U for a given enrichment in 235U was estimated using the available correlations; see Table 3 [27,28]. Figure 1 shows the core loading pattern with all types of 16 × 16 fuel assemblies for the initial reactor cycle. The applied enrichments and the number of fuel rods of each type are shown in Table 2. The pitch of fuel rods used for the numerical modeling is 1.2852 cm, the diameter of the fuel pellet is 0.8192 cm, and the active fuel height is 381 cm.
The geometry of each assembly was reconstructed numerically with due care in order to obtain reliable irradiation conditions. The nuclear fuel was divided into 11 axial and 22 radial burnup zones, which gives a total of 242 burnup zones for the calculations of isotopic changes in the matter. Table 4 presents the mass of Heavy Metal (HM) in each zone. The radial burnup zones correspond to each type of fuel rod in the fuel assemblies. The axial burnup zones uniformly divide the active column height. However, the top and bottom endings of the burnable absorber rods (~30 cm) include uranium fuel enriched to 2% without Gd2O3 (gadolinia). Therefore, in gadolinia-bearing fuel rods, the total masses of actinides in the top and bottom burnup zones are different; see Table 4. The reactor core is surrounded by multiple layers of top, bottom, and side reflectors, which are depicted in Figure 2. The components of the reflector around the active core with complex engineering geometry were numerically reconstructed using the volumetric homogenization method [29]. The geometry of the components was simplified, but the components’ isotopic composition matches the volumetric fractions of all the constituent materials. This method allows for general simplification of the numerical model and thus more efficient modeling of neutron transport. The crucial components of the active core containing nuclear fuel were reconstructed in detail, without the application of the volumetric homogenization method.
The numerical model is axially not symmetrical, because the design of the top and bottom reflectors are different in reality, which was included in the numerical model. The neutron transport simulations in the reactor core are usually performed with numerical models considering single fuel assemblies or the reactor core surrounded by symmetrical layers of neutron reflector. In the presented numerical model, more components influencing the neutron flux and spectrum are included. Thus, the simulations show a higher level of detail, compared to other studies. It is worth mentioning that above the fuel active column, all banks of part- and full-strength control rod assemblies were numerically reconstructed. This allows for further studies on the influence of the control rod insertion and withdrawal on the isotopic fuel composition.

2.2. Numerical Calculations

The MCB developed at the AGH University of Krakow was used for all numerical simulations [30]. The code is a coupling of the Monte Carlo N-Particle transport code (MCNP) developed at Los Alamos National Laboratory for Monte Carlo neutron transport calculations and code further developed at AGH University of Krakow Trajectory Transmutation Analysis (TTA) for burnup calculations. The Bateman equations governing the transmutation and radioactive decay system are solved by TTA using the linear chain method [31]. This method is currently the reference method for other methods used in burnup calculations. It provides not only the final results, such as the number of atoms of particular isotopes, but also allows for qualitative estimation of the paths following the formation of isotopes. This feature allows for tracing the origin of the isotopes for various fuel multi-cycling schemes in the designed nuclear fuel cycle. The MCB code was successfully validated using destructive assay data extracted from the fuel assemblies irradiated in the Japanese Ohi-2 PWR [32].
The calculations were performed with Joint Evaluated Fission and Fusion 3.3 (JEFF3.3) [33] cross-section data libraries using the High-Performance Computer (HPC) ARES, available at the Academic Computer Center CYFRONET of AGH University of Krakow [34]. The MCB code was executed for about 12 million histories per each time point, which gives a precision (relative error) of flux-base tallies of about 1–2%, which is far below the reliability reference level of 10% [35]. The MCB code was launched in the “kcode” mode for criticality calculations for each time point. The thermal power of the reactor for simulations was set to 3983 MWth, which corresponds to the nominal power of the APR1400. The time points applied in the simulation refer to the average burnup of the nuclear fuel in unit GWd/tHMint. The first time point corresponds to the Beginning of Cycle (BOC), 0 GWd/tHMint, while the second time point to 0.2 GWd/tHMint, which was introduced for determination of the 135Xe equilibrium concentration. The following 17 time points correspond to the burnup increase by 1 GWd/tHMint per time step. The last time point at the End of Cycle (EOC) corresponds to the burnup of 17.571 GWd/tHMint, which is the desired average burnup of the APR1400’s first reactor cycle. The critical boron concentration applied in the simulations is shown in Figure 3. The boron concentration in the cooling water is automatically adjusted at each time point using the available features of the MCB code, which allows for changes in the material composition during the simulations. Figure 4 presents the burnout of the odd gadolinium isotopes 155Gd and 157Gd in the reactor core. Gadolinium plays an important role in long-term reactivity control through the addition of positive reactivity due to the burnout of 155Gd and 157Gd isotopes [36]. The burnout of 157Gd is faster than that of 155Gd due to its higher absorption cross-section in the thermal energy range.

3. Results

3.1. The Actinide Build-Up

In this study, the crucial minor and major actinides formed in the nuclear fuel due to neutron transmutations and decay processes were investigated. The presented actinides play the key role in spent fuel safety-related applications and were selected considering the recommendation of the Nuclear Energy Agency (NEA) [37]. The analysis focuses on four isotopes of uranium (234U, 235U, 236U, 238U), one isotope of neptunium (237Np), five isotopes of plutonium (238Pu, 239Pu, 240Pu, 241Pu, 242Pu), three isotopes of americium (241Am, 242mAm, 243Am), and six isotopes of curium (242Cm, 243Cm, 244Cm, 245Cm, 246Cm, 247Cm). In addition, the formation of lumped fission products and actinides was shown. The concentrations of other minor and major actinides as well as fission products are available but are not investigated in this study due to their smaller relevance for safety assessments.
Table 5 presents the masses and mass fractions of the considered actinides at the end of the first reactor cycle, at the average burnup of 17.571 GWd/tHMint. The highest masses of 99.3 tons and 1.33 tons correspond to the residual uranium isotopes 238U and 235U. The lowest masses of 4.88 mg and 0.773 g were obtained for the long-lived 247Cm and 246Cm due to long transmutation and decay paths following their formation. At the end of the irradiation, the masses of fissile 239Pu and 241Pu were about 452 kg and 77 kg.
Table 6 shows the build-up of the actinides in the reactor core during the first reactor cycle. The data are presented in grams per final average burnup, which is 17.571 GWd/tHMint. The build-ups depend on the formation and destruction rates of isotopes in the neutron field and their half-life times. The highest build-ups of 25.74 kg and 14.65 kg were achieved for 239Pu, which is formed in the transmutation and decay chain from 238U, and for 236U, which is a transmutation product of 235U. On the contrary, the lowest build-ups of 0.28 mg and 43.99 mg were obtained for the heaviest actinides 247Cm and 246Cm, whose formation paths are much longer.
Table 7 shows the depletion of residual uranium isotopes per final average burnup and initial heavy metal mass. The depletion is understood as a decrease in the masses of particular uranium isotopes until the EOC. The total depletion of uranium per final burnup of 17.571 GWd/tHMint equals 168.66 kg. Half of it corresponds to the fission of 235U and the other half to the radiative neutron capture on 238U. The depletion of 234U is low and corresponds mainly to its transmutation via radiative neutron capture to 235U.

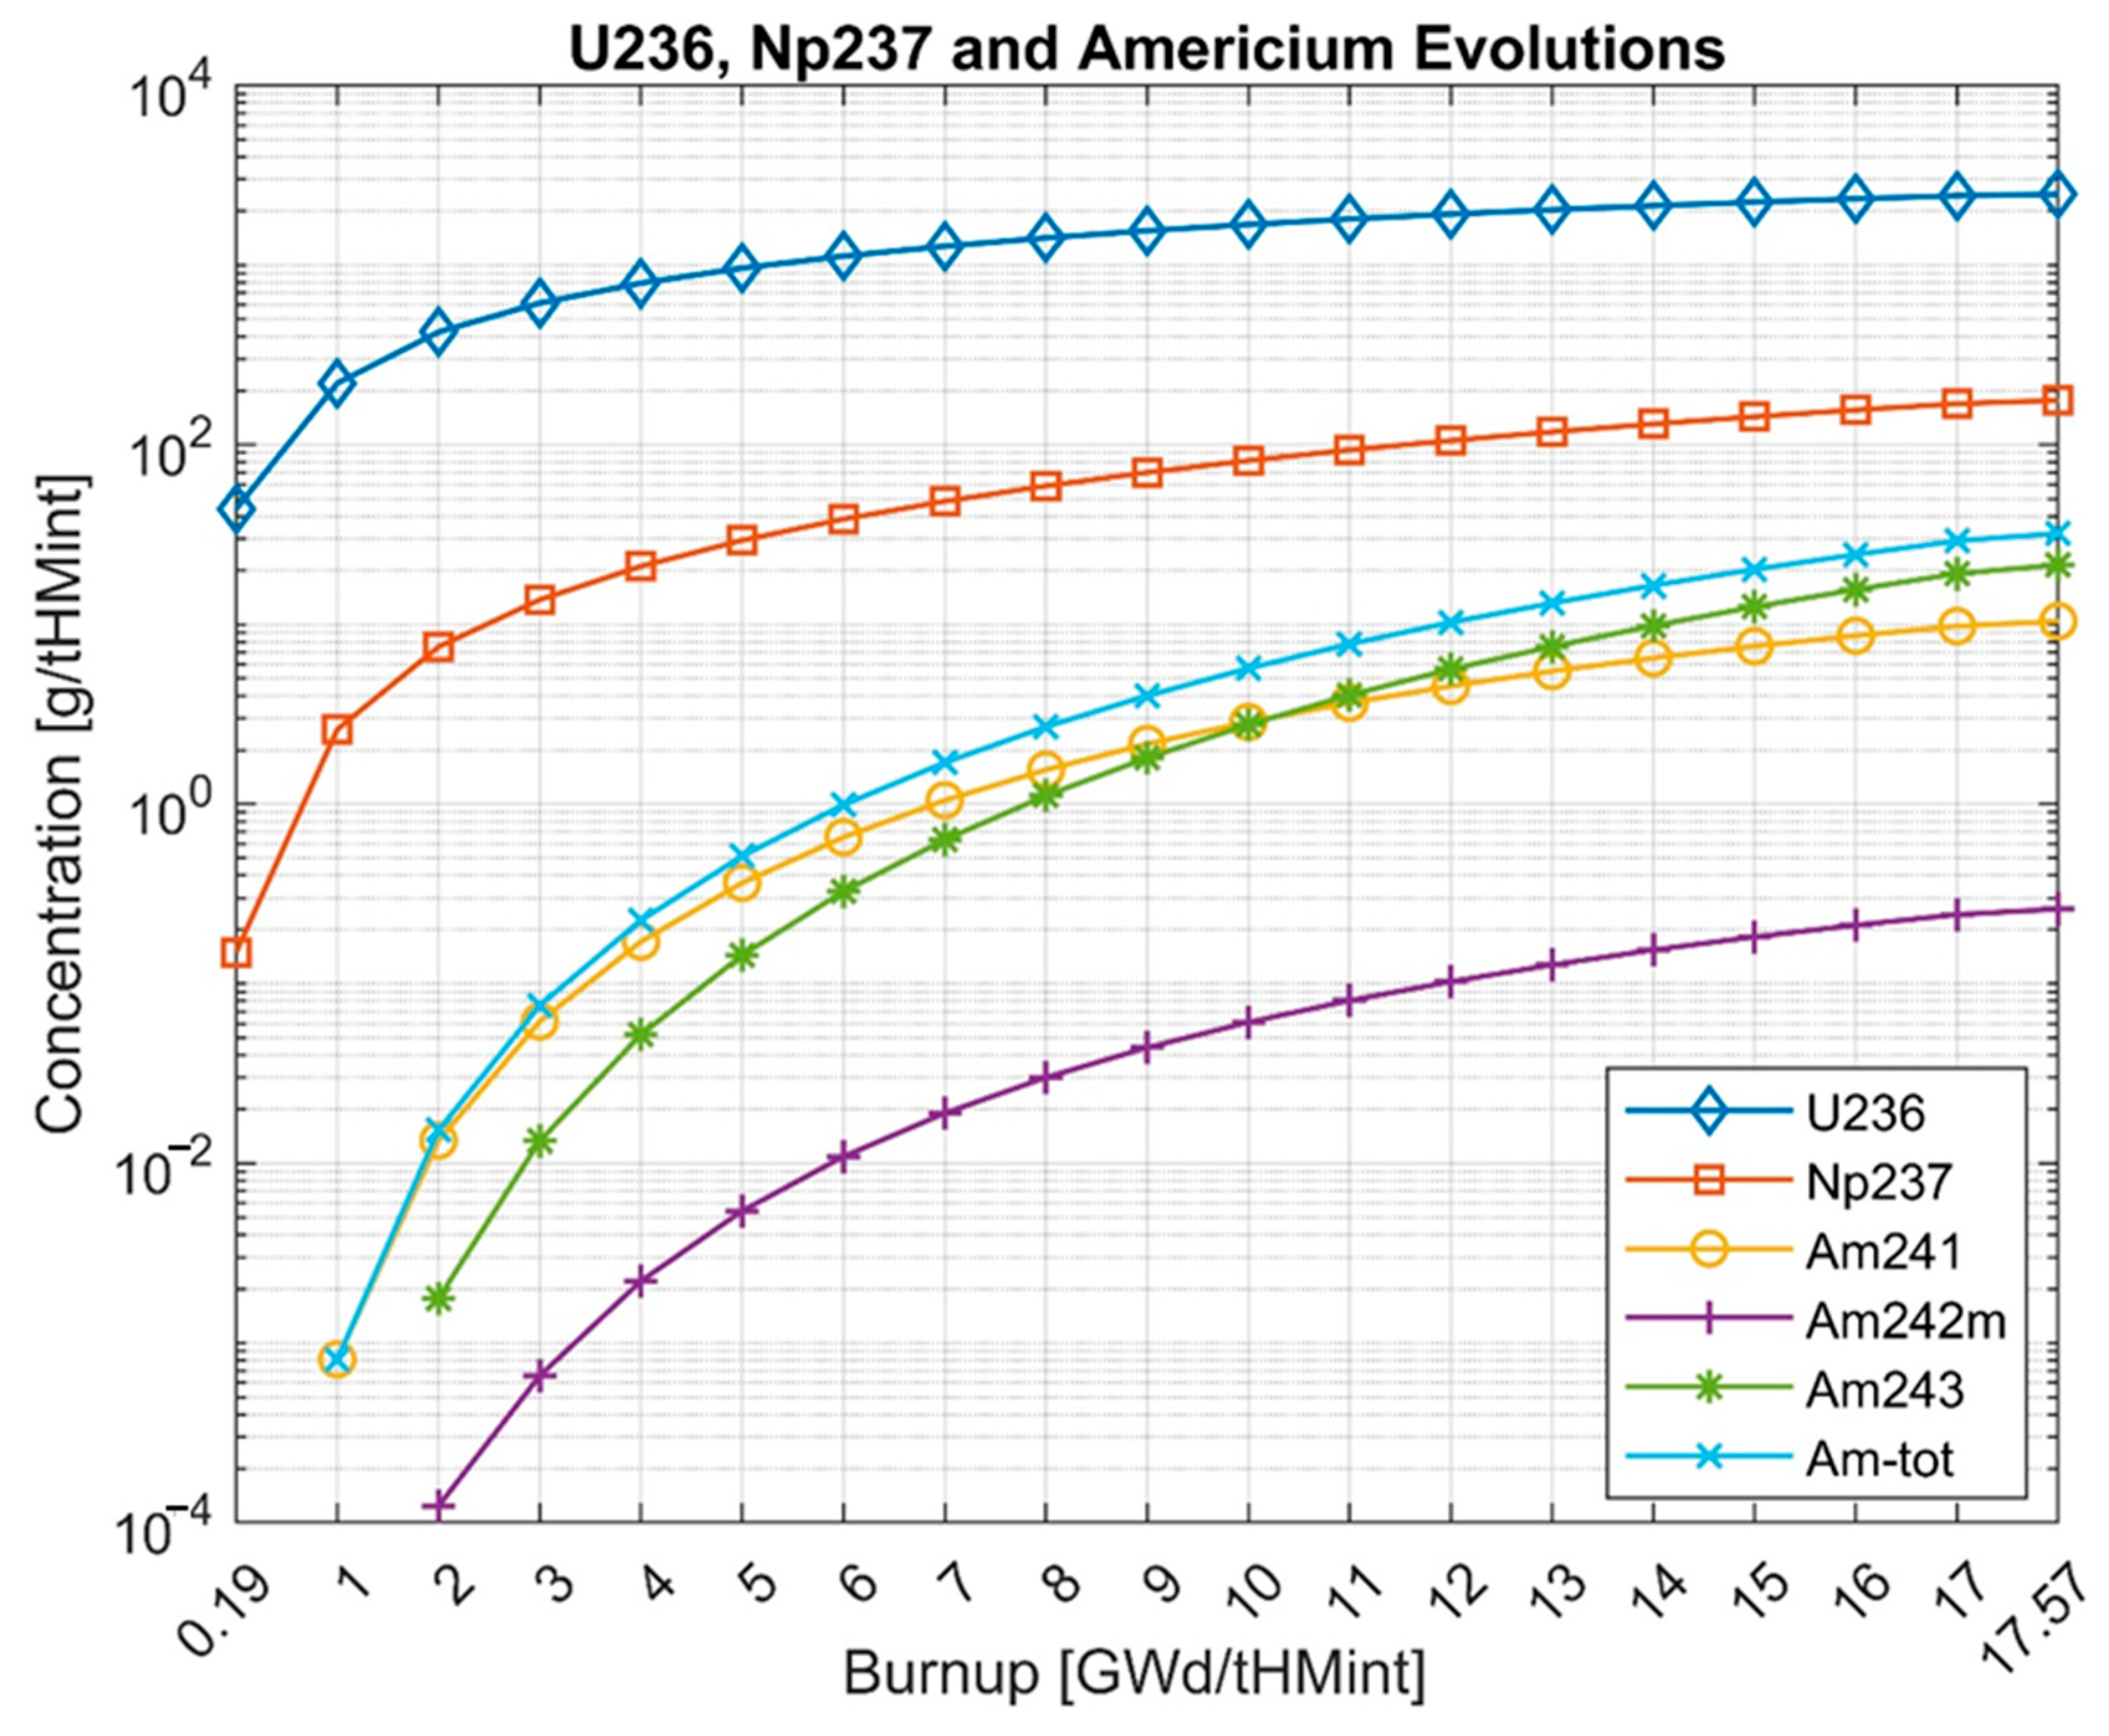
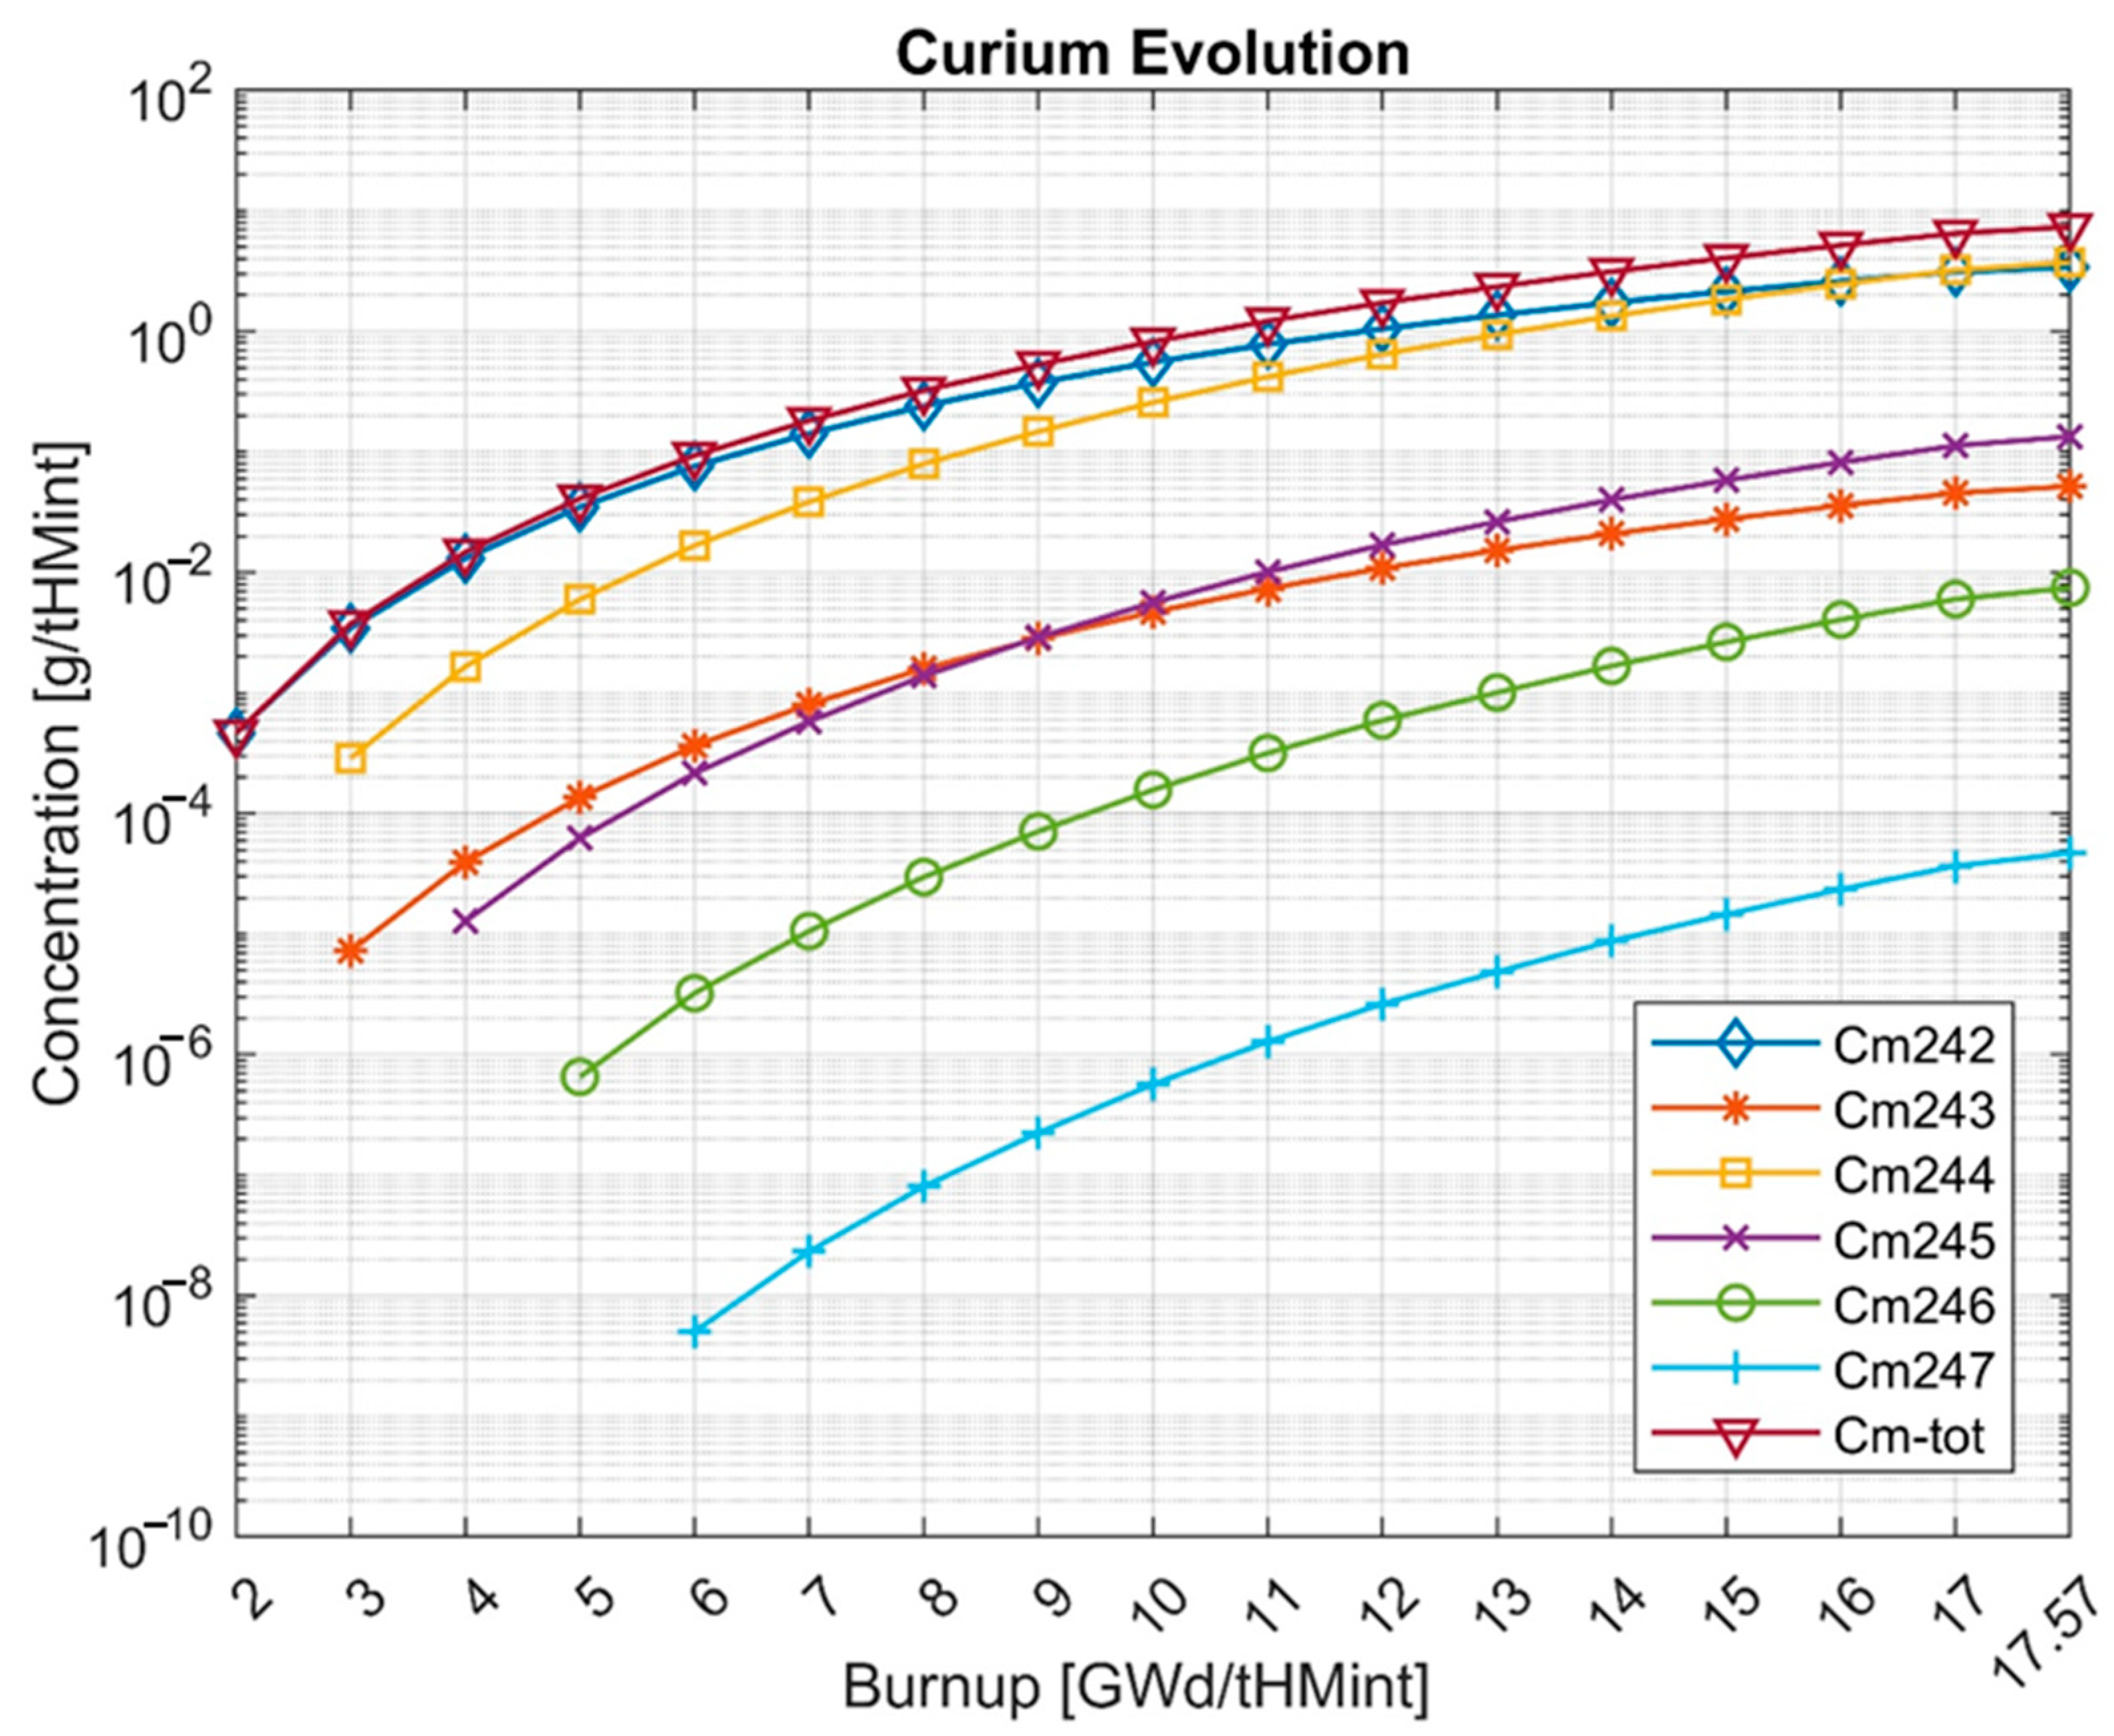
3.2. The Evolutions of the Actinides

Figure 5, Figure 6, Figure 7, Figure 8 and Figure 9 show the evolutions of the minor and major actinides in the nuclear fuel. The concentrations are normalized to the total initial mass of heavy metal in the nuclear fuel (103.57 tHMint). The evolutions for some isotopes are presented starting not from the first irradiation step, but from the subsequent steps. This approach was applied because the formation of isotopes in the fresh nuclear fuel is driven by quite long transmutation and decay chains, and their concentrations near the BOC are very low. The effect is clearly visible in the case of curium isotopes in Figure 9.
Figure 5 shows the drop in the mass of uranium isotopes and Figure 6 the depletion of uranium isotopes. The minus sign in Figure 6 shows a decrease in the mass of uranium isotopes between the mass at the BOC and the mass at the particular burnup step. The mass of uranium isotopes decreases due to the fuel burnup during the reactor operation at full power. The largest decrease shows 235U, which undergoes nuclear fission, and 238U, which transmutes to the higher actinides, especially to the fissile 239Pu. The step-by-step depletion of the uranium isotopes is higher at the BOC because of the lack of fissile 239Pu in the initial core, whose formation later compensates for the uranium consumption. The breeding of 239Pu together with the evolutions of other plutonium isotopes is shown in Figure 7. The Pu-239 concentration is becoming close to reaching equilibrium toward the higher end of the burnup but it has not reached it yet. The concentrations of the remaining plutonium isotopes increase starting from the BOC. Among the plutonium isotopes, the highest concentrations at EOC are shown in the case of 239Pu, and the lowest in the case of 238Pu. Figure 8 shows the evolutions of the 236U, 237Np, and americium isotopes. The mass of 236U increases due to its formation from 235U in radiative capture. 236U is the only uranium isotope presenting the relevant mass increase during the irradiation of nuclear fuel. The only neptunium isotope having a considerable mass and radiological influence is 237Np. Its concentration increases mainly due to its formation via an (n,2n) reaction on 238U. The increase in the mass of americium isotopes starts from the BOC. It is worth noting that at about 10 GWd/tHMint, the concentration of 243Am exceeds the concentration of 241Am. The reason is that the equilibrium concentration of 243Am is higher, due to differences in its precursors’ cross-sections. At the EOC, the highest concentration is shown in the case of 243Am and the lowest in the case of 242mAm. Figure 9 presents the evolutions of the curium isotopes. The mass of curium is determined by 242Cm and 244Cm, which show the highest concentrations at the EOC. At the end of the irradiation, 242Cm and 244Cm present almost the same concentrations. When comparing the evolutions of the odd curium isotopes 243Cm and 245Cm, it can be observed that starting at about 9 GWd/tHMint the concentration of 245Cm exceeds the concentration of 243Cm. This is caused by differences in their precursors’ cross-sections, similar to the americium isotopes.
In general, the concentrations of the transuranic isotopes are all monotonically increasing and have not yet reached equilibrium in the 17.571 GWd/tHMint of burnup. Also, the formation of any of the transuranic isotopes is not decreasing, and they start to be burned at a rate that approaches their production toward reaching equilibrium concentrations.

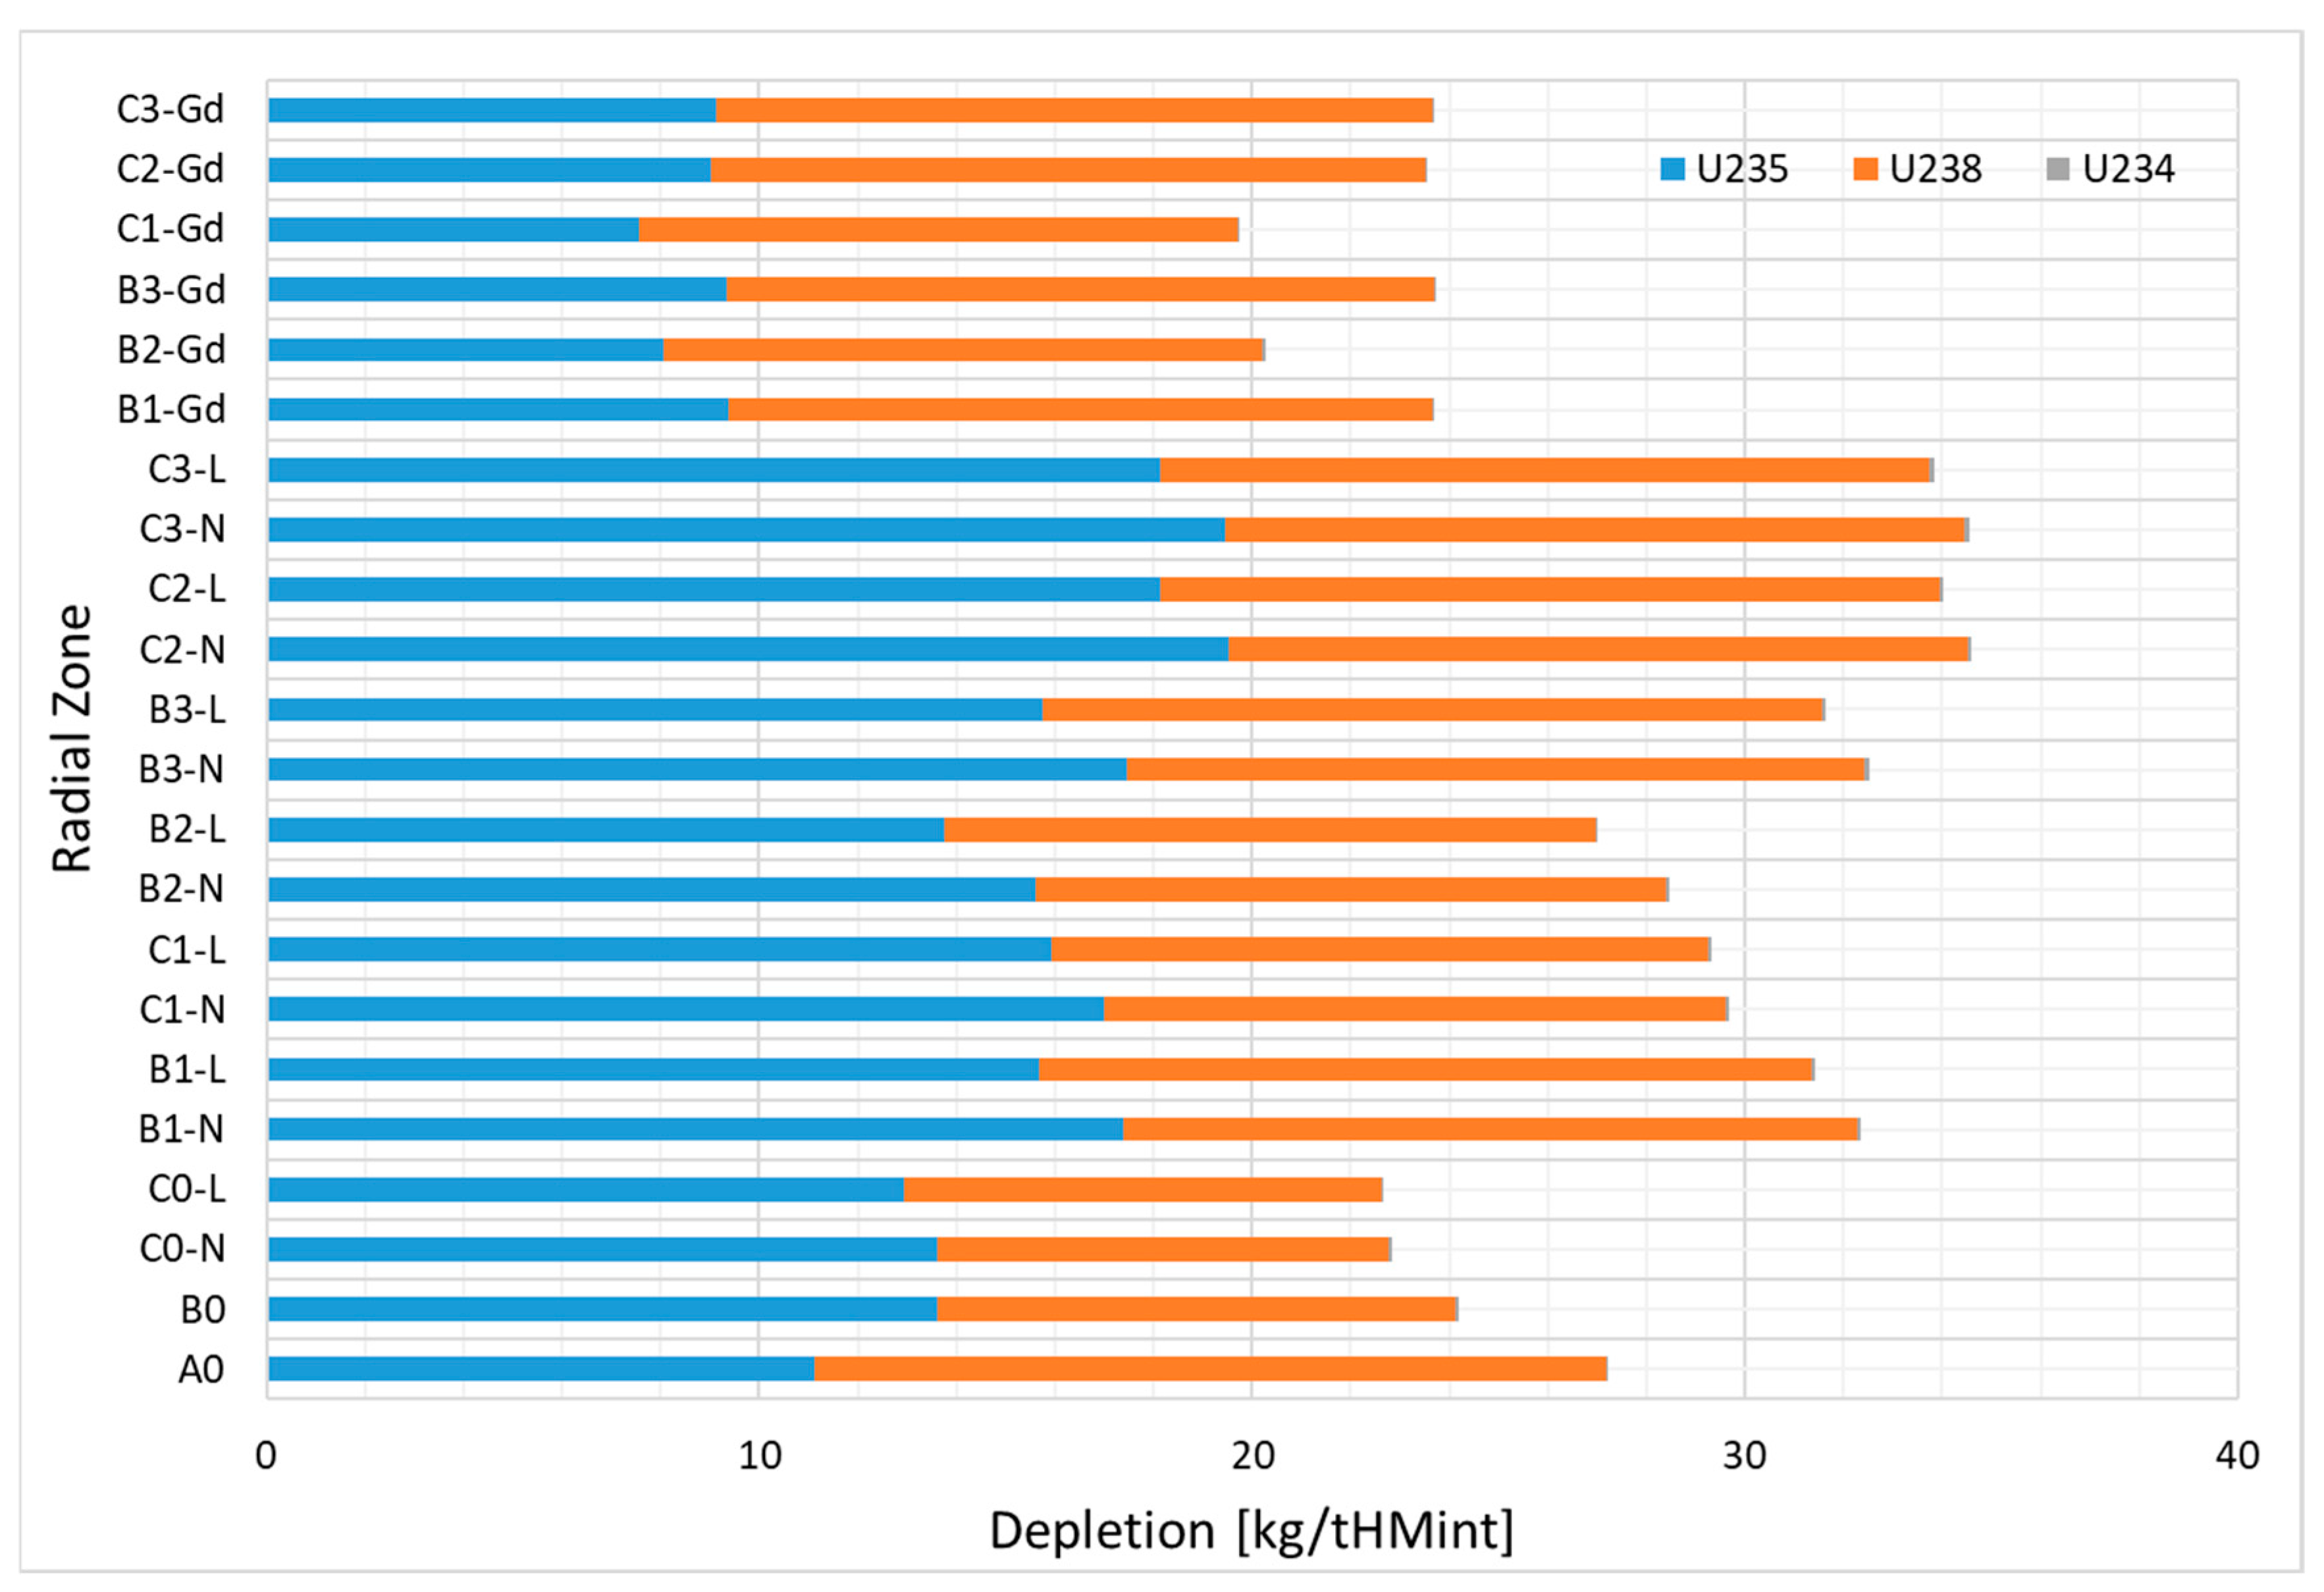
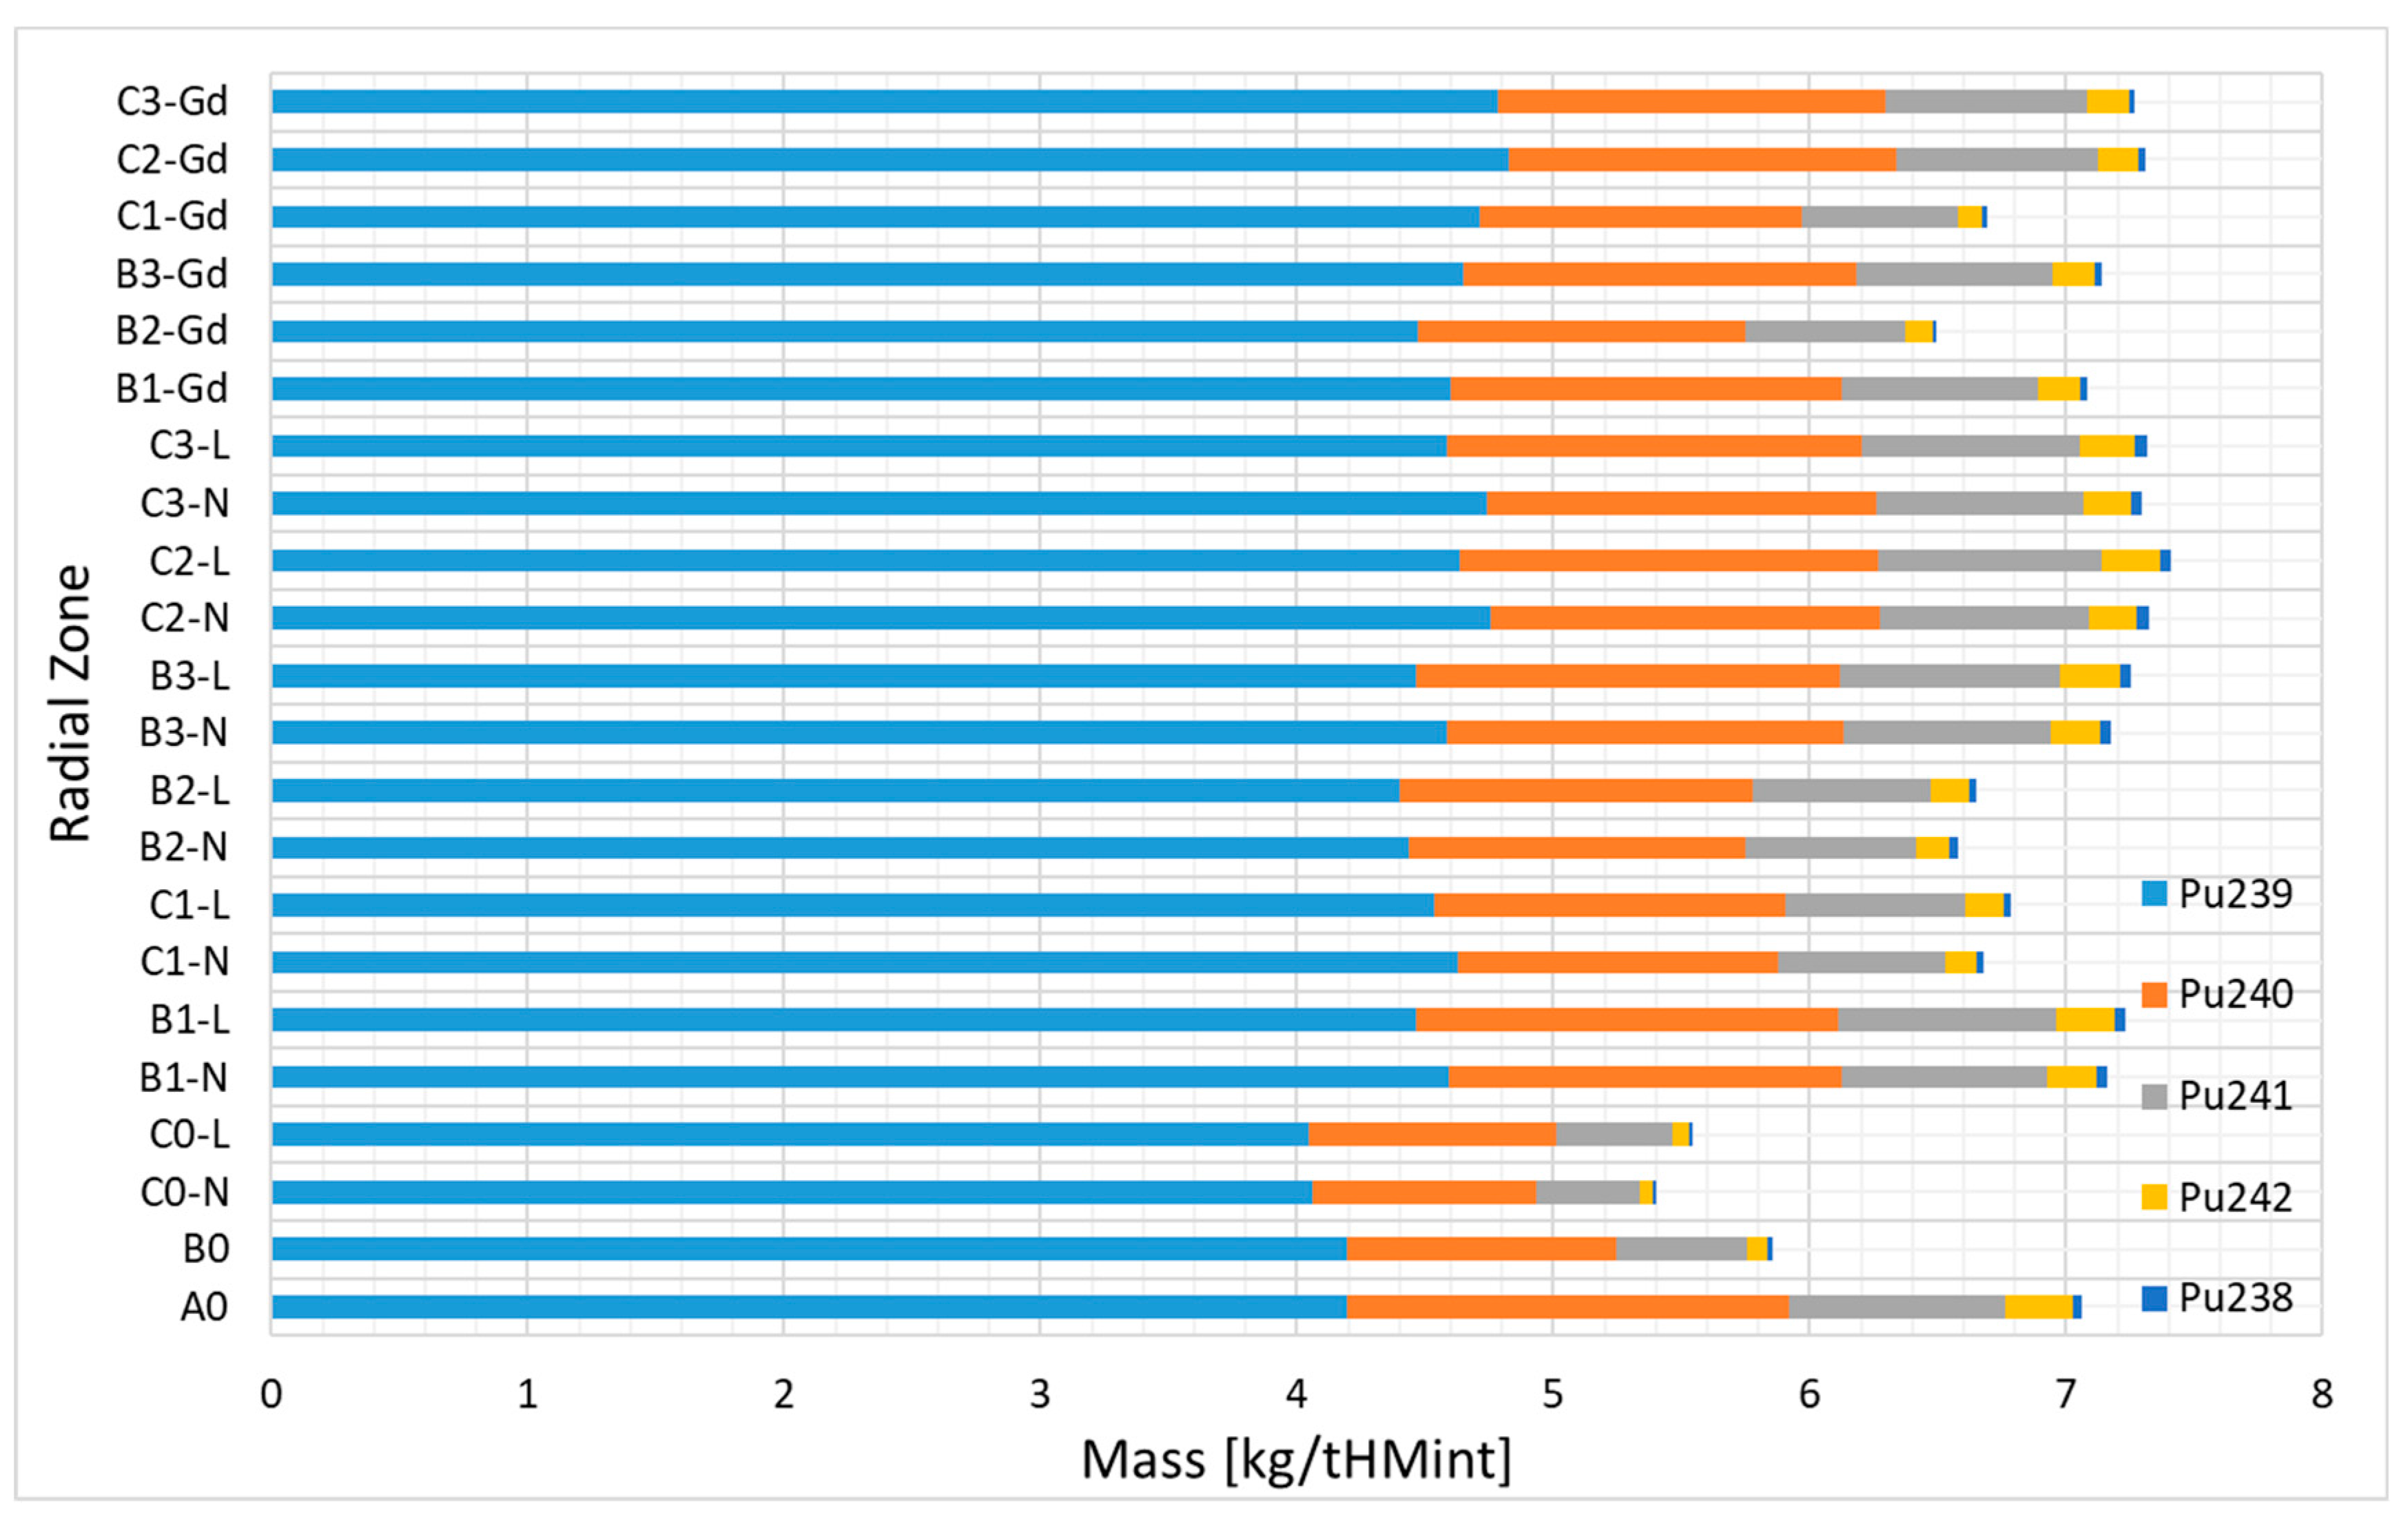
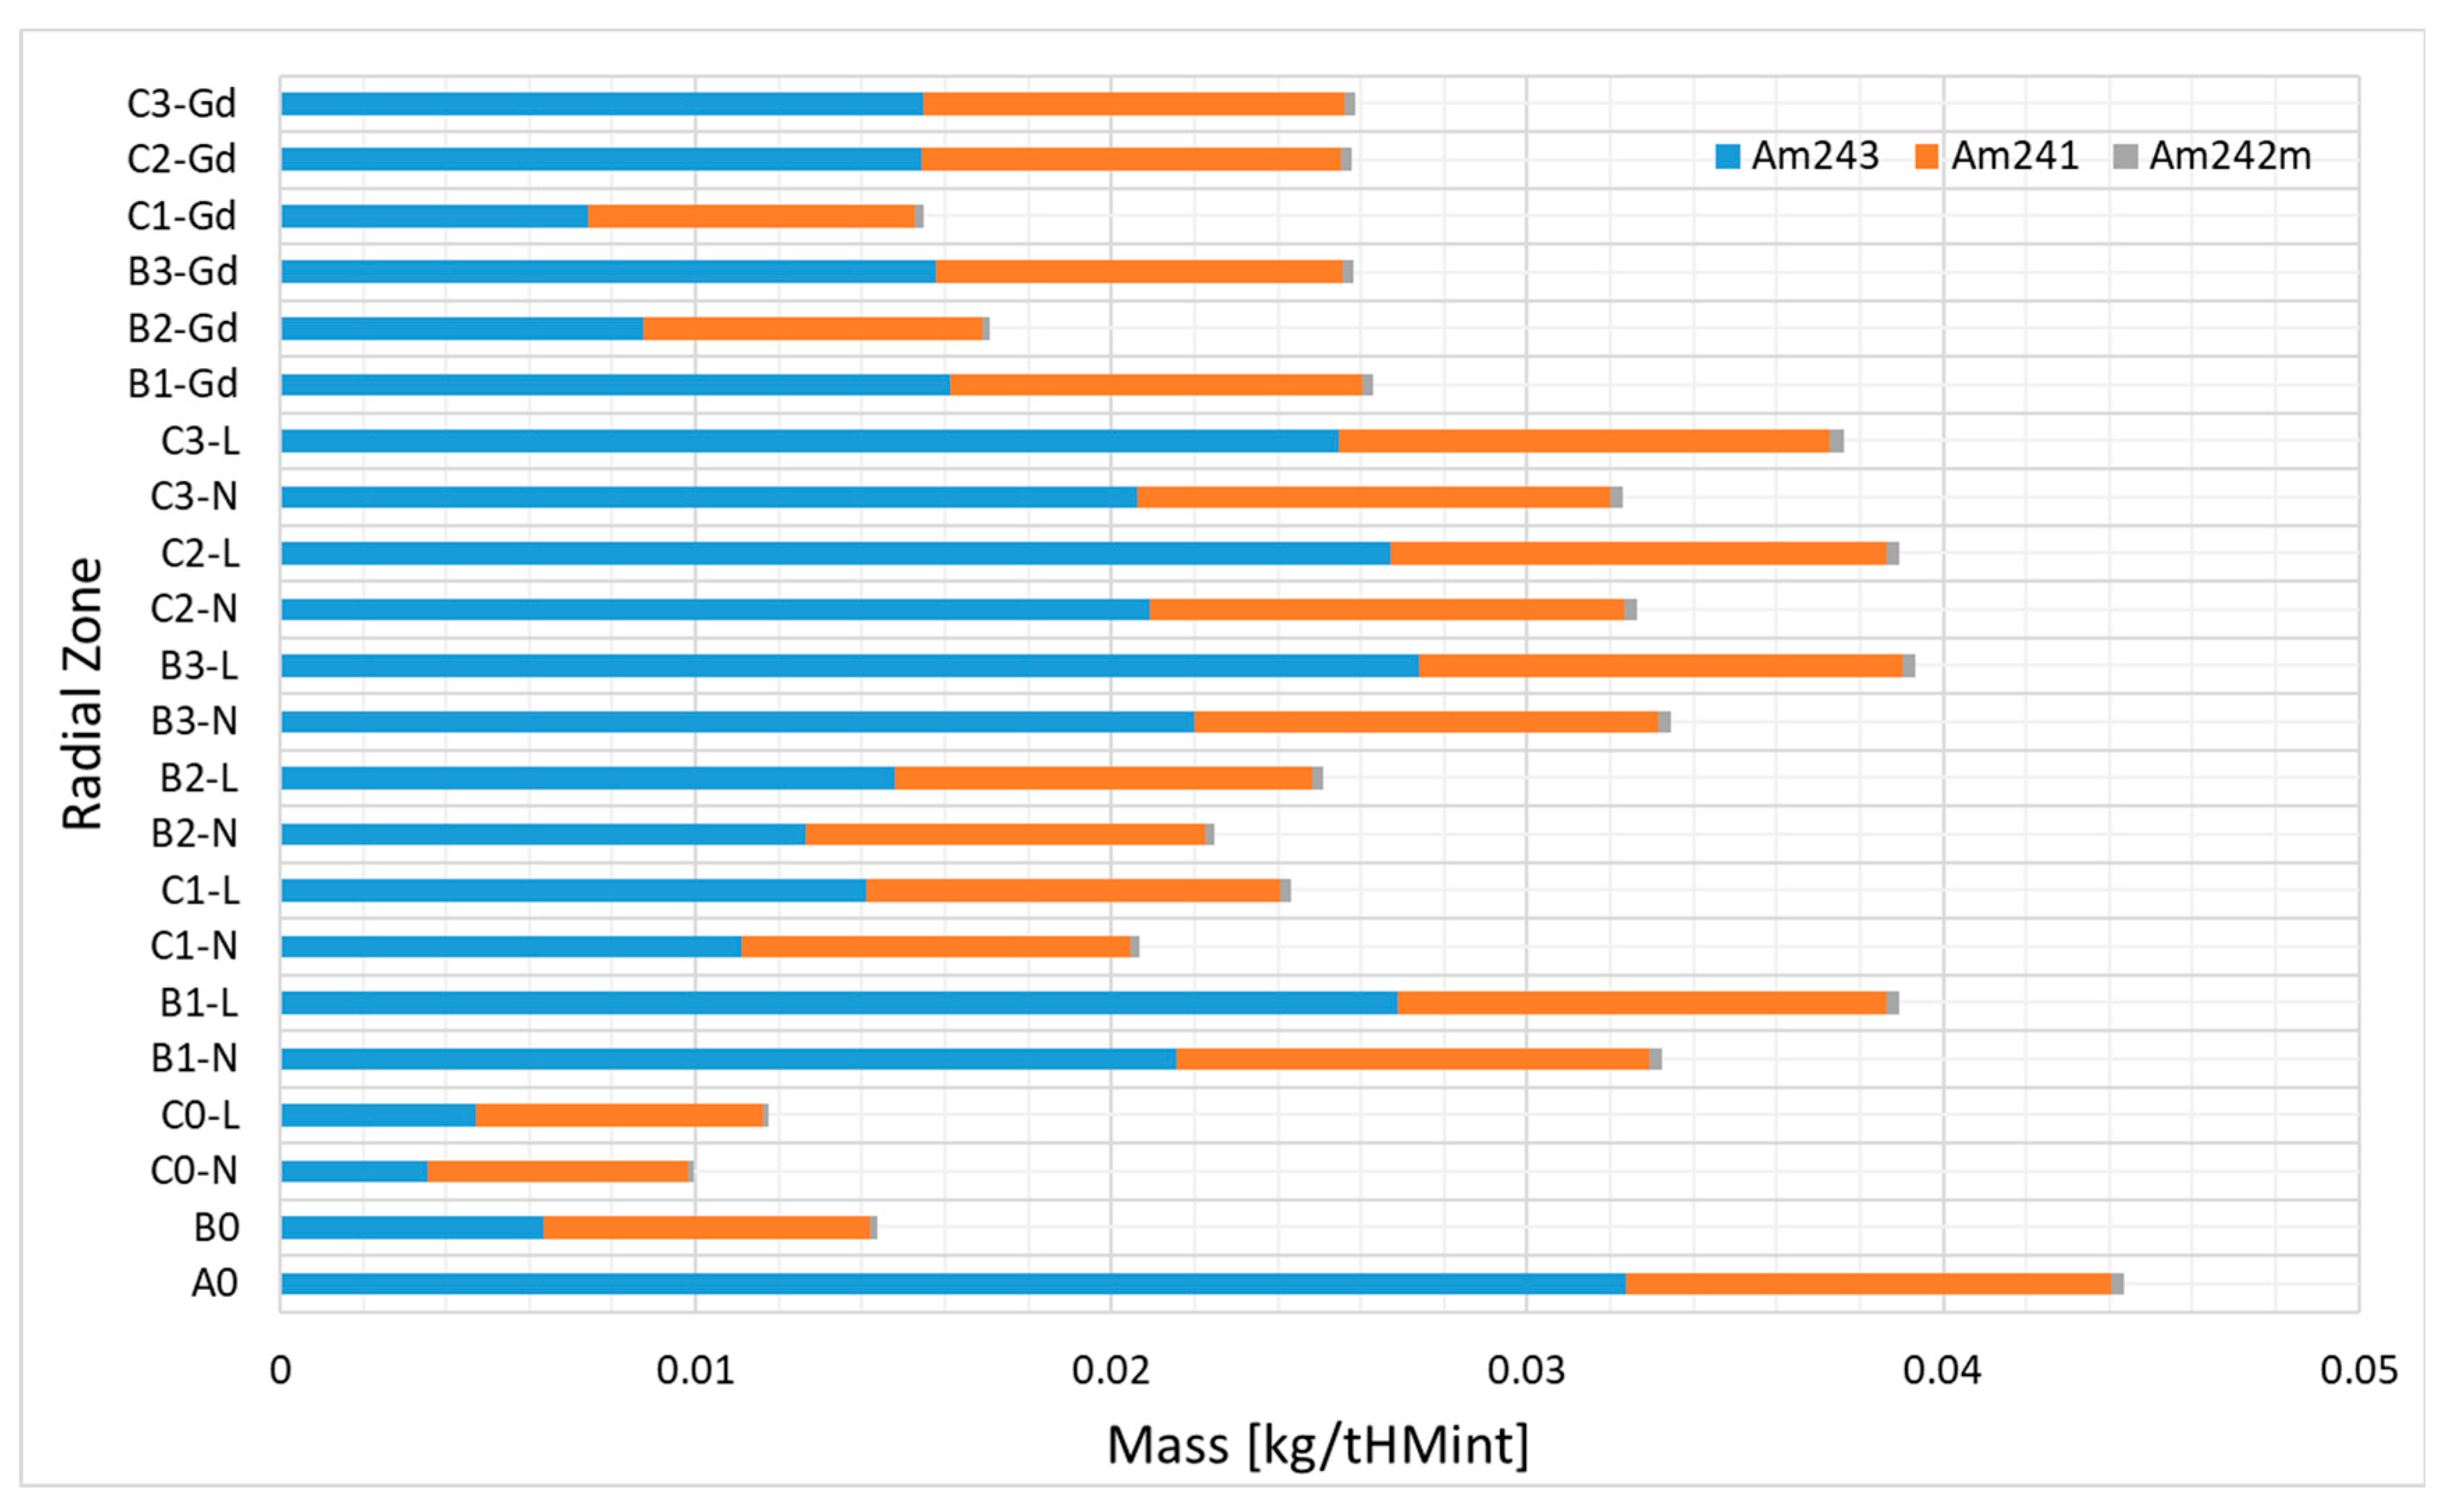
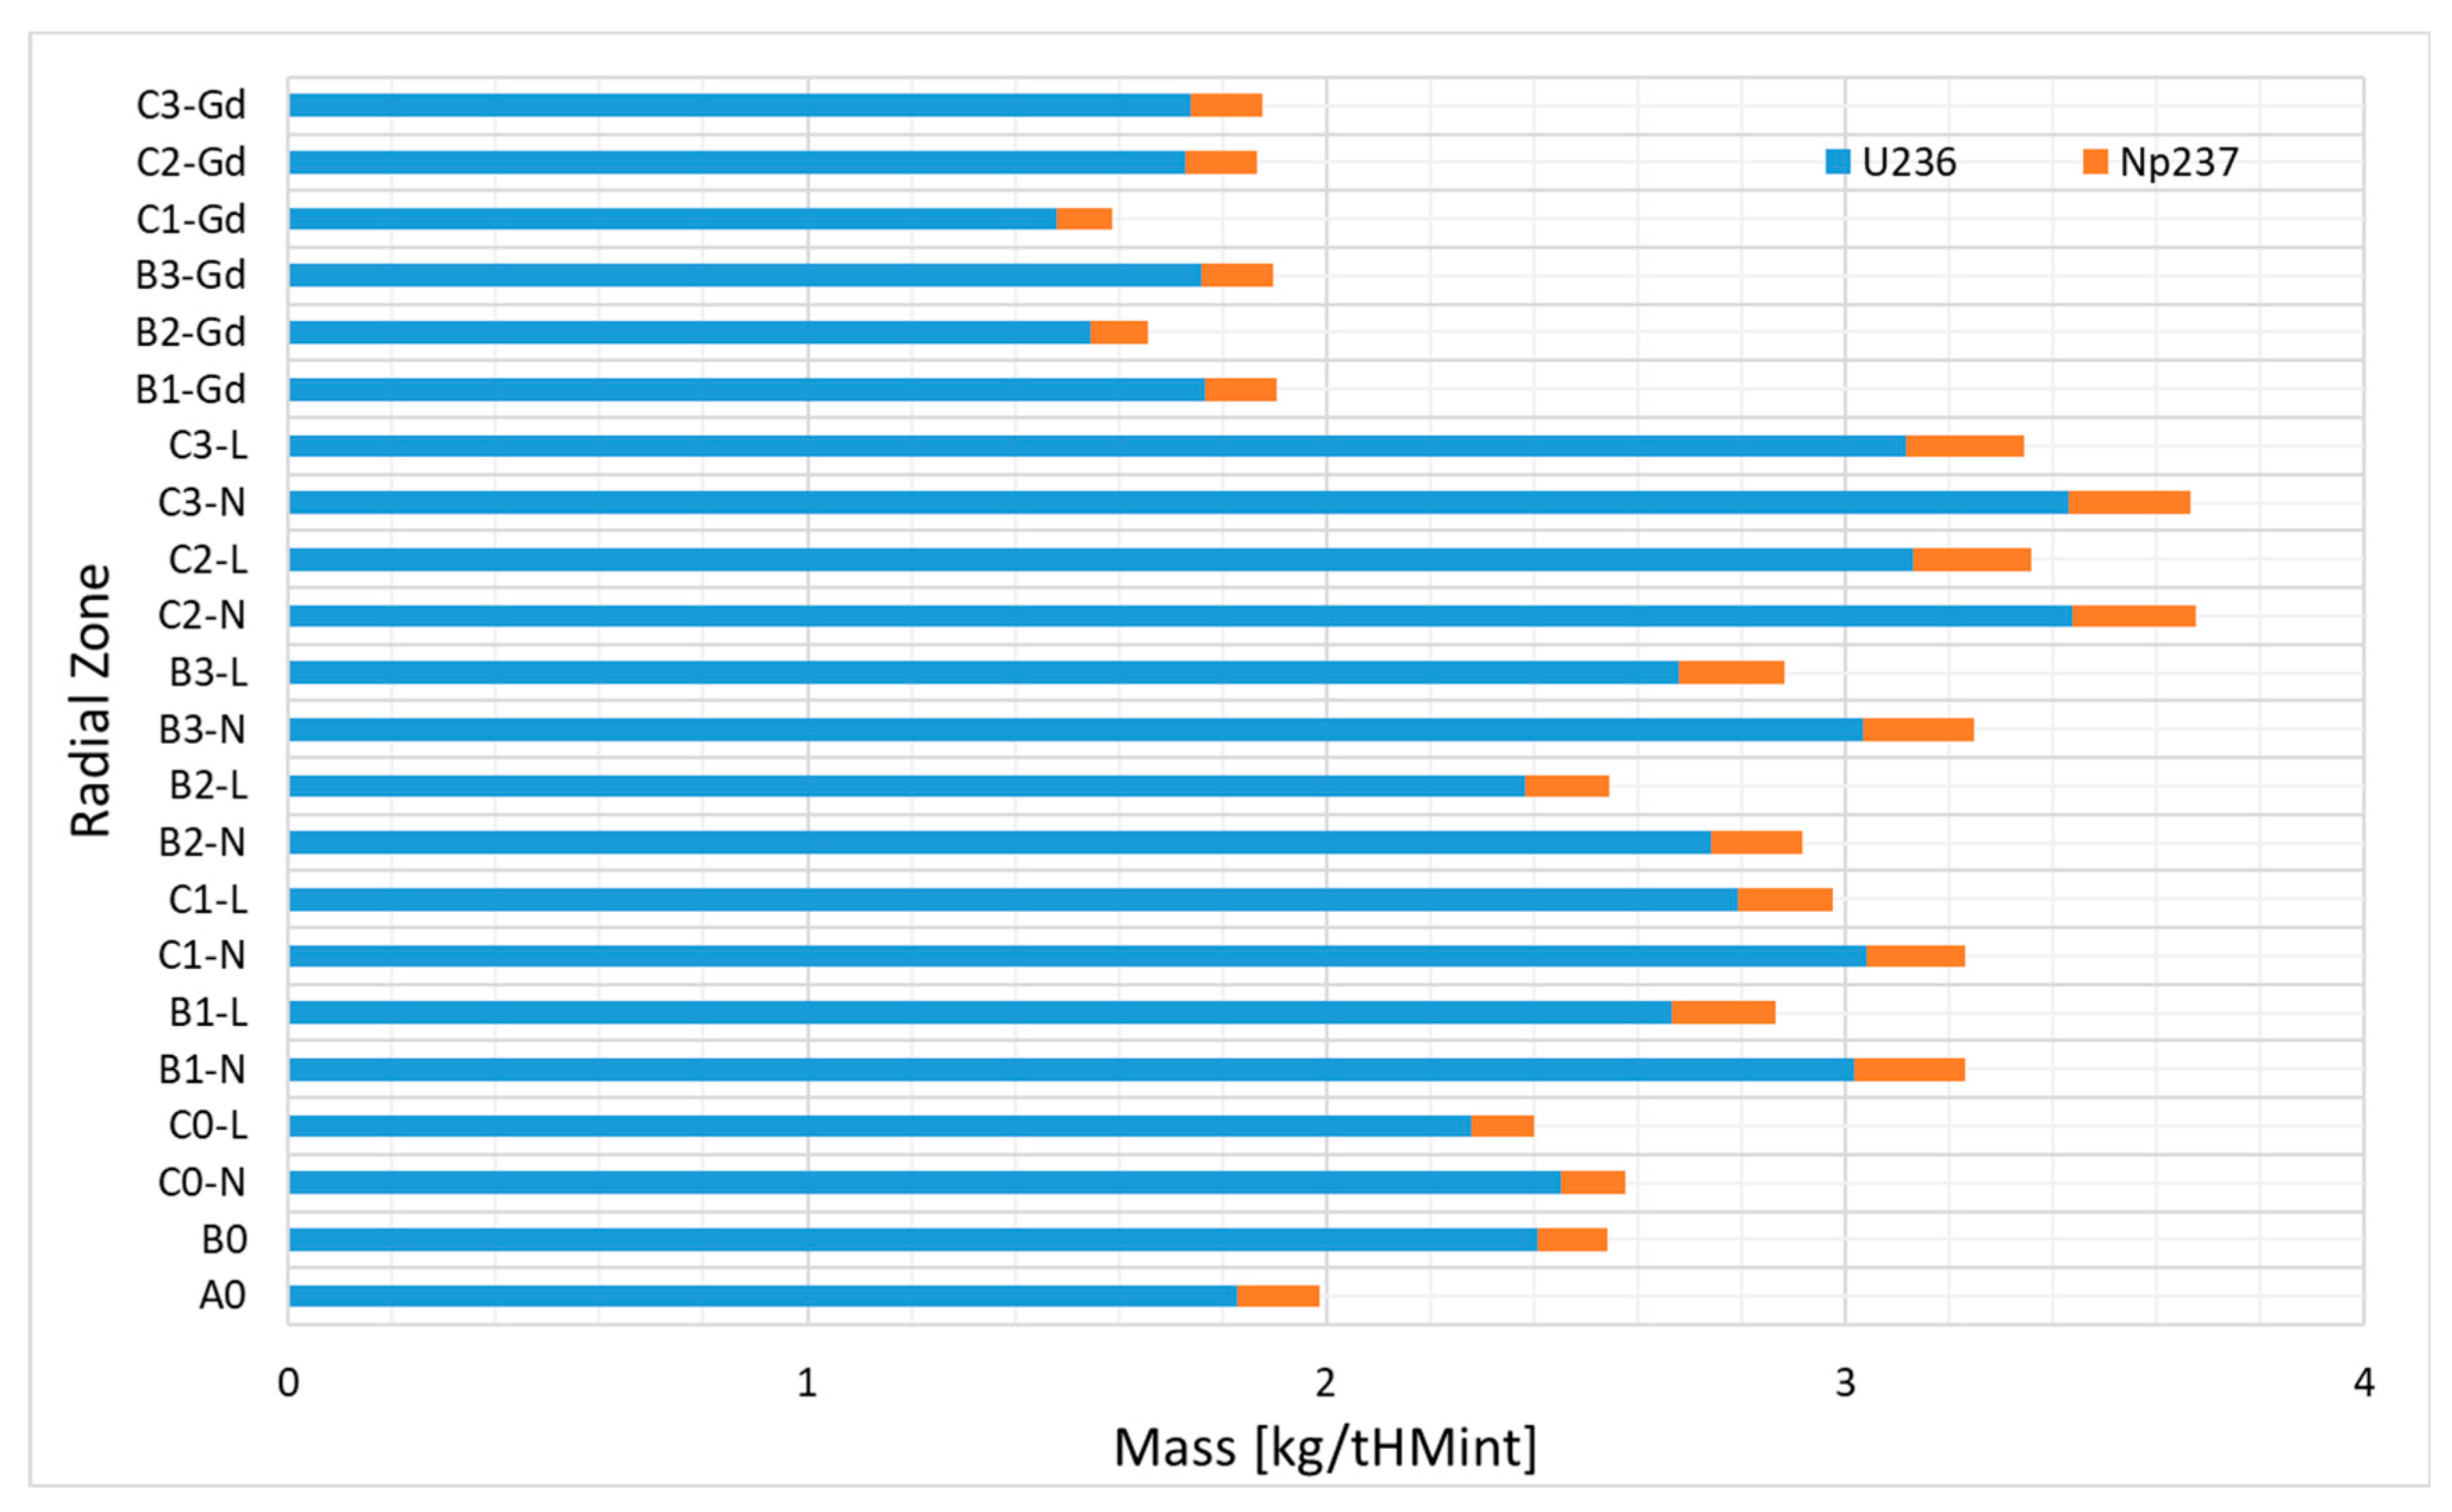
3.3. Radial Distribution

Figure 10 shows the radial distribution of uranium depletion at the EOC. The masses are normalized to the initial actinide mass in each radial burnup zone (Table 4). The zones C2 and C3 without gadolinia burnable absorber present the highest uranium depletion of about 33–35 kg. The enrichment in these zones is the highest (3.14–3.64%), and these are placed in the center of the core, which limits neutron leakage. The lowest uranium depletion of 20–24 kg was obtained for the gadolinia-bearing burnup zones due to the enhanced neutron absorption in odd gadolinium isotopes, and in zone C0 due to its location at the core peripheries and thus the lower neutron flux. It is worth mentioning that in some burnup zones, the 238U depletion dominates the 235U depletion, while in other zones, the 235U depletion dominates the 238U depletion. The balance between the depletions of both isotopes shows a correlation with fuel enrichment. The lower the enrichment, the higher the consumption of 238U due to its higher absorption macroscopic cross-section, which is visible for the low-enriched (2%) gadolinia-bearing burnup zones and the low-enriched (1.71%) zone A0. Moreover, higher consumption of 238U for the gadolinia-bearing burnup zones is caused by the limited thermal neutron absorption in 235U due to the extended neutron absorption in the gadolinium isotopes during the first half of the reactor cycle. The increase in enrichment causes an increase in the macroscopic fission cross-section of 235U, which dominates depletion, especially in the high-enriched C2 and C3 burnup zones.
Figure 11 shows the normalized distribution of the plutonium masses at the EOC. The highest plutonium masses of about 7.0–7.5 kg were obtained for the C2 and C3 burnup zones located in the core center. The lowest masses of about 5–6 kg were obtained for the C0 and B0 burnup zones located in the core peripheries. The final concentration of plutonium depends mainly on the neutron flux and thus on the placement of the burnup zones in the core. However, the concentrations of some plutonium isotopes depend on the gadolinia content and the uranium enrichment. The concentrations of 239Pu are the lowest for the A0, B0, and C0 burnup zones. The B0 and C0 zones are located at the core peripheries and show low neutron flux and thus low breeding of 239Pu from 238U. In the case of zone A0, the lower concentration of 239Pu is related to its extended fission compensating the 235U depletion and transmutation to higher plutonium isotopes. The highest concentrations of 239Pu were obtained for the high-enriched (C2-N, C3-N) and gadolinia-bearing (C2-Gd, C3-Gd) zones located in the core center. The accumulation of 239Pu in the C2-N and C3-N burnup zones is related to the high enrichment of 235U and suspended fission of 239Pu. In the gadolinia-bearing burnup zones C2-Gd and C3-Gd, the fission of 239Pu is limited because of neutron absorption on odd gadolinium isotopes, which leads to the accumulation of 239Pu. The concentration of the remaining plutonium isotopes (238Pu, 240Pu, 241Pu, 242Pu) depends mainly on the position of the burnup zone in the core. The inner zones show the highest concentrations, while the outer zones show the lowest concentrations. In the case of 238Pu, the presence of gadolinium influences its formation, i.e., the concentrations of 238Pu are lower due to the lower concentration of its precursors 237Np and 242Cm due to the lower transmutation of 238U. The concentrations of 240Pu, 241Pu, and 242Pu are significant for the burnup zone A0, where the concentration of 239Pu is low, and the depletion of 238U is high.
The radial normalized distribution of the 236U, 237Np, and americium masses at the EOC are presented in Figure 12 and Figure 13. The mass of 236U is the lowest in the gadolinia-bearing and A0 burnup zones (1.5–2 kg), and the highest in the high-enriched C2 and C3 burnup zones (3–3.5 kg) located in the center of the core. The formation of 236U corresponds straightforwardly to the depletion of 235U.
The concentration of 237Np is the lowest in the gadolinia-bearing burnup zones and the C0 and B0 burnup zones located at the core peripheries (0.11–0.14 kg). The highest concentration is present in the high-enriched C2 and C3 burnup zones located in the core center (3–3.5 kg). The reason for the larger concentration in the high-enriched burnup zones is related to the (n,2n) reaction on 238U, causing the production of 237Np, which appears in the fast neutron spectrum. The reaction is more probable in fuel with higher enrichments due to the larger number of fissions and thus fast neutrons.
Considering the americium concentrations, the lowest one was obtained for the outer burnup zones C0 and B0 (10–15 g), and the highest for the inner zones (30–45 g), especially zone A0. The concentration of americium is driven by the concentrations of 241Am and 243Am, which show the highest mass among the americium isotopes. All americium isotopes (241Am, 242mAm and 243Am) show similar behavior as lumped americium, considering their mass distribution in the core. The highest concentration of americium in the A0 zone is related to the highest depletion of 238U, which is a gateway isotope for the formation of higher actinides.
Figure 14 presents the final distribution of normalized curium masses. The concentrations of curium are driven by 242Cm and 244Cm. The highest mass of curium corresponds to the inner burnup zones (9–11 g), especially zone A0. The lowest masses of curium were observed for the outer burnup zones B0 and C0. The radial distribution of the curium isotopes (242Cm, 243Cm, 244Cm, 245Cm, 246Cm, 247Cm) is similar to the distribution of the americium isotopes.
The tables presenting numerical values of radial mass distributions are available in Supplementary Materials.

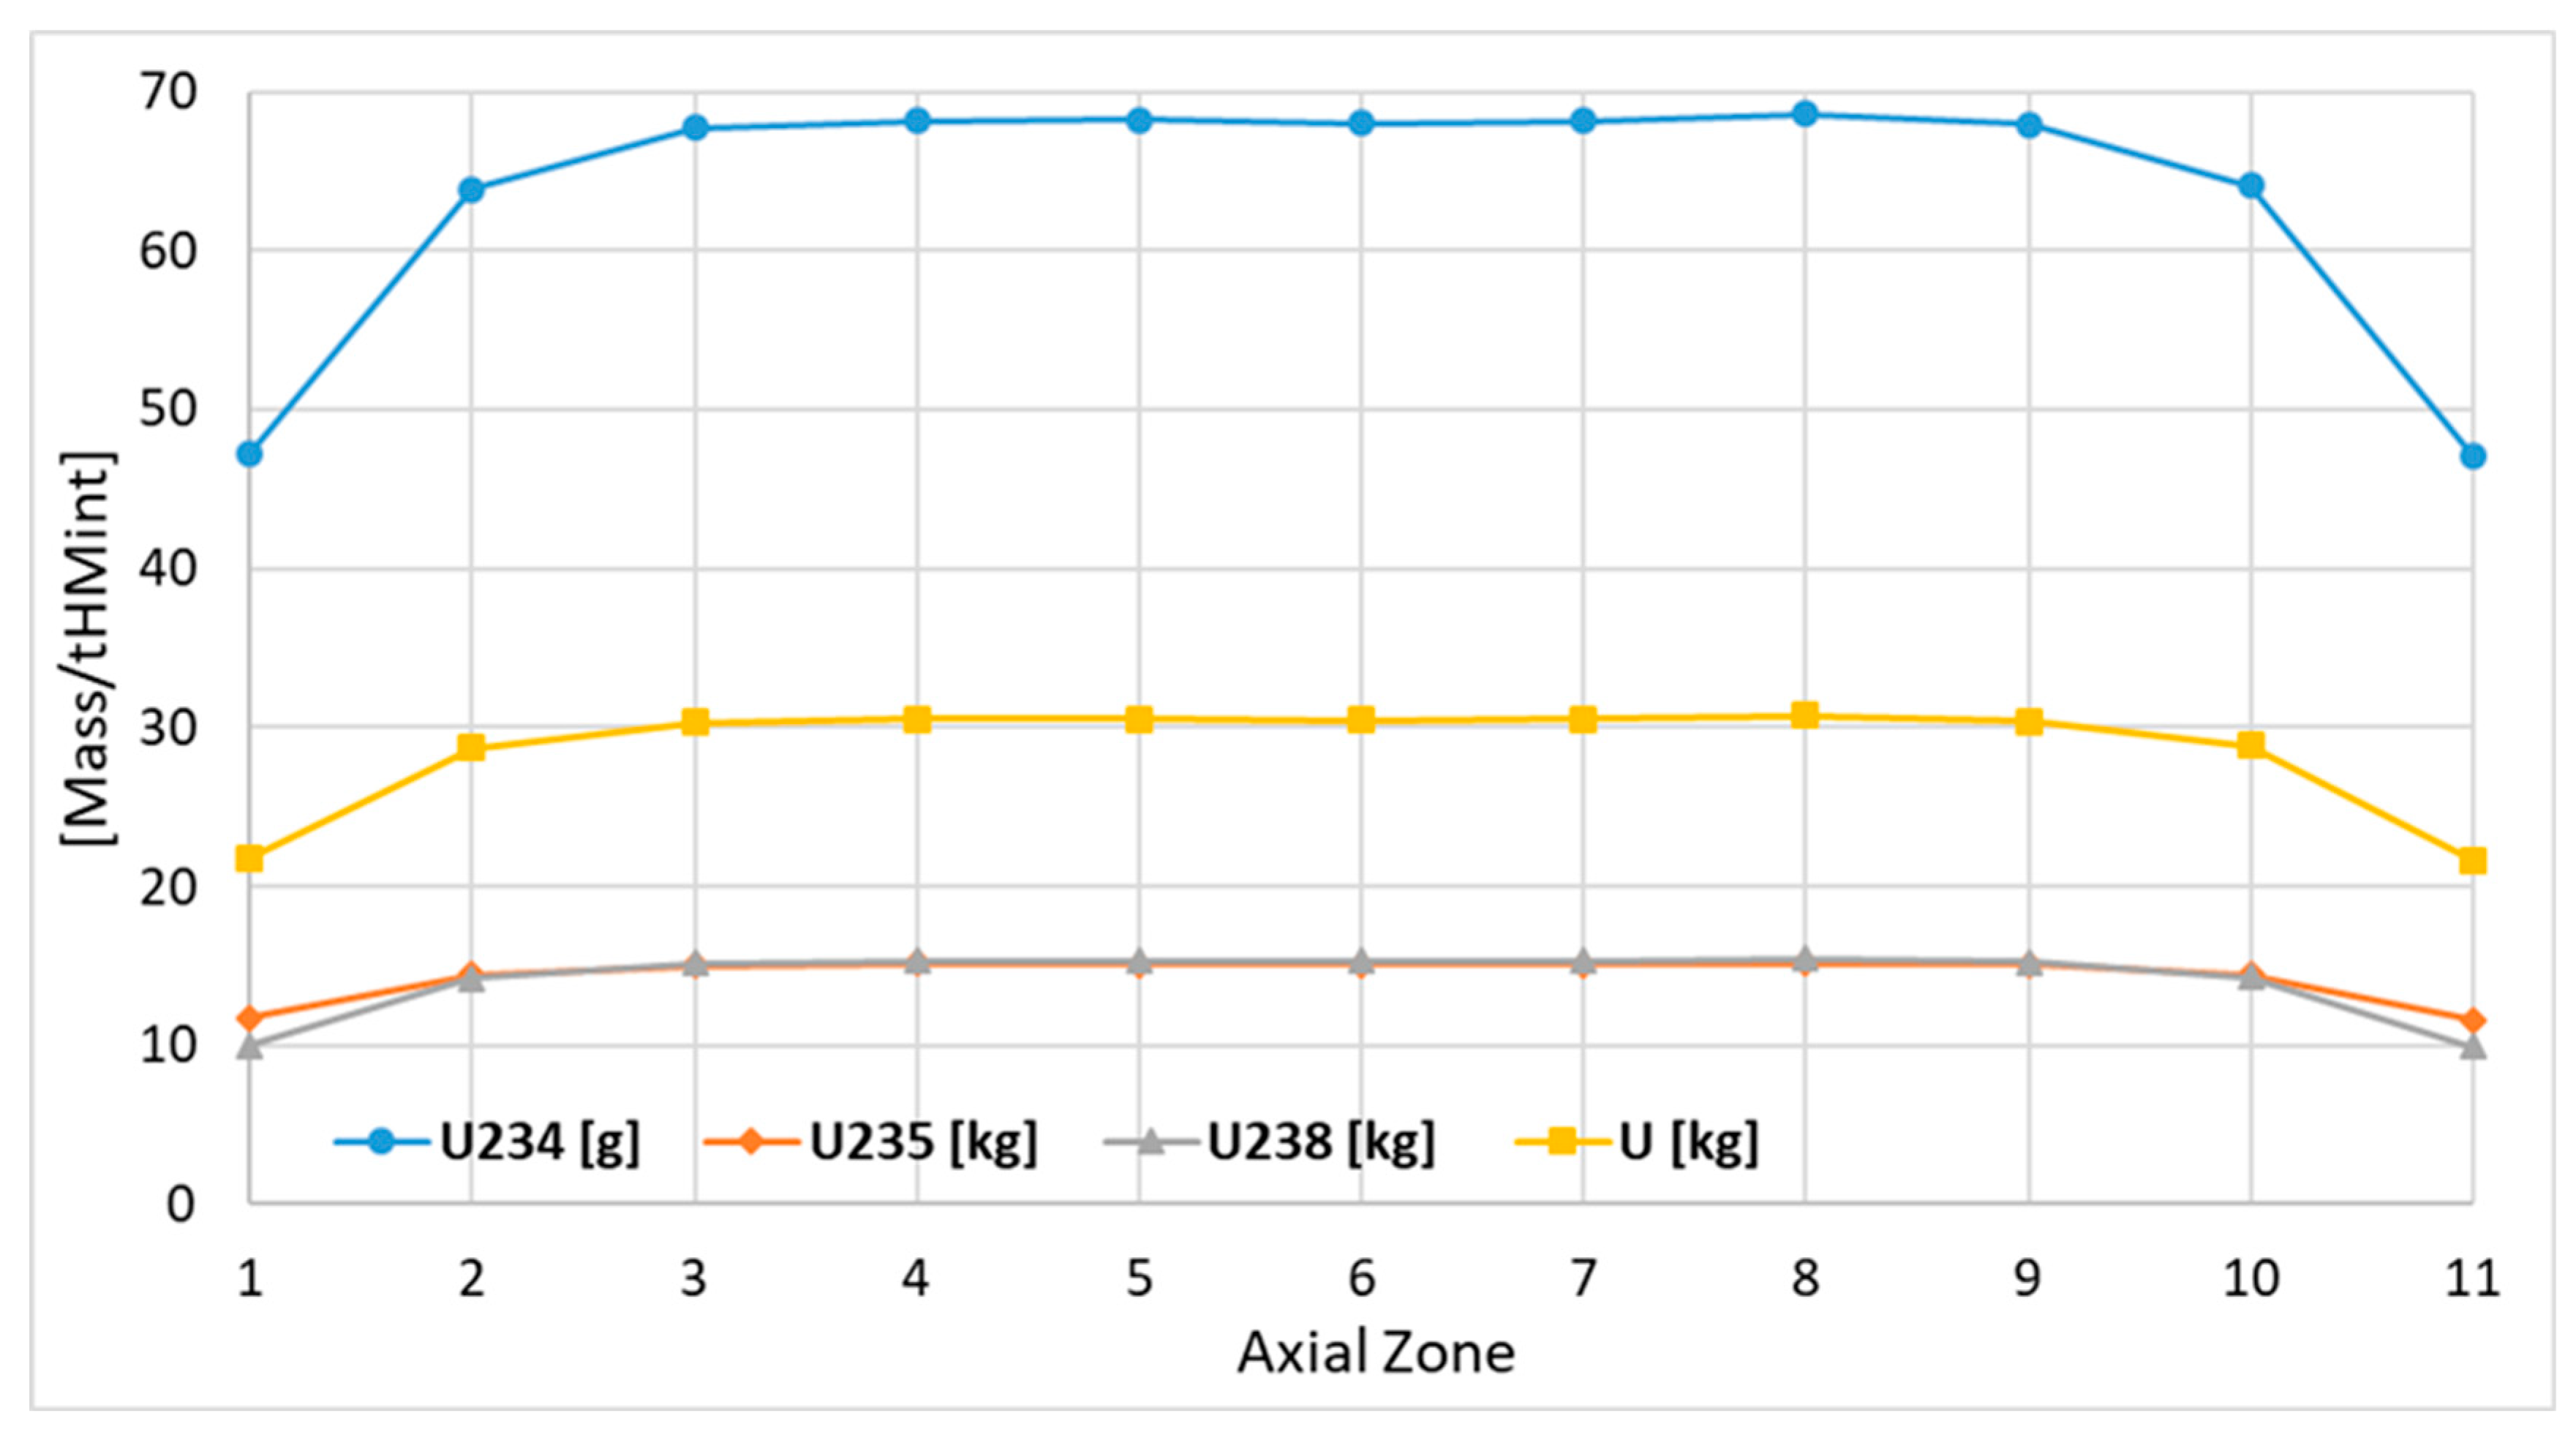
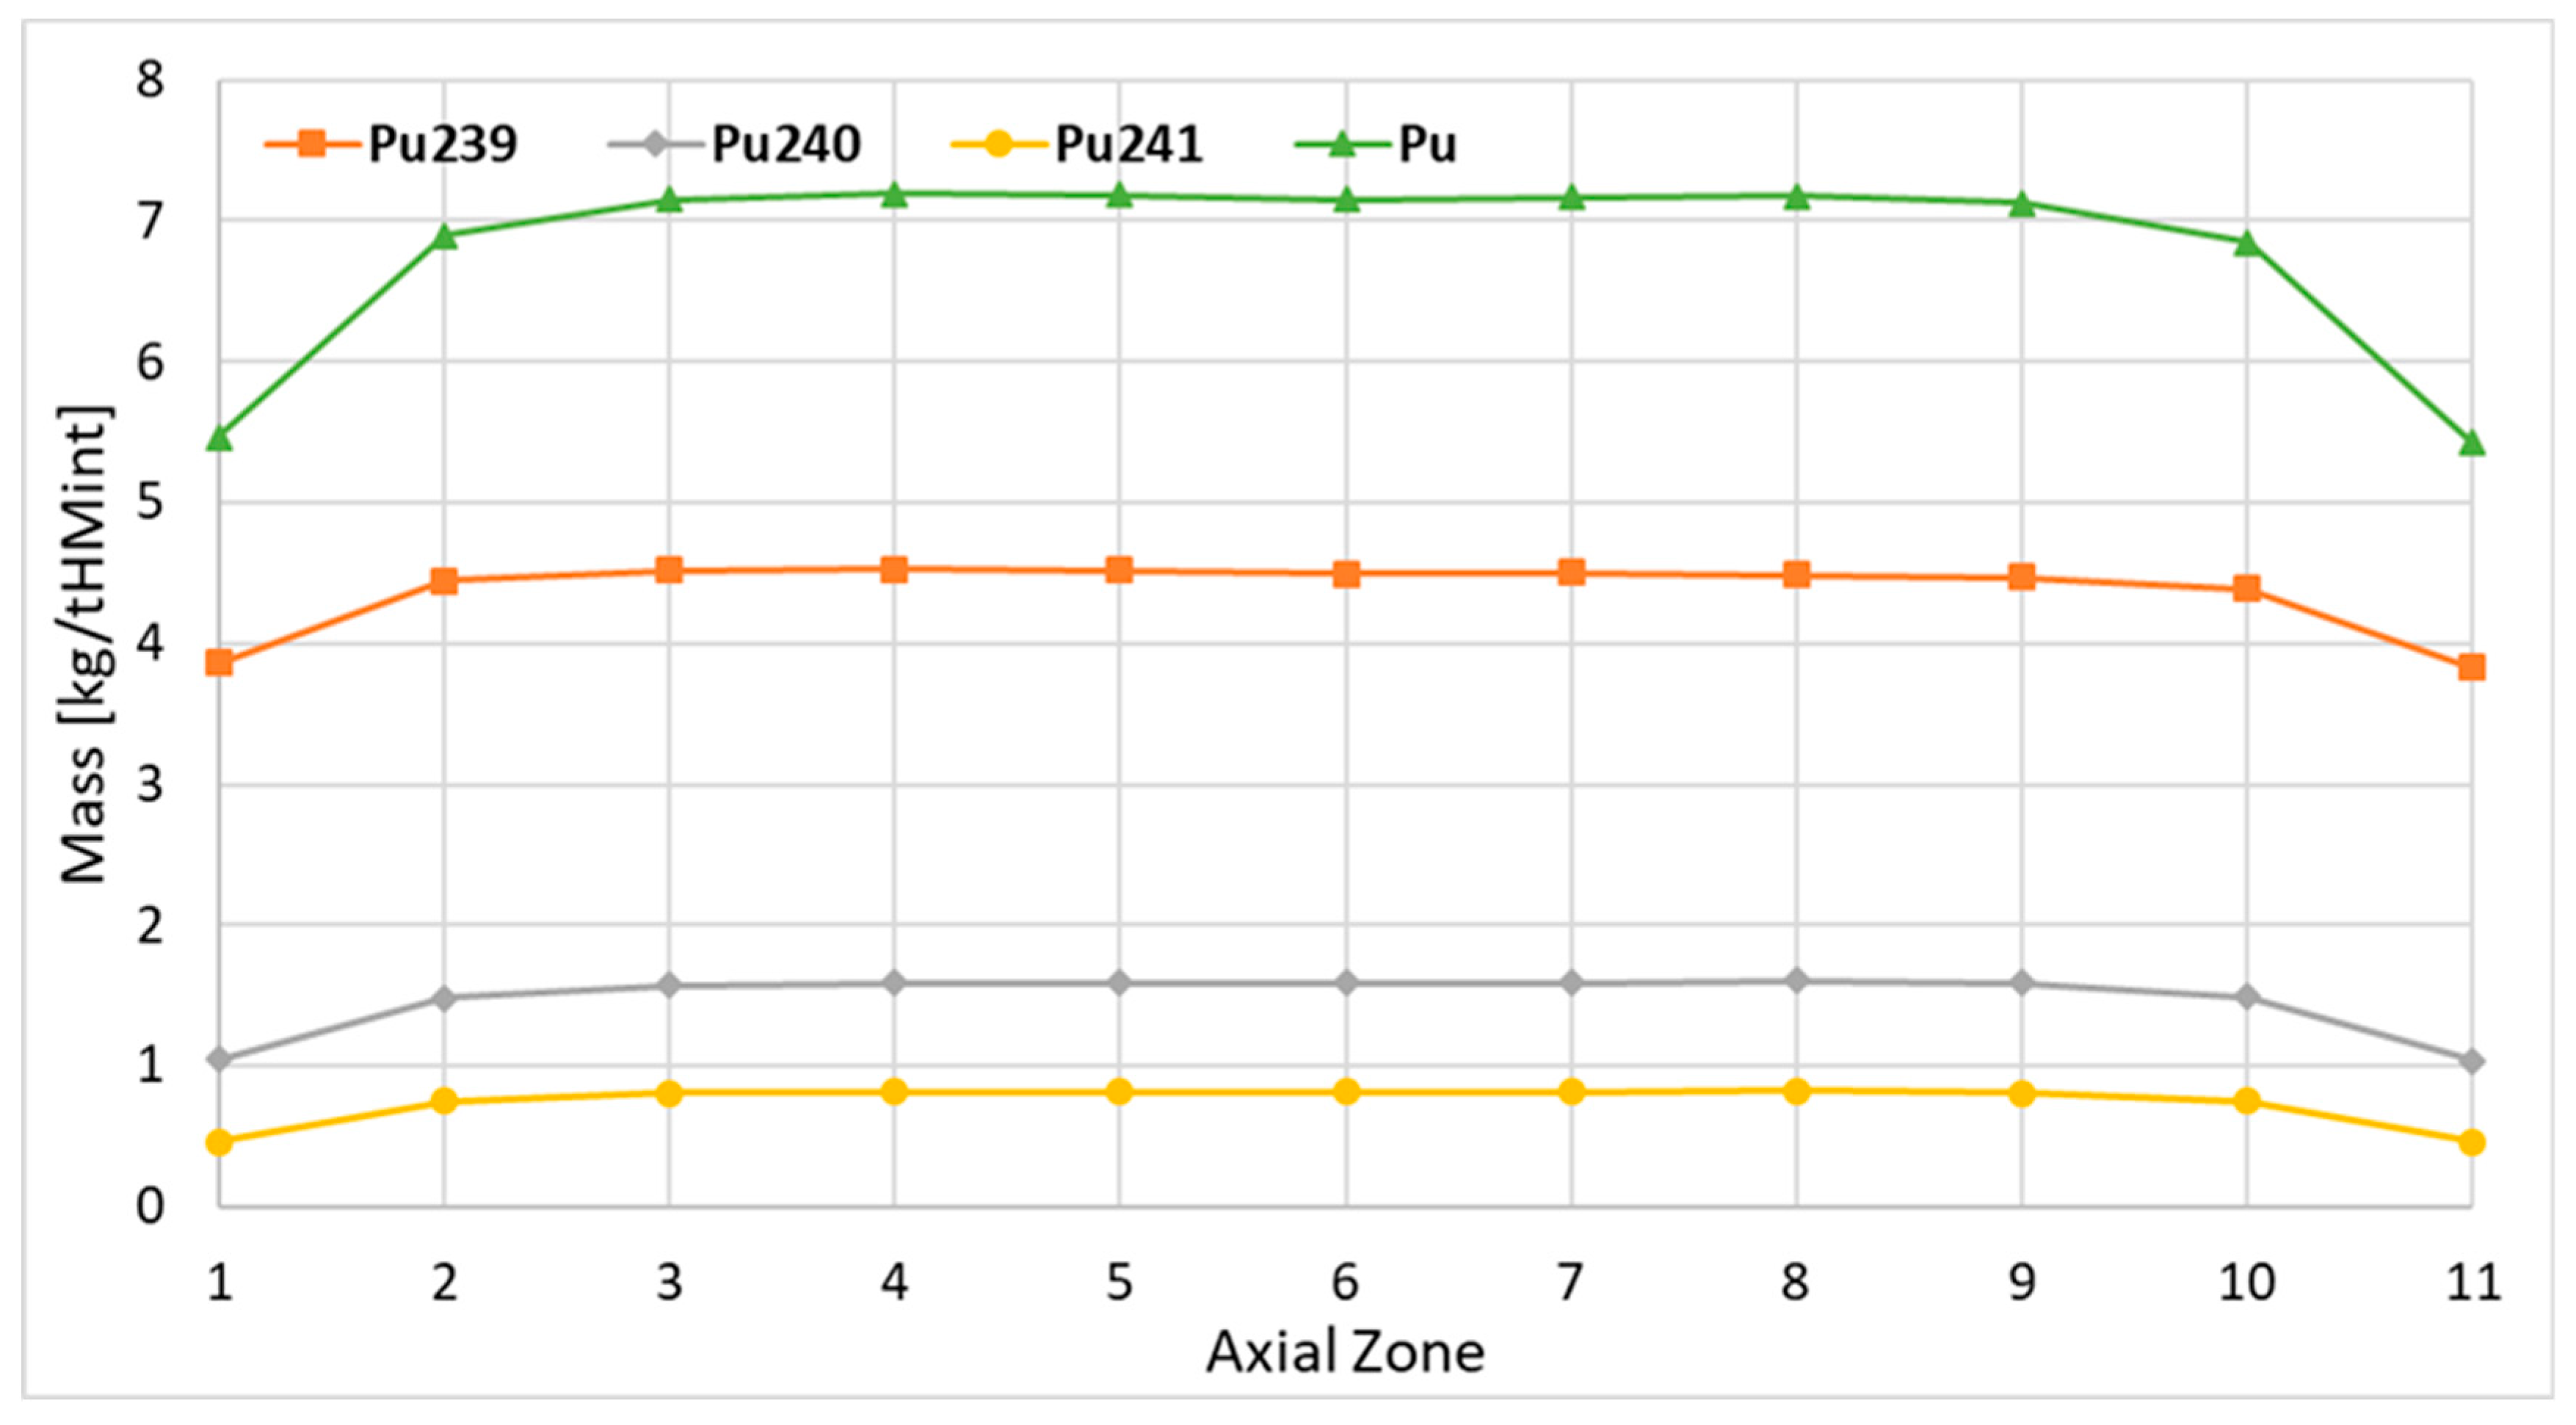
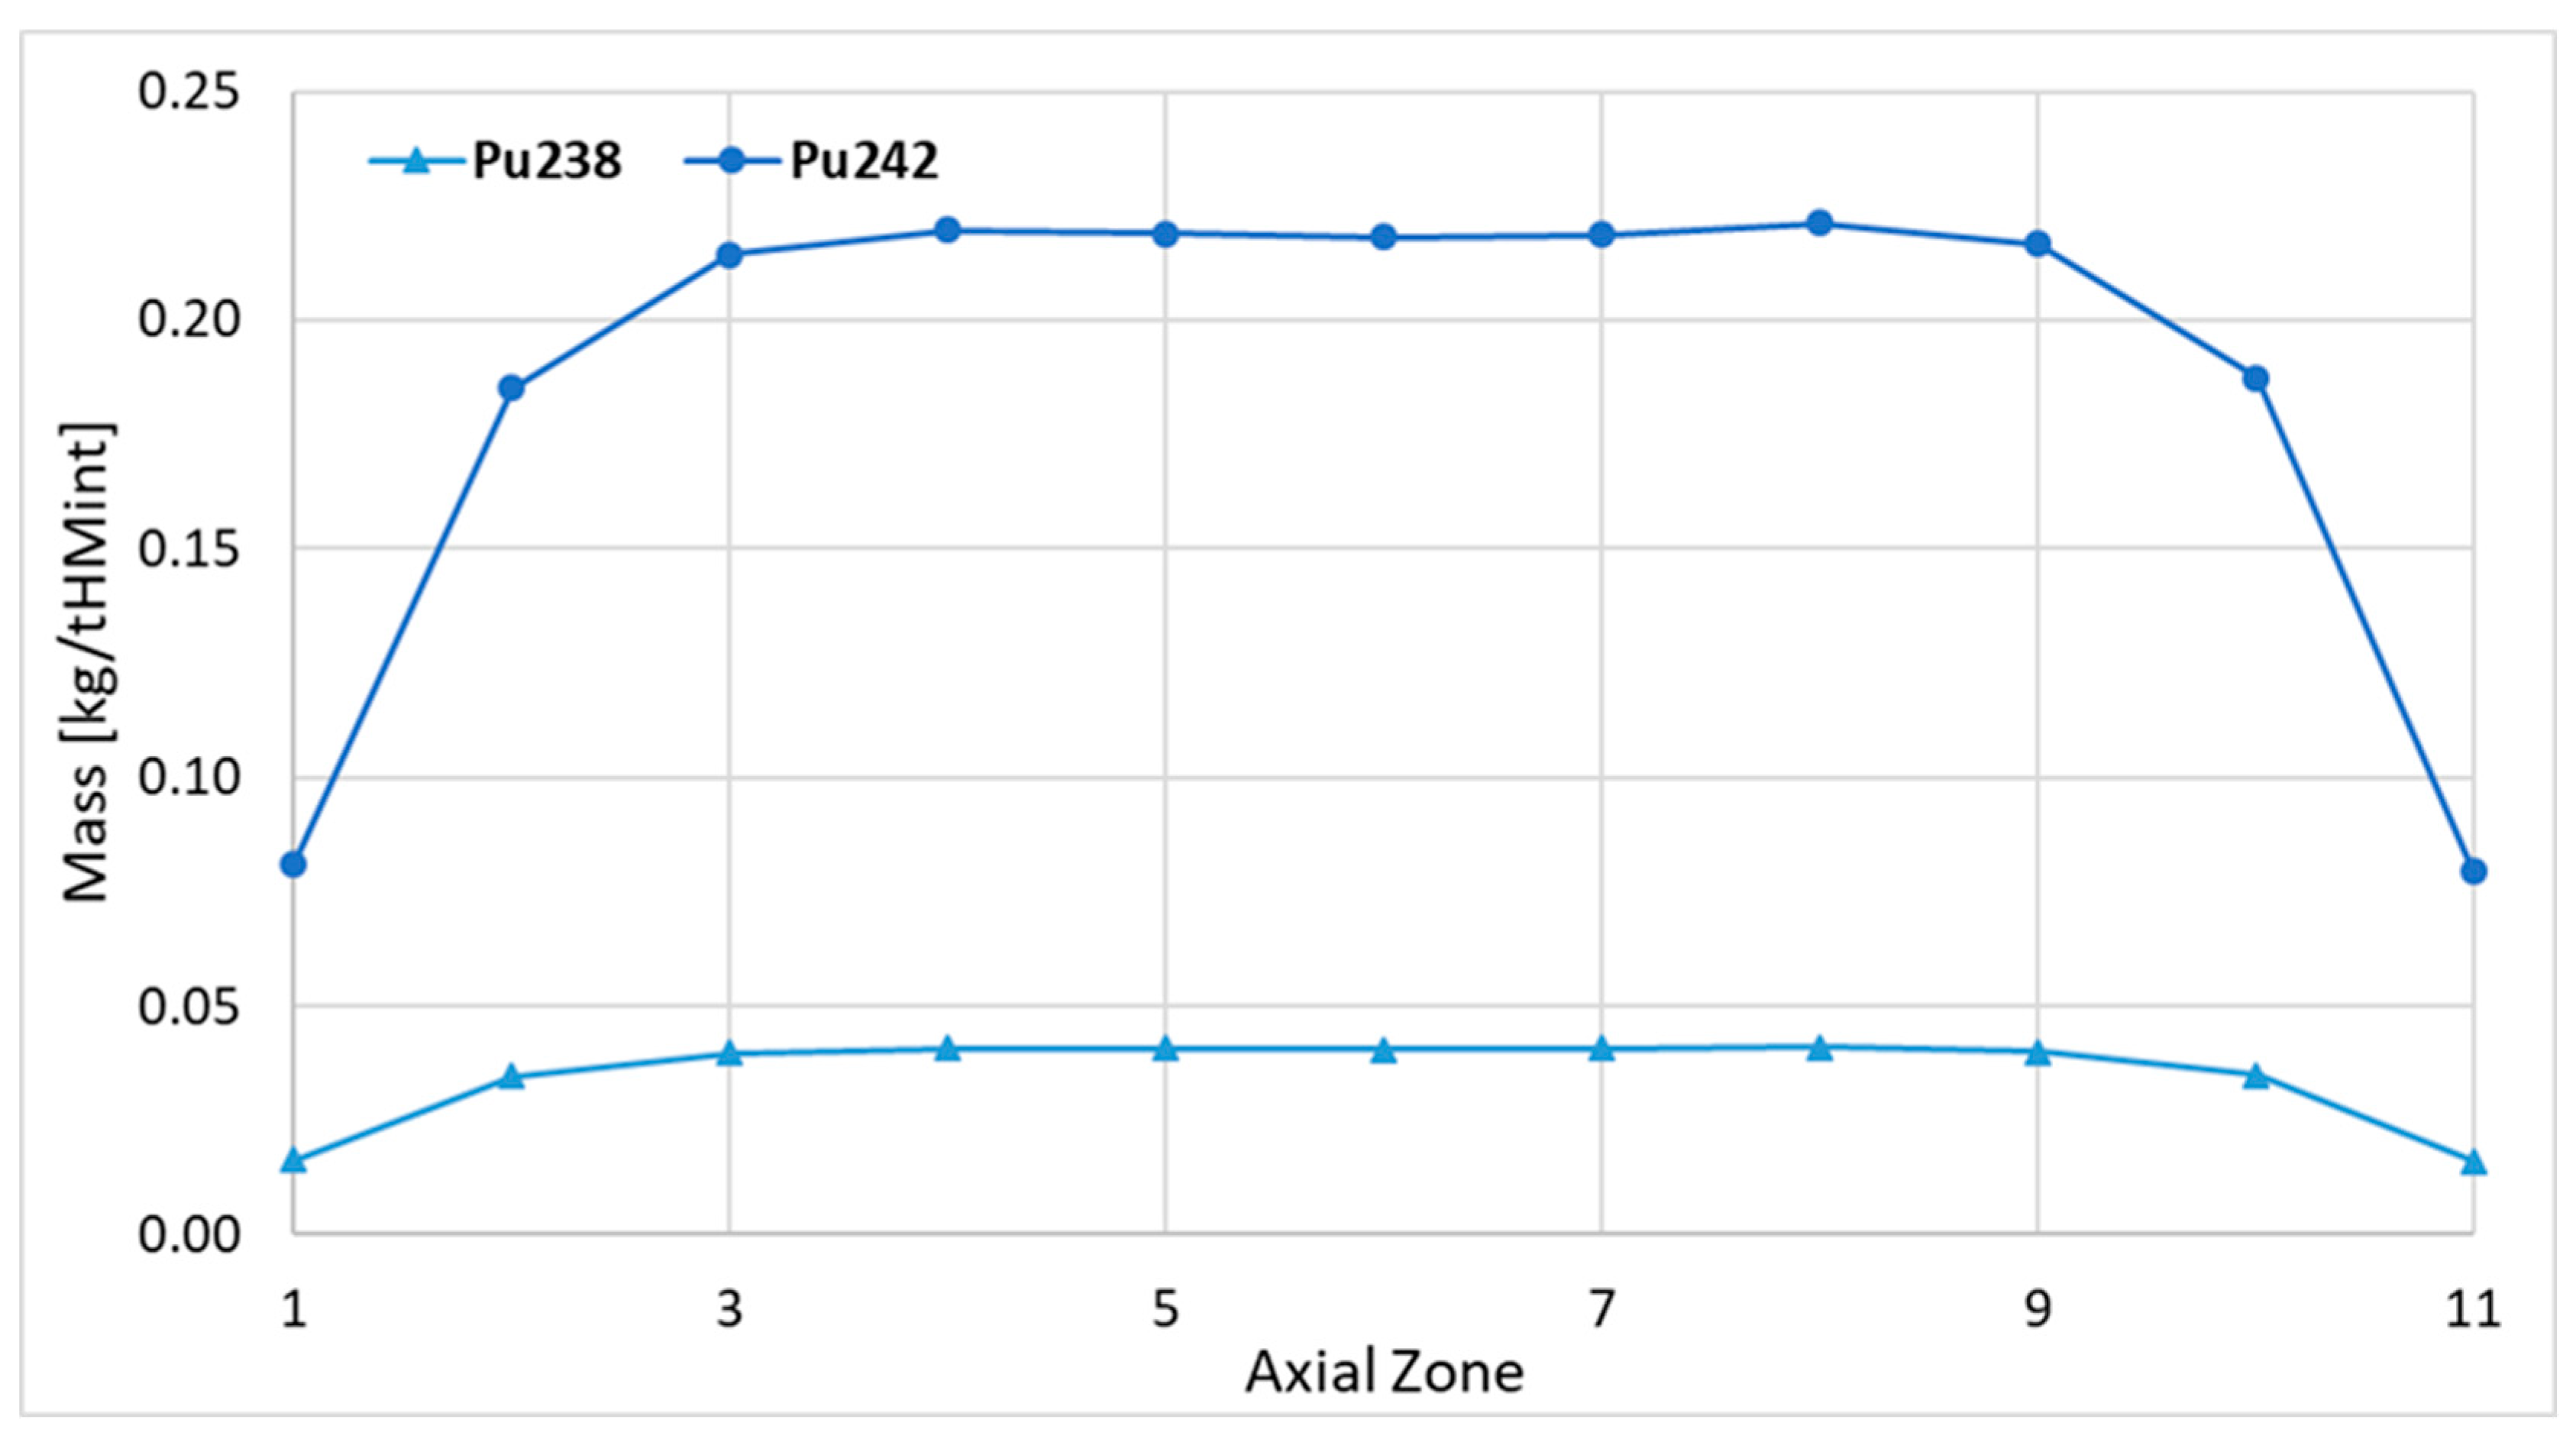
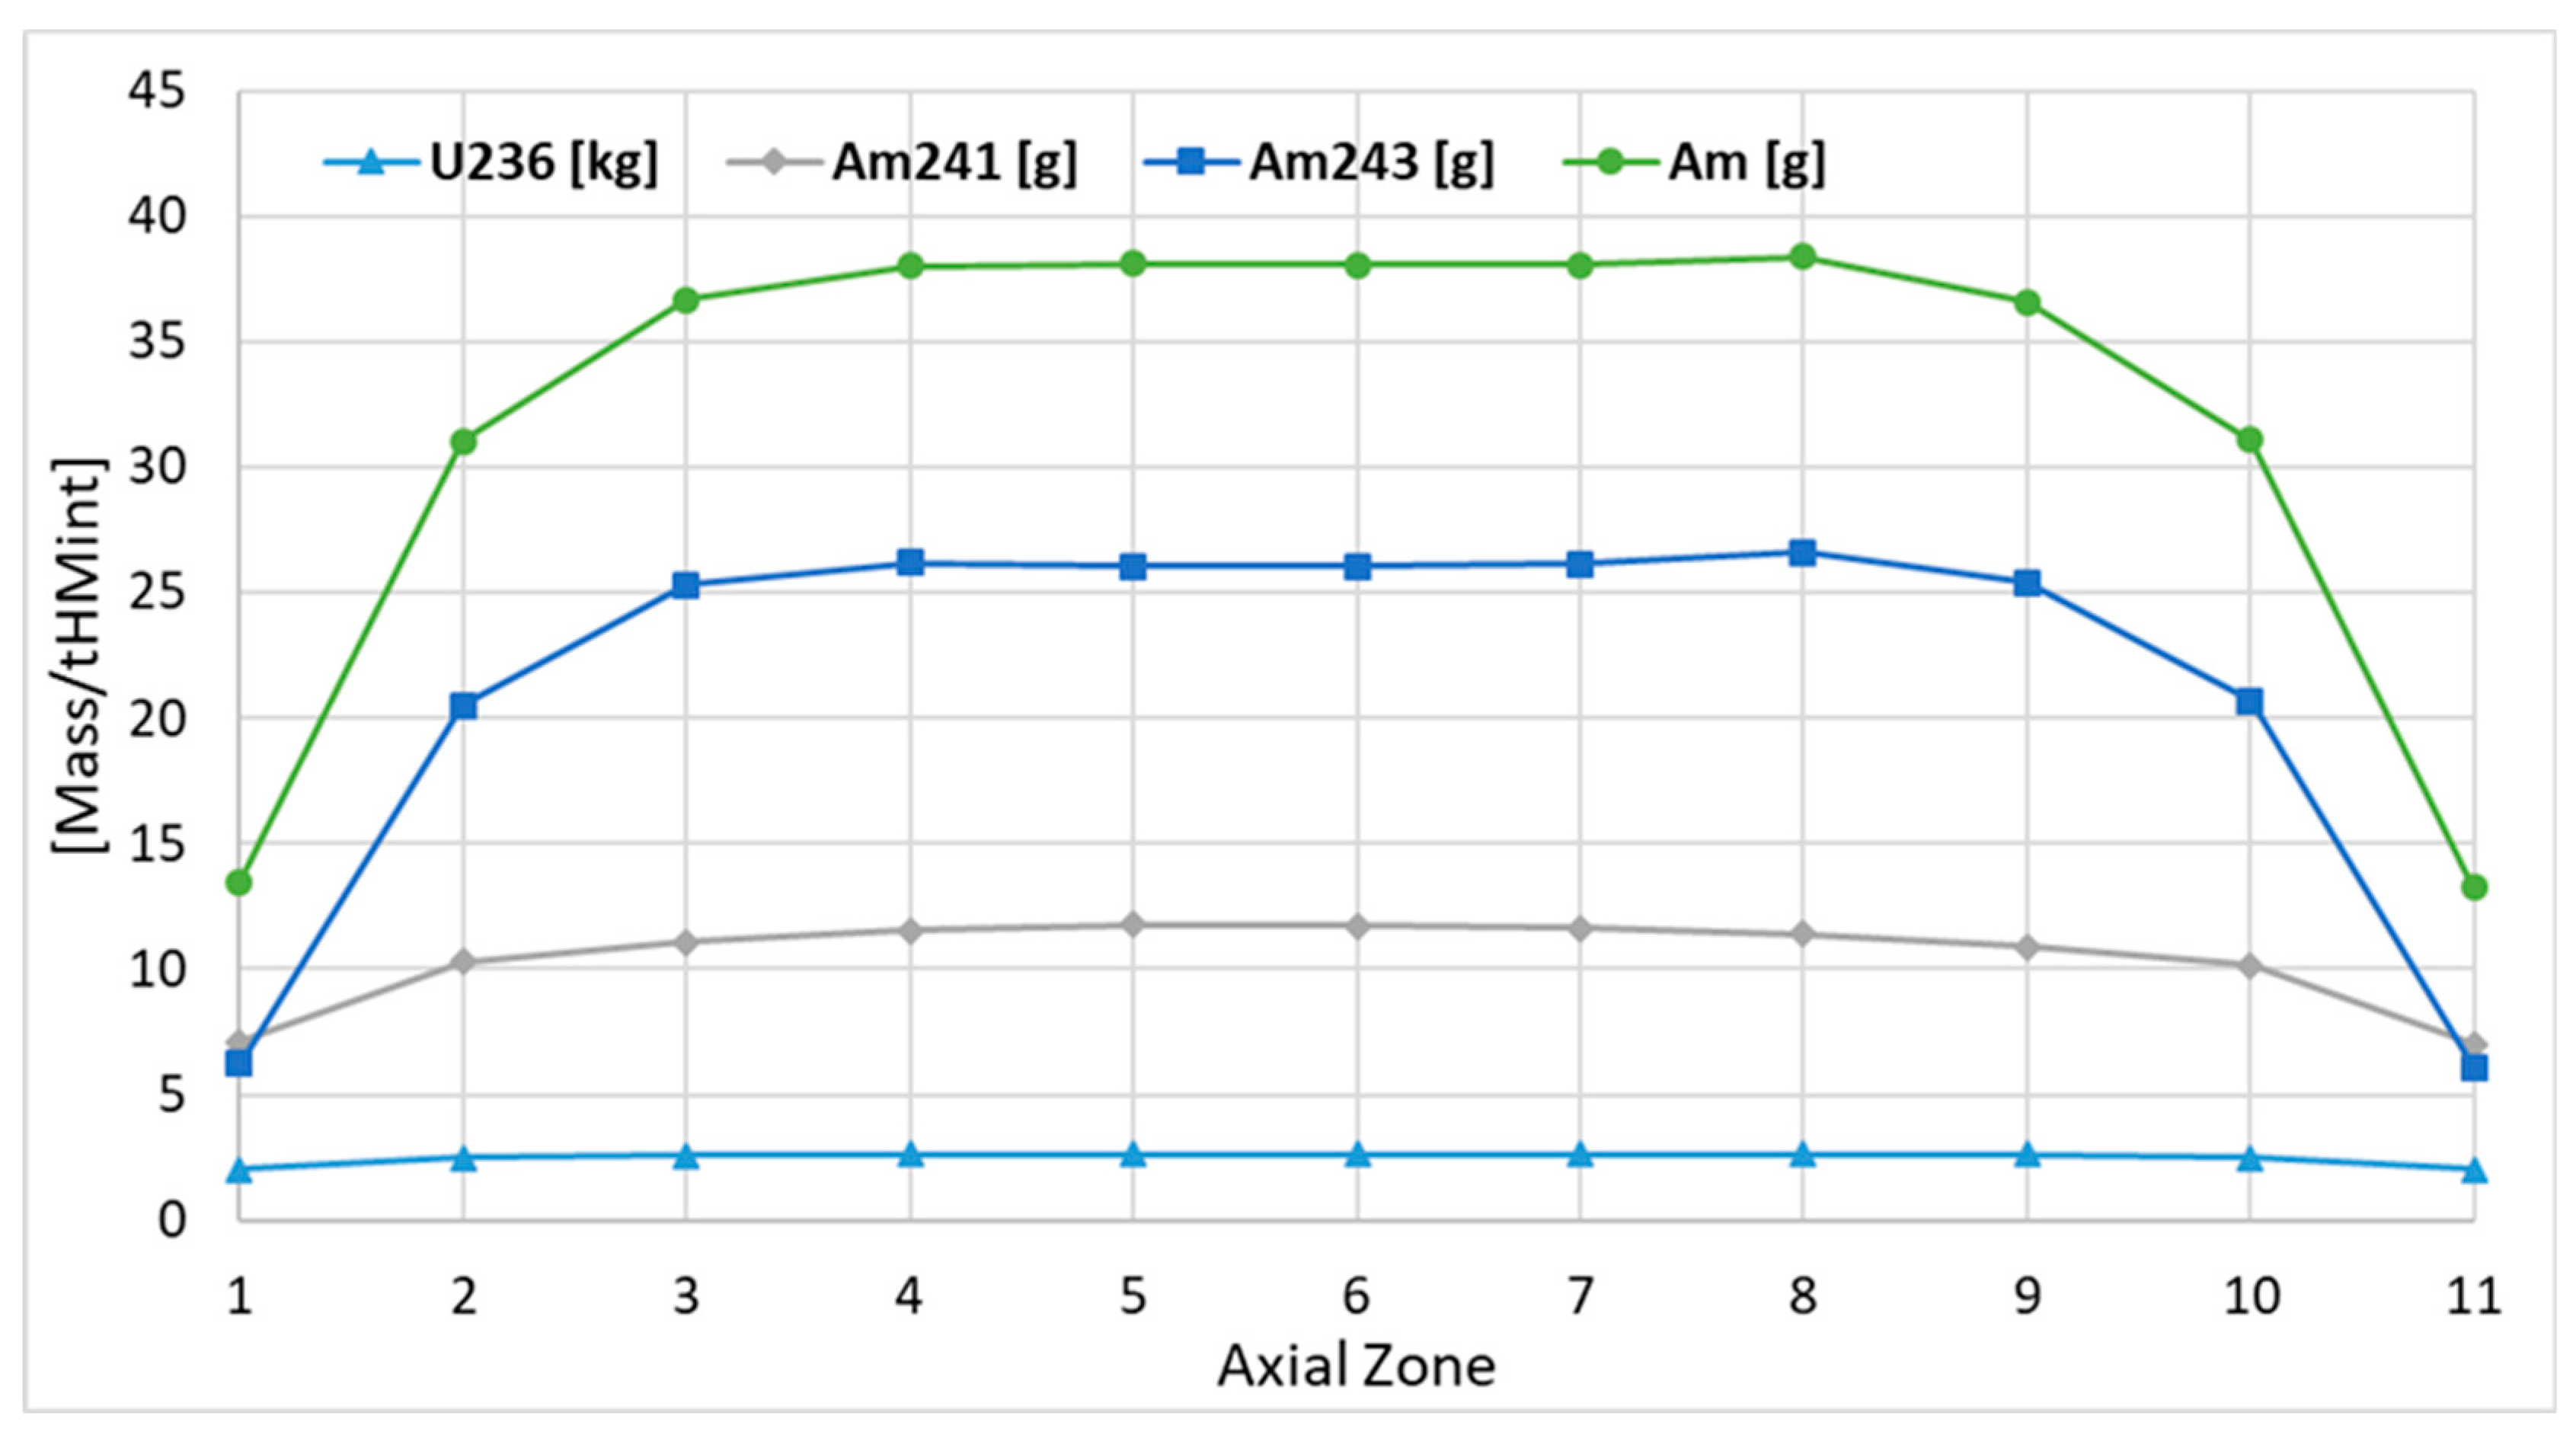
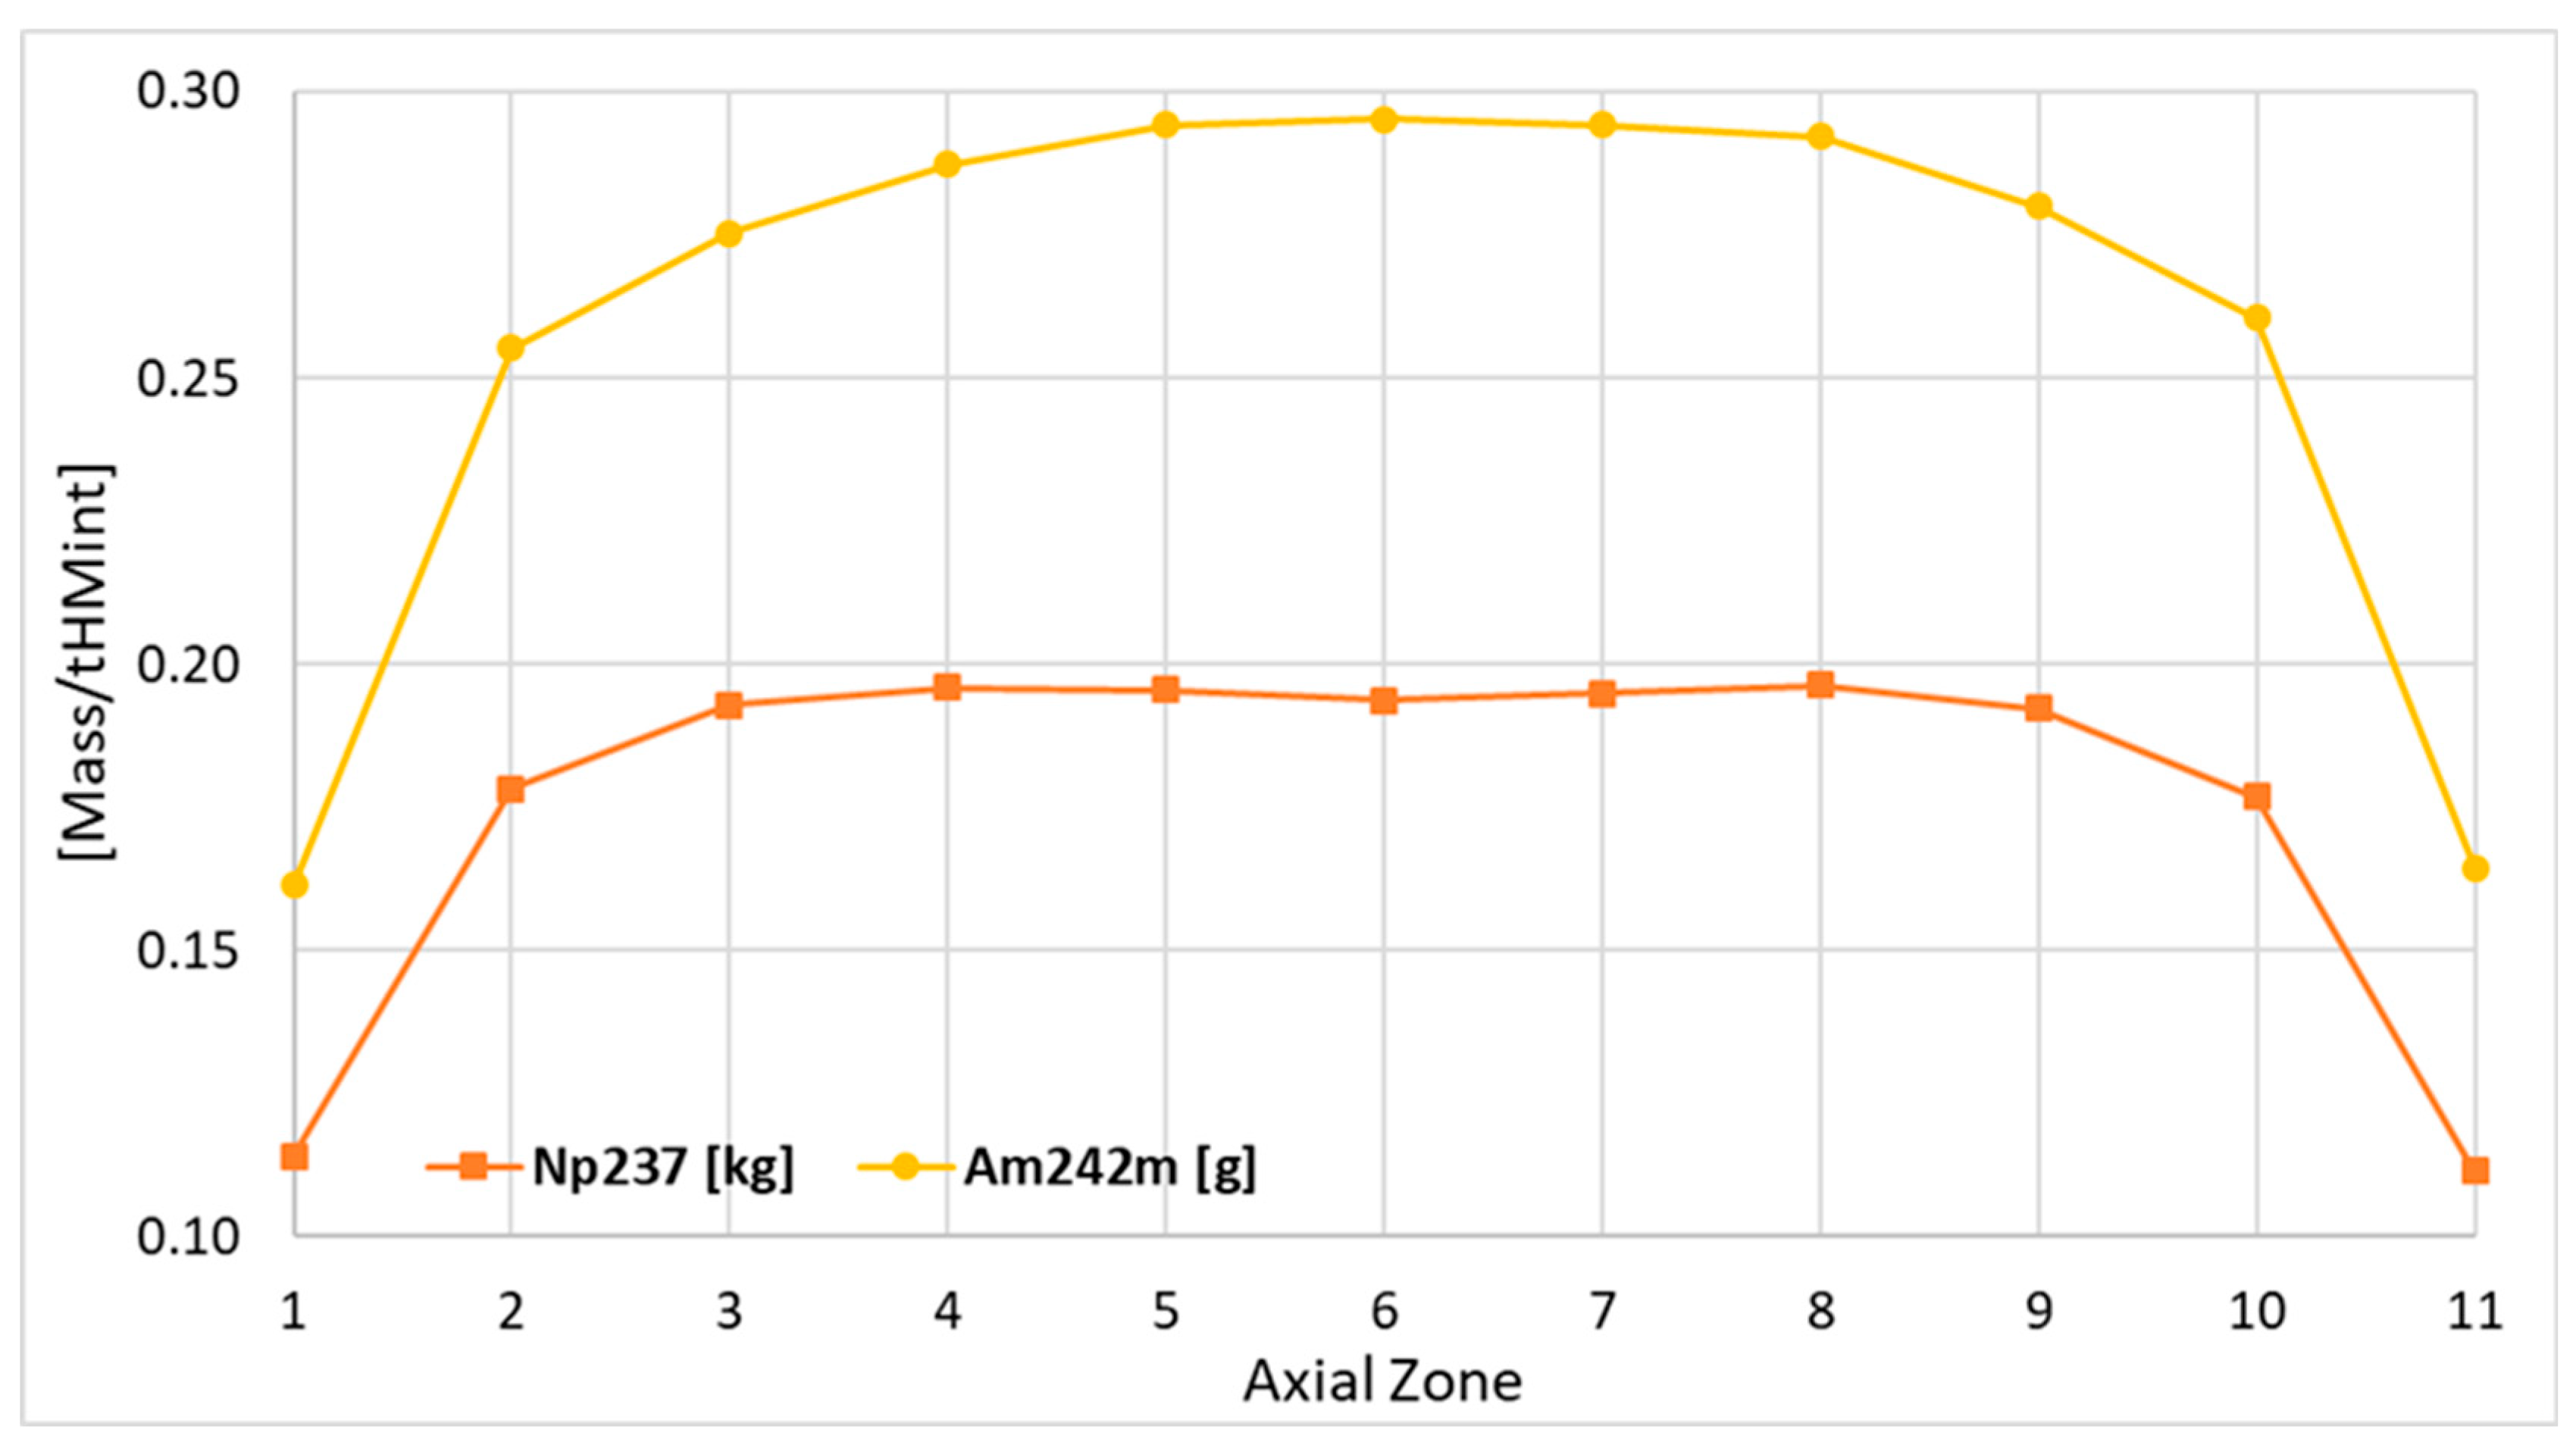
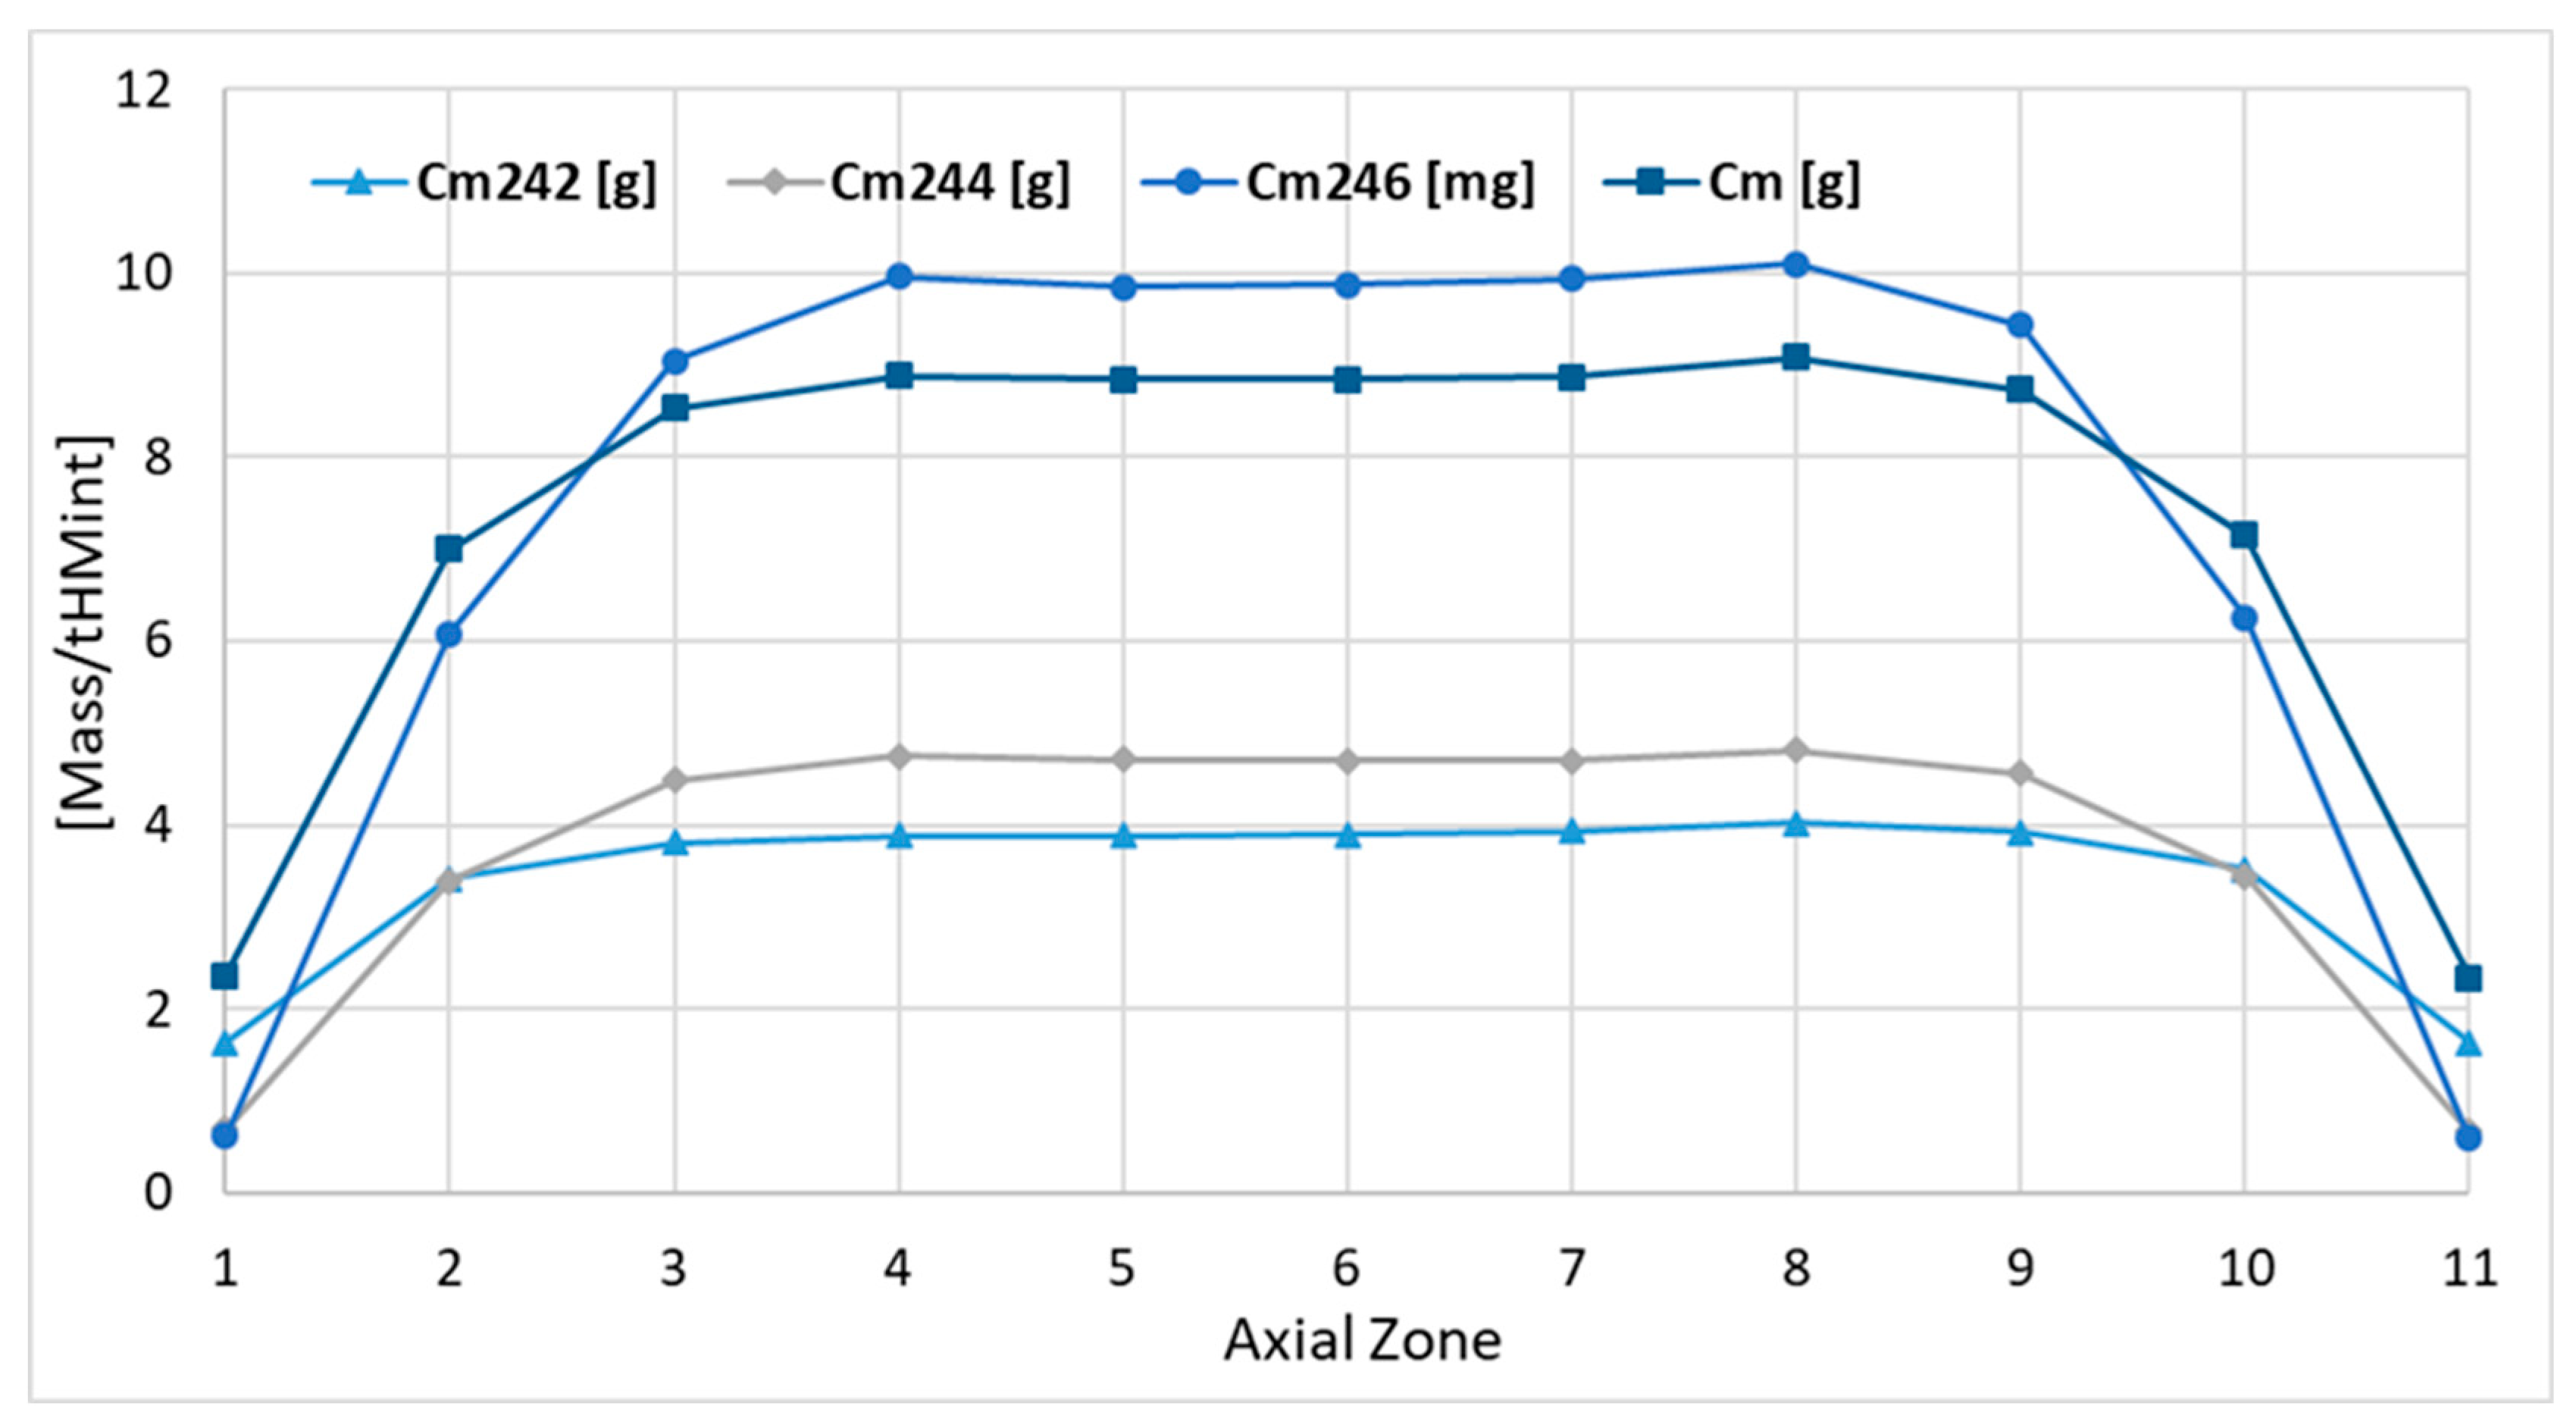
3.4. Axial Distribution

Figure 15 shows the axial distribution of the uranium depletion at the EOC in each axial burnup zone. The curves present an almost uniform distribution of the uranium depletion in the center of the core in zones 3–9, only with little depression in the central zone due to the higher neutron fluence. The zones closer to the bottom and top reflector show lower depletion due to the lower neutron fluence during the reactor cycle. In order to present a uniformity of mass and depletion distribution along the active core, the ratio of masses in the corresponding top and bottom zones was investigated. If the ratio is close to the unity, the mass distribution is more uniform. In the case of uranium depletion, the difference in mass for all isotopes is far below 1%. Figure 16, Figure 17, Figure 18, Figure 19, Figure 20 and Figure 21 show the axial distribution of the actinide concentrations at the EOC.
In the case of the plutonium isotopes, some decrease in the mass in the central zone is observable; see Figure 16 and Figure 17. The reason for this effect is the higher total neutron fluence in the center of the core and higher transmutation of the plutonium isotopes. The concentration of plutonium is driven by the mass of 239Pu. The 239Pu masses are higher in each top burnup zone on average by about 1.0% compared with the corresponding bottom burnup zone. Considering other plutonium isotopes, this tendency was not detected, and the difference oscillates maximally at about 1%. However, the mass of 238Pu and 242Pu is about 2% higher in the very top burnup zone compared with the very bottom burnup zone.
Figure 18 and Figure 19 depict the distribution of the 236U, 237Np, and americium isotopes at the EOC. The distribution of 236U is uniform along the reactor core, and the difference between the burnup zones is far below 1% and does not show any particular trends. The distribution of 237Np shows a higher mass of about 2.5% in the very top burnup zones compared with the very bottom burnup zone. In the remaining zones, the differences are very close to the unity, and oscillate around 0.5%. Little depression in 237Np mass in the central zones is also visible.
The americium mass distribution depends on all americium isotopes with leading 241Am and 243Am. All americium isotopes show the uniform distribution in the core center. However, some trends can be identified by investigating the mass differences at the top and bottom of the core. The 241Am masses are higher in the top burnup zones by about 1.5%, the 242mAm masses are lower in the top zones by about 1.5%, and the mass of 243Am is higher by about 2.5% only in the very top burnup zone, while in the remaining zones the difference in 243Am is far below 1%.
The curium distribution for all isotopes shows higher masses for the very top burnup zone compared with the very bottom burnup zone; see Figure 20 and Figure 21. This effect is especially visible in the case of 246Cm and 247Cm, where mass difference equals about 5%. The mass distribution in the remaining zones shows regularity, i.e., the masses in the bottom zones are lower, maximally by about 3.5%. The curium distribution also shows little depression in the central burnup zone.

4. Discussion

Considering the obtained results, some recommendations for future studies can be proposed in order to provide a more comprehensive analysis of the isotopic changes of actinides in APR1400 uranium fuel during the first reactor cycle.
The development of the numerical model with a large number of burnup zones allows for detailed mapping of isotopic distributions in the reactor core. The increase in the number of burnup steps and thus the decrease in time intervals between the reaction rate recalculations allows for the achievement of more precise time evolutions of the investigated parameters. The number of burnup zones and time steps are arbitrary parameters fixed by the researcher and technically limited only by software functionalities. However, the higher the spatial resolution of the numerical model and the larger the discretization of the time domain, the higher the demand for computer power or computation time needed to obtain high-precision results. Thus, high-precision numerical results involve a trade-off of model complexity [38]. In the present study, the best practices in the modeling of the APR1400, especially those provided in open access sources by reactor designers, were applied in order to optimize the developed numerical methodology with 242 burnup zones and 19 time steps. The developed numerical model is flexible and can be arbitrarily modified towards the investigation of the reactor’s desirable characteristics.
The formation and destruction of isotopes in the neutron interactions depend on the physical parameters related to the neutron transport and the parameters determining the transmutation and decay chains. All indirect parameters used for the calculations of the final masses of isotopes in each burnup zone are available. However, the quite high spatial and material resolution of the numerical model and thus the large set of data obtained pose technical problems related to data post-processing and the choice of sound data for the final presentation. In this study, the authors decided to show the main parameters obtained in the burnup calculation, especially the final masses and concentrations of actinides. More complex analysis of the neutron fluxes, neutron spectra, reaction rates, effective cross-sections, transmutation paths, etc. is foreseen for further investigations.
The reactor criticality during the operation is determined by the initial fuel composition, the concentration of chemical shim, the control rod operation, and the formation and destruction of isotopes with a high neutron absorption cross-section in the thermal energy range. The assessment of dependencies among the masses of particular isotopes and their influence on criticality is a complex multi-variable time-dependent optimization problem. In further research, the interaction between particular isotopes for given time points and their influence on criticality and other operational parameters will be investigated. Complex parametric study assessing the influence of particular isotopes on criticality is planned. For instance, the developed numerical model contains all structures above the active core for the modeling of the control rod operation. The model contains all banks of control rods, which can be inserted by arbitrary levels into the corresponding fuel assemblies. This functionality allows for a variety of analyses, including studies on alternative fuels [39], fuel multi-cycling, power maneuvering, control of 135Xe spatial oscillations, and safety evaluations (e.g., stuck of rod cluster control assembly in the core).
The MCB code allows for the modeling of geometrical changes in the numerical model at the defined time points during the reactor operation. This functionality can be used for the modeling of operations on nuclear fuel assemblies, such as fresh fuel loading, fuel shuffling, and the discharge of spent fuel. In this way, the isotopic changes during the whole life of the nuclear fuel can be analyzed and do not need to be limited to one reactor cycle. However, this task is complicated due to the confidentiality of the real operational data describing the reactor cycles—the so-called post-cycle reports. The lack of data about the current loading pattern of the reactor, planned refueling schemes, and applied reactivity control schemes introduce large uncertainties into the numerical modeling and thus into the numerical results, such as the actinide concentrations [40]. The authors have initiated the development of a methodology for the long-term modeling of fuel in-core management under theoretical reactor operational conditions, which can be later adjusted to real conditions.

5. Conclusions

The study shows a quantitative analysis of uranium fuel utilization during the first cycle of the APR1400. The main goal of the analysis was to present the isotopic changes in the uranium fuel following minor and major actinide formation and depletion. The developed methodology is based on the numerical model for neutron transport Monte Carlo calculations coupled with burnup calculations using the linear chain method. The model was based on the real reactor design and operational data. The results of this study focus on four main aspects related to uranium fuel utilization, i.e., the build-up of actinides in the reactor core, the evolutions of the actinide masses, and the axial and radial distributions of actinides in the burnup zones at the end of the reactor cycle.
The following general conclusions and indications can be drawn from the developed methodology and the research performed on the APR1400:
(a)
The modeling of uranium fuel utilization using the developed numerical model is characterized by improved reliability due to the application of the real design and operational data.
(b)
The reliability of the obtained results is increased by the use of the MCB code, which is a well-validated tool for the modeling of isotopic changes in the PWR cores.
(c)
The spatial and time resolutions of the numerical model were designed using the best practices indicated by reactor designers, and are suitable for the current study.
(d)
The numerical model and the whole modeling methodology are flexible and can be easily adjusted to other analyses related to reactor core design and safety estimation.
The main conclusions related strictly to the obtained numerical results in the modeling of the uranium fuel utilization in the APR1400 can be summarized as follows:
(e)
The build-ups of actinides depend on their transmutation and decay chains from the gateway isotope 238U; the highest masses were obtained for the plutonium isotopes and the lowest for the curium isotopes.
(f)
The radial distribution of actinides varies by the isotope and depends on the fuel enrichment in 235U, the content of gadolinia burnable absorber, and the geometrical location of the burnup zones in the core.
(g)
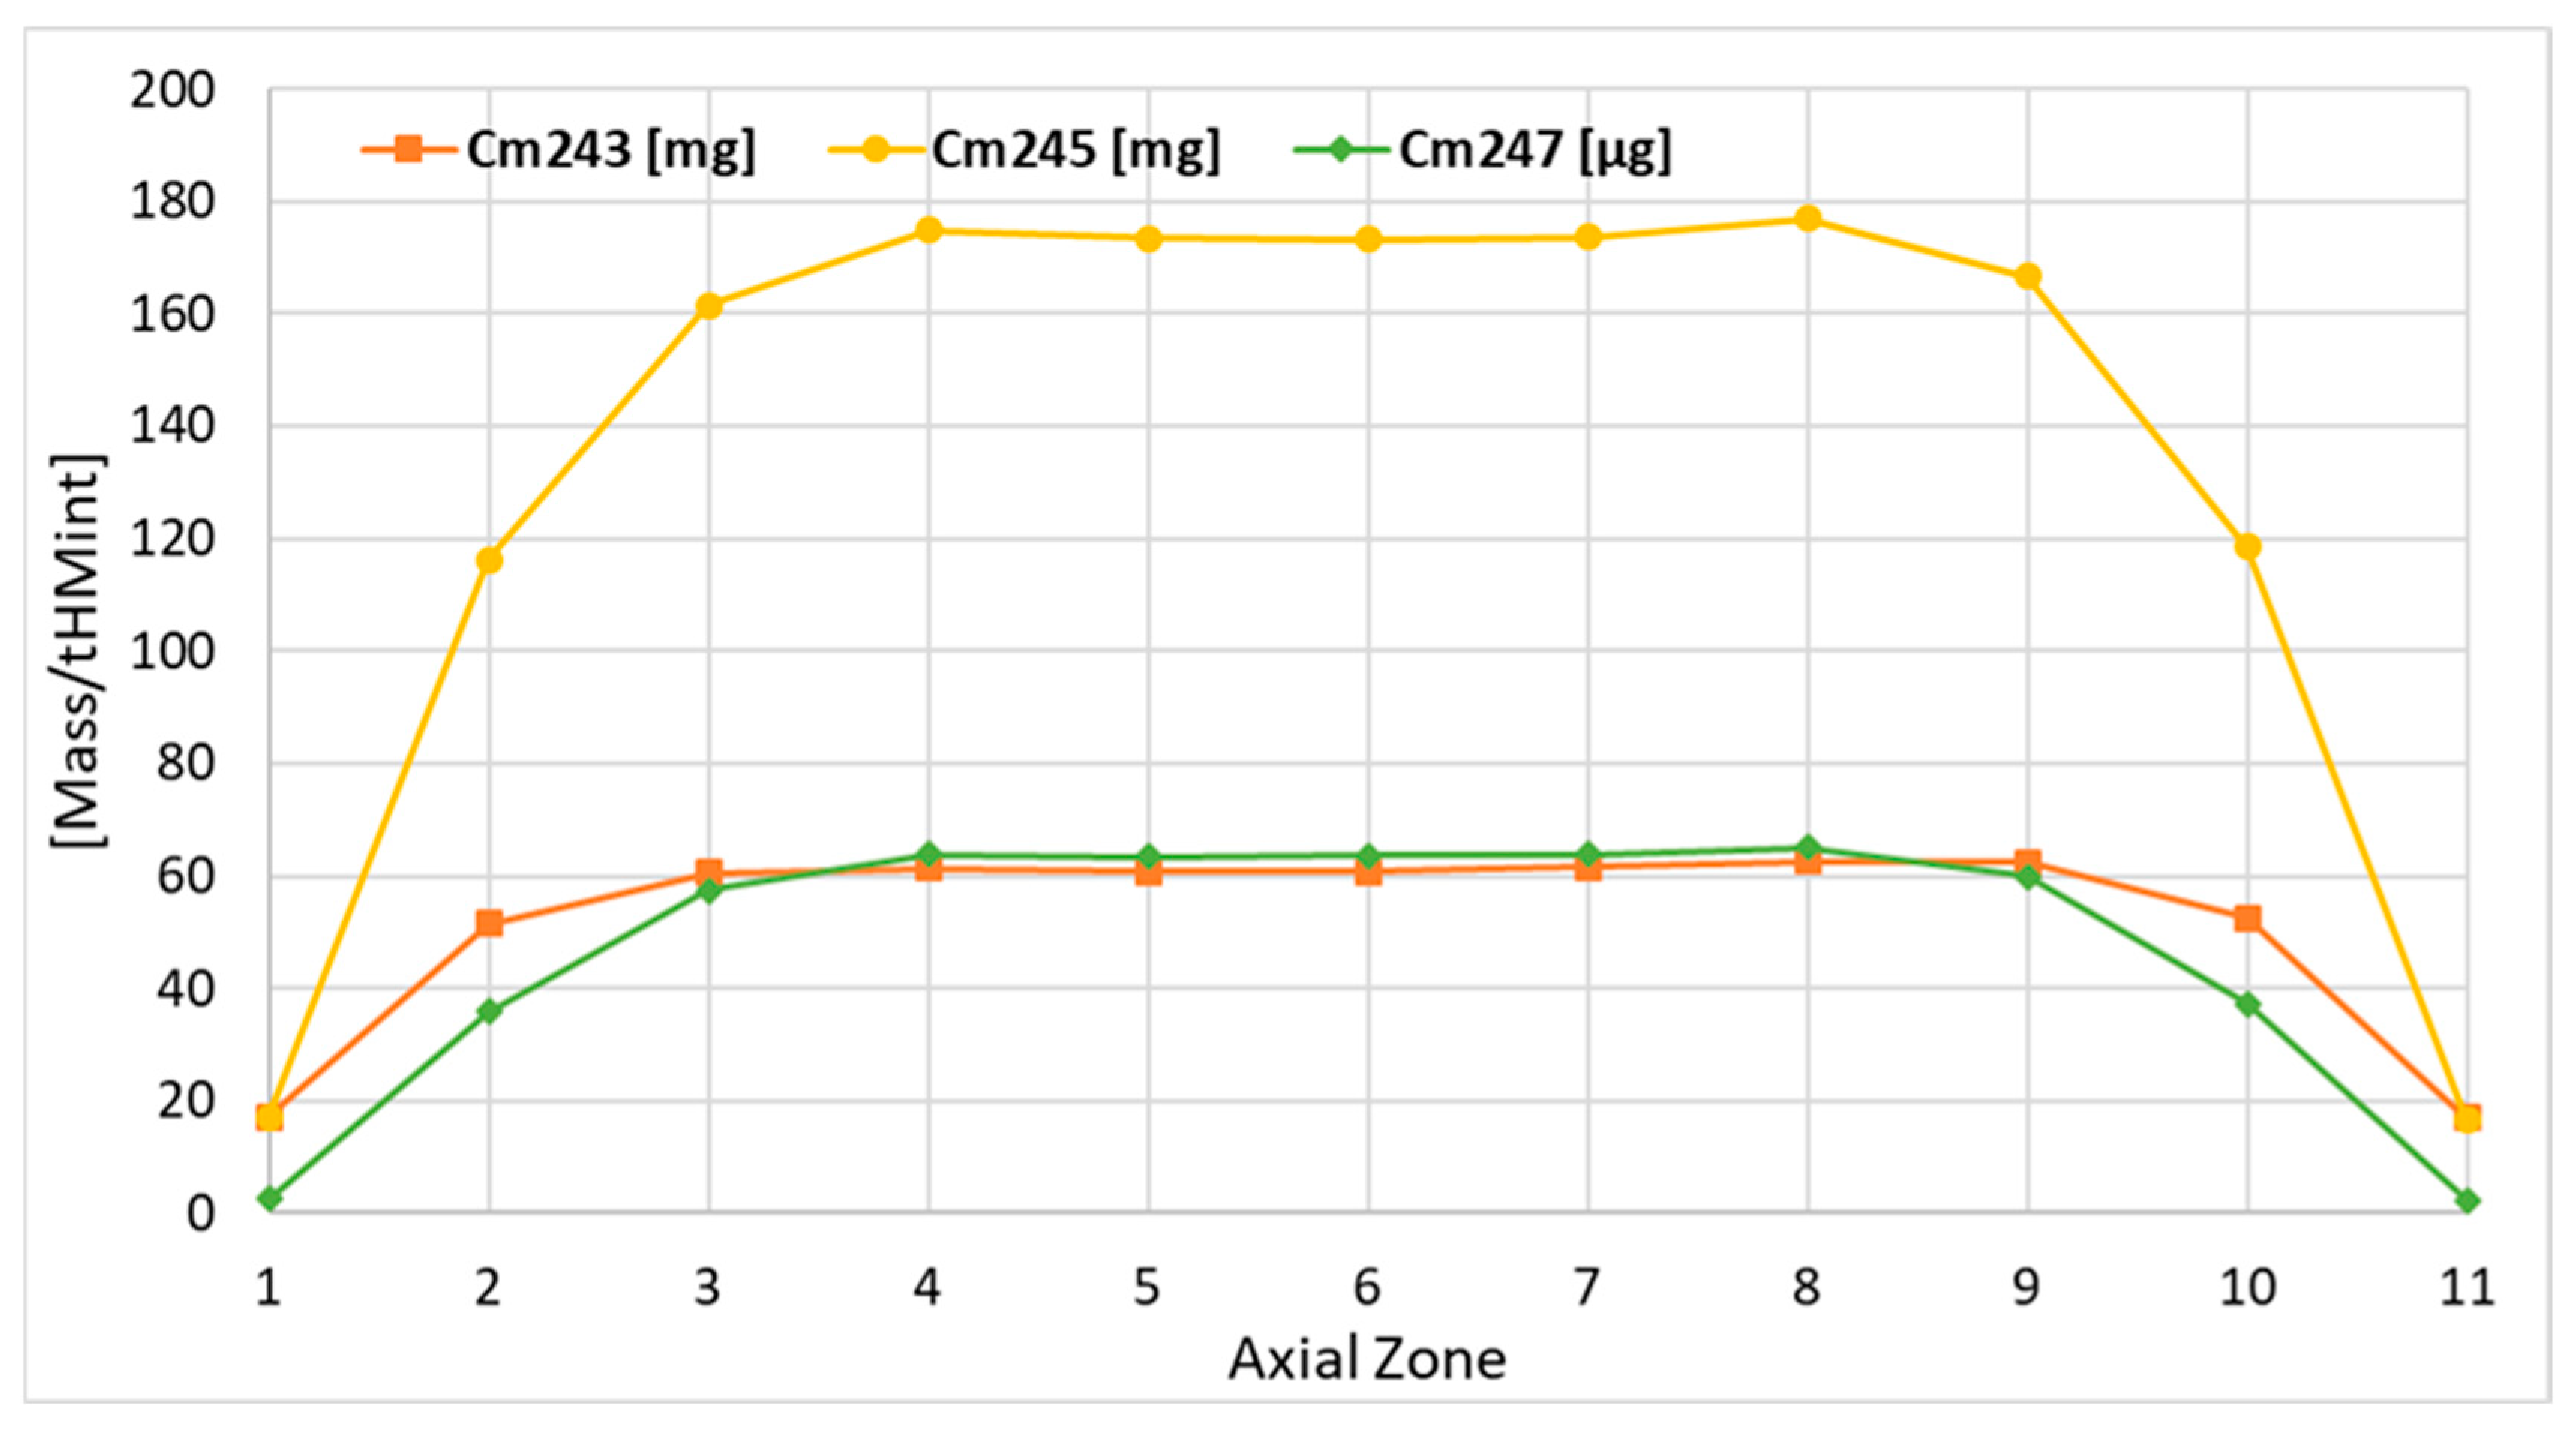
The axial distribution of actinides at the EOC depends on total neutron fluence; the lowest concentrations were obtained close to the top and bottom reflector, and the highest in the burnup zones near the core center (zones 4 and 8).
(h)
The concentrations of the transuranic isotopes were all monotonically increasing and had not yet reached equilibrium in the 17.571 GWd/tHMint of burnup.

Supplementary Materials

The following supporting information can be downloaded at: https://www.mdpi.com/article/10.3390/en17194864/s1, Table S1: Radial distribution of the uranium depletion at the EOC.; Table S2: Plutonium radial mass distributions at the EOC.; Table S3: 236U, 237Np and americium radial mass distributions at the EOC.; Table S4: Curium radial mass distributions at the EOC.

Author Contributions

Conceptualization, M.O.; methodology, M.O.; software, M.O.; validation, M.O.; writing—original draft preparation, M.O.; visualization, M.O.; resources, M.O. and J.K.; formal analysis, M.O. and J.K.; investigation, M.O. and J.K.; data curation, M.O. and J.K.; writing—review and editing, M.O. and J.K.; supervision, M.O. and J.K.; project administration, M.O. and J.K.; funding acquisition, M.O. and J.K. All authors have read and agreed to the published version of the manuscript.

Funding

This research was funded by the Polish Ministry of Science and Higher Education, scientific subvention number 16.16.210.476. This research project was also partly supported by the program “Excellence initiative—research university” of the AGH University of Science and Technology.

Data Availability Statement

The original contributions presented in this study are included in the article; further inquiries can be directed to the corresponding author(s).

Acknowledgments

We gratefully acknowledge the Polish high-performance computing infrastructure PLGrid (HPC Center: ACK Cyfronet AGH) for providing computer facilities and support within computational grant no. PLG/2024/017230. In addition, the partial financial support for this study provided under the scientific subvention 16.16.210.476 by the Polish Ministry of Science and Higher Education is kindly acknowledged. The research project was partly supported by the program “Excellence initiative—research university” of the AGH University of Krakow.

Conflicts of Interest

The authors declare no conflicts of interest.

References

  1. Lee, S.S.; Kim, S.H.; Suh, K.Y. The design features of the advanced power reactor 1400. Nucl. Eng. Technol 2009, 41, 995–1004. Available online: https://www.kns.org/files/jour/v41/JK0410995.pdf (accessed on 1 September 2024). [CrossRef]
  2. Yu, H.; Yahya, M.S.; Kim, Y. A reduced-boron OPR1000 core based on the big T burnable absorber. Nucl. Eng. Technol. 2016, 48, 318–329. [Google Scholar] [CrossRef]
  3. International Atomic Energy Agency. Advanced Reactors Information System, Status Report—APR1400 (KEPCO E&C/KHNP). 2020. Available online: https://aris.iaea.org/PDF/APR1400_2020May.pdf (accessed on 1 September 2024).
  4. Nuclear Energy Agency. Organisation for Economic Co-Operation and Development, Multinational Design Evaluation Programme, APR1400 Working Group, Design Description and Comparison of Design Differences between APR1400 Plants, Technical Report, TR-APR1400-01. 2018. Available online: https://cms.oecd-nea.org/mdep/documents/TR-APR1400-01%20Design%20Description%20and%20Comparison%20of%20Design%20Differences.pdf (accessed on 1 September 2024).
  5. International Atomic Energy Agency. Nuclear Power Reactors in the World, Reference Data Series No. 2, IAEA-RDS-2/43; International Atomic Energy Agency: Vienna, Austria, 2023; ISBN 978-92-0-137123-2. ISSN 1011-2642. [Google Scholar]
  6. International Atomic Energy Agency. The Power Reactor Information System. Available online: https://pris.iaea.org/pris/ (accessed on 1 September 2024).
  7. Lamarsh, J.R.; Baratta, A.J. Introduction to Nuclear Engineering, 3rd ed.; Prentice Hall: Upper Saddle River, NJ, USA, 2021; ISBN 0-201-82498-1. [Google Scholar]
  8. Nuclear Energy Agency. Organisation for Economic Co-Operation and Development, The Economics of the Back End of the Nuclear Fuel Cycle, NEA No. 7061, Nuclear Development. 2013. Available online: https://www.proquest.com/openview/e8af3b81ceb9285b84dee1c145cbc2f7/1?pq-origsite=gscholar&cbl=2026412 (accessed on 1 September 2024).
  9. Alhattawi, N.T.; Alrwashdeh, M.; Alameri, S.A.; Alaleeli, M.M. Sensitivity neutronic analysis of accident tolerant fuel concepts in APR1400. J. Nucl. Mater. 2023, 582, 154487. [Google Scholar] [CrossRef]
  10. Alrwashdeh, M.; Alameri, S.A. Preliminary neutronic analysis of alternative cladding materials for APR-1400 fuel assembly. Nucl. Eng. Des. 2021, 384, 111486. [Google Scholar] [CrossRef]
  11. Salam, M.; Hah, C.J. Comparative study on nuclear characteristics of APR1400 between 100% MOX core and UO2 core. Ann. Nucl. Energy 2018, 119, 374–381. [Google Scholar] [CrossRef]
  12. Do, M.; Nguyen, X.H.; Jang, S.; Kim, Y. Physics study for high-performance and very-low-boron APR1400 core with 24-month cycle length. Nucl. Eng. Technol. 2020, 52, 869–877. [Google Scholar] [CrossRef]
  13. Alrwashdeh, M.; Alameri, S.A. A neutronics study of the initial fuel cycle extension in APR-1400 reactors: Examining homogeneous and heterogeneous enrichment design. Arab. J. Sci. Eng. 2023. [CrossRef]
  14. Khalefih, H.; Oh, T.; Jeong, Y.; Kim, Y. LEU+ loaded APR1400 using accident tolerant fuel cladding for 24-month two-batch fuel management scheme. Nucl. Eng. Technol. 2023, 55, 2578–2590. [Google Scholar] [CrossRef]
  15. Khalefih, H.; Kim, Y. Feasibility study of a two-batch soluble-boron-free APR-1400 reactor. In Proceedings of the Transactions of the Korean Nuclear Society Virtual Spring Meeting, Daejeon, Republic of Korea, 13–14 May 2021. [Google Scholar]
  16. Alnaqbi, J.; Hartanto, D.; Alnuaimi, R.; Imron, M.; Gillette, V. Static and transient analyses of Advanced Power Reactor 1400 (APR1400) initial core using open-source nodal core simulator KOMODO. Nucl. Eng. Technol. 2022, 54, 764–769. [Google Scholar] [CrossRef]
  17. Barr, K.E.; Sooyoung, C.; Junsu, K.; Brendan, K. Verification of MPACT for the APR1400 Benchmark. Energies 2021, 14, 3831. [Google Scholar] [CrossRef]
  18. Yuk, S.; Cho, J.Y. DeCART solutions of APR1400 reactor core Benchmark problems. In Proceedings of the Transactions of the Korean Nuclear Society Virtual Autumn Meeting, Daejeon, Republic of Korea, 17–18 December 2020. [Google Scholar]
  19. Lee, I.S.; Yoon, D.H.; Bang, Y.S.; Kim, T.H.; Kim, Y.C. Assessment of realistic departure from nucleate boiling ratio (DNBR) considering uncertainty quantification of core flow asymmetry. Energies 2021, 14, 1504. [Google Scholar] [CrossRef]
  20. Al Awad, A.S.; Habashy, A.; Metwally, W.A. Sensitivity studies in spent fuel pool criticality safety analysis for APR-1400 nuclear power plants. Nucl. Eng. Technol. 2018, 50, 709–716. [Google Scholar] [CrossRef]
  21. Oettingen, M.; Kim, J. Detection of numerical power shift anomalies in burnup modeling of a PWR reactor. Sustainability 2023, 15, 3373. [Google Scholar] [CrossRef]
  22. Du Toit, M.H.; Naicker, V.V. Monte Carlo burnup oscillations for thorium-based EPR fuel. Ann. Nucl. Energy 2023, 185, 109714. [Google Scholar] [CrossRef]
  23. Al Zain, J.; El Hajjaji, O.; El Bardouni, T.; Lahdour, M. Validation of deterministic code DRAGON5 for the fuel depletion analysis of a PWR pin-cell benchmark. Radiat. Phys. Chem. 2021, 186, 109545. [Google Scholar] [CrossRef]
  24. El Bakkari, B.; El Bardouni, T.; Merroun, O.; El Younoussi, C.; Boulaich, Y.; Boukhal, H.; Chakir, E. Validation of a new continuous Monte Carlo burnup code using a MOX fuel assembly. Nucl. Eng. Des. 2009, 239, 1828–1838. [Google Scholar] [CrossRef]
  25. Morrison, S.L.; Lindley, B.A.; Parks, G.T. Isotopic and spectral effects of Pu quality in Th-Pu fueled PWRs. Ann. Nucl. Energy 2018, 117, 318–332. [Google Scholar] [CrossRef]
  26. Li, W.; Yu, G.; Wang, K. Comparative analysis of coupling schemes of Monte Carlo burnup calculation in RMC. Ann. Nucl. Energy 2020, 137, 107024. [Google Scholar] [CrossRef]
  27. Shephard, A.M.; Hiess, J.; Belian, A.; Wood, H.G. Estimation of the 234U fraction and uncertainty of enriched and depleted uranium. Nucl. Eng. Des. 2021, 382, 111351. [Google Scholar] [CrossRef]
  28. Solov’ev, G.S.; Saprygin, A.V.; Komarov, V.V.; Izrailevich, A.I. 234U content in enriched uranium as a function of the 234U concentration in the initial material. At. Energy 2003, 95, 473–475. [Google Scholar] [CrossRef]
  29. Oettingen, M.; Cetnar, J. Numerical modelling of modular high-temperature gas-cooled reactors with thorium fuel. Nukleonika 2021, 66, 133–138. [Google Scholar] [CrossRef]
  30. Oettingen, M.; Cetnar, J.; Mirowski, T. The MCB code for numerical modelling of fourth generation nuclear reactors. Comput. Sci. 2015, 16, 329–350. [Google Scholar]
  31. Cetnar, J. General solution of Bateman equations for nuclear transmutations. Ann. Nucl. Energy 2006, 33, 640–645. [Google Scholar] [CrossRef]
  32. Oettingen, M.; Cetnar, J. Comparative analysis between measured and calculated concentrations of major actinides using destructive assay data from Ohi-2 PWR. Nukleonika 2015, 60, 571–580. [Google Scholar] [CrossRef]
  33. Plompen, A.J.M.; Cabellos, O.; De Saint Jean, C.; Fleming, M.; Algora, A.; Angelone, M.; Archier, P.; Bauge, E.; Bersillon, O.; Blokhin, A.; et al. The joint evaluated fission and fusion nuclear data library, JEFF-3.3. Eur. Phys. J. A 2020, 56, 181. [Google Scholar] [CrossRef]
  34. Academic Computer Centre Cyfronet AGH, ARES Supercomputer. Available online: https://www.cyfronet.pl/en/computers/18827,artykul,ares_supercomputer.html (accessed on 26 September 2024).
  35. X5-Team. MCNP—A General Monte Carlo N-Particle Transport Code, 5th ed.; Volume I: Overview and Theory; Los Alamos National Laboratory: Los Alamos, NM, USA, 2008. Available online: https://mcnp.lanl.gov/pdf_files/TechReport_2003_LANL_LA-UR-03-1987Revised212008_SweezyBoothEtAl.pdf (accessed on 26 September 2024).
  36. International Atomic Energy Agency. Characteristics and Use of Urania-Gadolinia Fuels, IAEA-TECDOC-844; International Atomic Energy Agency: Austria, Vienna, 1995; ISSN 1011-4289. [Google Scholar]
  37. Nuclear Energy Agency. Spent Nuclear Fuel Assay Data for Isotopic Validation; NEA/NSC/WPNCS/DOC: Paris, France, 2011; Available online: https://www.oecd-nea.org/jcms/pl_23061/spent-nuclear-fuel-assay-data-for-isotopic-validation-state-of-the-art-report?details=true (accessed on 26 September 2024).
  38. Tramm, J.R.; Siegel, A.R. Memory bottlenecks and memory contention in multi-core Monte Carlo transport codes. Ann. Nucl. Energy 2015, 82, 195–202. [Google Scholar] [CrossRef]
  39. Galahom, A.A.; Khaliil, A.S.; Alnassar, N.; Reda, S.M. Discussing the possibility of using thorium-based fuels as an alternative fuel to uranium dioxide fuel for APR-1400 reactor. Nucl. Eng. Des. 2024, 417, 112817. [Google Scholar] [CrossRef]
  40. Kok, Y.; Kim, H.S.; Monteiro, R.; Hah, C.J. Developing a long-term fuel management strategy for APR1400. In Proceedings of the Transactions of the Korean Nuclear Society Virtual Autumn Meeting, Daejeon, Republic of Korea, 17–18 December 2020. [Google Scholar]
Figure 1. Initial core loading pattern with all types and numbers of fuel assemblies.
Energies 17 04864 g001
Figure 2. Visualization of the developed numerical model with its main components: vertical cross-section (A) and horizontal cross-section (¼ of the core) at the fuel assembly level (B).
Energies 17 04864 g002
Figure 3. Critical Boron Concentration (CBC) for the initial reactor cycle.
Energies 17 04864 g003
Figure 4. Burnout of the odd gadolinium isotopes during the initial reactor cycle.
Energies 17 04864 g004
Figure 5. Mass evolutions of uranium isotopes during the initial reactor cycle.
Energies 17 04864 g005
Figure 6. Depletion of the uranium isotopes in the APR1400 core.
Energies 17 04864 g006
Figure 7. Evolutions of the plutonium isotopes in the APR1400 core.
Energies 17 04864 g007
Figure 8. Evolutions of the 236U, 237Np, and americium isotopes in the APR1400 core.
Energies 17 04864 g008
Figure 9. Evolutions of the curium isotopes in the APR1400 core.
Energies 17 04864 g009
Figure 10. Radial distribution of the uranium depletion at the EOC.
Energies 17 04864 g010
Figure 11. Plutonium radial mass distributions at the EOC.
Energies 17 04864 g011
Figure 12. Americium radial mass distributions at the EOC.
Energies 17 04864 g012
Figure 13. 236U and 237Np radial mass distributions at the EOC.
Energies 17 04864 g013
Figure 14. Curium radial mass distributions at the EOC.
Energies 17 04864 g014
Figure 15. Axial depletion of uranium isotopes.
Energies 17 04864 g015
Figure 16. Axial distributions of the 239Pu, 240Pu, 241Pu, and plutonium.
Energies 17 04864 g016
Figure 17. Axial distributions of the 238Pu and 242Pu.
Energies 17 04864 g017
Figure 18. Axial distributions of the 236U, 241Am, 243Am, and americium.
Energies 17 04864 g018
Figure 19. Axial distributions of the 237Np and 242mAm.
Energies 17 04864 g019
Figure 20. Axial distributions of the 242Cm, 244Cm, 246Cm, and curium.
Energies 17 04864 g020
Figure 21. Axial distributions of the 243Cm, 245Cm, and 247Cm.
Energies 17 04864 g021
Table 1. Materials used in the numerical model of the APR1400.
NrComponentMaterialDensity [g/cm3]
1FuelUO210.31
UO2 + Gd2O310.07
2Gas gapHe1.76∙10−3
3CladdingZr-alloy6.55
4CoolantH2O + H3BO30.71
5Control rodsB4C1.84
INCONEL6258.44
6InternalsSS3048.03
7Reactor pressure vesselSA5087.7
Table 2. Specifications of the fuel assemblies for the first APR1400 reactor cycle.
Type of FAType of FRNumber of FREnrichment
[% w/w]
A0S2361.71
B0S2363.14
B1S1723.14
L522.64
A122.00
B2S1243.14
L1002.64
A122.00
B3S1683.14
L522.64
A162.00
C0S1843.64
L523.14
C1S1723.64
L523.14
A122.00
C2S1683.64
L523.14
A162.00
C3S1203.64
L1003.14
A162.00
S—standard enrichment; L—low enrichment; A—burnable absorber.
Table 3. Content of 234U in nuclear fuel for different enrichments.
235U [% w/w]234U [‰ w/w]
1.710.15
2.000.18
2.640.25
3.140.30
3.640.35
Table 4. Initial mass of heavy metal (uranium) in the reactor core, in tons.
Zone (Axial/Radial) [Tons]123–91011Total Radial
A03.01633.174
B00.4705.170
C0-N1.09912.092
C0-L0.3113.417
B1-N0.7998.792
B1-L0.2422.658
C1-N0.2282.512
C1-L0.0690.759
B2-N0.1651.811
B2-L0.1331.460
B3-N1.11512.267
B3-L0.3453.797
C2-N0.3353.680
C2-L0.1041.139
C3-N0.3984.381
C3-L0.3323.651
B1-Gd0.0490.0560.0500.0560.0490.561
B2-Gd0.0140.0160.0140.0160.0140.160
B3-Gd0.0930.1070.0950.1070.0931.068
C1-Gd0.0140.0160.0140.0160.0140.160
C2-Gd0.0280.0320.0290.0320.0280.320
C3-Gd0.0470.0530.0480.0530.0470.534
Total Axial9.4059.4419.4109.4419.405103.565 *
* Total mass of heavy metal (uranium) in the first core.
Table 5. Masses and mass fractions of actinides in the nuclear fuel at the EOC.
NuclideMass [g/tHMint]Mass Fraction *
234U1.93∙1041.87∙10−4
235U1.33∙1061.28∙10−2
236U2.57∙1052.49∙10−3
238U9.93∙1079.58∙10−1
237Np1.83∙1041.77∙10−4
238Pu3.64∙1033.51∙10−5
239Pu4.52∙1054.37∙10−3
240Pu1.52∙1051.47∙10−3
241Pu7.67∙1047.40∙10−4
242Pu1.94∙1041.88∙10−4
241Am4.43∙1004.27∙10−8
242mAm2.70∙1012.60∙10−7
243Am2.22∙1032.14∙10−5
242Cm3.55∙1023.42∙10−6
243Cm5.36∙1005.18∙10−8
244Cm3.87∙1023.74∙10−6
245Cm1.39∙1011.34∙10−7
246Cm7.73∙10−17.46∙10−9
247Cm4.88∙10−34.71∙10−11
U1.01∙1089.74∙10−1
Pu7.04∙1056.80∙10−3
Am2.25∙1032.17∙10−5
Cm7.61∙1027.35∙10−6
Actinides1.02∙1089.81∙10−1
Fission Products1.96∙1061.89∙10−2
* means per initial heavy metal mass—103.57 tHMint.
Table 6. Build-ups of actinides in the nuclear fuel during the first APR1400 cycle.
NuclideBuild-Up * [g/(GWd/tHMint)]
236U1.46∙104
237Np1.04∙103
238Pu2.07∙102
239Pu2.57∙104
240Pu8.66∙103
241Pu4.36∙103
242Pu1.11∙103
241Am2.52∙10−1
242mAm1.53∙100
243Am1.26∙102
242Cm2.02∙101
243Cm3.05∙10−1
244Cm2.20∙101
245Cm7.90∙10−1
246Cm4.40∙10−2
247Cm2.78∙10−4
Pu4.01∙104
Am1.28∙102
Cm4.33∙101
Fission Products1.11∙105
* means per final burnup—17.571 GWd/tHMint.
Table 7. Depletion of uranium for the first APR1400 reactor cycle.
NuclideDepletion * [g/(GWd/tHMint)]Depletion ** [g/tHMint]
234U3.70∙1026.40∙101
235U8.48∙1041.44∙104
238U8.35∙1041.42∙104
U1.69∙1052.86∙104
* means per final burnup—17.571 GWd/tHMint; ** means per initial heavy metal mass—103.57 tHMint.
Disclaimer/Publisher’s Note: The statements, opinions and data contained in all publications are solely those of the individual author(s) and contributor(s) and not of MDPI and/or the editor(s). MDPI and/or the editor(s) disclaim responsibility for any injury to people or property resulting from any ideas, methods, instructions or products referred to in the content.

