Article

Numerical Study on the Enhanced Oil Recovery by CO2 Huff-n-Puff in Shale Volatile Oil Formations

1
Sinopec Shale Oil and Gas Exploration and Development Key Laboratory, Exploration and Development Research Institute, Sinopec Jianghan Oilfield Company, Wuhan 430223, China
2
State Key Laboratory of Deep Oil and Gas, China University of Petroleum (East China), Qingdao 266580, China
*
Authors to whom correspondence should be addressed.
Energies 2024, 17(19), 4881; https://doi.org/10.3390/en17194881 (registering DOI)
Submission received: 22 August 2024 / Revised: 23 September 2024 / Accepted: 27 September 2024 / Published: 28 September 2024
(This article belongs to the Section H: Geo-Energy)

Abstract

:
The Sichuan Basin’s Liangshan Formation shale is rich in oil and gas resources, yet the recovery rate of shale oil reservoirs typically falls below 10%. Currently, gas injection huff-n-puff (H-n-P) is considered one of the most promising methods for improving shale oil recovery. This study numerically investigates the application of the CO2 huff-n-puff process in enhancing oil recovery in shale volatile oil reservoirs. Using an actual geological model and fluid properties of shale oil reservoirs in the Sichuan Basin, the CO2 huff-n-puff process was simulated. The model takes into account the molecular diffusion of CO2, adsorption, stress sensitivity effects, and nanopore confinement. After history matching, through sensitivity analysis, the optimal injection rate of 400 tons/day, soaking time of 30 days, and three cycles of huff-n-puff were determined to be the most effective. The simulation results show that, compared with other gases, CO2 has significant potential in improving the recovery rate and overall efficiency of shale oil reservoirs. This study is of great significance and can provide valuable references for the actual work of CO2 huff-n-puff processes in shale volatile oil reservoirs of the Sichuan Basin.

1. Introduction

In 2019, the production of shale oil in the United States reached 376 million tons, accounting for about 50% of the total crude oil production in the United States. This achievement made the United States a net exporter of oil and natural gas, achieving “energy independence,” and profoundly affected the global energy landscape [1]. Currently, China’s dependence on foreign crude oil has reached 73.5%. Shale oil, as a strategic alternative resource in the oil and gas industry, is of great significance for alleviating dependence on foreign oil and gas and ensuring national energy security [2,3,4,5]. The Sichuan Basin Liangshan Formation is rich in shale oil and gas resources, and in recent years, both PetroChina and Sinopec have carried out commercial development, showing a promising prospect for the exploration and development of Jurassic shale oil and gas in the Sichuan Basin [6]. Although hydraulic fracturing can increase the effective permeability between hydraulic fractures by about 5–10 times compared to the matrix permeability, shale oil reservoirs are still affected by short production life, with shale oil production declining by 80% within a year [7,8,9]. To supplement reservoir pressure and improve shale oil recovery, Sheng and Chen studied established conventional reservoir injection processes, including gas drive schemes for shale reservoirs [10]. Although these methods can increase oil production, they require a large amount of natural gas and face the challenge of early gas breakthrough [11,12].
Laboratory studies, numerical simulations, and field experiments have shown that the Huff and Puff (H-n-P) process has great potential in improving the recovery efficiency of shale oil. The pilot test of gas injection and gas cycling in shale oil reservoirs in North America has achieved positive results, especially since the EOG company has carried out gas injection and cycling in more than 150 wells in the Eagle Ford shale reservoir, claiming that compared with depletion mining, gas injection and cycling can increase the recovery rate by 30% to 70% [13,14]. The choice of injected gas includes produced gas, nitrogen, dry gas, and carbon dioxide. The aforementioned gases can dissolve in crude oil under high pressure, thereby extracting the light components of the crude oil into the phase that is rich in mixed gas. Because of its good injectivity, CO2 is considered to be the most promising gas for injection in shale oil reservoirs, and CO2 has effects such as reducing viscosity, increasing energy, acidizing to unblock, and changing wettability. In addition, the miscibility pressure of CO2 with crude oil is the lowest among the aforementioned gases. From another perspective, using carbon dioxide as an injection solvent provides the dual benefits of carbon capture and carbon storage [15,16,17,18,19].
Kong et al. studied the impact of reservoir properties, fracture networks, and depletion mining parameters on gas injection and gas cycling in the Duvernay shale volatile oil reservoir. The results show that the natural fractures coexisting with the hydraulic fractures are the key controlling factors for gas injection and gas cycling in the Duvernay shale oil reservoir [20]. Due to the widespread distribution of nanometer-scale pores in shale reservoirs, the phase behavior and physical properties of shale oil will change under the restriction of nanopores and affect the mass transfer mechanism between CO2 and shale oil. Kong et al. analyzed the impact of nanopore confinement on the phase behavior and physical properties of Duvernay shale oil, finding that under the restriction of nanopores, the viscosity, density, and bubble point pressure of the oil decrease as the pore diameter narrows, and the minimum miscibility pressure (MMP) between CO2 and shale oil decreases as the pore diameter decreases [21]. Wan and Sheng conducted gas injection studies on fractured shale reservoirs using dual-porosity simulation and found that matrix/fracture and matrix/matrix diffusion play important roles in the process of enhancing oil recovery [22]. Yu et al. conducted a series of simulation studies on CO2-EOR in the Bakken formation, concluding that the molecular diffusion rate of CO2 is crucial for CO2 injection in tight oil reservoirs, and they emphasized that this factor should be accurately captured in reservoir numerical simulation [23]. Fakher and Imqam studied the potential of CO2 huff-n-puff to improve the recovery rate of shale core, and their study showed that the CO2 capacity of shale reservoirs is significantly affected by pressure, and that an increase in injection pressure leads to increased CO2 adsorption [24]. Lashgari et al. developed a CO2 and miscible gas huff-n-puff model for shale oil reservoirs, and numerical simulation results show that gas injection rich in recycled gas shows a higher oil recovery rate compared to miscible CO2 injection. At the same time, molecular diffusion can accelerate the transport of carbon dioxide flux to a larger matrix area, thereby helping oil extraction, and being captured and adsorbed on minerals or organic matter [25]. Most current research is based on reservoir conceptual models, and there are multiple transport mechanisms in shale reservoirs, including stress sensitivity, molecular diffusion, adsorption, and restricted phase behavior [26]. There is less research on CO2 huff-n-puff based on actual geological models and real wells, fully considering the mechanisms in shale reservoirs.
This paper uses the actual geological model and fluid properties of a shale volatile oil reservoir in the Sichuan Basin to build a comprehensive component model for simulating the CO2 huff-n-puff process. The model takes into account factors such as stress sensitivity, molecular diffusion, adsorption, and changes in phase behavior due to the confined nature of the reservoir. The study also includes a sensitivity analysis of operational parameters for a single well, such as gas injection rate, soaking time, and the number of huff-n-puff cycles. Additionally, a field-specific sensitivity analysis of shale oil wells in the Sichuan Basin was performed. This research is significant because it provides valuable insights that can help optimize CO2 injection and huff-n-puff operations in volatile oil reservoirs in the region.

2. Methodology

In this section, we explain the key physical processes included in the numerical simulation of shale volatile oil reservoirs. Gas diffusion and adsorption within the reservoir play a crucial role in improving gas recovery and storage. The fluid properties and phase behavior change due to the nanoscale size of the pores in the shale. Additionally, shale reservoirs are highly sensitive to stress, and different types of reservoir rock exhibit different levels of sensitivity to pressure changes.

2.1. Molecular Diffusion

Molecular diffusion, driven by the random motion of molecules, refers to the process where molecules move from regions of higher concentration to areas of lower concentration. In shale reservoirs, the abundance of nanoscale pores makes diffusion flux a crucial factor. To accurately simulate the effect of this process on production in shale oil reservoirs, it is essential to experimentally measure the gas diffusion coefficient. The molecular diffusion flux is expressed as follows:
J i = ϕ D i j τ c i
where Ji [mole.ft/day] is the molecular diffusion flux of component i based on the area of the porous medium; c is the total concentration of component i; Dij [ft2/day] is the effective bulk molecular diffusivity of component i in phase j; Φ is the reservoir porosity; and τ is the effective tortuosity.

2.2. Gas Adsorption

This reservoir is classified as a volatile oil reservoir, meaning that when the pressure drops below the bubble point pressure, a significant amount of gas (methane) is released. The adsorption and desorption of methane and CO2 on the surfaces of shale pores have a non-negligible impact on the process of enhancing oil recovery and sequestration with CO2. While CO2 adsorption reduces the amount of CO2 in direct contact with the oil, it also allows for more CO2 to be captured by the reservoir. The adsorption process is generally described using the isothermal Langmuir equation, along with its extensions for multicomponent systems. In this study, we use the Extended Langmuir (EL) isotherm model, which is widely used due to its simplicity, to develop the simulation model. The expression is as follows:
ω i = ω max , i y i β i p 1 + p k = 1 N c y k β k
where βi is the Langmuir constant in [psi-1]; ωi represents the number of moles of adsorbed component i per unit mass of rock [gmol/lb]; ωmax,i is the Langmuir maximum moles of adsorbed component i per unit mass of rock in [gmol/lb]; p is the gas-phase pressure; yi denotes the mole fraction of adsorbed component i in the gas phase; and Nc is the total number of components contributing to adsorption.

2.3. Nanopore Confinement

In conventional reservoirs, the interaction range between pore walls and fluids is much smaller than the pore diameter, allowing the impact on the fluid to be disregarded. However, the nanoscale pores in shale reservoirs can alter the fluid properties and phase behavior due to the pore size being comparable to the interaction range. This has a significant effect on the fluid’s critical properties and the shift in saturation pressure. Zarragoicoechea and Kuz derived equations for the changes in the critical temperature and pressure of confined fluids from the generalized van der Waals equation, combined with the Lennard-Jones size parameter, and found good agreement with experimental results [27]. The critical properties of fluids in shale pores of different radii can be calculated using the following formulas:
Δ T c = T c b T c p T c b = 0.9409 σ L j r p 0.2415 ( σ L j r p ) 2
Δ P c = P c b P c p P c b = 0.9409 σ L j r p 0.2415 ( σ L j r p ) 2
σ L j = 0.244 T c b P c b 3
where Δ T c * is the relative change in critical temperature, Tcb and Tcp are the critical temperatures before and after confinement, respectively, k; Δ P c * is the relative change in critical pressure, Pcb and Pcp are the critical pressures before and after confinement, respectively, atm, σLj is the Lennard-Jones collision diameter; and rp is the pore radius, nm.

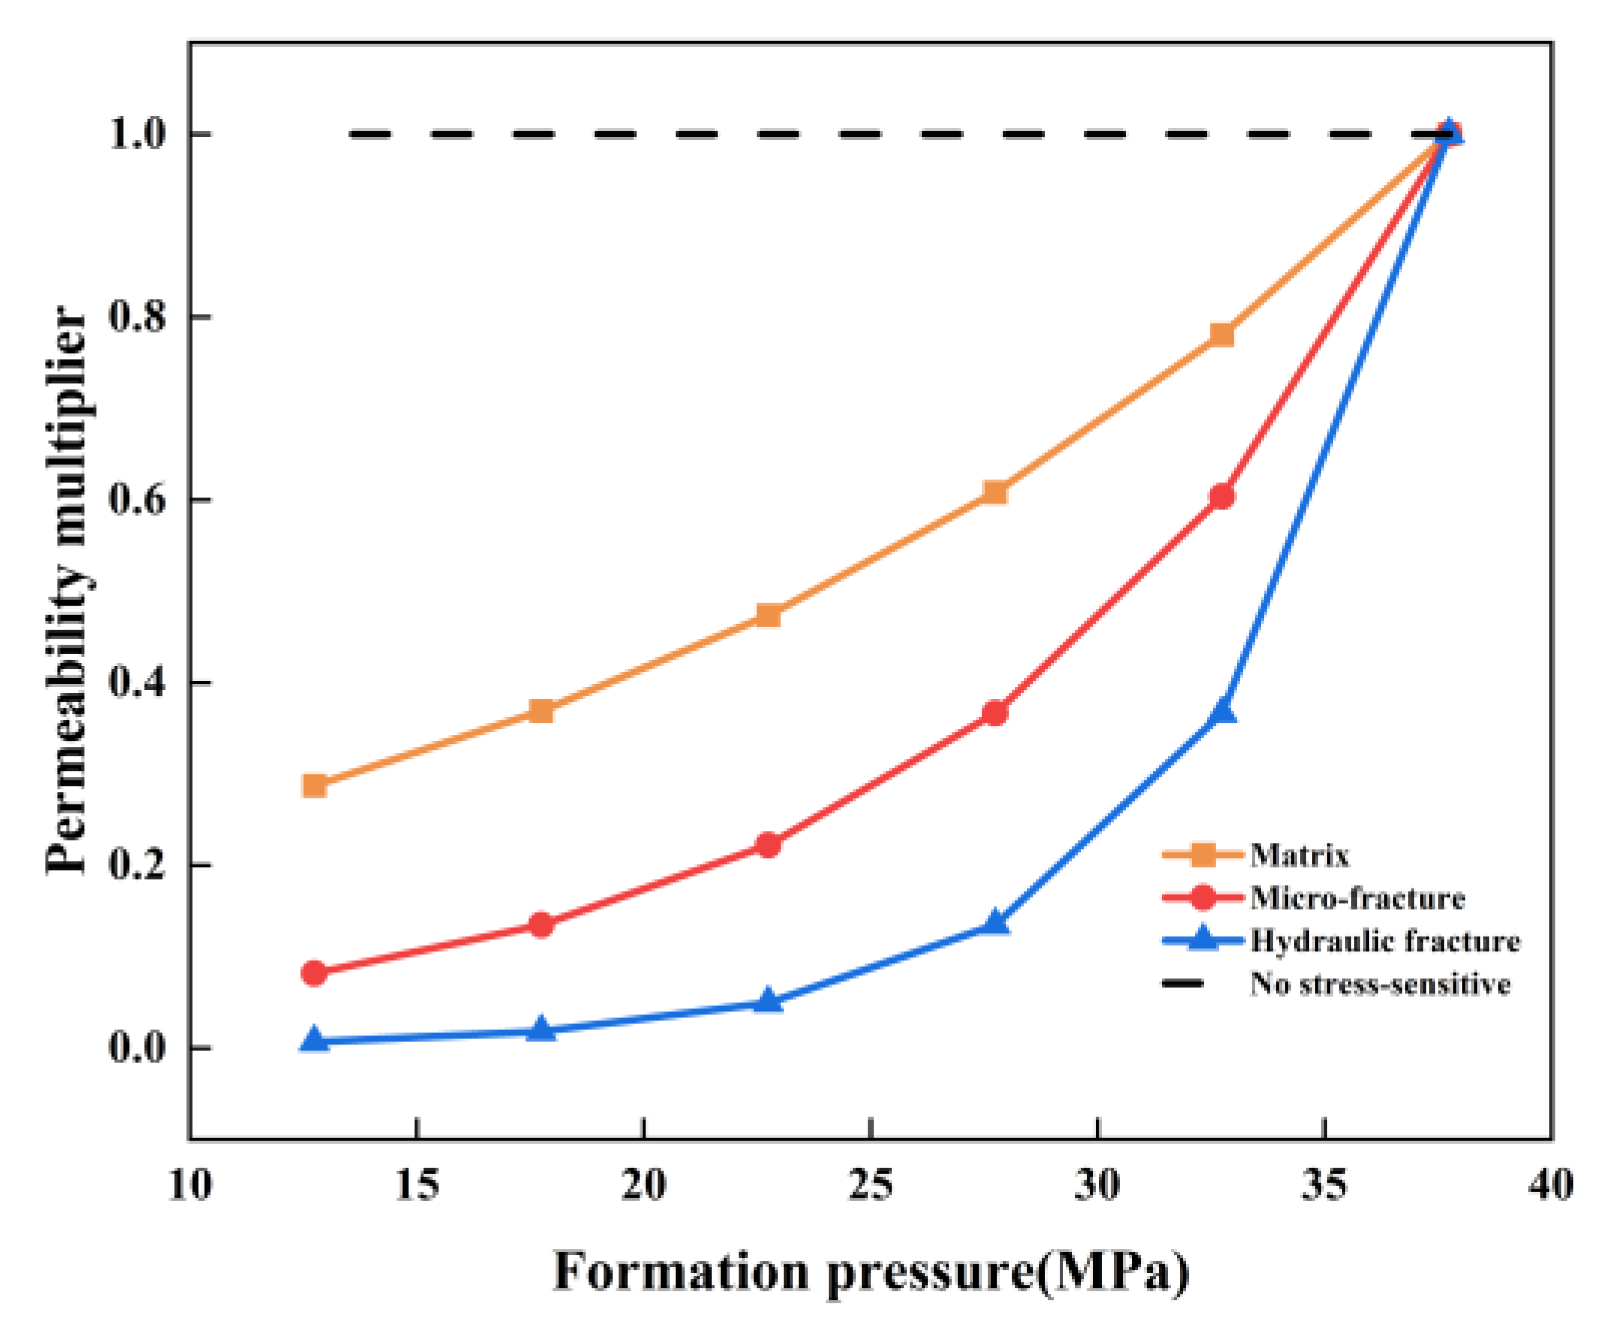
2.4. Strss-Sensitive Effect

Stress sensitivity is an important characteristic of shale reservoirs, significantly affecting the permeability field. A series of shale compaction and permeability experiments have shown a strong exponential relationship between shale permeability and effective stress [28,29]. Therefore, this paper adopts an exponential stress-sensitive formula that relates permeability to effective stress, as shown below:
K = K i e c ( p i p )
where Ki is the permeability at zero effective stress, mD; c is the stress-sensitive coefficient, a dimensionless parameter; and Pi is the initial pore pressure, MPa.
After fracturing in shale reservoirs, there are three types of media—man-made fractures, micro-fractures, and the matrix—each exhibiting different levels of stress sensitivity. In this paper, core experimental results are used to establish the relationship between formation pressure and the permeability multiplier, which illustrates the degree of stress sensitivity in each type of media. This relationship is depicted in Figure 1.

3. Numerical Simulation Model

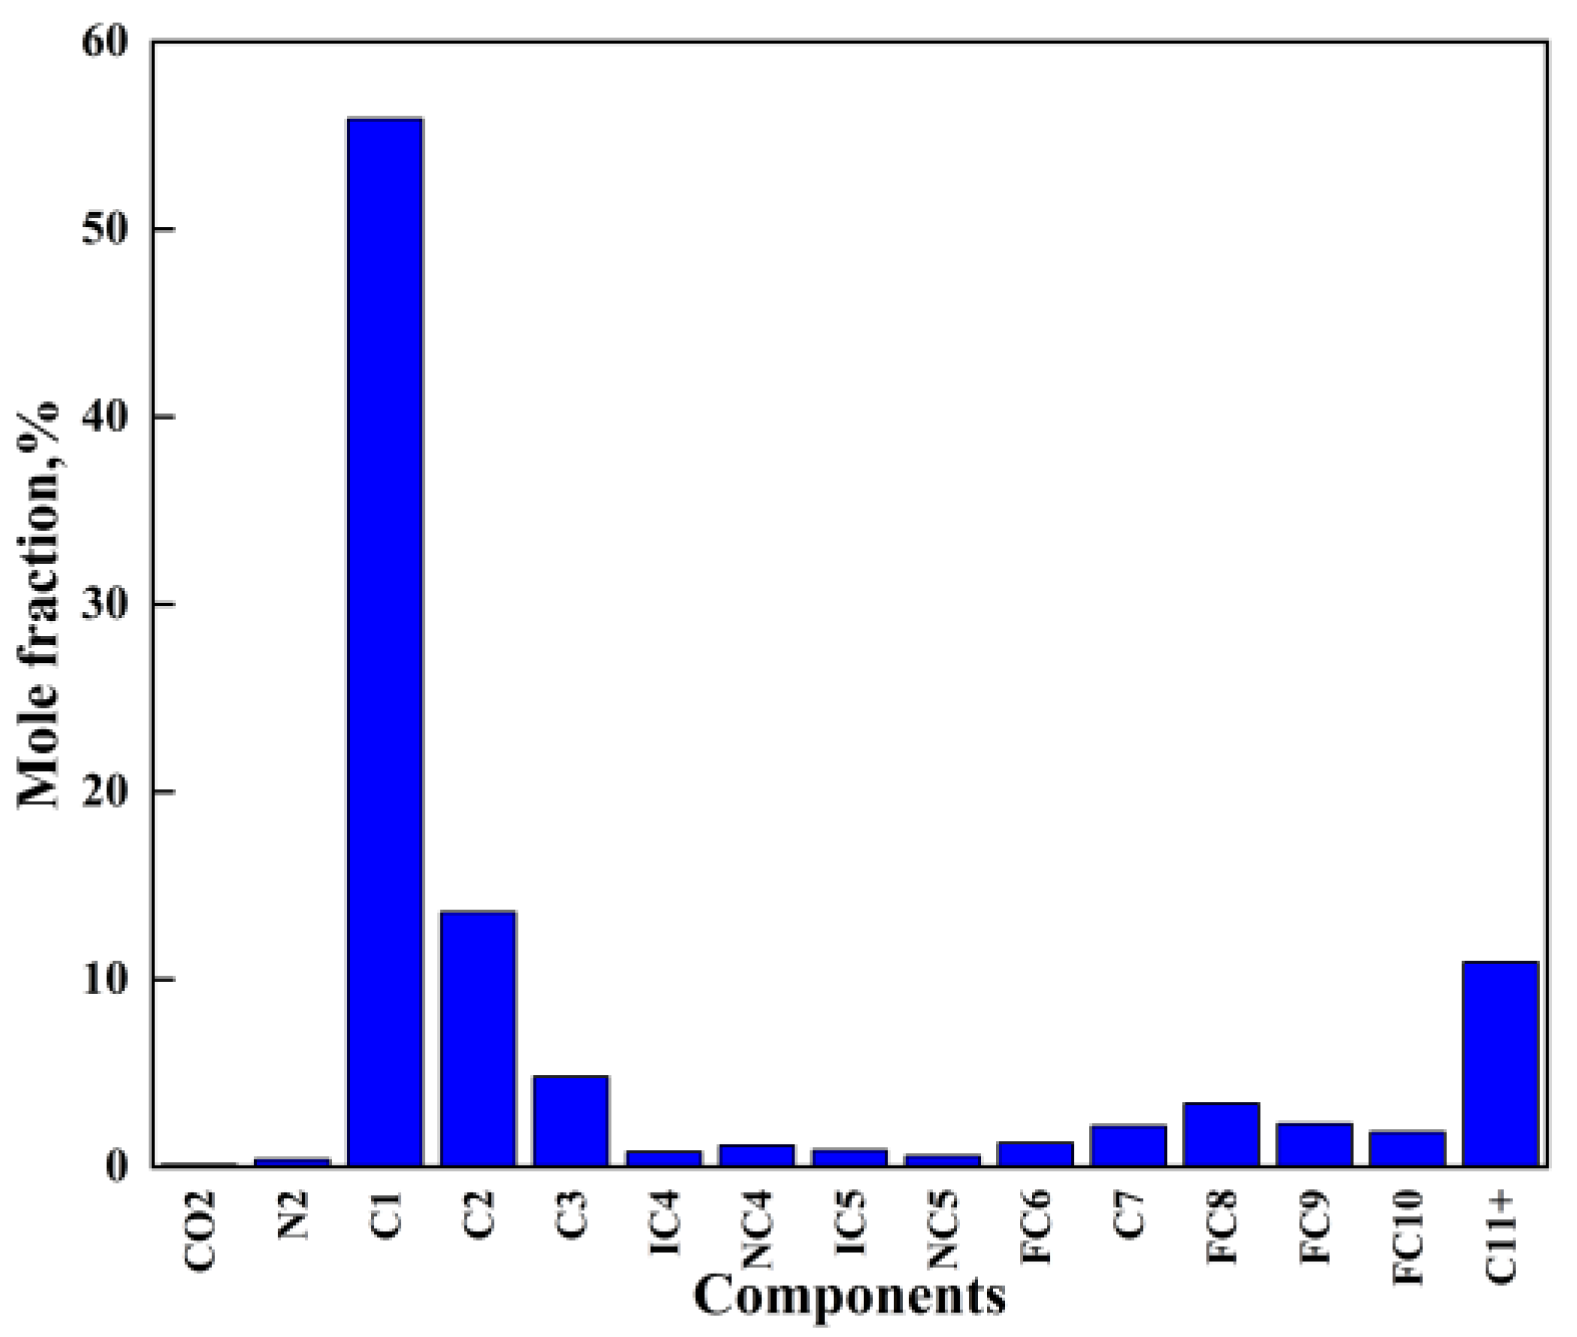
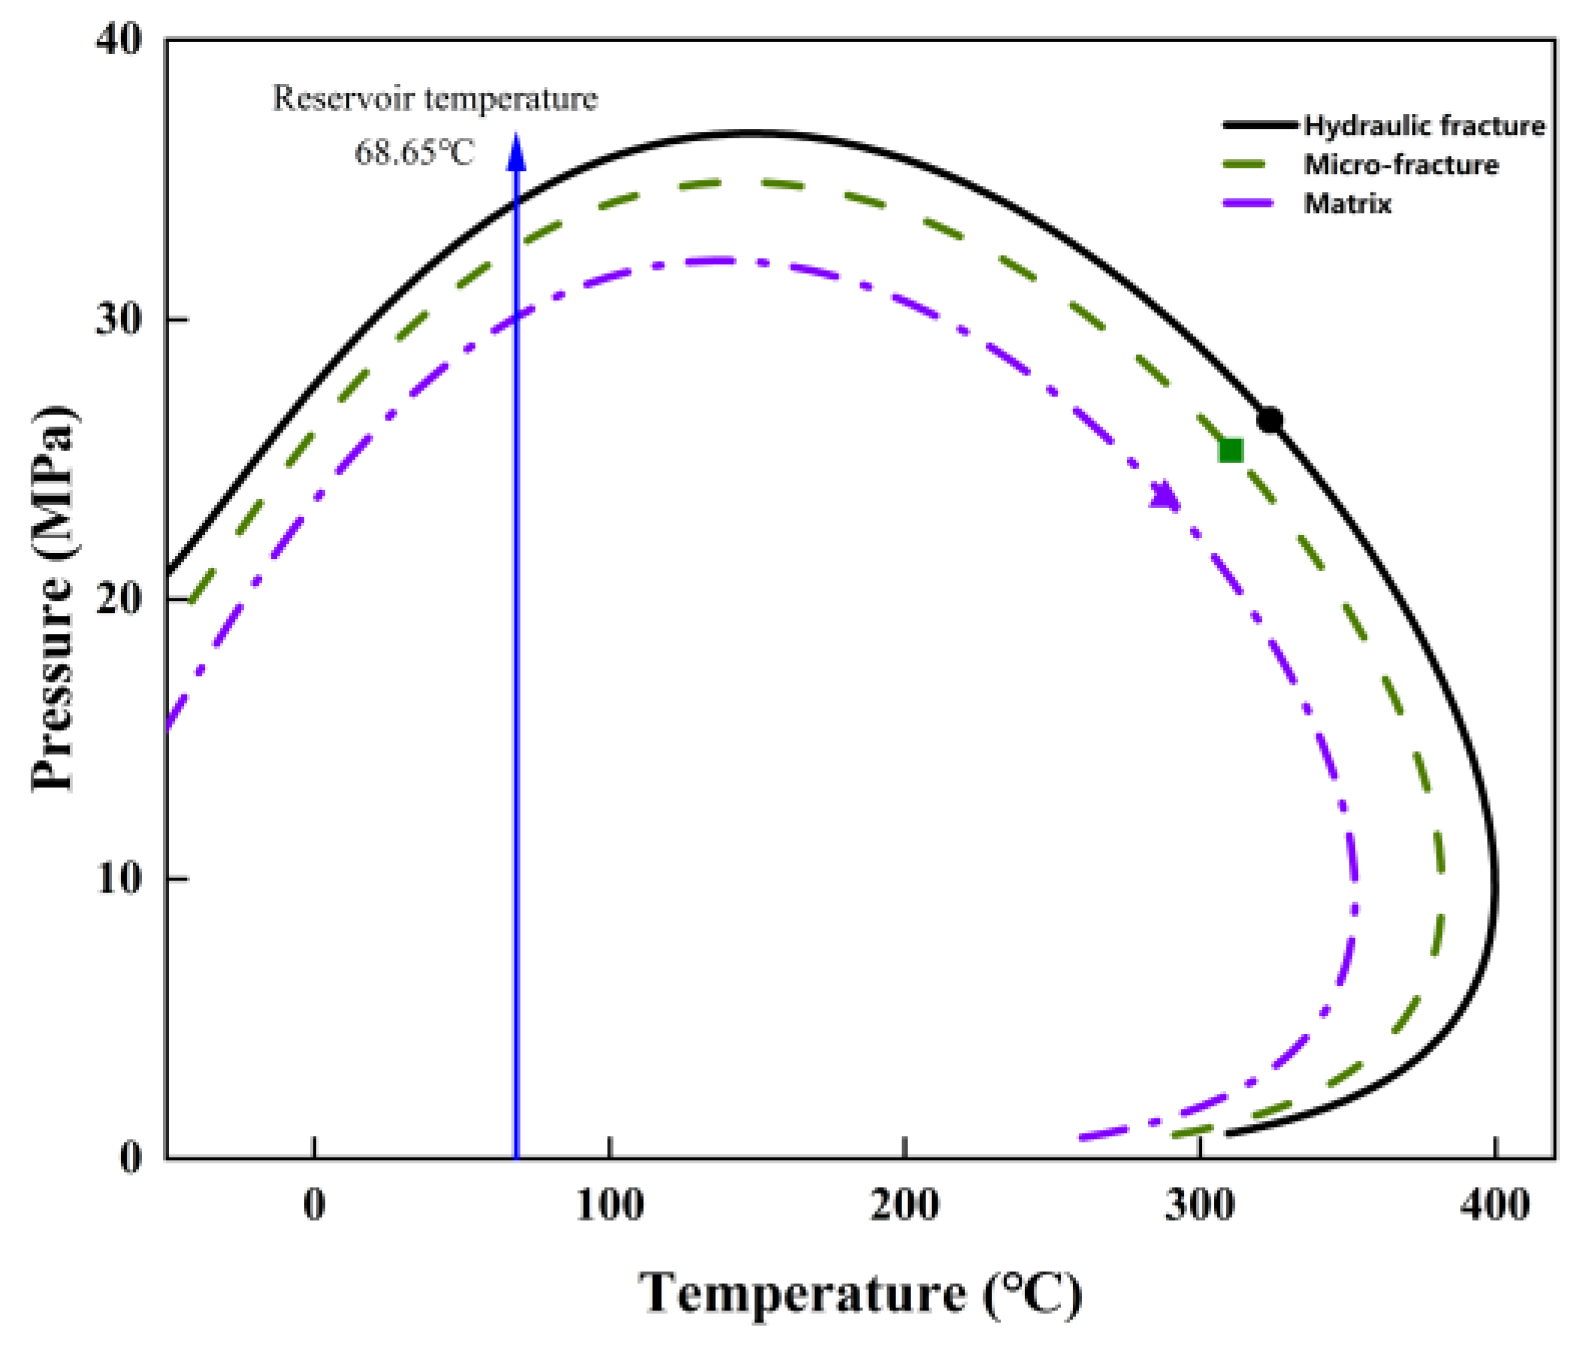
3.1. Phase Behavior Model

In this study, the fluid originates from the oil sample of the Xingye L1HF well, which exhibits volatile oil characteristics and is in an undersaturated state under reservoir conditions. The original mixture consists of 15 components, as shown in Figure 2. By lumping the original components, 6 pseudo-components were ultimately formed in CMG-WINPROP (Computer Modelling Group, 2021), as shown in Table 1. The parameters of the Peng-Robinson equation of state for each pseudo-component were adjusted to fit the multi-stage degassing experimental data and constant composition expansion experimental data under bulk phase conditions, making them more consistent with the real fluid conditions of the reservoir. Lu et al. measured the bubble point pressures of the oil sample from the Xingye L1HF well under nanoscale confinement in microfluidic experiments, which were 34.3 MPa for hydraulic fractures, 32.7 MPa for micro-fractures, and 30.1 MPa for matrix pores [30]. To meet the real phase characteristics of confined fluids in the nanopores of shale reservoirs, the critical parameters of the components were corrected according to Formulas (3)–(5) to match the observed values, and the fluid phase diagrams under different scales are shown in Figure 3.

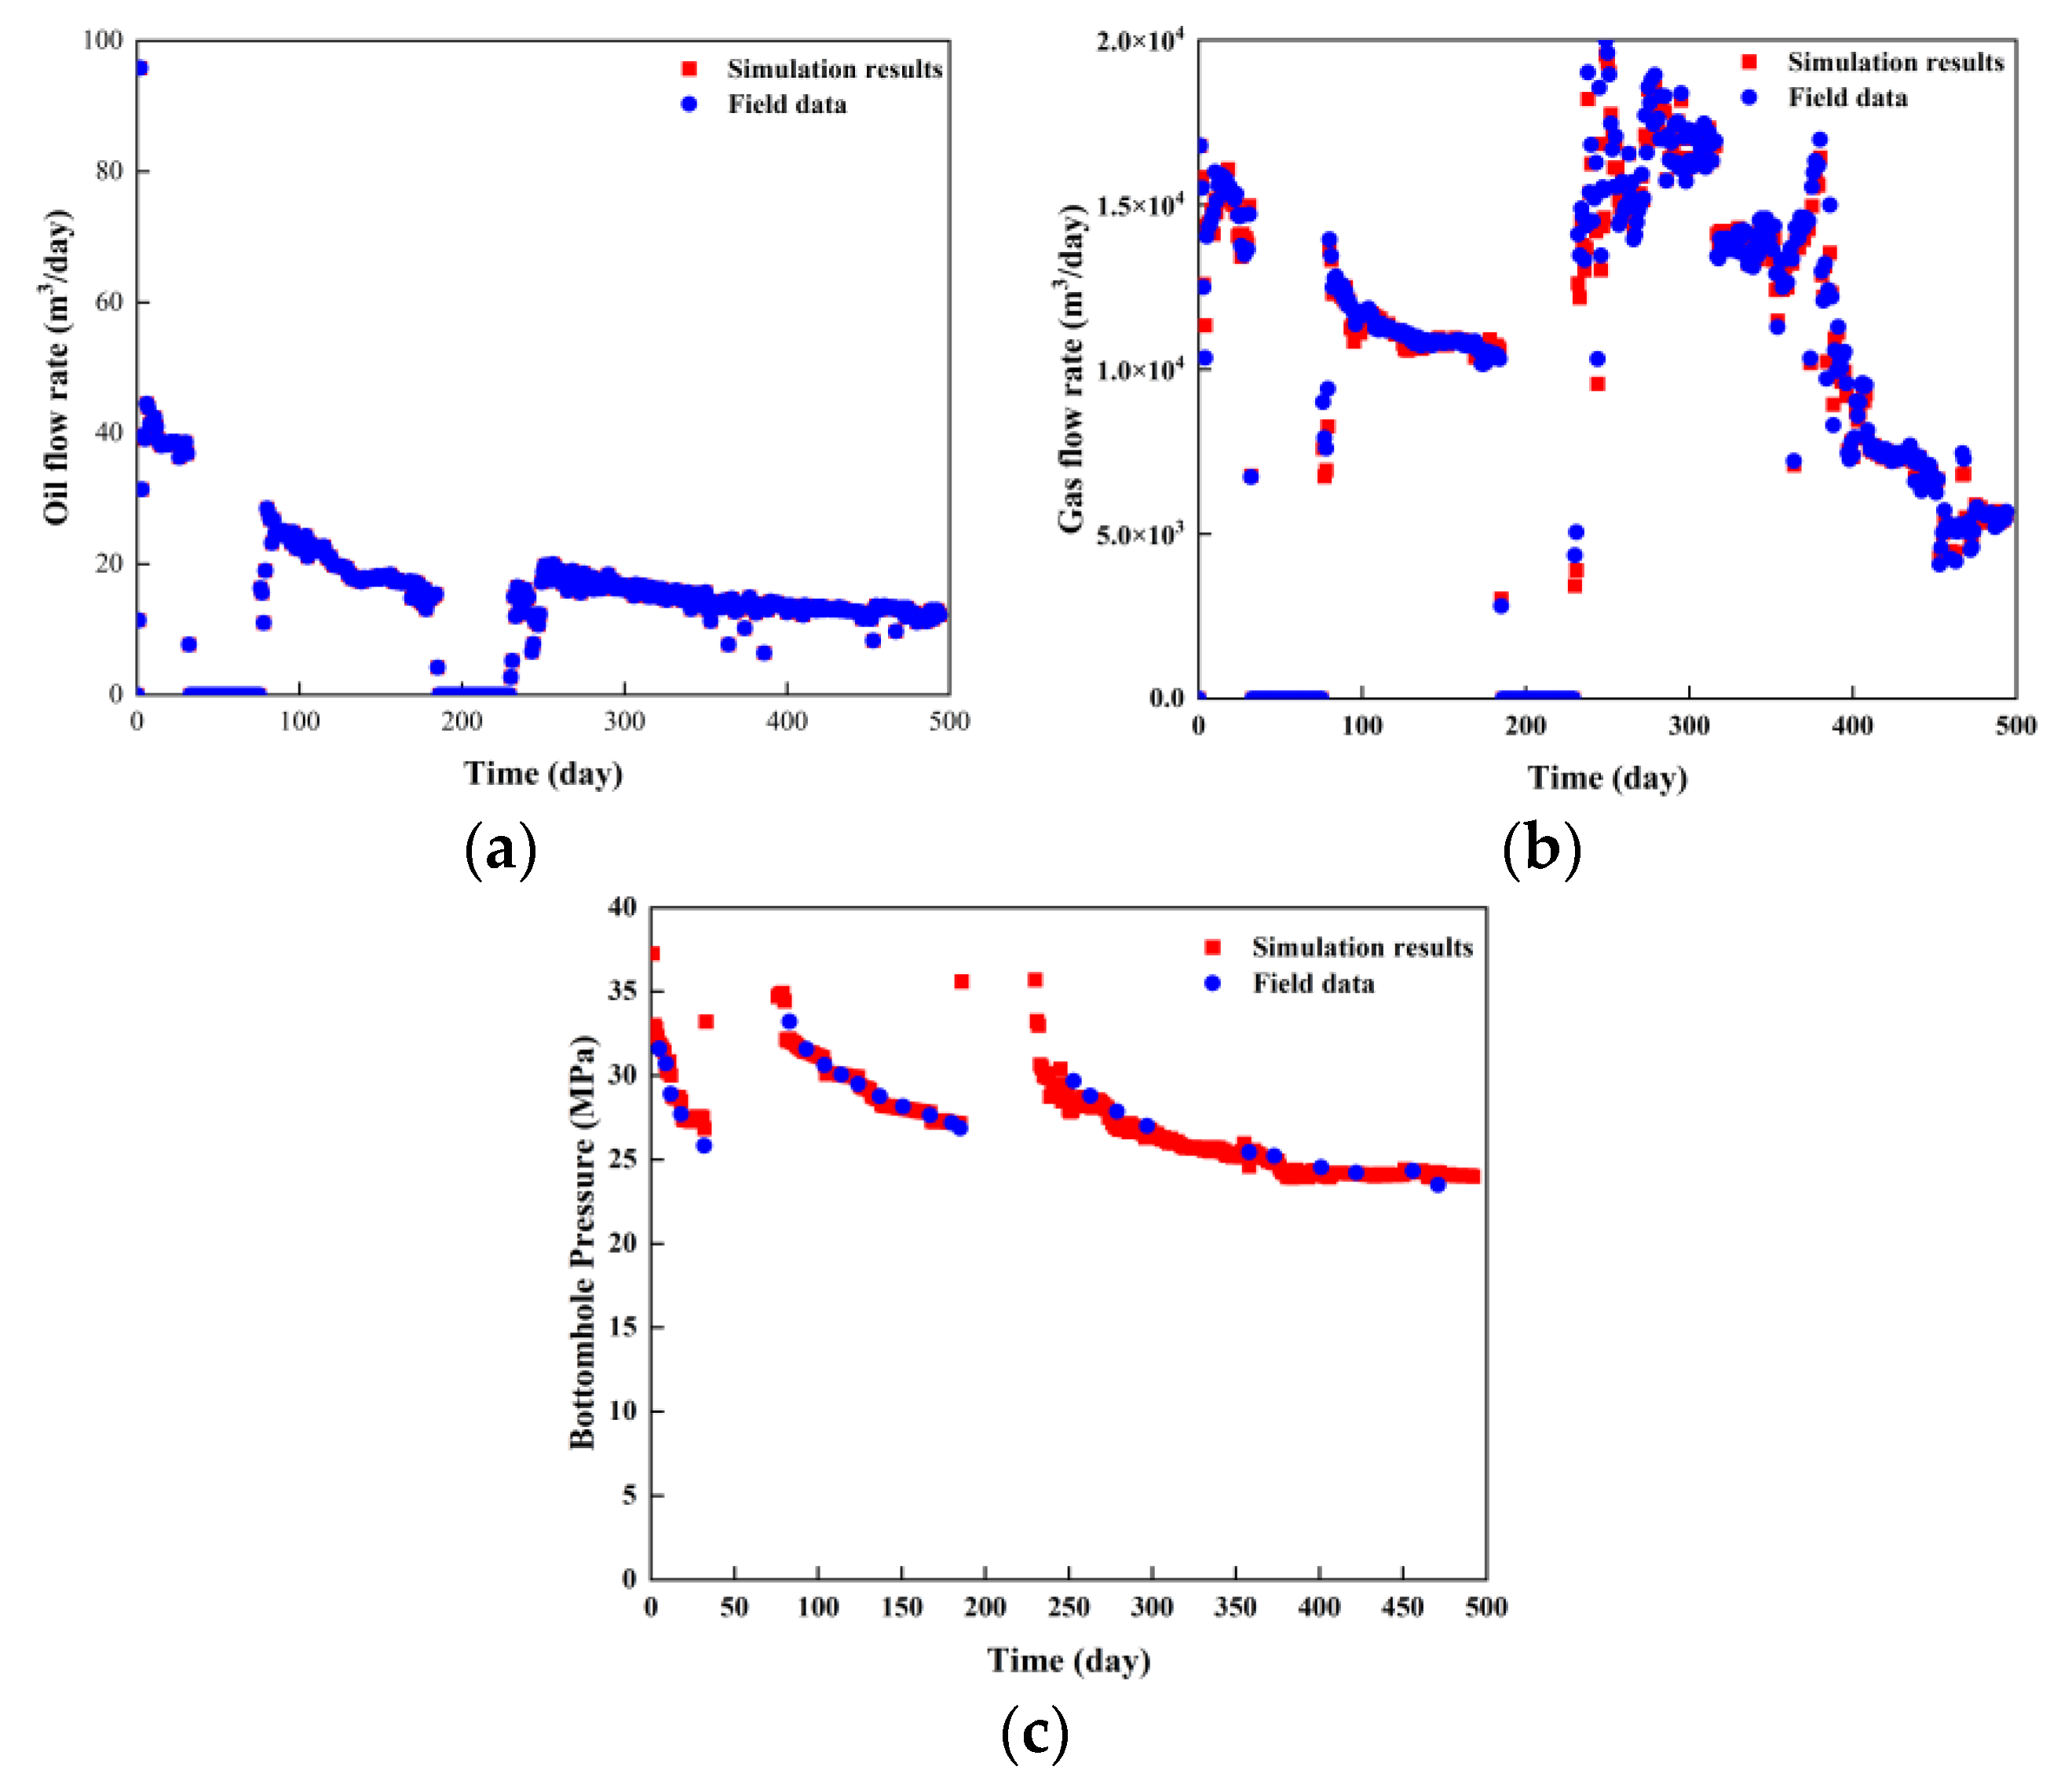
3.2. Reservoir Model

In this study, we used CMG-GEM (Computer Modelling Group, 2021) for component numerical simulation. The geological model generated 305,115 grid blocks in the X, Y, and Z directions. The reservoir model is 3900 m long, 6000 m wide, and 30 m high. The study focuses on a horizontal well in the block, Xingye L1HF, which has undergone 29 fracturing stages. To accurately describe the fluid transport mechanism around the hydraulic fractures and the surrounding media, and to finely characterize the pressure drop, a local grid refinement method was used to model the 29 hydraulic fractures in the well, assuming a symmetrical bi-wing fracture distribution. The reservoir model is shown in Figure 4. During the history matching process, the daily oil production under surface conditions was used as a constraint, and the daily gas production and bottom hole pressure were used as history matching targets. By adjusting fracture parameters and relative permeability curves, a good fitting effect was achieved. Figure 5a–c compare the simulated daily oil, daily gas, and bottom hole pressure with the production history, showing good consistency. Table 2 summarizes the reservoir and fracture parameters determined through history matching. Diffusion has been identified as an important mechanism in the CO2 Huff-n-Puff process for enhanced oil recovery. In our simulation, we considered the diffusion of CO2 in oil and gas, with other components’ diffusion coefficients assumed to be zero, and the diffusion coefficient was 1 × 10⁻⁴ cm2/s. Similarly, in our simulation, we also considered the adsorption of CO2 and methane in the reservoir, and Table 3 lists the Langmuir adsorption parameters used in this study.

4. Results and Discussion

Based on the geological model of the reservoir and the characteristics of the fluid, considering the various transport mechanisms in shale oil reservoirs, an actual well gas injection huff-n-puff simulation was conducted after history matching. We compared the performance of CO2, dry gas, and produced gas in three cycles of huff-n-puff and found that CO2 had the greatest potential for enhanced oil recovery. Subsequently, the impact of different CO2 injection parameters on the increase in oil and gas production ratio was compared, and the optimal operational parameters were selected accordingly. In the sensitivity analysis, only one variable was changed at a time, with all other parameters remaining constant and within a reasonable range. Here, we first provide a brief overview of the entire CO2 huff-n-puff process. After history matching, the horizontal well, as a production well, was developed through depletion for about one year, and then switched to an injection well for gas injection. After 30 days of gas injection, the well was shut in for a soak period, and after the soak period, the injection well was converted to a production well for constant pressure production, with a minimum bottom hole flowing pressure of 2 MPa, and then produced until 5000 days to evaluate the benefits of CO2 in a single cycle. After determining the parameters for the first cycle of injection, the optimization of the number of injection cycles was carried out, and the CO2 utilization ratio was defined as the mass of oil production increased by the injected gas divided by the mass of the injected gas.

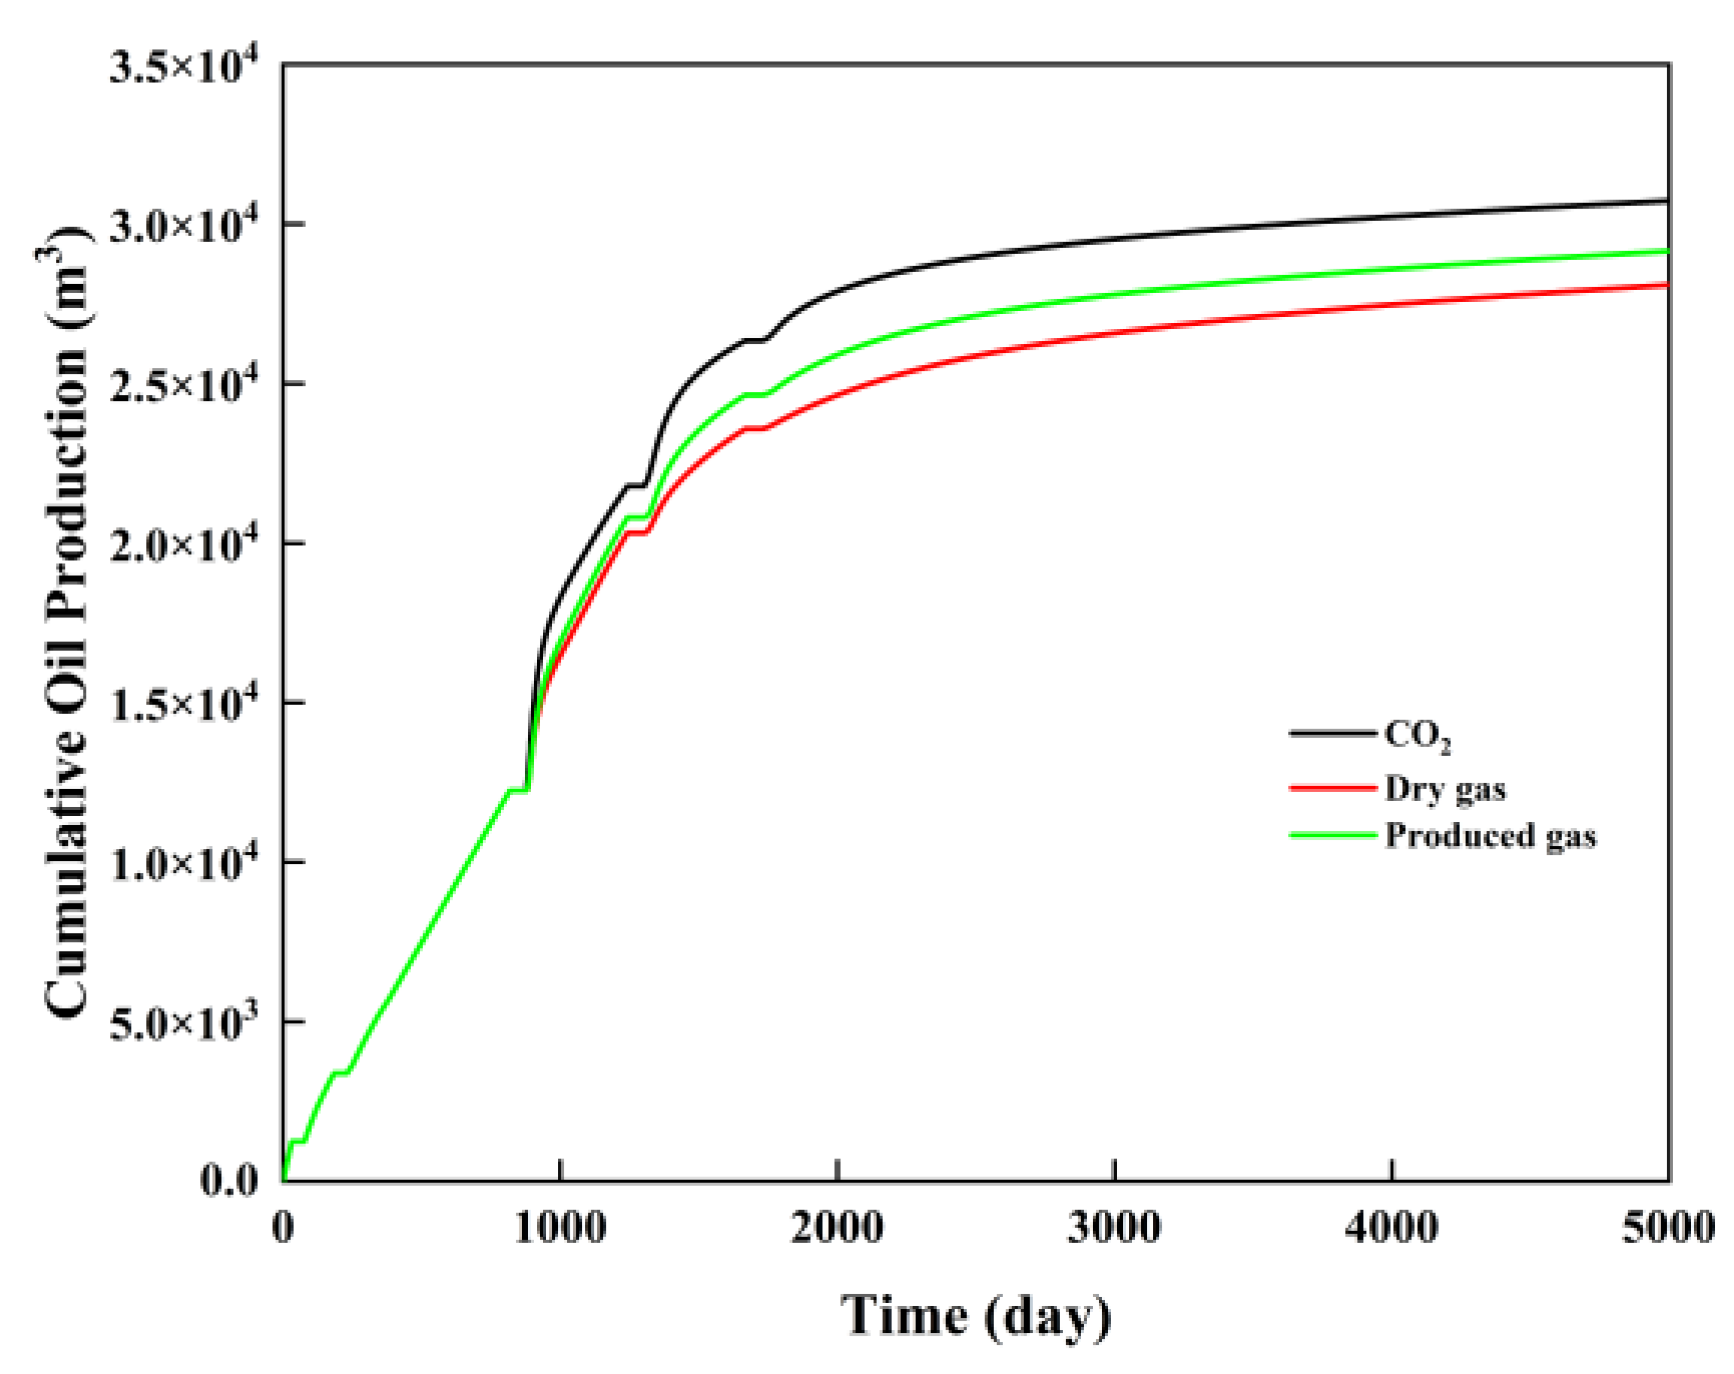
4.1. Advantages of CO2

We first optimized the injected gas, selecting CO2, produced gas, and dry gas as the injection gases, with an injection rate set at 100,000 cubic meters/day for three cycles of huff-n-puff operations. The production period for the first two cycles of huff-n-puff was 365 days, and after the third cycle of huff-n-puff, production continued until 5000 days. Figure 6 illustrates that CO2 as the injected gas had the best effect, followed by produced gas and dry gas. The minimum miscibility pressure (MMP) of the three gases with volatile oil was measured using the multi-stage mixing cell method, as shown in Table 4, and the MMP order was consistent with the huff-n-puff effect of different injected gases. Therefore, when implementing gas injection huff-n-puff in shale volatile oil reservoirs, CO2 should be the first choice.

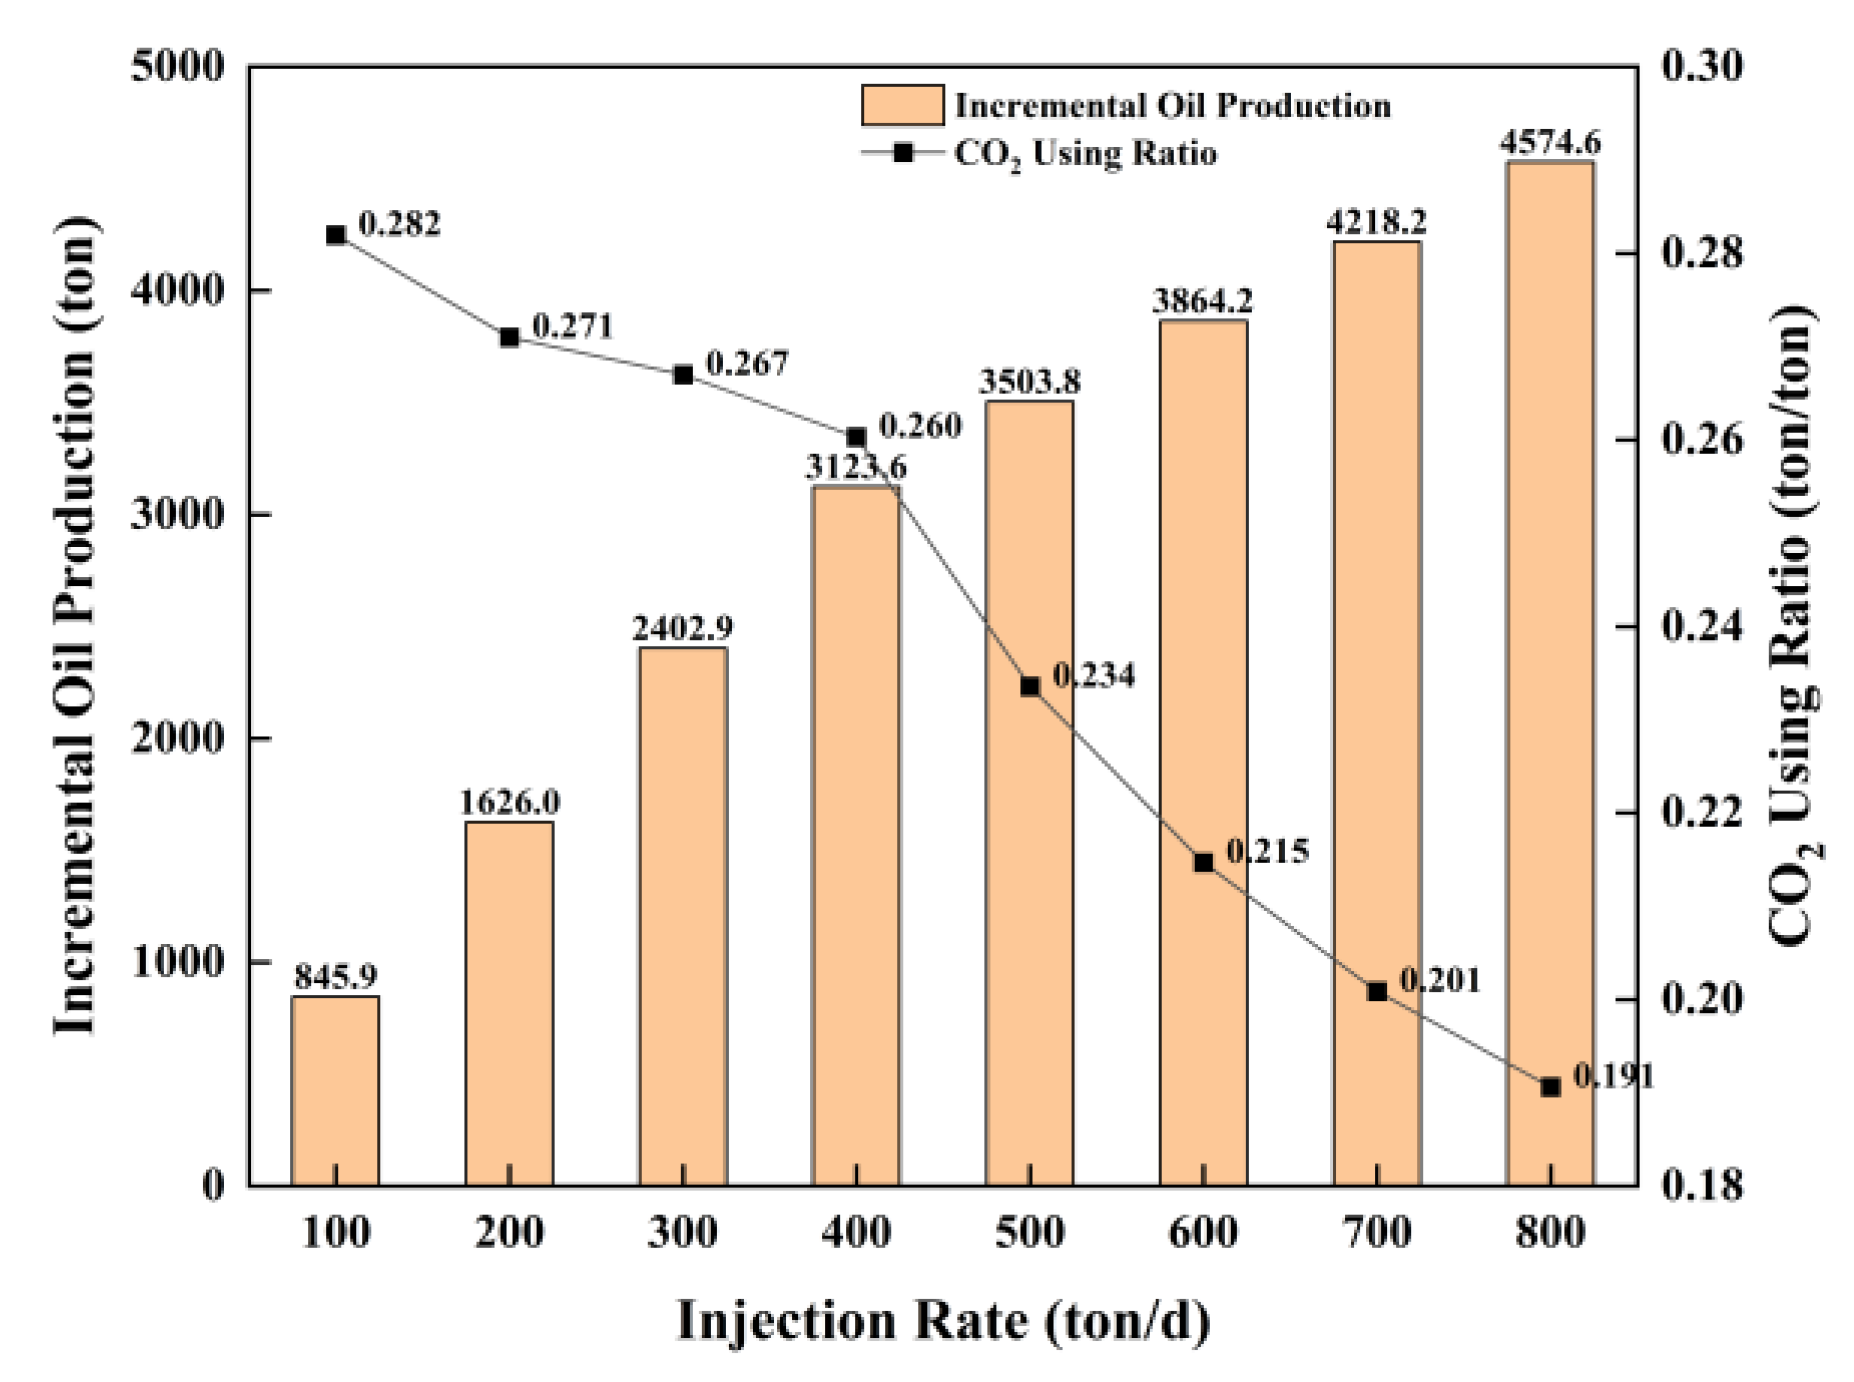
4.2. Effect of CO2 Injection Rate

In the study of CO2 injection rates, simulations were conducted with eight different rates, ranging from 100 to 800 tons/day. Figure 7 shows the impact of different injection rates on the first cycle of CO2 huff-n-puff. The oil production at any injection rate was higher than that of primary depletion, indicating that the injection of CO2 is beneficial for improving the recovery rate, and the more CO2 injected, the stronger the huff-n-puff effect. Figure 8 shows the impact of different injection rates on the increase in oil production and the CO2 utilization ratio. It can be observed that at an injection rate of 100 tons/day, the CO2 utilization ratio was the highest, but the increase in oil production was the lowest. As the injection rate increased, the increase in oil production gradually increased, but the growth rate slowed down. An excessively high injection rate might cause the injected gas to enter the deep formation without fully dissolving with the crude oil and might push the crude oil near the wellbore to the deeper part of the reservoir. The CO2 utilization ratio gradually decreased with the increase of the injection rate, and the rate of decrease accelerated after 400 tons/day. Therefore, based on the comprehensive consideration of the increase in oil production and the oil exchange rate, the injection rate was determined to be 400 tons/day.

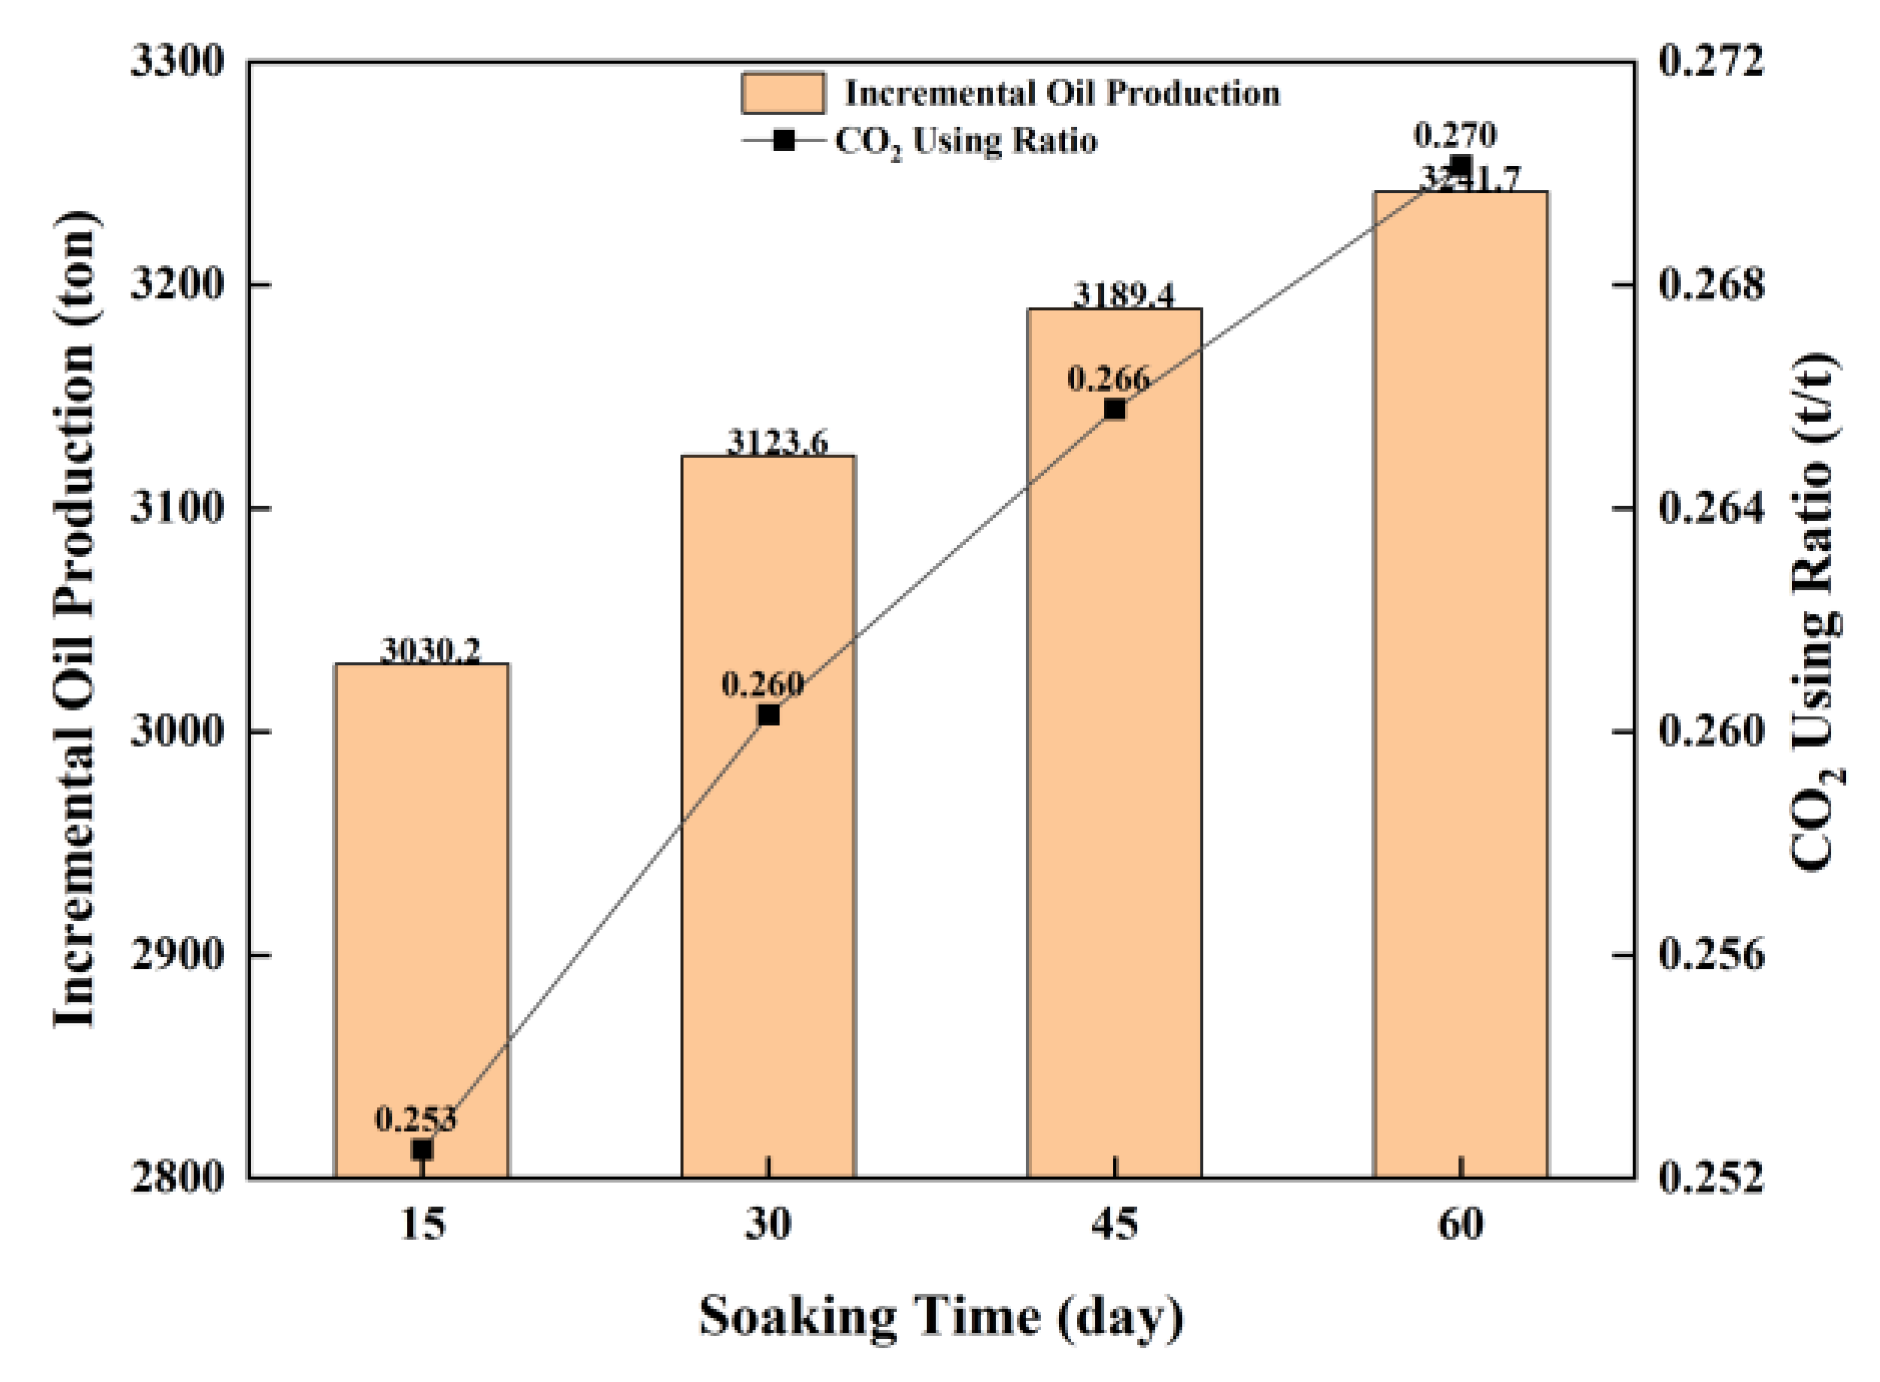
4.3. Effect of Soaking Time

The soaking time during the huff-n-puff process directly affected the utilization ratio of the injected CO2. Based on the optimized injection rate in the previous section, the soaking time of the well was optimized by simulating four scenarios of 15 days, 30 days, 45 days, and 60 days. The increase in oil production and the CO2 utilization ratio for different soaking times are shown in Figure 9 It was found that under the same injection rate, the soaking time had a certain impact on the CO2 huff-n-puff effect. From 10 days to 30 days, the growth rate of oil production was greater than that from 30 days to 90 days. At the same time, the longer the soaking time, the corresponding production time would decrease. Therefore, the soaking time for each cycle was set to 30 days.

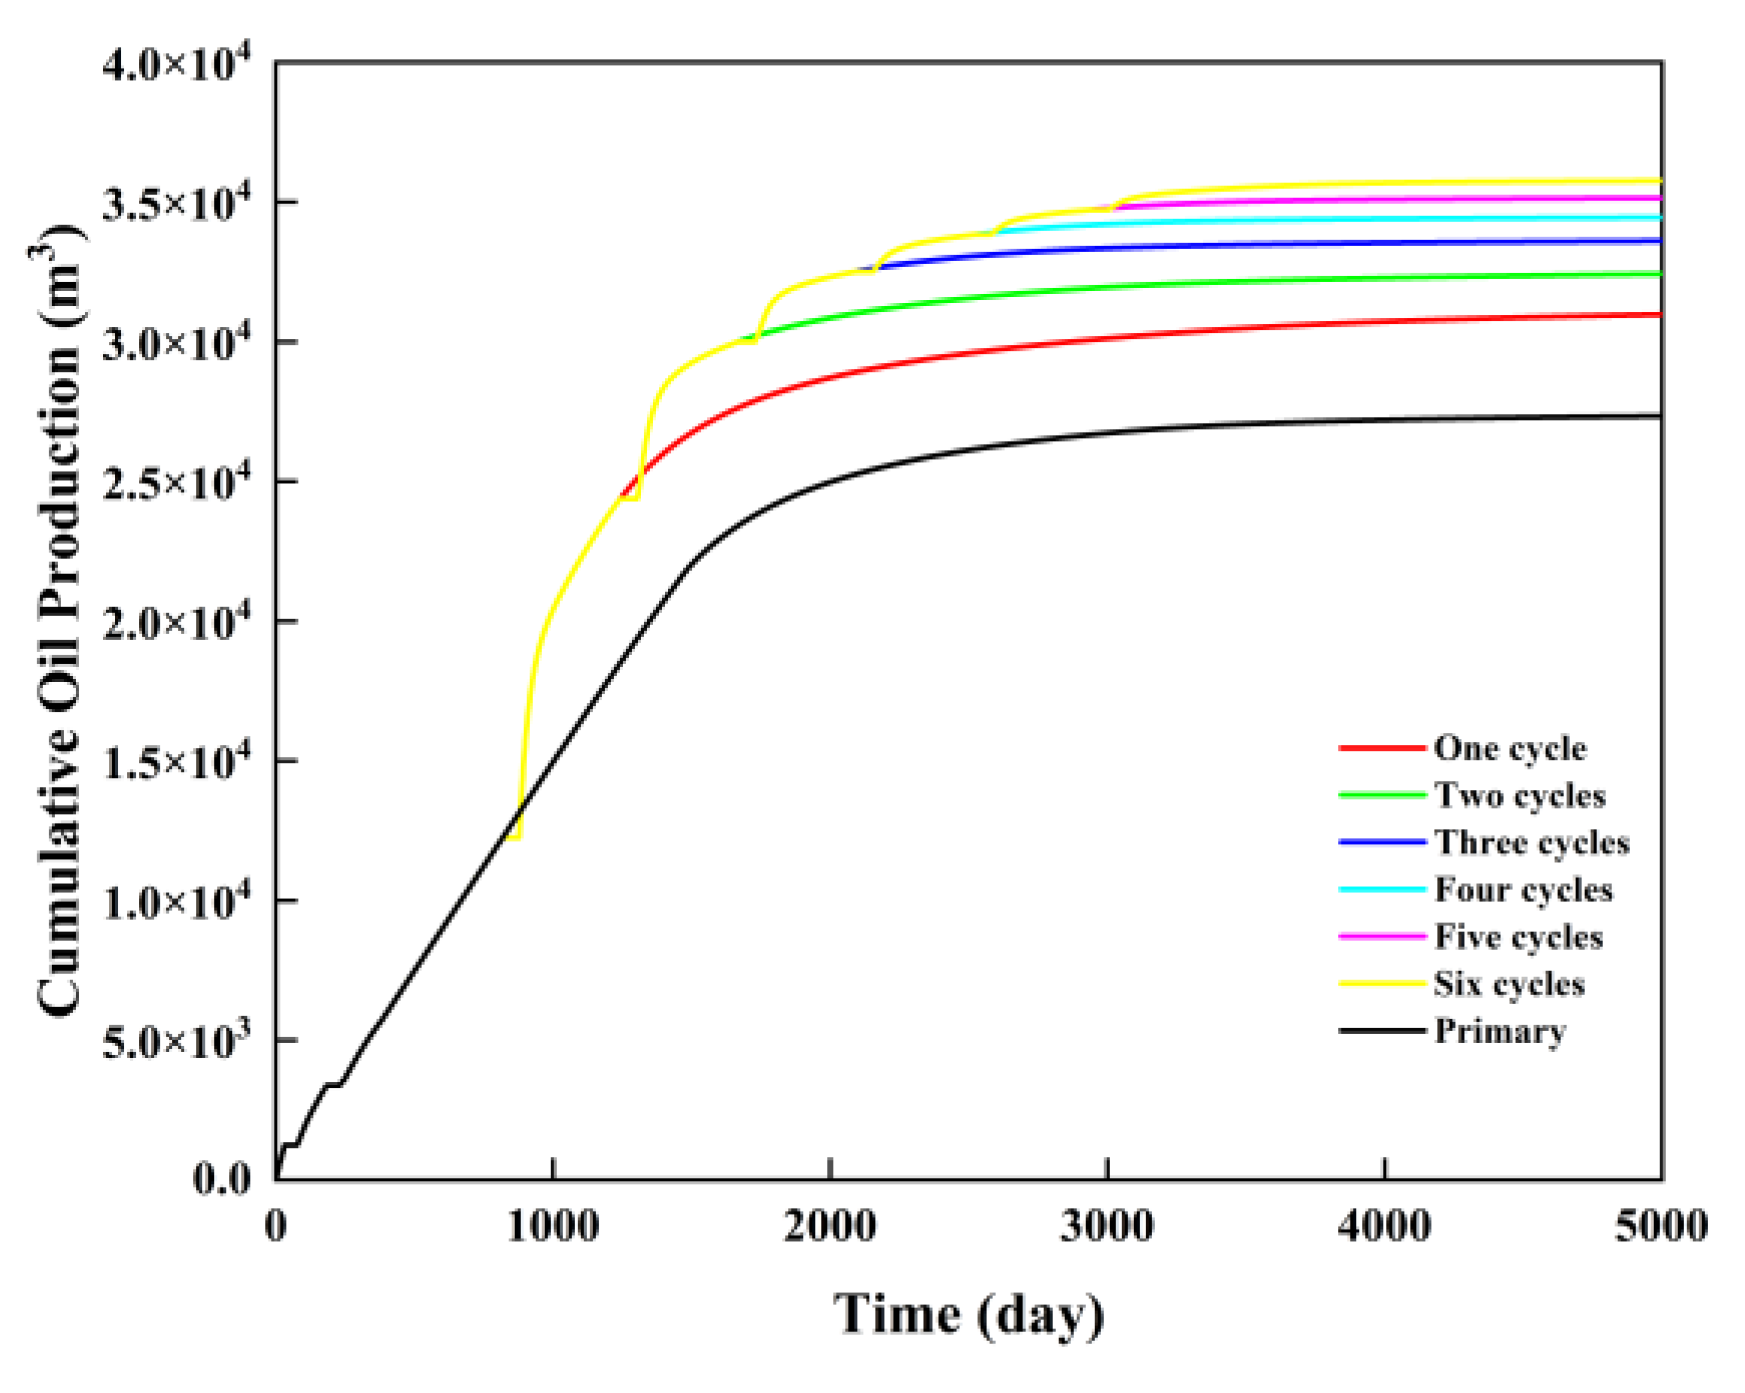
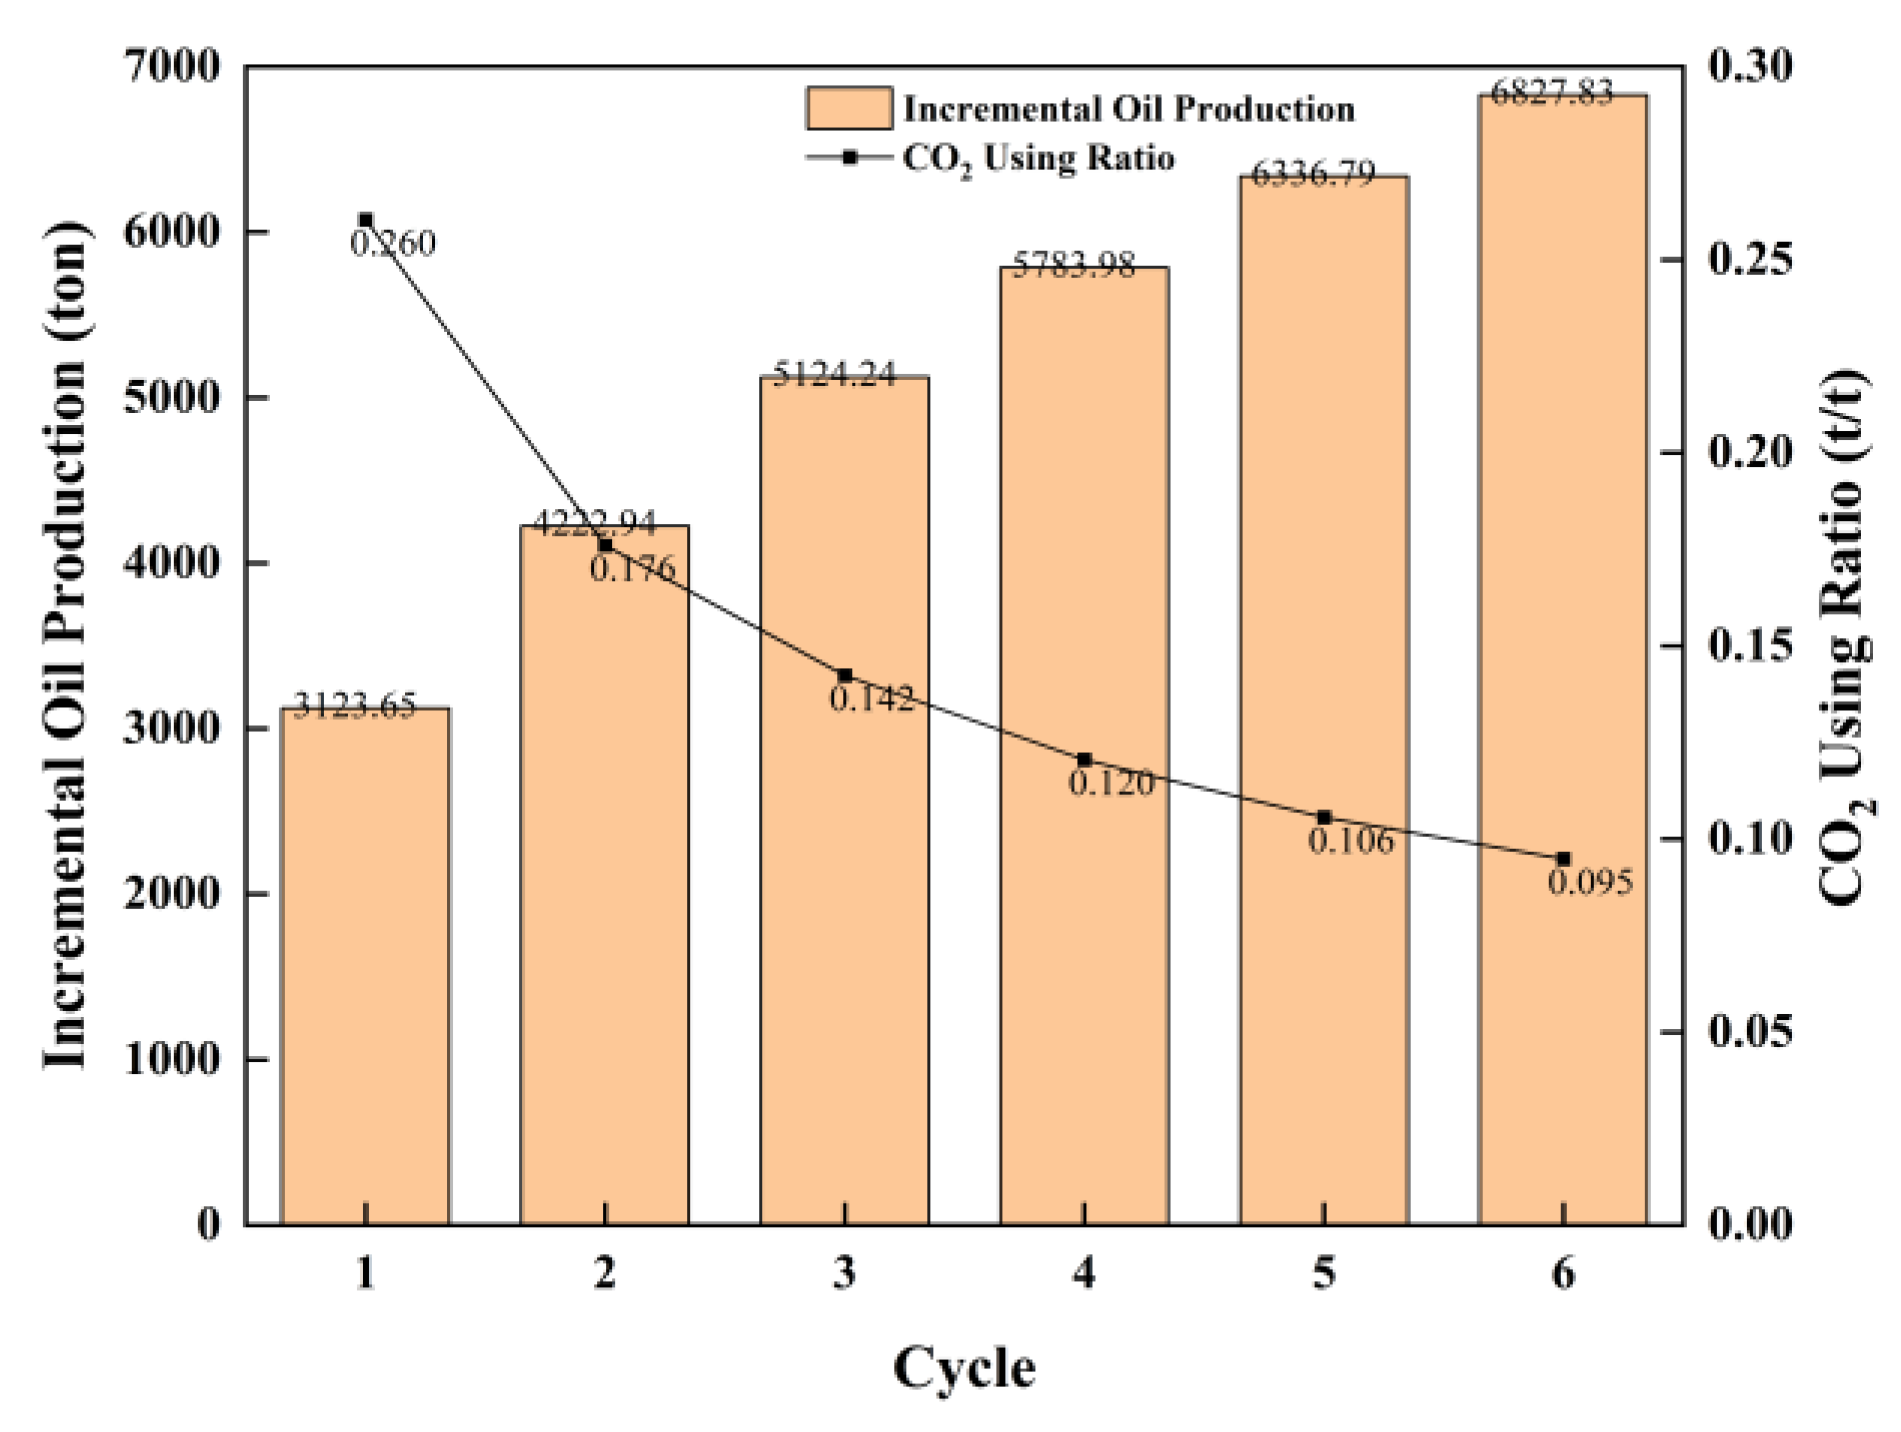
4.4. Effect of the Number of CO2 Huff-n-Puff Cycles

To find the most suitable number of huff-n-puff cycles, simulations were conducted with one to six cycles, based on the injection rate and soaking time optimized in the previous sections. Figure 10 shows the cumulative oil production for different CO2 huff-n-puff cycles. The oil production of all gas injection huff-n-puff cases was higher than that of exhaustion extraction, indicating that the injection of CO2 could indeed significantly increase oil production. However, as the number of huff-n-puff cycles increased, the rate of increase in oil production gradually slowed down. Figure 11 shows the impact of different huff-n-puff cycles on the increase in oil production and the CO2 utilization ratio. The CO2 utilization ratio gradually decreased with the increase of cycles, which might be due to the continuous extraction of oil saturation near the wellbore, and the difficulty of utilizing crude oil in the transformation area as the fractures close. On the other hand, the lack of formation energy in the later period of production was also a factor. After three cycles of huff-n-puff, the rate of increase in oil production slowed down. Therefore, based on the comprehensive consideration of the increase in oil production and the CO2 utilization ratio, the optimal number of cycles was determined to be three.

5. Conclusions

This study presents a comprehensive numerical simulation analysis focused on the application of CO2 huff-n-puff processes in shale volatile oil reservoirs. Through meticulous modeling and adjustment of parameters based on actual reservoir conditions and fluid characteristics, the research has yielded several key findings:
  • The utilization of CO2 in huff-n-puff operations demonstrates significant potential for enhancing oil recovery in shale reservoirs. The simulation results underscore the superiority of CO2 over other gases in improving both the recovery rate and the overall efficiency of the process.
  • A critical factor influencing the effectiveness of CO2 huff-n-puff is the injection rate. The study identifies an optimal injection rate of 400 tons/day, beyond which the benefits of increased injection rates diminish and can lead to suboptimal gas utilization.
  • The duration of the soaking period is another pivotal parameter, with the study suggesting that a soaking time of 30 days is most effective. This period allows for adequate contact between the injected CO2 and the reservoir fluids, facilitating better oil displacement.
  • The research reveals that three cycles of CO2 huff-n-puff are optimal for maximizing oil recovery. Beyond this point, the incremental benefits of additional cycles decrease, and the process becomes less efficient.
In summary, this research contributes to the body of knowledge on CO2 huff-n-puff processes in shale oil recovery, offering a robust model for predicting outcomes and guiding operational decisions that can enhance recovery efficiency and economic viability. The findings are expected to be instrumental for stakeholders in the oil and gas industry, particularly in the context of optimizing unconventional oil recovery strategies.

Author Contributions

Methodology, W.L.; Software, W.L.; Formal analysis, W.L. and H.S.; Investigation, A.Z.; Data curation, A.Z. and R.Z. Writing original draft, A.Z. and R.Z.; Writing-review &editing, W.L. and H.S.; Supervision, W.L. and H.S.; Funding acquisition, H.S. All authors have read and agreed to the published version of the manuscript.

Funding

We gratefully acknowledge the generous support from the National Natural Science Foundation of China (No. 52122402, 42090024, 52204032), Shandong Provincial Natural Science Foundation (No. ZR2022JQ23, ZR2020ME087).

Data Availability Statement

Data are contained within the article.

Conflicts of Interest

Authors Aiwei Zheng and Wentao Lu were employed by the company Exploration and Development Research Institute Sinopec Jianghan Oilfield Company. The remaining authors declare that the research was conducted in the absence of any commercial or financial relationships that could be construed as potential conflicts of interest.

References

  1. Ma, Y.S.; Cai, X.Y.; Zhao, P.R.; Hu, Z.; Liu, H.; Gao, B.; Zhang, Z. Geological characteristics and exploration practices of continental shale oil in China. Acta Geol. Sin. 2022, 96, 155–171. [Google Scholar]
  2. Jin, Z.J.; Bai, Z.R.; Gao, B.; Li, M. Has China ushered in the shale oil and gas revolution ? Oil Gas Geol. 2019, 40, 451–458. [Google Scholar]
  3. Du Jinhu, H.S.; Zhenglian, P.; Senhu, L.; Lianhua, H.; Rukai, Z. The types, potentials and prospects of continental shale oil in China. China Pet. Explor. 2019, 24, 560. [Google Scholar]
  4. Zou, C.; Pan, S.; Zhao, Q. On the connotation, challenge and significance of China’s “energy independence” strategy. Pet. Explor. Dev. 2020, 47, 449–462. [Google Scholar] [CrossRef]
  5. Zhao, W.; Hu, X.; Hou, L. Development potential and technical strategy of continental shale oil in China. Pet. Explor. Dev. 2020, 47, 819–828. [Google Scholar]
  6. Wang, P.; Liu, Z.; Zhang, D.; Li, X.; Liu, H.; Du, W.; Zhou, L.; Li, Q. Shale oil enrichment conditions and exploration potential of Middle Jurassic Lianggaoshan Formation in Fuxing area, Sichuan Basin. Nat. Gas Geosci. 2023, 34, 1237–1246. [Google Scholar]
  7. Hamdi, H.; Clarkson, C.R.; Ghanizadeh, A.; Ghaderi, S.M.; Vahedian, A.; Riazi, N.; Esmail, A. Huff-n-Puff gas injection performance in shale reservoirs: A case study from Duvernay Shale in Alberta, Canada. In Proceedings of the Unconventional Resources Technology Conference, Houston, TX, USA, 23–25 July 2018. [Google Scholar]
  8. Yu, W.; Lashgari, H.; Sepehrnoori, K. Simulation Study of CO2 Huff-n-Puff Process in Bakken Tight Oil Reservoirs. In Proceedings of the SPE Western North American and Rocky Mountain Joint Meeting, Denver, CO, USA, 15–18 April 2014. [Google Scholar]
  9. Kolawole, O.; Gamadi, T.D.; Bullard, D. Artificial lift system applications in tight formations: The state of knowledge. SPE Prod. Oper. 2020, 35, 422–434. [Google Scholar]
  10. Sheng, J.J.; Chen, K. Evaluation of the EOR potential of gas and water injection in shale oil reservoirs. J. Unconv. Oil Gas Resour. 2014, 5, 1–9. [Google Scholar] [CrossRef]
  11. Li, L.; Su, Y.; Sheng, J.J.; Hao, Y.; Wang, W.; Lv, Y.; Zhao, Q.; Wang, H. Experimental and numerical study on CO2 sweep volume during CO2 Huff-n-Puff enhanced oil recovery process in shale oil reservoirs. Energy Fuels 2019, 33, 4017–4032. [Google Scholar] [CrossRef]
  12. Wang, T.; Yu, Y.; Sheng, J.J. Experimental and numerical study of the EOR potential in liquid-rich shales by cyclic gas injection. J. Unconv. Oil Gas Resour. 2015, 12, 56–67. [Google Scholar]
  13. Wang, Y.; Tang, Y.; Li, S.; Liu, X. Cyclic gas injection huff-n-puff in multi-stage fracturing horizontal wells to improve recovery of shale oil and gas reservoirs: Taking Eagle Ford Shale in North America as an example. Nat. Gas Ind. 2023, 43, 153–161. [Google Scholar]
  14. Fu, J.; Yao, B.; Lei, Z.; Tian, Y.; Wu, Y. Enhanced Oil Recovery of Ultra-low Permeability Tight Reservoirs in North America. J. Southwest Pet. Univ. (Sci. Technol. Ed.) 2021, 43, 166–183. [Google Scholar]
  15. Hoffman, B.T. Comparison of Various Gases for Enhanced Recovery from Shale Oil Reservoirs. In Proceedings of the SPE Improved Oil Recovery Symposium, Tulsa, OK, USA, 14–18 April 2012. [Google Scholar]
  16. Li, L.; Sheng, J.J.; Xu, J. Gas selection for huff-n-puff EOR in shale oil reservoirs based upon experimental and numerical study. In Proceedings of the SPE Unconventional Resources Conference, Calgary, AB, Canada, 15–16 February 2017. [Google Scholar]
  17. Zhang, Y.; Sheng, J.; Li, Q.; Song, P.; Yukun, C.; Qin, J. Advances in the Application of CO2 Stimulation Technology. Spec. Oil Gas Reserv. 2021, 28, 1. [Google Scholar]
  18. Yan, J. Carbon Capture and Storage (CCS). Appl. Energy 2015, 148, A1–A6. [Google Scholar] [CrossRef]
  19. Aminu, M.D.; Nabavi, S.A.; Rochelle, C.A.; Manovic, V. A review of developments in carbon dioxide storage. Appl. Energy 2017, 208, 1389–1419. [Google Scholar] [CrossRef]
  20. Kong, X.; Wang, H.; Yu, W.; Wang, P.; Miao, J.; Fiallos-Torres, M. Compositional simulation of geological and engineering controls on gas huff-n-puff in Duvernay shale volatile oil reservoirs, Canada. Energies 2021, 14, 2070. [Google Scholar] [CrossRef]
  21. Kong, X.; Wang, H.; Yu, W.; Wang, P.; Liu, L.; Zhang, W. Phase Behavior in Nanopores and Its Indication for Cyclic Gas Injection in a Volatile Oil Reservoir from Duvernay Shale. Lithosphere 2022, 12, 5261253. [Google Scholar] [CrossRef]
  22. Wan, T.; Sheng, J.J. Compositional modeling of the diffusion effect on EOR process in fractured shale-oil reservoirs by gas flooding. J. Cdn Pet. Technol. 2015, 54, 107–115. [Google Scholar] [CrossRef]
  23. Yu, W.; Lashgari, H.R.; Sepehrnoori, K.; Zhang, T.; Wu, K.; Miao, J. Compositional simulation of CO2 Huff-n-Puff in Eagle Ford tight oil reservoirs with CO2 molecular diffusion, nanopore confinement, and complex natural fractures. In Proceedings of the SPE Improved Oil Recovery Conference, Tulsa, OK, USA, 14–18 April 2018. [Google Scholar]
  24. Fakher, S.; Imqam, A. Application of carbon dioxide injection in shale oil reservoirs for increasing oil recovery and carbon dioxide storage. Fuel 2020, 265, 116944. [Google Scholar] [CrossRef]
  25. Lashgari, H.R.; Sun, A.; Zhang, T.; Pope, G.A.; Lake, L.W. Evaluation of carbon dioxide storage and miscible gas EOR in shale oil reservoirs. Fuel 2019, 241, 1223–1235. [Google Scholar] [CrossRef]
  26. Liu, L.; Yao, J.; Sun, H.; Huang, Z.; Yan, X.; Li, L. Compositional modeling of shale condensate gas flow with multiple transport mechanisms. J. Pet. Sci. Eng. 2019, 172, 1186–1201. [Google Scholar]
  27. Zarragoicoechea, G.J.; Kuz, V.A. Critical Shift of a Confined Fluid in a Nanopore. Fluid Phase Equilibria 2004, 220, 7–9. [Google Scholar] [CrossRef]
  28. Chhatre, S.S.; Sinha, S.; Braun, E.M.; Esch, W.L.; Determan, M.D.; Passey, Q.R.; Kudva, R.A. Effect of Stress, Creep, and Fluid Type on Steady State Permeability Measurements in Tight Liquid Unconventional Reservoirs. In Proceedings of the Unconventional Resources Technology Conference, Denver, CO, USA, 25–27 August 2014. [Google Scholar]
  29. Reyes, L.; Osisanya, S.O. Empirical Correlation of Effective Stress Dependent Shale Rock Properties. J. Can. Pet. Technol. 2002, 41, 90–99. [Google Scholar] [CrossRef]
  30. Lu, Z.; Wan, Y.; Xu, L.; Fang, D.; Wu, H.; Zhong, J. Nanofluidic Study of Multiscale Phase Transitions and Wax Precipitation in Shale Oil Reservoirs. Energies 2024, 17, 2415. [Google Scholar] [CrossRef]
Figure 1. Stress-sensitive curves for different media.
Energies 17 04881 g001
Figure 2. Total components diagram of volatile oil.
Energies 17 04881 g002
Figure 3. Comparison of phase envelope of components in different media.
Energies 17 04881 g003
Figure 4. Reservoir model.
Energies 17 04881 g004
Figure 5. Comparison of surface oil rate (a) surface gas rate (b) and bottom hole pressure (c) between real well production data and simulation model results.
Energies 17 04881 g005
Figure 6. Effect of different injection gas on huff-n-puff effectiveness.
Energies 17 04881 g006
Figure 7. Effect of different CO2 injection rates on CO2 huff-n-puff effectiveness.
Energies 17 04881 g007
Figure 8. Incremental oil production and CO2 utilization ratio for different injection rate.
Energies 17 04881 g008
Figure 9. Incremental oil production and CO2 utilization ratio for different soaking time.
Energies 17 04881 g009
Figure 10. Effect of different CO2 huff-n-puff cycles on CO2 huff-n-puff effectiveness.
Energies 17 04881 g010
Figure 11. Incremental oil production and CO2 utilization ratio for different CO2 huff-n-puff cycles.
Energies 17 04881 g011
Table 1. Lumped oil composition.
Pseudo-ComponentsMole Fraction (%)
CO20.1147
N2-C156.2695
C2-NC420.2952
IC5-C74.8992
FC8-FC107.5140
C11+10.9073
Table 2. Reservoir and fracture properties.
ParameterValueUnit
Reservoir dimension3900 × 6000 × 30m × m × m
Number of blocks195 × 300 × 5-
Reservoir temperature68.65°C
Average matrix porosity0.0352-
Average matrix permeability0.003mD
Fracture conductivity20mD-m
Fracture half-length125m
Fracture spacing30m
Table 3. Langmuir adsorption parameters.
ComponentCO2CH4
Volume constant (gmole/lb)0.0830.033
Pressure constant (1/psi)1.22 × 10−31.26 × 10−4
Table 4. Minimum miscible pressure.
Injected GasMMP
CO215.2
Produced gas34.1
Dry gas40.3
Disclaimer/Publisher’s Note: The statements, opinions and data contained in all publications are solely those of the individual author(s) and contributor(s) and not of MDPI and/or the editor(s). MDPI and/or the editor(s) disclaim responsibility for any injury to people or property resulting from any ideas, methods, instructions or products referred to in the content.

