Real-Time Simulation and Hardware-in-the-Loop Testing Based on OPAL-RT ePHASORSIM: A Review of Recent Advances and a Simple Validation in EV Charging Management Systems


Abstract
1. Introduction
2. Opal-RT ePHASORSIM
3. Review of Recent Advances
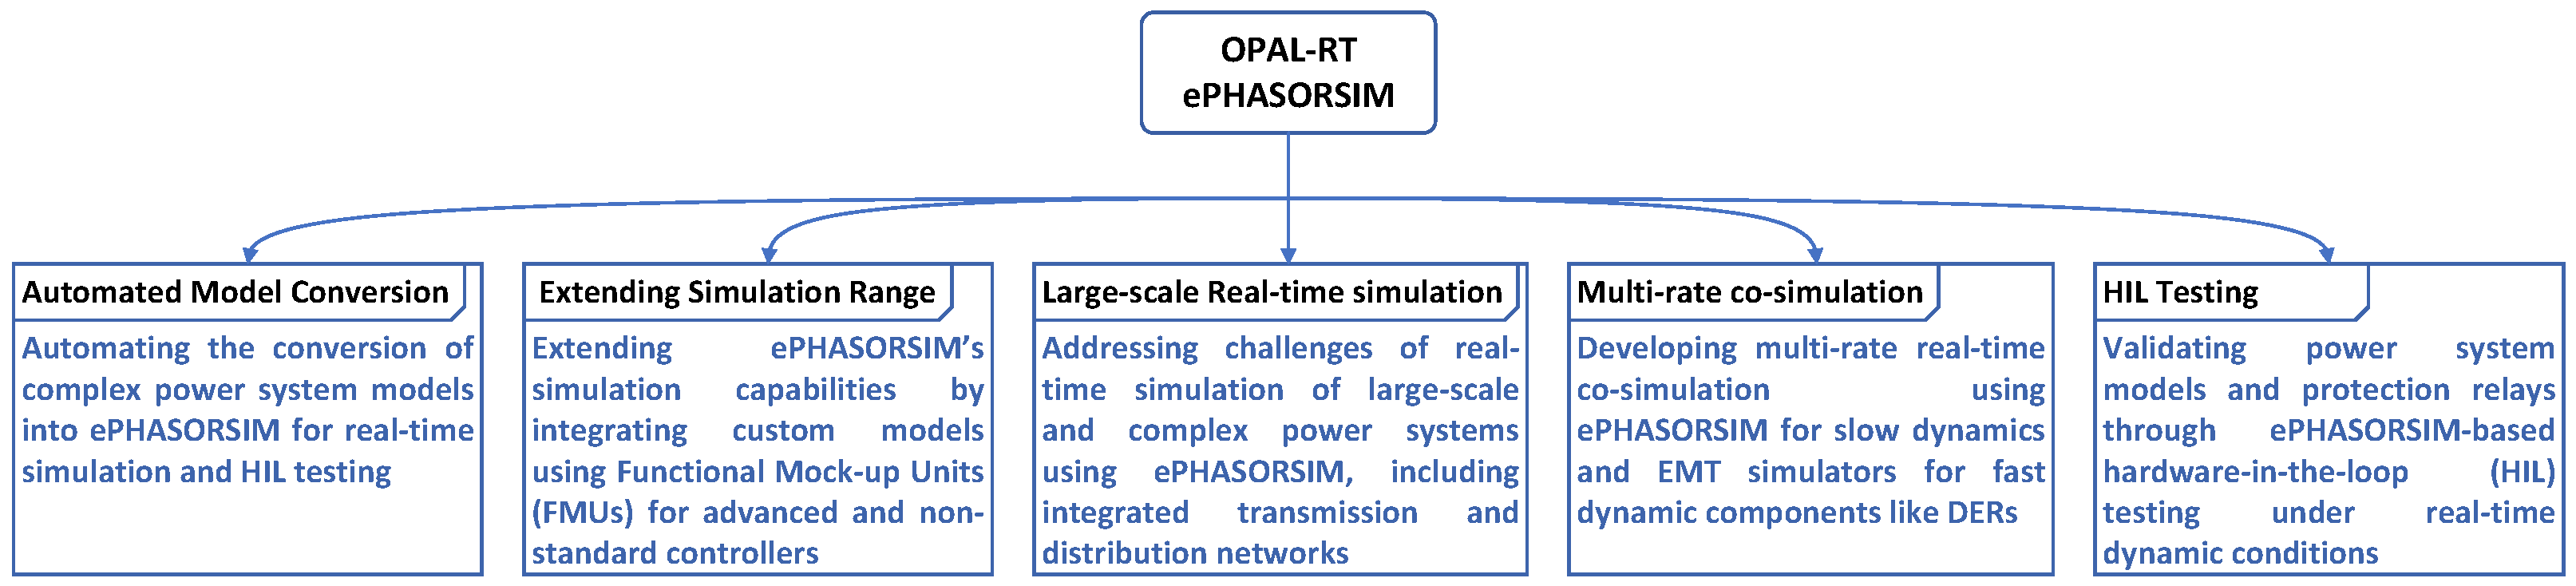
3.1. Automated Model Conversion for Enhanced Integration with ePHASORSIM
3.2. Extending ePHASORSIM’s Simulation Range with Custom Models
3.3. ePHASORSIM-Based RT Simulation
3.4. Hybrid RT Simulation Using ePHASORSIM and EMT Simulators
3.5. ePHASORSIM-Based HIL Testing
3.6. Persistent Challenges
- Limited Support for Non-Standard Components: ePHASORSIM’s built-in library for standard components like generators, governors, AVRs, and PSSs is sufficient for many conventional systems but falls short when more advanced or custom control systems are involved. Although integrating custom models via FMUs has mitigated some issues, the creation, export, and import of these models is still a complex process. More efforts are needed to simplify and improve this process.
- Model Conversion Complexity: While progress has been made in automating model conversions from compatible software environments, non-standard controllers and complex components still present significant challenges. Models with custom controllers, such as those developed using DSL scripts in DIgSILENT PowerFactory, or complex systems like HVDC links, often require manual redefinition, substitution, or simplification—a process that can be both labor-intensive and technically demanding. Moreover, while these simplifications enable real-time simulation, they may compromise the accuracy of the simulations, ultimately limiting seamless integration with ePHASORSIM.
- Limited Data Format Compatibility: Converting models from non-compatible software into ePHASORSIM often requires additional steps to bridge differences in data formats. For example, models from platforms like OpenDSS must be translated into intermediate formats, such as CIM XML, before being processed into ePHASORSIM-compatible spreadsheets using custom scripts. This multi-stage process not only adds complexity but also increases the likelihood of errors during model conversion.
- Time Step Synchronization Challenges: In hybrid multi-rate simulations involving ePHASORSIM and an EMT simulator, temporal synchronization poses a challenge. Specifically, the asynchronous connection between ePHASORSIM and other simulators can lead to delays in data exchange, which affects the overall accuracy of the co-simulation. Reducing the sampling time may alleviate the issue to some extent, but it requires higher computational resources, which may further complicates the simulation setup.
4. PowerFactory Model Conversion to ePHASORSIM
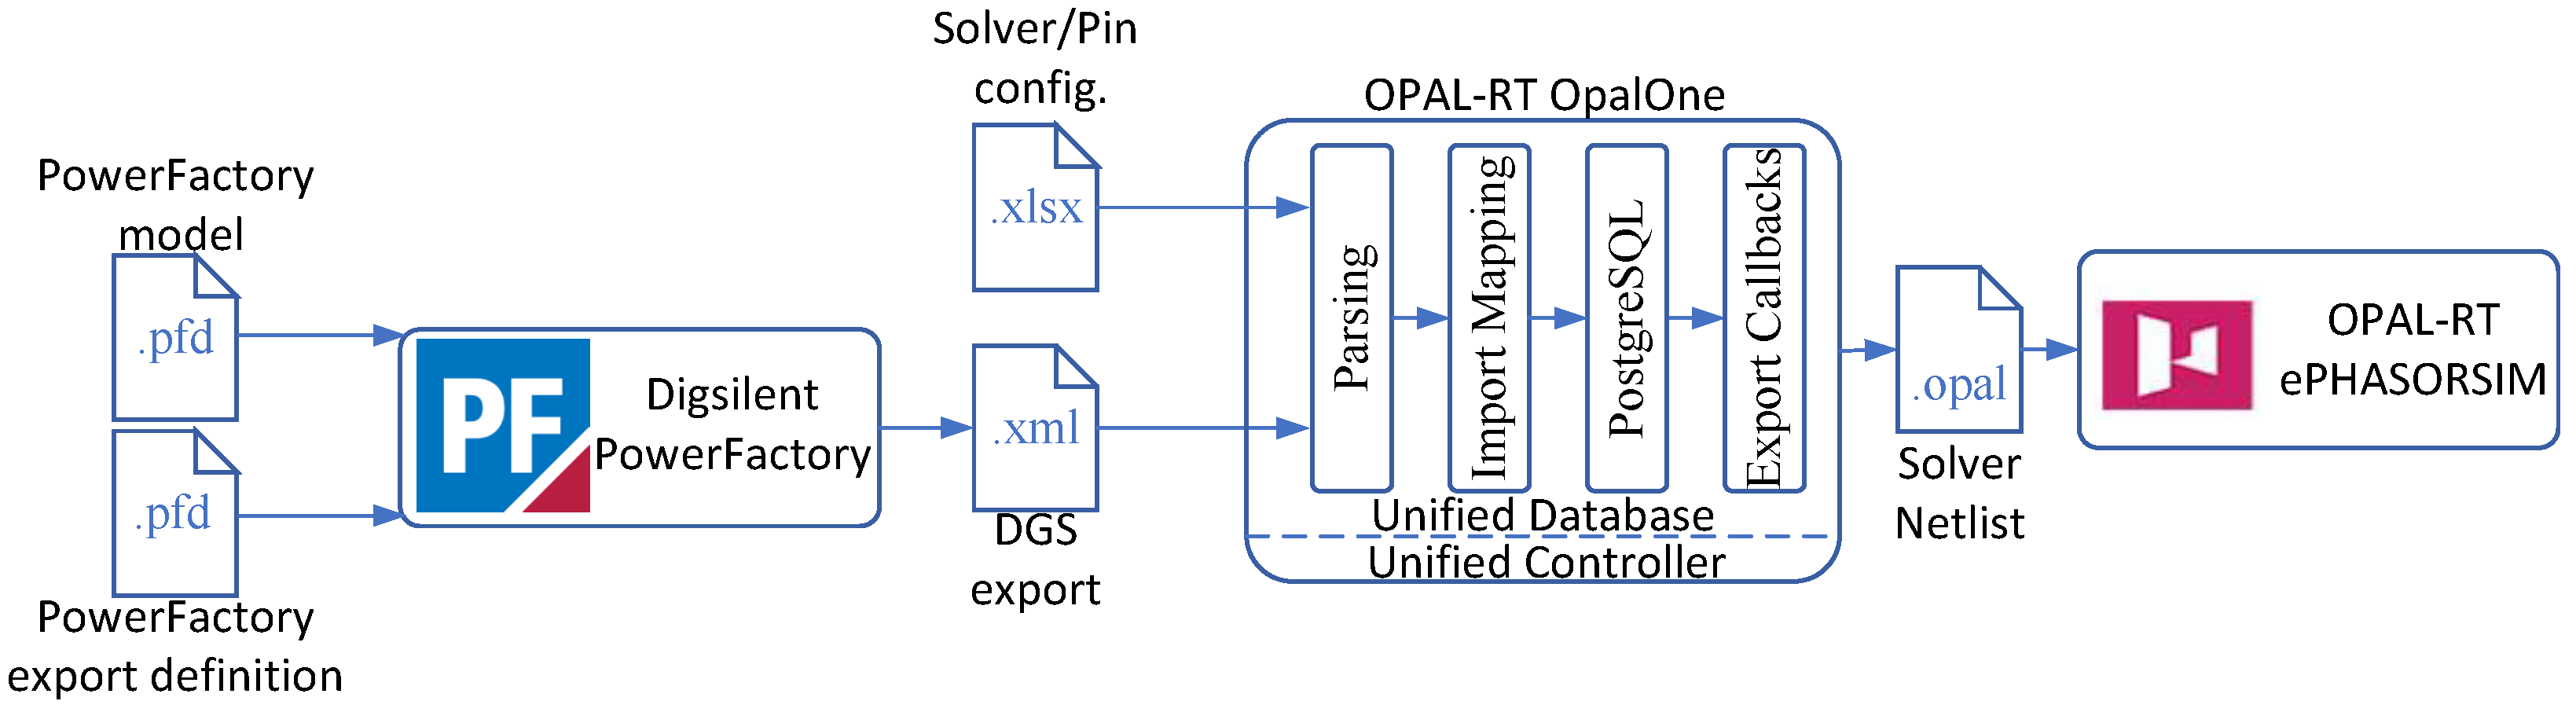
4.1. Automatic Conversion Using Built-In Importing Tools
4.2. Conversion Using Excel Workbook
- System Base and Frequency: Set up the system power base in the General sheet. The frequency can be obtained from the ElmNet sheet.
- Buses: Copy bus names from the ElmTerm sheet. Set initial voltage magnitudes and angles using generator rated voltage where applicable.
- Generators: Map generator connections using the object IDs from ElmSym and StaCubic sheets. Transfer parameters from TypSym, while adjusting for the system power base.
- Loads: Transfer load parameters from ElmLod to the Load sheet. For shunt capacitors/filters, use the ElmShnt sheet.
- Lines: Convert line parameters from ElmLne and TypLne to the Line sheet, while adjusting resistance, reactance, and susceptance to per-unit values.
- Transformers: Transfer transformer parameters from ElmTr2 and TypTr2 while adjusting resistance and reactance for the system power base.
5. Comparative Analysis of EV Charging Management Using ePHASORSIM and PowerFactory
5.1. Background and Context
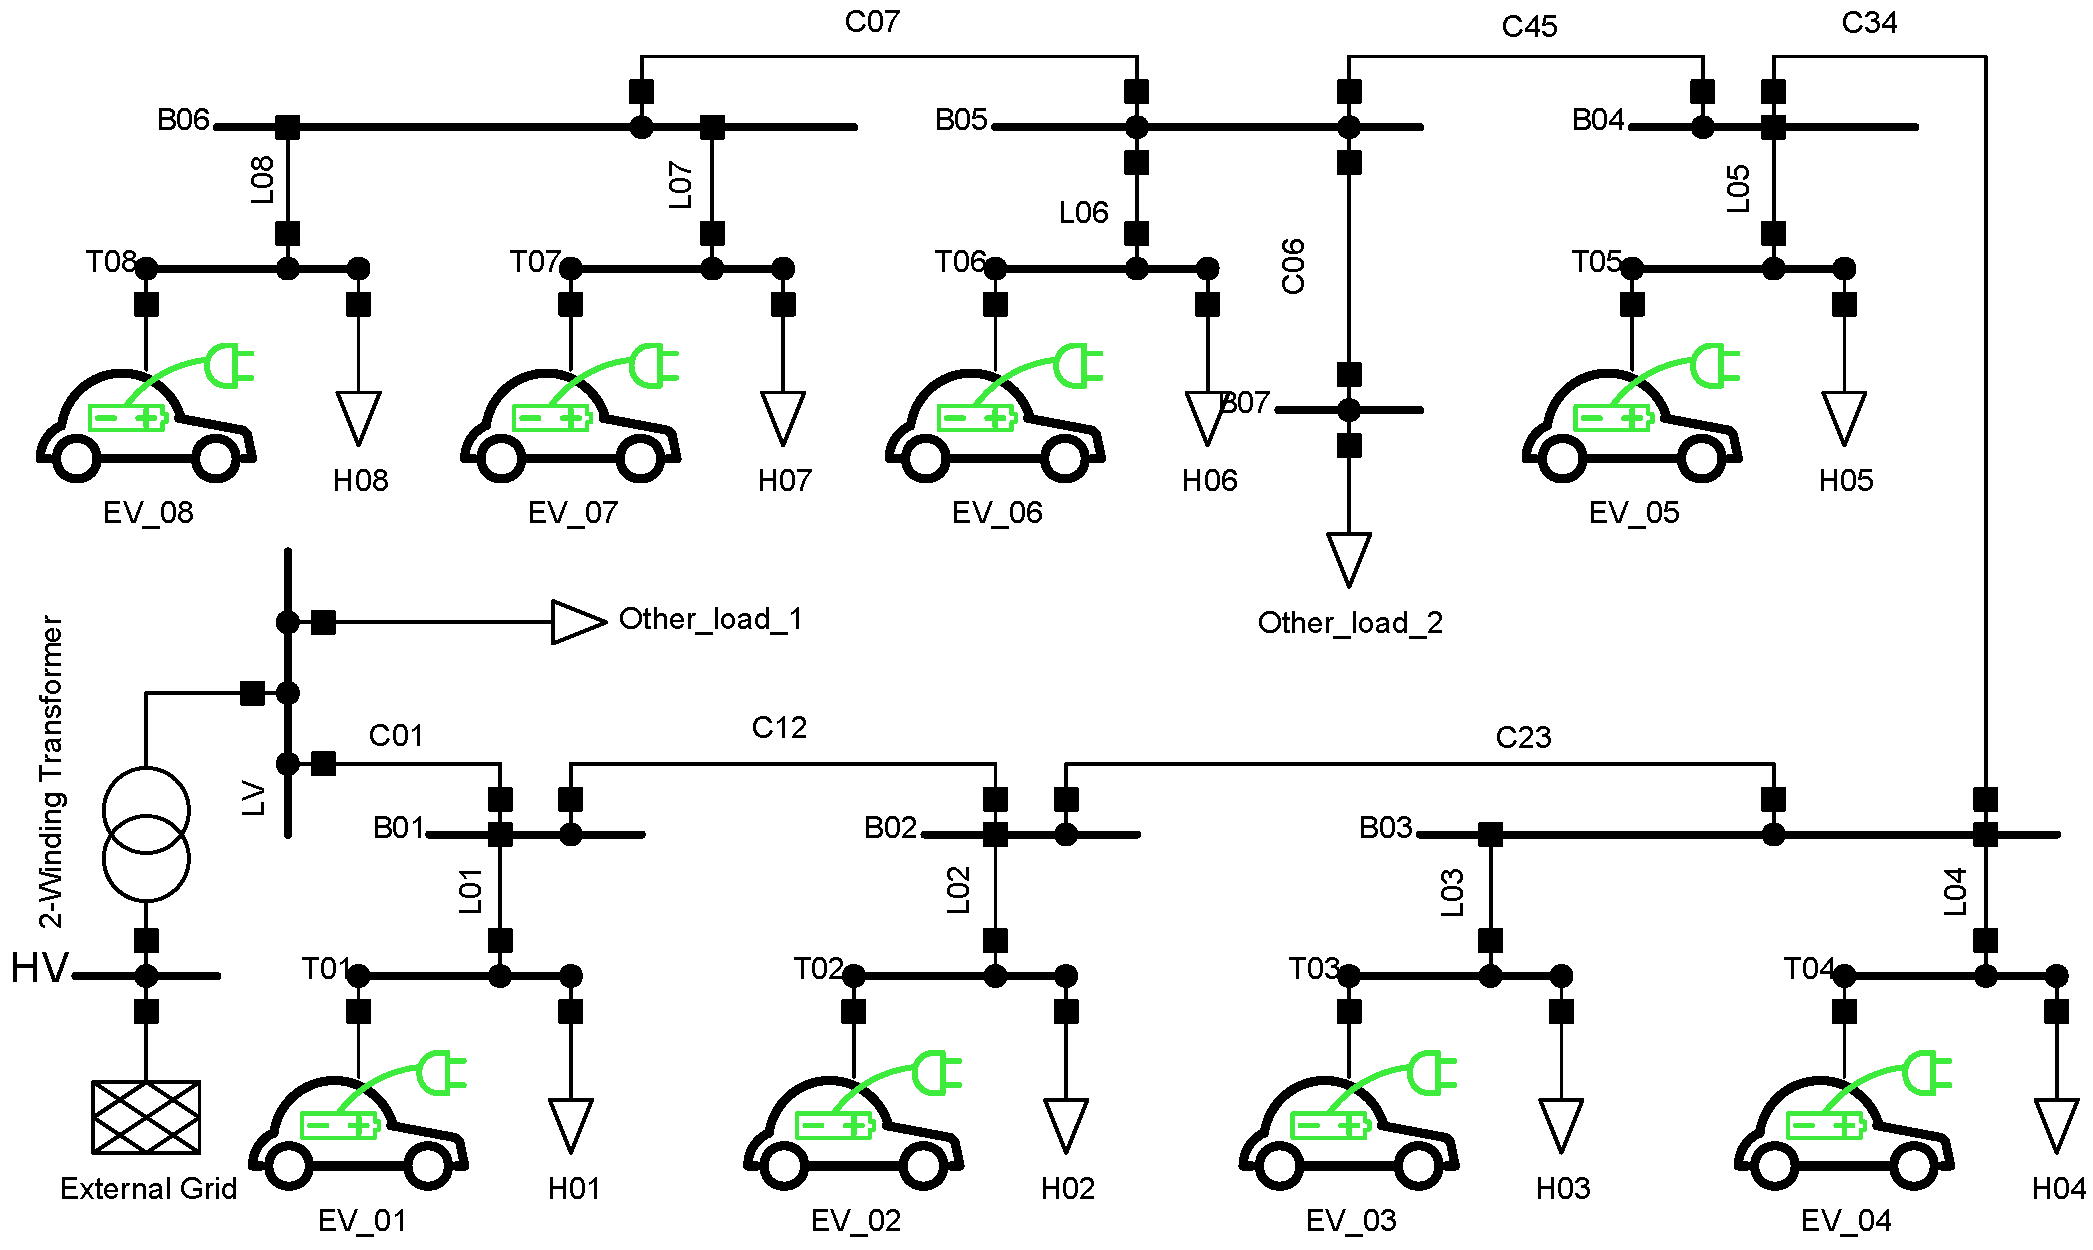
5.2. Test Grid
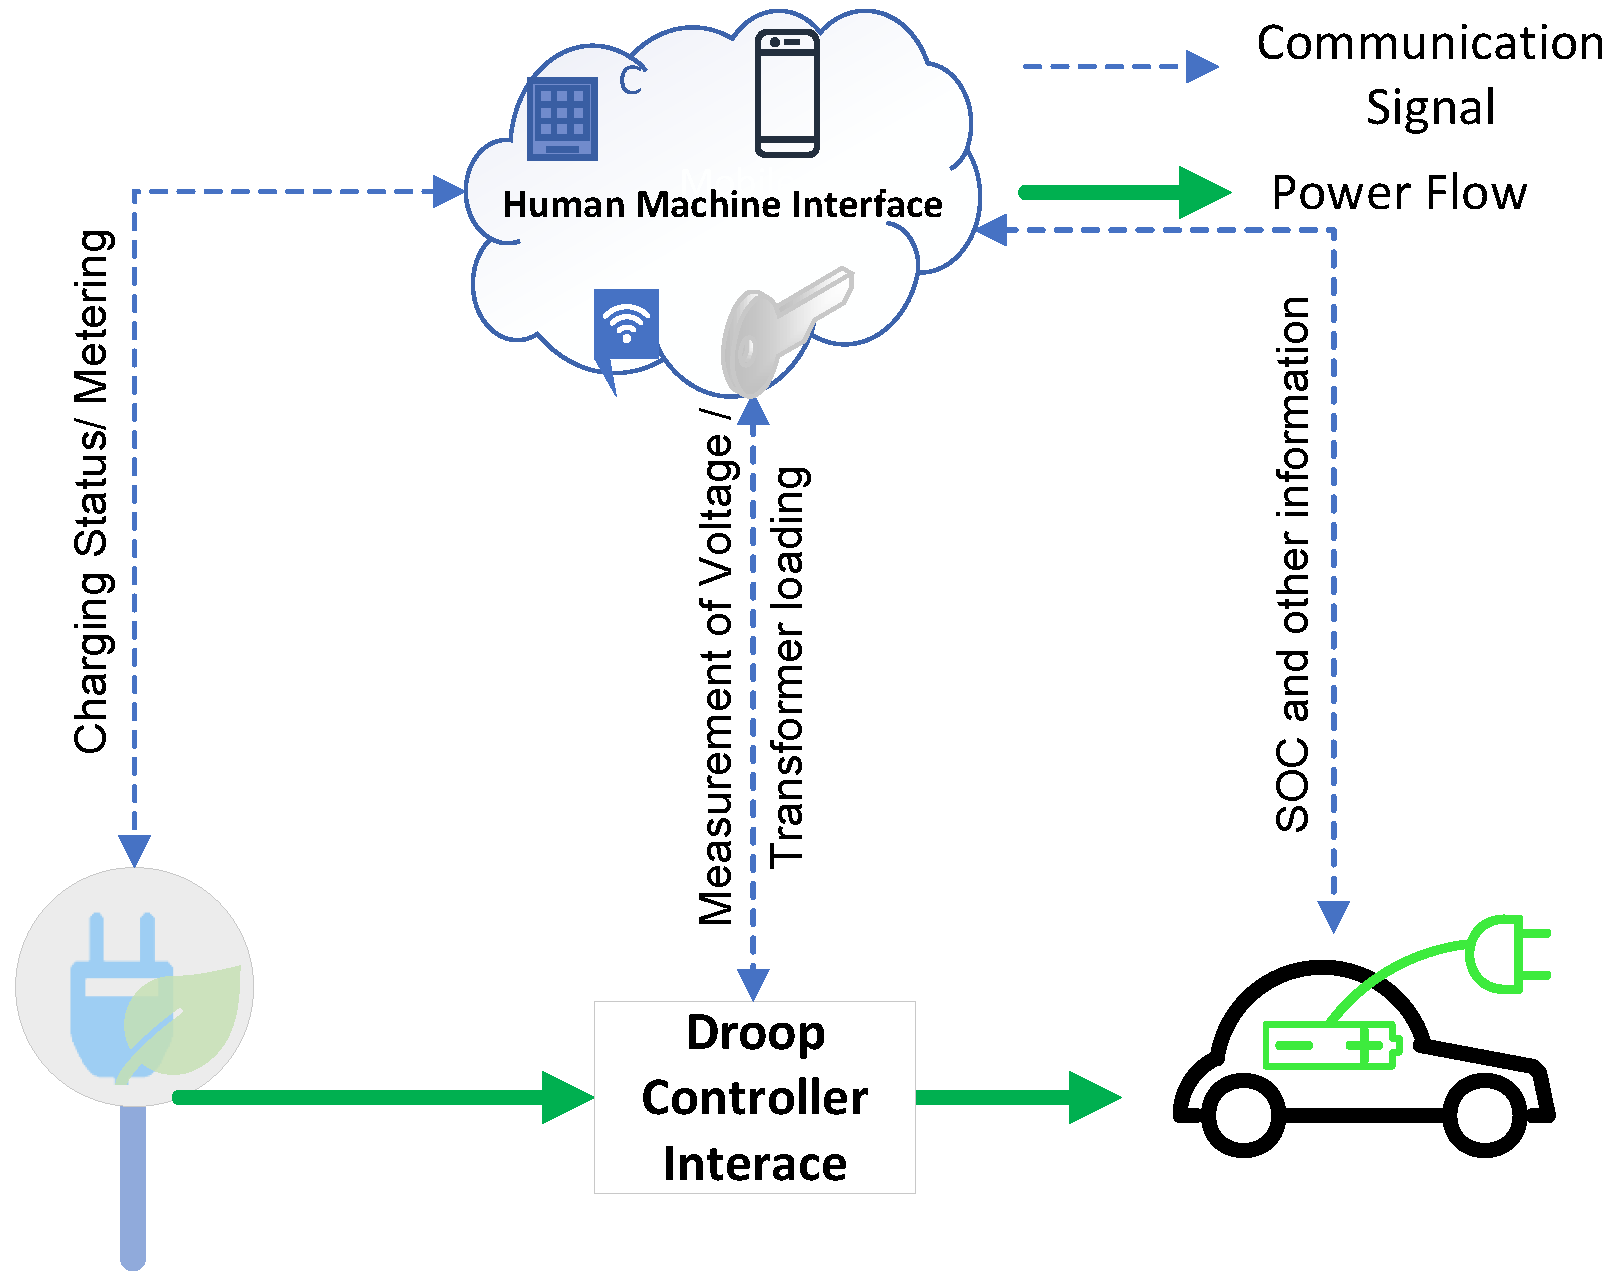
5.3. Control Architecture
5.4. EV Modeling
5.5. Simulation Results from PowerFactory and ePHASORSIM
- EV with No Droop Control: EVs are present but without droop control.
- EV with Droop Control: EVs are present, and droop control is applied.
- The network model in PowerFactory, excluding EVs, their controllers, and local loads, is exported using the DGS, configured to output data in Excel format according to the export definitions specified by OPAL-RT.
- The exported PowerFactory Excel sheets are then converted to OPAL-RT ePHASORSIM-compatible Excel sheets based on the procedure described in Section 4.2. Note that in the “Pins” sheet of the ePHASORSIM-compatible Excel sheets, the charging power of EVs and local loads needs to be defined as incoming information. Meanwhile, the bus voltages, which are used by the EV charging management system to determine the charging power, along with any other states that may need to be monitored, need to be defined as outgoing information.
- Next, the ePHASORSIM’s solver block is incorporated into the Simulink model, where the Excel workbook is referenced to provide the required network data. These data are then processed by the solver, which produces a *.opal file containing all essential network details.
- Two subsystems are then created: the master subsystem (a computation block) and the console subsystem (a communication block), as depicted in Figure 11a. The master subsystem, which includes the ePHASORSIM solver, is responsible for the power system simulation and encompasses all electrical components, EV controllers, and dynamic models. On the other hand, the communication block handles the specification and visualization of necessary variables and signals within the Matlab graphical environment and may also include events and other parameters for controlling the simulation [36]. Note that all signals exchanged between the master and console subsystems pass through the OpComm block, which simulates the behavior of a real-time communication link. Note also that the EV controllers, which are responsible for managing the charging power of the EVs, are modeled within the Simulink environment, based on the original DSL scripts from PowerFactory.
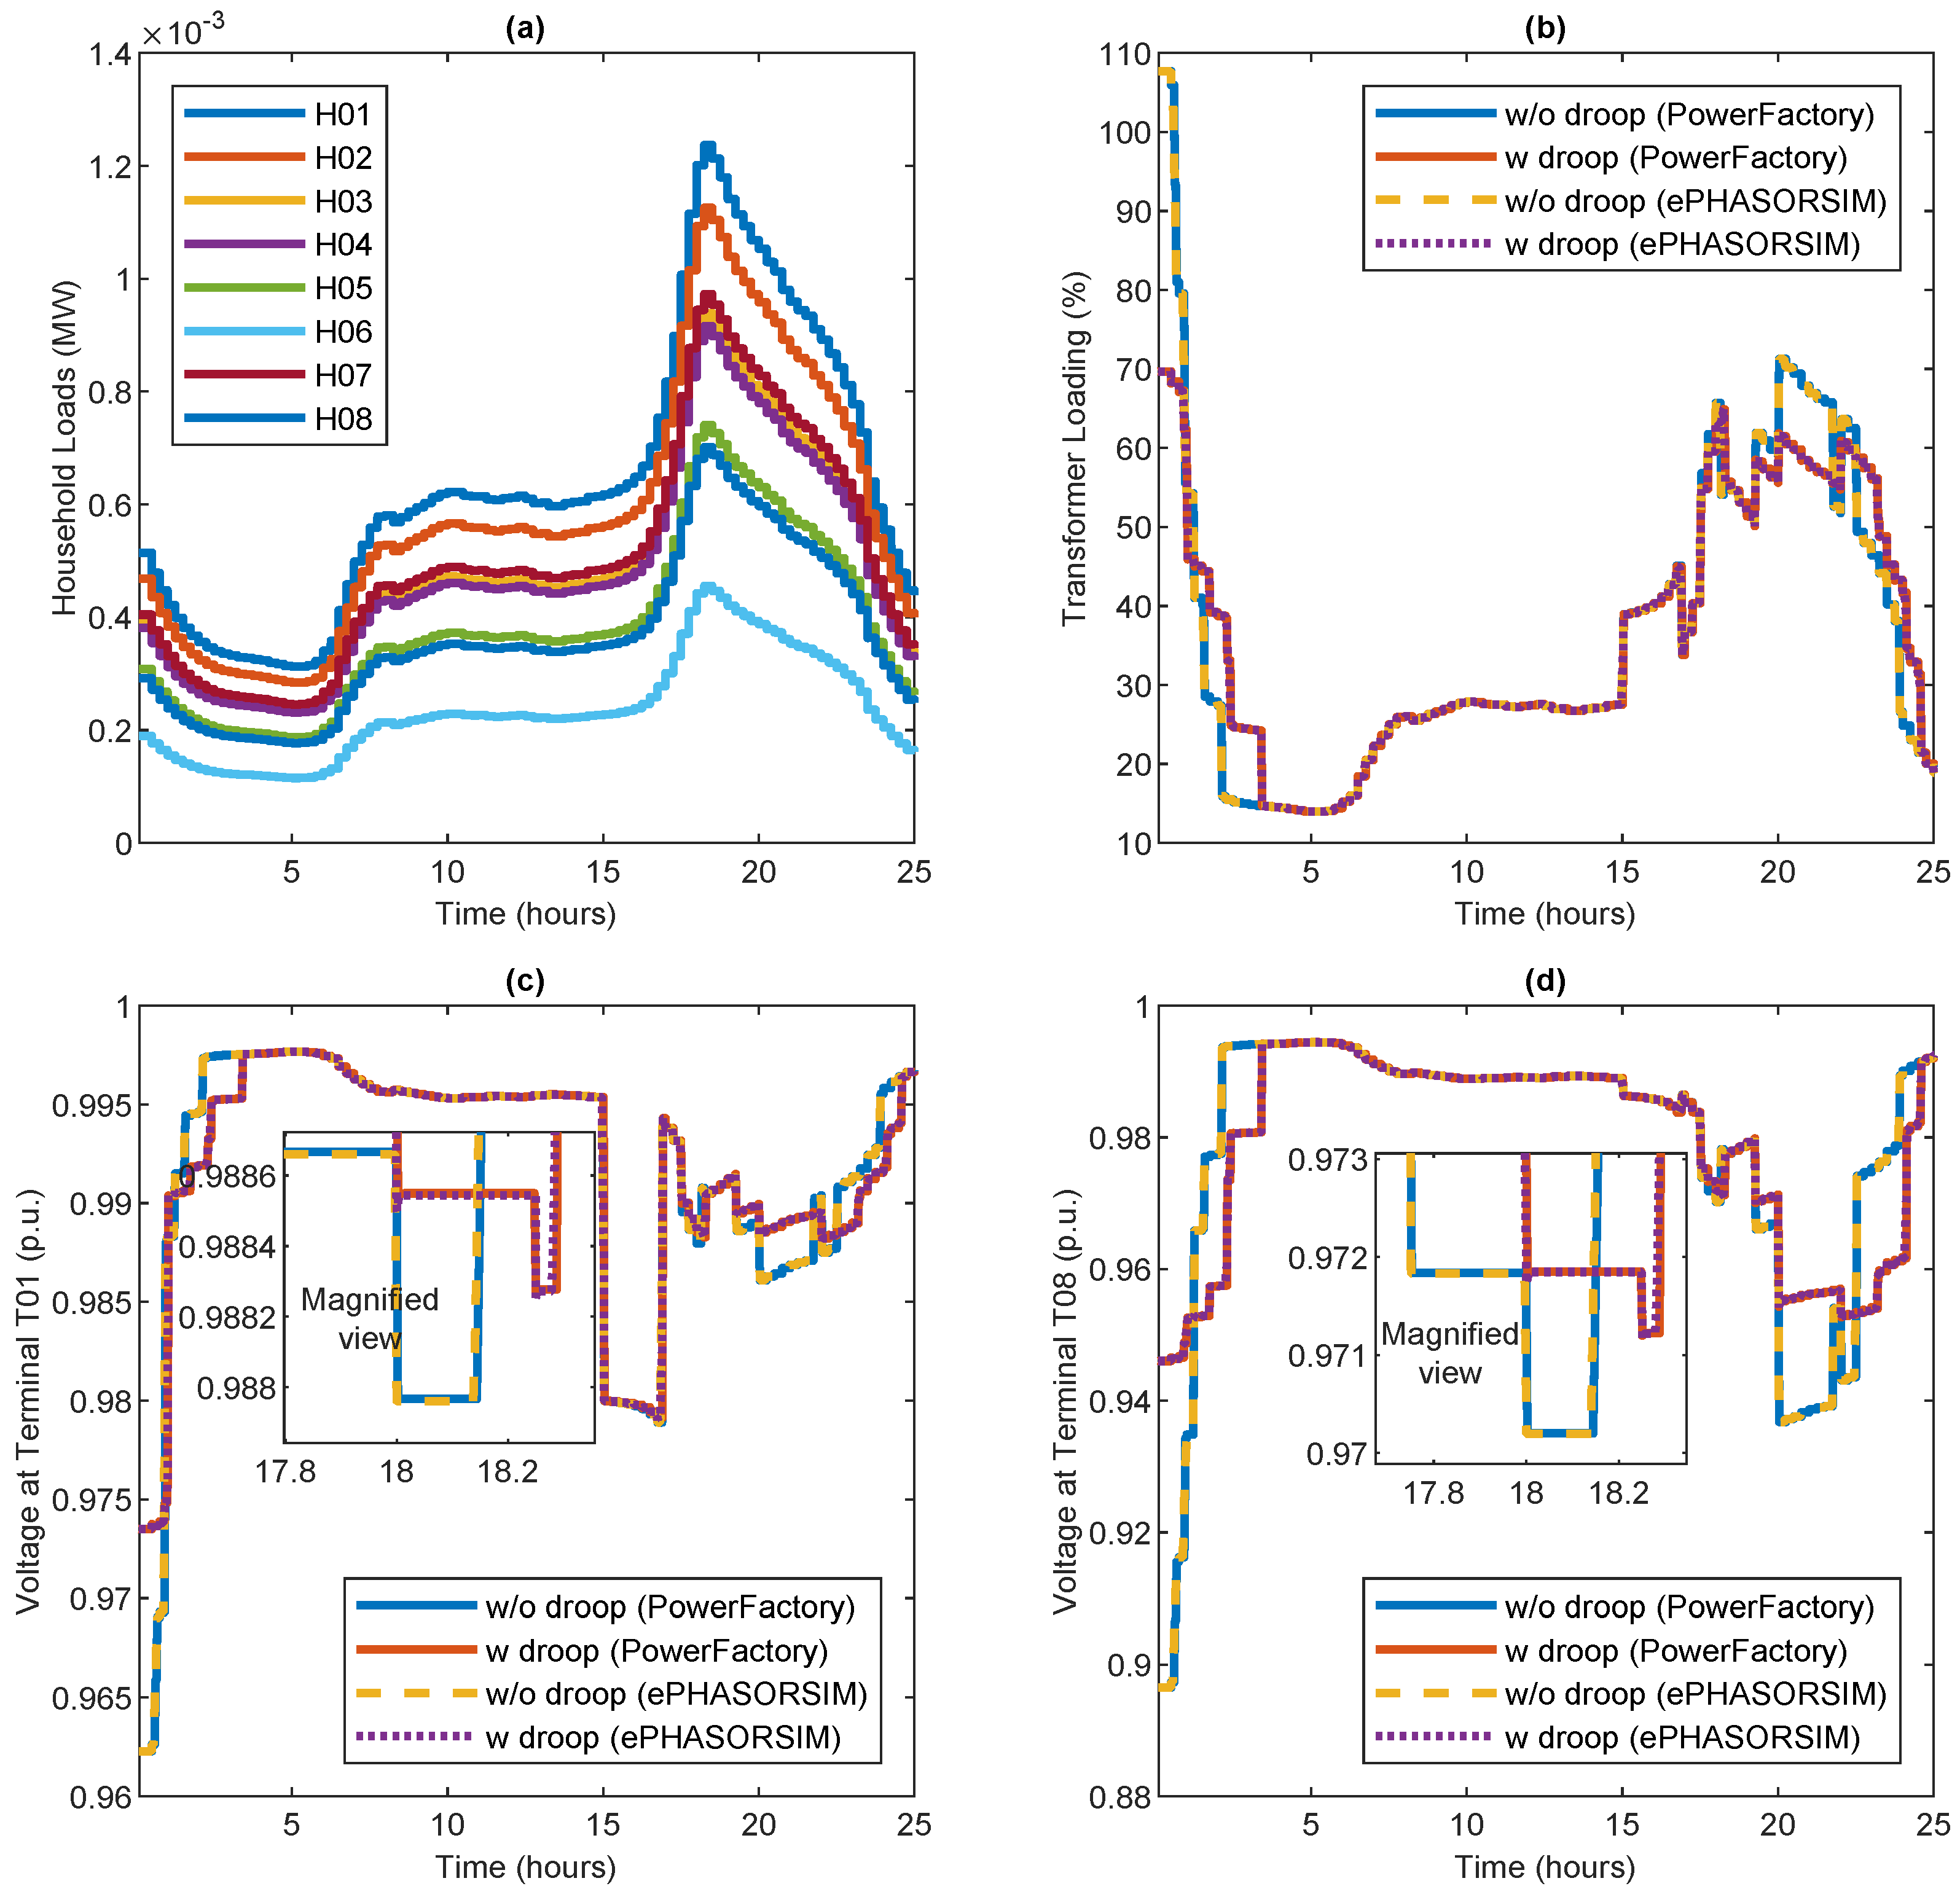
- Transformer Loading: Figure 12b presents the transformer loading for different scenarios. Charging all EVs without droop control results in a transformer loading of 108%. Conversely, implementing voltage droop control for EV charging reduces the maximum transformer loading to 70.5%.
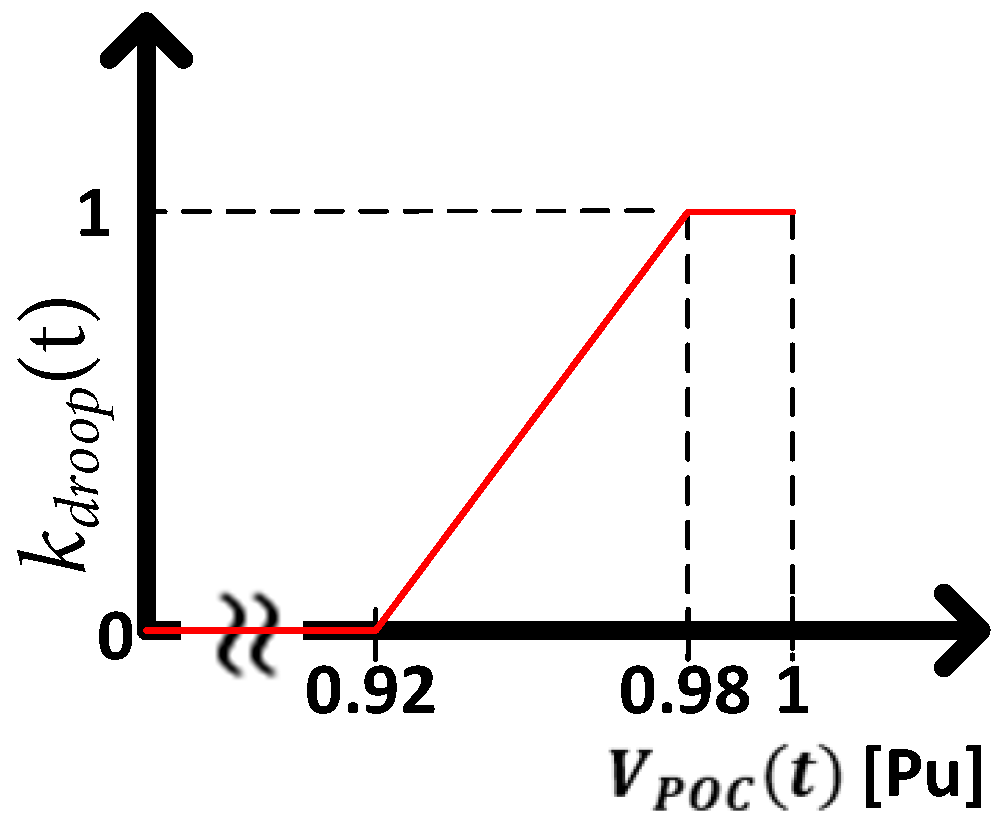
- Voltage Dip: According to Figure 12c, the voltage dip at terminal T01, which is close to the transformer’s secondary, stays above 0.96 pu across all scenarios. In contrast, Figure 12d illustrates a substantial voltage dip down to 0.9 pu at terminal T08, at the far end of the radial feeder, without droop control. The application of voltage droop control significantly improves the voltage at T08 to 0.95 pu. These findings demonstrate that using droop control for EV charging can address overloading and voltage dip challenges in long radial feeders within the distribution grid.
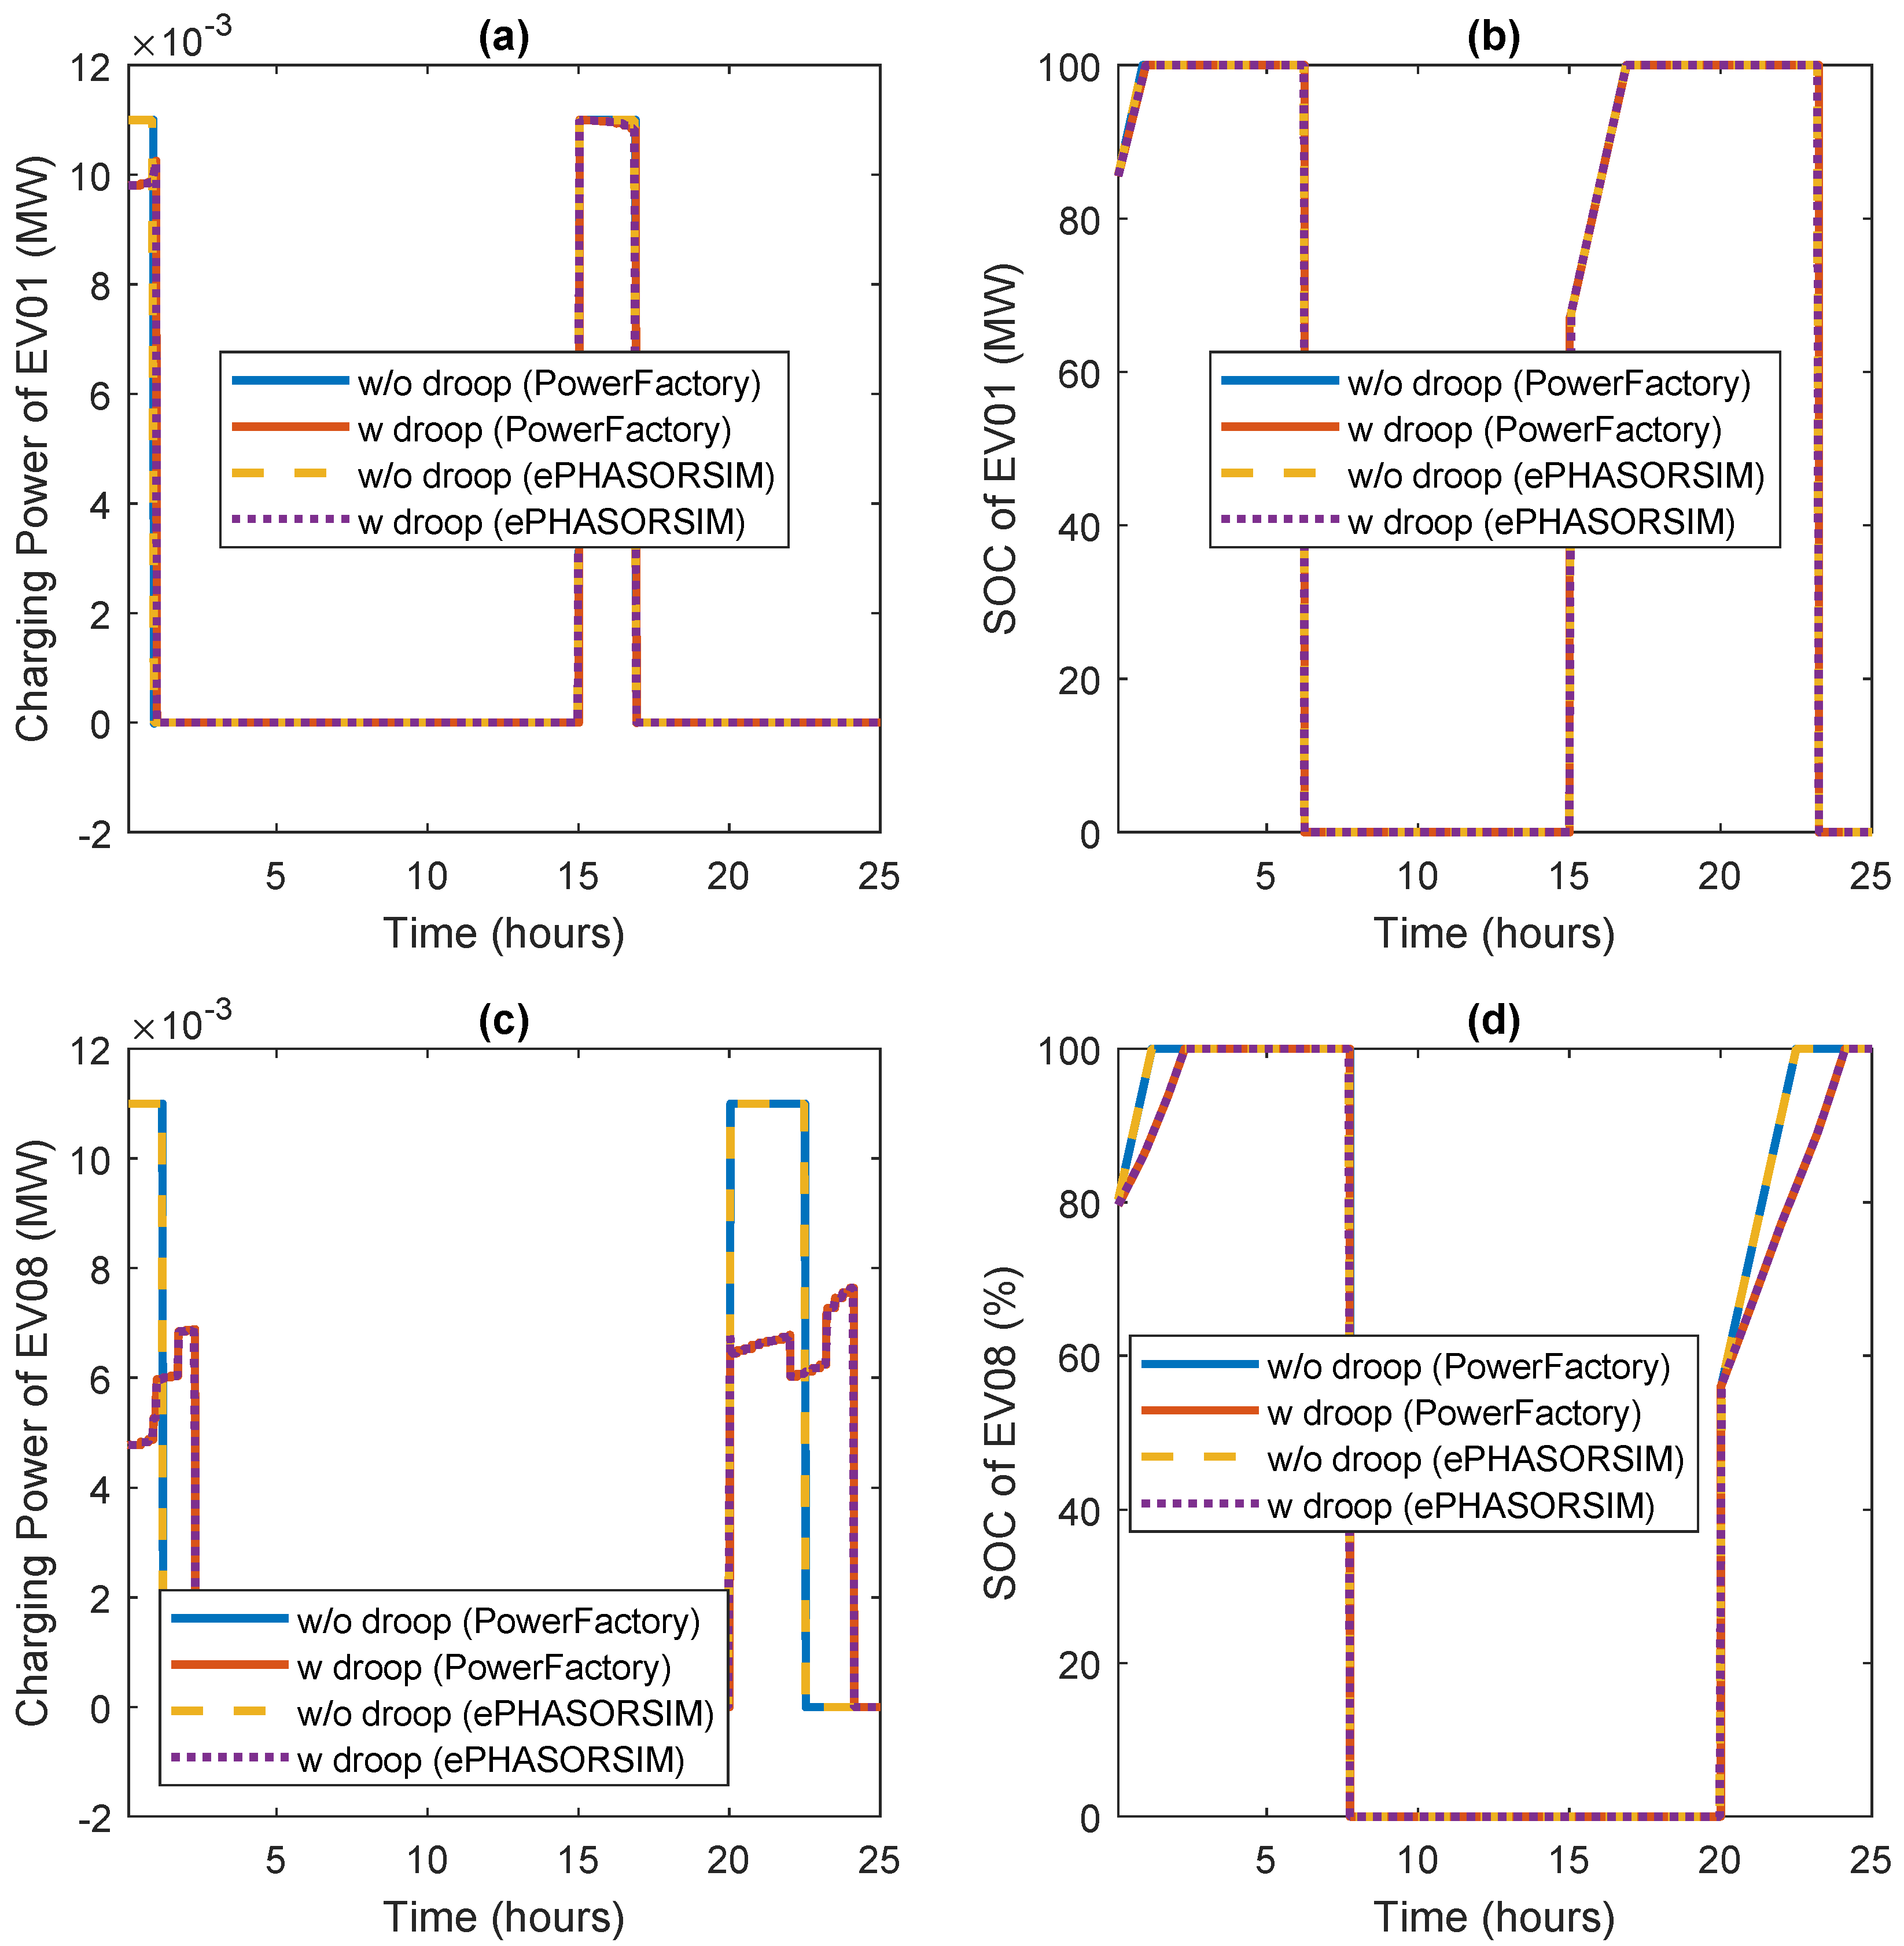
- Charging Power and SOC: According to Figure 13, When no droop control is applied, all EVs charge at the same power level (11 kW), meaning they equally benefit from electricity prices. In contrast, voltage droop control results in EVs at the end of the radial feeder charging at a lower power level (4.8 kW) than those nearer the transformer (9.8 kW). This demonstrates that voltage droop control enhances terminal voltages but is less economically beneficial for distant consumers.
- In all scenarios, the results from PowerFactory and ePHASORSIM are in excellent agreement, which confirms the reliability of using ePHASORSIM. Additionally, ePHASORSIM offers several benefits over PowerFactory, including the ability to perform RT simulations, which is crucial for validating dynamic control strategies in real-world conditions. Moreover, ePHASORSIM’s integration with MATLAB/Simulink for control design provides greater flexibility in developing and testing control algorithms. In contrast, developing control algorithms in PowerFactory using DSL scripts can be complex and time-consuming. Furthermore, ePHASORSIM’s scalability makes it ideal for large-scale simulations involving multiple distributed energy resources and complex grid configurations. OPAL-RT ePHASORSIM can also be used for CHIL testing real EV control devices.
6. Summary and Conclusions
- Tools and processes for automated model conversion from various simulation environments, such as PowerFactory and OpenDSS, to ePHASORSIM. This automation significantly reduces manual effort and enhances the accuracy and efficiency of model integration.
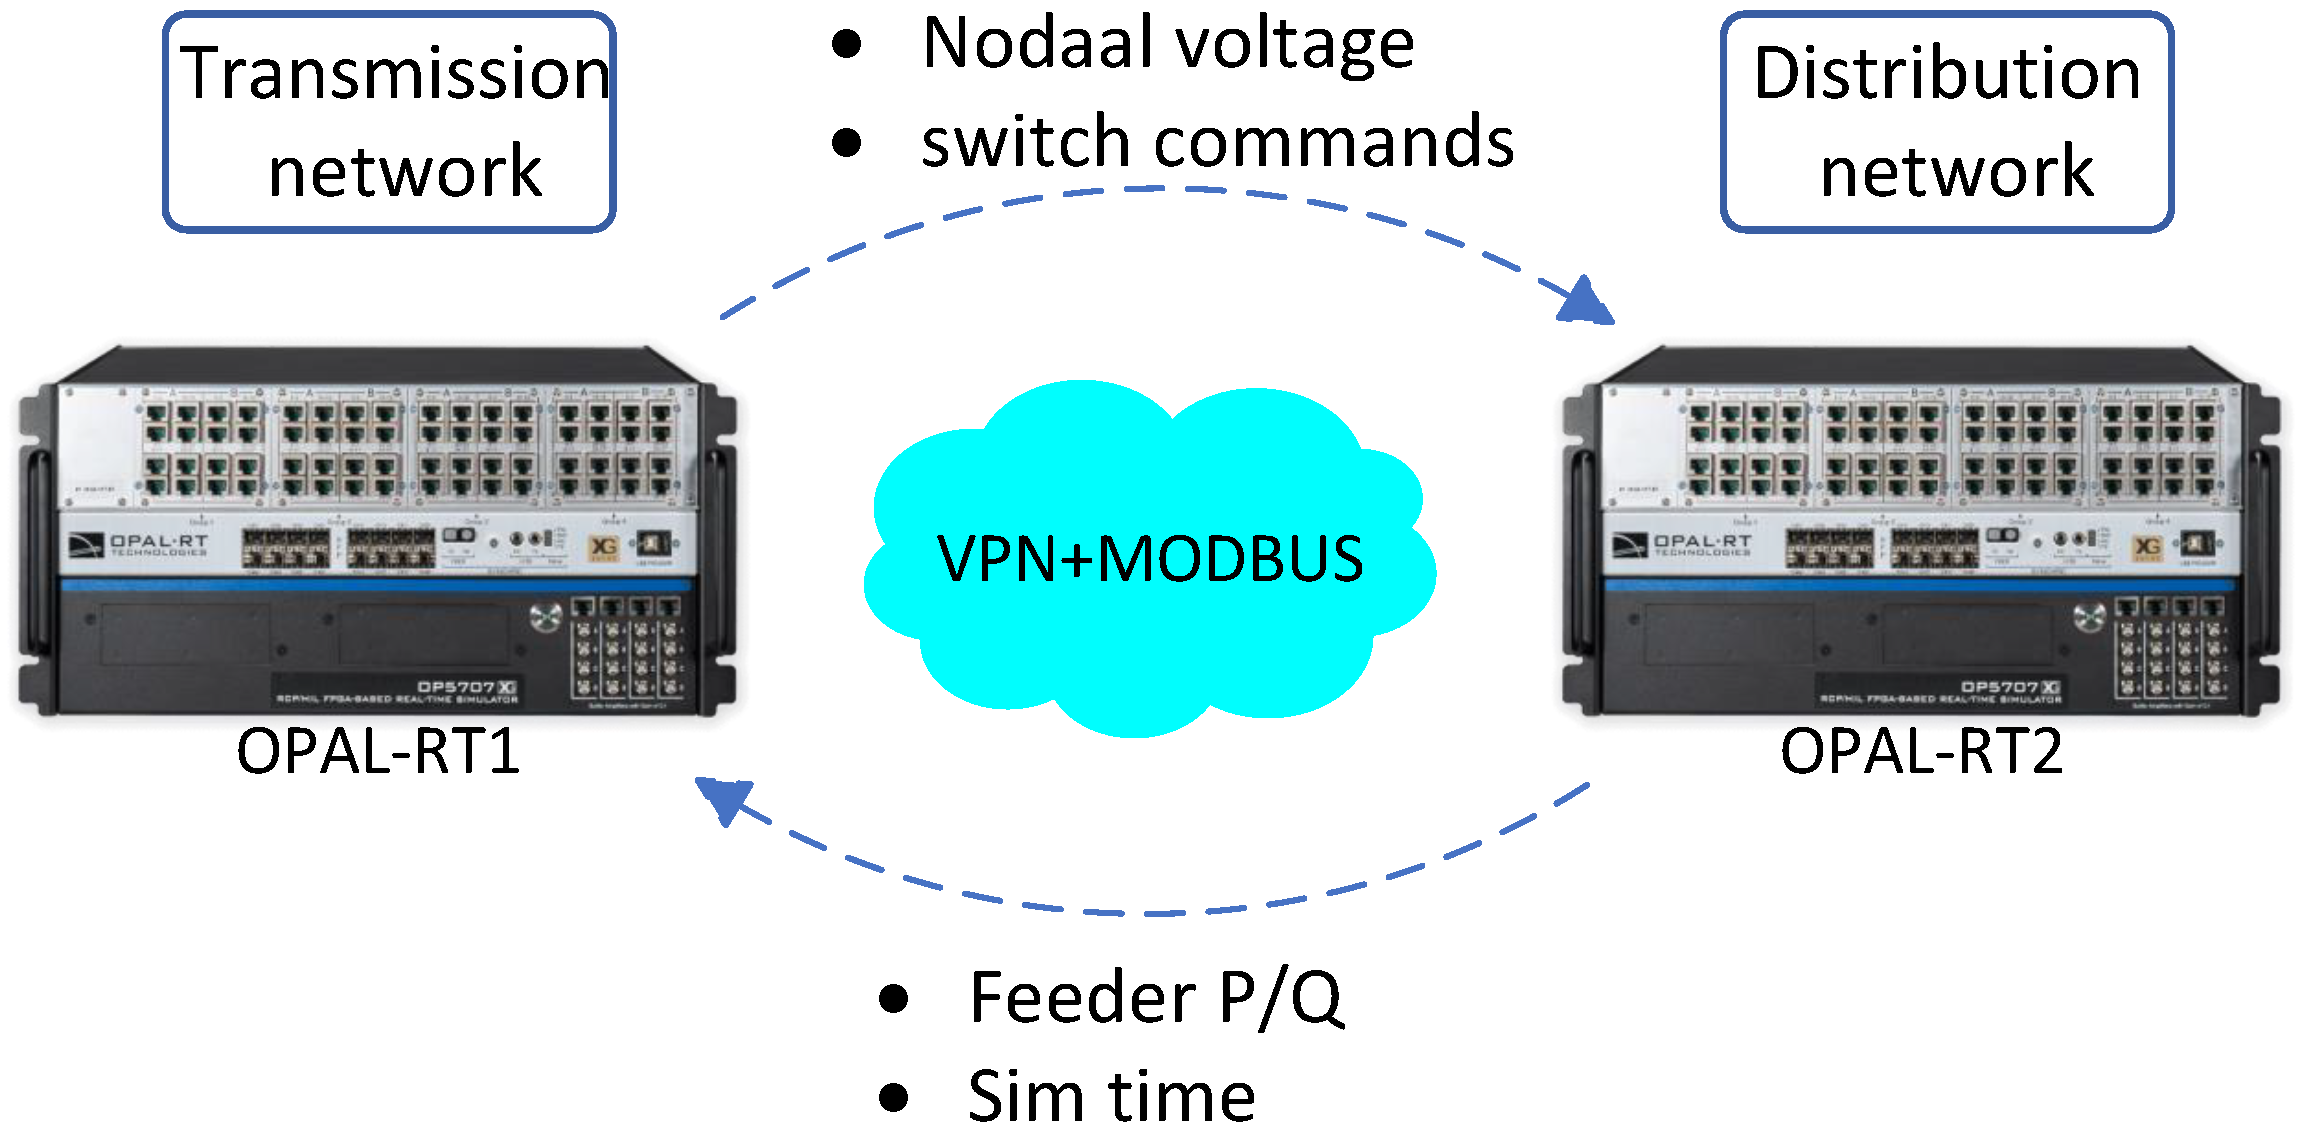
- Methods to combine transmission network models and distribution network models created in different software packages using OPAL-RT’s ePHASORSIM, which enables investigating interactions between them in real-time. However, due to the millisecond-range step time of OPAL-RT’s ePHASORSIM, this approach may not always effectively capture the fast dynamics of DERs in distribution networks.
- Development of methods for multi-rate RT co-simulation using ePHASORSIM and EMT simulators like eMEGASIM or Simscape Power Systems, which enables the simultaneous simulation of multiple interconnected systems operating at different time steps. These scenarios often involve utilizing ePHASORSIM to handle phasor-domain simulations of the transmission and/or distribution grid with time steps on the order of milliseconds, while an EMT simulator accurately models the fast dynamics of inverter-based DERs, other power electronics devices, or microgrids with time steps in the microsecond range.
- Techniques for ePHASORSIM-based HIL testing, where networks are implemented in the phasor domain using ePHASORSIM, and specific signals such as voltage and current waveforms at specific nodes are amplified and used to interface with physical devices like relays or power converters. This approach allows for the RT evaluation of the device under test performance under simulated operational conditions, ensuring that these components respond accurately to various grid disturbances and dynamic scenarios. Several notable examples were highlighted in the paper, including the simulation of the Great Britain transmission system, focusing on validating LoM protection relays using PMU data to simulate fast frequency phenomena; the Colombia-Ecuador interconnection, concentrating on a PMU-based SPS to handle scenarios like generation loss and overloads; and the Nordic power system, examining the virtual inertia provided by an HVDC converter terminal and its impact on frequency dynamics.
Author Contributions
Funding
Conflicts of Interest
References
- Rehtanz, C.; Guillaud, X. Real-time and co-simulations for the development of power system monitoring, control and protection. In Proceedings of the 2016 Power Systems Computation Conference (PSCC), Genoa, Italy, 20–24 June 2016; pp. 1–20. [Google Scholar]
- MathWorks. Getting Started with Simulink. MathWorks 2024. Available online: https://www.mathworks.com/products/simulink/getting-started.html (accessed on 26 September 2024).
- Siemens. PSS®E—High-Performance Transmission Planning and Analysis Software. Siemens 2024. Available online: https://www.siemens.com/global/en/products/energy/grid-software/planning/pss-software/pss-e.html (accessed on 26 September 2024).
- DIgSILENT. DIgSILENT PowerFactory—Power System Analysis Software. DIgSILENT 2024. Available online: https://www.digsilent.de/en/ (accessed on 26 September 2024).
- Parizad, A.; Mohamadian, S.; Iranian, M.E.; Guerrero, J.M. Power system real-time emulation: A practical virtual instrumentation to complete electric power system modeling. IEEE Trans. Ind. Inform. 2018, 15, 889–900. [Google Scholar] [CrossRef]
- Faruque, M.O.; Strasser, T.; Lauss, G.; Jalili-Marandi, V.; Forsyth, P.; Dufour, C.; Dinavahi, V.; Monti, A.; Kotsampopoulos, P.; Martinez, J.A.; et al. Real-time simulation technologies for power systems design, testing, and analysis. IEEE Power Energy Technol. Syst. J. 2015, 2, 63–73. [Google Scholar] [CrossRef]
- Ibarra, L.; Rosales, A.; Ponce, P.; Molina, A.; Ayyanar, R. Overview of real-time simulation as a supporting effort to smart-grid attainment. Energies 2017, 10, 817. [Google Scholar] [CrossRef]
- Sidwall, K.; Forsyth, P. Advancements in real-time simulation for the validation of grid modernization technologies. Energies 2020, 13, 4036. [Google Scholar] [CrossRef]
- Sidwall, K.; Forsyth, P. A review of recent best practices in the development of real-time power system simulators from a simulator manufacturer’s perspective. Energies 2022, 15, 1111. [Google Scholar] [CrossRef]
- Kłosowski, Z.; Cieślik, S. The Use of a Real-Time Simulator for Analysis of Power Grid Operation States with a Wind Turbine. Energies 2021, 14, 2327. [Google Scholar] [CrossRef]
- Yang, G.; Li, Y.; Hao, Z.; Chen, Z.; He, P.; Zhang, J. Multi-Rate Parallel Real-Time Simulation Method for Doubly Fed Wind Power Systems Based on FPGA–CPU. Machines 2022, 10, 1073. [Google Scholar] [CrossRef]
- Yao, R.; Chen, Q.; Bai, H.; Liu, C.; Liu, T.; Luo, Y.; Yang, W. A Multi-Rate Simulation Strategy Based on the Modified Time-Domain Simulation Method and Multi-Area Data Exchange Method of Power Systems. Electronics 2024, 13, 884. [Google Scholar] [CrossRef]
- Yu, D.; Zhou, N.; Luo, Y.; Dong, L.; Jia, Z. Research on the Cross-Platform Co-Simulation Strategy of Power Systems Based on the Model-Segmentation Algorithm. Electronics 2021, 10, 3185. [Google Scholar] [CrossRef]
- Zhu, J.; Zhang, B. Multi-rate real-time simulation method based on the norton equivalent. Energies 2020, 13, 4562. [Google Scholar] [CrossRef]
- da Silva, L.T.F.; Tomim, M.A.; Barbosa, P.G.; de Almeida, P.M.; da Silva Dias, R.F. Modeling and Simulating Wind Energy Generation Systems by Means of Co-Simulation Techniques. Energies 2023, 16, 7013. [Google Scholar] [CrossRef]
- Dagbagi, M.; Hemdani, A.; Idkhajine, L.; Naouar, M.W.; Monmasson, E.; Slama-Belkhodja, I. ADC-based embedded real-time simulator of a power converter implemented in a low-cost FPGA: Application to a fault-tolerant control of a grid-connected voltage-source rectifier. IEEE Trans. Ind. Electron. 2015, 63, 1179–1190. [Google Scholar] [CrossRef]
- Wang, W.; Shen, Z.; Dinavahi, V. Physics-based device-level power electronic circuit hardware emulation on FPGA. IEEE Trans. Ind. Inform. 2014, 10, 2166–2179. [Google Scholar] [CrossRef]
- Chiumeo, R.; Raggini, D.; Veroni, A.; Clerici, A. Comparative Analysis of PI and ADRC Control through CHIL Real Time Simulations of a DC-DC DAB into a Multi-Terminal MVDC/LVDC Distribution Network. Energies 2022, 15, 7631. [Google Scholar] [CrossRef]
- Soomro, J.B.; Chachar, F.A.; Munir, H.M.; Ahmed Ansari, J.; Zalhaf, A.S.; Alqarni, M.; Alamri, B. Efficient hardware-in-the-loop and digital control techniques for power electronics teaching. Sustainability 2022, 14, 3504. [Google Scholar] [CrossRef]
- Mihalič, F.; Truntič, M.; Hren, A. Hardware-in-the-loop simulations: A historical overview of engineering challenges. Electronics 2022, 11, 2462. [Google Scholar] [CrossRef]
- von Jouanne, A.; Agamloh, E.; Yokochi, A. Power hardware-in-the-loop (PHIL): A review to advance smart inverter-based grid-edge solutions. Energies 2023, 16, 916. [Google Scholar] [CrossRef]
- García-Martínez, E.; Sanz, J.F.; Muñoz-Cruzado, J.; Perié, J.M. A review of PHIL testing for smart grids—Selection guide, classification and online database analysis. Electronics 2020, 9, 382. [Google Scholar] [CrossRef]
- Ihrens, J.; Möws, S.; Wilkening, L.; Kern, T.A.; Becker, C. The impact of time delays for power hardware-in-the-loop investigations. Energies 2021, 14, 3154. [Google Scholar] [CrossRef]
- Brandl, R. Operational range of several interface algorithms for different power hardware-in-the-loop setups. Energies 2017, 10, 1946. [Google Scholar] [CrossRef]
- Wang, X.; Mathur, R. Real-time digital simulator of the electromagnetic transients of transmission lines with frequency dependence. IEEE Trans. Power Deliv. 1989, 4, 2249–2255. [Google Scholar] [CrossRef]
- Foley, M.; Chen, Y.; Bose, A. A real time power system simulation laboratory environment. IEEE Trans. Power Syst. 1990, 5, 1400–1406. [Google Scholar] [CrossRef]
- Taoka, H.; Iyoda, I.; Noguchi, H.; Sato, N.; Nakazawa, T. Real-time digital simulator for power system analysis on a hypercube computer. IEEE Trans. Power Syst. 1992, 7, 1–10. [Google Scholar] [CrossRef]
- RTDS Technology Inc. Real-Time Simulation; RTDS Technology Inc.: Winnipeg, MB, Canada, 2024. [Google Scholar]
- Devaux, O.; Levacher, L.; Huet, O. An advanced and powerful real-time digital transient network analyser. IEEE Trans. Power Deliv. 1998, 13, 421–426. [Google Scholar] [CrossRef]
- Etxeberria-Otadui, I.; Manzo, V.; Bacha, S.; Baltes, F. Generalized average modelling of FACTS for real time simulation in ARENE. In Proceedings of the IEEE 2002 28th Annual Conference of the Industrial Electronics Society, IECON 02, Sevilla, Spain, 5–8 November 2002; Volume 2, pp. 864–869. [Google Scholar]
- Mohanty, A.; Viswavandya, M.; Ray, P.K.; Mohanty, S. Literature survey on OPAL-RT Technologies with Advance features and Industrial applications. In Proceedings of the 2018 1st International Conference on Advanced Research in Engineering Sciences (ARES), Dubai, United Arab Emirates, 15 June 2018; pp. 1–5. [Google Scholar]
- Gómez-Luna, E.; Palacios-Bocanegra, L.; Candelo-Becerra, J.E. Real-time Simulation with OPAL-RT Technologies and Applications for Control and Protection Schemes in Electrical Networks. J. Eng. Sci. Technol. Rev. 2019, 12, 136–144. [Google Scholar]
- dSPACE GmbH. dSPACE Product Manual; dSPACE GmbH: Paderborn, Germany, 2024. [Google Scholar]
- OPAL-RT Technologies. ePHASORSIM—Real-Time Simulator for Phasor Domain. OPAL-RT Technologies 2024. Available online: https://www.opal-rt.com/systems-ephasorsim/ (accessed on 26 September 2024).
- Imris, P.; Bradley, M.; Taylor, G.; Li, Y. Development of a great britain transmission system reduced model for hardware-in-the-loop studies. In Proceedings of the 2020 55th International Universities Power Engineering Conference (UPEC), Virtual Conference, 1–4 September 2020; pp. 1–6. [Google Scholar]
- Imris, P.; Taylor, G.A.; Bradley, M.E.; Li, Y. A Novel Hardware-in-the-Loop Approach to Investigate the Impact of Low System Inertia on RoCoF Relay Settings. Energies 2022, 15, 6386. [Google Scholar] [CrossRef]
- Chamana, M.; Prabakar, K.; Palmintier, B.; Baggu, M.M. Conversion and validation of distribution system model from a QSTS-based tool to a real-time dynamic phasor simulator. In Proceedings of the 2017 Ninth Annual IEEE Green Technologies Conference (GreenTech), Denver, CO, USA, 29–31 March 2017; pp. 219–225. [Google Scholar]
- Sondharangalla, M.; Korada, N.; Ayyanar, R. Challenges and Solutions for Real-Time Phasor Modeling of Large-scale Distribution Network with High PV Penetration. In Proceedings of the 2021 IEEE 48th Photovoltaic Specialists Conference (PVSC), Fort Lauderdale, FL, USA, 20–25 June 2021; pp. 0630–0636. [Google Scholar]
- Maharjan, M.; Poudel, S.; Mix, S.R.; McDermott, T.E. Cybersecurity Assessment in DER-rich Distribution Operations: Criticality Levels and Impact Analysis. In Proceedings of the 2024 IEEE Power & Energy Society Innovative Smart Grid Technologies Conference (ISGT), Bengaluru, India, 10–13 November 2024; pp. 1–5. [Google Scholar]
- Valles, J.M.; Gonzalez-Longatt, F.; Angeles-Camacho, C.; Rueda, J.L.; Riquelme-Dominguez, J.M. A Simple Validation of ePHASORSIM’s User-Defined Model of a Virtual Synchronous Machine Suitable for Real-time Simulations. In Proceedings of the 2023 IEEE 41st Central America and Panama Convention (CONCAPAN XLI), Tegucigalpa, Honduras, 8–10 November 2023; pp. 1–5. [Google Scholar]
- Valles, J.M.; Angeles-Camacho, C.; Gonzalez-Longatt, F. Modelica Implementation and Validation of Virtual Synchronous Machine Control for a VSC in ePHASORSIM. In Proceedings of the 2023 IEEE Power &Energy Society General Meeting (PESGM), Orlando, FL, USA, 16–20 July 2023; pp. 1–5. [Google Scholar]
- Wang, S.; Tomsovic, K. A novel active power control framework for wind turbine generators to improve frequency response. IEEE Trans. Power Syst. 2018, 33, 6579–6589. [Google Scholar] [CrossRef]
- Ghosal, M.; Vallem, M.; Nguyen, Q.H.; Ke, X.; Vyakaranam, B.; Samaan, N.; Aworo, O.J.; Bhattarai, B. Real-time simulation of coordinated sub-transmission volt-var control tool under high distributed PV penetration. In Proceedings of the 2020 IEEE Power & Energy Society Innovative Smart Grid Technologies Conference (ISGT), Washington, DC, USA, 17–20 February 2020; pp. 1–5. [Google Scholar]
- Zhang, C.; Zhao, Y.; Zhu, L.; Liu, Y.; Farantatos, E.; Patel, M.; Hooshyar, H.; Pisani, C.; Zaottini, R.; Giannuzzi, G. Implementation and hardware-in-the-loop testing of a wide-area damping controller based on measurement-driven models. In Proceedings of the 2021 IEEE Power & Energy Society General Meeting (PESGM), Washington, DC, USA, 26–29 July 2021; pp. 1–5. [Google Scholar]
- Duong, T.D.; D’Arco, S.; Tande, J.O. Architecture and laboratory implementation of a testing platform for Wide Area Monitoring Systems. In Proceedings of the IECON 2019—45th Annual Conference of the IEEE Industrial Electronics Society, Lisbon, Portugal, 14–17 October 2019; Volume 1, pp. 6419–6424. [Google Scholar]
- Bharati, G.R.; Chakraborty, S.; Duan, C.; Nishikawa, T. An integrated transmission-distribution modeling for phasor-domain dynamic analysis in real-time. In Proceedings of the 2020 IEEE Power & Energy Society Innovative Smart Grid Technologies Conference (ISGT), Washington, DC, USA, 17–20 February 2020; pp. 1–5. [Google Scholar]
- Jalili-Marandi, V.; Bélanger, J. Real-time transient stability simulation of confederated transmission-distribution power grids with more than 100,000 nodes. In Proceedings of the 2018 IEEE Power & Energy Society General Meeting (PESGM), Portland, OR, USA, 5–10 August 2018; pp. 1–5. [Google Scholar]
- Mohammed, A.S.; Enslin, J.; Xiao, Q.; Lu, N.; Chacko, C.D.; Sico, K.; Whisenant, S. Real-Time Monitoring and Control of Inverter-based Resources with an Integrated T&D System. In Proceedings of the 2023 8th IEEE Workshop on the Electronic Grid (eGRID), Karlsruhe, Germany, 16–18 October 2023; pp. 1–6. [Google Scholar]
- Dubey, A.; Chakrabarti, S.; Terzija, V. Testing and validation of a dynamic estimator of states in OPAL-RT real time simulator. In Proceedings of the 2017 IEEE Power & Energy Society General Meeting, Chicago, IL, USA, 16–20 July 2017; pp. 1–5. [Google Scholar]
- Chandra, A.; Pradhan, A.K.; Sinha, A.K. PMU based real time power system state estimation using ePHASORsim. In Proceedings of the 2016 National Power Systems Conference (NPSC), Bhubaneswar, India, 19–21 December 2016; pp. 1–6. [Google Scholar]
- Petersen, L.; Iov, F. Practical considerations regarding Implementation of wind power applications into real-time hardware-in-the-loop framework. In Proceedings of the NEIS Conference 2016: Nachhaltige Energieversorgung und Integration von Speichern; Springer: Berlin/Heidelberg, Germany, 2017; pp. 61–66. [Google Scholar]
- Petersen, L.; Kryezi, F.; Iov, F. Design and tuning of wind power plant voltage controller with embedded application of wind turbines and STATCOMs. IET Renew. Power Gener. 2017, 11, 216–225. [Google Scholar] [CrossRef]
- Jalili-Marandi, V.; Belanger, J. Real-Time Hybrid Transient Stability and Electromagnetic Transient Simulation of Confederated Transmission-Distribution Power Grids. In Proceedings of the 2020 IEEE Power & Energy Society General Meeting (PESGM), Seattle, WA, USA, 21–25 July 2020; pp. 1–5. [Google Scholar]
- Jiang, T.; Song, X.; Schlegel, S.; Westermann, D. Hybrids-simulation using emegasim and ephasorsim for converter dominated distribution grid. In Proceedings of the NEIS 2018, Conference on Sustainable Energy Supply and Energy Storage Systems, VDE, Hamburg, Germany, 20–21 September 2018; pp. 1–6. [Google Scholar]
- Member, T.J.; Xinya, S.; Willkomm, J.; Schlegel, S.; Westermann, D. Hybrids-simulation using EMT-and phasor-based model for converter dominated distribution grid. In Proceedings of the 2018 IEEE PES Innovative Smart Grid Technologies Conference Europe (ISGT-Europe), Sarajevo, Bosnia and Herzegovina, 21–25 October 2018; pp. 1–6. [Google Scholar]
- Xie, F.; McEntee, C.; Zhang, M.; Lu, N. An asynchronous real-time co-simulation platform for modeling interaction between microgrids and power distribution systems. In Proceedings of the 2019 IEEE Power & Energy Society General Meeting (PESGM), Atlanta, GA, USA, 4–8 August 2019; pp. 1–5. [Google Scholar]
- He, B.; Li, T.Y.; Xiao, J.L. Digital twin-driven design for product control system. In Digital Twins for Digital Transformation: Innovation in Industry; Springer: Berlin/Heidelberg, Germany, 2022; pp. 41–65. [Google Scholar]
- Espinoza, R.F.; Justino, G.; Otto, R.B.; Ramos, R. Real-time RMS-EMT co-simulation and its application in HIL testing of protective relays. Electr. Power Syst. Res. 2021, 197, 107326. [Google Scholar] [CrossRef]
- Scheibe, C.; Kuri, A.; Graf, L.; Venugopal, R.; Mehlmann, G. Real time co-simulation of electromechanical and electromagnetic power system models. In Proceedings of the 2022 International Conference on Smart Energy Systems and Technologies (SEST), Eindhoven, The Netherlands, 5–7 September 2022; pp. 1–6. [Google Scholar]
- Imris, P.; Bradley, M.; Taylor, G.; Li, Y. Validation of dynamic GB transmission system models with PMU data for hardware-in-the-loop studies. In Proceedings of the 15th International Conference on Developments in Power System Protection (DPSP 2020), IET, Liverpool, UK, 10–12 March 2020; pp. 1–6. [Google Scholar]
- Xie, F.; McEntee, C.; Zhang, M.; Mather, B.; Lu, N. Development of an encoding method on a co-simulation platform for mitigating the impact of unreliable communication. IEEE Trans. Smart Grid 2020, 12, 2496–2507. [Google Scholar] [CrossRef]
- D’Arco, S.; Duong, T.D.; Suul, J.A. P-Hil evaluation of virtual inertia support to the nordic power system by an HVDC terminal. In Proceedings of the 2020 IEEE PES Innovative Smart Grid Technologies Europe (ISGT-Europe), The Hague, The Netherlands, 26–28 October 2020; pp. 176–180. [Google Scholar]
- Ciontea, C.I.; Pedersen, R.; Kristensen, T.L.F.; Sloth, C.E.; Olsen, R.L.; Iov, F. Smart grid control and communication: The SmartC2net Real-Time HIL approach. In Proceedings of the 2015 IEEE Eindhoven PowerTech, Eindhoven, The Netherlands, 29 June–2 July 2015; pp. 1–6. [Google Scholar]
- Shahid, K.; Petersen, L.; Olsen, R.L.; Iov, F. ICT Based HIL Validation of Voltage Control Coordination in Smart Grids Scenarios. Energies 2018, 11, 1327. [Google Scholar] [CrossRef]
- Nainar, K.; Ciontea, C.I.; Shahid, K.; Iov, F.; Olsen, R.L.; Schäler, C.; Schwefel, H.P.C. Experimental validation and deployment of observability applications for monitoring of low-voltage distribution grids. Sensors 2021, 21, 5770. [Google Scholar] [CrossRef] [PubMed]
- Ciontea, C.I.; Shahid, K.; Iov, F.; Olsen, R.L. Flexible platform for the study and testing of smart energy systems enabling-technologies. In Proceedings of the 2020 IEEE PES Innovative Smart Grid Technologies Europe (ISGT-Europe), The Hague, The Netherlands, 26–28 October 2020; pp. 1114–1119. [Google Scholar]
- Bessler, S.; Kemal, M.S.; Silva, N.; Olsen, R.; Iov, F.; Drenjanac, D.; Schwefel, H.P. Distributed flexibility management targeting energy cost and total power limitations in electricity distribution grids. Sustain. Energy Grids Netw. 2018, 14, 35–46. [Google Scholar] [CrossRef]
- Arraño-Vargas, F.; Konstantinou, G. Synthetic Grid Modeling for Real-Time Simulations. In Proceedings of the 2021 IEEE PES Innovative Smart Grid Technologies—Asia (ISGT Asia), Bengaluru, India, 10–13 November 2021; pp. 1–5. [Google Scholar]
- Mehlmann, G.; Kühnapfel, U.; Wege, F.; Winkens, A.; Scheibe, C.; Vogel, S.; Noglik, P.; Gratza, M.; Richter, J.; Weber, M.; et al. The Kopernikus ENSURE Co-Demonstration Platform. IEEE Open J. Power Electron. 2023, 4, 987–1002. [Google Scholar] [CrossRef]
- Xu, B. Development of Advanced Grid-Support Functionalities Using Battery Energy Storage Systems. Ph.D. Thesis, North Carolina State University, Raleigh, NC, USA, 2023. [Google Scholar]
- Aalborg University. Smart Energy Systems Laboratory. Aalborg University 2024. Available online: https://www.energy.aau.dk/laboratories/smart-energy-systems-laboratory (accessed on 26 September 2024).
- Denmark, S. New Registrations and Used Cars. Available online: https://www.dst.dk/en/Statistik/emner/transport/transportmidler/nyregistrerede-og-brugte-biler (accessed on 15 May 2024).


| ePHASORSIM | eMEGASIM | HYPERSIM | eFPGASIM | |
|---|---|---|---|---|
| Application | Power Systems Simulation | Power Systems and Power Electronics Simulation | Power Systems Simulation | Power Electronics Simulation |
| Simulation domain | Phasor domain | EMT domain | EMT domain | EMT domain |
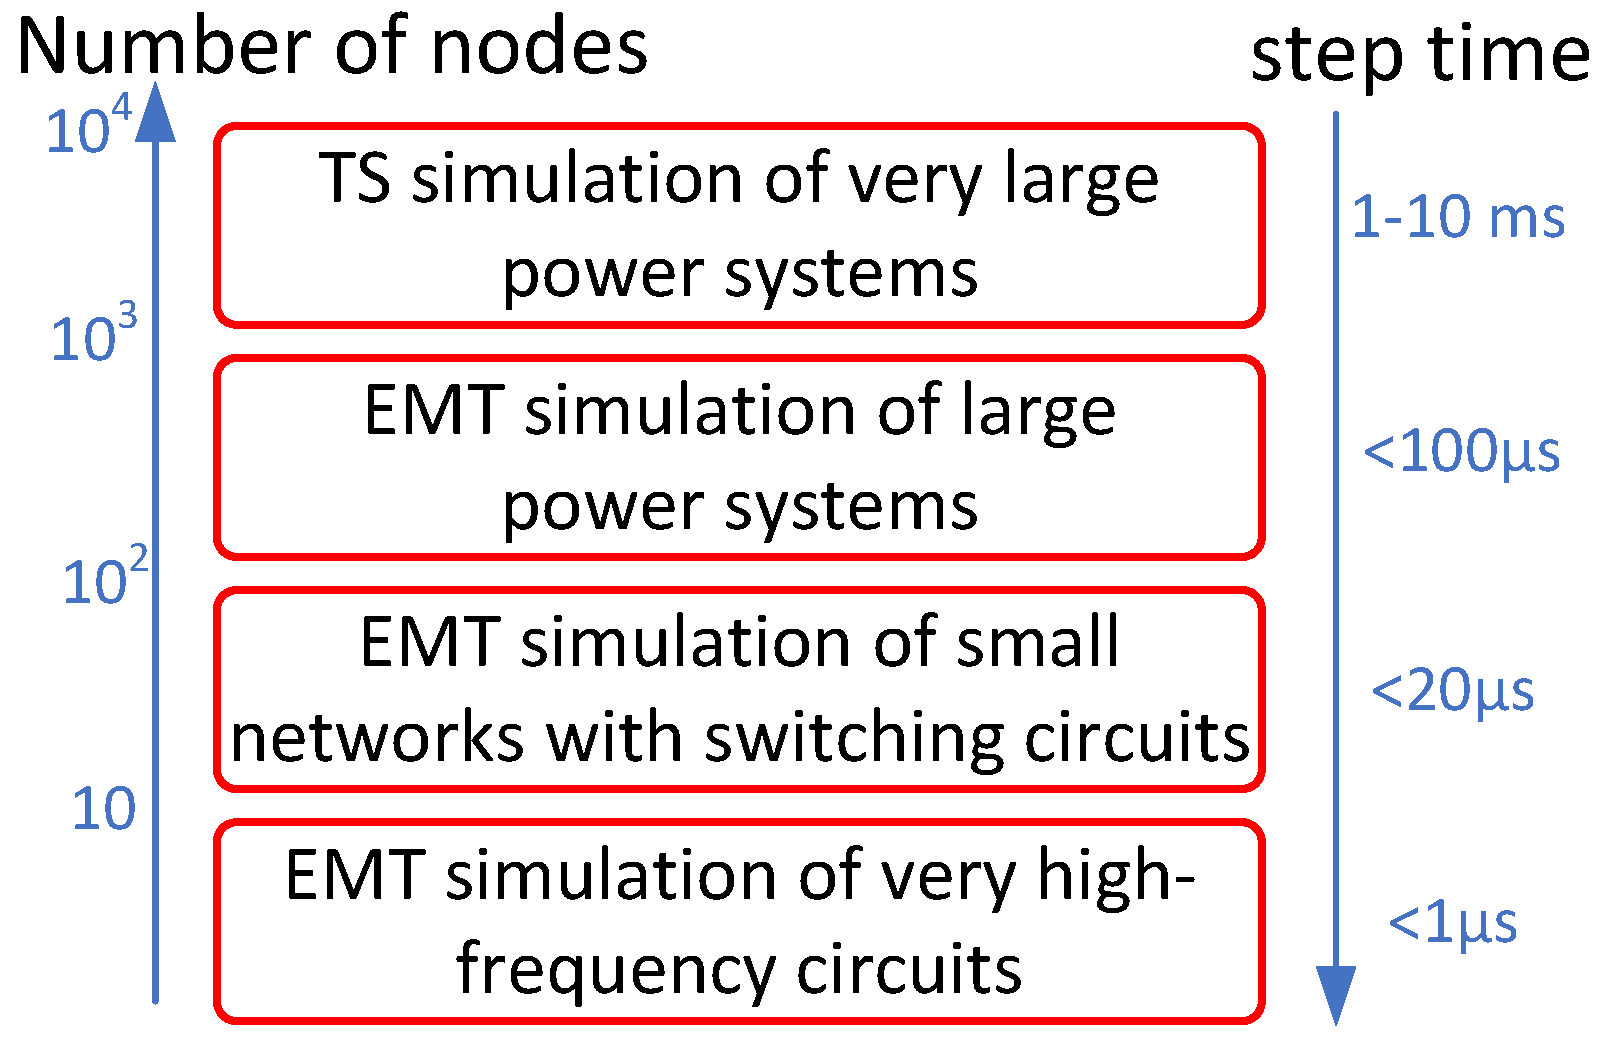
| Typical time steps | 1–10 ms | 10–100 s | 5–100 s | 200 ns–2 s |
| Modeling domain | Positive-sequence phasor domain | Three-phase time domain | Three-phase time domain | Three-phase time domain |
| Size of Study System | 10,000 nodes/CPU core (max: 108,000 nodes) | 30–40 three-phase nodes/core (max: 900 nodes) | 75 three-phase nodes/core (max: 27,000 nodes) | 128 switches/FPGA |
| Compatible modeling environments | Simulink, Excel, ETAP, PSS®E, CYME, Power Factory, FMU (Open Modelica and Dymola) | SPS/Simulink | SPS/Simulink, HYPERSIM | SPS/Simulink, PLECS, PSIM, and NI Multisim |
| Typical Type of Studies Performed | Wide-Area Monitoring Protection and Control, Power System Controls, Cybersecurity | Protection Systems, Power System Controls, MMC, Microgrid, Onboard Power Systems, Hybrid and Electrical Transportation, Cybersecurity | Protection Systems, Power System Controls, MMC, Wide-Area Monitoring Protection and Control, Cybersecurity, Microgrid, Distribution | Energy Conversion Controls, Hybrid and Electrical Transportation, Power System Controls |
| Excel Sheet | Definition |
|---|---|
| General | Basic project information |
| BLKDef | Definitions for blocks |
| ElmComp | Component information |
| ElmDsl | Exciter and governor parameters for generators |
| TypVt(1) | Information about wind power plants |
| Elmlne | Line placement, length, and type |
| ElmLod | Load placement and PQ values |
| ElmNet | Nominal frequency of the grid |
| ElmShnt | Capacitor banks and shunt filters |
| ElmSym | Generator placement, PQ values, and type |
| ElmTerm | Bus names and nominal voltages |
| ElmTr2 | Transformer placement and type |
| StaCubic | Connections of elements to buses |
| StaSwitch | Switch information |
| TypLne | Line specifications including rated voltage, resistance, and reactance |
| TypLod | Load types |
| TypSym | Synchronous machine parameters |
| TypTr2 | Transformer parameters |
| Excel Sheet | Definition |
|---|---|
| General | Includes fundamental details of the power system, such as the base frequency and MVA. |
| Pins | Details the outgoing and incoming data for ePHASORSIM Solver. Outgoing pins monitor measurements or status, while incoming pins send control commands or fed in voltage/current/power signals to the simulator. |
| Bus | Lists bus IDs along with their voltage and angle information for initializing the simulation. |
| Vsource Three-Phase | Contains information on the substation bus and voltage, including series impedance. |
| Current Injector | Describes buses and current source IDs, such as distributed generators and PV. These sources need to be modeled in Simulink and linked to the ePHASORSIM environment. |
| Load Three-Phase | Specifies three-phase loads, breaking them down into constant impedance, constant current, and constant power components. |
| Shunt Three-Phase | Used to model shunt devices like capacitor banks and reactors. |
| Line Three-Phase | Provides details on three-phase lines, including overhead, underground, and service lines, modeled as pi-sections. |
| Transformer Three-Phase | Includes information on transformers in the feeder, with capabilities for voltage regulation via external tap position signals. |
| Switch | Describes breakers and disconnects, indicating their open (0) or closed (1) status. |
| Bus Faults Three-Phase | Used to simulate various types of balanced and unbalanced faults in three-phase systems, allowing faults to be applied at buses through external signals. |
| Load Name | Consumption (kWh/day) |
|---|---|
| H01 | 15.42 |
| H02 | 14.03 |
| H03 | 11.70 |
| H04 | 11.42 |
| H05 | 9.23 |
| H06 | 5.68 |
| H07 | 12.13 |
| H08 | 8.75 |
| Other load 1 | 474.2 |
| Other load 2 | 124.8 |
Disclaimer/Publisher’s Note: The statements, opinions and data contained in all publications are solely those of the individual author(s) and contributor(s) and not of MDPI and/or the editor(s). MDPI and/or the editor(s) disclaim responsibility for any injury to people or property resulting from any ideas, methods, instructions or products referred to in the content. |
© 2024 by the authors. Licensee MDPI, Basel, Switzerland. This article is an open access article distributed under the terms and conditions of the Creative Commons Attribution (CC BY) license (https://creativecommons.org/licenses/by/4.0/).
Share and Cite
Golestan, S.; Golmohamadi, H.; Sinha, R.; Iov, F.; Bak-Jensen, B. Real-Time Simulation and Hardware-in-the-Loop Testing Based on OPAL-RT ePHASORSIM: A Review of Recent Advances and a Simple Validation in EV Charging Management Systems. Energies 2024, 17, 4893. https://doi.org/10.3390/en17194893
Golestan S, Golmohamadi H, Sinha R, Iov F, Bak-Jensen B. Real-Time Simulation and Hardware-in-the-Loop Testing Based on OPAL-RT ePHASORSIM: A Review of Recent Advances and a Simple Validation in EV Charging Management Systems. Energies. 2024; 17(19):4893. https://doi.org/10.3390/en17194893
Chicago/Turabian StyleGolestan, Saeed, Hessam Golmohamadi, Rakesh Sinha, Florin Iov, and Birgitte Bak-Jensen. 2024. "Real-Time Simulation and Hardware-in-the-Loop Testing Based on OPAL-RT ePHASORSIM: A Review of Recent Advances and a Simple Validation in EV Charging Management Systems" Energies 17, no. 19: 4893. https://doi.org/10.3390/en17194893
APA StyleGolestan, S., Golmohamadi, H., Sinha, R., Iov, F., & Bak-Jensen, B. (2024). Real-Time Simulation and Hardware-in-the-Loop Testing Based on OPAL-RT ePHASORSIM: A Review of Recent Advances and a Simple Validation in EV Charging Management Systems. Energies, 17(19), 4893. https://doi.org/10.3390/en17194893