Article

Flexibility-Oriented AC/DC Hybrid Grid Optimization Using Distributionally Robust Chance-Constrained Method

Power Dispatching and Control Center, Guangdong Power Grid Co., Ltd., Guangzhou 510600, China
*
Author to whom correspondence should be addressed.
Energies 2024, 17(19), 4902; https://doi.org/10.3390/en17194902
Submission received: 23 August 2024 / Revised: 26 September 2024 / Accepted: 27 September 2024 / Published: 30 September 2024

Abstract

:
With the increasing integration of stochastic sources and loads, ensuring the flexibility of AC/DC hybrid distribution networks has become a pressing challenge. This paper aims to enhance the operational flexibility of AC/DC hybrid distribution networks by proposing a flexibility-oriented optimization framework that addresses the growing uncertainties. Notably, a comprehensive evaluation method for operational flexibility assessment is first established. Based on this, this paper further proposes a flexibility-oriented operation optimization model using the distributionally robust chance-constrained (DRCC) method. A customized solution method utilizing second-order cone relaxation and sample average approximation (SAA) is also introduced. The results of case studies indicate that the flexibility of AC/DC hybrid distribution networks is enhanced through sharing energy storage among multiple feeders, adaptive reactive power regulation using soft open points (SOPs) and static var compensators (SVCs), and power transfer between feeders via SOPs.

1. Introduction

In recent years, the proliferation of DC loads, such as electric vehicle (EV) charging stations, and the increasing deployment of DC power sources like photovoltaic (PV) have significantly impacted the landscape of distribution networks. Traditional AC distribution networks, though well-established, are increasingly facing challenges due to the growing integration of these DC components, which has led to inefficiencies and operational complexities that are difficult to manage with conventional AC infrastructure alone [1].
Consequently, the AC/DC hybrid distribution network has emerged as a promising solution for future grid development. By integrating the advantages of both AC and DC systems, the AC/DC hybrid distribution network offers enhanced energy transmission efficiency, reduced conversion losses, and more effective integration of distributed energy resources, thereby playing a pivotal role in the evolution of modern distribution grids [2,3]. However, as the penetration of renewable energy sources and stochastic load continue to rise, the inherent variability and uncertainty in these networks necessitate greater operational flexibility. Therefore, research on flexibility-oriented optimization in AC/DC hybrid distribution networks is increasingly essential.
A typical structure of an AC/DC hybrid distribution network is shown in Figure 1. The AC/DC hybrid distribution network comprises distinct AC and DC parts, interconnected by soft open point (SOP) converters, which enable bidirectional power flow between the two domains [4]. The DC network is characterized by integrating large-scale PV and energy storage systems (ESSs), which are the primary sources of distributed generation. The main loads within this network include data centers, EV charging stations, and other DC-based loads such as lighting systems. These components form a cohesive DC distribution system connected to the AC part via SOP converters. This setup allows for seamless power exchange between the AC and DC systems, facilitating the evolution of traditional distribution networks into more flexible hybrid systems capable of efficiently managing both AC and DC resources.
At present, considerable research has been conducted on AC/DC hybrid distribution network optimization. For example, in [5], a three-level hierarchy consisting of DC grids, voltage source converter (VSC) stations, and AC grids was formulated to decompose the operation problem of AC/DC hybrid distribution networks. Ref. [6] further considered the characteristics of the ESS in AC/DC hybrid distribution networks and realized optimal coordinated control of “source-load-storage” by proposing a two-layer control structure. In [7,8,9], the SOP is used to achieve flexible interconnection between AC and DC distribution networks. Due to the SOP’s capabilities, such as reactive power regulation and power transfer [10], the AC/DC hybrid distribution network based on SOP will have enhanced operational flexibility. Enabling shared ESS across multiple feeders and adaptive reactive power control of SOP also improves the self-healing ability of the distribution system [11]. In a word, existing studies have adopted different distribution network equipment to minimize line losses [12], manage the random fluctuations of source and load [13,14], ensure the stable operation of the system [15], and so on.
However, while these studies contribute significantly to optimizing various aspects of the network, more attention should be given to the comprehensive optimization of operational flexibility, which is increasingly necessary given the growing integration of renewable energy sources and stochastic loads.
In addition, to address uncertainties such as the output of PVs and load demand in AC/DC hybrid distribution networks, several optimization approaches have been developed, including stochastic optimization (SO) [16] and robust optimization (RO) [17,18]. SO models uncertainties by considering various future scenarios. For example, a bi-level programming model with chance constraints was established to describe the uncertainty of renewable energy in [16]. While RO ensures performance under worst-case scenarios and determines optimal operation scheme by solving “max-min-max” robust programming model [17,18].
However, there are many shortcomings in SO and RO. Firstly, the SO method is based on a precise reference function, which is generally difficult to obtain in the real system. When the real distribution deviates from the empirical distribution in the actual situation, the optimality of the results will also be greatly compromised. Additionally, the RO method only considers the optimization results in the worst-case scenario; however, the probability of the worst-case scenario is very low in practice, which leads to conservative RO results. In order to overcome the deficiency of SO and RO, the distributionally robust chance-constrained (DRCC) method has gradually become a research focus in recent years [19]. The DRCC method considers a set of probability distributions that are close to the empirical distribution and studies the optimal results under the worst-case probability distribution, thus combining the advantages of traditional SO and RO. Specifically, compared to SO, the DRCC method does not require precise probability distribution functions; thus, the results are more robust statistically. Compared to RO, the DRCC method takes into account the distribution characteristics of uncertainties, thus avoiding the impact of small-probability extreme scenarios on the optimization results [20]. At the current stage, the DRCC method has been applied in power system planning [21,22], but there is still little research in flexibility-oriented operational optimization.
This paper develops a flexibility-oriented optimization framework for AC/DC hybrid distribution networks using a DRCC method to effectively deal with the issue of source–load uncertainty and enhance operational flexibility. The main contribution of this paper can be summarized as the following points:
  • We propose a framework for enhancing operational flexibility in AC/DC hybrid distribution networks. Comprehensive evaluation indexes for operational flexibility assessment are also established, which include the flexibility balance index, bus flexibility index, and branch flexibility index.
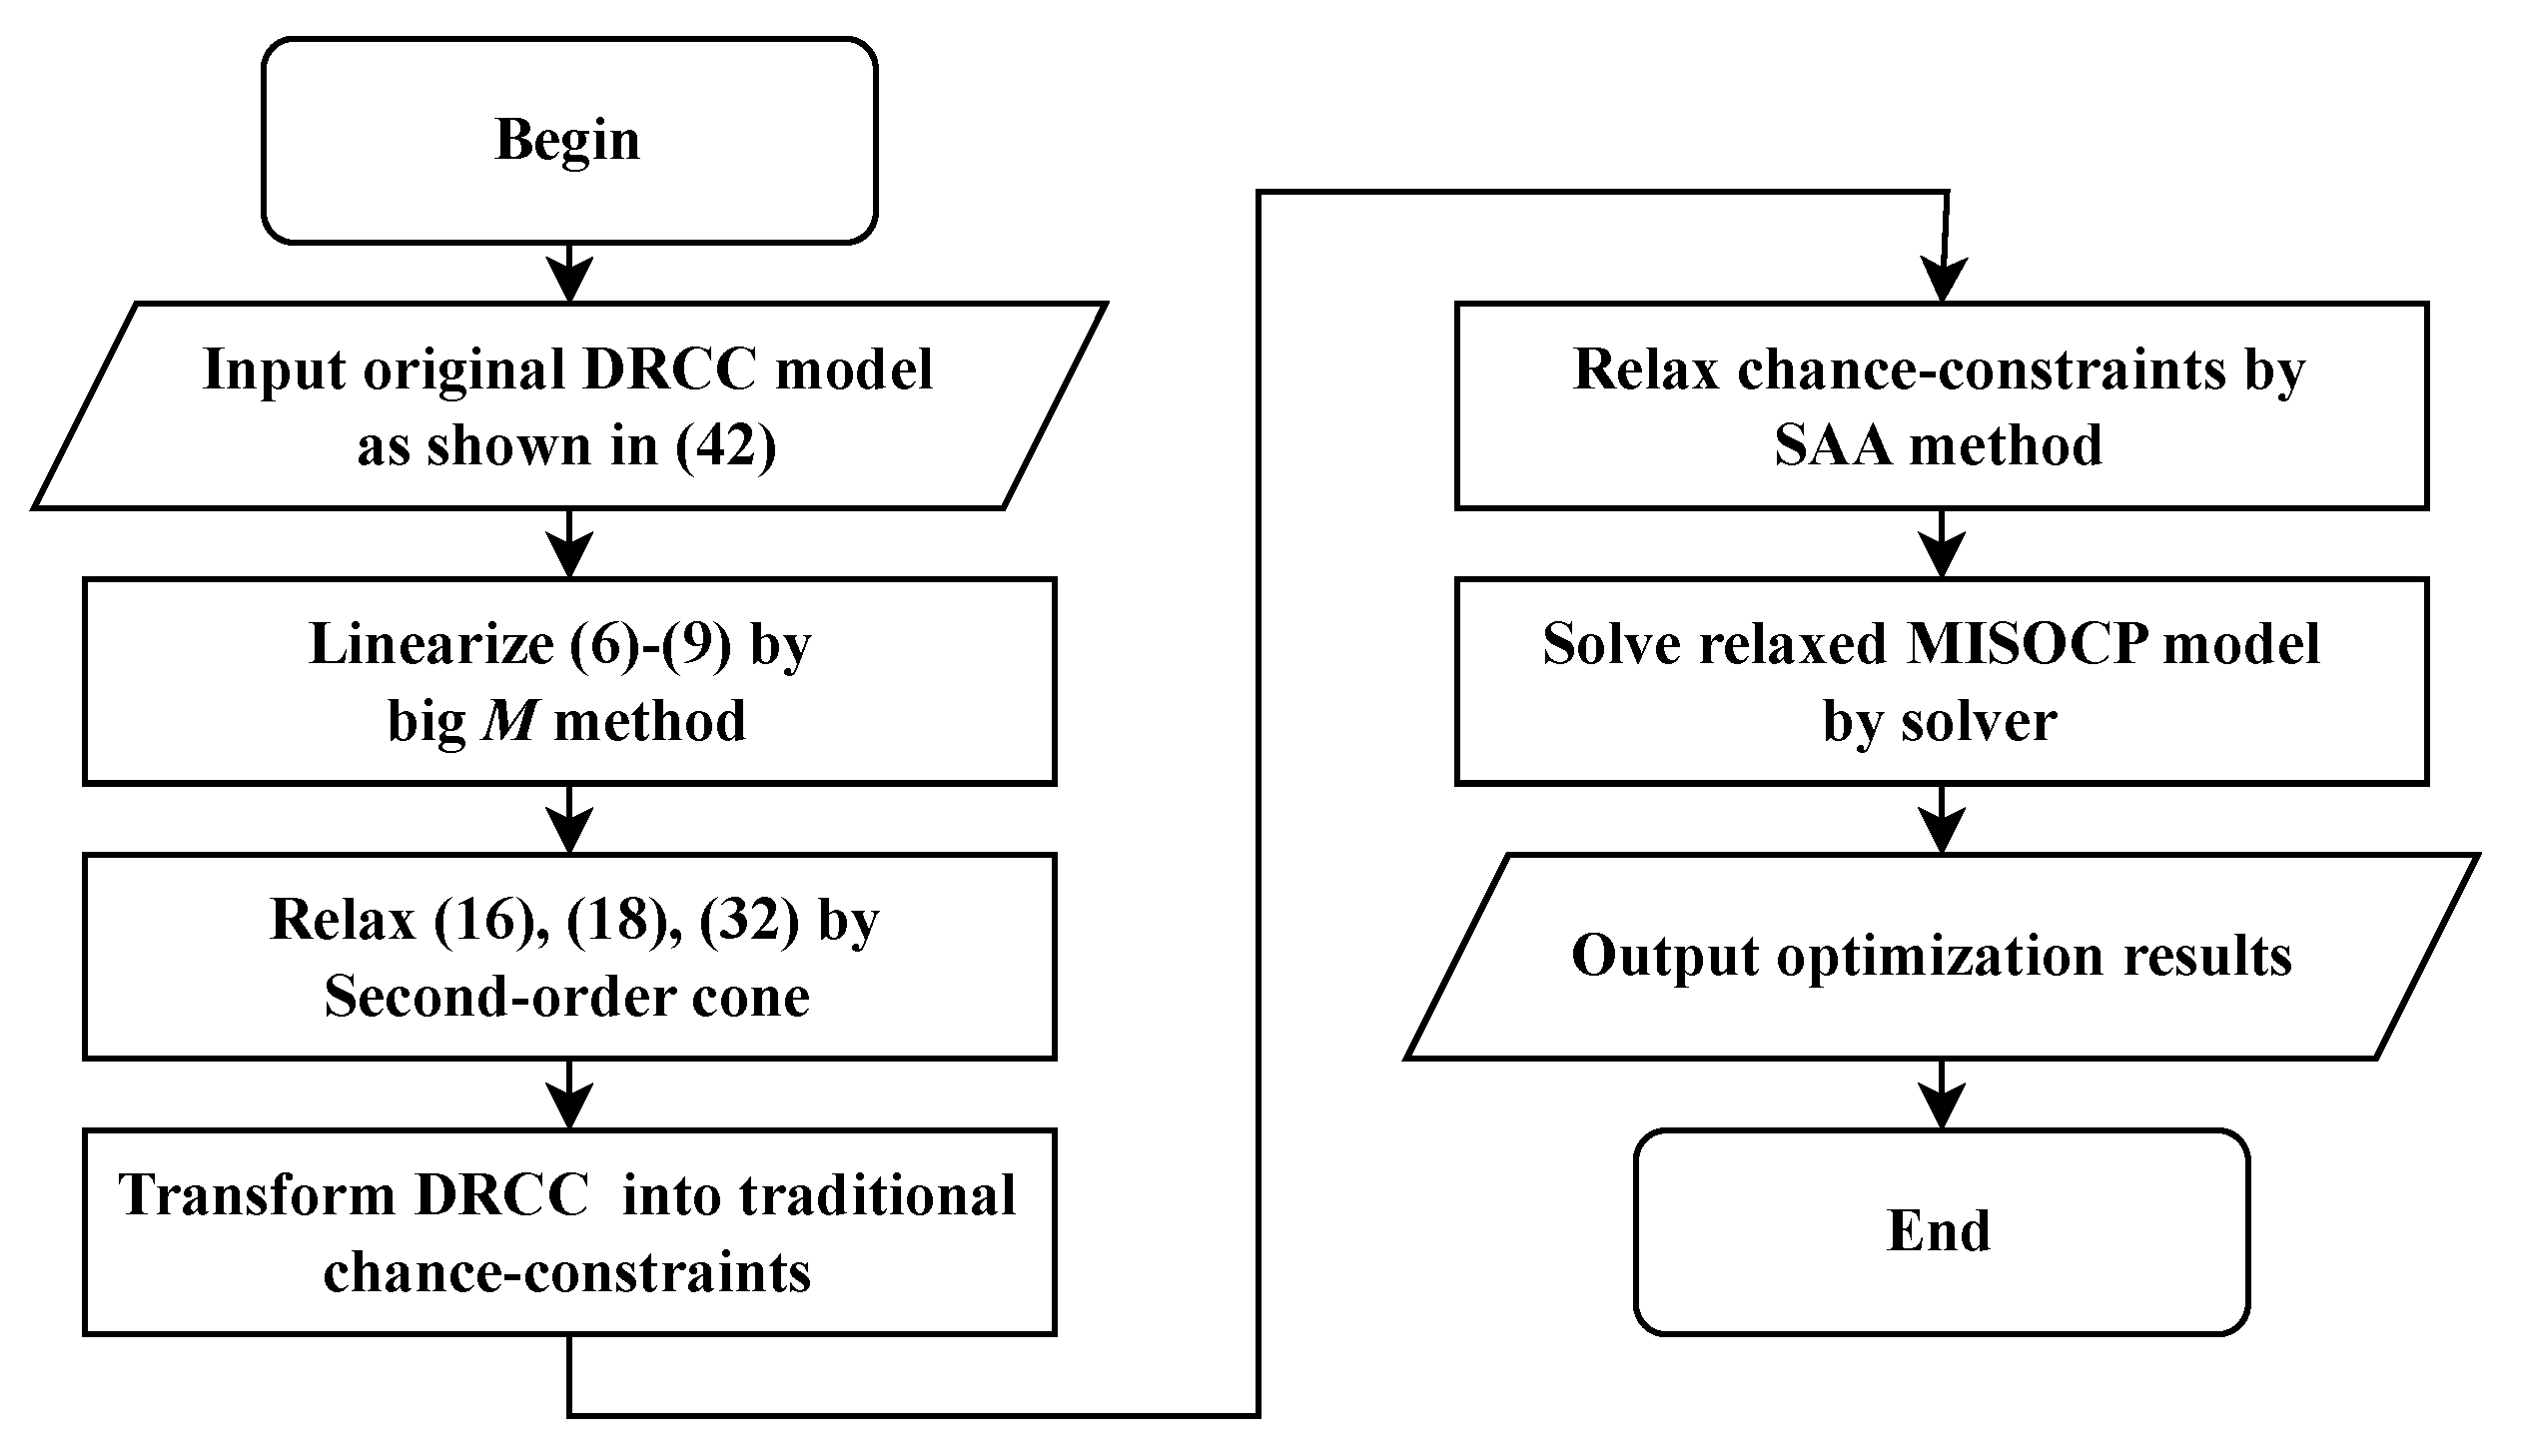
  • We develop a flexibility-oriented DRCC model for AC/DC hybrid distribution networks operation, which effectively manages the stochastic fluctuations of source and load during the day-ahead scheduling. A customized solution method based on second-order cone relaxation and sample average approximation (SAA) is also proposed.
The remainder of this paper is organized as follows. Section 2 analyzes how to enhance the flexibility of the AC/DC hybrid network and proposes corresponding flexibility evaluation indicators. Section 3 establishes the DRCC model to obtain the flexible optimal operation scheme of the AC/DC hybrid network. The solution method is developed in Section 4. Case studies are presented in Section 5. Finally, conclusions are given in Section 6.

2. Framework for Enhancing Flexibility of AC/DC Hybrid Distribution Network

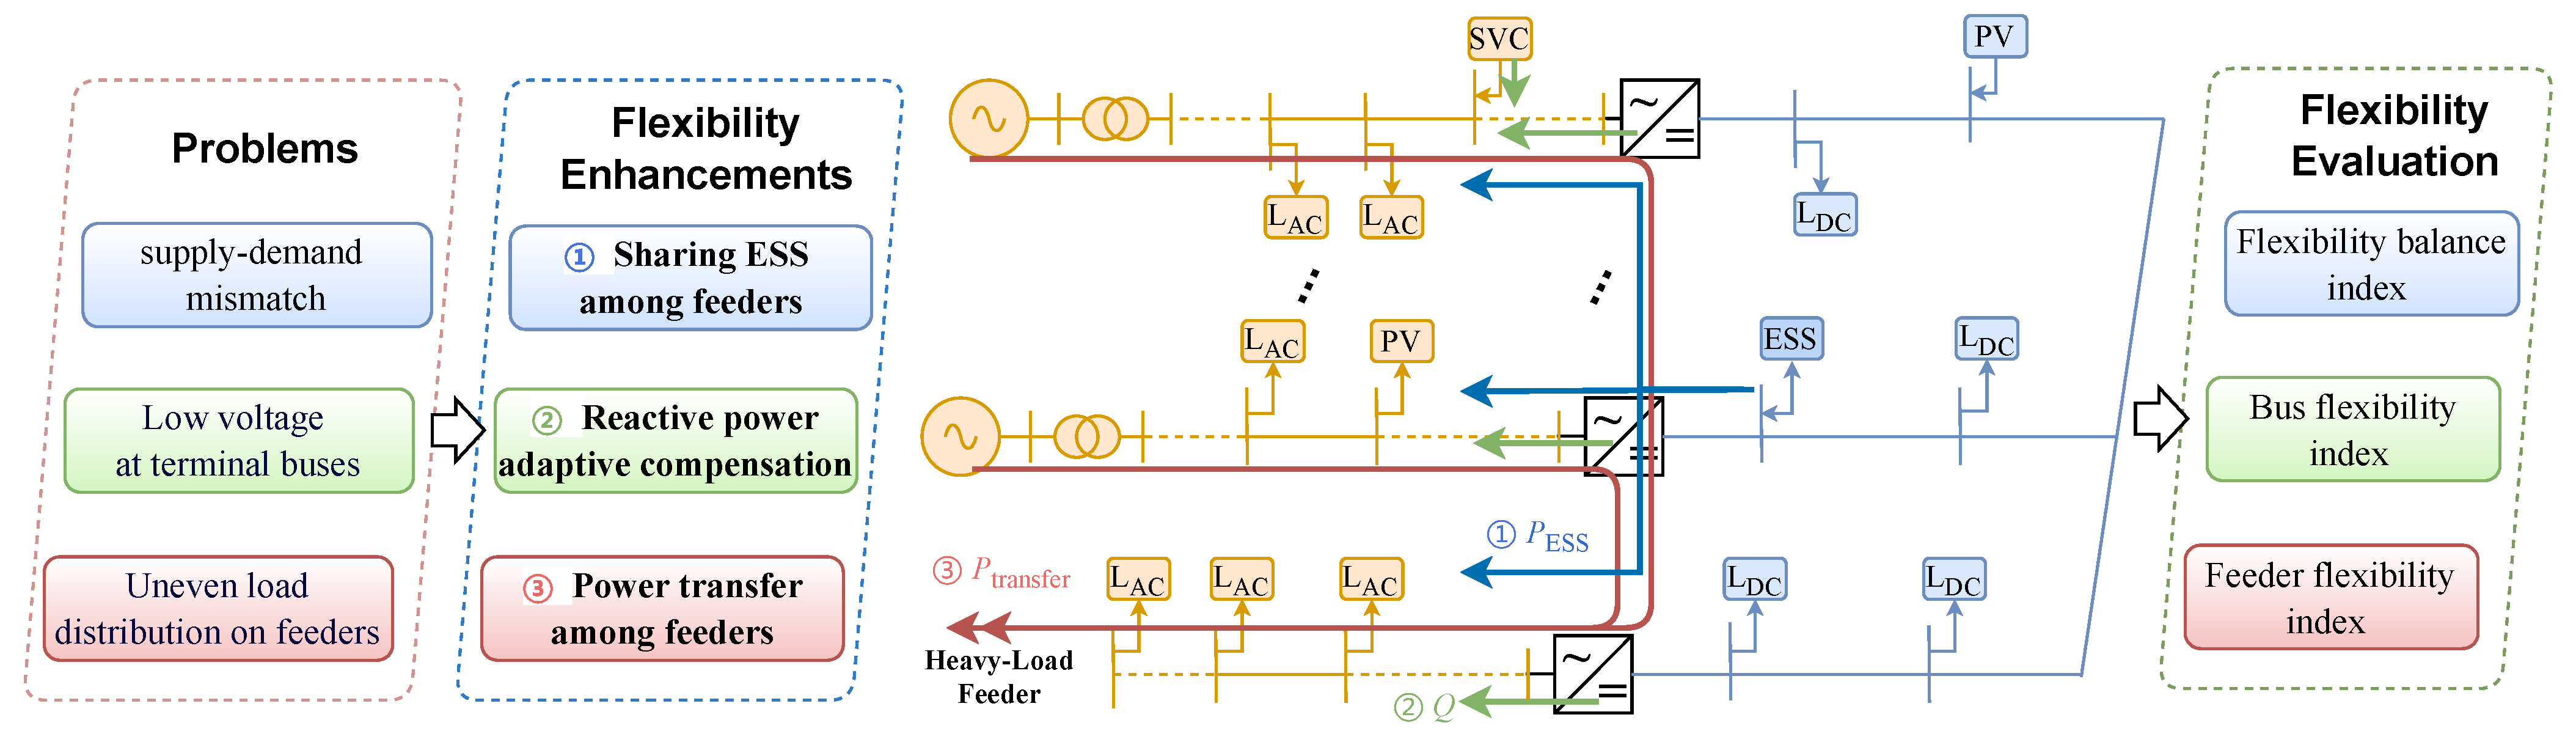
2.1. Flexibility Enhancement Methods

The AC/DC hybrid distribution network faces several critical challenges related to operational flexibility. First, the increasing proportion of stochastic sources and loads exacerbates the temporal and spatial mismatch between power generation and demand, leading to significant imbalances across the network. Second, at the nodal level, low voltage issues at the terminal buses, particularly those located at the ends of feeders, can no longer meet the stringent power quality requirements of high-end users. Finally, at the feeder level, the uneven load distribution caused by the high density of connected loads results in substantial disparities in feeder load rates, with some feeders experiencing excessively high load conditions. These issues collectively underscore the growing need for enhanced flexibility in the operation of AC/DC hybrid distribution networks.
As shown in Figure 2, in order to overcome the flexibility dilemma of the AC/DC distribution network, this paper proposes the following flexibility enhancement schemes from the supply and demand balance, node level, and feeder level to enhance flexibility.
  • Sharing ESS among multiple feeders. As an energy component, ESS can temporarily enhance the distribution network’s flexibility. However, ESS connected to a single fixed node faces challenges adjusting to excess renewable energy and insufficient power supply on other feeders. On the other hand, as a power component, SOP can spatially enhance the distribution network’s flexibility but lacks energy storage capability and relies on the energy supply from the connected feeder lines. Therefore, ESS and SOP enhance the flexibility in the dimensions of time and space, respectively, and the advantages of these two components complement each other. In the AC/DC hybrid distribution network, the centralized ESS located at the DC part is connected to multiple feeders of the AC network through the SOP converter, realizing the adaptive sharing of ESS resources across multiple feeders. By adjusting the charging and discharging power of ESS at different times, the problem of temporal and spatial mismatch between the source and load can be effectively solved.
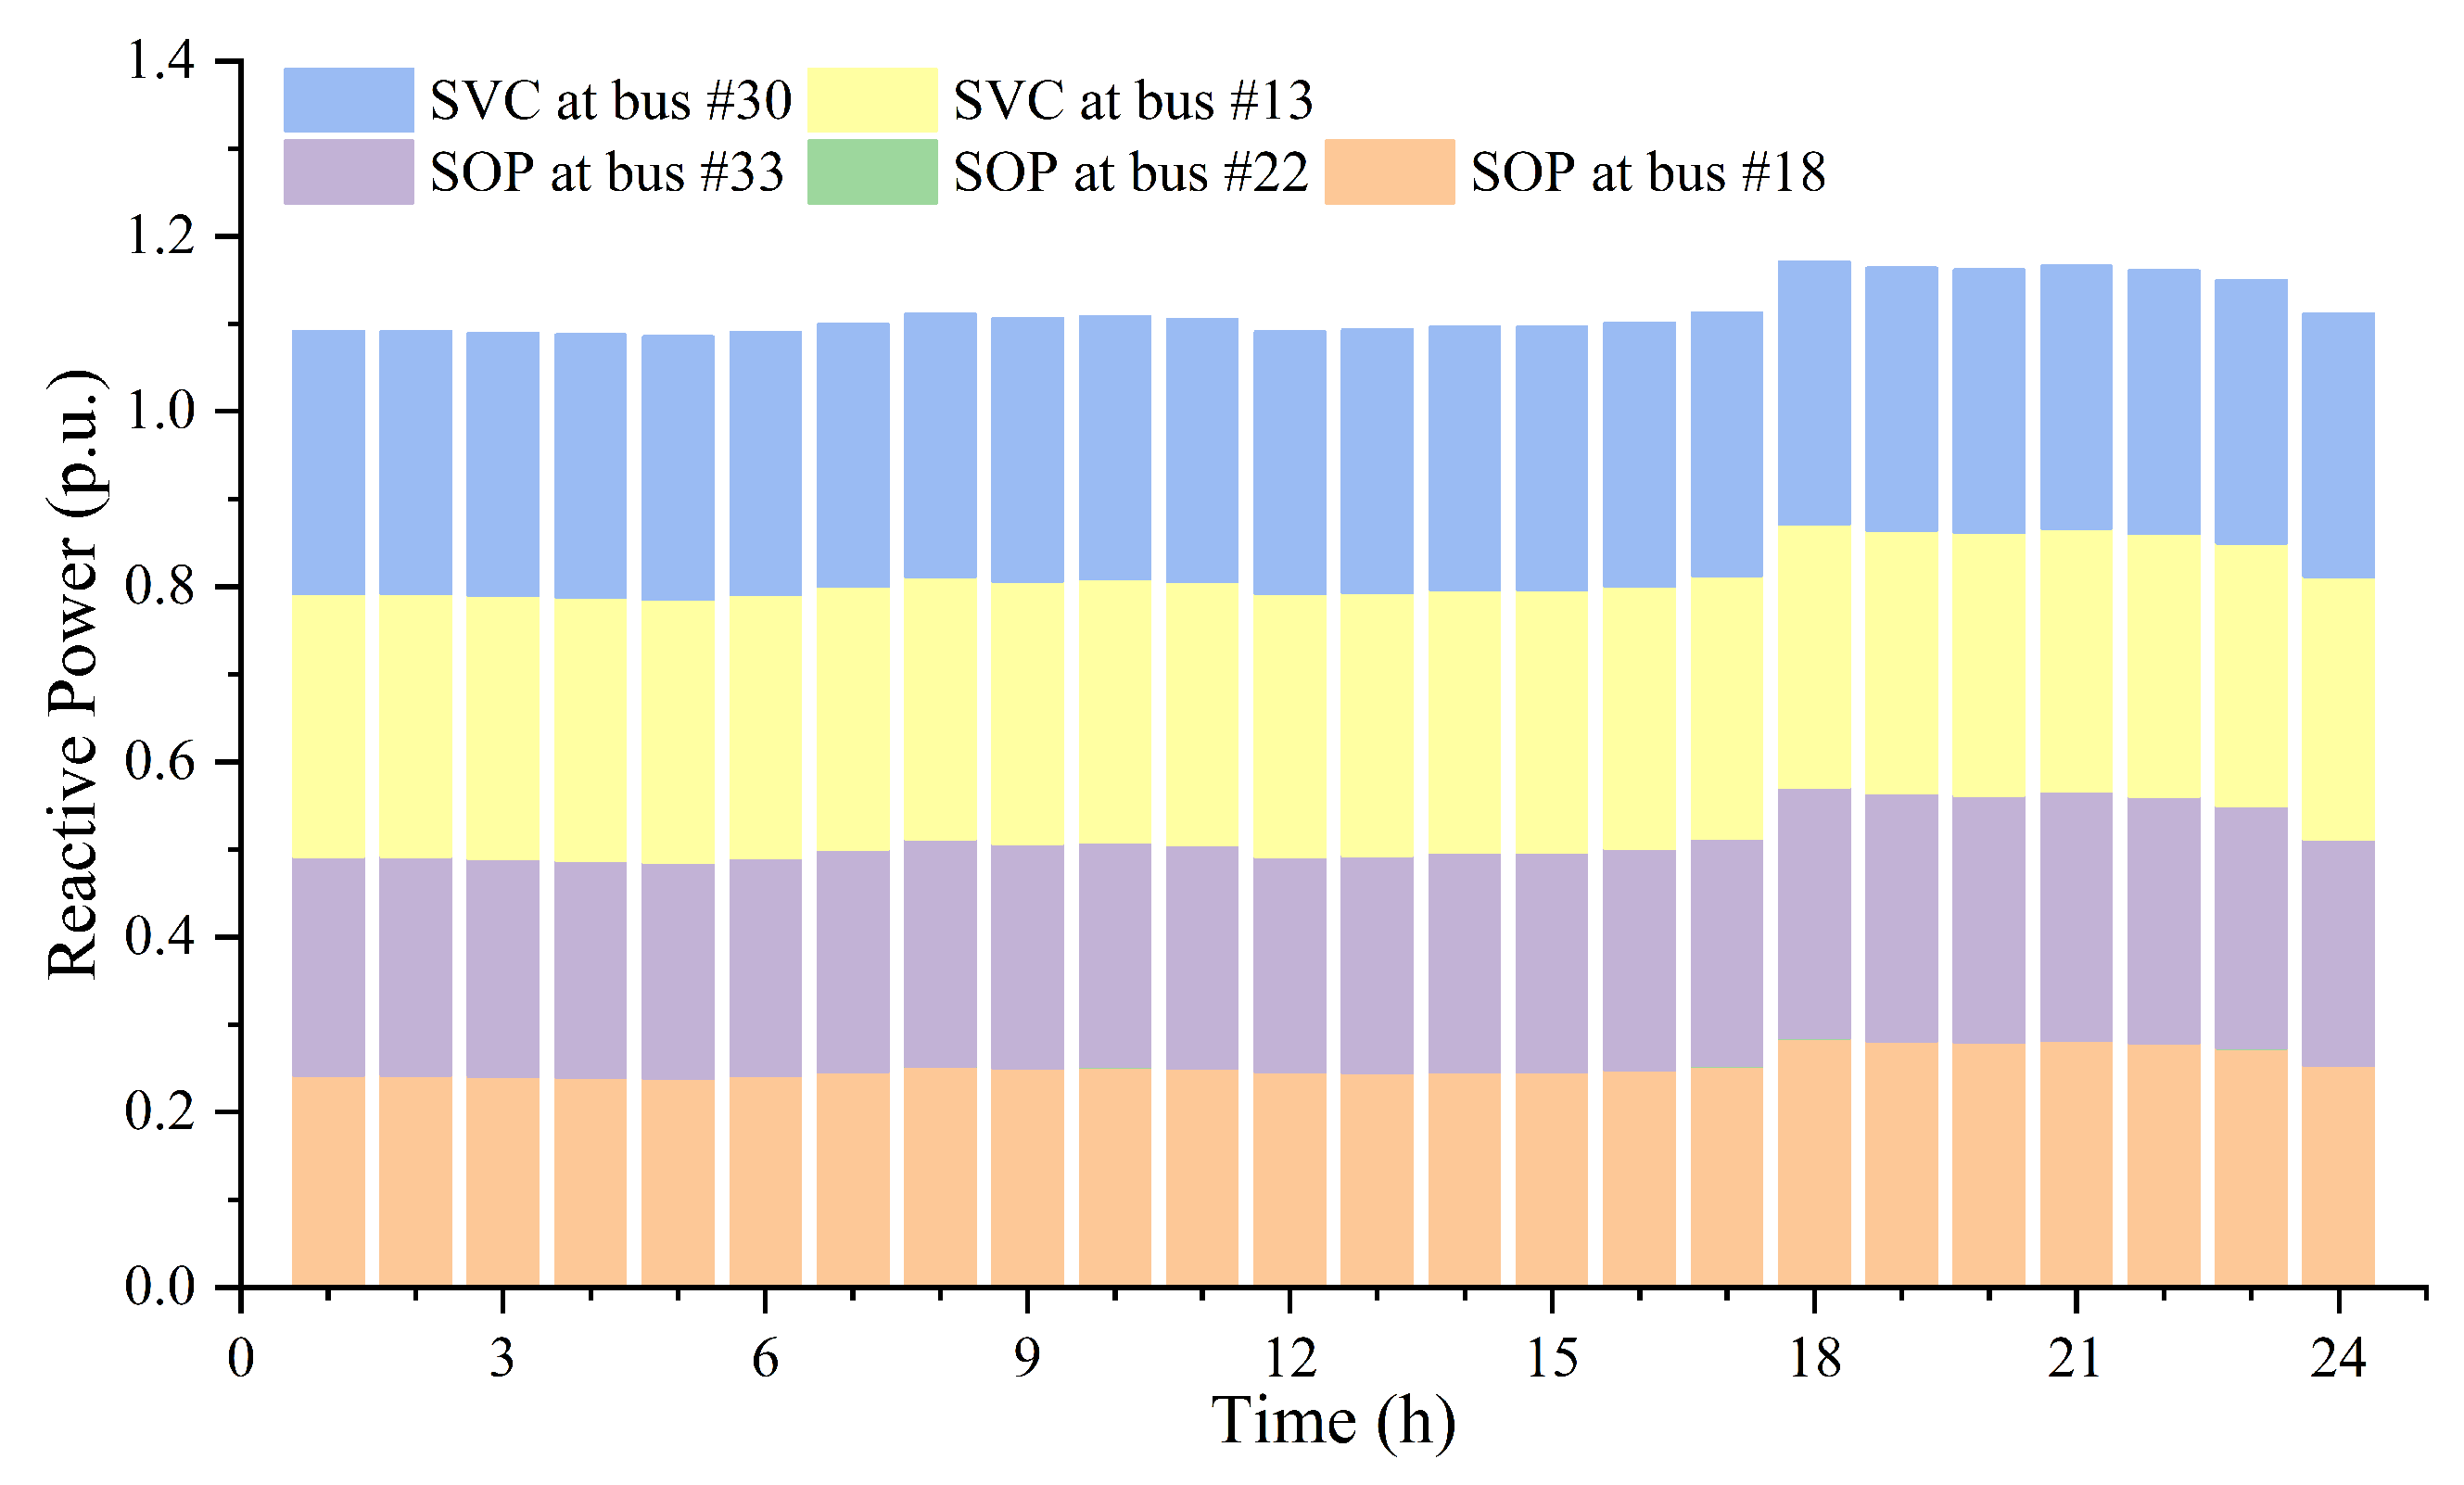
  • Reactive power adaptive compensation. To address voltage issues at feeder-end buses, reactive power compensation is adopted, and the static var compensator (SVC) and SOP play vital roles in this regard. The SVC can adjust the reactive power locally, thereby improving voltage stability and ensuring power quality for high-end users. Meanwhile, the SOP can also inject reactive power into AC buses (see SOP’s operation model in Section 3.1.2), balancing the voltage across multiple feeders. Together, SVC and SOP provide a coordinated approach to maintaining voltage levels, enhancing the nodal flexibility of the distribution network.
  • Power transfer among feeders. Uneven load distribution among feeders can lead to overloading issues on specific lines. The SOP’s power transfer capability addresses this by redistributing active power among feeders. In an AC/DC hybrid distribution network, the SOP facilitates power transfer between heavily loaded and lightly loaded feeders, as well as AC and DC parts, thereby balancing the load and preventing potential overloads. This power transfer capability enhances the spatial flexibility of the network, ensuring that no single feeder becomes a bottleneck and improves the branch efficiency of the distribution network.

2.2. Flexibility Evaluation Indexes

Based on the AC/DC hybrid distribution network flexibility improvement methods mentioned in Section 2.1, we propose three key flexibility evaluation indicators, which are evaluated from the aspects of flexibility supply–demand balance, bus flexibility, and branch flexibility.

2.2.1. Flexibility Balance Index

In an AC/DC hybrid distribution network with a high proportion of renewable energy and stochastic load penetration, the flexibility demand refers to the demand for power regulation due to fluctuations in the net load of the system, which mainly comes from the random fluctuation of source and load [23]. In general, the demand of the distribution network can be divided into upward and downward flexibility demand:
F s , t demand , up = max P s , t + 1 nl P s , t nl , 0
F s , t demand , down = min P s , t + 1 nl P s , t nl , 0
P s , t nl = i B AC B DC P s , i , t load P s , i , t DG
where F s , t demand , up and F s , t demand , down denote the up and downward flexibility demand of the distribution network at time t under scenario s.
The flexibility sources refer to the resources or the operation method that can handle the uncertain fluctuation of renewable energy and stochastic load penetration. As shown in Figure 1, the power adjustment of ESSs and power interaction with utility grids provide flexibility. Note that passive flexibility measures, such as PV power curtailment and load shedding, are excluded from this paper to prioritize high power supply reliability and renewable energy utilization.
F s , t source , up = i B AC F s , i , t G , up + j B DC F s , j , t ESS , up
F s , t source , down = i B AC F s , i , t G , down + j B DC F s , j , t ESS , down
where F s , t source , up and F s , t source , down denote the up and downward flexibility supply of the distribution network; F s , i , t G , up and F s , j , t ESS , up are the up-forward flexibility supply of power interaction with utility grids and ESS, while F s , i , t G , down and F s , j , t ESS , down are the down-forward flexibility supply, which can be expressed by:
F s , i , t G , up = min P i , max G P s , i , t G , R up Δ T
F s , i , t G , up = min P s , i , t G , R down Δ T
F s , j , t ESS , up = min P j ESS P dis , s , j , t ESS , η ESS E j ESS ( ξ s , j , t SOC ξ min SOC ) Δ T
F s , j , t ESS , down = min P j ESS P ch , s , j , t ESS , E j ESS ( ξ max SOC ξ s , j , t SOC ) η ESS Δ T
When the upward flexibility supply falls short of the demand, the distribution network is at risk of load shedding. Conversely, insufficient downward flexibility supply may necessitate the curtailment of renewable energy. Therefore, this paper further defines a flexibility balance index I FSD to measure the ability of flexibility supply to meet flexibility demand. A higher value of I FSD indicates a greater ability of flexibility resources to meet demand, resulting in better overall flexibility of the distribution network.
I s , FSD = 1 T t = 1 T F s , t source , up F s , t demand , up + F s , t source , down F s , t demand , down

2.2.2. Bus Flexibility Index

Enhancing the voltage qualification rate is also one of the objectives of flexible operation. Considering the reactive power compensation capabilities of both SOPs and static var compensators (SVCs), the flexible AC/DC interconnected distribution network also possesses voltage regulation capabilities. Therefore, a bus voltage margin index I bus V is also introduced in this paper:
I s , bus V = 1 T | B AC | + | B DC | t = 1 T i B AC B DC V s , i , t 1 2

2.2.3. Branch Flexibility Index

The SOP converters facilitate power exchange between different feeders as well as between AC and DC networks, thereby balancing the load rates across various feeders and providing each feeder with greater flexibility to handle the stochastic fluctuations of renewable energy and loads. Consequently, this paper defines branch flexibility indices I branch mean and I branch var to reflect the flexibility of distribution branches. Specifically, I branch mean represents the average load rate of the branches, with a lower value indicating a greater load margin and, therefore, higher flexibility of the distribution network branches to manage uncertainty. Meanwhile, I branch var reflects the load balancing level among different branches through the variance of branch load rates, with a lower value indicating more balanced loads across the branches. Note that
I s , branch mean = 1 T | L AC | + | L DC | t = 1 T i k L AC L DC L s , i k , t
I s , branch var = 1 T | L AC | + | L DC | t = 1 T i k L AC L DC L s , i k , t I s , branch mean 2
L s , i k , t = l s , i k , t I i k , max 2
where | | means the number of elements in the set.

3. DRCC Model for AC/DC Hybrid Network Operation

3.1. Deterministic Optimization Model

3.1.1. Objective Function

As analyzed in Section 2.2, the flexibility of the AC/DC hybrid distribution network consists of overall system flexibility, bus flexibility, and branch flexibility, which correspond to I s , FSD , I s , bus V , I s , branch mean , and I s , branch var . Therefore, this paper takes the sum of the daily flexibility index of the distribution network under each operation scenario as the optimization objective:
max I = 1 | S | s S p s w FSD I s , FSD + w bus V I s , bus V w branch mean I s , branch mean w branch var I s , branch var
where p s is the probability of the scenario s; w FSD , w bus V , w branch mean , and w branch var are the weights of each index.

3.1.2. SOP Operation Constraints

SOPs’ operation constraints are shown as follows:
P s , j , t SOP , l = ( 1 η SOP ) ( P s , j , t SOP ) 2 + ( Q s , j , t SOP ) 2
μ SOP S j SOP Q s , j , t SOP μ SOP S j SOP
( P s , j , t SOP ) 2 + ( Q s , j , t SOP ) 2 S j SOP
In the SOP model, (16) gives the calculation formula of SOP loss, (17) constrains the upper and lower limits of SOP reactive power, and (18) constrains that SOP’s apparent power at any time should not exceed its capacity.
In fact, the SOP model should also include the constraint that represents the net internal power of the SOP as zero, which means treating the SOP converter and the equipment connected to its internal DC bus as a generalized node; the power injected into this generalized node equals the power flowing out. In this paper, the DC part of the distribution network is connected to the AC part through the SOP converters. Therefore, this constraint can also be represented by the power balance in the DC distribution network, as detailed in (19).
j B DC ( P s , j , t DG P s , j , t DG , l ) + ( P dis , s , j , t ESS P ch , s , j , t ESS ) = j B DC ( P s , j , t load P s , j , t load , l ) + ( P s , j , t SOP + P s , j , t SOP , l ) + P s , j , t SOP , l + m n L DC P s , m n , t line , l

3.1.3. ESS Operation Constraints

ESS’s operation constraints are as follows:
0 P ch , s , j , t ESS B ch , s , j , t ESS P j ESS
0 P dis , s , j , t ESS B dis , s , j , t ESS P j ESS
B ch , s , j , t ESS + B dis , s , j , t ESS 1 , B ch , s , j , t ESS , B dis , s , j , t ESS { 0 , 1 }
ξ min SOC ξ s , j , t SOC ξ max SOC
ξ s , j , t SOC = ξ s , j , t 1 SOC + ( P ch , s , j , t ESS η ESS P dis , s , j , t ESS η ESS ) Δ T E j ESS
ξ s , j , 1 SOE = ξ s , j , T SOE
In ESS’s model, (20)–(22) ensure that the charge and discharge power of the ESS does not exceed the upper limit of the installed power conversion system (PCS) capacity, and the 0-1 variables B ch , s , i , t ESS and B dis , s , i , t ESS are introduced to ensure that the ESS is not simultaneously in both charging and discharging states. (23) restricts the SOC from exceeding upper and lower limits. (24) establishes the SOC transformation relationship between the moment of presence. (25) limits the SOC to return to the initial value at the end of a scheduling cycle so as to ensure that there is enough energy stored in subsequent scheduling cycles, thus ensuring the sustainability of ESS operation.

3.1.4. Unified Hybrid AC/DC Power Flow Constraint

The active and reactive power injected into each bus is equal to the power output of the utility grid or SOP minus the load, as shown in (26) and (27). Note that the utility grid usually does not transmit reactive power to the distribution network, thus, the SOP converters and SVCs are the only reactive power source in the AC distribution network.
P s , i , t = P s , i , t G + P s , i , t SOP + ( P s , i , t DG P s , i , t DG , l ) ( P s , i , t load P s , i , t load , l ) i B AC
Q s , i , t = Q s , i , t SVC + Q s , i , t SOP ( Q s , i , t load Q s , i , t load , l ) i B AC
There is no reactive power in the DC distribution network. Note that since the active power of SOP has been specified as positive when it is injected into the AC bus, the SOP will be considered a load in the DC part of the distribution network. The power balance for DC buses is shown as follows:
P s , j , t = ( P s , j , t DG P s , j , t DG , l ) + ( P dis , s , j , t ESS P ch , s , j , t ESS ) ( P s , j , t load P s , j , t load , l ) ( P s , j , t SOP + P s , j , t SOP , l ) j B DC
The distflow model is adopted in this paper to formulate a unified hybrid AC/DC power flow [24]. For the AC part, it can be expressed as follows:
P s , i , t = k : i k p s , i k , t l : l i p s , l i , t r l i l s , l i , t i B AC
Q s , i , t = k : i k q s , i k , t l : l i q s , l i , t x l i l s , l i , t i B AC
V s , i , t V s , k , t = 2 r i k p s , i k , t + x i k q s , i k , t r i k 2 + x i k 2 l s , i k , t i k L AC
p s , i k , t 2 + q s , i k , t 2 = V s , i , t l s , i k , t i k L AC
U i , min 2 V s , i , t U i , max 2 i B AC
l s , i k , t I i k , max 2 i k L AC
In the DC part, the power flow model can be simplified by ignoring the reactive power:
P s , j , t = k : j k p s , j k , t l : l j p s , l j , t r l j l s , l j , t j B DC
V s , j , t V s , k , t = 2 r j k p s , j k , t r j k 2 l s , j k , t j k L DC
p s , j k , t 2 = V s , j , t l s , j k , t j k L DC
U j , min 2 V s , j , t U j , max 2 j B DC
l s , j k , t I j k , max 2 j k L DC

3.1.5. Feasible Constraints of Decision Variables

The feasible region of the decision variables, such as P s , i , t G , P s , i , t DG , l , P s , i , t load , l , and Q s , i , t SVC , are shown as follows:
0 P s , i , t G P i , max G
0 P s , i , t DG , l P s , i , t DG
0 P s , i , t load , l P s , i , t load
Q i , max SVC Q s , i , t SVC Q i , max SVC

3.2. Kullback–Leibler Divergence Ambiguity Set for Scenario Probabilities

In the day-ahead dispatching stage, the uncertainty of the AC/DC hybrid distribution network mainly comes from the fluctuation of distributed renewable energy and random load. In fact, there are often some “typical scenarios” in the actual operation of the power distribution system. Therefore, the operation scenarios can be clustered into a few “typical scenarios” to reduce the difficulty of solving the model on the premise of ensuring the accuracy of the model results. Therefore, this paper introduces a KL divergence-based distributionally robust chance-constrained approach that addresses those random fluctuations.
The empirical distribution of scenario probabilities is first generated based on historical data of DG outputs and load demands. Assuming that the decision-maker has collected hourly history data in M days and those data can be clustered into | S | scenarios, each scenario has a total of M 1 , M 2 , , M | S | samples. Then, the empirical probability of the scenario is p s 0 = 365 M s / M , s = 1 , 2 , , | S | .
However, the empirical distribution of the scenarios established above is obviously inaccurate, and the operation scheme may change greatly with the change of scenario occurrence probabilities. Thus, the DRCC model proposed in this paper treats the scenario probabilities as the uncertain variable. It seeks to find the “worst” scenario probability distribution that minimizes the total flexibility of the distribution network around the empirical distribution, i.e., in the ambiguity set.
The construction of the ambiguity set requires defining the distance between two probability distributions. Considering that the scenario probability distribution is discrete, we use KL divergence d KL to quantify the distance from P 0 to another PDF P. The d KL of discrete probability distribution can be defined by:
d KL ( P | | P 0 ) = s S p s ln p s p s 0
The ambiguity set based on KL divergence is as follows:
ψ = { P | d KL ( P | | P 0 ) d }
where ψ is the ambiguity set for scenario probability distribution; d is the threshold decided by the decision-maker. A larger d indicates a stronger ability of the distribution network to handle uncertainties while also resulting in more conservative decision-making outcomes. To balance the conservatism of decisions with economic efficiency, the following selection method can be adopted [25]:
d = 1 2 M χ | S | 1 , α * 2
where χ | S | 1 , α * represents the upper α * -quantile of a chi-square distribution with | S | 1 freedom degrees, ensuring that the accurate distribution is included within the ambiguity set ψ with a probability of no less than α * .

3.3. DRCC Optimization Model

Based on the deterministic model and the ambiguity set, the distributionally robust chance-constrained model for the AC/DC hybrid distribution network is presented in (47).
max ( 15 ) s . t . ( 16 ) ( 43 ) inf P ψ Pr D load , l R load , l , D DG , l R DG , l 1 α
The last line in (47) is the distributionally robust chance-constrain, which means that the probability of violating the load shedding constraint and the DG curtailment constraint does not exceed α . In (47), Pr { } stands for the probability under PDF P; R load , l and R DG , l represent the annual upper limits for load shedding and DG curtailment, respectively; D load , l and D DG , l represent the actual annual load shedding and DG curtailment, which can be calculated using the following equations:
D load , l = 365 s S t = 1 T i B AC B DC p s P s , i , t load , l
D DG , l = 365 s S t = 1 T i B AC B DC p s P s , i , t DG , l

4. Solution Method

In the DRCC model established in the previous section, the minimize function in the objective function, the complex nonlinear constraints, and the distributionally robust chance-constraint greatly increase the difficulty of solving the model. Therefore, the following method is developed to solve the DRCC model in this section, as shown in Figure 3.
Firstly, the minimize function in the objective function is linearized by the big- M method. Note that giving P s , i , t load and P s , i , t DG in scenario s, F s , t demand , up and F s , t demand , down shown in (1) and (2) are determinate. Thus, the big- M method is only used to linearize (6)–(9). The linearization method for (6) is given below, and the same approach applies to the other equations:
M ( 1 z s , i , t G , up , 1 ) F s , i , t G , up ( P i , max G P s , i , t G ) M ( 1 z s , i , t G , up , 1 )
M ( 1 z s , i , t G , up , 2 ) F s , i , t G , up R up Δ T M ( 1 z s , i , t G , up , 2 )
( P i , max G P s , i , t G ) R up Δ T M ( 1 z s , i , t G , up , 1 )
( P i , max G P s , i , t G ) R up Δ T M ( 1 z s , i , t G , up , 2 )
z s , i , t G , up , 1 + z s , i , t G , up , 2 = 1 , z s , i , t G , up , 1 , z s , i , t G , up , 2 { 0 , 1 }
where M is a coefficient of the big- M method; z s , i , t G , up , 1 and z s , i , t G , up , 2 are auxiliary binary variables.
Additionally, performing second-order cone relaxation on the constraints shown in (16), (18) and (29) yields the following second-order cone constraints:
[ P s , j , t SOP Q s , j , t SOP ] T 2 P s , j , t SOP , loss P s , j , t SOP , loss ( 1 η SOP ) ( 1 η SOP )
[ P s , j , t SOP Q s , j , t SOP ] T 2 S j SOP
[ 2 p s , i k , t 2 q s , i k , t V s , i , t l s , i k , t ] T 2 V s , i , t + l s , i k , t
In addition, the distributionally robust chance-constraint aims to estimate the probability in an ambiguity set containing infinite distribution functions (see (45)), which causes great inconvenience in solving the problem. However, when the ambiguity set is defined by KL divergence, it can be proved that the distributionally robust chance-constraint is equivalent to the following traditional chance-constraints [26]:
Pr 0 D load , l R load , l 1 α +
Pr 0 D DG , l R DG , l 1 α +
α + = max 0 , 1 inf x ( 0 , 1 ) e d x 1 α 1 x 1
where α + is the revised threshold and x is the auxiliary variable. Obviously, when α is given, α + can be solved easily since ( e d x 1 α 1 ) / ( x 1 ) is convex for x ( 0 , 1 ) .
However, the chance-constraints shown in (58) and (59) are still non-convex. In this paper, SAA is used to transform chance-constraints into deterministic constraints [27]. (58) and (59) are equivalent to the following chance-constraints:
E P 0 I + ( D load , l R load , l ) = Pr 0 ( D load , l R load , l ) > 0 α +
E P 0 I + ( D DG , l R DG , l ) = Pr 0 ( D DG , l R DG , l ) > 0 α +
where E P 0 ( ) is the expectation under PDF P 0 , and I + ( x ) is the indicator function:
I + ( x ) = 1 x > 0 0 x 0
Then, those constraints can be further transferred into the following deterministic constraints:
s S p s I + ( D s load , l R load , l ) α +
s S p s I + ( D s DG , l R DG , l ) α +
By introducing the auxiliary variable ϕ s load and ϕ s DG , it can be further converted to the following linear form:
D s load , l R load , l + ϕ s load M , s S p s ϕ s load α + , ϕ s load { 0 , 1 }
D s DG , l R DG , l + ϕ s DG M , s S p s ϕ s DG α + , ϕ s DG { 0 , 1 }
Now the DRCC model shown in (47) has been converted into a mixed integer second-order cone programming (MISOCP) problem, which can be solved by solvers like Gurobi efficiently. Note that the reactive power regulation capability of SOP and the bus voltage are considered in this paper. Therefore, the second-order cone relaxation is necessary to ensure the solution accuracy instead of linearization. In addition, the second-order cone model is convex, which can be solved by solvers; the solving efficiency can meet the needs of day-ahead scheduling in real-world systems.

5. Case Study

5.1. Case Settings

In this paper, the AC/DC hybrid distribution network shown in Figure 4 is used to verify the proposed model and algorithm. The AC part is modified by adding PV and SVCs to the IEEE-33 system, and the DC part consists of eight DC buses and seven DC branches. Detailed data of the AC part can be found in [28]. To simulate the condition of a heavily loaded feeder, the active power at buses #26 to #33 has been increased to 1.5 times its original value, while the load at other buses remains consistent with that in the IEEE-33 system. The main parameters of each device in the test system are shown in Table 1. The PV output and load power data in the test system are obtained from the literature [29] and are clustered by the K-means algorithm. The contact switch, which is used to transfer loads in different feeders, is not considered in this case because it is generally open in normal scenarios.
The base value of power is 1 MW, and the base value of voltage is 12.66 kV. In the following, physical quantities such as voltage, current, and power are expressed in per unit (p.u.) values (except where specifically noted as rated unit values).
To have a comprehensive comparison, the following cases are considered, with each case corresponding to a specific flexibility device.
case 1: AC distribution networks only with PV.
case 2: AC/DC hybrid distribution network with only PVs, i.e., AC part without SVCs and DC part without ESS.
case 3: Propose test system.

5.2. Results and Analysis

With an interval of 1 h, i.e., Δ T = 1 h , we apply the proposed DRCC model to the above cases to solve the optimal operation schemes. The flexibility indicators of each case are shown in Table 2. Note that all indicators in Table 2 are weighted average results based on the probability of scenarios.
As shown in Table 2, operation flexibility for case 1, where the distribution network is not equipped with any flexibility devices, overall ranked last. Note that the reason why I FSD in case 1 is higher than that in case 2 is that case 1 only considers the AC distribution network, which has fewer buses; thus the flexibility demand is much lower. However, the flexibility supply F supply , up + F supply , down in case 1 and case 2 is actually similar, i.e., 214.36 vs. 218.09. The test system presented in case 3 has the most abundant flexibility resources and the best scores. The optimal operation results of different cases in supply–demand balance flexibility, bus flexibility, and branch flexibility are as follows.

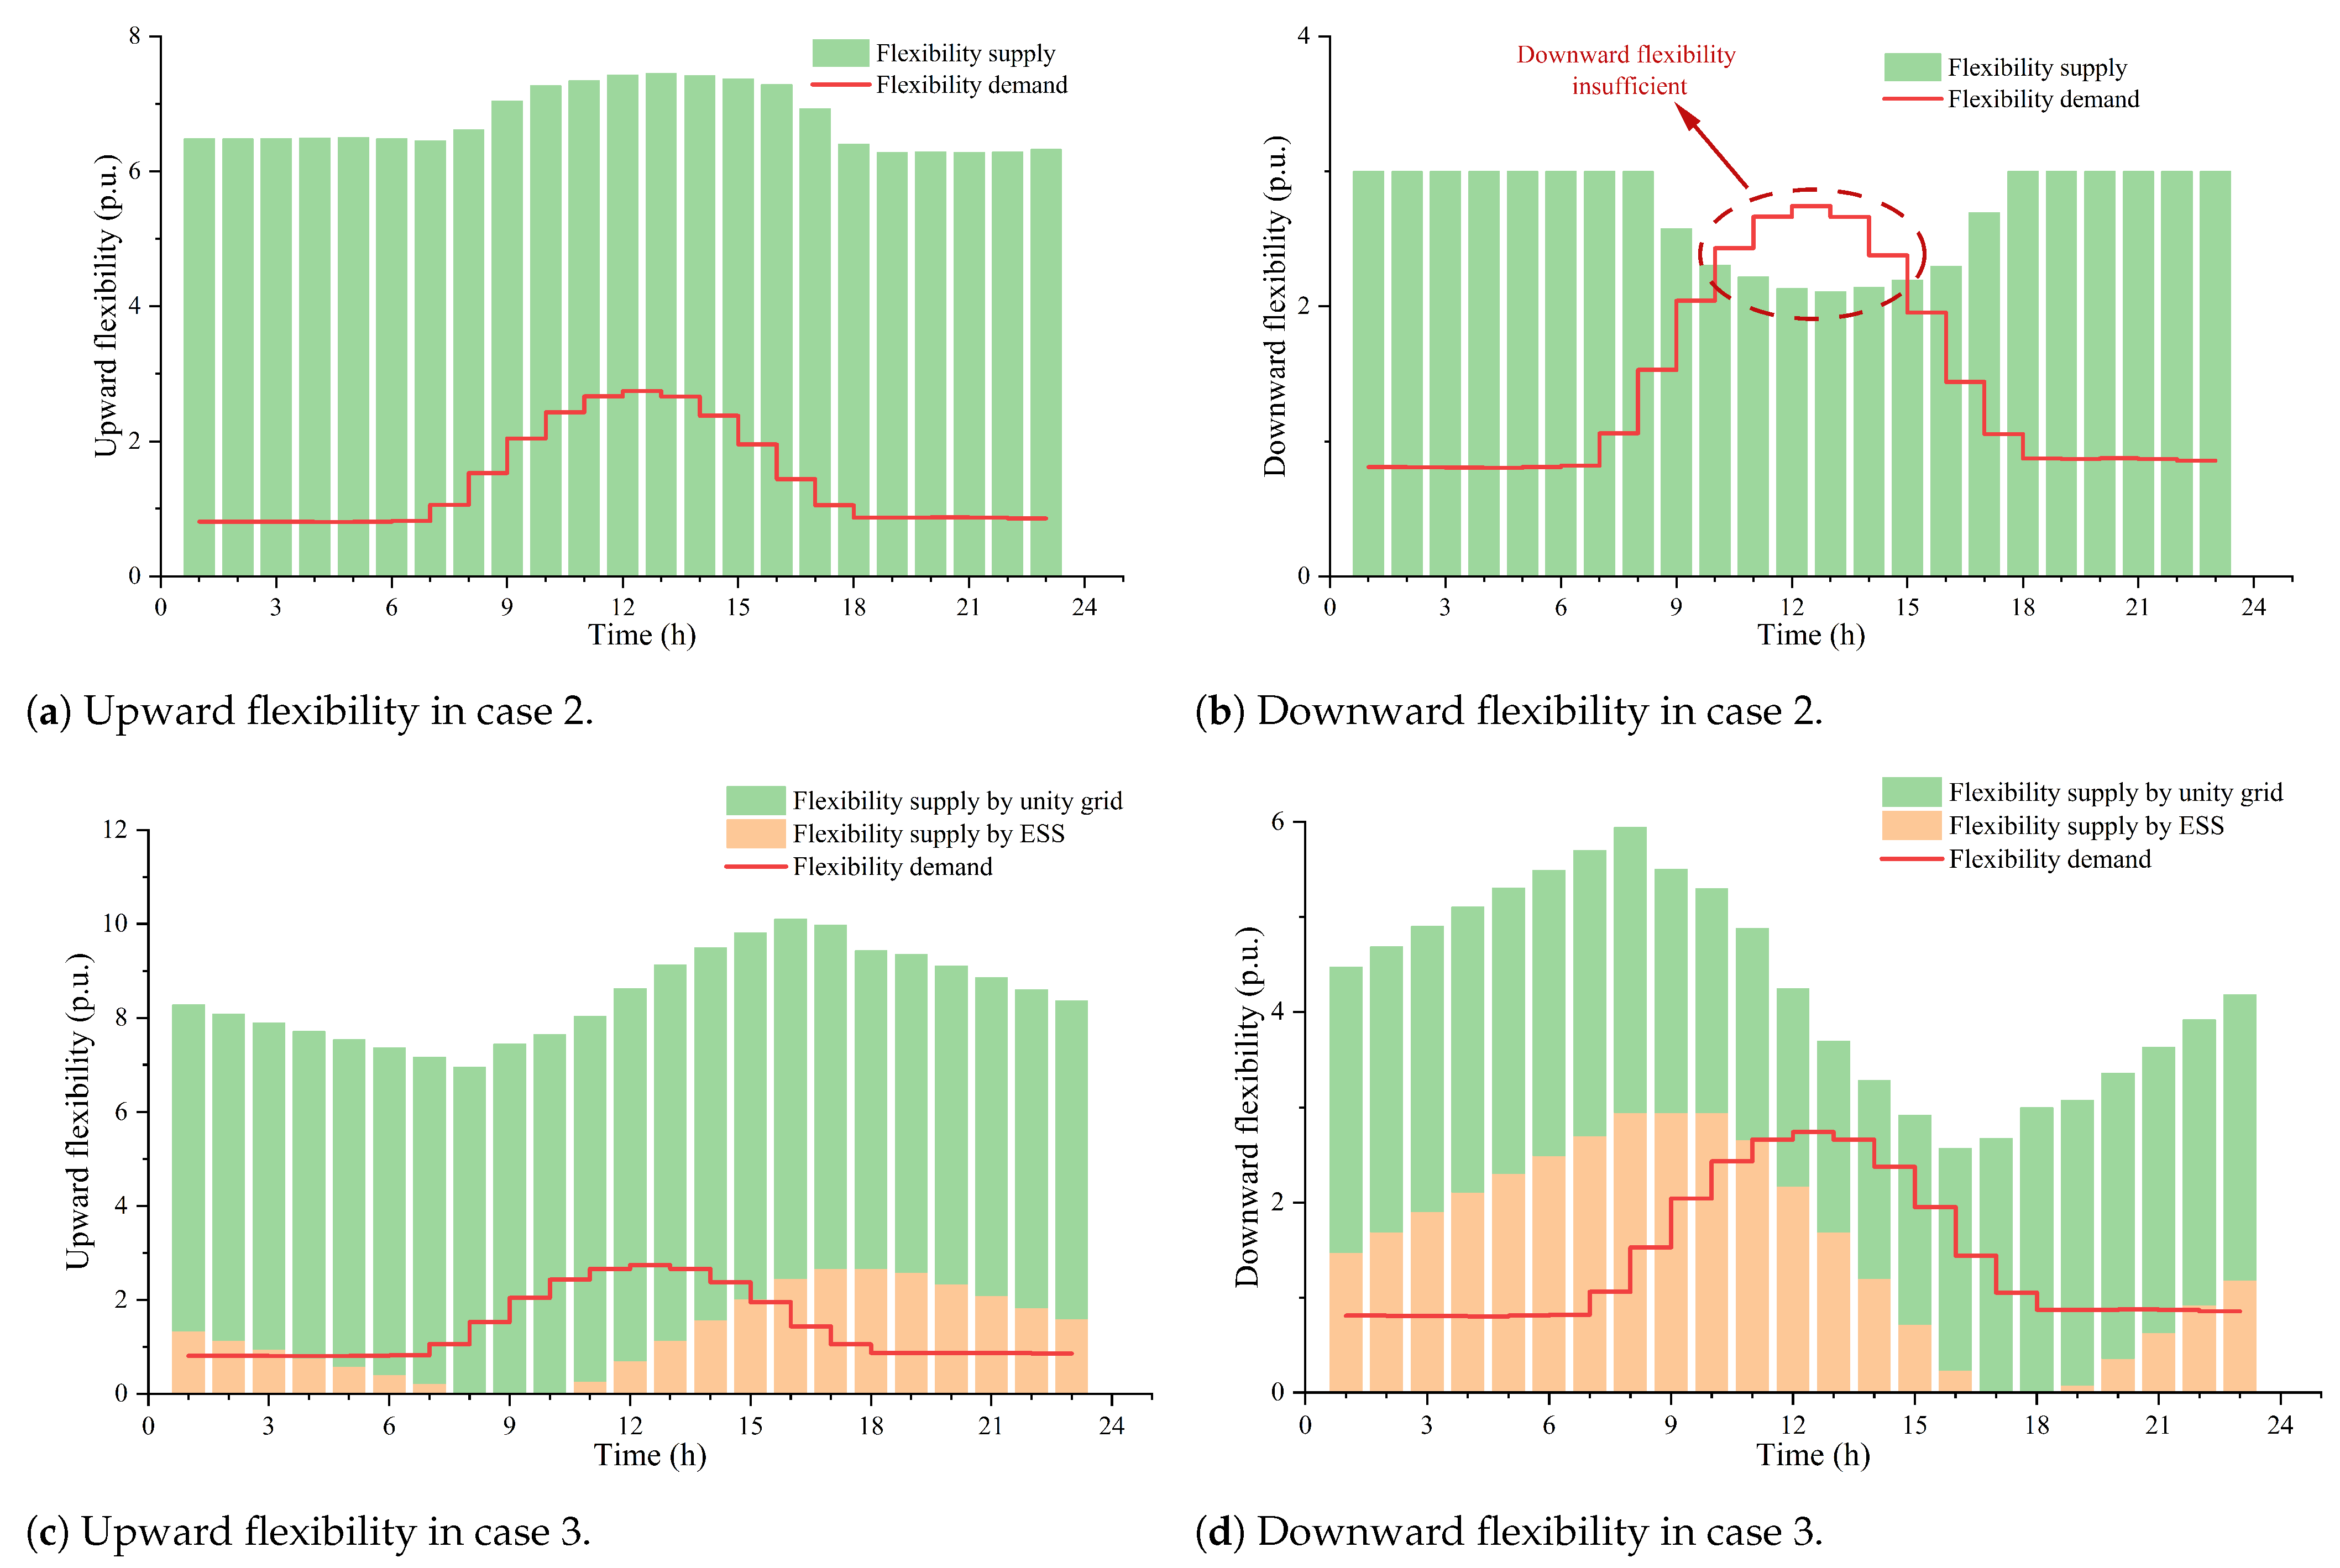
5.2.1. Flexibility of Supply-Demand Balance

Table 2 shows that the flexibility of the supply–demand balance in case 3 improves significantly compared to in case 1 and case 2. This improvement is primarily attributed to the ESS balancing the supply–demand matching temporarily and the SOP enabling the sharing of the ESS across multiple feeders spatially.
Figure 5 shows the flexibility supply and demand at each moment in case 2 and case 3. At 10:00–15:00, due to the substantial increase in PV output, the demand for downward flexibility in AC/DC hybrid distribution networks increases. In case 2, downward flexibility can only be provided by reducing the transmission power of the unity grid, and the demand for downward flexibility cannot be met at those moments, inevitably leading to PV curtailment. In fact, the operation results also show that case 2 requires an average of 2.248 MWh of PV curtailment per day.
In contrast, as a bidirectional regulation resource, ESS can provide the system with bidirectional up/down flexibility. Therefore, in case 3, which is equipped with ESS, flexibility, especially downward flexibility, is significantly improved. By adjusting the charge and discharge strategy, ESS makes up for the mismatch between the peak of PV output and the peak of load demand in time, thus effectively promoting the absorption of PV. In addition, SOPs also further promote the sharing of ESS between different feeders in the grid. Specifically, in case 3, PVs are installed at different buses of the AC/DC distribution network, including both AC and DC buses. By sharing ESS via SOPs, the centralized ESS installed at a single DC bus can effectively absorb the PV output of the entire system.

5.2.2. Bus Flexibility

Figure 6 illustrates the average voltage profiles across various cases. In all cases, the distribution network in case 1 is not equipped with any flexibility devices and lacks voltage regulation measures, resulting in the lowest voltage levels. Conversely, in case 2, the introduction of SOPs for reactive power regulation significantly improves the voltage levels at the buses of the AC distribution network, particularly at the buses at the end of the feeders (e.g., buses #16, #17, and #18).
In case 3, reactive power released by SOPs and SVCs is shown in Figure 7. The voltages of all buses in case 3 are maintained around 1 p.u., i.e., the most favorable voltage, which demonstrates that the SOPs and SVCs play an important role in improving bus voltage flexibility, contributing significantly to reactive power regulation. While in the DC distribution network, due to the presence of ESS for further power regulation, the DC bus voltage in case 3 exhibits a slight increase. Based on the results obtained, in AC/DC hybrid distribution networks experiencing voltage fluctuations, which may be caused by random sources and loads, the flexible operation of SVCs and SOPs emerges as an effective solution to address overvoltage and undervoltage issues.
Note that the reactive power injected into bus #22 by the SOP converter is nearly zero; thus, the green part is almost invisible in Figure 7.

5.2.3. Branch Flexibility

Table 2 shows that I branch mean and I branch var in case 2 and case 3 are lower than in case 1, which means SOP-based AC/DC hybrid grid have higher flexibility to balance the load between branches. This improvement is due to the involvement of SOPs, which allow current and active power to be integrated between AC feeders and AC/DC networks.
Figure 8 illustrates the branch load rate of the heavy load feeder from bus #26 to #33 in different cases. The load rate of the heavy load feeder in the SOP-based AC/DC hybrid grid in case 2 and case 3 is about 40% lower than in the AC distribution network in case 1. This shows that SOPs play a key role in dispersing the current and reducing the branch load rate of the heavy load feeder. In addition, the load rate of the feeder #26–#33 in case 1 fluctuates significantly over time, and there is an obvious load peak in 10:00–15:00, which brings certain challenges to the safe and stable operation of the distribution network. In contrast, the load rate in case 2 and case 3 fluctuates less over the course of a day, while load peaks are effectively smoothed out. These results indicate that the SOP can effectively solve the problem of temporal and spatial imbalance of branch load rate, and the AC/DC hybrid distribution network has better branch flexibility to cope with feeder overload and load fluctuations.

6. Conclusions

In this paper, methods to improve the flexibility of AC/DC hybrid distribution networks are proposed and a comprehensive evaluation method for operational flexibility assessment is also established. Then, a flexibility-oriented optimization model for AC/DC hybrid distribution network operation based on the DRCC method is further proposed. The case study results justify the following conclusions: 1. The ESS can offer bidirectional flexibility, both upward and downward, facilitating the balance between flexibility supply and demand in the system, thereby promoting the integration of renewable energy. 2. SOPs and SVCs play a crucial role in adaptive reactive power regulation, effectively improving node voltage, particularly at the end of feeders, thus better meeting users’ demands for power quality. 3. In the SOP-based AC/DC hybrid distribution network, SOP transfers active power from lightly loaded lines to heavily loaded lines, effectively balancing the load rates of different lines, thereby improving line flexibility. Based on these conclusions, the optimal operation strategies, such as the charging and discharging strategy for ESS and the exchange power for SOP, will be recommended to the distribution network dispatching center in real-world systems to improve operational flexibility.
On this basis, it would be far more significant to further study the optimal allocation of incremental resources to improve the flexibility of AC/DC hybrid distribution networks and even larger regional distribution networks.

Author Contributions

Conceptualization, Y.C. and Q.L.; methodology, Y.C. and Q.L.; software, K.Z.; validation, Y.C., Q.L. and K.Z.; formal analysis, Y.C. and Q.L.; investigation, Y.C.; resources, P.X.; data curation, P.X.; writing—original draft preparation, Y.C.; writing—review and editing, Y.Y. and P.X.; visualization, K.Z.; supervision, Y.Y. and P.X.; project administration, Y.Y.; funding acquisition, Y.Y. All authors have read and agreed to the published version of the manuscript.

Funding

This work is supported by the Science and Technology Project of China Southern Power Grid Corporation. (Project No. 036000KK52220025 (GDKJXM20220329)).

Data Availability Statement

Data are contained within the article.

Acknowledgments

We would like to express our gratitude to all the reviewers for providing valuable feedback.

Conflicts of Interest

All authors were employed by the Power Dispatching and Control Center of Guangdong Power Grid Co., Ltd. The authors declare that the research was conducted in the absence of any commercial or financial relationships that could be construed as a potential conflict of interest. The authors declare that this study received funding from the Science and Technology Project of China Southern Power Grid Corporation. (Project No. 036000KK52220025 (GDKJXM20220329)). The funder was not involved in the study design, collection, analysis, interpretation of data, the writing of this article or the decision to submit it for publication.

Abbreviations and Nomenclature

Abbreviations
DRCC                    Distributionally robust chance-constrained
DGDistributed generator
PVPhotovoltaic
SOPSoft open point
ESSEnergy storage system
SAASample average approximation
MISOCPMixed integer second-order cone programming
Sets and Indices
B AC , B DC Sets of all the buses in the AC and DC part of the network
L AC , L DC Sets of lines in the AC and DC part of the network
S Set of scenarios
sIndex of scenarios
tIndex of time
Parameters
TTotal number of time slots in a scheduling day
Δ T Time interval
P s , t nl Net-load of the distribution network
P s , i , t load Load demand of bus i
P s , i , t DG DG output of bus i
P i , max G Maximum power from utility grid at AC bus i
R up , R down Upward and downward ramping ratios of utility grid
P j ESS , E j ESS Power and capacity of the ESS at DC bus j
E min SOC , E max SOC Minimum and maximum SOC of ESSs
η ESS , η SOP Efficiency of ESSs and SOPs
S j SOP Capacity of SOP converter at bus j
μ SOP Reactive power limitation coefficient of SOPs
l i k , max Upper limit of the current amplitude on line i k
U i , min , U i , max Lower and upper limit of voltage magnitude
r i k , x i k Resistance and reactance of branch i k
Q i , max SVC Maximum reactive power that an SVC can release or absorb
Variables
F s , t demand , up Upward flexibility demand
F s , t demand , down Downward flexibility demand
F s , t source , up Upward flexibility supply
F s , t source , down Downward flexibility supply
F s , t G , up , F s , t G , down Upward and downward flexibility supply by utility grid
F s , t ESS , up , F s , t ESS , down Upward and downward flexibility supply by ESS
p s Probability of the scenario
P s , i , t G Active power supplied by the utility grid
P ch , s , j , t ESS , P dis , s , j , t ESS Charge and discharge power of the ESS
B ch , s , j , t ESS , B dis , s , j , t ESS Binary variables indicating whether ESS is charging (discharging) or not;
B ch , s , j , t ESS = 1 ( B dis , s , j , t ESS = 1 ) if ESS is charging (discharging)
ξ s , j , t S O C State of charge of the ESS
P s , j , t SOP , Q s , j , t SOP Active and reactive power of the SOP converter injected into the AC network
at bus j
P s , j , t SOP , l Active power loss of the SOP converter
P s , j , t DG , l , P s , j , t load , l Shut power of DG and load
P s , m n , t line , l Line loss on branch m n
V s , i , t Square of the voltage amplitude on bus i
l s , i k , t Square of the current amplitude on line i k
p s , i k , t , q s , i k , t Active and reactive power flowing from bus i to k on branch i k

References

  1. Hassan, S.J.U.; Mehdi, A.; Haider, Z.; Song, J.S.; Abraham, A.D.; Shin, G.S.; Kim, C.H. Towards medium voltage hybrid AC/DC distribution Systems: Architectural Topologies, planning and operation. Int. J. Electr. Power Energy Syst. 2024, 159, 110003. [Google Scholar] [CrossRef]
  2. Charadi, S.; Chaibi, Y.; Redouane, A.; Allouhi, A.; El Hasnaoui, A.; Mahmoudi, H. Efficiency and energy-loss analysis for hybrid AC/DC distribution systems and microgrids: A review. Int. Trans. Electr. Energy Syst. 2021, 31, e13203. [Google Scholar] [CrossRef]
  3. Javid, Z.; Kocar, I.; Holderbaum, W.; Karaagac, U. Future distribution networks: A review. Energies 2024, 17, 1822. [Google Scholar] [CrossRef]
  4. Li, S.; Li, Z.; Shahidehpour, M.; Huang, W.; Zheng, J.H. Dispatchable region for distributed renewable energy generation in reconfigurable AC-DC distribution networks with soft open points. Appl. Energy 2024, 371, 123704. [Google Scholar] [CrossRef]
  5. Qi, C.; Wang, K.; Fu, Y.; Li, G.; Han, B.; Huang, R.; Pu, T. A decentralized optimal operation of AC/DC hybrid distribution grids. IEEE Trans. Smart Grid 2018, 9, 6095–6105. [Google Scholar] [CrossRef]
  6. Peng, Q.; Qu, L.; Yuan, Z.; Wang, X.; Chen, Y.; Tian, B. Optimal scheduling strategy of AC/DC hybrid distribution network based on power electronic transformer. Energies 2021, 14, 3219. [Google Scholar] [CrossRef]
  7. Qian, T.; Ming, W.; Shao, C.; Hu, Q.; Wang, X.; Wu, J.; Wu, Z. An edge intelligence-based framework for online scheduling of soft open points with energy storage. IEEE Trans. Smart Grid 2024, 15, 2934–2945. [Google Scholar] [CrossRef]
  8. Gholami, K.; Azizivahed, A.; Arefi, A.; Rahman, M.M.; Islam, M.R.; Li, L.; Arif, M.T.; Haque, M.E. Hybrid uncertainty approach for management of energy storage-embedded soft open points in distribution grids. J. Energy Storage 2024, 87, 111394. [Google Scholar] [CrossRef]
  9. Chen, L.; Zhang, N.; Yang, X.; Pei, W.; Zhao, Z.; Zhu, Y.; Xiao, H. Synergetic optimization operation method for distribution network based on SOP and PV. Glob. Energy Interconnect. 2024, 7, 130–141. [Google Scholar] [CrossRef]
  10. Li, J.; Ge, S.; Zhang, S.; Xu, Z.; Wang, L.; Wang, C.; Liu, H. A multi-objective stochastic-information gap decision model for soft open points planning considering power fluctuation and growth uncertainty. Appl. Energy 2022, 317, 119141. [Google Scholar] [CrossRef]
  11. Esmail, E.M.; Elkalashy, N.I.; Kawady, T.A.; Taalab, A.M.; Elsadd, M.A. Modified autonomous fault management strategy for enhancing distribution network reliability. Electr. Eng. 2022, 104, 233–248. [Google Scholar] [CrossRef]
  12. Pan, H.; Ding, M.; Chen, A.; Bi, R.; Sun, L.; Shi, S. Research on distributed power capacity and site optimization planning of AC/DC hybrid micrograms considering line factors. Energies 2018, 11, 1930. [Google Scholar] [CrossRef]
  13. Ghadiri, A.; Haghifam, M.R.; Larimi, S.M.M. Comprehensive approach for hybrid AC/DC distribution network planning using genetic algorithm. IET Gener. Transm. Distrib. 2017, 11, 3892–3902. [Google Scholar] [CrossRef]
  14. Elkholy, M.H.; Yona, A.; Ueda, S.; Said, T.; Senjyu, T.; Lotfy, M.E. Experimental Investigation of AI-Enhanced FPGA-Based Optimal Management and Control of an Isolated Microgrid. IEEE Trans. Transp. Electrif. 2024, 10, 3670–3679. [Google Scholar] [CrossRef]
  15. Zhao, W.; Zheng, J.; Han, Z.; Liu, H. Large-disturbance stability analysis method based on mixed potential function for AC/DC hybrid distribution network with PET. IET Gener. Transm. Distrib. 2020, 14, 3802–3813. [Google Scholar] [CrossRef]
  16. Zhang, L.; Chen, Y.; Shen, C.; Tang, W.; Liang, J.; Xu, B. Optimal configuration of hybrid AC/DC urban distribution networks for high penetration renewable energy. IET Gener. Transm. Distrib. 2018, 12, 4499–4506. [Google Scholar] [CrossRef]
  17. Meng, W.; Song, D.; Huang, L.; Chen, X.; Yang, J.; Dong, M.; Talaat, M.; Elkholy, M.H. Distributed energy management of electric vehicle charging stations based on hierarchical pricing mechanism and aggregate feasible regions. Energy 2024, 291, 130332. [Google Scholar] [CrossRef]
  18. Zhao, J.; Qu, J.; Ji, H.; Xu, J.; Hasanien, H.M.; Turky, R.A.; Li, P. Robust operation of flexible distribution network with large-scale EV charging loads. IEEE Trans. Transp. Electrif. 2024, 10, 2207–2219. [Google Scholar] [CrossRef]
  19. Liu, J.; Weng, X.; Bao, M.; Lu, S.; He, C. Active distribution network expansion planning based on Wasserstein distance and dual relaxation. Energies 2024, 17, 3005. [Google Scholar] [CrossRef]
  20. Zare, A.; Chung, C.Y.; Zhan, J.; Faried, S.O. A distributionally robust chance-constrained MILP model for multistage distribution system planning with uncertain renewables and loads. IEEE Trans. Power Syst. 2018, 33, 5248–5262. [Google Scholar] [CrossRef]
  21. Babaei, S.; Jiang, R.; Zhao, C. Distributionally Robust Distribution Network Configuration Under Random Contingency. IEEE Trans. Power Syst. 2020, 35, 3332–3341. [Google Scholar] [CrossRef]
  22. Gao, H.; Li, Y.; He, S.; Tang, Z.; Liu, J. Distributionally robust planning for power distribution network considering multi-energy station enabled integrated demand response. Energy 2024, 306, 132460. [Google Scholar] [CrossRef]
  23. Han, J.P.; Liu, N.; Catalao, J.P.S. Optimization of distribution network and mobile network with interactive balance of flexibility and power. IEEE Trans. Power Syst. 2023, 38, 2512–2524. [Google Scholar] [CrossRef]
  24. Wu, X.; Wang, Z.; Ding, T.; Li, Z. Hybrid AC/DC microgrid planning with optimal placement of DC feeders. Energies 2019, 12, 1751. [Google Scholar] [CrossRef]
  25. Chen, Y.; Guo, Q.; Sun, H.; Li, Z.; Wu, W.; Li, Z. A distributionally robust optimization model for unit commitment based on Kullback-Leibler divergence. IEEE Trans. Power Syst. 2018, 33, 5147–5160. [Google Scholar] [CrossRef]
  26. Jiang, R.; Guan, Y. Data-driven chance constrained stochastic program. Math. Program. 2016, 158, 291–327. [Google Scholar] [CrossRef]
  27. Yang, L.; Cao, Y.; Wei, W.; Chen, L.; Mei, S. Configuration method of energy storage for wind farms considering wind power uncertainty and wind curtailment constraint. Autom. Electr. Power Syst. 2020, 44, 45–52. [Google Scholar]
  28. Baran, M.; Wu, F. Network reconfiguration in distribution-systems for loss reduction and load balancing. IEEE Trans. Power Deliv. 1989, 4, 1401–1407. [Google Scholar] [CrossRef]
  29. Zhuo, Z.; Zhang, N.; Yang, J.; Kang, C.; Smith, C.; O’Malley, M.J.; Kroposki, B. Transmission expansion planning test system for AC/DC Hybrid grid with high variable renewable energy penetration. IEEE Trans. Power Syst. 2020, 35, 2597–2608. [Google Scholar] [CrossRef]
Figure 1. Configuration of a typical AC/DC hybrid distribution network.
Energies 17 04902 g001
Figure 2. Framework of improving flexibility of AC/DC distribution network.
Energies 17 04902 g002
Figure 3. Flow chart of solution method for DRCC model.
Energies 17 04902 g003
Figure 4. Structure of the test system.
Energies 17 04902 g004
Figure 5. Comparison of flexibility supply–demand balance in case 2 and case 3. (a) Upward flexibility in case 2. (b) Downward flexibility in case 2. (c) Upward flexibility in case 3. (d) Downward flexibility in case 3.
Energies 17 04902 g005
Figure 6. Average voltage profiles across various cases.
Energies 17 04902 g006
Figure 7. Reactive power released by SOPs and SVCs in case 3.
Energies 17 04902 g007
Figure 8. Load rate of heavy load feeder (#26–#33) in each case.
Energies 17 04902 g008
Table 1. Main parameters of the test system.
DeviceLocationCapacity/Resistance
Utility grid transformer 1#110 MW
AC PV#8 0.5 MW
SVCs#13, #30 0.1 0.3 MVar , 0.1 0.3 MVar
DC PVs#34, #36 0.8 MW, 1 MW
ESS 2#402 MW/4 MWh
SOPs 3#18, #22, #331 MW, 1 MW, 1 MW
DC loads#35, #37, #38, #39, #4130 kW, 20 kW, 60 kW, 40 kW, 20 kW
DC branches#34–#35, #35–#41, #36–#37, #37–#38, #38–#39, #39–#40, #40–#41 0.0922 Ω , 0.493 Ω , 0.366 Ω , 0.3811 Ω , 0.3811 Ω , 0.819 Ω , 0.1872 Ω , 0.7114 Ω
1  R up = 2 MW / h , R down = 3 MW / h , 2  η ESS = 0.95 , ξ s , j , 1 SOE = 0.5 , ξ min SOC = 0.15 , ξ max SOC = 0.85 , 3  μ SOP = 0.6 , η SOP = 0.98 .
Table 2. Flexibility indicators for each case.
Case No. I FSD I bus V I branch mean I branch var
case 17.126 1.449 × 10 3 0.1549 1.475 × 10 2
case 26.424 5.554 × 10 4 0.1253 1.101 × 10 2
case 39.539 8.024 × 10 5 0.1236 8.446 × 10 3
Disclaimer/Publisher’s Note: The statements, opinions and data contained in all publications are solely those of the individual author(s) and contributor(s) and not of MDPI and/or the editor(s). MDPI and/or the editor(s) disclaim responsibility for any injury to people or property resulting from any ideas, methods, instructions or products referred to in the content.

