Abstract
Enhancing the production of energy from renewable energy sources (RES) has been a consistently important issue for many years, both in Poland and other countries around the world. Selecting sites for devices that convert renewable energy into electricity requires various spatial data, especially during the initial design stage when optimal investment locations are identified. The article presents a new method for assessing the usefulness of publicly accessible Polish geodetic databases—the Topographic Objects Database (Polish name: BDOT10k) and the Digital Elevation Model (DEM, Polish name: NMT)–in the process of renewable energy infrastructure siting. This study is the first to jointly assess these two databases from the user’s perspective rather than the creator’s or administrator’s viewpoint. User requirements for spatial data were defined through research factors identified in a literature review. The methodology developed includes checking the availability of Polish geodetic databases and evaluating the quality of spatial data. Analyses were performed in a GIS environment for eighteen research areas in Poland. A suitability coefficient was developed to determine the usefulness of the databases studied. The obtained value of the suitability coefficient in each area was above 50% of its maximum value, which was taken as a threshold value proving the suitability of the analyzed databases for the purpose specified in the study. The databases are fully useful for a group of province and poviat capital cities—there the suitability coefficient value exceeds 80% of its maximum value. The studies confirmed the validity of using publicly accessible BDOT10k and DEM geodetic databases in GIS analyses for the search for sites for solar, wind, and small hydroelectric power plants.
1. Introduction
The limited availability of resources, climate change, the threat of a global energy crisis, and the current geopolitical situation underscore the pressing need to advance energy production from renewable sources [1,2]. Renewable energy sources (RES), especially those harnessing natural forces (wind, hydro, solar, and geothermal energy), possess significant potential to fulfil energy demands. Their resources are virtually inexhaustible. This study focuses on three renewable energy sources: solar, wind, and hydro energy. Geothermal energy was excluded due to its minimal contribution to Poland’s energy production. In 2023, according to data published by the Energy Market Agency [3], coal accounted for 39.7%, lignite for 21.3%, and wind for 16% of total electricity production in Poland. In total, energy produced from RES during this time accounted for 25.9% of the total. Between 2018 and 2022, electricity production from renewable energy sources exhibited an upward trend, primarily driven by increased wind energy production and the rapid growth of photovoltaics. The most significant declines in electricity production were observed in the use of hydro energy [4].
1.1. Siting Criteria and Factors Relevant to RES Investments
The location of devices that convert renewable wind, solar, and water energy into electricity requires various spatial data, especially at the initial design stage, where the best investment locations are identified. The availability of renewable energy resources varies significantly across different regions, both in Poland and globally [2,5,6,7,8,9]. A literature review indicates that GIS 3.19 tools and software are frequently used in multi-criteria analyses to determine suitable areas for locating devices for all three types of RES [10,11,12,13,14]. Paper [15] assesses the suitability of areas for siting wind and solar farms in the southern England region, while criteria were typed for both types of RES together. However, typically, researchers focus on one type of renewable energy at a time, such as wind energy [13,14,16,17,18,19,20,21,22], solar energy [10,11,12,23,24,25], and hydro energy [9,26,27,28,29]. Modern requirements for RES investments emphasize not only selecting locations with abundant renewable energy resources but also the rational and optimal use of space [30]. It is crucial to implement investments in harmony with the landscape and natural environment [12]. The economic aspects of the entire project and the identification of factors that can increase investment costs during the early design stages are also very important [19,27,28]. The literature analysis found no single list of criteria for site selection. Each publication adopted different sets of features, definitions, and importance-weights (Appendix A). The selection of siting-relevant criteria and factors varies across the world [9] as does the spatial data used for analysis. The resulting tables summarize the most significant criteria and factors cited in the literature as relevant to the location of solar power plants (Table 1), wind power plants (Table 2), and small hydroelectric power plants (Table 3). For small power plants, the literature analysis, as well as location criteria and factors, are extensively detailed in [31].

Table 1.
Criteria relevant to the selection of solar power plant sites, source: own study.
Table 2.
Criteria relevant to the selection of wind farm sites, source: own study.
Table 3.
Criteria relevant to the selection of small hydroelectric power plants; source: [31].
As shown in the tables above, all the reviewed GIS analyses for siting solar, wind, and hydro power plants included the following spatial data factors: slope or elevation, existing building locations, power and telecommunication network locations, land use, transportation network elements, and water network elements. These six factors were selected as the research factors in this study. Economic, social, climatic, and legal-administrative aspects were not considered, with the study concentrating solely on spatial data-related location factors.
1.2. Polish Geodetic Databases
The study focused on two geodetic databases: Topographic Objects Database at a 1:10,000 scale (BDOT10k) and Databases for aerial and satellite imagery, orthophotomap and Digital Elevation Models, specifically the part constituting the database of the Digital Elevation Model (in Polish: NMT, in English: DEM). Polish geodetic databases are part of the National Geodetic and Cartographic Resource (in Polish: PZGiK). Table 4 presents all the databases collected in the National Geodetic and Cartographic Resource. It provides the abbreviated names used in Poland and indicates whether the database is freely accessible (+) or available for a fee (−). Additionally, it specifies the authority in charge of the database in relation to the division of the National Geodetic and Cartographic Resource into central, provincial, and poviat parts [32].
Table 4.
Geodetic and Cartographic Resource databases, broken down by the authority in charge of the database and data accessibility, Source: Own study based on [32,33].
Individual geodetic databases collected in Poland have been analysed in the literature, but always from the perspective of the data producers or administrators, not the users [34,35,36,37]. Additionally, no studies have yet assessed the collective suitability of multiple geodetic databases for a specific user group. The paper attempts to evaluate the usefulness of the data in the BDOT10k and DEM geodetic databases for the preliminary stage of renewable energy infrastructure siting in Poland. The evaluation of these databases’ quality was carried out by comparing the data contained in the databases (BDOT10k and DEM) with corresponding data from reference geodetic databases Comparative analysis, as explained in [38] after [39], is an external, direct method of quality assessment, which should be performed wherever possible. It involves using additional (external) reference data to assess quality, whereas direct internal assessment relies solely on the data within the evaluated dataset.
The BDOT10k and DEM geodetic databases studied in this paper are characterized by the best accessibility, as they cover the entire country, are available online for free and for any use, and use a uniform data format nationwide. BDOT10k provides a detailed topographic objects database with a scale equivalent to 1:10,000 topographic maps. The geometry of objects for the BDOT10k is recorded with an accuracy of at least 1.5 m, and for objects with challenging field identification, the accuracy is no less than 5 m [40,41,42,43]. The database includes attributes related to the geometric accuracy of the objects. For external sources of geometric data, such as the EGiB database, the actual accuracy may be even higher. The DEM database represents terrain elevation as discrete (point-based) data, with an interpolation algorithm. It allows for the determination of height H at any X,Y point within the model’s area. The database is updated with digital elevation models that meet the accuracy parameters expressed by the root mean square error of the normal height H, calculated for control points.
The most detailed and accurate spatial data in Poland are collected in three main geodetic databases: the land and buildings register (EGiB), the utilities network (GESUT), and the topographic objects database (BDOT500) [41,42,43]. These databases are used as reference databases for many studies and less detailed databases. Most of the objects in these databases are identified based on direct field surveying. According to the standard [44], surveying must determine a point’s location relative to the nearest horizontal geodetic control points and measurement control network with a minimum accuracy of:
- 0.10 m—in the case of field details of group I (e.g., buildings, construction equipment);
- 0.30 m—in the case of field details of group II (e.g., covered construction objects);
- 0.50 m—in the case of field details of group III.
Coverage of complete object-oriented EGiB, GESUT, and BDOT500 databases in Poland is not comprehensive. In many regions of Poland, spatial data related to the thematic scope of BDOT500, GESUT, and EGiB databases are often available as vector maps, though raster data are sometimes still needed. In several poviats, the data are hybrid, meaning that while some data are digitized in the database, older data have not yet been transferred and remain in vector and/or raster format. Reference database information is provided to users as base maps (Polish name: mapa zasadnicza), understood as a large-scale cartographic work containing information about the spatial positioning of geodetic control points, cadastral parcels, buildings, land use contours, classification contours, utility networks, structures and construction devices, as well as other topographic objects, along with selected descriptive information regarding these objects [32,43]. Access to these data involves fees and requires submitting a detailed request to the data administrator, specifying the geographic area of interest. Additionally, data formats vary across the country, depending on the software used by the managing authorities.
Leveraging free and readily available data from public databases can greatly accelerate work and cut costs during early design phases. It also facilitates the identification of potentially optimal sites for renewable energy projects through the use of GIS software and analyses over larger areas.
1.3. Concept for Assessing the Suitability of BDOT10k and DEM Databases
This study introduces the concept of database suitability and attempts to identify aspects influencing it. Database suitability is intrinsically linked to the quality of data within the databases, which is referred to as external quality. As defined by [45], external quality encompasses all characteristics of a product that affect its ability to satisfy both explicit and implicit needs. According to [35], data are deemed high-quality if they are usable for operational, decision-making, and planning purposes. The data can be used as intended if they are free of defects and have the desired characteristics. Essential attributes of high-quality data include availability, completeness, consistency, accuracy, and usability. Since geodetic databases are information products, evaluating their usability—the aspect that determines how well a product meets user requirements—is essential [46]. Usability is a concept commonly applied in informatics to interactive devices, applications, and websites. According to the standard [47], usability assesses the performance, efficiency, and satisfaction derived from using a product by particular users for specific tasks under defined conditions. The figure below (Figure 1) shows the most important aspects that determine the usability of a spatial database for the user. These will include not only the quality of the data contained in the database, but also the availability and type of data (format, content) and usability in terms of user-defined factors.
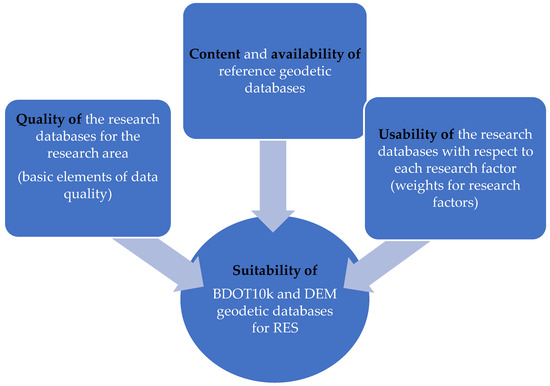
Figure 1.
Concept for assessing the suitability of BDOT10k and DEM geodetic databases for RES. Source: own study.
The traditional process for assessing spatial data quality produces separate quality outcomes for each of the five quality elements. In the present study, geodetic databases were evaluated in a manner similar to that adopted by [35,48], adhering to the standard [49]. The standard outlines five core quality assessment elements: completeness, logical consistency, positional accuracy, temporal accuracy, and thematic accuracy, along with an additional element—usability. Usability reflects how well the data meet specific user needs, an aspect not fully covered by the five quality elements. For users of spatial data, usability is crucial. The method for assessing suitability proposed in this study involves presenting the aggregated assessment score expressed as a single coefficient. A method that takes into account the aggregation of quality scores was proposed earlier by [50], who developed a data quality model for the EGIB, GESUT, and BDOT500 databases. The author suggested that data quality assessments should be based on a few clear metrics that are easy for users to understand. When assessing data quality from the user’s perspective, it is important to recognize that different quality elements have varying levels of importance. According to [48], dataset completeness is the most critical element, followed by the location accuracy and thematic accuracy. Temporal accuracy and logical consistency have a lesser impact on the overall assessment of spatial data quality.
2. Materials and Methods
2.1. Research Methodology
In the initial phase of developing the research methodology, research factors were selected and the thematic scope for the analyses was defined. The selection of factors was made possible through a literature analysis (Table 1, Table 2 and Table 3). The following table (Table 5) shows the research factors along with the thematic scope. Additionally, geodetic databases containing data relevant to each factor for the area of Poland are also indicated.
Table 5.
Research factors selected for analysis. Source: own study.
The assessment of selected elements of database quality was conducted by comparing the data from the research database with corresponding data from reference databases. Tables (Table 6, Table 7, Table 8, Table 9, Table 10 and Table 11) detail the thematic scope of the layers compared between the research and reference databases for each factor. The geometric representation of objects in geodetic databases differs based on the object type and is defined by technical standards specific to each database. The possible forms of geometric representation include point, multipoint, polyline, multiline, polygon, multipolygon. For certain objects, multiple geometric representation methods may be applicable, depending on their features.
Table 6.
The detailed thematic scope of the research factor “Land use”, source: own study based on [40,41].
Table 7.
Detailed thematic scope of the research factor “Water network”, source: own study based on [40,43].
Table 8.
Detailed thematic scope of the research factor “Land cover objects–buildings”, source: own study based on [40,41].
Table 9.
Detailed thematic scope of the research factor “Communication network”, source: own study based on [40,43].
Table 10.
Detailed thematic scope of the research factor “Utility networks”, source: own study based on [40,42].
Table 11.
Detailed thematic scope of the research factor “Terrain elevation”, source: own study based on [40,43].
The next phase of the work involved creating a method to estimate the completeness of data within the BDOT10k database. It was determined that completeness is the most critical quality aspect for users of spatial data. A database is deemed useful if it includes the data that users are looking for. The completeness of the data in BDOT10k was examined separately for spatial data and attribute data (for a selected primary attribute recorded in the database). The measure used to determine the attribute completeness was, similar to [35], the ratio of the number of data entries in the research database to the number of data entries that should be present according to the theoretical model. Given that the analysis compared the research database with a reference database, the attribute completeness coefficient ( was determined as the ratio of the number of attribute values in the research database to the number of distinct attribute values in the reference database the analysed study area within the given factor according to Equation (1).
where:
- —attribute completeness coefficient;
- —the number of attribute values in the research database;
- —the number of different attribute values in the reference database.
The attribute completeness coefficient Ka calculated in this way represents the true level of completeness of the research database in relation to the reference data for the specific attribute being assessed (compared). The range of attribute scores depends on the data analysed and takes values from 0 to ‘n’. A score of 0 indicates the absence of attributes in the surveyed database; a score of 1 indicates attribute completeness in the research and reference databases (the same number of attribute values are present in the research and reference databases). Conversely, scores above 1 indicate attribute redundancy in the research database relative to the reference data.
Spatial completeness or geometric completeness was determined as the degree of similarity between two spatial sets by calculating the spatial completeness coefficient (). For a comprehensive completeness analysis, both the completeness coefficient and a spatial redundancy coefficient () were calculated. Formulas for calculating the degree of completeness and redundancy were applied by [50], where the completeness of building location data in OpenStreetMap (OSM) was analysed by comparison to the BDOT10k database. A similar formula was used by [51] to determine the similarity of the area occupied by water recorded in land and building registers and the current area covered by water obtained from orthophotomaps. The spatial redundancy coefficient is an additional metric that complements the completeness coefficient and should be considered alongside it.
The completeness degree was calculated using the formula:
where:
- —spatial completeness coefficient;
- —the product of the intersecting (overlapping) surfaces of the selected layer(s) in the research and reference databases within the research area;
- —the area of the examined layer within the analysis area;
- —the area of the reference layer within the research area.
The completeness coefficient can range from 0 to 100%, where a value of 0% is obtained when the intersection of layers shows no common area, and 100% is achieved when the objects in the research and reference databases perfectly overlap.
To calculate the spatial redundancy coefficient (), the following formula was used:
where:
- —spatial redundancy coefficient;
- —the product of the intersecting (overlapping) surfaces of the selected layer(s) in the research and reference databases within the research area;
- —the area of the examined layer within the analysis area;
- —the area of the reference layer within the research area.
A high spatial redundancy coefficient indicates discrepancies between the reference and research databases. Depending on the type of research factor, the results varied from 0% to 200%, with a 0% result meaning no data in the research database and a 200% result indicating objects present in the research database but absent in the reference database. A high completeness coefficient coupled with a low redundancy coefficient signifies robust data completeness.
The spatial analyses required the existence of input layers in surface (shape) form in the adopted research method. In cases where the data were not in the form of a layer with surface objects, e.g., due to the linear representation of the objects, a buffering function with a set buffer width was used (e.g., for linear objects with width recorded in database attributes (drainage ditch, pavement width for roads)). All analyses were performed in QGIS 3.19 software. Despite inconsistencies in reference data across Poland, spatial completeness and redundancy coefficients can be estimated using the formulas provided (Equations (2) and (3)), regardless of the type of reference data for each research factor.
Elevation data are crucial for siting devices that use the renewable energy sources (RES) analysed in this paper. Data from the DEM database differ significantly from the spatial data in the BDOT10k database. The completeness of spatial data was not estimated for the DEM database since the numeric terrain model allows interpolation of the elevation at any point within the area it covers. Spatial accuracy, however, was considered. Preliminary analyses of elevation data in various test areas revealed that the elevation data from the BDOT500 geodetic database are not error-free. High absolute elevation differences dH observed for some elevation points in BDOT500 compared to their elevation in the DEM database do not indicate errors in DEM, but likely result from various errors in the reference data. Due to the uncertainty of the reference database data, the accuracy of the DEM database data cannot be assessed based on comparisons with the reference database. Each elevation comparison requires detailed analysis and possible field surveying. In view of the above, it was decided to include the mean elevation error , as revealed in the metadata of each DEM dataset, in the suitability assessment.
In addition to the coefficients mentioned above, the final suitability equation incorporated the usability weights of other research factors. The usability weights of research factors for each type of RES are shown in Table 12. The weight values were set arbitrarily but are directly derived from the literature analysis concerning siting criteria (Table 1, Table 2 and Table 3).
Table 12.
Weights to determine the usefulness of the data for RES, Source: own study.
The final step in developing the methodology was to create a new equation for the suitability coefficient of the BDOT10k and DEM geodetic databases for RES. Equation (4) is based on the calculation of the weighted average.
To calculate the score value of the suitability coefficient, the following formula was used:
where:
- —the score value of the suitability coefficient of the BDOT10k and DEM databases for the research area;
- —another coefficient affecting the suitability of BDOT10k and DEM databases;
- —the j-th factor weight affecting the suitability of BDOT10k and DEM databases (Table 11).
Equation (5) provides the expanded form of the above formula:
where:
- —the score value of the suitability coefficient of the BDOT10k and DEM databases for the research area;
- —the spatial completeness coefficient Kp of the BDOT10k database for the land use factor;
- —the spatial completeness coefficient Kp of the BDOT10k database for the water network factor;
- —the spatial completeness coefficient Kp of the BDOT10k database for the land cover objects (buildings) factor;
- —the spatial completeness coefficient Kp of the BDOT10k database for the transportation network factor;
- —the spatial completeness coefficient Kp of the BDOT10k database for utilities network factor;
- —the mean elevation error for the DEM dataset, as specified in the metadata;
- —the average value from the preliminary assessment of the three reference databases (EGiB, BDOT500, GESUT) for the test area.
Equation (5) contains the coefficient . The coefficient is calculated as the arithmetic mean of the scoring of reference data from the BDOT500, EGiB, and GESUT databases for each study area. The point values are taken for each database according to Table 13. The highest point value is for reference data in the form of a full object database (1.0), the lowest for data in the form of an analogue map. Preliminary assessment of reference data is necessary due to the variability of the reference data used in spatial analyses. The different types of reference data affect the overall suitability score estimated according to the adopted methodology. The obtained results in terms of the Rd factor in the study areas are presented in the description of the study areas in Table 14.
Table 13.
Preliminary assessment of geodetic data within the thematic scope of the EGiB, BDOT500, and GESUT reference databases, source: own study.
Table 14.
Preliminary assessment of geodetic reference data (from the thematic scope of the EGiB, BDOT500, and GESUT databases) along with the calculation of the Rd coefficient in the test areas. Source: own study.
The proposed scoring values are based on authors’ own experience with the analysed spatial data in the test areas. Hybrid and raster data formats complicated and prolonged the preparation time for input layers for analysis.
2.2. Research Areas and Input Data for Analysis
The developed methodology for assessing the suitability of databases was applied to eighteen research areas across Poland, located in eight provinces. The research areas were differentiated by the size of the locality and the level of urbanization. Four groups of areas were selected: province capitals (W), poviat capitals (P), towns (M), and rural municipalities (G). Three research areas were selected for each group. For urban areas (W, P, and M groups), the research areas were located outside city centres, on city outskirts, and in investment areas. Partially undeveloped areas adjacent to existing buildings were selected. The siting selection was random, but efforts were made to ensure that land cover objects, such as the road network and buildings related to factors important for renewable energy investment siting, were included within the research area. For the group of rural municipalities (G), the number of areas was increased to three per municipality. This group was further divided into areas near the centres of cities/towns being the seat of the municipality (group GC), areas around developed zones but located in rural outskirts of the municipality (group GZ), and areas in rural outskirts of the municipality in undeveloped agricultural areas (group GR). Three locations were selected for each of the research groups: GC, GZ, GR.
The locations of the research areas are presented below (Figure 2).
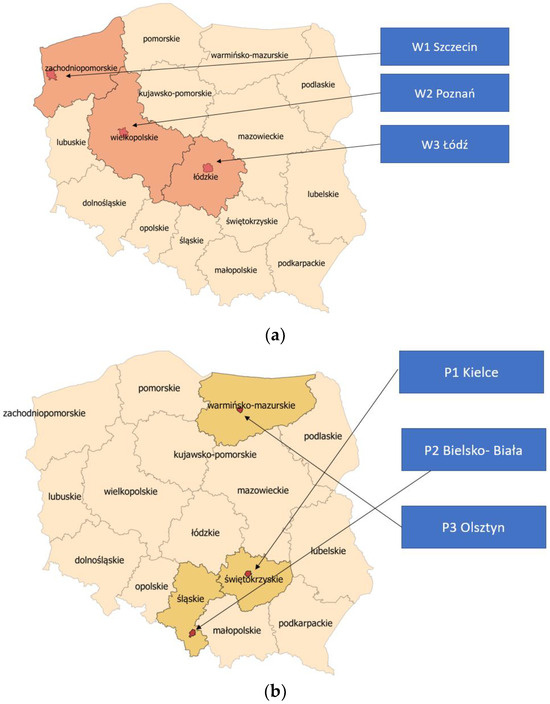
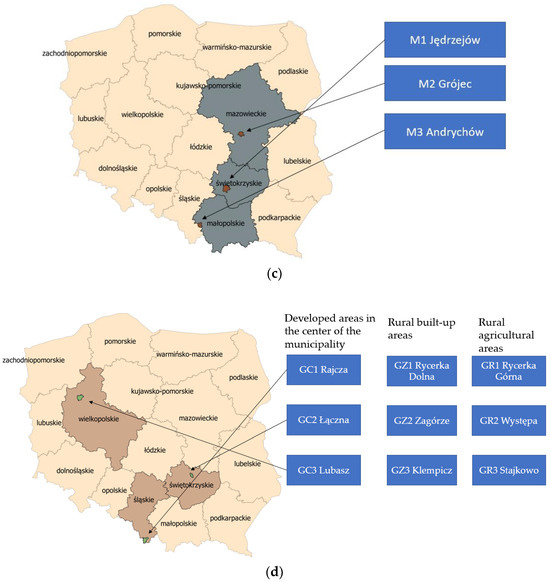
Figure 2.
Location of the research areas within the administrative borders of Poland in the different research groups: (a) province capitals W, (b) poviat capitals P, (c) towns M, (d) rural municipalities G.
The purpose of distinguishing areas into groups was to assess which group had access to “better quality” data in geodetic databases. The table below (Table A3 in Appendix B) presents all the research areas divided into groups, detailing their specific locations and sizes.
For each research area, data were obtained from the publicly accessible BDOT10k and DEM databases via the website www.geoportal.gov.pl. In the case of data from the reference databases (EGiB, BDOT500, GESUT), data were sourced from the appropriate poviat starosty. If comprehensive object-oriented database data were not available for the area, a vector map was obtained, which included the graphical elements pertinent to the thematic content of the EGiB, BDOT500, and GESUT databases (Polish name: mapa zasadnicza). Coverage of full object-oriented reference databases varies across the country, posing considerable challenges during data retrieval and, primarily, for their subsequent application. When no database exists for a specific site, potential users cannot access metadata online, which complicates obtaining basic information about data availability and quality. Information about the type of data available for a specific site is only provided in response to requests. The format of the data (raster, object-oriented database, numerical map, or hybrid data) and the format for sharing data for selected sites in Poland vary depending on the software used for the base map. Potential data users receive files in different formats; in some cases, these include rasters of analogue maps or hybrid data (some data are in numerical form, some in database form, and some on a raster).
To enhance the visualization and organization of information regarding the type of reference data obtained from the National Geodetic and Cartographic Resource, Table 14 provides a preliminary assessment of the reference data. At the beginning, after recognising what kind of data exist in the PZGiK for a given study area, the point values of the initial evaluation of the BDOT500, EGiB, GESUT thematic range data were determined. The point values are taken for each database according to Table 13. The amount of Rd was then calculated as an arithmetic mean. The obtained results in terms of the Rd factor in the study areas are presented in Table 14. The highest coefficient value (1.0) was achieved for larger cities such as Szczecin, Poznań, Łódź, Bielsko-Biała, and Olsztyn, where comprehensive object-based databases EGiB, BDOT500, and GESUT are maintained. The lowest coefficient value was found for the test area of Jędrzejów, where the reference data consist of hybrid spatial data (vector map and raster of an analogue map) across the three databases. Cities typically have spatial data that are better aligned with current regulations compared to towns, due to greater financial resources available in these areas. In addition, update surveys in towns usually involve individual building plots.
3. Results
This chapter presents the results of all the analyses conducted in this study. First, Section 3.1 presents the results regarding the attribute completeness coefficient (, spatial completeness coefficient , and spatial redundancy coefficient () obtained across all 18 research areas for all research factors. Then, Section 3.2 provides detailed comparisons of the spatial completeness and spatial redundancy coefficients for the following research factors: land use, water network, land cover objects (buildings), transportation network, and infrastructure network. Section 3.3 provides the results regarding the suitability coefficient of publicly accessible geodetic databases for RES. As there are many parameters in the article, it was decided to summarise all calculated coefficients in a table. Table 15 shows all the coefficients calculated in the article with a brief explanation.
Table 15.
Summary of all calculated coefficients. Source: own study.
3.1. BDOT10k Database Data Completeness Results
All the results obtained for completeness, being the most critical element of data quality in this study, are provided in Appendix C. Each table (Table A4, Table A5, Table A6, Table A7, Table A8 and Table A9) contains results for a different group of research areas. The values of the calculated coefficients– attribute completeness coefficient ( spatial completeness coefficient and spatial redundancy coefficient ()–for all research areas are presented in the form of charts and described below.
3.1.1. Results for the Attribute Completeness Coefficient (Ka)
The attribute completeness coefficient was calculated based on Equation (1) presented in Section 2. The coefficient (Ka) indicates the actual completeness of the BDOT10k research database in relation to the reference data for the evaluated (compared) attribute. The score ranges from 0 to “n”, where 0 indicates the absence of attributes in the research database, and 1 indicates attribute completeness in both the research and reference databases (the same number of objects with the given attribute value are present in both databases). Values exceeding 1 indicate attribute redundancy in the research database relative to the reference data. The obtained values for the attribute completeness coefficient of the BDOT10k database in relation to the reference data for all research areas across all analysed research factors are presented in the chart below (Figure 3).
Figure 3.
Attribute completeness coefficient chart for all research factors across all research areas. Source: own study.
The highest scores for the Ka coefficient (2.0), indicating attribute redundancy in BDOT10k compared to the reference data, were obtained for the Rajcza and Rycerka Dolna areas regarding the water network and for the transportation network in Zagórze. In the case of Andrychów (a town from group M), the coefficient also reached 2.0 for the utilities network factor. The greatest attribute completeness (attribute completeness coefficient score close to 1.0) was found in province capitals, as well as in rural, non-urbanized areas (group GR). For GR areas, this high completeness is also related to the small number of objects in the layers and the absence of water and road network objects. In developed rural areas, the highest attribute completeness coefficient scores were obtained for most of the research factors.
For building data, a high attribute completeness coefficient (close to 1.0), indicating consistency between the BDOT10k and EGiB databases, was observed in Szczecin, Poznań, Łódź, Olsztyn, Rajcza, and Klempicz. The greatest attribute deficiencies in the BDOT10k database were found in the Rycerka Dolna and Zagórze areas. Regarding the infrastructure network, similar coefficient scores (1.0) were obtained for Bielsko, Olsztyn, Szczecin, and Rycerka Dolna. The largest attribute deficiencies (coefficient below 1.0) in the BDOT10k database were noted in the Kielce and Łączna test areas. A high attribute completeness coefficient (score close to 1.0) was consistently achieved for land use data and in rare cases for other factors. The study showed that for the other research factors, attribute designations in the BDOT10k database are not consistent with those in the reference databases. This inconsistency stems from differences in the attribute designation schemes between the BDOT10k and the reference databases. For instance, in the BDOT10k database, residential areas are categorized into multifamily and single-family housing, while the EGiB database does not have equivalent categories. Conversely, the EGiB distinguishes between residential development (B) and buildings on agricultural lands (Br), a distinction that is absent in the BDOT10k database. In BDOT10k, agricultural land is categorized into two attribute values (grass vegetation and arable land), whereas in EGiB, there is a more detailed division into arable land, pastures, and meadows. In areas where the reference data consisted of complete databases (BDOT500, GESUT, EGiB), the attribute designations were more consistent with BDOT10k compared to areas where the reference data was available in other forms (hybrid data, vector maps).
3.1.2. Results of the Spatial Completeness (Kp) and Spatial Redundancy (Np) Coefficients
To determine if a database exhibits high spatial completeness, the results of two coefficients were analysed, the spatial completeness coefficient and the spatial redundancy coefficient, which complement each other. The spatial completeness coefficient was calculated based on Equation (2) presented in Section 2. The completeness coefficient can range from 0 to 100%, with a value of 0% obtained when the intersection of layers revealing a lack of common areas, while 100% revealing when the objects in the research and reference databases overlapped. Equation (3) described in Section 2 was used to calculate the spatial redundancy coefficient (). A high spatial redundancy coefficient indicates discrepancies between the reference and research databases. Depending on the type of research factor, the results varied from 0% to 200%, with a result of 0% indicating a lack of data in the research database, while the maximum value of 200% indicating the presence of objects in the research database while being absent in the reference database. A high completeness coefficient coupled with a low redundancy coefficient signifies robust data completeness.
The results for the spatial completeness coefficient for all areas included in the spatial analyses, across all studied factors, are presented in the chart (Figure 4). The results for the spatial redundancy coefficient (Np) are shown in a separate chart (Figure 5).
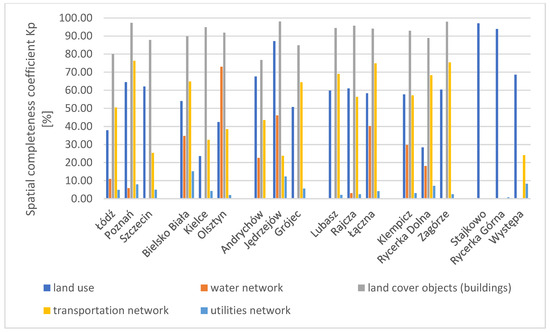
Figure 4.
Chart of the spatial completeness coefficient in the studied areas across all research factors. Source: own study.
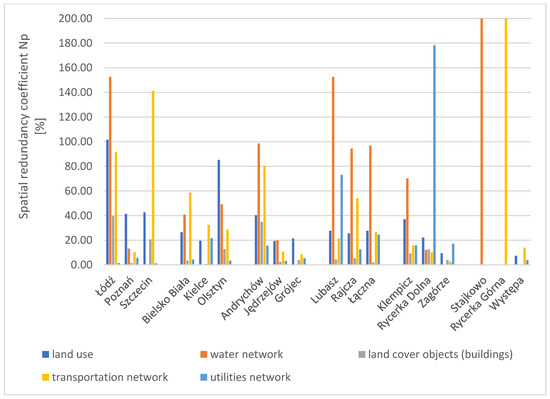
Figure 5.
Chart of the spatial redundancy coefficient in the studied areas across all research factors. Source: own study.
The highest value of the spatial completeness coefficient for the BDOT10k database among all research factors was obtained for land cover objects (buildings). For three research areas, namely Poznań, Jędrzejów, and Zagórze, the coefficient value is close to 100%. The high results of the spatial completeness coefficient for the land use factor and land cover objects (buildings) along with simultaneously low values of the spatial redundancy coefficient indicate a high degree of consistency between the publicly accessible research databases and the geodetic reference data. The lowest values of the spatial completeness coefficient were obtained for the infrastructure network factor in all test areas, regardless of whether they were cities or rural areas. For this factor, redundancy was also minimal (Figure 5). The highest values of the spatial redundancy coefficient were recorded in rural areas for the water network and road network. Similarly high redundancy coefficients were noted in the areas of Łódź and Szczecin (cities in group W).
3.2. Comparative Analysis of the Results Obtained for Spatial Completeness and Redundancy Coefficients by Research Factor
Below is a comparative analysis of the results obtained for spatial completeness () and spatial redundancy () coefficients, separately for each research factor. Interesting cases, encountered difficulties, and interim conclusions from the analyses are also highlighted.
3.2.1. Land Use
The value of the spatial completeness coefficient for the land use factor is presented in the chart for all research areas analysed in the study (Figure 6).
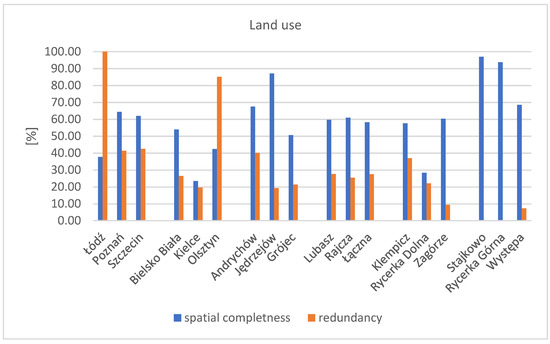
Figure 6.
Chart of the spatial completeness and redundancy coefficients for the research factor—land use. Source: Own study.
The highest value of the completeness coefficient was obtained in the research areas of Stajkowo and Rycerka Górna, where no spatial redundancy was detected. The average completeness value for this research factor is 60% across all areas. For all analysed research areas, it was possible to calculate the spatial completeness coefficient of the BDOT10k database using reference data, regardless of the type of data available for each area. Moreover, for the land use factor, only four research areas had a spatial completeness coefficient value below 50%. The lowest spatial data completeness coefficient was recorded in the research area of Kielce (24%) and Rycerka Dolna.
Only in two urban areas, Łódź and Olsztyn, was a high redundancy coefficient observed in the BDOT10k data compared to the reference data, along with a low completeness degree—around 40% in these areas. In general, the completeness for the land use factor in cities is relatively low. Conversely, for predominantly agricultural areas (undeveloped), the completeness is significantly higher compared to cities This is due to the presence of large complexes with uniform land use in the BDOT10k, mainly agricultural and forest areas. In the BDOT10k database, land cover data are primarily retrieved from orthophotomaps, and their interpretation largely depends on the person entering the contours of that land cover into the database. Utilizing a reference layer of land use during the update process for the BDOT10k database would be helpful.
Difficulties were encountered during spatial analyses due to the lack of land use data in the object-oriented databases of EGiB for several test areas. For example, in the Grójec research area, an incomplete EGiB object-oriented database existed but lacked spatial data on land use. These data had to be retrieved for analysis purposes from a vector map of the land and building register. No object-oriented EGiB database is maintained for the areas in the Świętokrzyskie province areas (Jędrzejów and the Łączna municipality, including the Łączna, Występa, and Zagórze test areas). Information on land use was available in vector map form, and in the Występa area, partially as a vector map and partially as a raster map (hybrid data). As the study conducted in the paper shows, this reference database is not used when updating BDOT10k due to insufficient information. Land use data are recorded in the EGiB database as land use designations (attributes) and land use boundaries (spatially). It is suggested that instead of the BDOT500 database (as currently indicated by the BDOT10k application schema), the EGiB database should be indicated as the reference for BDOT10k in the database application schema. Using land use information during the BDOT10k update could be very useful in places where interpreting the boundaries of areas for specific purposes on orthophotomaps is difficult.
3.2.2. Water Network
A high degree of spatial data redundancy compared to completeness was obtained for the water network factor. The highest redundancy coefficient score values were obtained in the Stajkowo test area, as well as in the Łódź and Lubasz areas. Spatial redundancy in the BDOT10k data regarding water network objects was present in nearly all test areas where such objects were included (Figure 7).
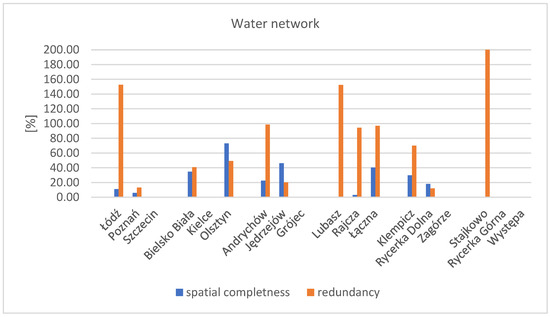
Figure 7.
Chart of the spatial completeness and redundancy coefficients for the research factor—water network. Source: own study.
The average spatial completeness coefficient for all areas was 28%. The highest completeness coefficient was recorded in the Olsztyn area, approximately 73%. Only in the case of the Rycerka Dolna research area, the geometric representation of the river in BDOT10k took the form of a surface object, not just a linear one in the form of a watercourse axis, as shown in the figure (Figure 8). In this area, however, the reference database contained only fragmentary data and did not allow for the creation of a surface layer for comparative analyses. It should be noted that the alignment of the river with the current orthophotomap is not very accurate.
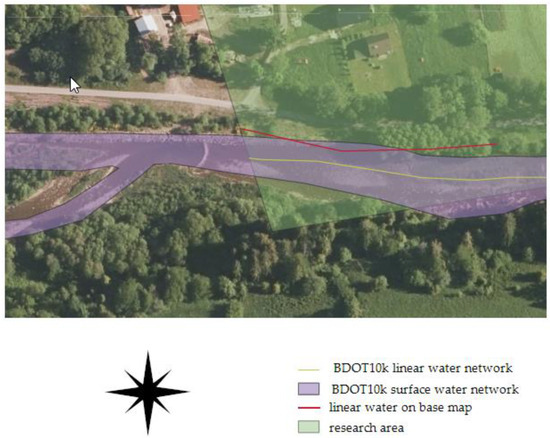
Figure 8.
Objects of the water network from the base map and the research BDOT10k database in the vicinity of the Rycerka Dolna research area against the orthophotomap.
In most research areas, the water network in BDOT10k consists of linear objects with attributes indicating width, such as that of drainage ditches. A complete BDOT500 database exists for the Łódź area. Water network objects in this area are drainage ditches, which in BDOT10k are recorded as 1.0 m wide (as noted in the database attributes), whereas in BDOT500, they are shown as surface objects. The completeness coefficient for this thematic layer was 38%, while a high redundancy coefficient of 153% was recorded. In some cases, such as in Klempicz (a group of towns on the outskirts of municipalities), there were surface water objects that were not present in the reference database (neither in BDOT500 nor in the vector or raster main map—hybrid data exist for this area), but they accounted for 50% of all water network objects in terms of surface area.
3.2.3. Land Cover Objects (Buildings)
For all study areas, high values of the completeness coefficient for buildings were obtained, ranging from 78% to 98%. Simultaneously, the lowest values of the redundancy coefficient were observed in this group of factors. This indicates a high level of completeness of the research database relative to the reference database. The chart (Figure 9) shows the obtained results of spatial completeness and redundancy coefficients.
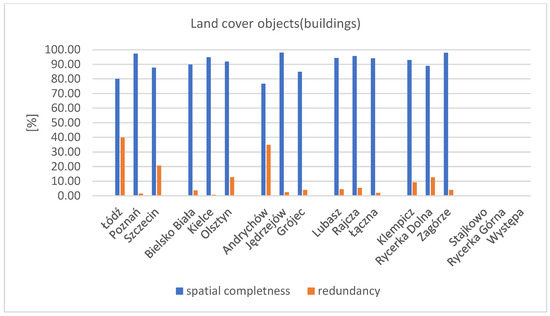
Figure 9.
Chart of the spatial completeness and redundancy coefficients for the research factor—land cover objects—buildings. Source: own study.
The highest value of the redundancy coefficient was obtained in the areas of Łódź and Andrychów, approximately 40%. At the same time, these areas showed lower results for the spatial completeness coefficient—80% for Łódź and 77% for Andrychów. The highest completeness coefficients for buildings were found in rural municipalities and for the group of poviat capitals (P). Lower values were observed for province capitals (W) and towns (M). In all research areas, the spatial completeness coefficient exceeded 70%, indicating a high level of completeness in the BDOT10k database regarding the buildings factor. The high result of the spatial completeness coefficient for land cover objects (buildings) along with simultaneously low values of the spatial redundancy coefficient indicate a high degree of consistency between the publicly accessible research databases and the geodetic reference data.
Despite the estimated high spatial completeness coefficient for this factor compared to other analysed objects, numerous difficulties were encountered during comparative analyses. These issues stem from inconsistencies between the reference databases and the research database. While the BDOT10k database demonstrated high uniformity nationwide, the reference data varied across different areas. The most important discrepancies and difficulties in the analyses performed, according to the authors of the paper, are described below. In the Klempicz area (GZ—municipal settlements, village on the outskirts of the municipality), the reference database is an incomplete geodetic database (EGiB). The EGiB database contains information on some buildings (from 2013). Older objects are recorded on the vector base map layers. The following figure (Figure 10) shows the distribution of buildings in the research area, indicating which buildings were recorded in the EGiB object-oriented database and which were recorded only on the vector base map.
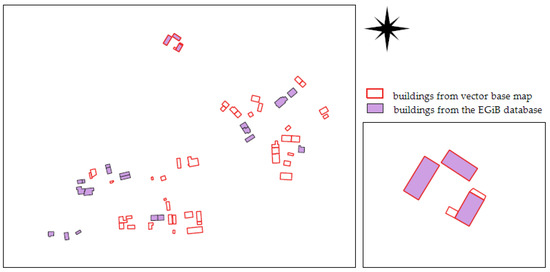
Figure 10.
Distribution and completeness of buildings in the partially existing EGiB reference database compared to the vector data of the base map in the Klempicz research area.
In the partially existing EGiB object-oriented database, there are 22 buildings, while the base map shows 46 buildings. In addition, it was found that three buildings were present both in the EGiB database and on the map, with one building’s outline on the vector map being enlarged and more closely matching its image on the orthophotomap. In addition, the building function designations were not complete on the vector map. In many cases, determining the function of a building required using a raster of an old map. Some farm buildings lacked designations on the vector map, as opposed to the raster. Additionally, some buildings in the vector database only had a reference number but lacked a building function designation.
Interesting cases were encountered during the analysis of buildings in the Rajcza municipality. In the Rajcza area (GC group), the outlines of buildings in the BDOT10k database did not geometrically match the buildings on the base map, even though most buildings in the analysed area had a record in the database attributes stating that the source of geometric data for BDOT10k was the base map. Seven buildings (out of forty-seven buildings in the test area, constituting 15%) were identified based on the current orthophotomap. In the Rycerka Dolna area, there is also a discrepancy in location, although the geometry of the buildings is mainly derived from the base map (according to the data recorded in the database attributes). In this area, there is a puzzling shift by a similar vector of approximately 0.3–0.40 m of data in BDOT10k relative to the vector base map. The likely reason may be the alignment of the geodetic survey grid to which the update measurements for EGiB are referenced. The observed discrepancies between the BDOT10k database and the reference data for the Rycerka Dolna area are illustrated in the figure (Figure 11).
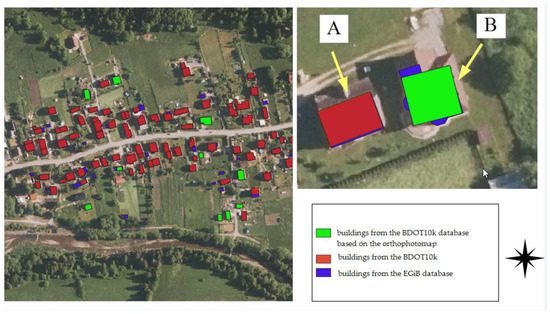
Figure 11.
Discrepancies between the location in the BDOT10k database and the base map: (A) offset by vector 0.3–0.4 (for buildings in BDOT10k with data source attribute: EGiB database); (B) building outline in BDOT10k (based on the orthophotomap) relative to the outline from the EGiB database.
3.2.4. Transportation Network
The value of the spatial completeness coefficient for the transportation network in the test areas ranged from 24% in Jędrzejów and Występ to 76% in Poznań (Figure 12). In most of the test areas, the transportation network consisted of road networks, with only two areas containing other objects (tracks).
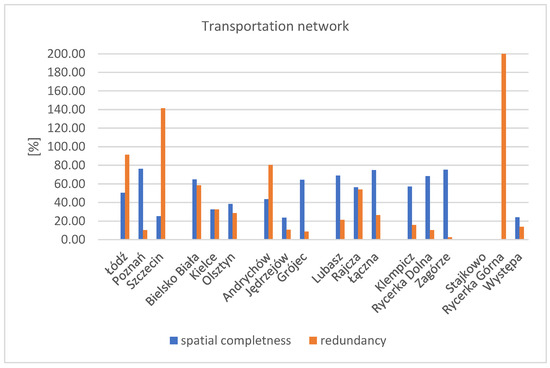
Figure 12.
Chart of the spatial completeness and redundancy coefficients for the research factor—transportation network. Source: own study.
A high value of the spatial completeness coefficient was obtained for most urban areas and rural settlements (GC and GZ groups). Only in four test areas did the coefficient fall below 40%. These areas were Szczecin, Kielce, and Jędrzejów. In the Szczecin research area, where a complete BDOT500 (reference) database exists, it was found that the BDOT10k database contains significantly fewer road network objects than the reference database. This is evidenced by a low spatial completeness index of 25% and the high level of redundancy at 141%.
The lowest spatial completeness was recorded for typically agricultural areas, where unpaved dirt roads prevail (GR group areas). In these sites, the reference database often lacks data from updating measurements, which would reveal objects in the BDOT500 database or the base map. Conversely, the absence of dirt roads in the BDOT10k database in some test areas may result from interpretive difficulties or visibility on the orthophotomap. It is worth mentioning that while the geometry of dirt roads is recorded in BDOT10k, the surface width attribute is NULL. In places where spatial data on road objects are missing from both BDOT10k and the reference database, the only road-related information is the parcel boundary and the land use designation “dr” in EGiB. In the agricultural area of Stajkowo, there were no spatial data available in either the BDOT10k or the reference databases. In the Rycerka Górna area, there were no objects in the research database, while the reference database (fundamental base vector map, as there was no BDOT500 database in the area) included layers of the edges of dirt roads (F). As a result, the data redundancy coefficient was 200% (completeness: 0%), which is the highest among all values in the tested areas. It is noteworthy that outside the test area, there is a dirt road with a similar layout and appearance on the orthophotomap, which was identified in the BDOT10k database (Figure 13).
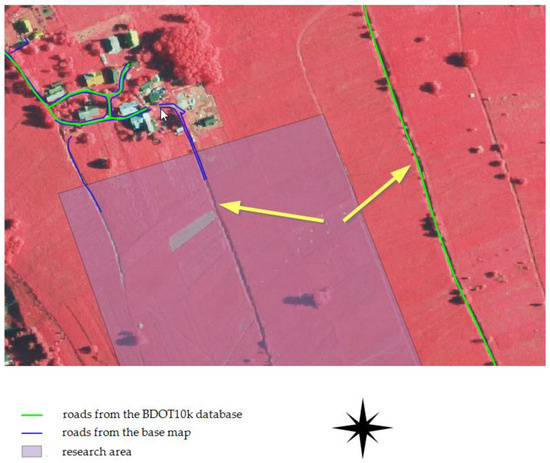
Figure 13.
Elements of the road network in the area of Rycerka Górna against the background of the orthophotomap. Source: Own study.
3.2.5. Utility Networks
The lowest values of the spatial completeness coefficient were obtained for infrastructure networks information. The coefficient value is comparable across all test fields. The lowest completeness coefficient was recorded in areas of large province capitals, with two areas from this group having a coefficient of 5%. The chart below shows the results of the spatial completeness and redundancy coefficient (Figure 14). For better readability, the vertical scale is shown up to 30%, with redundancy results in the Lubasz and Rycerka Dolna areas exceeding 30%, 73% for Lubasz, and 178% for Rycerka Dolna.
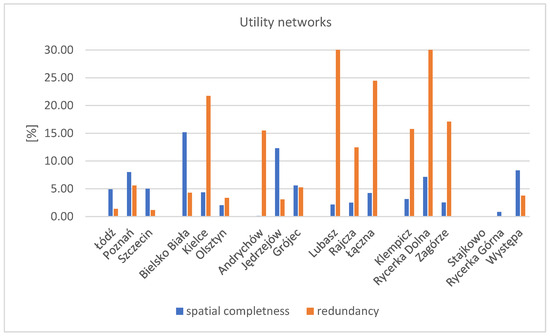
Figure 14.
Value of the spatial completeness and redundancy coefficients for the research factor—utilities network. Source: own study.
The highest value of the spatial completeness coefficient was obtained for the Bielsko-Biała area, at 15%. The lowest completeness coefficient was recorded in areas of large province capitals, with two areas from this group having a coefficient of 5%. The highest value of the spatial redundancy coefficient was observed for infrastructure networks in Rycerka Dolna, at approximately 178%. This high value indicates significant data redundancy in BDOT10k compared to the reference database, likely resulting from the removal of an overhead grid segment in this area. A similarly high redundancy coefficient (73%) was noted for the Lubasz area. Detailed analysis reveals that the Lubasz research area has a GESUT database. However, during the preparation of input layers for GIS analysis, it was found that only the most recent data from 2021 had been entered into the database. The remaining grids are partially available in the vector database (mainly service connections to the buildings, recorded based on recent measurements in individual reports—mostly underground (cable) service connections). In contrast, most of the grids analysed in this paper (overhead main grid) were sourced from a raster map at a scale of 1:500, leading to difficulties in grid identification and probable errors. For the remaining areas, the spatial redundancy coefficient did not exceed 30%, and the low spatial completeness coefficient suggests that the completeness concerning utilities networks is not high.
3.3. Assessment of the Suitability of Publicly Accessible Geodetic Databases for RES
In the final stage of the analysis, an attempt was made to assess the overall usability of the publicly accessible BDOT10k and DEM databases for RES investments using a single suitability coefficient. This coefficient score was calculated based on own formula Equation (5) presented in Section 2. The range of possible score values for the suitability coefficient ranges from 0.38 to 2.69. The lowest possible score value of the coefficient was estimated for a theoretical area where the spatial completeness coefficients are minimal (0.01) for all research factors, all reference data are in raster format, and the average DEM error in the dataset metadata is 0.50 m. The maximum score value of the suitability coefficient was estimated for DEM with an average error of 0.10 m, reference data in the form of complete object-oriented databases, and a spatial completeness coefficient of 1.0 for all research factors. To assess the suitability of the verified databases, a threshold score value of the suitability coefficient was set at 1.34, representing 50% of the maximum score value, indicating the suitability of the databases. Subsequently, it was assumed that a suitability coefficient value above 80% of the maximum score value (2.15) indicates that the databases are fully suitable for RES. Based on these assumptions, the following ranges for the suitability coefficient score values were defined:
- 0–1.34 databases not suitable for RES;
- 1.35–2.15 databases suitable for RES;
- 2.16–2.70 databases fully suitable for RES.
The results obtained for the suitability coefficient of BDOT10k and DEM geodetic databases for RES in the research areas, divided by area groups, along with calculations according to the adopted methodology, are provided in Appendix D. The obtained results of the suitability coefficient are also presented in the chart below (Figure 15). The threshold level of the suitability coefficient is marked with a red dashed line. Values above this level indicate the suitability of the publicly accessible BDOT10k and DEM databases for RES in the research area. The red solid line marks the value considered as the minimum for determining full suitability of the research databases for RES investment siting in the research area.
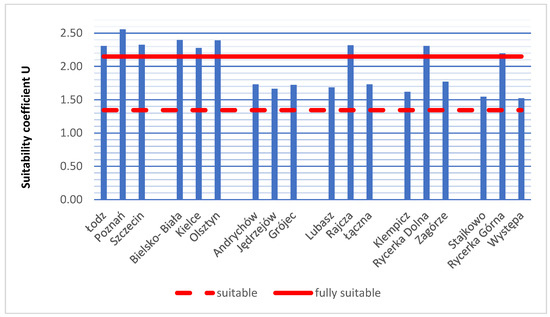
Figure 15.
Results of the suitability coefficient of publicly accessible databases. Source: own study.
The highest suitability coefficient was recorded in the research area of Poznań (2.56), while the lowest result among all analysed areas was in Występa (1.52). Based on the chart above, it can be concluded that the best suitability is found in city areas (from the group of province capitals W and poviat capitals P), where the suitability coefficient is relatively high, averaging 2.40 for province capitals and 2.36 for poviat capitals. These areas have reference data in the form of complete object-oriented databases. The analyses yielded high values for the completeness coefficient. Generally, the DEM database is more accurate in urban areas compared to rural areas. In town group areas (Andrychów, Jędrzejów, Grójec), the suitability coefficient was notably lower, averaging 1.71. The results were similar across all areas in this group. Similar suitability coefficient score values were observed in rural areas across all three groups of GC, GR, GZ areas. In these areas, there is a noticeable variability in results. Research areas in the Rajcza municipality (Rajcza, Rycerka Górna, and Rycerka Dolna) achieved significantly higher results compared to other rural areas. In these research fields, the DEM database having a higher accuracy, as well as fairly higher values in terms of completeness coefficient, were observed. Moreover, these areas have a complete EGiB object-oriented database along with land use data, while reference data for thematic areas BDOT500 and GESUT are included in a complete vector map.
The obtained score value of the coefficient in each of these areas exceeds 1.34, which was adopted as the threshold value indicating the usefulness of the analysed databases for the specified purpose of this paper. Based on the analyses, it was determined that fully suitable databases are available for the group of poviat capitals (Łódź, Poznań, Szczecin) and province capitals (Bielsko-Biała, Kielce, Olsztyn).
4. Discussion and Conclusions
The conducted analyses allowed for the formulation of the following main conclusions:
- (1)
- It is possible to determine the requirements of spatial data users related to the process of siting renewable energy infrastructure based on the existing extensive national and international literature regarding the first stage of investments, i.e., spatial analyses carried out in a GIS environment to identify areas predisposed to and excluded from investment siting;
- (2)
- As a result of the analysis of publicly available geodetic databases BDOT10k and NMT in 18 randomly selected locations from Poland, it was found that these databases contain data for the determination of research factors of importance in the process of localization of infrastructure for selected RES. The data are available in the databases, and with their help, it is possible to carry out research according to the methodology adopted in the study.
The BDOT10k database is a topographic spatial database, made available for free use. As shown in the literature, spatial data of this thematic scope and similar detail are typically used in multi-criteria spatial analyses for the selection of sites for RES devices [13,18,28,29]. The BDOT10k database covers the entire country, so data can be obtained for any site and any area at the poviat, province, or national level. In addition, for any area in Poland, the data are uniform (the same layer names, object representations, and attributes). From the perspective of data users, this database has the best accessibility. DEM was chosen as the research database for elevation-related factors due to its coverage with free, publicly accessible, and uniform data for the entire country. The BDOT10k database is also intended to include elevation data in the future (according to the BDOT10k Regulation), although such data are not currently collected.
- (3)
- It was found that publicly accessible geodetic databases BDOT10k and DEM are useful in the process of RES infrastructure siting. The method for assessing the suitability of publicly accessible BDOT10k and DEM geodetic databases, proposed in this paper, allowed for the calculation of the suitability coefficient in all research areas. Similar analyses of geodetic databases from the perspective of a specific group of data users have not yet been conducted. Additionally, no studies have assessed the collective suitability of multiple geodetic databases in the form of a single coefficient.
The presented studies confirmed the validity of using publicly accessible BDOT10k and DEM geodetic databases in GIS analyses for finding suitable sites for solar, wind, and small hydroelectric power plants. The developed methodology allows us to assess the suitability of the databases studied for any area of Poland. It considers all forms of reference data occurring in the area of the country (data in the form of object database, raster, vector, analogue). The developed method is universal and can be used in other locations also in the world, provided that similar databases are available for the area of the country (in terms of subject and accuracy). It is also necessary to have reference databases of higher accuracy and detail than the databases studied, as the methodology involves comparative analyses of objects contained in two databases. The proposed usability assessment is performed from the point of view of the data user and represents an innovative approach to database assessment. Research on the usability of databases has not been conducted so far and it is difficult to compare it with other methods due to its specific nature. Further research in a similar scientific context would be needed and valuable. The suitability assessment in the form of a single coefficient is easy for data users to interpret; however, it should be noted that there is some risk of misinterpreting the assessment score during the data aggregation process. The proposed methodology could be useful for other groups of spatial data users in assessing the suitability of geodetic databases for their purposes by selecting an appropriate set of research factors reflecting the requirements of the target user group.
Author Contributions
Conceptualization, T.F.-D. and A.K.-P.; methodology, T.F.-D.; software, T.F.-D.; validation, T.F.-D.; investigation, T.F.-D.; resources, T.F.-D. and A.K.-P.; writing—original draft preparation, T.F.-D.; writing—review and editing, A.K.-P.; visualization, T.F.-D.; supervision, A.K.-P.; project administration, T.F.-D.; funding acquisition, T.F.-D. All authors have read and agreed to the published version of the manuscript.
Funding
This research was funded by Kielce University of Technology, grant number 05.0.13.00/1.02.001/SUBB.IKGD.24.001.
Data Availability Statement
The original contributions presented in the study are included in the article, further inquiries can be directed to the corresponding authors. Source data from the BDOT10k and NMT databases on which the research in this work was based are openly available at [https://www.geoportal.gov.pl/]. Source data from the BDOT500, GESUT, EGiB databases used in this study are available upon request from the data controller due to legal restrictions.
Conflicts of Interest
The authors declare no conflicts of interest.
Appendix A
Table A1.
Identification of factors relevant to the siting of solar power plants—literature analysis, source: own study.
Table A1.
Identification of factors relevant to the siting of solar power plants—literature analysis, source: own study.
| Author, Publication, Country | Categories of Factors | Factors Influencing Localisation | Factors Excluding Location | Spatial Data Used/Notes |
|---|---|---|---|---|
| Financial subsidies and the location decision of solar power plants in Hungary: An empirical investigation [52] |
|
|
| |
| Environmental decision-support systems for evaluating the carrying capacity of land areas: Optimal site selection for grid-connected photovoltaic power plants [23] Andalusia (Spain) |
|
|
|
|
| Location Study of Solar Thermal Power Plant in the State of Pernambuco Using Geoprocessing Technologies and Multiple-Criteria Analysis [10] Pernambuco, north-eastern region of Brazil |
|
|
|
|
| Site selection for solar power plant in Zaporizhia city (Ukraine) [11] Zaporizhia city (Ukraine) |
|
|
| |
| Improving the Efficiency of Solar Power Plants [30] Luxor (Egypt) |
|
|
| |
| Optimization of photovoltaic solar power plant locations in northern Chile [24] |
|
|
|
|
| Analyzing territory for the sustainable development of solar photovoltaic power using GIS [12] Valencia, eastern Spain |
|
|
|
|
| Regional Scale wind farm and solar farm suitability assessment using GIS-assisted multi-criteria evaluation [15] Area of southern England | Technical factors Visual factors Environmental factors Economic factors |
|
|
|
| PV site suitability analysis using GIS-based spatial fuzzy multi-criteria evaluation [25] Oman | Technical factors Economic factors Environmental factors |
|
|
|
Table A2.
Identification of factors relevant to the siting of wind farm sites—literature analysis, source: own study.
Table A2.
Identification of factors relevant to the siting of wind farm sites—literature analysis, source: own study.
| Author, Publication, Country | Categories of Factors | Factors Influencing Localisation | Factors Excluding Location | Spatial Data Used/Notes |
|---|---|---|---|---|
| Constraints on development of wind energy in Poland due to environmental objectives. Is there is space in Poland wind farm siting [18] | Settlement factors Landscape and environmental factors Visual factors Technical factors |
|
|
|
| Regional Scale wind farm and solar farm suitability assessment using GIS-assisted multi-criteria evaluation [15] Area of southern England | Technical factors Visual factors Environmental factors Economic factors |
|
|
|
| A multicriterial evaluation of land suitability for wind energy development, as exemplified by Poland’s gmina of Rymanów [13] | Technical factors |
|
|
|
| GIS-based environmental assessment of wind energy systems for spatial planning: A case study from Western Turkey [16] | The potential of wind energy Environmental |
|
|
|
| GIS-based method for wind farm location multi-criteria analysis Prusice municipality in Lower Silesia, Poland [14] | Environmental Social Spatial Technical |
|
| |
| Application of the GIS-DANP-MABAC multi-criteria model for selecting the location of wind farms: A case study of Vojvodina, Serbia [19] | Environmental Economic Social |
|
| |
| A Geospatial Approach for Prioritizing Wind Farm Development in Northeast Nebraska, USA [20] |
|
|
| |
| Factors in determining wind farm location: Integrating GQM, fuzzy DEMATEL, and ANP [21] Taiwan | Safety and quality Economy and benefits Social impressions Noise and harsh light Monitoring and ecology |
| ||
| Wind Energy–assessment of resources and investment problems in renewable sources of energy based on the commune Latowicz, Polska [22] | Environmental Topography |
|
|
|
| A Decision Support System methodology for selecting wind farm installation locations using AHP and TOPSIS: Case study in Eastern Macedonia and Thrace region, Greece [17] | Qualitative and quantitative criteria |
|
|
|
Appendix B
Table A3.
Research areas selected for analysis. Source: own study.
Table A3.
Research areas selected for analysis. Source: own study.
| Group of Research Areas | Area Designation | Name of Locality | Province | Surface Area [ha] | MultiPolygon Coordinates [Layout: ETRS89/Poland CS92] |
|---|---|---|---|---|---|
| W | W1 | Szczecin | Zchodniopomorskie | 25.15 | 199,713.41 624,880.71, 200,276.65 624,975.72, 200,545.40 624,610.02, 199,987.33 624,464.72, 199,713.41624,880.71 |
| W2 | Poznań | Wielkopolskie | 25.11 | 363,911.58 500,395.19, 364,206.12 500,188.69, 363,967.49 499,610.78, 363,597.77 499,749.76, 363,911.58 500,395.19 | |
| W3 | Łódź | Łódzkie | 23.18 | 540,368.50 432,383.94, 540,783.94 432,229.87, 540,640.66 431,745.07, 540,220.28 431,852.20, 540,368.49 432,383.94 | |
| P | P1 | Kielce | Świętokrzyskie | 28.64 | 614,079.63 337,093.91, 614,352.17 336,993.98, 614,352.17 336,993.98, 614,006.94 336,244.47, 613,639.01 336,530.65, 614,079.63 337,093.91 |
| P2 | Bielsko-Biała | Śląskie | 17.99 | 502,321.85 214,930.52, 502,401.10 214,987.91, 502,401.10 214,987.91, 502,791.89 214,884.06, 502,678.48 214,702.33, 502,500.85 214,494.64, 502,133.29 214,700.97 | |
| P3 | Olsztyn | Warmińsko-mazurskie | 24.62 | 597,330.20 655,369.99, 597,419.98 655,856.73, 597,934.05 655,893.47, 597,944.61 655,529.66, 597,728.73 655,441.52, 597,330.20 655,369.99 | |
| M | M1 | Jędrzejów | Świętokrzyskie | 21.08 | 588,855.37 308,268.77, 589,319.31 308,232.86, 589,151.21 307,746.52, 588,702.98 307,897.79, 588,855.36 308,268.77 |
| M2 | Grójec | Mazowieckie | 31.86 | 629,612.12 446,573.16, 630,063.93 446,512.11, 630,063.93 446,512.11, 630,012.03 445,788.61, 629,621.28 445,788.61, 629,612.12 446,573.16 | |
| M3 | Andrychów | Małopolskie | 24.29 | 523,418.85 222,229.56, 523,814.71 222,131.62, 523,699.23 221,572.84, 523,274.19 221,667.42, 523,418.85 222,229.56 | |
| GC | GC1 | Rajcza | Śląskie | 15.91 | 507,371.31 181,847.72, 507,607.65 182,133.67, 507,891.68 181,700.16, 507,650.27 181,511.11, 507,371.31 181,847.72 |
| GC2 | Łączna | Świętokrzyskie | 20.87 | 625,654.90 349,111.75, 626,018.43 349,385.84, 626,381.47 349,093.07, 625,996.99 348,812.53, 625,654.90 349,111.75 | |
| GC3 | Lubasz | Wielkopolskie | 19.25 | 333,135.53 556,970.50, 333,404.69 557,359.63, 333,734.27 557,192.20, 333,469.81 556,741.08, 333,135.53 556,970.50 | |
| GZ | GZ1 | Rycerka Dolna | Śląskie | 17.71 | 504,926.99 179,268.53, 505,310.77 179,339.06, 505,411.52 179,050.98, 505,009.76 178,991.32, 504,926.99 179,268.53 |
| GZ2 | Zagórze | Świętokrzyskie | 22.45 | 627,338.90 346,855.19, 627,978.25 346,762.66, 627,920.76 346,425.53, 627,253.17 346,527.31, 627,338.90 346,855.19 | |
| GZ3 | Klempicz | Wielkopolskie | 19.17 | 330,707.81 547,657.21, 331,169.98 547,872.51, 331,327.61 547,537.78, 330,876.58 547,310.96, 330,707.81 547,657.21 | |
| GR | GR1 | Rycerka Górna | Śląskie | 15.60 | 504,651.47 178,728.80, 504,876.21 178,793.10, 505,106.70 178,181.24, 504,854.54 178,134.80, 504,651.47 178,728.80 |
| GR2 | Występa | Świętokrzyskie | 23.10 | 621,803.52 347,638.56, 622,143.94 347,643.18, 622,338.93 347,004.25, 621,969.03 346,988.32, 621,803.52 347,638.56 | |
| GR3 | Stajkowo | Wielkopolskie | 21.66 | 330,502.35 554,134.67, 330,986.20 553,859.90, 330,766.19 553,537.07, 330,274.75 553,830.45, 330,502.35 554,134.67 |
Appendix C
Table A4.
Research results in research areas from the group of province capitals “W” for data quality elements.
Table A4.
Research results in research areas from the group of province capitals “W” for data quality elements.
| No. | Research Factor | Area | Databases Adopted for Research | Data Quality Element: 1. COMPLETENESS | ||||||
|---|---|---|---|---|---|---|---|---|---|---|
| Reference (Comparative) Database | Research Database | Descriptive Data (Attributes) | Spatial Data | |||||||
| Data Development Level: -Geodetic Database -Database + Vector Map -Complete Vector Map -Vector Map + Raster -Hybrid Data (Database + Vector + Raster) -Raster | Actual Number of Attributes of the Evaluated Base/Actual Number of Attributes in the Reference Base (Completeness of the Database Being Assessed in Relation to the Reference Database) | 1. Completeness (Kp) Degree of the Research Database in Relation to the Reference Database. 2. Redundancy (Np) Degree of the Research Database in Relation to the Reference Database. | ||||||||
| 1 | Land use | Łódź | EGiB | BDOT10k | FORESTS | BUILDINGS | FARMLAND | FORESTS | BUILDINGS | FARMLAND |
0.0 | 0.60 | 2.00 | 0 (Kp) 200 (Np) | 47.35 101.13 | 66.04 3.44 | |||||
| Geodetic database | Geodetic database | |||||||||
| Poznań | EGiB | BDOT10k | None | 0.6 | 2.00 | None | 59.87 75.50 | 69.10 7.33 | ||
| Geodetic database | Geodetic database | |||||||||
| Szczecin | EGiB | BDOT10k | 1.0 | 0.40 | 1.0 | 75.72 0.43 | 38.34 122.10 | 72.13 5.31 | ||
| Geodetic database | Geodetic database | |||||||||
| 2 | Water network | Łódź | BDOT500 | BDOT10k | 1.0 (1/1) | 11.03 152.55 | ||||
| Geodetic database | Geodetic database | |||||||||
| Poznań | BDOT500 | BDOT10k | 1.0 (1/1) | 5.94 13.16 | ||||||
| Geodetic database | Geodetic database | |||||||||
| Szczecin | BDOT500 | BDOT10k | None | None | ||||||
| Geodetic database | Geodetic database | |||||||||
| 3 | Land cover objects (buildings) | Łódź | EGiB | BDOT10k | 0.80 | 79.99 39.76 | ||||
| Geodetic database | Geodetic database | |||||||||
| Poznań | EGiB | BDOT10k | 1.00 | 97.33 1.42 | ||||||
| Geodetic database | Geodetic database | |||||||||
| Szczecin | EGiB | BDOT10k | 0.86 | 87.84 20.62 | ||||||
| Geodetic database | Geodetic database | |||||||||
| 4 | Transportation network | Łódź | BDOT500 | BDOT10k | 0.60 | (1/0) none in reference closed areas | 50.41 91.50 | 0.00 0.00 | ||
| Geodetic database | Geodetic database | |||||||||
| Poznań | BDOT500 | BDOT10k | 1.0 | 76.25 10.19 | ||||||
| Geodetic database | Geodetic database | |||||||||
| Szczecin | BDOT500 | BDOT10k | 0.33 | 25.29 141.37 | ||||||
| Geodetic database | Geodetic database | |||||||||
| 5 | Utility networks | Łódź | GESUT | BDOT10k | 1.5 | 4.92 1.39 | ||||
| Geodetic database | Geodetic database | |||||||||
| Poznań | GESUT | BDOT10k | 0.67 | 7.95 5.59 | ||||||
| Geodetic database | Geodetic database | |||||||||
| Szczecin | GESUT | BDOT10k | 1.0 | 4.98 1.17 | ||||||
| Geodetic database | Geodetic database | |||||||||
Table A5.
Research results in research areas from the group of province capitals “P” for data quality elements.
Table A5.
Research results in research areas from the group of province capitals “P” for data quality elements.
| No. | Research Factor | Area | Databases Adopted for Research | Data Quality Element: 1. COMPLETENESS | ||||||
|---|---|---|---|---|---|---|---|---|---|---|
| Reference (Comparative) Database | Research Database | Descriptive Data (Attributes) | Spatial Data | |||||||
| Data Development Level: -Geodetic Database -Database + Vector Map -Complete Vector Map -Vector Map + Raster -Hybrid Data (Database + Vector + Raster) -Raster | Actual Number of Attributes of the Evaluated Base/Actual Number of Attributes in the Reference Base (Completeness of the Database Being Assessed in Relation to the Reference Database) | 1. Completeness (Kp) Degree of the Research Database in Relation to the Reference Database. 2. Redundancy (Np) Degree of the Research Database in Relation to the Reference Database. | ||||||||
| 1 | Land use | Bielsko-Biała | EGiB | BDOT10k | FORESTS | BUILDINGS | FARMLAND | FORESTS | BUILDINGS | FARMLAND |
0.5 | 1.0 | 0.33 | 0 (Kp) 200 (Np) | 65.90 61.34 | 55.10 7.68 | |||||
| Geodetic database | Geodetic database | |||||||||
| Kielce | EGiB | BDOT10k | None | 1.0 | None | 0.00 2.00 | 70.53 54.97 | 0.00 2.00 | ||
| Geodetic database + vector base map | Geodetic database | |||||||||
| Olsztyn | EGiB | BDOT10k | 0.50 | 0.60 | 1.0 | 19.36 159.94 | 59.22 71.56 | 48.67 23.98 | ||
| Geodetic database | Geodetic database | |||||||||
| 2 | Water network | Bielsko-Biała | BDOT500 | BDOT10k | 0.67 | 34.68 40.79 | ||||
| Geodetic database | Geodetic database | |||||||||
| Kielce | BDOT500 | BDOT10k | 0 (0/1) None | 0 0 | ||||||
| Geodetic database | Geodetic database | |||||||||
| Olsztyn | BDOT500 | BDOT10k | 0.5 | 72.99 49.12 | ||||||
| Geodetic database | Geodetic database | |||||||||
| 3 | Land cover objects (buildings) | Bielsko-Biała | EGiB | BDOT10k | 1.67 | 89.86 3.52 | ||||
| Geodetic database | Geodetic database | |||||||||
| Kielce | EGiB | BDOT10k | 1.43 | 94.87 0.65 | ||||||
| Geodetic database | Geodetic database | |||||||||
| Olsztyn | EGiB | BDOT10k | 0.83 | 91.88 12.72 | ||||||
| Geodetic database | Geodetic database | |||||||||
| 4 | Transportation network | Bielsko-Biała | BDOT500 | BDOT10k | 0.67 | 64.84 58.63 | ||||
| Geodetic database | Geodetic database | |||||||||
| Kielce | BDOT500 | BDOT10k | Roads: 0.67 | Tracks: 1.00 | Roads: 60.38 32.48 | Tracks: 4.74 1.02 | ||||
| Geodetic database + vector base map | Geodetic database | |||||||||
| Olsztyn | BDOT500 | BDOT10k | 0.44 | 1.00 | 70.23 39.89 | 6.65 17.34 | ||||
| Geodetic database | Geodetic database | |||||||||
| 5 | Utility networks | Bielsko-Biała | GESUT | BDOT10k | 1.0 | 15.17 4.28 | ||||
| Geodetic database | Geodetic database | |||||||||
| Kielce | GESUT | BDOT10k | 0.40 | 4.34 21.73 | ||||||
| Geodetic database | Geodetic database | |||||||||
| Olsztyn | GESUT | BDOT10k | 1.0 | 2.02 3.35 | ||||||
| Geodetic database | Geodetic database | |||||||||
Table A6.
Research results in research areas from the group of towns “M” for data quality elements.
Table A6.
Research results in research areas from the group of towns “M” for data quality elements.
| No. | Research Factor | Area | Databases Adopted for Research | Data Quality Element: 1. COMPLETENESS | ||||||
|---|---|---|---|---|---|---|---|---|---|---|
| Reference (Comparative) Database | Research Database | Descriptive Data (Attributes) | Spatial Data | |||||||
| Data Development Level: -Geodetic Database -Database + Vector Map -Complete Vector Map -Vector Map + Raster -Hybrid Data (Database + Vector + Raster) -Raster | Actual Number of Attributes of the Evaluated Base/Actual Number of Attributes in the Reference Base (Completeness of the Database Being Assessed in Relation to the Reference Database) | 1. Completeness (Kp) Degree of the Research Database in Relation to the Reference Database. 2. Redundancy (Np) Degree of the Research Database in Relation to the Reference Database. | ||||||||
| 1 | Land use | Andrychów | EGiB | BDOT10k | FORESTS | BUILDINGS | FARMLAND | FORESTS | BUILDINGS | FARMLAND |
| 0.5 | 1.0 | 1.0 | 48.15 66.76 | 72.50 53.40 | 82.13 0.50 | |||||
| Geodetic database | Geodetic database | |||||||||
| Jędrzejów | BDOT10k | 1/0 None in reference | 1.0 | 0.7 | 100 0 | 68.91 55.63 | 92.62 2.25 | |||
| vector map + raster | Geodetic database | |||||||||
| Grójec | EGiB | BDOT10k | None | 0.8 | 1.0 | None | 84.52 1.93 | 67.56 62.25 | ||
| database + vector map | Geodetic database | |||||||||
| 2 | Water network | Andrychów | BDOT500 | BDOT10k | 0.33 | 22.45 (Kp) 98.44 (Np) | ||||
| Geodetic database | Geodetic database | |||||||||
| Jędrzejów | BDOT10k | 1.0 | 46.08 20.04 | |||||||
| vector map + raster | Geodetic database | |||||||||
| Grójec | BDOT10k | None | None | |||||||
| vector map + raster | Geodetic database | |||||||||
| 3 | Land cover objects (buildings) | Andrychów | EGiB | BDOT10k | 0.50 | 76.65 34.86 | ||||
| Geodetic database | Geodetic database | |||||||||
| Jędrzejów | BDOT10k | 0.71 | 97.97 2.41 | |||||||
| vector map + raster | Geodetic database | |||||||||
| Grójec | BDOT10k | 0.63 | 84.86 3.93 | |||||||
| complete vector map | Geodetic database | |||||||||
| 4 | Transportation network | Andrychów | BDOT500 | BDOT10k | 0.43 | 43.50 80.47 | ||||
| Geodetic database | Geodetic database | |||||||||
| Jędrzejów | BDOT10k | 0.33 | 23.67 10.75 | |||||||
| vector map + raster | Geodetic database | |||||||||
| Grójec | BDOT10k | 0.57 | 64.42 8.59 | |||||||
| complete vector map | Geodetic database | |||||||||
| 5 | Utility networks | Andrychów | BDOT10k | 2.0 | 0.07 15.50 | |||||
| complete vector map | Geodetic database | |||||||||
| Jędrzejów | BDOT10k | 1.0 | 12.30 3.07 | |||||||
| vector map + raster | Geodetic database | |||||||||
| Grójec | BDOT10k | 1.0 | 5.63 5.25 | |||||||
| complete vector map | Geodetic database | |||||||||
Table A7.
Research results in research areas from the group of towns villages located in the centre of the municipality “GC” for data quality elements.
Table A7.
Research results in research areas from the group of towns villages located in the centre of the municipality “GC” for data quality elements.
| No. | Research Factor | Area | Databases Adopted for Research | Data Quality Element: 1. COMPLETENESS | ||||||
|---|---|---|---|---|---|---|---|---|---|---|
| Reference (Comparative) Database | Research Database | Descriptive Data (Attributes) | Spatial Data | |||||||
| Data Development Level: -Geodetic Database -Database + Vector Map -Complete Vector Map -Vector Map + Raster -Hybrid Data (Database + Vector + Raster) -Raster | Actual Number of Attributes of the Evaluated Base/Actual Number of Attributes in the Reference Base (Completeness of the Database Being Assessed in Relation to the Reference Database) | 1. Completeness (Kp) Degree of the Research Database in Relation to the Reference Database. 2. Redundancy (Np) Degree of the Research Database in Relation to the Reference Database. | ||||||||
| 1 | Land use | Lubasz | EGiB | BDOT10k | FORESTS | BUILDINGS | FARMLAND | FORESTS | BUILDINGS | FARMLAND |
| 0.5 | 0.75 | 0.67 | 56.46 33.78 | 72.45 38.78 | 50.47 10.44 | |||||
| Geodetic database | Geodetic database | |||||||||
| Rajcza | EGiB | BDOT10k | 1.0 | 0.75 | 0.50 | 66.43 3.66 | 48.41 20.87 | 68.04 51.94 | ||
| Geodetic database | Geodetic database | |||||||||
| Łączna | BDOT10k | 0.5 | 1.0 | 0.67 | 44.03 4.41 | 66.36 18.74 | 64.58 59.63 | |||
| complete vector map | Geodetic database | |||||||||
| 2 | Water network | Lubasz | BDOT500 | BDOT10k | 1/0 None in BDOT500 and raster. | 0 (Kp) 152.45 (Np) | ||||
| database + raster | Geodetic database | |||||||||
| Rajcza | BDOT10k | 2.0 | 3.14 94.37 | |||||||
| complete vector map | Geodetic database | |||||||||
| Łączna | BDOT10k | 1.0 | 40.16 96.81 | |||||||
| complete vector map | Geodetic database | |||||||||
| 3 | Land cover objects (buildings) | Lubasz | EGiB | BDOT10k | 1.8 | 94.42 4.35 | ||||
| Geodetic database | Geodetic database | |||||||||
| Rajcza | EGiB | BDOT10k | 1.13 | 95.71 5.35 | ||||||
| Geodetic database | Geodetic database | |||||||||
| Łączna | BDOT10k | 1.40 | 94.08 1.97 | |||||||
| complete vector map | Geodetic database | |||||||||
| 4 | Transportation network | Lubasz | BDOT500 | BDOT10k | 1.50 | 69.05 21.38 | ||||
| database + raster | Geodetic database | |||||||||
| Rajcza | BDOT10k | 0.67 | 56.36 54.11 | |||||||
| complete vector map | Geodetic database | |||||||||
| Łączna | BDOT10k | 1.0 | 74.86 26.52 | |||||||
| complete vector map | Geodetic database | |||||||||
| 5 | Utility networks | Lubasz | GESUT | BDOT10k | 0.67 | 2.15 73.05 | ||||
| database + raster | Geodetic database | |||||||||
| Rajcza | BDOT10k | 0.67 | 2.49 12.46 | |||||||
| complete vector map | Geodetic database | |||||||||
| Łączna | BDOT10k | 0.33 | 4.24 24.47 | |||||||
| complete vector map | Geodetic database | |||||||||
Table A8.
Research results in research areas from the group of towns villages located on the outskirts of the municipality “GZ” for data quality elements.
Table A8.
Research results in research areas from the group of towns villages located on the outskirts of the municipality “GZ” for data quality elements.
| No. | Research Factor | Area | Databases Adopted for Research | Data Quality Element: 1. COMPLETENESS | ||||||
|---|---|---|---|---|---|---|---|---|---|---|
| Reference (Comparative) Database | Research Database | Descriptive Data (Attributes) | Spatial Data | |||||||
| Data Development Level: -Geodetic Database -Database + Vector Map -Complete Vector Map -Vector Map + Raster -Hybrid Data (Database + Vector + Raster) -Raster | Actual Number of Attributes of the Evaluated Base/Actual Number of Attributes in the Reference Base (Completeness of the Database Being Assessed in Relation to the Reference Database) | 1. Completeness (Kp) Degree of the Research Database in Relation to the Reference Database. 2. Redundancy (Np) Degree of the Research Database in Relation to the Reference Database. | ||||||||
| 1 | Land use | Klempicz | EGiB | BDOT10k | FORESTS | BUILDINGS | FARMLAND | FORESTS | BUILDINGS | FARMLAND |
| 2.0 | 0.60 | 0.33 | 46.83 13.61 | 54.91 76.45 | 71.18 21.08 | |||||
| Geodetic database | Geodetic database | |||||||||
| Rycerka Dolna | EGiB | BDOT10k | 2/0 None in reference | 1.0 | 1.0 | 0 0 | 33.09 2.06 | 51.97 64.33 | ||
| Geodetic database | Geodetic database | |||||||||
| Zagórze | BDOT10k | (1/0) None in reference | 1.0 | 0.67 | 0 0 | 87.93 18.35 | 93.16 9.87 | |||
| complete vector map | Geodetic database | |||||||||
| 2 | Water network | Klempicz | BDOT500 | BDOT10k | 1.5 | 29.66 (Kp) 70.01 (Np) | ||||
| database + raster | Geodetic database | |||||||||
| Rycerka Dolna | BDOT10k | 2.00 | 18.10 12.04 | |||||||
| complete vector map | Geodetic database | |||||||||
| Zagórze | BDOT10k | (2/0) None in reference | 0 0 | |||||||
| complete vector map | Geodetic database | |||||||||
| 3 | Land cover objects (buildings) | Klempicz | EGiB | BDOT10k | 0.75 | 92.92 9.15 | ||||
| hybrid data (database + vector + raster) | Geodetic database | |||||||||
| Rycerka Dolna | EGiB | BDOT10k | 0.29 | 88.87 12.60 | ||||||
| Geodetic database | Geodetic database | |||||||||
| Zagórze | BDOT10k | 0.40 | 97.94 3.94 | |||||||
| complete vector map | Geodetic database | |||||||||
| 4 | Transportation network | Klempicz | BDOT500 | BDOT10k | 1.0 | 57.11 15.70 | ||||
| hybrid data (database + vector + raster) | Geodetic database | |||||||||
| Rycerka Dolna | BDOT10k | 1.50 | 68.36 10.26 | |||||||
| complete vector map | Geodetic database | |||||||||
| Zagórze | BDOT10k | 2.00 | 75.36 2.58 | |||||||
| complete vector map | Geodetic database | |||||||||
| 5 | Utility networks | Lubasz | GESUT | BDOT10k | 0.50 | 3.13 15.77 | ||||
| hybrid data (database + vector + raster) | Geodetic database | |||||||||
| Rajcza | BDOT10k | 1.0 | 7.13 178.22 | |||||||
| complete vector map | Geodetic database | |||||||||
| Łączna | BDOT10k | 1.5 | 2.53 17.10 | |||||||
| complete vector map | Geodetic database | |||||||||
Table A9.
Research results in research areas from the group of towns villages located on the outskirts of the municipality, in agricultural areas “GR” for data quality elements.
Table A9.
Research results in research areas from the group of towns villages located on the outskirts of the municipality, in agricultural areas “GR” for data quality elements.
| No. | Research Factor | Area | Databases Adopted for Research | Data Quality Element: 1. COMPLETENESS | ||||||
|---|---|---|---|---|---|---|---|---|---|---|
| Reference (Comparative) Database | Research Database | Descriptive Data (Attributes) | Spatial Data | |||||||
| Data Development Level: -Geodetic Database -Database + Vector Map -Complete Vector Map -Vector Map + Raster -Hybrid Data (Database + Vector + Raster) -Raster | Actual Number of Attributes of the Evaluated Base/Actual Number of Attributes in the Reference Base (Completeness of the Database Being Assessed in Relation to the Reference Database) | 1. Completeness (Kp) Degree of the Research Database in Relation to the Reference Database. 2. Redundancy (Np) Degree of the Research Database in Relation to the Reference Database. | ||||||||
| 1 | Land use | Stajkowo | EGiB | BDOT10k | FORESTS | BUILDINGS | FARMLAND | FORESTS | BUILDINGS | FARMLAND |
- | - | 1.00 | - | - | 97.07 0.00 | |||||
| Geodetic database | Geodetic database | |||||||||
| Rycerka Górna | EGiB | BDOT10k | - | - | 1.00 | - | - | 93.87 0.00 | ||
| Geodetic database | Geodetic database | |||||||||
| Występa | BDOT10k | 0.5 | - | 0.67 | 43.77 2.65 | - | 93.41 11.98 | |||
| vector map + raster | Geodetic database | |||||||||
| 2 | Water network | Stajkowo | BDOT500 | BDOT10k | 2/0 None in reference | 24.17 (Kp) 145.46 (Np) | ||||
| database + vector map | Geodetic database | |||||||||
| Rycerka Górna | BDOT10k | None | None | |||||||
| complete vector map | Geodetic database | |||||||||
| Występa | BDOT10k | None | None | |||||||
| complete vector map | Geodetic database | |||||||||
| 3 | Land cover objects (buildings) | Stajkowo | EGiB | BDOT10k | None | None | ||||
| Geodetic database | Geodetic database | |||||||||
| Rycerka Górna | BDOT10k | None | None | |||||||
| complete vector map | Geodetic database | |||||||||
| Występa | BDOT10k | None | None | |||||||
| vector map + raster | Geodetic database | |||||||||
| 4 | Transportation network | Stajkowo | BDOT500 | BDOT10k | None | None | ||||
| hybrid data (database + vector + raster) | Geodetic database | |||||||||
| Rycerka Górna | BDOT10k | 0 (0/1) None in BDOT10k | 0.00 200.00 | |||||||
| complete vector map | Geodetic database | |||||||||
| Występa | BDOT10k | 1.0 | 24.02 13.89 | |||||||
| complete vector map | Geodetic database | |||||||||
| 5 | Utility networks | Stajkowo | GESUT | BDOT10k | None | None | ||||
| hybrid data (database + vector + raster) | Geodetic database | |||||||||
| Rajcza | BDOT10k | 1.0 (1/1) | 0.82 0.04 | |||||||
| complete vector map | Geodetic database | |||||||||
| Łączna | BDOT10k | 1.0 | 8.31 3.75 | |||||||
| complete vector map | Geodetic database | |||||||||
Appendix D
Table A10.
Suitability assessment score for BDOT10k and DEM databases in the research areas of the group of province capitals “W”.
Table A10.
Suitability assessment score for BDOT10k and DEM databases in the research areas of the group of province capitals “W”.
| Łódź | |||
| Suitability element | Weight | Coefficient score value | Product |
| 2 | 0.05 | 0.10 | |
| 2 | 0.50 | 1.00 | |
| 2 | 0.80 | 1.60 | |
| 1 | 0.11 | 0.11 | |
| 3 | 0.38 | 1.13 | |
| 3 | 1.00 | 3.00 | |
| 3 | 10.00 | 30.00 | |
| total | 16 | total | 36.94 |
| 2.31 | |||
| Poznań | |||
| Suitability element | Weight | Coefficient score value | Product |
| 2 | 0.59 | 1.18 | |
| 2 | 0.86 | 1.72 | |
| 2 | 0.99 | 1.98 | |
| 1 | 0.70 | 0.70 | |
| 3 | 0.79 | 2.37 | |
| 3 | 1.00 | 3.00 | |
| 3 | 10.00 | 30.00 | |
| total | 16 | suma | 40.95 |
| 2.56 | |||
| Szczecin | |||
| Suitability element | Weight | Coefficient score value | Product |
| 2 | 0.05 | 0.10 | |
| 2 | 0.25 | 0.50 | |
| 2 | 0.88 | 1.76 | |
| 1 | 0.00 | 0.00 | |
| 3 | 0.62 | 1.86 | |
| 3 | 1.00 | 3.00 | |
| 3 | 10.00 | 30.00 | |
| total | 16 | suma | 37.22 |
| 2.33 | |||
Table A11.
Suitability assessment score for BDOT10k and DEM databases in the research areas from the group of poviat capitals “P”.
Table A11.
Suitability assessment score for BDOT10k and DEM databases in the research areas from the group of poviat capitals “P”.
| Bielsko-Biała | |||
| Suitability Element | Weight | Coefficient Score Value | Product |
| 2 | 0.15 | 0.30 | |
| 2 | 0.65 | 1.30 | |
| 2 | 0.90 | 1.80 | |
| 1 | 0.35 | 0.35 | |
| 3 | 0.54 | 1.62 | |
| 3 | 1.00 | 3.00 | |
| 3 | 10.00 | 30.00 | |
| total | 16 | suma | 38.37 |
| 2.40 | |||
| Kielce | |||
| Suitability element | Weight | Coefficient score value | Product |
| 2 | 0.04 | 0.08 | |
| 2 | 0.60 | 1.20 | |
| 2 | 0.95 | 1.90 | |
| 1 | 0.00 | 0.00 | |
| 3 | 0.24 | 0.71 | |
| 3 | 0.86 | 2.58 | |
| 3 | 10.00 | 30.00 | |
| total | 16 | suma | 36.47 |
| 2.28 | |||
| Olsztyn | |||
| Suitability element | Weight | Coefficient score value | Product |
| 2 | 0.02 | 0.04 | |
| 2 | 0.70 | 1.40 | |
| 2 | 0.92 | 1.84 | |
| 1 | 0.73 | 0.73 | |
| 3 | 0.42 | 1.27 | |
| 3 | 1.00 | 3.00 | |
| 3 | 10.00 | 30.00 | |
| total | 16 | suma | 38.28 |
| 2.39 | |||
Table A12.
Suitability assessment score for BDOT10k and DEM databases in the research areas from the group of towns “M”.
Table A12.
Suitability assessment score for BDOT10k and DEM databases in the research areas from the group of towns “M”.
| Jędrzejów | |||
| Suitability element | Weight | Coefficient score value | Product |
| 2 | 0.12 | 0.24 | |
| 2 | 0.24 | 0.48 | |
| 2 | 0.98 | 1.96 | |
| 1 | 0.46 | 0.46 | |
| 3 | 0.87 | 2.60 | |
| 3 | 0.30 | 0.90 | |
| 3 | 6.67 | 20.00 | |
| total | 16 | suma | 26.64 |
| 1.67 | |||
| Andrychów | |||
| Suitability element | Weight | Coefficient score value | Product |
| 2 | 0.16 | 0.32 | |
| 2 | 0.44 | 0.88 | |
| 2 | 0.77 | 1.54 | |
| 1 | 0.23 | 0.23 | |
| 3 | 0.67 | 2.02 | |
| 3 | 0.90 | 2.70 | |
| 3 | 6.67 | 20.00 | |
| total | 16 | suma | 27.69 |
| 1.73 | |||
| Grójec | |||
| Suitability element | Weight | Coefficient score value | Product |
| 2 | 0.06 | 0.12 | |
| 2 | 0.64 | 1.28 | |
| 2 | 0.85 | 1.70 | |
| 1 | 0.00 | 0.00 | |
| 3 | 0.77 | 2.30 | |
| 3 | 0.73 | 2.19 | |
| 3 | 6.67 | 20.00 | |
| total | 16 | suma | 27.59 |
| 1.72 | |||
Table A13.
Suitability assessment score for BDOT10k and DEM databases in the research areas from the group of villages located in the centre of the municipality “GC”.
Table A13.
Suitability assessment score for BDOT10k and DEM databases in the research areas from the group of villages located in the centre of the municipality “GC”.
| Lubasz | |||
| Suitability element | Weight | Coefficient score value | Product |
| 2 | 0.02 | 0.04 | |
| 2 | 0.69 | 1.38 | |
| 2 | 0.94 | 1.88 | |
| 1 | 0.29 | 0.29 | |
| 3 | 0.59 | 1.78 | |
| 3 | 0.53 | 1.59 | |
| 3 | 6.67 | 20.00 | |
| total | 16 | suma | 26.96 |
| 1.69 | |||
| Rajcza | |||
| Suitability element | Weight | Coefficient score value | Product |
| 2 | 0.02 | 0.04 | |
| 2 | 0.56 | 1.12 | |
| 2 | 0.96 | 1.92 | |
| 1 | 0.03 | 0.03 | |
| 3 | 0.61 | 1.82 | |
| 3 | 0.73 | 2.19 | |
| 3 | 10.00 | 30.00 | |
| total | 16 | suma | 37.12 |
| 2.32 | |||
| Łączna | |||
| Suitability element | Weight | Coefficient score value | Product |
| 2 | 0.04 | 0.08 | |
| 2 | 0.75 | 1.50 | |
| 2 | 0.94 | 1.88 | |
| 1 | 0.40 | 0.40 | |
| 3 | 0.58 | 1.75 | |
| 3 | 0.70 | 2.10 | |
| 3 | 6.67 | 20.00 | |
| total | 16 | suma | 27.71 |
| 1.73 | |||
Table A14.
Suitability assessment score for BDOT10k and DEM databases in the research areas from the group of villages located on the outskirts of the municipality “GZ”.
Table A14.
Suitability assessment score for BDOT10k and DEM databases in the research areas from the group of villages located on the outskirts of the municipality “GZ”.
| Klempicz | |||
| Suitability element | Weight | Coefficient score value | Product |
| 2 | 0.03 | 0.06 | |
| 2 | 0.18 | 0.36 | |
| 2 | 0.93 | 1.86 | |
| 1 | 0.30 | 0.30 | |
| 3 | 0.58 | 1.73 | |
| 3 | 0.53 | 1.59 | |
| 3 | 6.67 | 20.00 | |
| total | 16 | suma | 25.90 |
| 1.62 | |||
| Rycerka Dolna | |||
| Suitability element | Weight | Coefficient score value | Product |
| 2 | 0.07 | 0.14 | |
| 2 | 0.68 | 1.36 | |
| 2 | 0.89 | 1.78 | |
| 1 | 0.18 | 0.18 | |
| 3 | 0.43 | 1.28 | |
| 3 | 0.73 | 2.19 | |
| 3 | 10.00 | 30.00 | |
| total | 16 | suma | 36.93 |
| 2.31 | |||
| Zagórze | |||
| Suitability element | Weight | Coefficient score value | Product |
| 2 | 0.03 | 0.06 | |
| 2 | 0.75 | 1.50 | |
| 2 | 0.98 | 1.96 | |
| 1 | 0.00 | 0.00 | |
| 3 | 0.91 | 2.72 | |
| 3 | 0.70 | 2.10 | |
| 3 | 6.67 | 20.00 | |
| total | 16 | suma | 28.34 |
| 1.77 | |||
Table A15.
Suitability assessment score for BDOT10k and DEM databases in the research areas from the group of villages located on the outskirts of the municipality, in agricultural areas “GR”.
Table A15.
Suitability assessment score for BDOT10k and DEM databases in the research areas from the group of villages located on the outskirts of the municipality, in agricultural areas “GR”.
| Stajkowo | |||
| Suitability element | Weight | Coefficient score value | Product |
| 2 | 0.00 | 0.00 | |
| 2 | 0.00 | 0.00 | |
| 2 | 0.00 | 0.00 | |
| 1 | 0.24 | 0.24 | |
| 3 | 0.97 | 2.91 | |
| 3 | 0.53 | 1.59 | |
| 3 | 6.67 | 20.00 | |
| total | 16 | suma | 24.74 |
| 1.55 | |||
| Rycerka Górna | |||
| Suitability element | Weight | Coefficient score value | Product |
| 2 | 0.08 | 0.16 | |
| 2 | 0.00 | 0.00 | |
| 2 | 0.00 | 0.00 | |
| 1 | 0.00 | 0.00 | |
| 3 | 0.94 | 2.82 | |
| 3 | 0.73 | 2.19 | |
| 3 | 10.00 | 30.00 | |
| total | 16 | suma | 35.17 |
| 2.20 | |||
| Występa | |||
| Suitability element | Weight | Coefficient score value | Product |
| 2 | 0.08 | 0.16 | |
| 2 | 0.24 | 0.48 | |
| 2 | 0.00 | 0.00 | |
| 1 | 0.00 | 0.00 | |
| 3 | 0.69 | 2.06 | |
| 3 | 0.56 | 1.68 | |
| 3 | 6.67 | 20.00 | |
| total | 16 | suma | 24.38 |
| 1.52 | |||
References
- Tomaszewski, K.; Sekściński, A. Odnawialne Źródła Energii w Polsce—Perspektywa Lokalna i Regionalna. Rynek Energii 2020, 4, 10–19. [Google Scholar]
- Dmowski, A. Rosłaniec Łukasz Odnawialne Źródła Energii—Możliwości i Ograniczenia w Warunkach Polskich. In Proceedings of the II Szkoła Energetyki Jądrowej, Warszawa, Poland, 3 November 2009; pp. 1–16. [Google Scholar]
- Agencja Rynku Energii, S.A. Sytuacja Energetyczna w Polsce—Krajowy Bilans Energii. Q. Bull. 2023, 4, 1–51. [Google Scholar]
- Statistics Poland Energy from Renewable Sources in 2022. Available online: https://stat.gov.pl/en/topics/environment-energy/energy/energy-from-renewable-sources-in-2022,9,2.html (accessed on 15 July 2024).
- Teleszewski, T.J. Warianty Lokalizacji Elektrowni Wiatrowych w Obszarze Zurbanizowanym Na Podstawie Pomiaru Prędkości Wiatru—Badania Wstępne. Bud. O Zoptymalizowanym Potencjale Energetycznym 2018, 7, 83–88. [Google Scholar] [CrossRef]
- European Small Hydropower Association. State of the Art of Small Hydropower in EU-25. Policy 2010, 12, 14. Available online: https://www.globalccsinstitute.com/resources/publications-reports-research/state-of-the-art-of-small-hydropower-in-eu-25/ (accessed on 11 May 2023).
- Asoh, D.A.; Mbinkar, E.N.; Moutlen, A.N. Load Frequency Control of Small Hydropower Plants Using One-Input Fuzzy PI Controller with Linear and Non-Linear Plant Model. Smart Grid Renew. Energy 2022, 13, 1–16. [Google Scholar] [CrossRef]
- Chen, J.; Li, H. Analysis of Switching Overvoltage in Regional Grid with Small Hydropower Plants. Engineering 2013, 5, 19–23. [Google Scholar] [CrossRef]
- Kwartnik-Pruc, A.; Mączyńska, A. Methodology of Assessing Quality of Spatial Data Describing Course of Shoreline as Tool Supporting Water Resource Management Process. J. Water Land Dev. 2023, 167–180. [Google Scholar] [CrossRef]
- Azevêdo, V.; Candeias, A.; Tiba, C. Location Study of Solar Thermal Power Plant in the State of Pernambuco Using Geoprocessing Technologies and Multiple-Criteria Analysis. Energies 2017, 10, 1042. [Google Scholar] [CrossRef]
- Yankiv-Vitkovska, L.; Peresunko, B.; Wyczałek, I.; Papis, J. Site Selection for Solar Power Plant in Zaporizhia City (Ukraine). Geod. Cartogr. 2023, 69, 97–116. [Google Scholar] [CrossRef]
- Guaita-Pradas, I.; Marques-Perez, I.; Gallego, A.; Segura, B. Analyzing Territory for the Sustainable Development of Solar Photovoltaic Power Using GIS Databases. Environ. Monit. Assess. 2019, 191, 764. [Google Scholar] [CrossRef]
- Synowiec, W.; Luc, M. A Multicriterial Evaluation of Land Suitability for Wind Energy Development, as Exemplified by Poland’s Gmina of Rymanów. Przegląd Geogr. 2013, 85, 323–352. [Google Scholar] [CrossRef]
- Szurek, M.; Blachowski, J.; Nowacka, A. GIS-Based Method for Wind Farm Location Multi-Criteria Analysis. Min. Sci. 2014, 21, 65–81. [Google Scholar]
- Watson, J.J.W.; Hudson, M.D. Regional Scale Wind Farm and Solar Farm Suitability Assessment Using GIS-Assisted Multi-Criteria Evaluation. Landsc. Urban Plan. 2015, 138, 20–31. [Google Scholar] [CrossRef]
- Aydin, N.Y.; Kentel, E.; Duzgun, S. GIS-Based Environmental Assessment of Wind Energy Systems for Spatial Planning: A Case Study from Western Turkey. Renew. Sustain. Energy Rev. 2010, 14, 364–373. [Google Scholar] [CrossRef]
- Konstantinos, I.; Georgios, T.; Garyfalos, A. A Decision Support System Methodology for Selecting Wind Farm Installation Locations Using AHP and TOPSIS: Case Study in Eastern Macedonia and Thrace Region, Greece. Energy Policy 2019, 132, 232–246. [Google Scholar] [CrossRef]
- Hajto, M.; Cichocki, Z.; Bidłasik, M.; Borzyszkowski, J.; Kuśmierz, A. Constraints on Development of Wind Energy in Poland Due to Environmental Objectives. Is There Space in Poland for Wind Farm Siting? Environ. Manag. 2017, 59, 204–217. [Google Scholar] [CrossRef]
- Gigović, L.; Pamučar, D.; Božanić, D.; Ljubojević, S. Application of the GIS-DANP-MABAC Multi-Criteria Model for Selecting the Location of Wind Farms: A Case Study of Vojvodina, Serbia. Renew. Energy 2017, 103, 501–521. [Google Scholar] [CrossRef]
- Miller, A.; Li, R. A Geospatial Approach for Prioritizing Wind Farm Development in Northeast Nebraska, USA. ISPRS Int. J. Geoinf. 2014, 3, 968–979. [Google Scholar] [CrossRef]
- Yeh, T.-M.; Huang, Y.-L. Factors in Determining Wind Farm Location: Integrating GQM, Fuzzy DEMATEL, and ANP. Renew. Energy 2014, 66, 159–169. [Google Scholar] [CrossRef]
- Majewski, G.; Nasilowska, B. Wind Energy—Assessment of Resources and Investment Problems in Renewable Sources of Energy Based on the Commune Latowicz. Sci. Rev.-Eng. Environ. Sci. 2011, 51, 61–71. [Google Scholar]
- Arán Carrión, J.; Espín Estrella, A.; Aznar Dols, F.; Zamorano Toro, M.; Rodríguez, M.; Ramos Ridao, A. Environmental Decision-Support Systems for Evaluating the Carrying Capacity of Land Areas: Optimal Site Selection for Grid-Connected Photovoltaic Power Plants. Renew. Sustain. Energy Rev. 2008, 12, 2358–2380. [Google Scholar] [CrossRef]
- Suuronen, A.; Lensu, A.; Kuitunen, M.; Andrade-Alvear, R.; Celis, N.G.; Miranda, M.; Perez, M.; Kukkonen, J.V.K. Optimization of Photovoltaic Solar Power Plant Locations in Northern Chile. Environ. Earth Sci. 2017, 76, 824. [Google Scholar] [CrossRef]
- Charabi, Y.; Gastli, A. PV Site Suitability Analysis Using GIS-Based Spatial Fuzzy Multi-Criteria Evaluation. Renew. Energy 2011, 36, 2554–2561. [Google Scholar] [CrossRef]
- Tsoutsos, T.; Maria, E.; Mathioudakis, V. Sustainable Siting Procedure of Small Hydroelectric Plants: The Greek Experience. Energy Policy 2007, 35, 2946–2959. [Google Scholar] [CrossRef]
- Jeftenić, G.; Rašeta, A.; Kolaković, S.; Panić, M.; Kolaković, S.; Mandić, V. A Methodology Proposal for Selecting the Optimal Location for Small Hydropower Plants. Teh. Vjesn.-Tech. Gaz. 2021, 28, 1462–1470. [Google Scholar] [CrossRef]
- Rojanamon, P.; Chaisomphob, T.; Bureekul, T. Application of Geographical Information System to Site Selection of Small Run-of-River Hydropower Project by Considering Engineering/Economic/Environmental Criteria and Social Impact. Renew. Sustain. Energy Rev. 2009, 13, 2336–2348. [Google Scholar] [CrossRef]
- Nur, W.H.; Yuliana, Y.; Susilowati, Y.; Kumoro, Y.; Yunarto, Y. Overview about GIS Multi-Criteria Spatial Analysis for Micro Hydropower Plant Site Suitability in South Ogan Komering Ulu District, South Sumatera, Indonesia. Bull. Electr. Eng. Inform. 2021, 10, 1024–1034. [Google Scholar] [CrossRef]
- Strebkov, D.S.; Shogenov, Y.K.; Bobovnikov, N.Y. Improving the Efficiency of Solar Power Plants. Eng. Technol. Syst. 2020, 30, 480–497. [Google Scholar] [CrossRef]
- Kwartnik-Pruc, A.; Mączyńska, A. Assessing Validity of Employing Surveying Methods to Capture Data on Topography to Determine Hydrological and Topographic Parameters Essential for Selecting Locations for the Construction of Small Hydropower Plants. Energies 2022, 15, 1527. [Google Scholar] [CrossRef]
- Act of 17 May 1989 Geodetic and Cartographic Law. Official Journal of 2024, Item 1151 (as Amended). Available online: https://isap.sejm.gov.pl/isap.nsf/download.xsp/WDU19890300163/U/D19890163Lj.pdf (accessed on 15 September 2024).
- Izdebski, W.; Seremet, A. Praktyczne Aspekty Infrastruktury Danych Przestrzennych w Polsce; Główny Urząd Geodezji i Kartografii: Warszawa, Poland, 2020; pp. 1–132. [Google Scholar]
- Ślusarski, M. Improving the Dates Quality in the County’s Geoinformation System. Infrastruct. Ecol. Rural Areas 2012, 9, 41–47. [Google Scholar]
- Siejka, M.; Ślusarski, M. The Qualitative Analysis Data in Spatial Registration of Utility Infrastructure. Infrastruct. Ecol. Rural Areas 2013, 10, 119–126. [Google Scholar]
- Bielecka, E. Principles of Spatial Data Quality Assessment and Their Use for Quality Assessment of Data Stored in TBD. Rocz. Geomatyki 2010, 8, 53–66. [Google Scholar]
- Bielecka, E. Geographical Data Sets Fitness of Use Evaluation. Geod. Vestn. 2015, 59, 335–348. [Google Scholar] [CrossRef]
- Cichociński, P. Assessment of Openstreetmap Suitability as a Data Source for Network Analysis. Rocz. Geomatyki 2012, X, 15–26. [Google Scholar]
- PN-EN ISO 19114:2005; Geographic Information—Quality Evaluation Procedures. Polish Committee for Standardization: Warszawa, Poland, 2005.
- Regulation of the Minister of Interior and Administration of 17 November 2011 on the Database of Topographic Objects and the Database of General Geographic Objects, as Well as Standard Cartographic Studies. Official Journal of 2011, No 279, Item 1642. Available online: https://isap.sejm.gov.pl/isap.nsf/DocDetails.xsp?id=WDU20112791642 (accessed on 15 September 2024).
- Regulation of the Minister of Development, Labour and Technology of 27 July 2021 on the Registration of Land and Buildings. Official Journal of 2021, Item 1390 (as Amended). Available online: https://isap.sejm.gov.pl/isap.nsf/download.xsp/WDU20210001390/O/D20211390.pdf (accessed on 15 September 2024).
- Regulation of the Minister of Development, Labour and Technology of 28 July 2021 on the Geodetic Register of Land Development Networks. Official Journal of 2021, Item 1374 (as Amended). Available online: https://isap.sejm.gov.pl/isap.nsf/download.xsp/WDU20210001374/O/D20211374.pdf (accessed on 15 September 2024).
- Regulation of the Minister of Development, Labour and Technology of 23 July 2021 on the Database of Topographic Objects and the Base Map. Official Journal of 2021, Item 1385 (as Amended). Available online: https://isap.sejm.gov.pl/isap.nsf/download.xsp/WDU20210001385/O/D20211385.pdf (accessed on 15 September 2024).
- Regulation of the Minister of Development of 18 August 2020 on Technical Standards for Performing Situational and Altimetric Geodetic Measurements and Developing and Transferring the Results of Such Measurements to the National Geodetic and Cartographic Resource. Official Journal of 2020, Item 1429 (as Amended). Available online: https://isap.sejm.gov.pl/isap.nsf/download.xsp/WDU20200001429/O/D20201429.pdf (accessed on 15 September 2024).
- ISO 8402:1994; Quality Management and Quality Assurance—Vocabulary. Polish Committee for Standardization: Warszawa, Poland, 1994.
- Gaździcki, J. The Social Usability of Geoinformation Products. Rocz. Geomatyki 2013, XI, 11–14. [Google Scholar]
- PN-EN ISO 19113:2005; Geographic Information—Quality Principles. Polish Committee for Standardization: Warszawa, Poland, 2005.
- Ślusarski, M. Methods and Models for the Assessment of the of Spatial Data Quality; Wydawnictwo Uniwersytetu Rolniczego w Krakowie: Krakowie, Poland, 2017; pp. 1–205. [Google Scholar]
- PN-EN ISO 19157:2014:04; Geographic Information—Data Quality. Polish Committee for Standardization: Warszawa, Poland, 2014.
- Nowak Da Costa, J. Novel Tool for Examination of Data Completeness Based on a Comparative Study of VGI Data and Official Building Datasets. Geod. Vestn. 2016, 60, 495–508. [Google Scholar] [CrossRef]
- Mączyńska, A.; Kwartnik-Pruc, A. Accuracy of Determination of the Running of the Shoreline on Orthophoto Map. In Proceedings of the Geographic Information Systems Conference and Exhibition “GIS ODYSSEY”, Perugia, Italy, 10–14 September 2018; pp. 346–353. [Google Scholar]
- Lados, M.; Somossy, É.S.; Tóth, T. Financial Subsidies and the Location Decision of Solar Power Plants in Hungary: An Empirical Investigation. Reg. Stat. 2020, 10, 166–185. [Google Scholar] [CrossRef]


Disclaimer/Publisher’s Note: The statements, opinions and data contained in all publications are solely those of the individual author(s) and contributor(s) and not of MDPI and/or the editor(s). MDPI and/or the editor(s) disclaim responsibility for any injury to people or property resulting from any ideas, methods, instructions or products referred to in the content. |
© 2024 by the authors. Licensee MDPI, Basel, Switzerland. This article is an open access article distributed under the terms and conditions of the Creative Commons Attribution (CC BY) license (https://creativecommons.org/licenses/by/4.0/).