
Application of PVT Coupled Solar Heat Pump System in the Renovation of Existing Campus Buildings

Abstract
1. Introduction
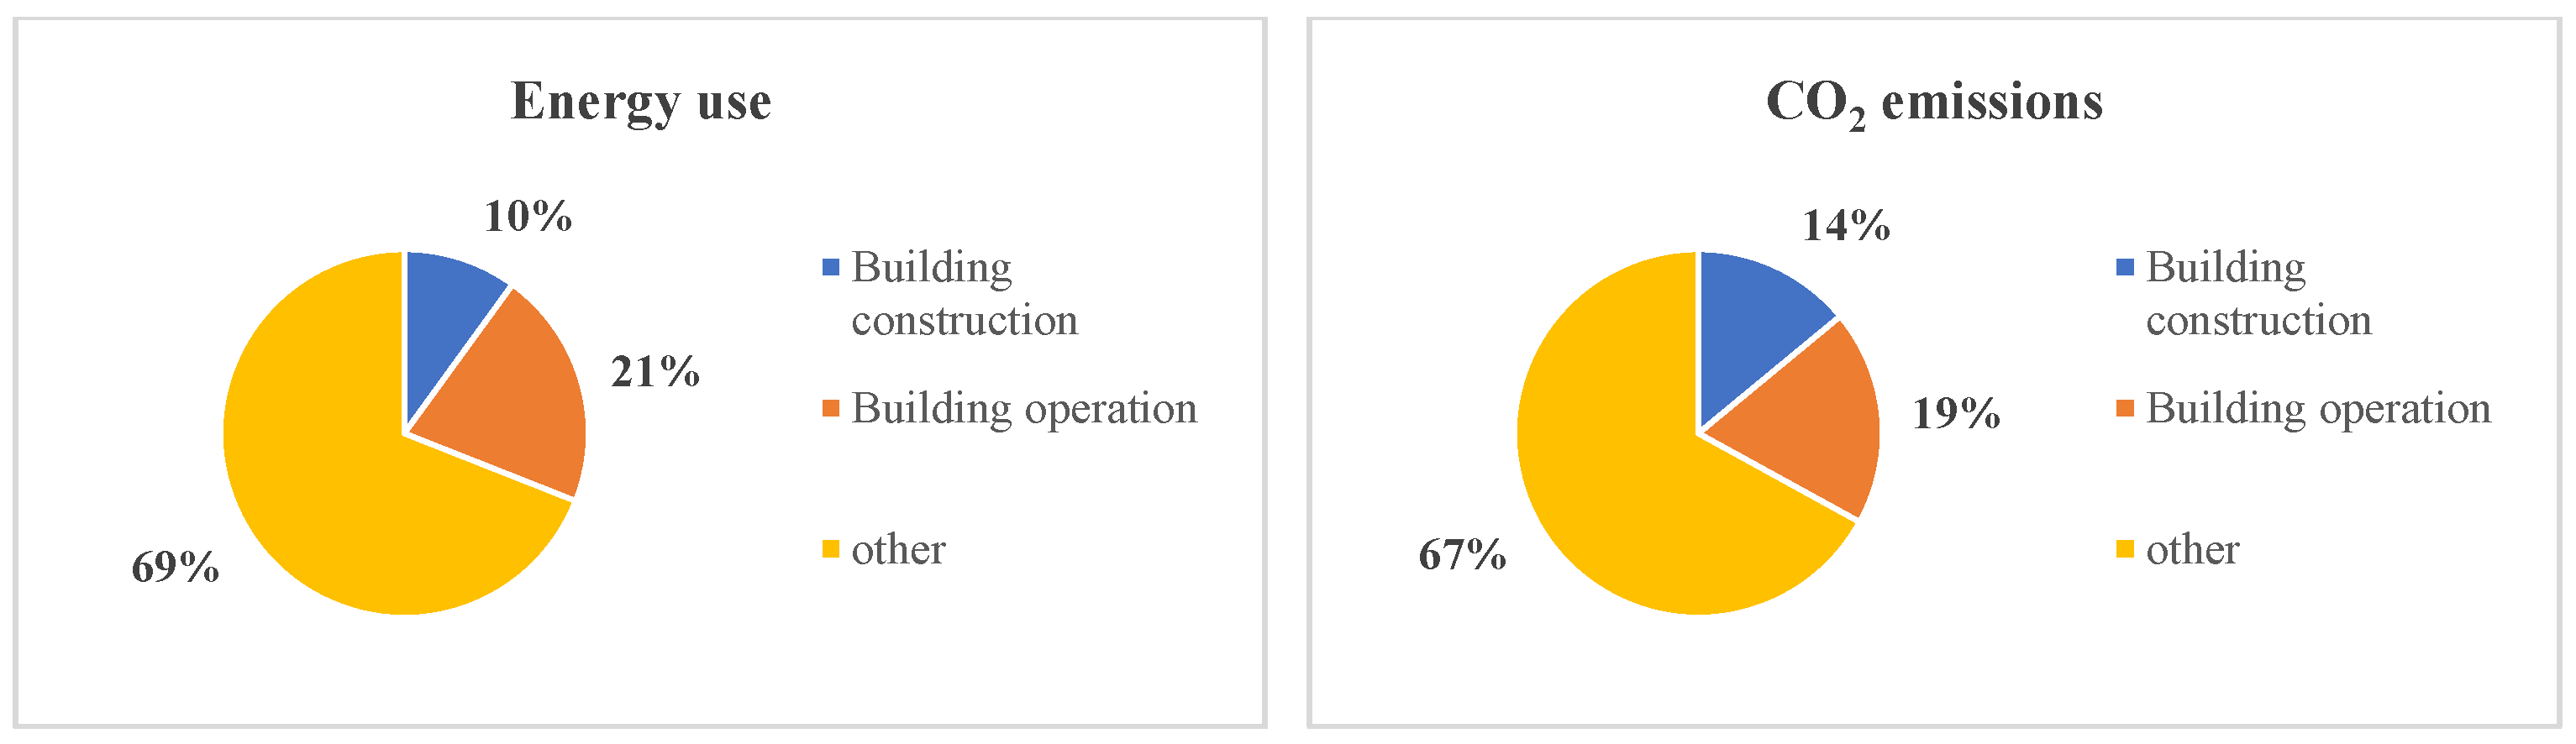
1.1. Background
1.2. Research Status
2. System Description and Model Construction
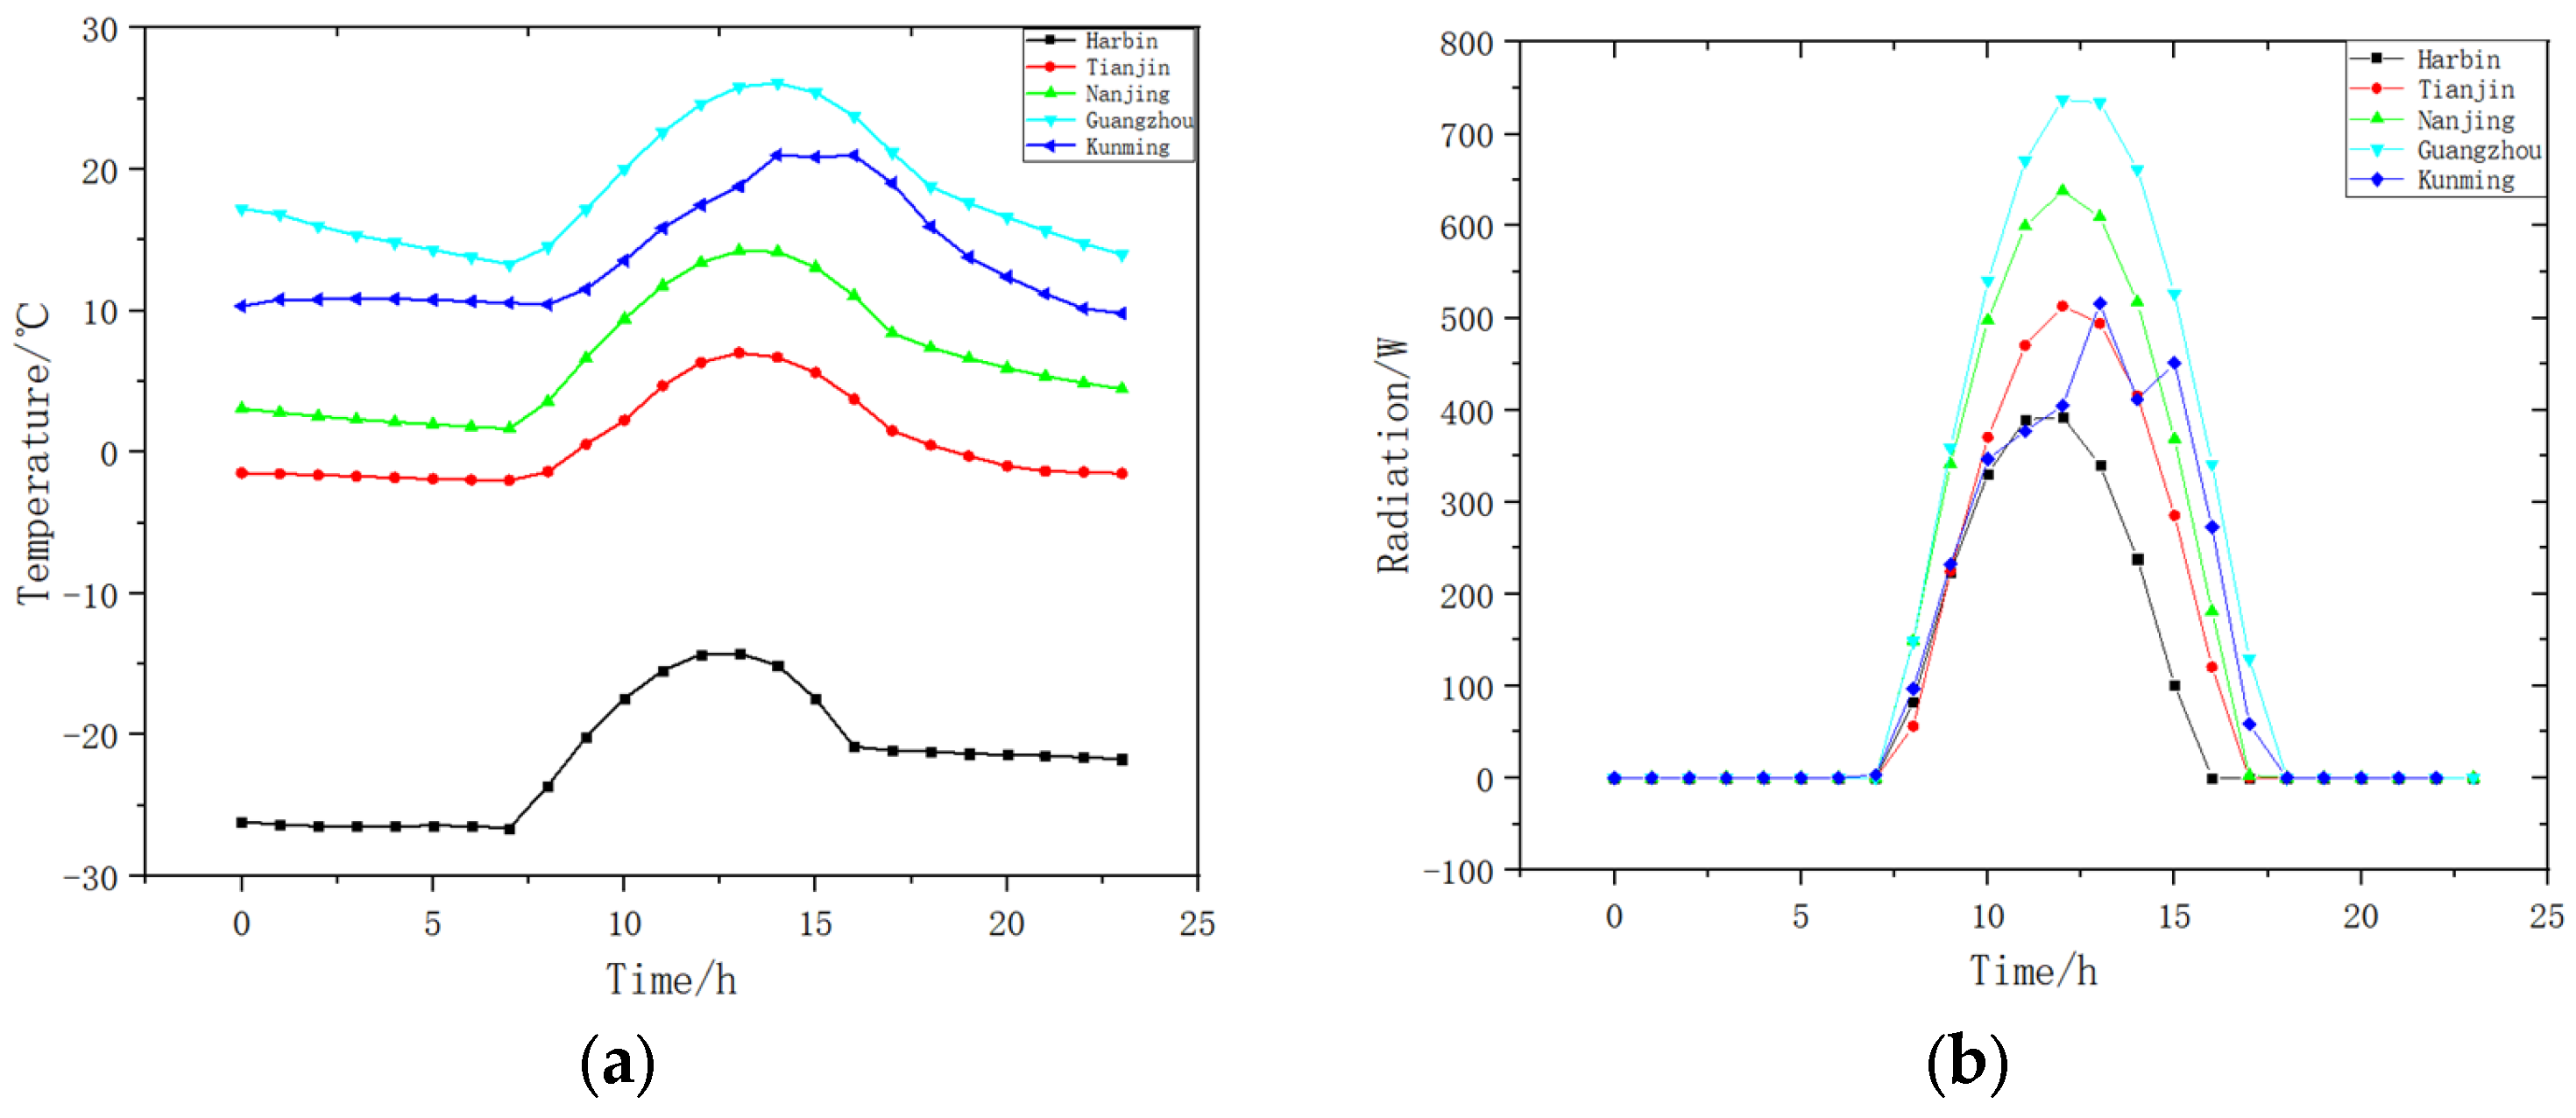
2.1. Geographic Location and Climatic Conditions
2.2. Building Structure and Standards
2.3. PV/T Solar Heat Pump System
2.4. Model Construction
- The PV/T collector model
- (1)
- The temperature within each layer of the PV/T collector is uniform, with no internal temperature gradients.
- (2)
- Heat transfer occurs only in the direction perpendicular to the plate surface.
- (3)
- There is perfect thermal contact between the layers inside the collector with no thermal resistance.
- (4)
- The thermal properties of each material layer are stable and do not vary with temperature.
- (5)
- The insulation materials used are highly effective, and heat loss from the frame and backplate is neglected.
- 2.
- The compressor model
- 3.
- Condensing heat exchanger model
- (1)
- The temperature and pressure of the refrigerant in the condenser remain constant along the axial direction of the condensing heat exchanger, varying only with time.
- (2)
- The condensing heat exchanger is well constructed with effective insulation, preventing heat exchange with the environment and ignoring heat loss to the surroundings.
- (3)
- The average dryness of the refrigerant in the condenser is assumed to be 0.5.
- (4)
- The mass flow rate of the refrigerant in the condensing heat exchanger is equal to the mass flow rate discharged from the compressor.
- (5)
- The pressure drop and heat loss during refrigerant condensation and flow are not considered.
- (6)
- The refrigerant flows as a one-dimensional uniform flow along the axial direction of the condenser channel.
- 4.
- Evaporative heat exchanger model
- (1)
- The refrigerant within the evaporative heat exchanger is uniformly distributed, with consistent temperature, and the internal temperature and pressure change only over time.
- (2)
- The cooling working fluid inside the evaporative heat exchanger has a uniform temperature that also changes only with time, with no heat exchange considered with the external environment.
- (3)
- The average dryness of the refrigerant in the evaporative heat exchanger is assumed to be 0.7.
- (4)
- The pressure drop and heat loss due to flow and evaporation are ignored.
- (5)
- The refrigerant flow inside the evaporative heat exchanger is treated as a one-dimensional homogeneous flow along the axial direction of the pipeline.
- 5.
- User usage-end model
- (1)
- The water tank is effectively insulated and kept separate from its surrounding environment.
- (2)
- The medium inside the tank is uniformly mixed, with its temperature changing only over time.
- (1)
- Indoor air is evenly distributed with constant thermal properties, and the temperature is uniform throughout.
- (2)
- The building is well sealed, ignoring heat loss due to air leakage, personnel movement, and heat dissipation of the occupants and equipment.
- (3)
- The water flow within the heating pipeline is consistent, with no consideration of pressure loss.
- 6.
- Relevant evaluation indicators
2.5. Model Validation
3. Simulation Results and the Analysis
3.1. Climate Conditions in Different Climatic Zones
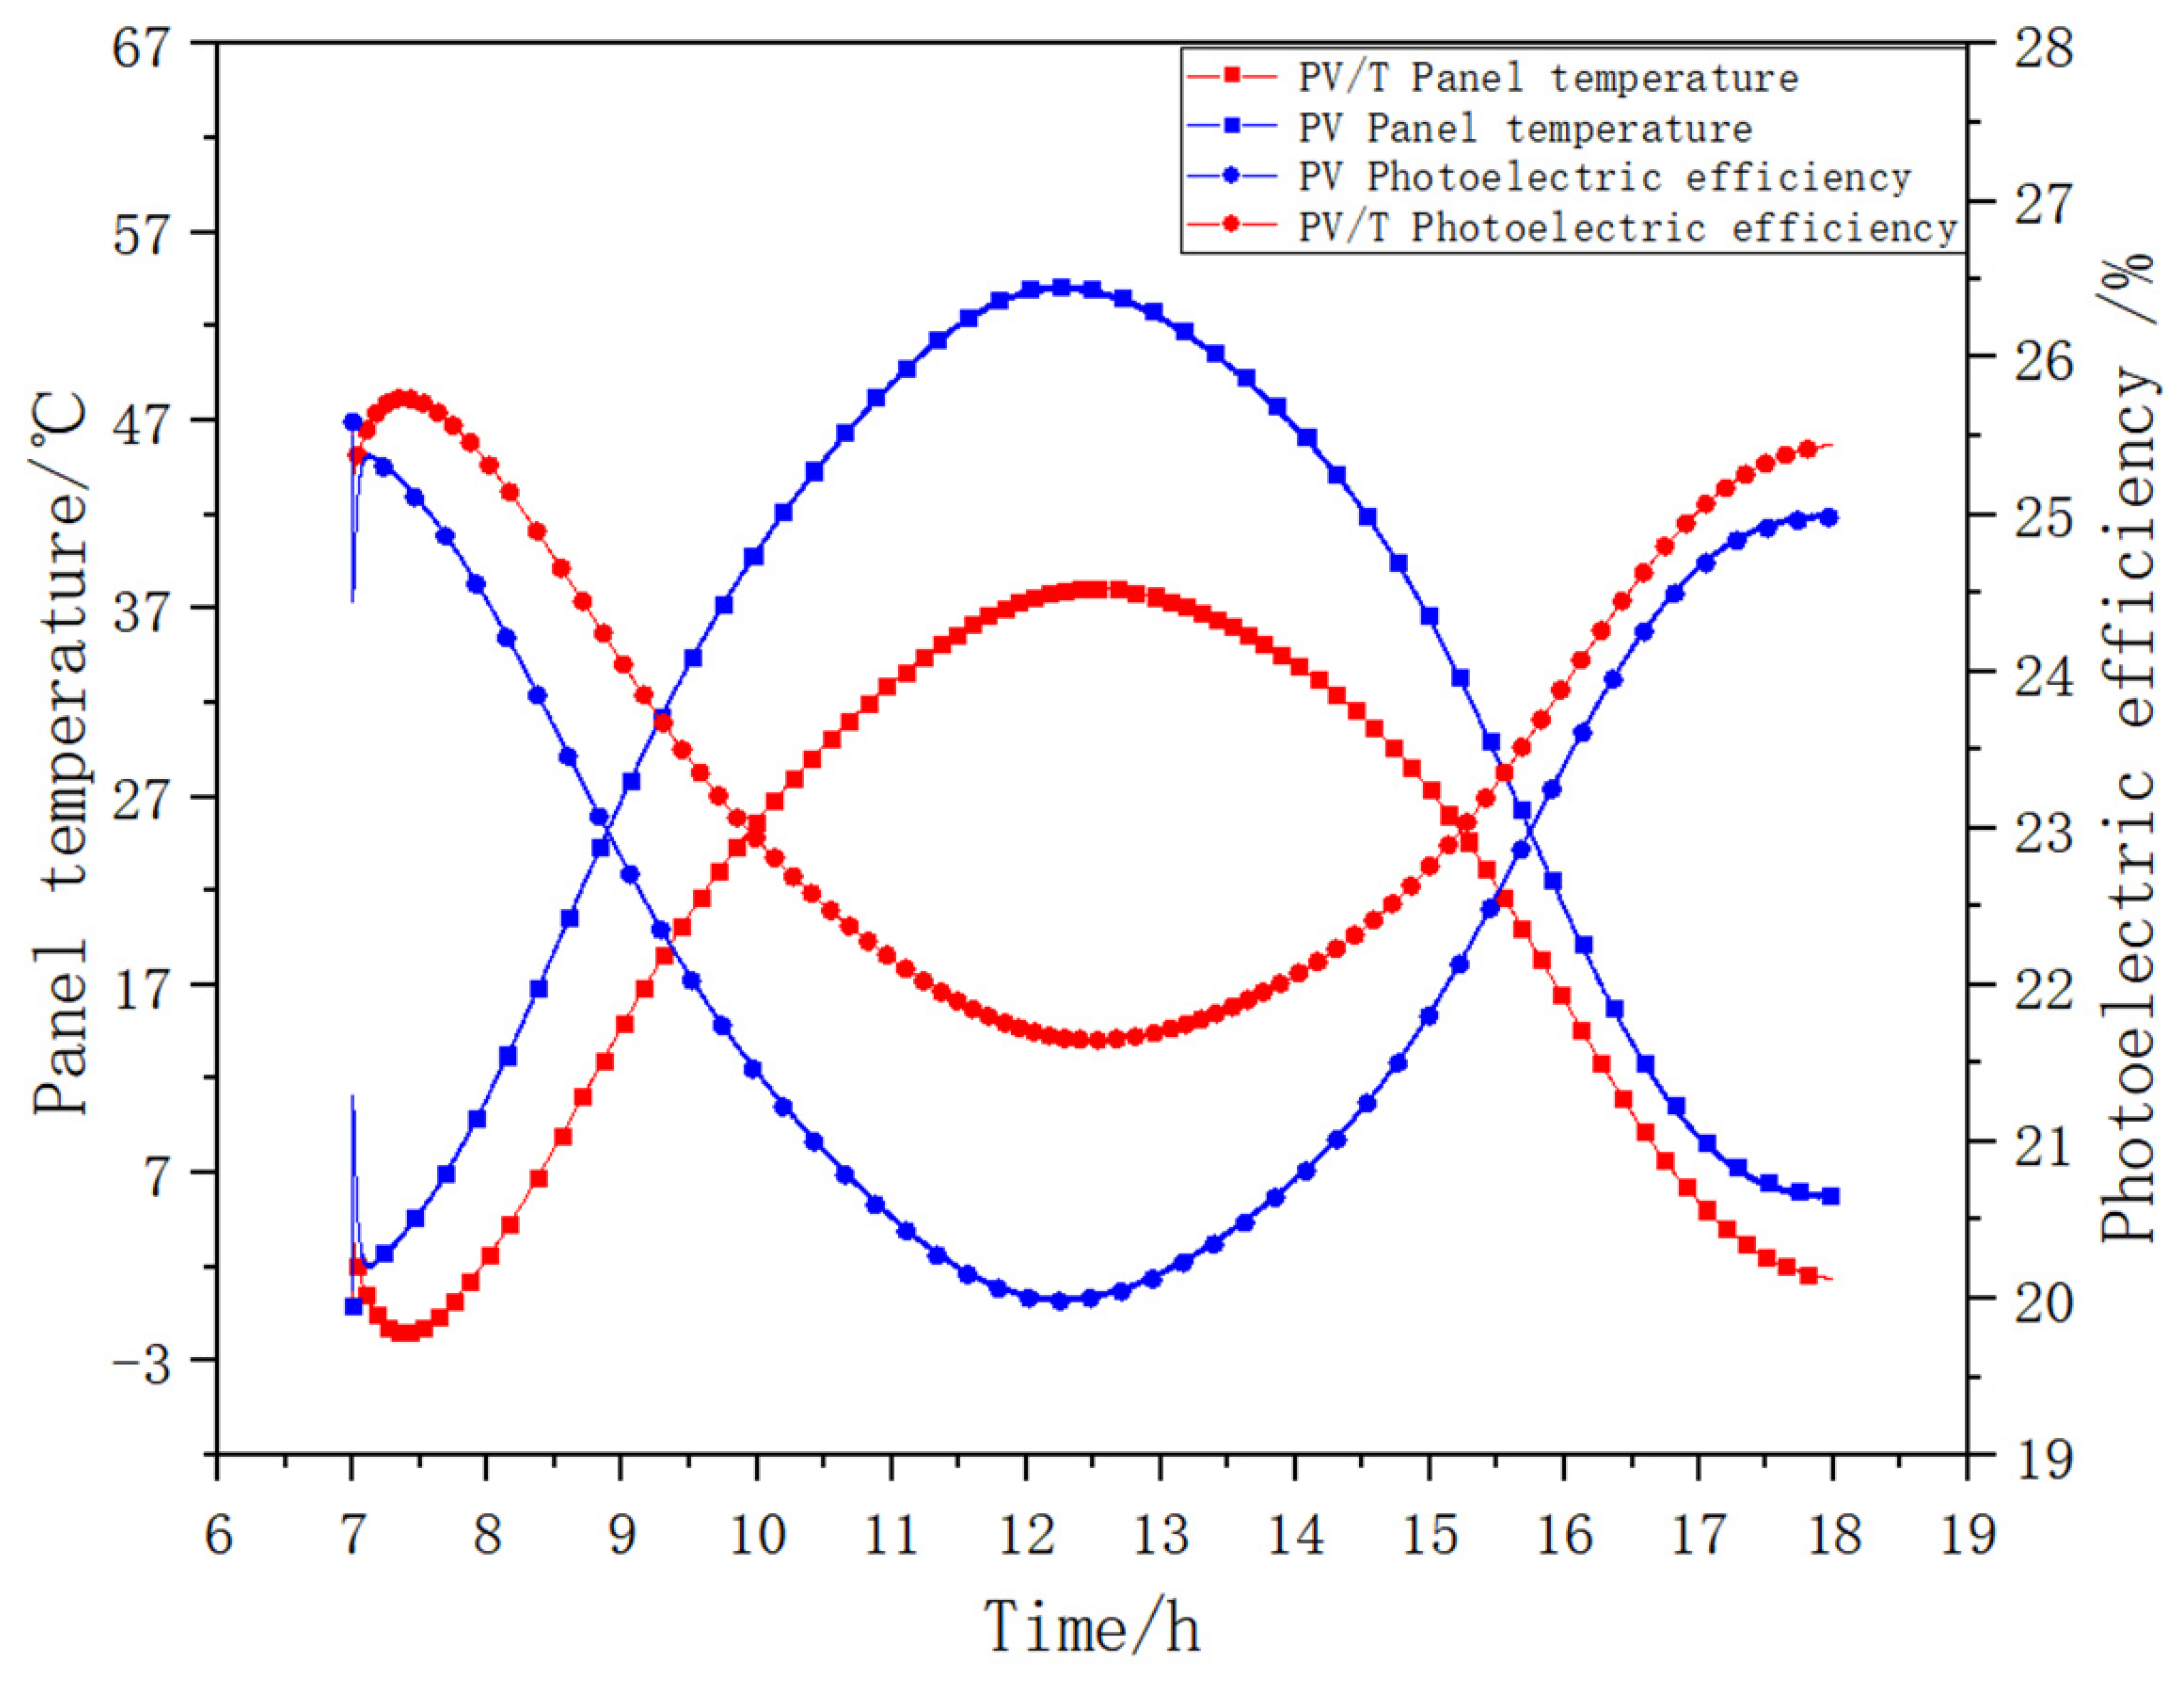
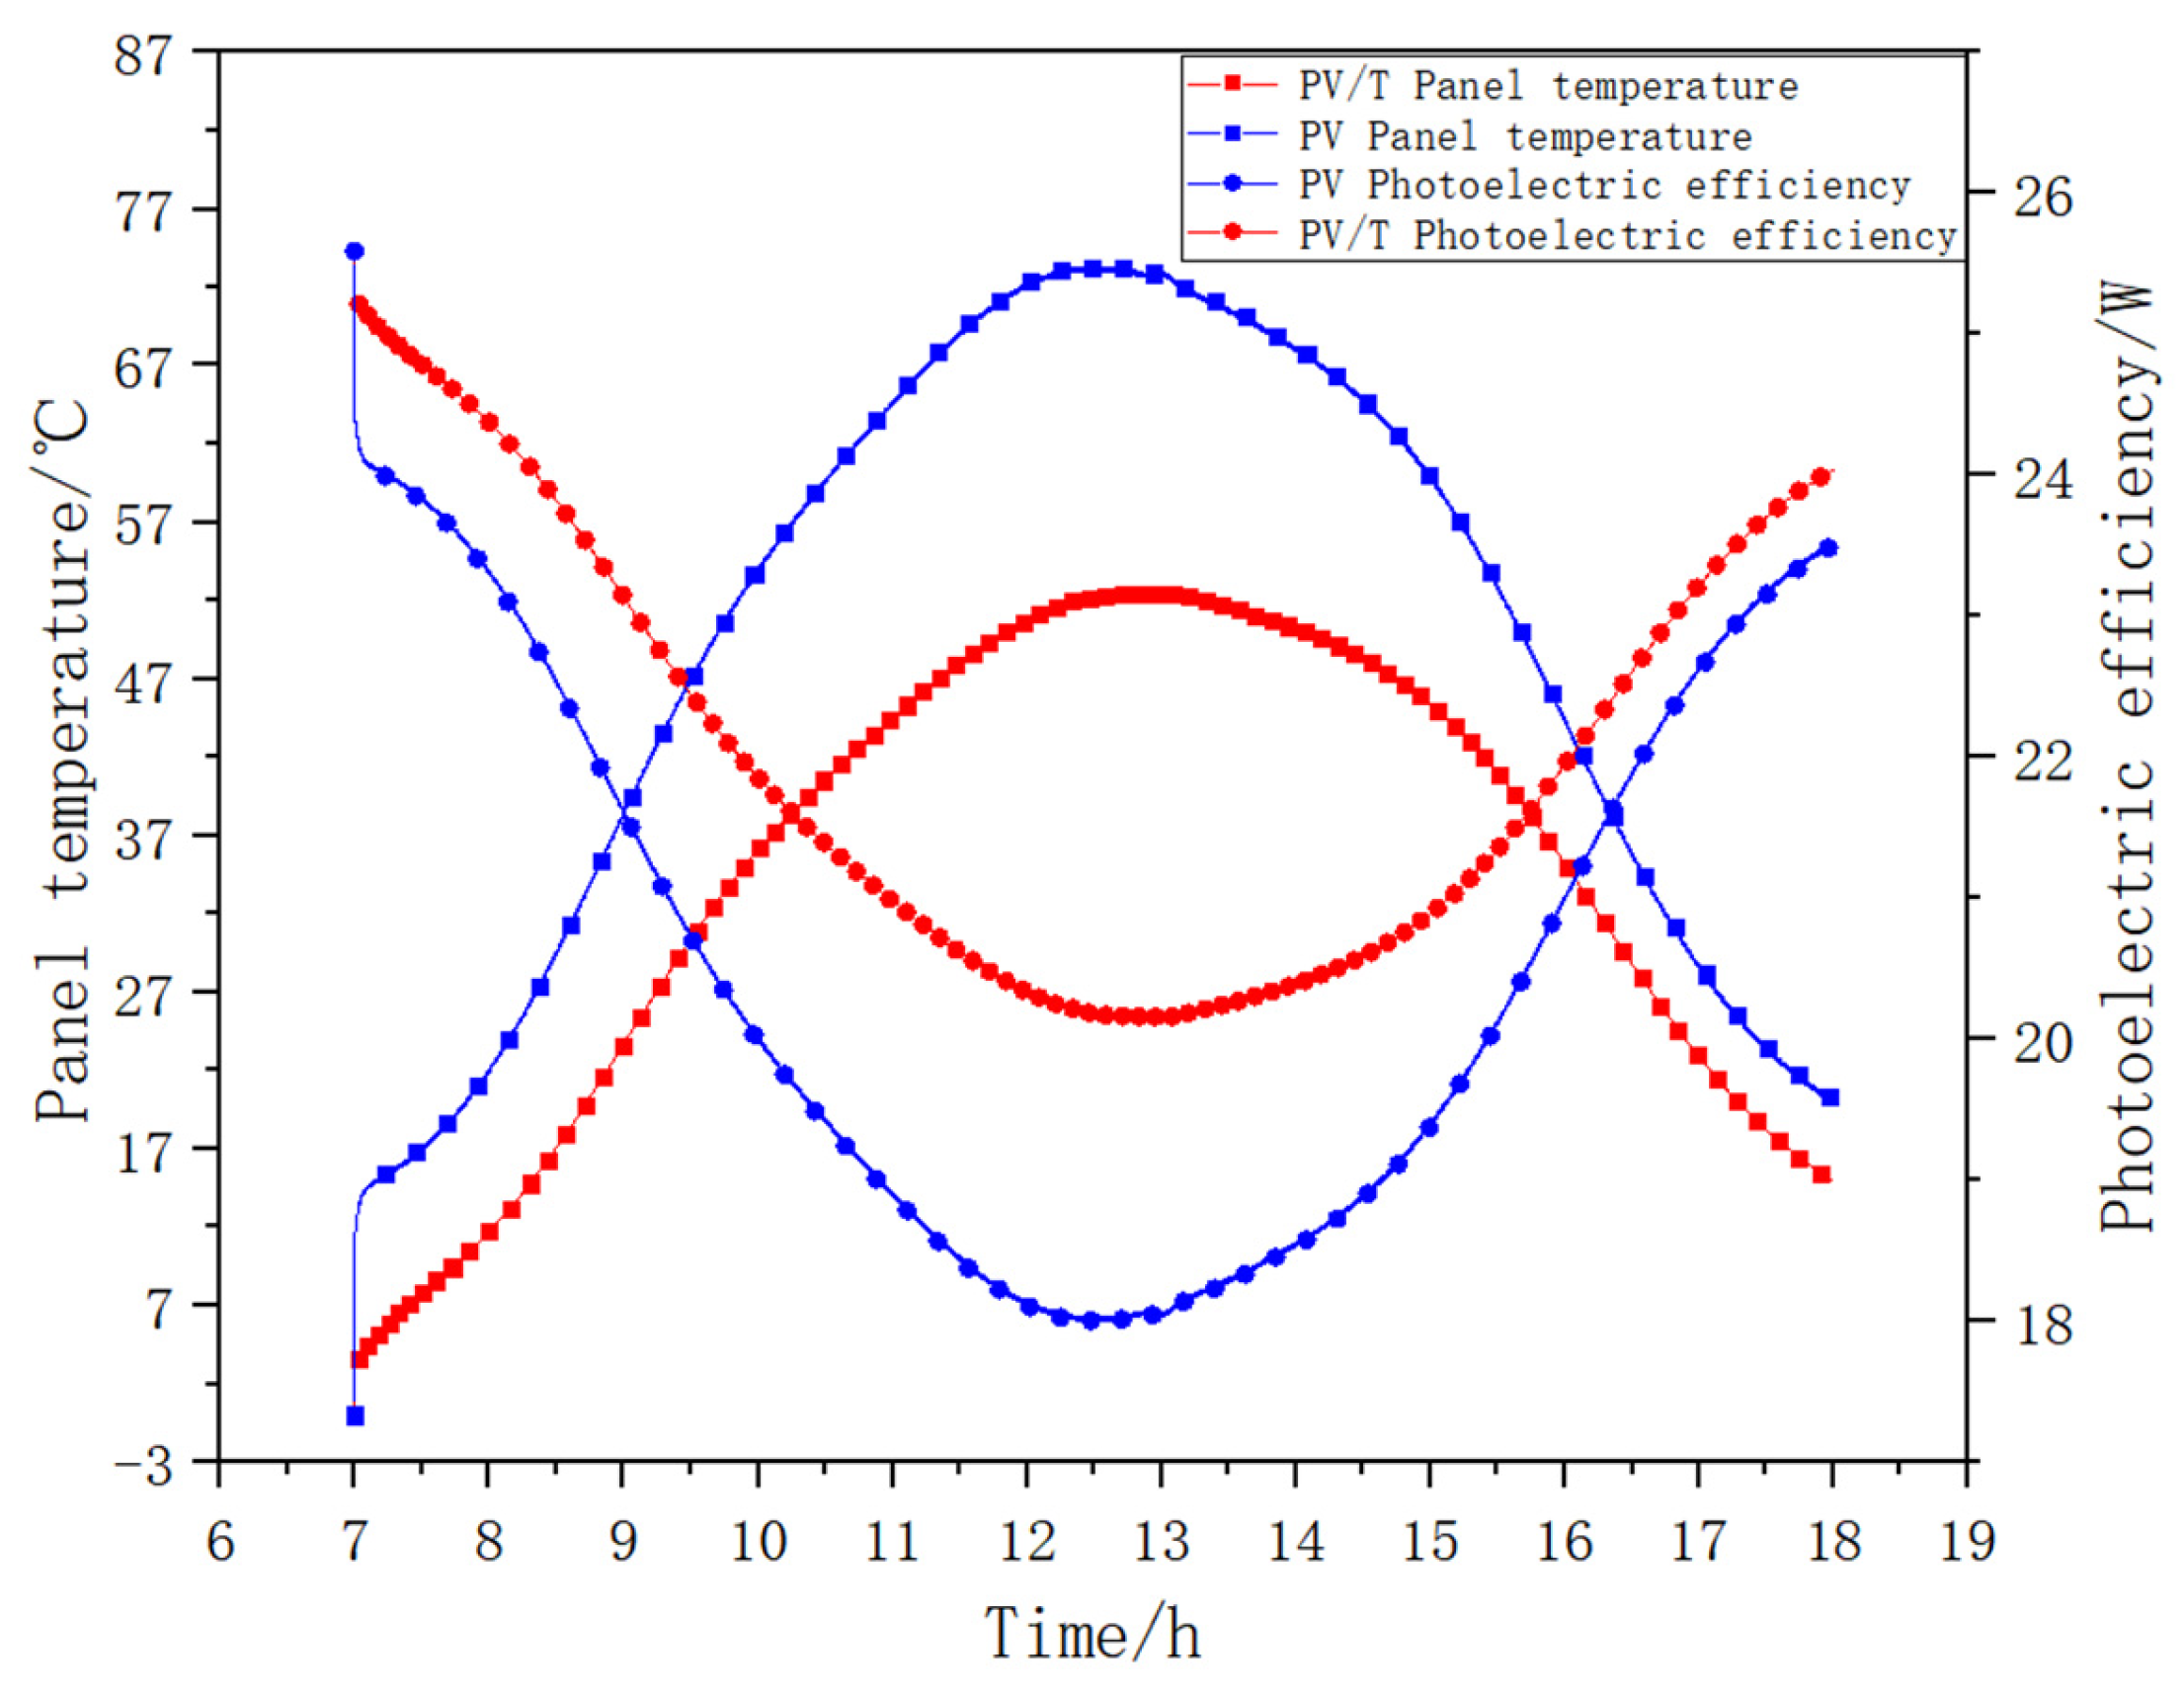
3.2. Performance of the PV/T Heat Pump System
- (1)
- System power generation
- (2)
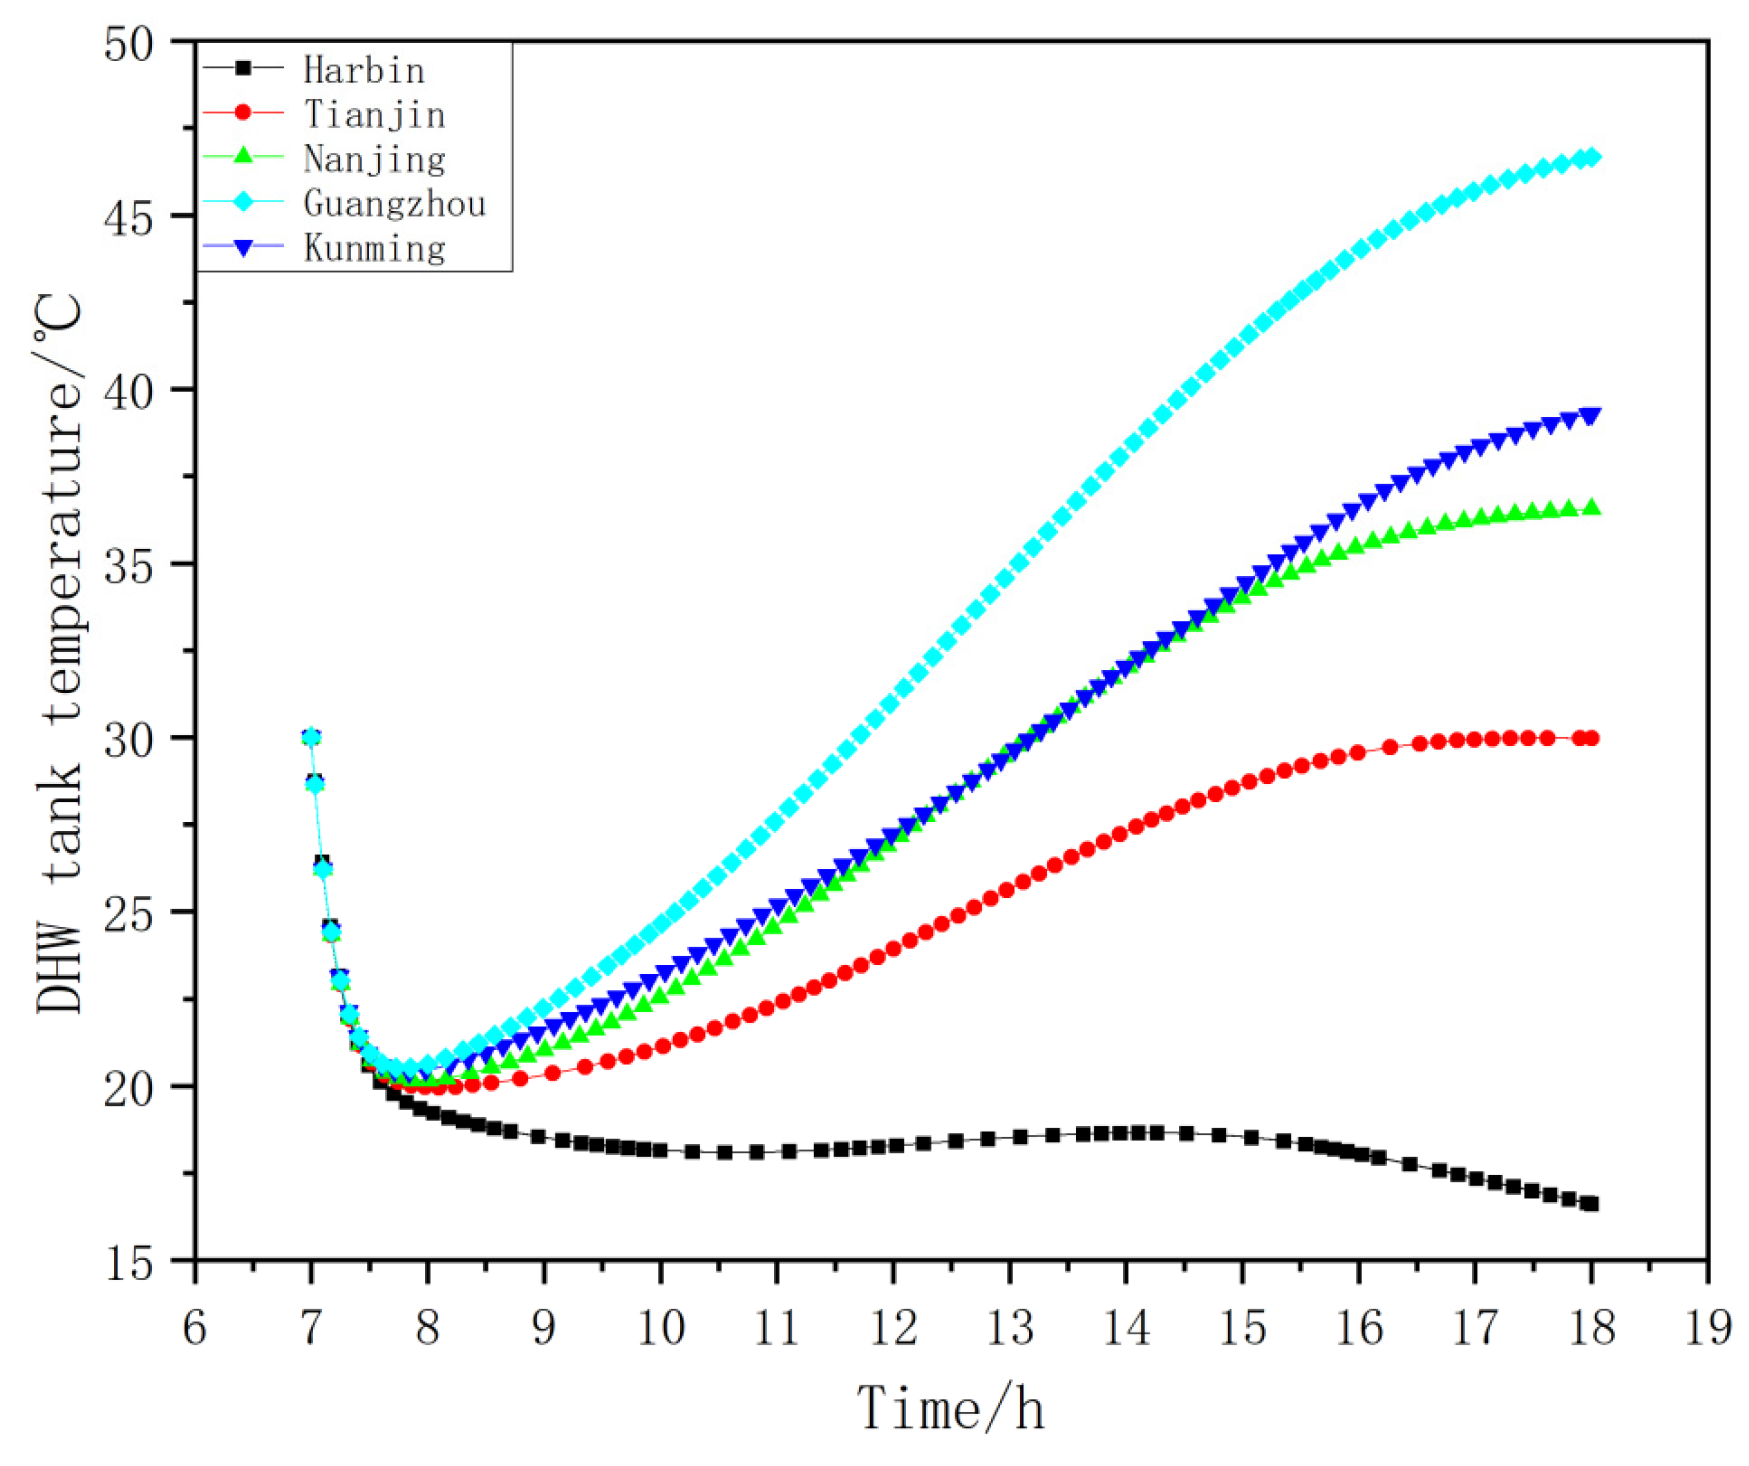
- Heating performance of PV/T solar heat pump system
- (3)
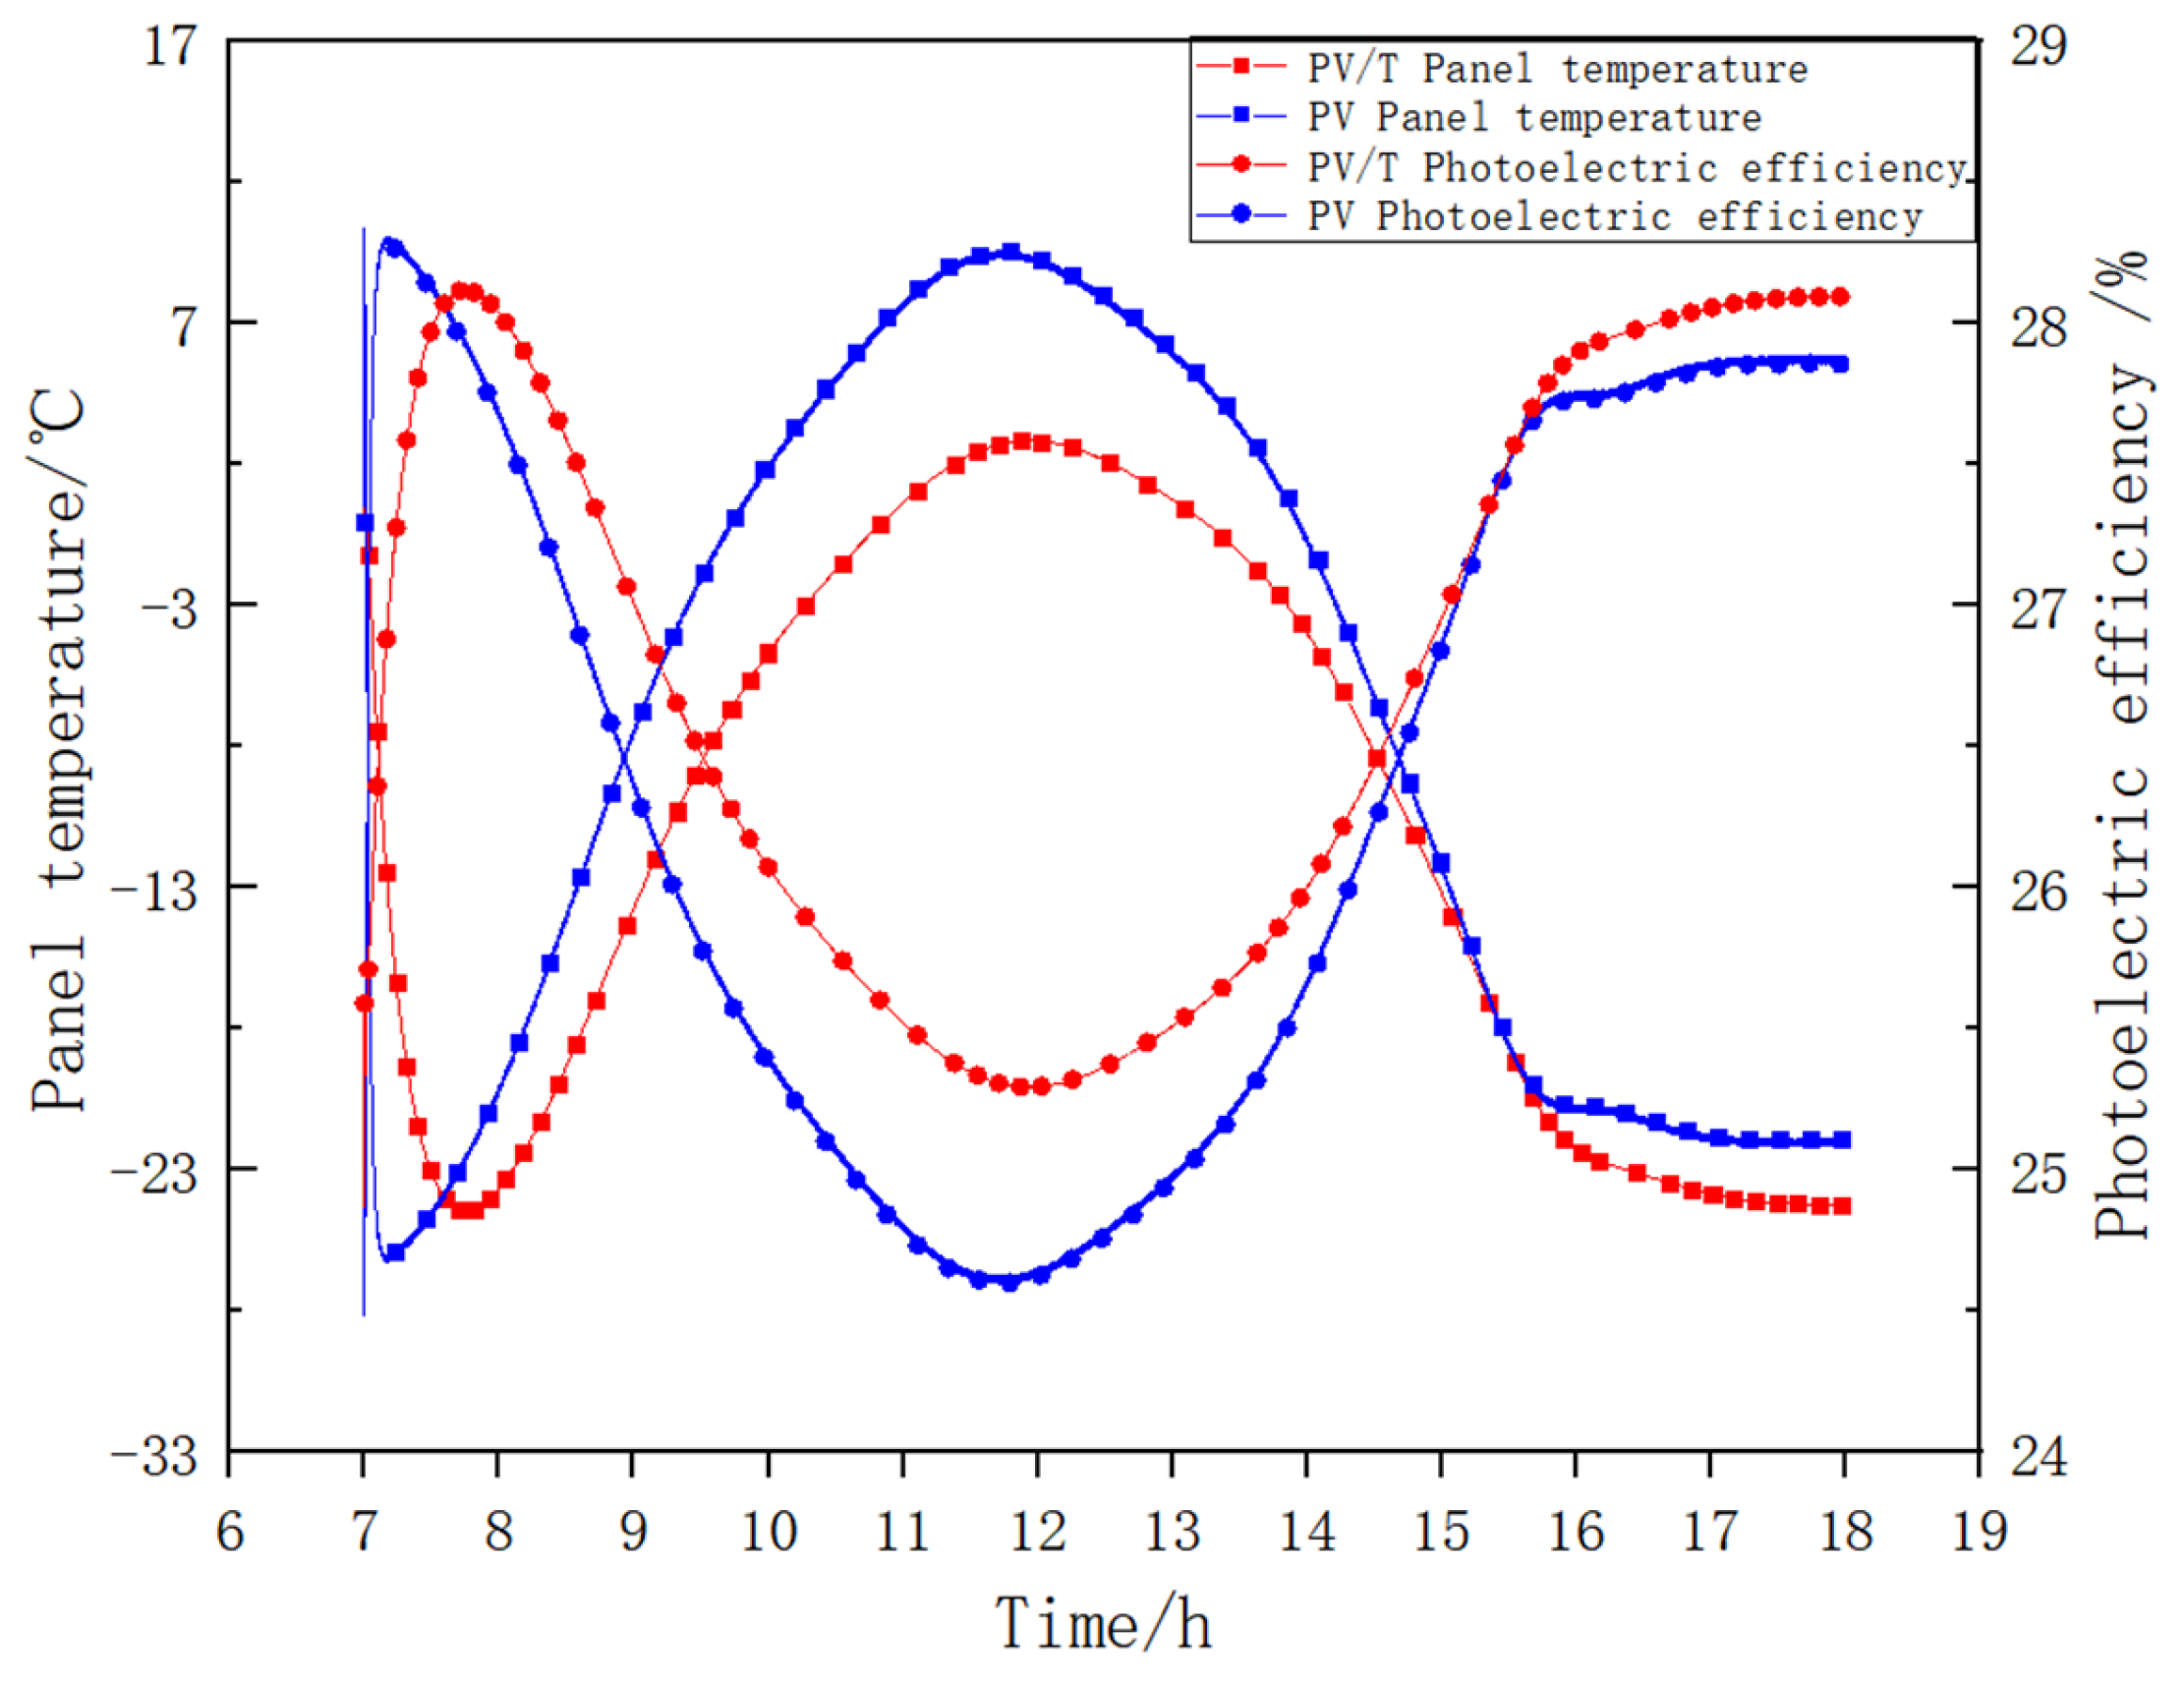
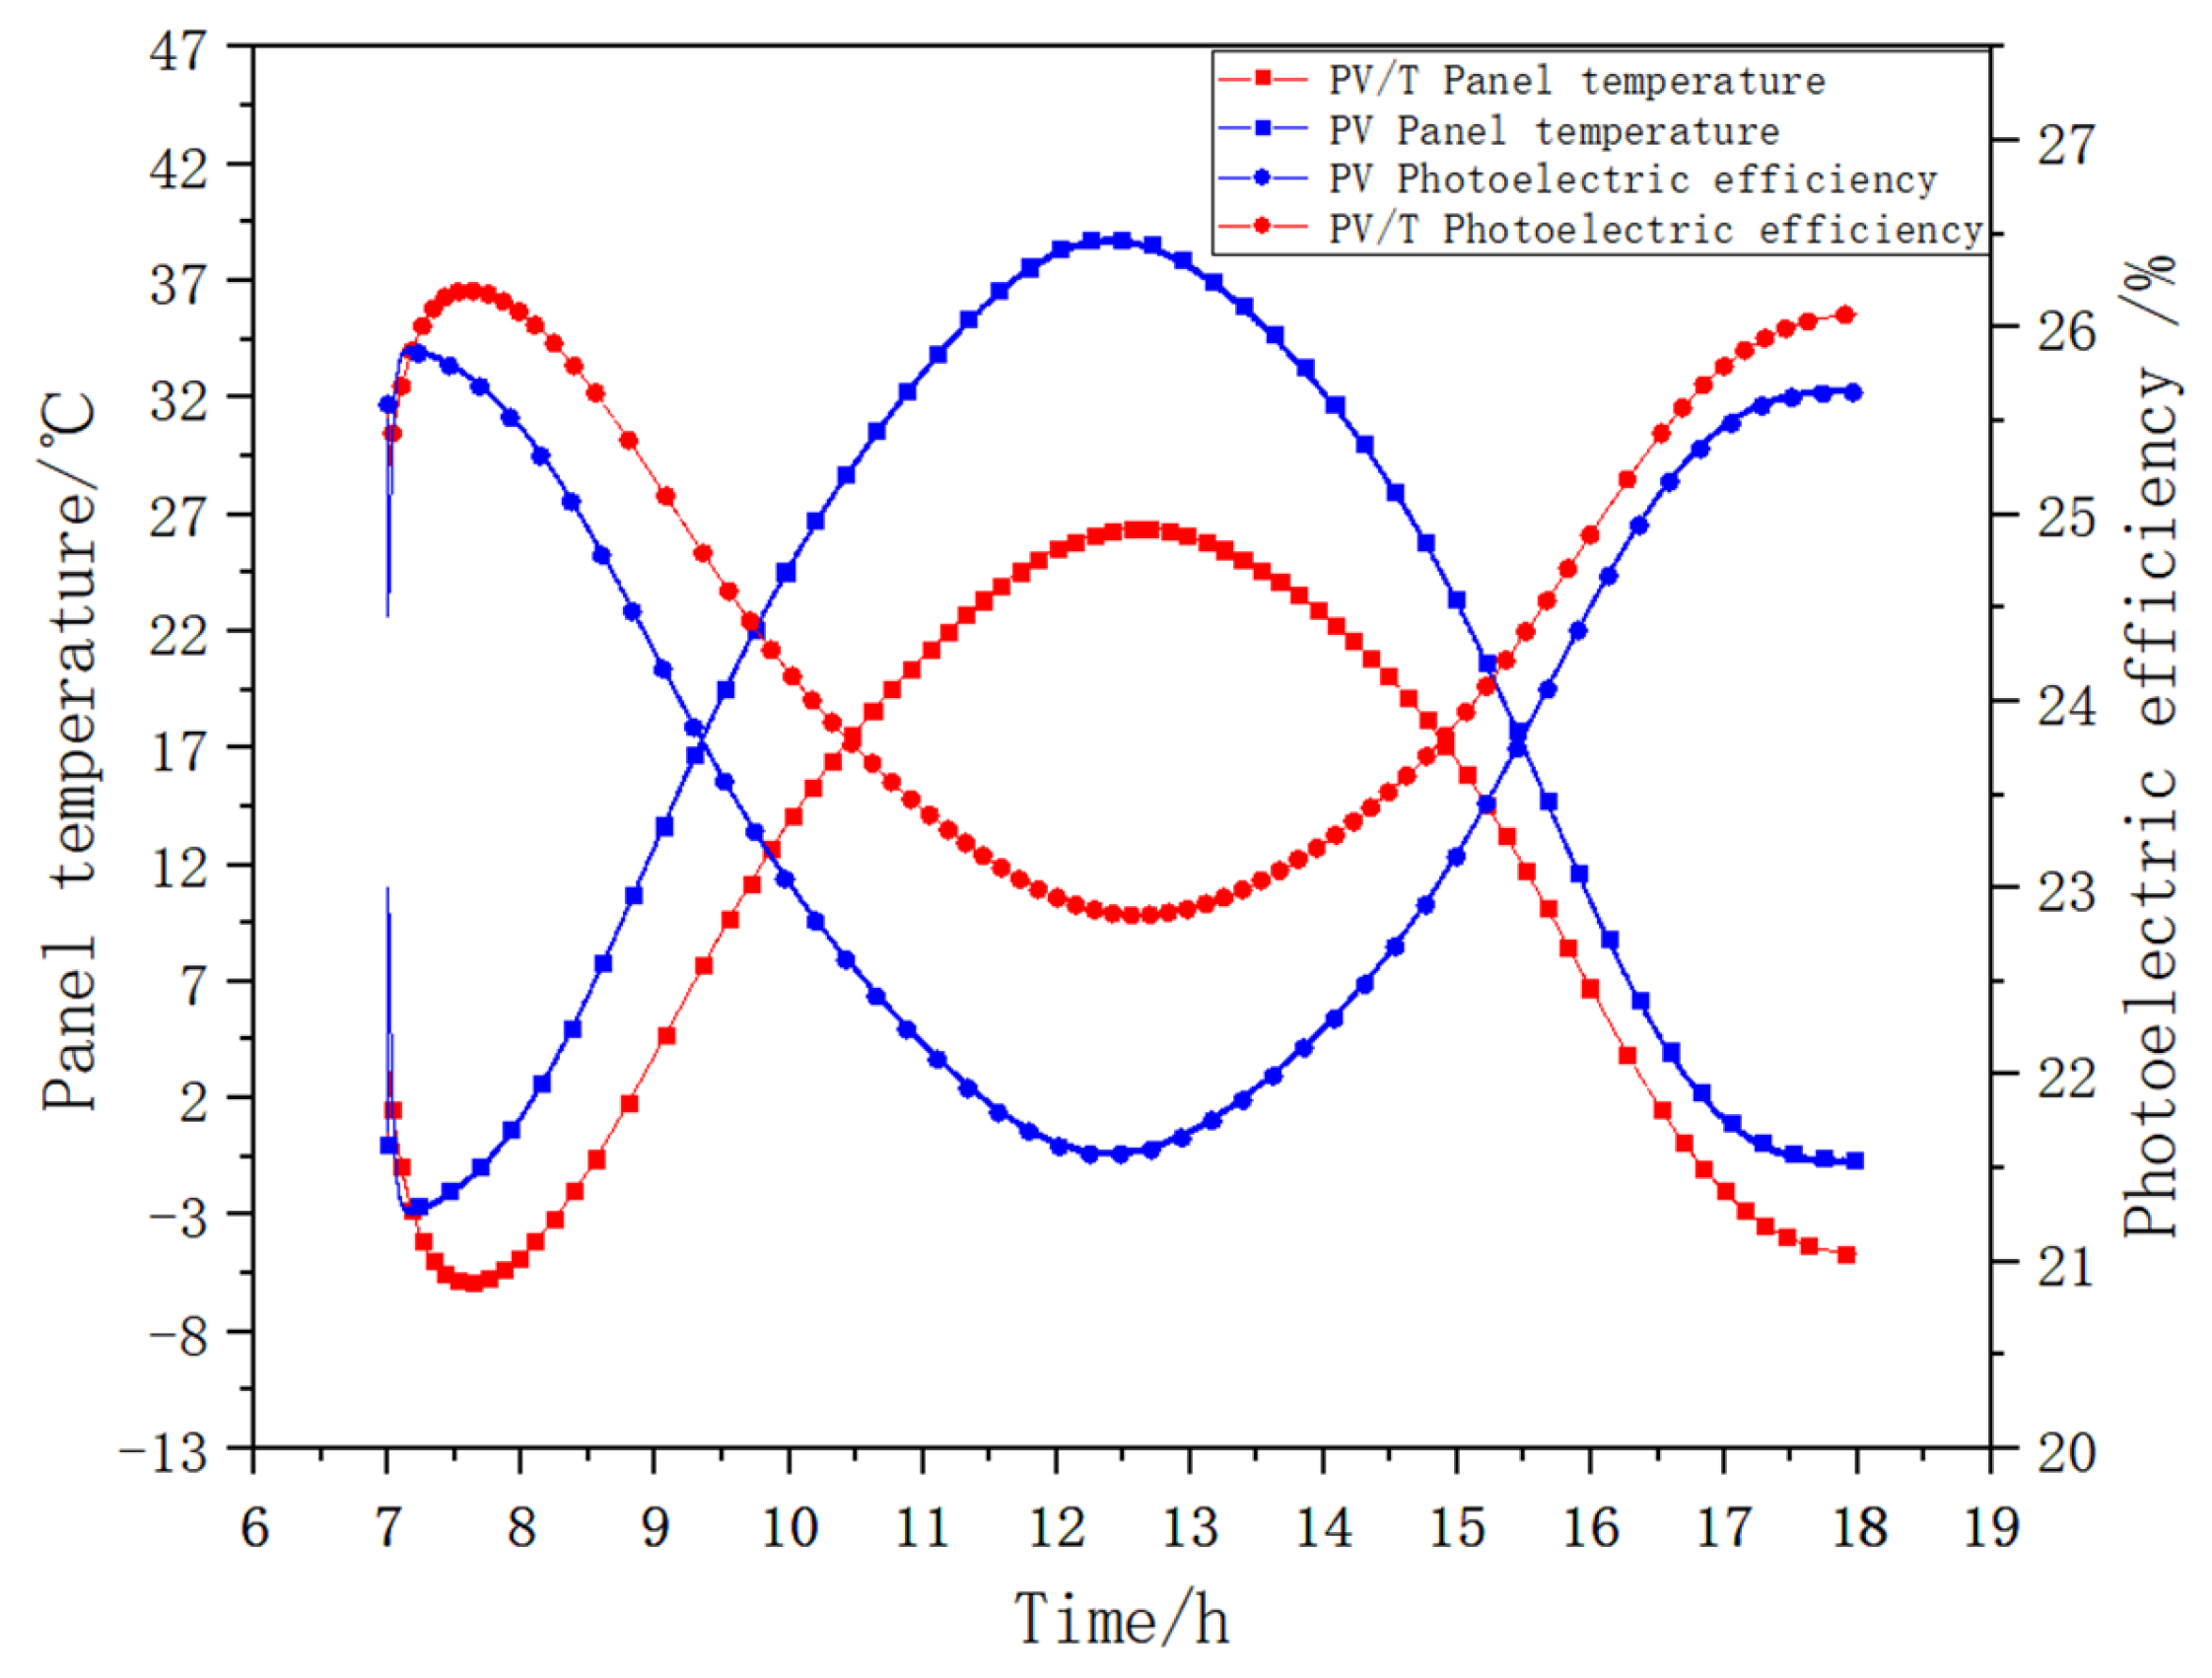
- Performance of PV/T solar heat pump
4. Discussion and Conclusions
- (1)
- The PV/T system has a greater photoelectric efficiency compared to the PV system. However, in higher latitude areas with lower winter temperatures, environmental cooling reduces the PV/T system’s effectiveness. In lower latitude areas with warmer winters, the PV/T system’s cooling effect is more significant. Among the five cities, Guangzhou has the lowest average photoelectric efficiency at 22%, Kunming and Nanjing at 23%, Tianjin at 24%, and Harbin at 26%.
- (2)
- The maximum power generation of the PV/T solar heat pump system is 120 W in Guangzhou, followed by 113 W in Nanjing, 95 W in Tianjin, 90 W in Kunming, and 80 W in Harbin, which aligns with the solar radiation patterns.
Author Contributions
Funding
Data Availability Statement
Conflicts of Interest
References
- Global Status Report for Buildings and Construction; International Energy Agency: Paris, France, 2019.
- Tsinghua University Building Energy Conservation Research Center. Research Report on Annual Development of China’s Building Energy Efficiency 2023; Building Industry Press: Beijing, China, 2023. [Google Scholar]
- European Commission. EU Energy in Figures; European Commission: Brussels, Belgium, 2021.
- European Commission. An EU Strategy on Heating and Cooling; European Commission: Brussels, Belgium, 2016.
- Das, D.; Kalita, P.; Roy, O. Flat Plate Hybrid Photovoltaic-Thermal (PV/T) System: A Review on Design and Development. Renew. Sustain. Energy Rev. 2018, 84, 111–130. [Google Scholar] [CrossRef]
- Joshi, S.S.; Dhoble, A.S. Photovoltaic-Thermal Systems (PVT): Technology Review and Future Trends. Renew. Sustain. Energy Rev. 2018, 92, 848–882. [Google Scholar] [CrossRef]
- Chae, S.; Bae, S.; Nam, Y. Analyze the Economic and Environmental Impacts of the Optimal Design of an Integrated System with Air Source Heat Pump and PVT. Case Stud. Therm. Eng. 2023, 48, 103142. [Google Scholar] [CrossRef]
- Chhugani, B.; Pärisch, P.; Helmling, S.; Giovannetti, F. Comparison of PVT–Heat Pump Systems with Reference Systems for the Energy Supply of a Single-Family House. Sol. Energy Adv. 2023, 3, 100031. [Google Scholar] [CrossRef]
- Zhang, X.; Zhao, X.; Xu, J.; Yu, X. Characterization of a Solar Photovoltaic/Loop-Heat-Pipe Heat Pump Water Heating System. Appl. Energy 2013, 102, 1229–1245. [Google Scholar] [CrossRef]
- Zhang, X.; Shen, J.; Xu, P.; Zhao, X.; Xu, Y. Socio-Economic Performance of a Novel Solar Photovoltaic/Loop-Heat-Pipe Heat Pump Water Heating System in Three Different Climatic Regions. Appl. Energy 2014, 135, 20–34. [Google Scholar] [CrossRef]
- Dannemand, M.; Perers, B.; Furbo, S. Performance of a Demonstration Solar PVT Assisted Heat Pump System with Cold Buffer Storage and Domestic Hot Water Storage Tanks. Energy Build. 2019, 188–189, 46–57. [Google Scholar] [CrossRef]
- Dannemand, M.; Sifnaios, I.; Tian, Z.; Furbo, S. Simulation and optimization of a hybrid unglazed solar photovoltaic-thermal collector and heat pump system incorporating two storage tanks. Energy Convers. Manag. 2020, 206, 112429. [Google Scholar] [CrossRef]
- Chen, H.; Zhang, L.; Jie, P.; Xiong, Y.; Xu, P.; Zhai, H. Performance Study of Heat-Pipe Solar Photovoltaic/Thermal Heat Pump System. Appl. Energy 2017, 190, 960–980. [Google Scholar] [CrossRef]
- Del Amo, A.; Martínez-Gracia, A.; Bayod-Rújula, A.A.; Cañada, M. Analyzing Performance and Validating Experimentation of a Solar-Assisted Heat Pump Supplied by Photovoltaic-Thermal Collectors. Energy 2019, 169, 1214–1223. [Google Scholar] [CrossRef]
- Del Amo, A.; Martínez-Gracia, A.; Pintanel, T.; Bayod-Rújula, A.A.; Torné, S. Analysis and Optimization of a Heat Pump System Coupled to an Installation of PVT Panels and a Seasonal Storage Tank on an Educational Building. Energy Build. 2020, 226, 110373. [Google Scholar] [CrossRef]
- Braun, R.; Haag, M.; Stave, J.; Abdelnour, N.; Eicker, U. Designing and assessing the feasibility of trigeneration systems employing hybrid photovoltaic-thermal (PVT)collectors for zero-energy office buildings in diverse climates. Sol. Energy 2020, 196, 39–48. [Google Scholar] [CrossRef]
- Odeh, S.; Feng, J. Assessment of the Long-Term Performance of a Residential PV/Thermal Hybrid System. Energies 2023, 16, 121. [Google Scholar] [CrossRef]
- Ahmed, M.T.; Rashel, M.R.; Abdullah-Al-Wadud, M.; Hoque, T.T.; Janeiro, F.M.; Tlemcani, M. Mathematical Modeling, Parameters Effect, and Sensitivity Analysis of a Hybrid PVT System. Energies 2024, 17, 2887. [Google Scholar] [CrossRef]
- Korkut, T.B.; Gören, A.; Rachid, A. Numerical and Experimental Study of a PVT Water System under Daily Weather Conditions. Energies 2022, 15, 6538. [Google Scholar] [CrossRef]
- Cui, Y.; Zhu, J.; Zoras, S.; Qiao, Y.; Zhang, X. Assessments of Energy Performance and Life Cycle Costs for a Photovoltaic/Thermal Assisted Heat Pump System. Energy 2020, 206, 118108. [Google Scholar] [CrossRef]
- Kong, R.; Deethayat, T.; Asanakham, A.; Kiatsiriroat, T. Performance and Economic Evaluation of a Photovoltaic/Thermal (PV/T)-Cascade Heat Pump for Combined Cooling, Heat and Power in Tropical Climate Area. J. Energy Storage 2020, 30, 101507. [Google Scholar] [CrossRef]
- Obalanlege, M.A.; Mahmoudi, Y.; Douglas, R.; Ebrahimnia-Bajestan, E.; Davidson, J.; Bailie, D. A study evaluating the performance of a hybrid photovoltaic-thermal and heat pump system for generating solar heating and electricity. Renew. Energy 2020, 148, 558–572. [Google Scholar] [CrossRef]
- Qu, M.; Chen, J.; Nie, L.; Li, F.; Yu, Q.; Wang, T. Experimental Study on the Operating Characteristics of a Novel Photovoltaic/Thermal Integrated Dual-Source Heat Pump Water Heating System. Appl. Therm. Eng. 2016, 94, 819–826. [Google Scholar] [CrossRef]
- Croci, L.; Molinaroli, L.; Quaglia, P. Dual Source Solar Assisted Heat Pump Model Development, Validation and Comparison to Conventional Systems. Energy Procedia 2017, 140, 408–422. [Google Scholar] [CrossRef]
- Wang, G.; Quan, Z.; Zhao, Y.; Sun, C.; Deng, Y.; Tong, J. Experimental Study on a Novel PV/T Air Dual-Heat-Source Composite Heat Pump Hot Water System. Energy Build. 2015, 108, 175–184. [Google Scholar] [CrossRef]
- Long, J.; Zhang, R.; Lu, J.; Xu, F. Heat Transfer Performance of an Integrated Solar-Air Source Heat Pump Evaporator. Energy Convers. Manag. 2019, 184, 626–635. [Google Scholar] [CrossRef]
- Simonetti, R.; Molinaroli, L.; Manzolini, G. Conducted an experimental and analytical investigation on a new integrated dual-source evaporator designed for solar-assisted heat pumps. J. Sol. Energy 2019. [Google Scholar] [CrossRef]
- Lazzarin, R.; Noro, M. Photovoltaic/Thermal(PV/T)/Ground Dual Source Heat Pump: Optimum Energy and Economic Sizing Based on Performance Analysis. Energy Build. 2020, 211, 109800. [Google Scholar] [CrossRef]
- Bae, S.; Nam, Y. A Comparison of Experimental and Computational Approaches for Developing a Tri-Generation System Utilizing Photovoltaic-Thermal and Ground Source Heat Pump Technologies. Energy Build. 2021, 231, 110623. [Google Scholar] [CrossRef]
- GB55015-2021; General Code for Energy Efficiency and Renewable Energy Application in Buildings. Ministry of Housing and Urban-Rural Development of the People’s Republic of China: Beijing, China, 2021.


| Exterior-Protected Construction | Climate Zoning | ||||
|---|---|---|---|---|---|
| Cold Area (Harbin) | Cold Area (Tianjin) | Hot Summer and Cold Winter Zone (Nanjing) | Hot Summer and Warm Winter Area (Guangzhou) | Moderate Area (Kunming) | |
| Exterior wall (W/m2·K) | ≤0.35 | ≤0.50 | ≤0.80 | ≤1.50 | ≤1.50 |
| Window (W/m2·K) | ≤1.40 | ≤1.80 | ≤2.10 | ≤2.40 | ≤2.50 |
| Roof (W/m2·K) | ≤0.25 | ≤0.40 | ≤0.40 | ≤0.40 | ≤0.80 |
Disclaimer/Publisher’s Note: The statements, opinions and data contained in all publications are solely those of the individual author(s) and contributor(s) and not of MDPI and/or the editor(s). MDPI and/or the editor(s) disclaim responsibility for any injury to people or property resulting from any ideas, methods, instructions or products referred to in the content. |
© 2024 by the authors. Licensee MDPI, Basel, Switzerland. This article is an open access article distributed under the terms and conditions of the Creative Commons Attribution (CC BY) license (https://creativecommons.org/licenses/by/4.0/).
Share and Cite
Liu, B.; Yang, L.; Lv, T.; Zhu, L.; Ji, M.; Hu, W. Application of PVT Coupled Solar Heat Pump System in the Renovation of Existing Campus Buildings. Energies 2024, 17, 4922. https://doi.org/10.3390/en17194922
Liu B, Yang L, Lv T, Zhu L, Ji M, Hu W. Application of PVT Coupled Solar Heat Pump System in the Renovation of Existing Campus Buildings. Energies. 2024; 17(19):4922. https://doi.org/10.3390/en17194922
Chicago/Turabian StyleLiu, Bing, Linqing Yang, Tiangang Lv, Li Zhu, Mingda Ji, and Weihang Hu. 2024. "Application of PVT Coupled Solar Heat Pump System in the Renovation of Existing Campus Buildings" Energies 17, no. 19: 4922. https://doi.org/10.3390/en17194922
APA StyleLiu, B., Yang, L., Lv, T., Zhu, L., Ji, M., & Hu, W. (2024). Application of PVT Coupled Solar Heat Pump System in the Renovation of Existing Campus Buildings. Energies, 17(19), 4922. https://doi.org/10.3390/en17194922