Abstract
The Avoid–Shift–Improve framework has been used since its conception in the 1990s to help decision-makers prioritize action towards environmental sustainability in the transport sector. The core of the framework establishes a clear priority of action among the three main strategies that give it its name, thus highlighting the prominent role transport demand reduction should have within policy discussions. However, although its general formulation allows for a fruitful application to other sectors, the approach and its definitions have rarely been extended beyond transport. In particular, the energy sector could significantly benefit from an application of its methodology since the prioritization of energy demand reduction over energy efficiency would be in line with an optimized path towards decarbonization. This paper outlines a theoretical application of the A-S-I framework to the energy sector that allows the categorization of energy policies in terms of Avoid, Shift, or Improve strategies. Moreover, the paper presents an analysis of several energy policies databases to evaluate to what extent policies are addressing energy demand reduction, shift to less-carbon-intensive energy sources or energy efficiency. The results of the study show that most energy-related policies seem to support improving efficiency in current technology (18–33% of policies, depending on the database that is considered) and shifting towards low-carbon sources (28–48% of policies) more than reducing or altogether avoiding energy demand in the first place (6–22% of policies). Further research is recommended to strengthen the results, especially by evaluating the significance of each policy in terms of committed investment, as well as to understand the main factors that contribute to Avoid-type policies being under-represented in the energy sector.
1. Introduction
Tackling the environmental and social challenges that characterize global energy systems requires prioritizing actions, which in turn means prioritizing investments. Since economic resources are inherently limited, they must be properly managed and directed toward the most efficient actions to achieve a given goal, such as reducing greenhouse gas emissions from energy consumption [1].
This task is particularly difficult since energy demand is projected to increase: the International Energy Agency (IEA) highlights that despite advancements in energy efficiency and renewable energy technologies, the global demand for energy continues to rise, and fossil fuel consumption has not yet peaked, posing significant challenges for sustainability, in all scenarios (STEPS and APS). The STEPS (Stated Policies Scenario) in the IEA’s World Energy Outlook 2022 reflects the impact of existing and announced energy policies on future energy demand and emissions, projecting current trends and policy settings to evaluate their sufficiency in achieving global climate goals and identifying gaps for more ambitious actions. The APS (Announced Pledges Scenario) in the IEA’s World Energy Outlook 2022 assesses the impact of all climate and energy pledges announced by governments, including long-term net-zero targets, projecting their effects on energy demand, emissions, and the energy mix to evaluate progress towards achieving international climate goals. This will hold true even if economic growth to 2030 should be slower than previously projected, leading to lower levels of activity in all sectors and thus lower energy demand growth [1,2].
In this context, a shared framework to prioritize investments in the energy sector is paramount to ensuring that the ‘best’ interventions—those that are most efficient in achieving the target given a certain input of economic, human, technological, and political resources—are funded and supported [3]. This requires a comprehensive approach that integrates multiple dimensions of sustainability, including environmental impact, economic viability, and social acceptance [4].
Several frameworks to assess the prioritization of investment and action have been proposed in the past. Interested readers may refer to the Circular Economy Framework, which focuses on minimizing waste and promoting the reuse, repair, refurbishment, and recycling of products and materials [5,6]. This approach is critical in creating closed-loop systems that reduce resource extraction and waste generation [7,8]. A life cycle approach is often required to perform a comprehensive and coherent analysis of all the environmental impacts [9], and potentially also other dimensions such as the social impacts [10].
Alternatively, Low-Carbon Development Strategies promote economic development while reducing carbon emissions through technological innovation, policy measures, and changes in energy infrastructure [11,12]. These strategies emphasize the importance of transitioning to a low-carbon economy through a combination of renewable energy adoption, improvements in energy efficiency, and supportive policy frameworks [13,14].
This article focuses on demand-side actions for energy sector, providing new insights into climate change mitigation strategies through discussing, in particular, the Avoid–Shift–Improve (A-S-I) framework. The framework emphasizes a hierarchical approach to sustainability, prioritizing actions that avoid resource consumption, shift to more sustainable alternatives, and improve the efficiency of existing resource use [15].
The A-S-I framework was introduced in the early 1990s in Germany and first mentioned in 1994 in the report of the German Parliament’s Enquete Commission [16], and it has recently been cited by the United Nations [17] as “a useful framework for assessing transport measures and for taking action in support of sustainable passenger and freight transport”.
The framework identifies three main ways or ‘pillars’ to increase the efficiency of the use of any natural resource:
- 1.
- Avoid: Encourage end users to reduce or altogether avoid the consumption of the resource. This involves strategies such as promoting behavioral change, enhancing digitalization to reduce physical travel, and optimizing processes to eliminate unnecessary resource use [18].
- 2.
- Shift: Promote the consumption of a more sustainable resource in place of the original, less sustainable one. This could include transitioning from fossil fuels to renewable energy sources, encouraging the use of public transportation over private vehicles, and substituting carbon-intense products with alternatives [19].
- 3.
- Improve: Increase the output-to-input ratio for the consumption of the current resource or modify its origin to a more sustainable one. This encompasses technological advancements, energy efficiency measures, and process optimizations to improve the performance of existing systems [20].
The most important feature of the framework lies not in the classification and organization of the three pillars but in its explicit prioritization of actions among them: the three pillars ‘are not created equal’; on the contrary, a specific hierarchy subordinates one to the other. Specifically, the A-S-I framework mandates [21,22,23] that the first priority should be given to ‘Avoid’ actions to modify consumers’ choices to avoid unnecessary and unwanted consumption of the natural resource. Only when ‘avoiding’ is not feasible or acceptable should ‘Shift’ actions be undertaken to modify the nature of the resource consumed. Finally, as the last choice, when neither ‘avoiding’ nor ‘shifting’ is possible or sufficient, action should be directed towards ‘Improve’ actions that increase the efficiency of the resource as it currently is [22].
This prioritization mechanism is at the heart of the A-S-I framework and is the focus of the present research work. The paper aims to characterize global investments in the energy sector in terms of the A-S-I framework’s three pillars, investigating whether the A-S-I prioritization is respected within the main energy policy frameworks that currently guide worldwide action in the sector. The specific aims of the paper are thus as follows:
- 1.
- To propose a theoretical framework that links the A-S-I framework to the energy sector by proposing parallels about the application of the three pillars to the global energy consumption and generation, thus enabling the use of the ‘Avoid’, ‘Shift’, and ‘Improve’ terms when describing energy policies;
- 2.
- To investigate whether current policies and investments in the energy sector respect the priority of action proposed within the A-S-I framework and, if not, where the main imbalances lie.
The methods and materials used for achieving these aims are as follows:
- 1.
- The existing literature concerning both current and future energy policies as well as the A-S-I framework, which have been used to elaborate the newly proposed theoretical framework;
- 2.
- Several publicly available energy policy databases, that have been analyzed as case studies of the application of the proposed framework to verify to what extent the proposed prioritization of the A-S-I framework is reflected in the policies that are currently in place.
The theoretical framework that stems from the application of the A-S-I framework to the energy sector represents a small but original contribution of this work. As mentioned, the A-S-I framework has been defined and applied mostly in the transport sector, although some similar approaches have been used in other domains, such as the application of the 3R’s or the 5R’s approaches (Reduce, Reuse, Recycle, Refuse, and Repair, respectively) in the waste management sector [24,25]. Also, its application to the transportation sector has been linked to several potential outcomes which include the reduction in related energy consumption and carbon emissions, making it viable to effectively address energy consumption in passenger transport [26] and freight transport [27]. At the same time, the framework could also be applied to assess energy policies in sectors other than transportation. Specifically, at the theoretical level, the paper proposes a categorization of energy policies type within the three A-S-I pillars of the framework, thus enabling a classification that, to the authors’ best knowledge, has not yet been proposed. Of course, the proposed categorization is prone to modifications and debate; in this regard, the paper’s desired contribution is also the sparking of a discussion on the role, and, to an extent, the main goal, of some energy policies. This aspect is presented in detail in the Discussion section of the paper.
Moreover, the second contribution of the present paper is the practical application of the proposed theoretical framework to the analyzed databases, which provide insights into the broad direction in which energy policies (globally and at European level) are moving. Such insights are guided by the prioritization proposed by the A-S-I framework, against which the analyzed data concerning current energy policies are weighted. This comparison of ‘theory vs. practice’ can start providing useful indications to adapt or correct the significance of energy policies to tackle the climate crisis. A recent work from the Boston Consulting Group [28] has similarly applied the A-S-I framework to assess whether the proposed theoretical prioritization is reflected into the Nationally Determined Contributions (NDCs) under the Paris Agreement, even though the study is still limited to the transport sector.
The paper is structured as follows: the A-S-I framework is discussed in Section 2, comparing its definition and application to the transport sector with a proposed adaptation to the energy sector. A subsequent analysis of five relevant policy databases is presented as a case study (Section 3), to evaluate to what extent existing policies address the three pillars of the A-S-I framework. This section presents a dedicated analysis of each database, together with a final comparison of the most significant ones. A subsequent discussion (Section 4) addresses the main points that emerge from the previous sections, which are then synthesized in the conclusions of the analysis (Section 5).
2. Avoid–Shift–Improve Policy Framework
2.1. Original Framework in the Transport Sector
As anticipated, the A-S-I (Avoid–Shift–Improve) framework was conceptualized in Germany in the early 1990s to address prioritization of efforts and investment in the transport sector, but its general features have since been transferred to other sectors and realms (usually accompanied by an adaption of the frameworks’ nomenclature).
The three strategies identified by the framework largely correspond to three main domains of action within the transport sector:
- 1.
- The “Avoid” strategy encourages final users to reduce or avoid resource consumption by addressing mobility demand directly. The demand-side management is strictly linked to the socio-cultural domain of transport, which encompasses social norms, culture, and individual choices. Key interventions in this realm include urban planning that promotes compact, mixed-use development, reducing the need for long-distance travel and fostering transport hubs [29,30], as well as promoting remote options such as remote working [31], online learning, e-commerce, and digital administration [32,33].
- 2.
- The “Shift” strategy aims at changing people’s mobility habits from using polluting and costly modes of transport, like private cars, to more sustainable options. The focus of the strategy is thus on the ‘infrastructure’ domain, as it promotes developing an infrastructure that supports sustainable transport modes, such as public transit, cycling, and walking. In fact, investment in high-quality public transit systems can facilitate a shift from private car use to public transport [34]. Moreover, creating safe and extensive cycling and walking networks encourages active transport, reducing emissions [35,36].
- 3.
- The “improve” strategy is strictly linked with the ‘technology’ domain, as it focuses on enhancing existing technological solutions to reduce emissions and increase energy efficiency in the transport sector. This includes cleaner vehicle technology (such as replacing internal combustion engine vehicles with electric vehicles (EVs), as well as the integration of renewable energy sources for the power supply chain of vehicles, which are both proven to reduce dependence on fossil fuels and to lower emissions [37,38].
The A-S-I framework has been widely used in the transport sector [39], with a range of applications: defining policies, evaluating health and environmental co-benefits [40], and assessing the performance of mobility and accessibility services [41], as well as for transport optimization actions [42]. The framework has also been used in the literature to quantify the economic cost of environmental impacts and compare the potential savings of different measures [43]. It is important to remember that transport policies need to ensure a variety of goals [44], not only reducing environmental impact and energy consumption but also aiming at increasing accessibility [45] and reducing transport inequality and social exclusion [46,47]. In this perspective, the A-S-I framework should be interpreted by considering the different dimensions of transportation planning.
The principles of the A-S-I framework are also outlined in global and European strategies aimed at making mobility more sustainable, transforming transport systems for more sustainable societies, and creating pathways for decarbonizing the transport sector [48,49].
2.2. The A-S-I Framework for the Energy Sector
The energy system includes many sectors and stages of the supply chain, from the production to the final consumption. As a result, policies and strategies at different levels (local, national or international) may be focused on specific sectors and have different objectives. It is of particular importance to ensure the coherence of planning at different levels, such as at the national and local scales [50,51]. Most policies are currently aiming at reducing fossil energy consumption to decrease GHG emissions, by pushing for low-carbon alternatives such as renewable energy sources [52,53,54], and by supporting an increase in the energy efficiency of the systems and processes under analysis [55,56]. Energy plans are being developed at different scales [57], often with the support of energy system modeling tools [58,59] and participatory methods to involve relevant stakeholders [60,61].
Given the goal of the paper to investigate whether the A-S-I prioritization is respected within the energy sector, it is crucial to transfer the applicability of the framework from the transport to the energy sector by proposing new ‘definitions’ of the Avoid, Shift, and Improve terms that can apply to energy consumption and generation:
- 1.
- The “Avoid” pillar focuses on reducing the overall need for energy. This approach looks at the global energy consumption landscape and identifies strategies that can decrease energy needs through regulation and changes in human behavior [62,63]. This can be achieved through various strategies that target energy consumption at its source. Conducting energy audits, as highlighted by the International Energy Agency [64] and other scholars [65], can help to identify inefficiencies and opportunities for energy savings in residential [66], commercial [67], and industrial [68] facilities. Demand–response programs nudge consumers to reduce energy usage during peak periods, thus balancing supply and demand more effectively [69]. Additionally, enforcing improved building standards ensures that new constructions are designed to be more energy efficient, thereby reducing their overall energy footprint [70,71].
- 2.
- The “Shift” pillar emphasizes changing energy sources or technologies to more sustainable, less carbon-intensive alternatives. This involves increasing the integration of renewable energy sources such as wind, solar, and biomass, which is crucial for reducing reliance on fossil fuels [72]. This shift is often discussed for electricity generation [73,74], but it is important to remember that the same logic applies to energy consumption for heat generation [75] and in the transport sector [76]. In addition, switching final uses to electricity (for example, through the electrification of heating systems by replacing fossil fuel-based heaters with electric heat pumps [77]) can significantly increase the penetration of renewable sources and thus cut emissions [78,79]. Furthermore, promoting the use of green hydrogen, produced from renewable energy, for industrial processes and energy storage may provide a viable pathway to decarbonize sectors that are hard to electrify, such as heavy industry [80,81].
- 3.
- The “improve” pillar aims to increase the efficiency of existing energy systems. Implementing smart grid technologies improves the efficiency and reliability of electricity distribution [82], allowing for better management of energy resources [83,84]. Advanced energy storage solutions optimize the use of renewable energy and enhance grid stability [85]. Additionally, encouraging the adoption of high-efficiency appliances and lighting systems can lead to significant reductions in energy consumption [86].
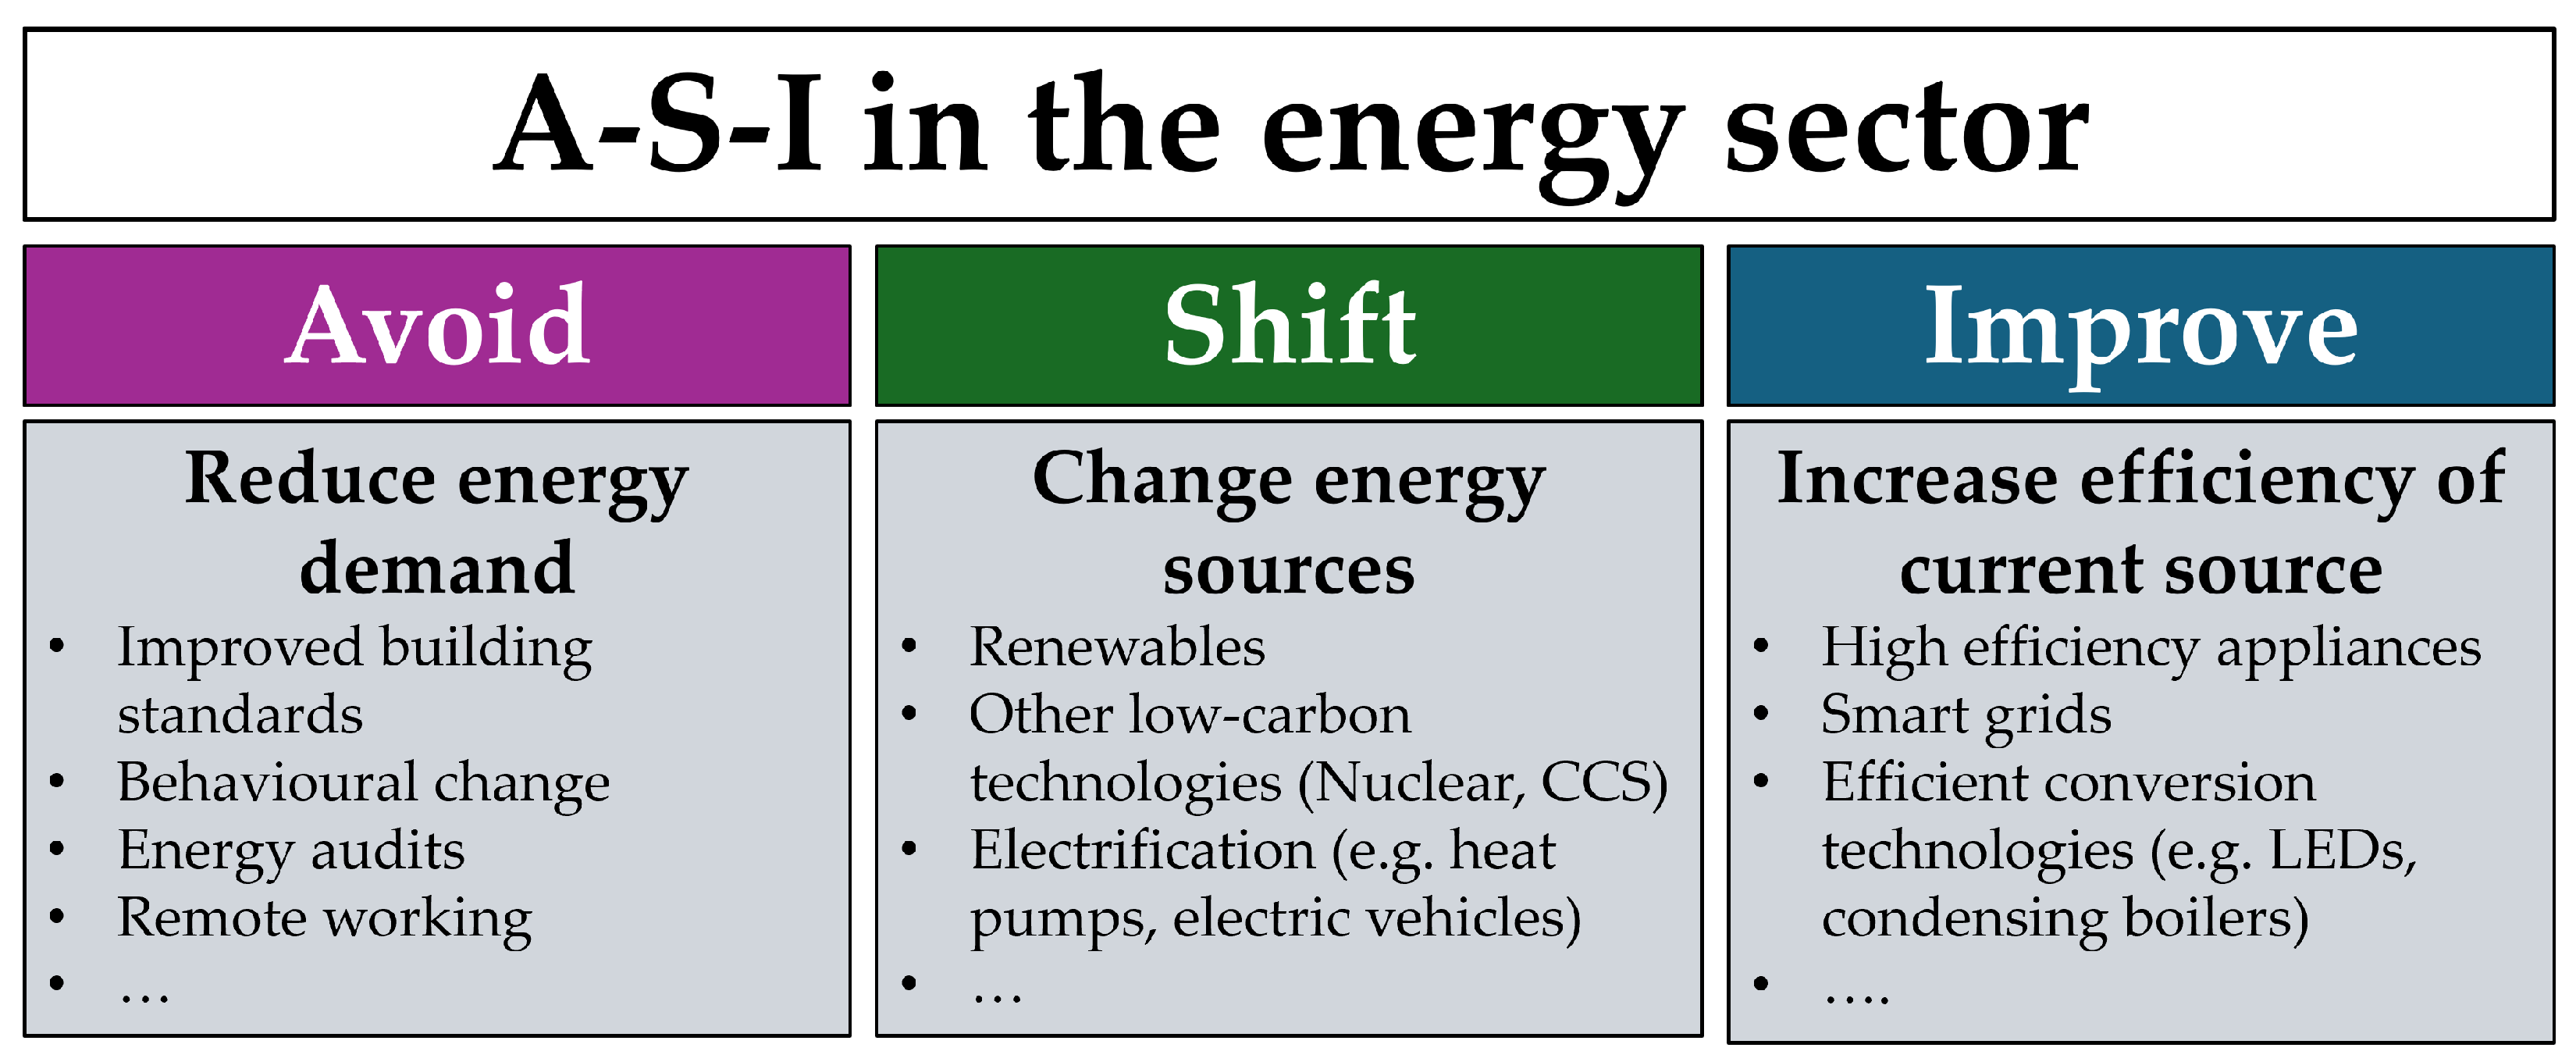
Energy consumption can thus be reduced in any specific sector with a combination of the three strategies. For instance, considering buildings’ heating, actions may include the implementation of better insulation (Avoid), the installation of heat pumps or solar collectors in substitution of fossil-fired boilers (Shift) or the choice of low-temperature heating distribution and condensing boilers (Improve). Similar examples can be made for other sectors, such as industry, transport and power generation. In fact, many actions that are often grouped together as ‘energy efficiency’ may actually fall within different pillars since the concept of energy efficiency include many different solutions [87,88]. In this analysis a difference is proposed between actions that reduce the energy demand (Avoid)—such as buildings insulation—and actions that improve the energy conversion efficiency (Improve), possibly also changing the energy source that is used (Shift).
An example of the strategies in the energy sector that can be classified into the A-S-I framework is reported in Figure 1.
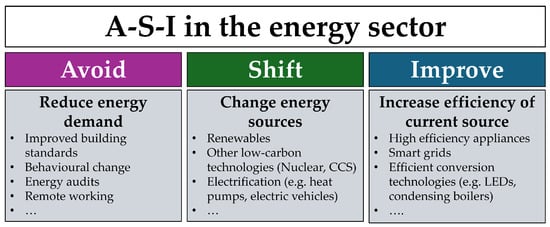
Figure 1.
Classification of strategies in the energy sector within the A-S-I framework with some relevant examples.
Again, it is important to highlight that sometimes, this classification may be rigid for some actions: a heat pump (HP) has better energy conversion efficiency than a fossil boiler, so although it is classified as a “Shift” measure, it could also be considered an “Improve” measure. Therefore, the proposed classification can have a margin of uncertainty, and some policies may address two (or three) different pillars. For instance, “Shift” measures include any solution that changes the energy source that is consumed, such as the electricity production from renewable sources instead of fossil fuels, or the electrification of buildings and transport via heat pumps or electric vehicles respectively. Conversely, “improve” measures include the better use of an existing technology, such as condensing boilers instead of traditional boilers in households [89] or industries [90], and the deployment of efficient lighting systems in buildings [91].
Finally, a shift towards electrification may not actually change the primary energy that is used: substituting a natural gas boiler with a HP in a country where electricity is mostly produced from natural gas may produce very little change. However, this is an additional layer of complexity that has not been considered in this analysis, even though it is possible that other scholars may propose different interpretations and classifications.
3. Case Studies
As anticipated, after proposing a definition of the A-S-I framework that can be applied to the energy sector, several publicly available policy databases have been analyzed as case studies to understand to what extent the existing policies can be classified in accordance with the discussed framework, and assess to what extent each pillar of the framework is reflected in the policies that are currently in place.
Five different public databases that summarize the main features of policies in the energy sector have been analyzed. The main features of the databases are reported in Table 1. The policies will be analyzed by classifying them based on the available information in each dataset, to assess the prominence of Avoid, Shift, and Improve actions in existing policies.

Table 1.
Main features of the policy databases considered in this paper.
The depth of information available in each database varies, thus making it difficult to present a comprehensive comparison. For this reason, each database is here described in a dedicated section, and a final comparison will summarize the results for each case.
3.1. IEA’s Policy Database
The IEA has a database of all world’s country policies [92] that includes more than 8000 policies, and it is probably the largest available collection of energy policies. However, it currently cannot be exported for further analysis and can only be consulted online, but a wider version of the database is expected to be made available in the future for further analysis. Given this current limitation, only a general description of some features can be presented.
The database includes a total of 8065 policies, including 6385 that are currently in force, 1510 that are no longer in force, and the remaining 170 that are either planned or have been announced. The majority of policies are developed at the national level (7008), in addition to a group of international policies (359) and others are developed at the provincial (575) or municipal (105) level. The policies are classified considering a number of dimensions, including the sector, the policy type, the topic, and the technology that are considered. The web interface allows to visualize the first ten categories by the number of policies for each dimension, and the user can also manually search for other categories. For this reason, only a general description of the most frequent categories can be presented. The most recurrent policy types include payments, finance and taxation (2900), regulation (2544), payments and transfers (2028), targets, plans and framework legislation (1595) and grants (1368).
The dimension that can provide some insights within the proposed A-S-I perspective is the classification by topic. The most frequent topics are associated to energy efficiency (which account for almost half of the recorded policies, 3668) and energy generation technologies. A manual analysis of energy efficiency policies suggests that this category also includes policies related to energy savings and energy reduction, although it is not possible to assess their relevance in quantitative terms without analyzing in detail every single record. Other important topics that are relevant for this discussion include renewable energy (2963 policies), technology R&D and innovation (722), electrification (294) and energy poverty (264). Unfortunately, through the online interface, which is currently the only publicly available option, it is not possible to perform additional analyses such as aggregating and classifying policies.
3.2. Climate Policy Database
The Climate Policy Database [93] is published and maintained by the NewClimate Institute for Climate Policy and Global Sustainability, with support from Wageningen University and PBL Netherlands Environmental Assessment Agency. It includes a collection of climate mitigation policies, which is periodically updated. Planned policies are excluded from the database, with the exception of energy and emission targets announced as Intended Nationally Determined Contributions (INDCs) for the post-2020 period.
The current version of the database includes a total of 6273 policies that address climate change, of which 4597 are currently active (labeled as “In force” in the database). More than 95% of the policies are developed at the national level, while the remaining policies are focused on sub-national levels (regions or cities). The database includes many details for each policy, as well as some useful classifications that can help to evaluate the characteristics of the policies, among which the main are the following (the number in bracket indicates the number of unique categories within each classification):
- Policy instrument (71 categories): the policy schemes that are applied (e.g., GHG reduction target, monitoring, and voluntary approaches);
- Sector (33): the final sectors that are covered by each policy;
- Policy type (5): the type of actions that are included in the policy (e.g., energy efficiency and renewables);
- Policy status (7): whether a policy is currently in force or not;
- Policy objective (9): the aim of the policy (e.g., mitigation and air pollution).
It must be remarked that in many cases, a single policy is associated with multiple categories, and for this reason, a policy focusing on a single category might in principle be more relevant compared to a multiple-category policy.
An analysis of the policies by type is reported in Table 2. The types of policies have been classified in accordance with the A-S-I framework described in the previous section, considering “Energy service demand reduction and resource efficiency” to be Avoid policies, “Renewables” and “Other low-carbon technologies and fuel switch” to be Shift policies, and “Energy efficiency” to be Improve policies.
Table 2.
Climate policy database—policies by type.
More than half of the total policies (57%) are measures of a single type, while the remaining 43% addresses multiple measures simultaneously. When considering Improve or Shift policies, about one third of them (35% and 30%, respectively) are policies only focused on that pillar. This figure decreases to 9% for Avoid policies, meaning that very few policies are specifically focused on energy demand reduction, while these measures are often promoted together with other types of policies.
3.3. Energy Policy Tracker Database
The Energy Policy Tracker database [94] includes policy and measures that were related to COVID-19 recovery, thus limited to the 2020–2021 years. A new database on future energy policies is expected to be launched in the future.
The database includes 2000 policies across 38 countries, although with significant differences between countries with many policies (Spain and Canada with 321 and 294 policies, respectively) and with few policies (Vietnam: 2, Bangladesh: 3, Peru and Nigeria: 6). Moreover, half of all policies are regarding only five countries (Spain, Canada, United States, the United Kingdom, and India). Records include policies developed at national, regional or municipal level.
The main classifications are the following, where the number in bracket indicates the number of unique categories within each classification:
- Policy category (5): classification considering clean vs. fossil and conditional vs. unconditional policies;
- Sector (6): the final sectors that are covered by each policy;
- Mechanism (15): the type of mechanism that supports the policy (e.g., fossil fuel subsidy reform, loan, tax or royalty);
- Energy type (22): the energy source or carrier that is addressed by the policy;
- Stage (10): the energy stage that is addressed (e.g., electricity generation, distribution, and energy efficiency);
- Economic values committed and disbursed by the policies (both in local currencies and USD).
Additional information include the name of the policy, the objectives, the background and links to sources.
An analysis of the database allows to draw some general conclusions on the policies that are included. Most of the policies are classified as addressing clean energy (with 595 unconditional policies and 524 conditional policies), although a significant number are also related to fossil fuels (443 unconditional and 163 conditional). The sectors that are mostly addressed are mobility (676), power generation (511), and buildings (197), although 319 policies address multiple sectors at the same time.
Unfortunately, a clear classification of policy types through the A-S-I framework discussed in the previous section is not possible, given the lack of an explicit classification of the policy objectives. Nevertheless, some information is available to classify the policies by stage of application as reported in Table 3.
Table 3.
Energy Policy Tracker database—number of policies and expenditure by stage.
The figures presented in Table 3 show a worldwide total commitment of USD 1.24 trillion, although only USD 22 billion (1.77%) are recorded as being actually disbursed. Most policies (and expenditure) address the final energy use, which includes different sectors (households, mobility, buildings, etc.). However, most of these policies (76% of policies and 92% of committed expenditure) are focused on the mobility sector, reflecting the importance of these actions as a reaction to the effects of the COVID-19 pandemic. The policies included in this database are therefore mostly short-term ones, sparked by the immediate interest in mobility due to the COVID-19 pandemic; they may thus not always be aligned with those described in the other considered cases, which include medium- and long-term policies as well.
3.4. EEA Database
The European Environment Agency published a database [95] that contains a number of policies and measures implemented, adopted or planned by European countries to achieve climate and energy targets, such as reducing GHG emissions, producing additional renewable energy, or reducing overall energy consumption. The policies and measures included in the database are based on the integrated national energy and climate plans, and they were reported in 2023 by European countries under the Governance of the Energy Union and Climate Action Regulation and its two Implementing Regulations (EU) 2020/1208 and (EU) 2022/2299.
The database includes several columns, a significant number of which unfortunately reports many empty records (a total of 81% of the cells in the database are empty). This is due to the fact that many indicators are defined, but they may not be relevant for every policy or there may not be enough information to record them. For this reason, many indicators cannot be properly compared across policies and measures.
A useful indicator is the collection of sector objectives for each of the policies that are included in the database. Around half of the policies (1483) have a single objective, while 723, 406, and 182 policies have 2, 3, or 4 objectives, respectively (316 policies have more than four objectives, and for 231 policies, no information is available about their objectives). The main sector objectives per number of occurrences are reported in Table 4.
Table 4.
European Environment Agency database—main sector objectives per number of occurrences.
Data confirm the relevance granted to the topic of energy efficiency in buildings (571 policies) as well as in other sectors: services (252), industry (216), vehicles (206), and appliances (206). The energy supply sector in general (138 policies), which includes energy production and transformation, figures prominently within the database.
The shift to other forms of energy includes the improvement in renewable energy sources in electricity production (478) and heating and cooling (240), as well as the shift to low-carbon fuels in transport (279) and energy supply (200), or the electrification of road transport (192).
Finally, demand management and reduction is mentioned in 255 policies considering energy consumption in final uses, and in 149 policies considering transport. In this sector, 224 policies are also focusing on the modal shift towards public or active transport modes, and 140 policies on improving the transport infrastructure.
Summarizing these figures by type of policy, considering the A-S-I framework presented in the previous section and extending the analysis to all the 76 different policy objectives (instead of the main 15 presented in the previous table) leads to the following results:
- ‘Avoid’ measures appear in 1341 policies, of which 376 are single-objective policies (including the energy efficiency improvement in buildings);
- ‘Shift’ measures, including the increase in renewables and the shift towards low-carbon fuels and other transport modes, appear in 2056 policies, of which 469 are single-objective policies;
- ‘Improve’ measures, considering efficiency improvements across different sectors, appear in 2232 policies, including 305 single-objective policies.
These figures give a preliminary estimation of the effort across the three types of policies, or strategies, although the number of policies alone is not a sufficient indicator neither of the actual effort put on those measures nor of the level of ambition of the policies compared to what should be required. Nevertheless, these results suggest that under the proposed classification, measures aiming at reducing the energy demand appear less frequently than measures aiming at growing the penetration of renewables or increasing energy efficiency.
3.5. MURE Database
The Mesures d’Utilisation Rationnelle de l’Energie (MURE) database [96] collects multiple energy efficiency measures in the European Union (plus Norway, Switzerland, the UK, and Energy Community Contracting Parties [97]). The database includes policies and measures at the national level and at the EU level, focusing on energy efficiency in the end-use sectors for households, industry, transport, and services. For this reason, the focus is narrower than in the cases presented above, and the results of the analysis should then be interpreted accordingly.
The database includes 1978 policies, with information on sector, country, and measure type, among others. Policies are divided across four sectors: transport (455 policies), households (462), services (406), and industry (229). Moreover, 426 policies concern general cross-cutting solutions that are not addressing a specific sector. The distribution across countries is quite variable, with seven countries concerned by less than 10 policies each and three countries concerned by more than 100 policies each. Policies are also classified based on the type of measure (each policy can include multiple measures, although 86% of the policies are single measure). The most frequent measures are financial support (appearing in 502 policies), mandatory standards (425), general program (339), and information/training (220).
The database also includes a field with the title of the policy and another with a short description of the policy. Unfortunately, there is no other classification that could help in further evaluating the policy actions. An analysis of the frequency of words appearing in both the titles and descriptions of the policies has been tried, but has not led to a clear support of the aim of the paper. Many words appear quite frequently, such as “efficiency” (328 occurrences in the policy titles and 474 in the descriptions) or “renewable” (147 and 81), but such information alone is not sufficient for any reasonable and reliable classification. Furthermore, as already mentioned, this database includes energy efficiency measures only, thus rendering any comparison with the previously presented case studies less meaningful.
3.6. Comparison
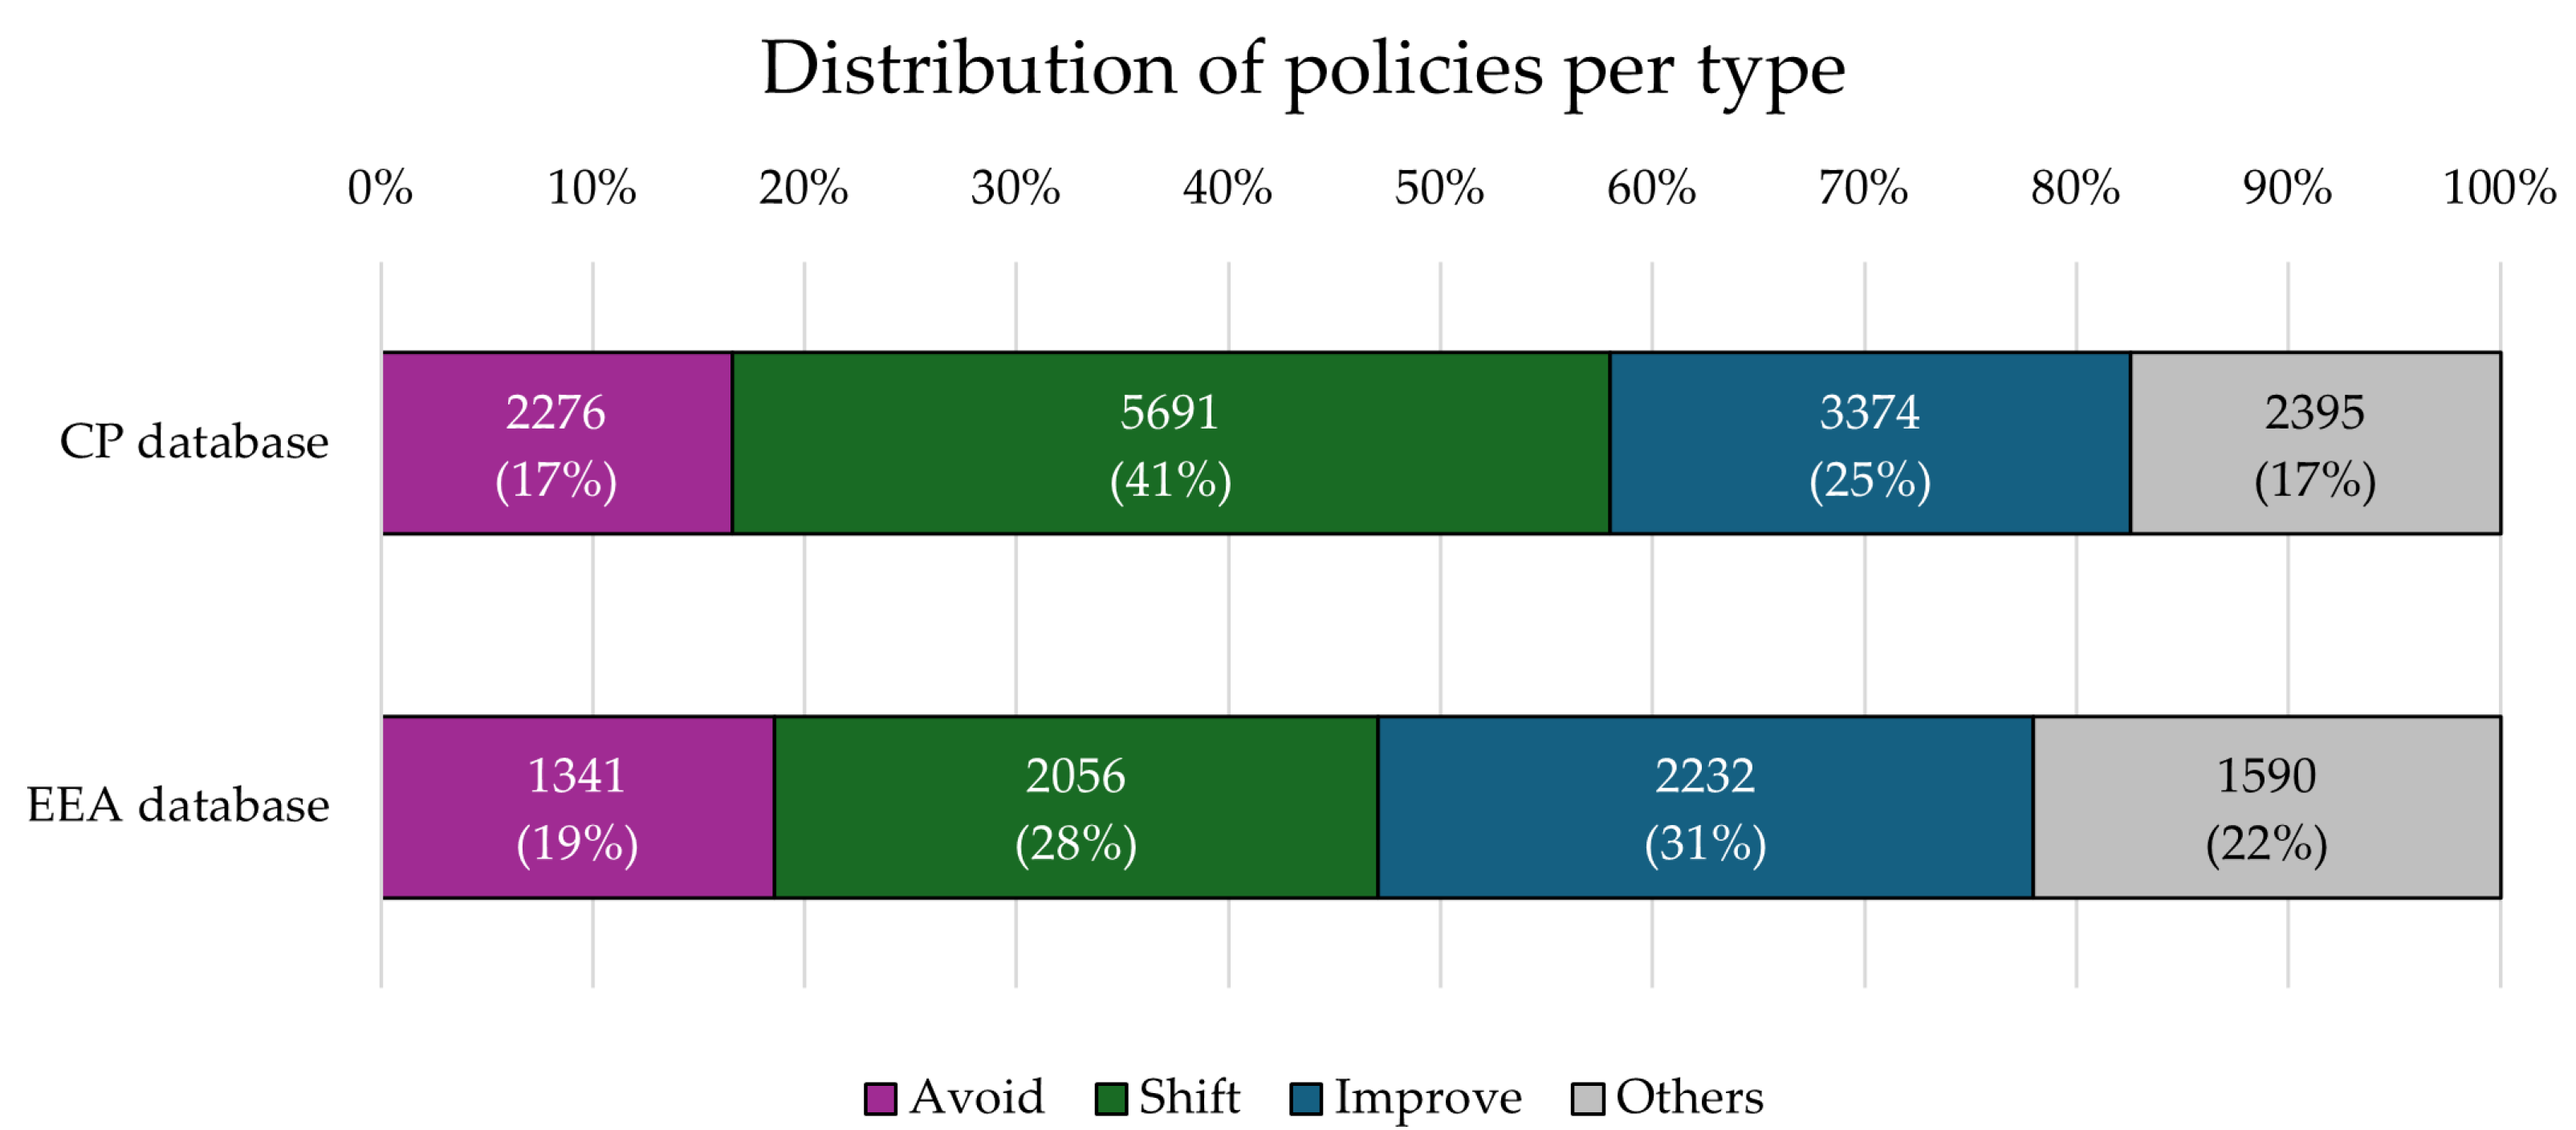
As previously discussed, a complete comparison across databases is not possible, as they include different information and classification fields. Nevertheless, a preliminary classification according to the proposed A-S-I framework has been performed for the Climate Policy and EEA databases. This preliminary classification, presented in the previous sections for the single database, is reported in Figure 2 to allow for the comparison across the CP and EEA databases.

Figure 2.
Comparison of the classification of energy policies in an A-S-I framework for the CP and EEA databases (all policies).
In both databases, the policies that are classified as “Avoid” represent a limited share of the total, 17% and 19% for the CP and EEA databases, respectively. Most of the policies in the CP database are classified as Shift policies (41%), followed by Improve (25%). The EEA database is different since the majority of policies are classified as Improve, although the gap between the two categorization is narrower (31% Improve and 28% Shift).
The preliminary conclusion drawn from the proposed comparison is that the policies aiming at the Avoid measures are a limited share of the total in both databases. However, as already mentioned, this fact alone does not provide sufficient information neither on the actual effect of those policies nor on their relevance and magnitude. For this reason, additional information would be required to properly assess the role of each policy type. At the same time, the results of the proposed analysis can provide a preliminary evaluation of the weight of each policy type.
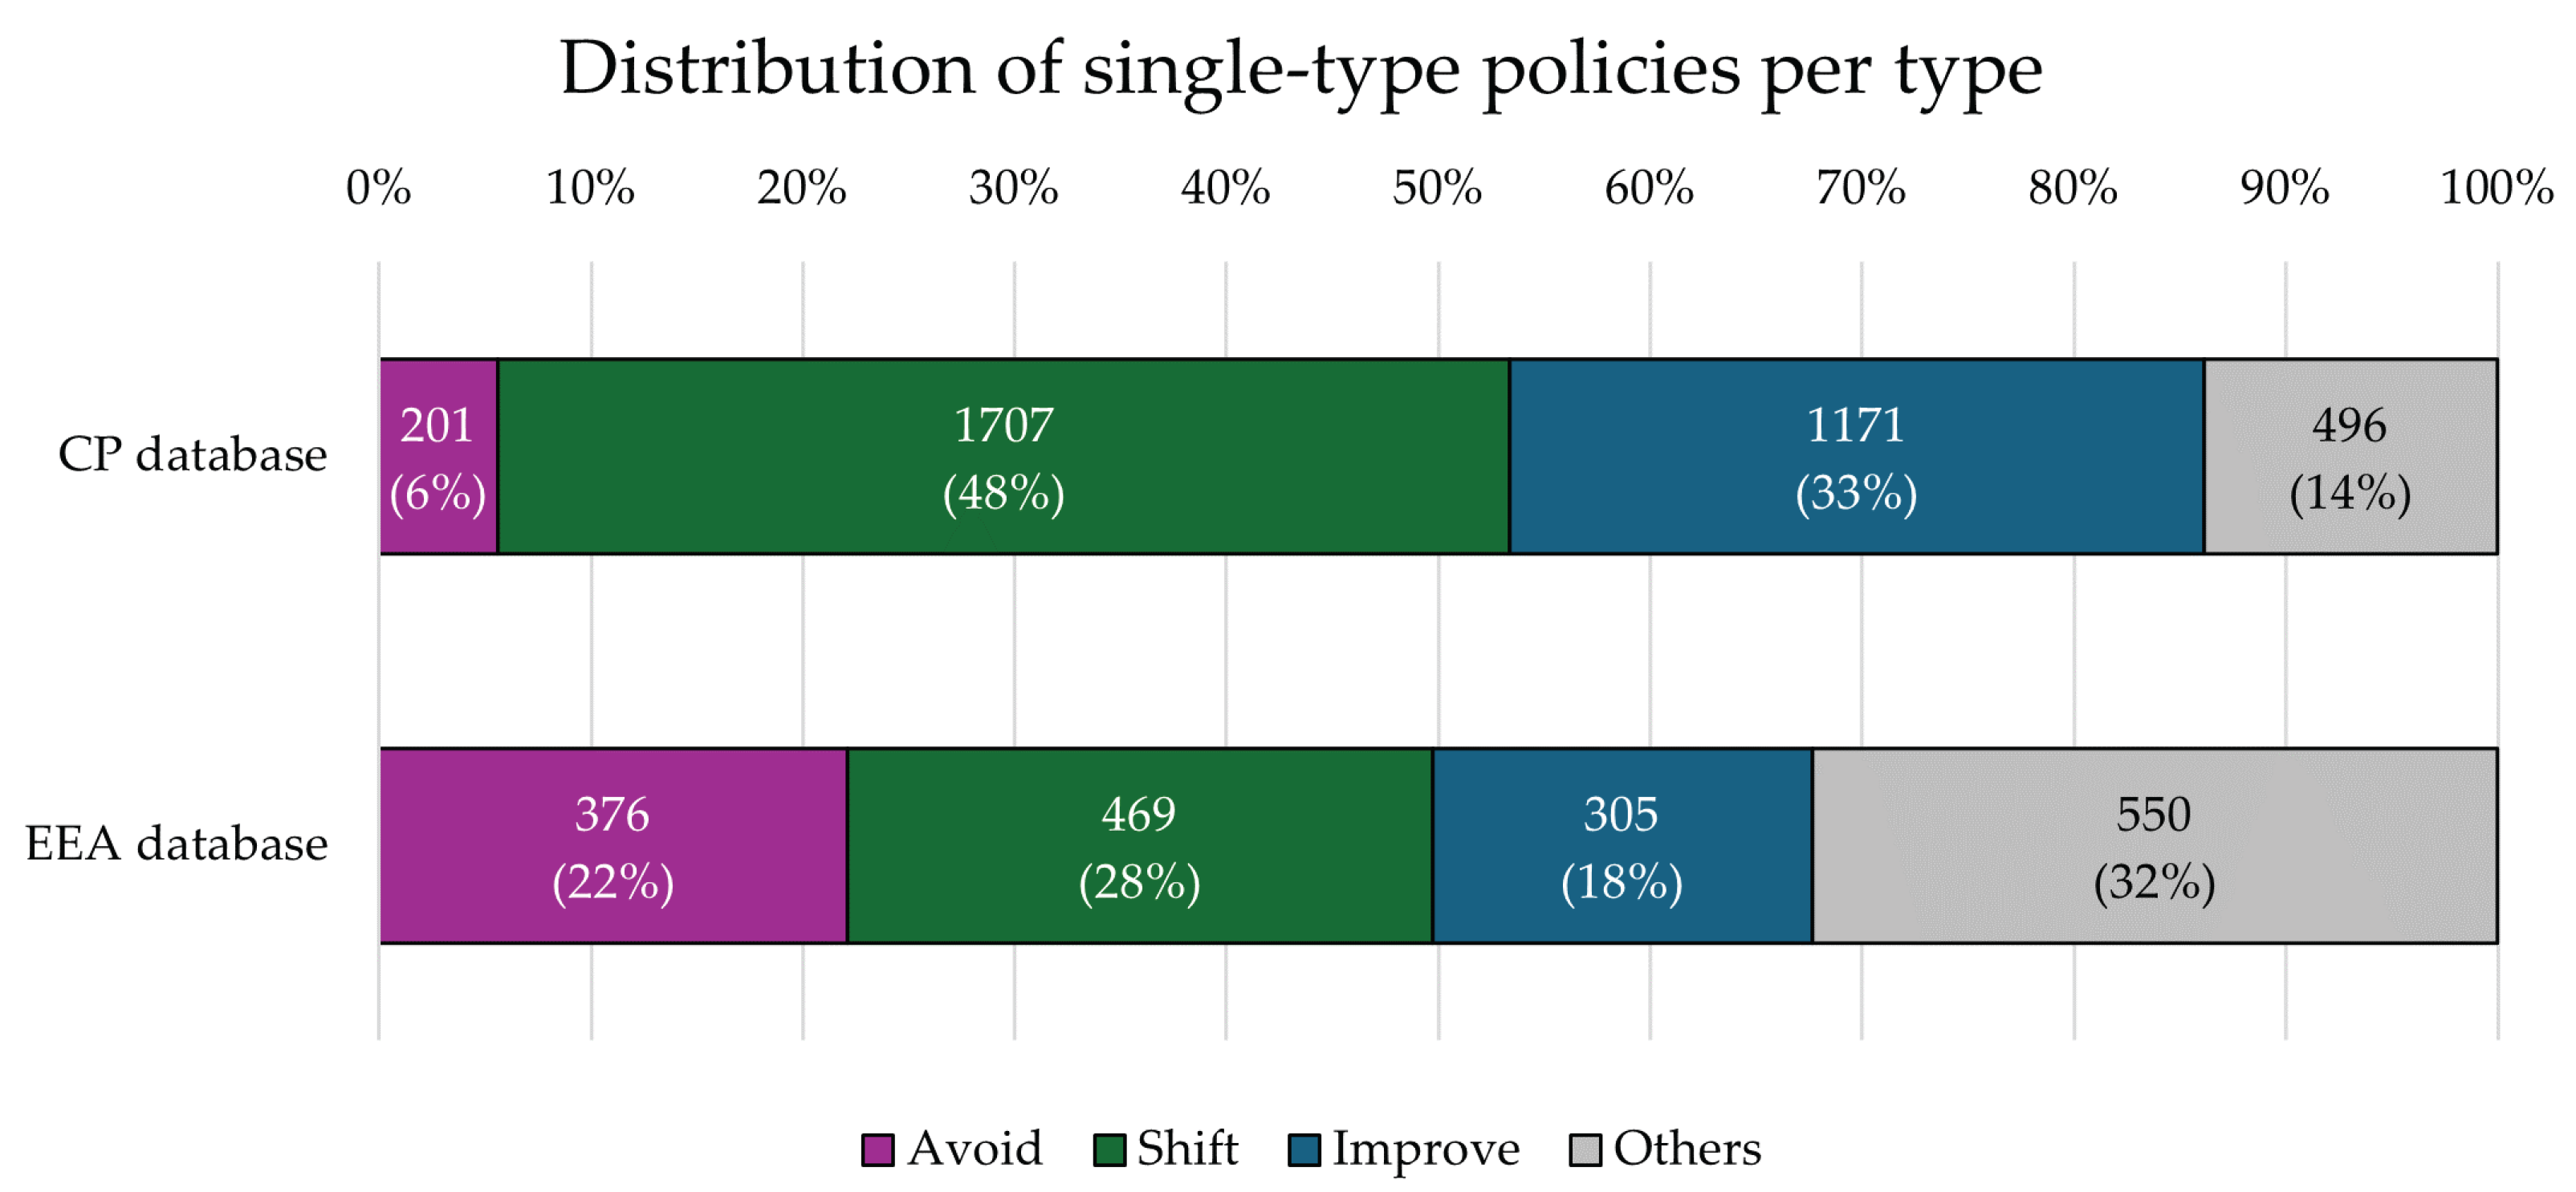
An additional focus is presented by limiting the analysis to single-type policies as reported in Figure 3. In this case, Avoid policies represent an even lower share for the CP database (6%), while they account for a higher number of policies in the EEA database (22%) with respect to the previous analysis which includes multiple-type policies. In the case of the EEA database, it is important to remark that most of the single-type Avoid policies (219 on a total of 376) are related to energy efficiency improvements in buildings. Nonetheless, it must be noted that Avoid policies still represent a minority within both databases, notwithstanding the limitation of the previously discussed analysis.

Figure 3.
Comparison of the classification of energy policies in an A-S-I framework for the CP and EEA databases (single-type policies only). Percentages may not total 100 due to rounding.
4. Discussion
The results from the proposed analysis suggest that the Avoid-type policies represent, at least in numerical terms, a small portion of all existing decarbonization policies within the energy sector. This is a relevant result since the A-S-I framework indicates a clear priority of action: the Avoid-type actions should be considered of primary importance, with Shift-type actions in ‘second place’ and Improve-type actions in ‘third place’. The results, therefore, seem to show that the proposed policies contradict such a prioritization scheme, as the prioritized policies appear to be the ones pertaining to the Shift and Improve strategies, and by some margin. This result holds true when considering both multiple-type policies, which are policies where a mix of two or three of the A-S-I strategies are addressed, and single-type policies which only pertain to one of the three strategies.
On one hand, as already pointed out, the collected information in each of the analyzed database does not allow to fully analyze the relevance of each policy, thus leaving the possibility open that the few Avoid-type policies still represent the largest interest and investment within the sector when compared to the larger but less significant Shift- and Improve-type policies. The improvement in existing databases might allow further, deeper analysis to at least partially clarify this aspect.
On the other hand, the result derived from the analysis provides a preliminary indication of a clear direction of prioritization that does not match the one proposed within the A-S-I framework. This, in turn, points at a potential mismatch between the ‘theory’ and ‘practice’ of policy-making and investment that might hint at inefficiencies in resource allocation and, ultimately, a higher risk of not achieving the given target of the decarbonization of society, or at a higher cost than what would theoretically be possible.
An important remark is that such a result, here devised for the energy sector, might also be shared across economic sectors where the same or similar theoretical approaches have been proposed, such as the transport sector or the waste-management industry, for example. In that sense, there might be a structural difficulty in proposing and financing Avoid-type policies per se.In fact, a difficult but fundamental question that should be answered with further research, at least pertaining the energy sector but possibly extending to other sectors such as the ones just mentioned, is why this should be the case: why should the demand reduction in energy, transport, or the reduction in waste generation attract less political commitment and interest (and thus probably less investment) than other types of policies, especially since cited research has shown that their potential in achieving decarbonization targets should grant them at least the same ‘dignity’ as Shift- or Improve-type policies.
A potential explanation might concern the issue of economic growth and its link to energy consumption; in this sense, demand reduction policies might be seen as carrying the risk of ‘degrowth’ of the energy sector, and in that sense being seen as nonattractive. This might be particularly true for private investors, as Avoid-type policies would ultimately decrease the volume of business of many companies and entities whose activity is directly related to the generation and transportation of energy in all its forms.
One other potential barrier might concern the inherent multidisciplinarity of demand management policies, which seldom, if ever, are ‘purely technical’ solutions; this, in turn, might make Avoid-type policies appear as too complicated and ‘random’ (i.e., where the obtained results are less easily connected with the provided inputs) when compared to Shift- and Improve-type policies. Further research should thus explicitly aim at investigating the main barriers to Avoid-type policies in the energy sector.
This is particularly true as it has been shown that some Shift and Improve policies might even increase the final energy demand and thus have the effect of increasing, or at least decreasing less than initially expected, the final energy consumption through the so-called ‘Rebound effect’ [98,99,100]. This well-known phenomenon further highlights the opportunity to prioritize Avoid- over Shift- and Improve-type policies (see, for example, the results from [26]).
In addition, some existing policies even contribute against the reduction in energy demand by providing subsidies that reduce the cost of energy consumption to final users. In particular, the last update of the fossil fuel subsidies database by the IEA [101] includes measures that have reached USD 1.13 trillion of subsidies across 49 countries in 2022. This figure represents a 92% increase against 2021, mostly due to the effect of the energy crisis in Europe. Another example of a similar mechanism concerns cost structures that disincentivize energy savings, such as energy bills that are at least in part proportional to the installed power and not only to the consumed energy; such cost structures make Avoid-type policies less attractive, as their efficacy is not entirely reflected in reduced costs for the final users.
Moreover, a factor that must be taken into account is that multiple policies might have the final effect of increasing energy consumption in certain socio-geographic contexts, simply because their aim is to increase energy accessibility to fight poverty, vulnerability and other socio-economic disadvantages. An evaluation of these policies within the A-S-I framework here proposed is thus not immediate since their direct target has less to do with decarbonization and more with expanding equal access to energy.
Finally, the obtained results can be compared with those from previous similar studies, though only to an extent. In [3], an evaluation of the potential for ’demand-side solutions’ towards climate change mitigation is presented, and such an evaluation adopts the A-S-I approach in a similar way to the one proposed in the present work. The main result in this regard states that there exist a high potential (in the range of 41% to 78%) of greenhouse gas emissions reductions for Avoid-type policies in all considered macro-sectors, which are ‘buildings’, ‘transport’, ‘food’, and ‘industry’. Therefore, the paper highlights the importance of such policies and their potential role for climate change mitigation. At the same time, no comparison is made to assess whether such assessed potential is reflected in the existing policies, simply because this is out of the scope of the paper. Moreover, the proposed macro-sectors classification does not allow to single out the impact on ‘Energy’ as proposed in the present work.
Conversely, the work from the Boston Consulting Group [28] does compare, as it is one of the primary objectives of the study, the potential for Avoid-type measures with their prominence in existing policies, namely, the updated NDCs under the Paris Agreement as collected by the United Nations Framework Convention on Climate Change (UNFCCC). The paper’s findings are coherent with those in the present work, as the authors find an under-representation of Avoid- and Shift-type measures, an over-representation of Improve-type ones, given their assessed potential for reducing GHG emissions, and they find that measures within the updated NDCs “focus overwhelmingly on Improve Measures” despite the huge potential that the research work has found to be associated with Avoid and Shift measures. At the same time, the paper is focused on the transport sector only, which is the primary ‘field of application’ of the A-S-I approach as already stated, thus allowing only a partial comparison with the results from the present work.
Similarly, in [26], different scenarios that adopt multiple combinations of Avoid, Shift, and Improve measures are compared within a specific context, that of the German transport sector. The results again show that combinations of Avoid and Shift measures show potential for a significant reduction in energy demand; the paper also explores the potential equity and cost issues of the three types of policies. However, the scope of the paper is once again limited to the transport sector, even though results are expressed in terms of energy demand reduction.
5. Conclusions
As the urgency to tackling climate change and its related challenges grows, a paramount issue becomes the efficiency of the allocated resources and the appropriateness of existing and planned policies to steer action in the right direction. As one of the main ones responsible for GHG emissions, the energy sector should be kept under particularly heavy scrutiny, as failing in properly direct efforts within the energy generation and consumption realm might prevent climate-related targets from being met.
In this paper, an existing approach called A-S-I, initially developed for prioritizing action in the transport sector, has been shortly presented and adapted to the energy sector. The three strategies that compose the approach (‘Avoid’, ‘Shift’ and ‘Improve’) have been redefined to make them applicable to the energy sector, allowing to categorize existing policies within such a framework. This is relevant because the framework proposes a clear prioritization of the Avoid policies over the Shift policies and then over the Improve policies in turn. The application of the adapted A-S-I framework to the energy sector thus allows to investigate whether current policies respect such prioritization.
Therefore, several databases that collect the existing, planned, and inoperative energy policies worldwide have been analyzed and compared through the lens of the redefined A-S-I framework. Even if the information provided in the databases is not always directly comparable, the obtained results suggest that the prioritization proposed within the A-S-I framework is largely not reflected in the number of policies pertaining to the three strategies; in fact, policies that pertain to the Avoid strategy are consistently under-represented within the existing policy realms, both when considering multiple-type and single-type policies. Based on the available data, policies related to the Avoid strategy represent 17–19% of the total when considering multiple-type policies (compared to 28–41% for Shift policies and 25–31% for Improve policies) and 6–22% of the total for single-type policies (against 28–48% for Shift policies and 18–33% for Improve policies).
The obtained results are relevant, as they point at the possible inefficient resource allocation and partial misdirection of energy policies for decarbonization, which in turn carry the risk of missing climate targets or increasing the cost of achieving them with respect to what would be theoretically possible. Such results are also coherent with the general indication from the existing literature, which points at an under-representation of Avoid- (and Shift-) type policies with respect to their significant potential for energy demand and GHG emissions reduction; at the same time, the existing literature is usually focused on applying the A-S-I approach to the transport sector, or it does not provide a comparison between theoretical potential and existing policies. }
The main limitation of the proposed approach as pointed out in the main body of the study, concerns the difficulty in assigning a ‘relevance’ scale to the policies, which could then only be compared in terms of sheer number. For this reason, the contribution of the article is based on the analysis of the studied databases, and thus on the statistical relevance of the number of analyzed policies, rather than inference logic about their content. Improved databases, some of which are already expected to be made available in the future, might help fill this knowledge gap and refine the analysis, for example, by comparing investments in each of the three A-S-I strategies. Further research could thus exploit the theoretical framework proposed by this study and build on it to deepen the analysis concerning the energy sector. At the same time, a similar conceptual framework might be used for other sectors, where the A-S-I framework is directly applicable (i.e., the transport sector) or adaptable (e.g., the waste management industry).
Finally, as the obtained results seem to indicate an under-representation of the Avoid strategy within the energy sector, a fundamental question that could spark new research pertains to why that should be the case. Whether energy demand reduction is deemed inefficient (though existing research suggests otherwise), too difficult, or perhaps not capable of attracting private investment as much as Shift- or Improve-type actions is certainly worth exploring.
Author Contributions
Conceptualization, M.J., M.N. and E.C.; literature review M.J., M.N. and E.C.; data curation, M.N.; formal analysis, M.N.; writing—original draft preparation, M.N., E.C. and M.J.; writing—review and editing, M.N. and M.J. All authors have read and agreed to the published version of the manuscript.
Funding
This research received no external funding.
Data Availability Statement
No new data have been produced in this analysis.
Conflicts of Interest
Authors Matteo Jarre and Edoardo Campisi were employed by the company Decisio s.r.l. The remaining author, Michel Noussan, declares that the research was conducted in the absence of any commercial or financial relationships that could be construed as a potential conflict of interest.
Abbreviations
The following abbreviations are used in this manuscript:
| A-S-I | Avoid–Shift–Improve |
| CCS | carbon capture and storage |
| CP | Climate Policy |
| EEA | European Environment Agency |
| EU | European Union |
| EV | electric vehicle |
| GHG | greenhouse gas |
| HP | heat pump |
| IEA | International Energy Agency |
| INDC | Intended Nationally Determined Contribution |
| MURE | Mesures d’Utilisation Rationnelle de l’Energie |
| UNFCC | United Nations Framework Convention on Climate Change |
References
- International Energy Agency. World Energy Outlook 2022; International Energy Agency: Paris, France, 2022. [Google Scholar]
- International Energy Agency. World Energy Outlook 2023; International Energy Agency: Paris, France, 2023. [Google Scholar]
- Creutzig, F.; Niamir, L.; Bai, X.; Callaghan, M.; Cullen, J.; Díaz-José, J.; Figueroa, M.; Grubler, A.; Lamb, W.; Leip, A.; et al. Demand-side Solutions to Climate Change Mitigation Consistent with High Levels of Well-being. Nat. Clim. Change 2022, 12, 36–46. [Google Scholar] [CrossRef]
- Robert, K.; Parris, T.; Leiserowitz, A. What is Sustainable Development? Goals, Indicators, Values, and Practice. Environ. Sci. Policy Sustain. Dev. 2005, 47, 8–21. [Google Scholar] [CrossRef]
- Geissdoerfer, M.; Savaget, P.; Bocken, N.M.; Hultink, E.J. The Circular Economy—A new sustainability paradigm? J. Clean. Prod. 2017, 143, 757–768. [Google Scholar] [CrossRef]
- Kirchherr, J.; Reike, D.; Hekkert, M. Conceptualizing the circular economy: An analysis of 114 definitions. Resour. Conserv. Recycl. 2017, 127, 221–232. [Google Scholar] [CrossRef]
- Ellen MacArthur Foundation. Towards the Circular Economy: Economic and Business Rationale for an Accelerated Transition. Bind 1; Ellen MacArthur Foundation: Isle of Wight, UK, 2013. [Google Scholar]
- Morseletto, P. Targets for a circular economy. Resour. Conserv. Recycl. 2020, 153, 104553. [Google Scholar] [CrossRef]
- Curran, M.A. Life Cycle Assessment: A review of the methodology and its application to sustainability. Curr. Opin. Chem. Eng. 2013, 2, 273–277. [Google Scholar] [CrossRef]
- Bhatnagar, A.; Härri, A.; Levänen, J.; Niinimäki, K. Exploring the role of social life cycle assessment in transition to circular economy: A systematic review. Resour. Conserv. Recycl. 2024, 207, 107702. [Google Scholar] [CrossRef]
- Urban, F. China’s rise: Challenging the North-South technology transfer paradigm for climate change mitigation and low carbon energy. Energy Policy 2018, 113, 320–330. [Google Scholar] [CrossRef]
- Fambri, G.; Marocco, P.; Badami, M.; Tsagkrasoulis, D. The flexibility of virtual energy storage based on the thermal inertia of buildings in renewable energy communities: A techno-economic analysis and comparison with the electric battery solution. J. Energy Storage 2023, 73, 109083. [Google Scholar] [CrossRef]
- United Nations Framework Convention on Climate Change (UNFCCC). Paris Agreement, 2015; United Nations: New York, NY, USA, 2015. [Google Scholar]
- Gbadeyan, O.; Muthivhi, J.; Linganiso, L.; Deenadayalu, N. Decoupling Economic Growth from Carbon Emissions: A Transition toward Low-Carbon Energy Systems—A Critical Review. Clean Technol. 2024, 6, 1076–1113. [Google Scholar] [CrossRef]
- Creutzig, F.; Agoston, P.; Minx, J.; Canadell, J.; Andrew, R.; Le Quéré, C.; Peters, G.; Sharifi, A.; Yamagata, Y.; Dhakal, S. Urban infrastructure choices structure climate solutions. Nat. Clim. Change 2016, 6, 1054–1056. [Google Scholar] [CrossRef]
- Transformative Urban Mobility Initiative (TUMI). ASI TUMI SUTP iNUA No. 9, April 2019; Transformative Urban Mobility Initiative (TUMI): Bonn, Germany, 2019. [Google Scholar]
- United Nations. Mobilizing Sustainable Transport for Development. Analysis and Policy Recommendations from the United Nations Secretary-General’s High-Level Advisory Group on Sustainable Transport; United Nations: New York, NY, USA, 2016. [Google Scholar]
- Creutzig, F.; Roy, J.; Lamb, W.; Azevedo, I.; Bruine de Bruin, W.; Dalkmann, H.; Edelenbosch, O.; Geels, F.; Grubler, A.; Hepburn, C.; et al. Towards demand-side solutions for mitigating climate change. Nat. Clim. Change 2018, 8, 268–271. [Google Scholar] [CrossRef]
- Sims, R.; Schaeffer, R.; Creutzig, F.; Cruz-Núñez, X.; D’Agosto, M.; Dimitriu, D.; Meza, M.; Fulton, L.; Kobayashi, S.; Lah, O.; et al. Transport. In Climate Change 2014: Mitigation of Climate Change. Contribution of Working Group III to the Fifth Assessment Report of the Intergovernmental Panel on Climate Change; Cambridge University Press: Cambridge, UK, 2014. [Google Scholar] [CrossRef]
- Peters, G.; Andrew, R.; Canadell, J.; Fuss, S.; Jackson, R.; Korsbakken, J.I.; Le Quéré, C.; Nakicenovic, N. Key indicators to track current progress and future ambition of the Paris Agreement. Nat. Clim. Change 2017, 7, 118–122. [Google Scholar] [CrossRef]
- Pfoser, S. Decarbonizing Freight Transport: Acceptance and Policy Implications. Ph.D. Thesis, Universitat Bremen, Bremen, Germany, 2021. [Google Scholar] [CrossRef]
- McKinnon, A.C. Decarbonizing Logistics: Distributing Goods in a Low Carbon World; Kogan Page Ltd.: New York, NY, USA, 2018. [Google Scholar]
- Wittenbrink, P. Green Logistics: Konzept, Aktuelle Entwicklungen und Handlungsfelder zur Emissionsreduktion im Transportbereich; Essentials (Springer VS), Springer Gabler: Wiesbaden, Germany, 2015. [Google Scholar]
- Zorpas, A.A. The hidden concept and the beauty of multiple “R” in the framework of waste strategies development reflecting to circular economy principles. Sci. Total. Environ. 2024, 952, 175508. [Google Scholar] [CrossRef]
- Phonthanukitithaworn, C.; Srisathan, W.A.; Naruetharadhol, P. Revolutionizing waste management: Harnessing citizen-driven innovators through open innovation to enhance the 5Rs of circular economy. J. Open Innov. Technol. Mark. Complex. 2024, 10, 100342. [Google Scholar] [CrossRef]
- Arnz, M.; Göke, L.; Thema, J.; Wiese, F.; Wulff, N.; Kendziorski, M.; Hainsch, K.; Blechinger, P.; von Hirschhausen, C. Avoid, Shift or Improve passenger transport? Impacts on the energy system. Energy Strategy Rev. 2024, 52, 101302. [Google Scholar] [CrossRef]
- Zhu, Y.; Ma, H.; Sha, C.; Yang, Y.; Sun, H.; Ming, F. Which strategy among avoid, shift, or improve is the best to reduce CO2 emissions from sand and gravel aggregate transportation? J. Clean. Prod. 2023, 391, 136089. [Google Scholar] [CrossRef]
- Sandalkhan, B.; Kothari, N.; Trajkovski, M.; Moscatelli, G.; Birkebaek, S.; Trench, S.; Zawadzki, A.; Ferrer, S.; Vijayavargia, V. Accelerating the Shift to Sustainable Transport. 2024. Available online: https://www.bcg.com/publications/2024/accelerating-the-shift-to-sustainable-transport (accessed on 1 September 2024).
- Newman, P.; Kenworthy, J. Sustainability and Cities: Overcoming Automobile Dependence; Island Press: Washington, DC, USA, 1999. [Google Scholar]
- Ewing, R.; Cervero, R. Travel and the Built Environment: A Meta-Analysis. J. Am. Plan. Assoc. 2010, 76, 265–294. [Google Scholar] [CrossRef]
- Roberto, R.; Zini, A.; Felici, B.; Rao, M.; Noussan, M. Potential Benefits of Remote Working on Urban Mobility and Related Environmental Impacts: Results from a Case Study in Italy. Appl. Sci. 2023, 13, 607. [Google Scholar] [CrossRef]
- Banister, D. The sustainable mobility paradigm. Transp. Policy 2008, 15, 73–80. [Google Scholar] [CrossRef]
- Steg, L. Car use: Lust and must. Instrumental, symbolic and affective motives for car use. Transp. Res. Part Policy Pract. 2005, 39, 147–162. [Google Scholar] [CrossRef]
- Cervero, R.; Murakami, J. Effects of Built Environments on Vehicle Miles Traveled: Evidence from 370 US Urbanized Areas. Environ. Plan. A 2010, 42, 400–418. [Google Scholar] [CrossRef]
- Heath, G.W. City Cycling, John Pucher, Ralph Buehler (Eds.), The MIT Press (2012), (393 pp.), ISBN: 978-0-262-51781-2. Prev. Med. 2013, 57, 147–148. [Google Scholar] [CrossRef]
- Heinen, E.; Wee, B.; Maat, K. Commuting by Bicycle: An Overview of the Literature. Transp. Rev. 2010, 30, 59–96. [Google Scholar] [CrossRef]
- Hawkins, T.; Gausen, O.; Strømman, A. Environmental impacts of hybrid and electric vehicles—A review. Int. J. Life Cycle Assess. 2012, 17, 997–1014. [Google Scholar] [CrossRef]
- Schipper, L.; Marie-Lilliu, C.; Gorham, R.B. Flexing the Link between Transport and Greenhouse Gas Emissions: A Path for the World Bank; World Bank: Washington, DC, USA, 2000. [Google Scholar]
- Wimbadi, R.W.; Djalante, R.; Mori, A. Urban experiments with public transport for low carbon mobility transitions in cities: A systematic literature review (1990–2020). Sustain. Cities Soc. 2021, 72, 103023. [Google Scholar] [CrossRef]
- Farzaneh, H.; de Oliveira, J.A.P.; McLellan, B.; Ohgaki, H. Towards a Low Emission Transport System: Evaluating the Public Health and Environmental Benefits. Energies 2019, 12, 3747. [Google Scholar] [CrossRef]
- Mårtensson, H.B.; Larsen, K.; Höjer, M. Investigating potential effects of mobility and accessibility services using the avoid-shift-improve framework. Sustain. Cities Soc. 2023, 96, 104676. [Google Scholar] [CrossRef]
- Turan, B.; Hemmelmayr, V.; Larsen, A.; Puchinger, J. Transition towards sustainable mobility: The role of transport optimization. Cent. Eur. J. Oper. Res. 2024, 32, 435–456. [Google Scholar] [CrossRef]
- Leroutier, M.; Quirion, P. Tackling Car Emissions in Urban Areas: Shift, Avoid, Improve. Ecol. Econ. 2023, 213, 107951. [Google Scholar] [CrossRef]
- Bakker, S.; Zuidgeest, M.; de Coninck, H.; Huizenga, C. Transport, Development and Climate Change Mitigation: Towards an Integrated Approach. Transp. Rev. 2014, 34, 335–355. [Google Scholar] [CrossRef]
- Ribeiro, J.; Fontes, T.; Soares, C.; Borges, J.L. Accessibility as an indicator to estimate social exclusion in public transport. Transp. Res. Procedia 2021, 52, 740–747. [Google Scholar] [CrossRef]
- Bruno, M.; Kouwenberg, M.; van Oort, N. Addressing transport related social exclusion through transportation policy: A novel evaluation method applied to the Amsterdam Transport Region. Transp. Res. Interdiscip. Perspect. 2024, 26, 101177. [Google Scholar] [CrossRef]
- Lucas, K. Transport and social exclusion: Where are we now? Transp. Policy 2012, 20, 105–113. [Google Scholar] [CrossRef]
- Cardama, M.; Cortez, A.; Hosek, E.; Krapp, A.; Medimorec, N.; Yiu, A. Partnership on Sustainable Low-Carbon Transport. In SLOCAT Transport, Climate and Sustainability Global Status Report, 3rd ed.; Transport Energy Sources; SLOCAT: Brussels, Belgium, 2023. [Google Scholar]
- Scapolo, F.; Tarchi, D.; Alvarez Alvarez, M.; Belmonte, M.; Kajander, N.; Kalantaryan, S.; Loeschner, J.; Minora, U.; Sermi, F.; Tintori, G. Atlas of Migration—2022; Publications Office of the European Union: Luxembourg, 2023. [Google Scholar]
- Muñoz, I.; Hernández, P.; Pérez-Iribarren, E.; García-Gusano, D.; Arrizabalaga, E. How can cities effectively contribute towards decarbonisation targets? A downscaling method to assess the alignment of local energy plans with national strategies. Energy Strategy Rev. 2023, 49, 101137. [Google Scholar] [CrossRef]
- Nielsen, S.; Østergaard, P.A.; Sperling, K. Renewable energy transition, transmission system impacts and regional development—A mismatch between national planning and local development. Energy 2023, 278, 127925. [Google Scholar] [CrossRef]
- Nastasi, B.; Di Matteo, U. Solar Energy Technologies in Sustainable Energy Action Plans of Italian Big Cities. Energy Proc. 2016, 101, 1064–1071. [Google Scholar] [CrossRef]
- Kim, C. A review of the deployment programs, impact, and barriers of renewable energy policies in Korea. Renew. Sustain. Energy Rev. 2021, 144, 110870. [Google Scholar] [CrossRef]
- Liu, J. China’s renewable energy law and policy: A critical review. Renew. Sustain. Energy Rev. 2019, 99, 212–219. [Google Scholar] [CrossRef]
- Gonzalez-Torres, M.; Bertoldi, P.; Castellazzi, L.; Perez-Lombard, L. Review of EU product energy efficiency policies: What have we achieved in 40 years? J. Clean. Prod. 2023, 421, 138442. [Google Scholar] [CrossRef]
- Edziah, B.K.; Opoku, E.E.O. Enhancing energy efficiency in Asia-Pacific: Comprehensive energy policy analysis. Energy Econ. 2024, 138, 107831. [Google Scholar] [CrossRef]
- Cowell, R.; Webb, J. What do we know about the effectiveness of local energy plans? A systematic review of the research. Energy Res. Soc. Sci. 2024, 118, 103767. [Google Scholar] [CrossRef]
- Yazdanie, M.; Orehounig, K. Advancing urban energy system planning and modeling approaches: Gaps and solutions in perspective. Renew. Sustain. Energy Rev. 2021, 137, 110607. [Google Scholar] [CrossRef]
- Prina, M.G.; Groppi, D.; Nastasi, B.; Garcia, D.A. Bottom-up energy system models applied to sustainable islands. Renew. Sustain. Energy Rev. 2021, 152, 111625. [Google Scholar] [CrossRef]
- McGookin, C.; Ó Gallachóir, B.; Byrne, E. Participatory methods in energy system modelling and planning—A review. Renew. Sustain. Energy Rev. 2021, 151, 111504. [Google Scholar] [CrossRef]
- Roberto, R.; Ferruzzi, G.; Negro, V.; Noussan, M. Mapping of Energy Community Development in Europe: State of the Art and Research Directions. Energies 2023, 16, 6554. [Google Scholar] [CrossRef]
- Laskari, M.; de Masi, R.F.; Karatasou, S.; Santamouris, M.; Assimakopoulos, M.N. On the impact of user behaviour on heating energy consumption and indoor temperature in residential buildings. Energy Build. 2022, 255, 111657. [Google Scholar] [CrossRef]
- Shehawy, Y.M.; Ali Khan, S.M.F. Consumer readiness for green consumption: The role of green awareness as a moderator of the relationship between green attitudes and purchase intentions. J. Retail. Consum. Serv. 2024, 78, 103739. [Google Scholar] [CrossRef]
- International Energy Agency. Energy Efficiency Market Report 2014; International Energy Agency: Paris, France, 2014. [Google Scholar]
- Liu, J.; Nie, S.; Lin, T. Government auditing and urban energy efficiency in the context of the digital economy: Evidence from China’s Auditing System reform. Energy 2024, 296, 131100. [Google Scholar] [CrossRef]
- Spudys, P.; Jurelionis, A.; Fokaides, P. Conducting smart energy audits of buildings with the use of building information modelling. Energy Build. 2023, 285, 112884. [Google Scholar] [CrossRef]
- Long, N.; Fleming, K.; CaraDonna, C.; Mosiman, C. BuildingSync: A schema for commercial building energy audit data exchange. Dev. Built Environ. 2021, 7, 100054. [Google Scholar] [CrossRef]
- Boharb, A.; Allouhi, A.; Saidur, R.; Kousksou, T.; Jamil, A. Energy conservation potential of an energy audit within the pulp and paper industry in Morocco. J. Clean. Prod. 2017, 149, 569–581. [Google Scholar] [CrossRef]
- Albadi, M.; El-Saadany, E. Demand Response in Electricity Markets: An Overview. In Proceedings of the 2007 IEEE Power Engineering Society General Meeting, Tampa, FL, USA, 24–28 June 2007. [Google Scholar] [CrossRef]
- Pérez-Lombard, L.; Ortiz, J.; Pout, C. A Review on buildings energy consumption information. Energy Build. 2008, 40, 394–398. [Google Scholar] [CrossRef]
- Mandel, T.; Kranzl, L.; Popovski, E.; Sensfuß, F.; Müller, A.; Eichhammer, W. Investigating pathways to a net-zero emissions building sector in the European Union: What role for the energy efficiency first principle? Energy Effic. 2023, 16, 22. [Google Scholar] [CrossRef]
- REN21 Secretariat. Renewables 2021 Global Status Report; REN21 Secretariat: Paris, France, 2021. [Google Scholar]
- Labis, P.E.; Visande, R.G.; Pallugna, R.C.; Caliao, N.D. The contribution of renewable distributed generation in mitigating carbon dioxide emissions. Renew. Sustain. Energy Rev. 2011, 15, 4891–4896. [Google Scholar] [CrossRef]
- Ortega-Izquierdo, M.; del Río, P. Benefits and costs of renewable electricity in Europe. Renew. Sustain. Energy Rev. 2016, 61, 372–383. [Google Scholar] [CrossRef]
- Kolb, S.; Plankenbühler, T.; Hofmann, K.; Bergerson, J.; Karl, J. Life cycle greenhouse gas emissions of renewable gas technologies: A comparative review. Renew. Sustain. Energy Rev. 2021, 146, 111147. [Google Scholar] [CrossRef]
- Chiaramonti, D.; Talluri, G.; Scarlat, N.; Prussi, M. The challenge of forecasting the role of biofuel in EU transport decarbonisation at 2050: A meta-analysis review of published scenarios. Renew. Sustain. Energy Rev. 2021, 139, 110715. [Google Scholar] [CrossRef]
- Lin, H.; Clavreul, J.; Jeandaux, C.; Crawley, J.; Butnar, I. Environmental life cycle assessment of heating systems in the UK: Comparative assessment of hybrid heat pumps vs. condensing gas boilers. Energy Build. 2021, 240, 110865. [Google Scholar] [CrossRef]
- Lund, H.; Möller, B.; Mathiesen, B.; Dyrelund, A. The role of district heating in future renewable energy systems. Energy 2010, 35, 1381–1390. [Google Scholar] [CrossRef]
- Jarre, M.; Noussan, M.; Simonetti, M. Primary energy consumption of heat pumps in high renewable share electricity mixes. Energy Convers. Manag. 2018, 171, 1339–1351. [Google Scholar] [CrossRef]
- Marocco, P.; Gandiglio, M.; Audisio, D.; Santarelli, M. Assessment of the role of hydrogen to produce high-temperature heat in the steel industry. J. Clean. Prod. 2023, 388, 135969. [Google Scholar] [CrossRef]
- International Renewable Energy Agency. Green Hydrogen: A Guide to Policy Making; International Renewable Energy Agency: Abu Dhabi, United Arab Emirates, 2020. [Google Scholar]
- Fambri, G.; Diaz-Londono, C.; Mazza, A.; Badami, M.; Weiss, R. Power-to-Gas in gas and electricity distribution systems: A comparison of different modeling approaches. J. Energy Storage 2022, 55, 105454. [Google Scholar] [CrossRef]
- Fang, X.; Misra, S.; Xue, G.; Yang, D. Smart Grid—The New and Improved Power Grid: A Survey. Commun. Surv. Tutor. IEEE 2012, 14, 944–980. [Google Scholar] [CrossRef]
- Diaz-Londono, C.; Fambri, G.; Mazza, A.; Badami, M.; Bompard, E. A Real-Time Based Platform for Integrating Power-to-Gas in Electrical Distribution Grids. In Proceedings of the 2020 55th International Universities Power Engineering Conference (UPEC), Virtual Conference, 1–4 September 2020; pp. 1–6. [Google Scholar] [CrossRef]
- Dunn, B.; Kamath, H.; Tarascon, J.M. Electrical Energy Storage for the Grid: A Battery of Choices. Science 2011, 334, 928–935. [Google Scholar] [CrossRef]
- Mills, E.; Rosenfeld, A. Consumer non-energy benefits as a motivation for making energy-efficiency improvements. Energy 1996, 21, 707–720. [Google Scholar] [CrossRef]
- Tripathy, P.; Jena, P.K.; Mishra, B.R. Systematic literature review and bibliometric analysis of energy efficiency. Renew. Sustain. Energy Rev. 2024, 200, 114583. [Google Scholar] [CrossRef]
- Geng, D.; Evans, S.; Kishita, Y. The identification and classification of energy waste for efficient energy supervision in manufacturing factories. Renew. Sustain. Energy Rev. 2023, 182, 113409. [Google Scholar] [CrossRef]
- Bălănescu, D.T.; Homutescu, V.M. Experimental investigation on performance of a condensing boiler and economic evaluation in real operating conditions. Appl. Therm. Eng. 2018, 143, 48–58. [Google Scholar] [CrossRef]
- Rastegarpour, S.; Mariotti, A.; Ferrarini, L.; Aminyavari, M. Energy efficiency improvement for industrial boilers through a flue-gas condensing heat recovery system with nonlinear MPC approach. Appl. Therm. Eng. 2023, 229, 120554. [Google Scholar] [CrossRef]
- Attia, S.; Hamdy, M.; Ezzeldin, S. Twenty-year tracking of lighting savings and power density in the residential sector. Energy Build. 2017, 154, 113–126. [Google Scholar] [CrossRef]
- International Energy Agency. Policies Database. 2024. Available online: https://www.iea.org/policies (accessed on 31 May 2024).
- NewClimate Institute. Climate Policy Database. 2024. Available online: https://climatepolicydatabase.org/policies (accessed on 31 May 2024). [CrossRef]
- EnergyPolicyTracker.org. Energy Policy Tracker. 2021. Available online: https://www.energypolicytracker.org/policies-analysis/ (accessed on 31 May 2024).
- European Environment Agency. EEA Database on Integrated National Climate and Energy Policies and Measures in Europe. 2024. Available online: https://pam.apps.eea.europa.eu/ (accessed on 31 May 2024).
- ODYSSEE-MURE. MURE Database on Energy Efficiency Measures in the European Union. 2024. Available online: https://www.measures.odyssee-mure.eu/energy-efficiency-policies-database.html (accessed on 31 May 2024).
- Energy Community. Energy Community—Who We Are. 2024. Available online: https://www.energy-community.org/aboutus/whoweare.html (accessed on 31 July 2024).
- Thiesen, J.; Christensen, T.S.; Kristensen, T.G.; Andersen, R.D.; Brunoe, B.; Gregersen, T.K.; Thrane, M.; Weidema, B.P. Rebound effects of price differences. Int. J. Life Cycle Assess. 2008, 13, 104–114. [Google Scholar] [CrossRef]
- Mashhadi Rajabi, M. Dilemmas of energy efficiency: A systematic review of the rebound effect and attempts to curb energy consumption. Energy Res. Soc. Sci. 2022, 89, 102661. [Google Scholar] [CrossRef]
- Nadel, S. The Potential for Additional Energy Efficiency Savings Including How the Rebound Effect Could Affect This Potential. Curr. Sustain. Energy Rep. 2016, 3, 35–41. [Google Scholar] [CrossRef]
- International Energy Agency. Fossil Fuel Subsidies Database. 2023. Available online: https://www.iea.org/data-and-statistics/data-product/fossil-fuel-subsidies-database (accessed on 31 May 2024).
Disclaimer/Publisher’s Note: The statements, opinions and data contained in all publications are solely those of the individual author(s) and contributor(s) and not of MDPI and/or the editor(s). MDPI and/or the editor(s) disclaim responsibility for any injury to people or property resulting from any ideas, methods, instructions or products referred to in the content. |
© 2024 by the authors. Licensee MDPI, Basel, Switzerland. This article is an open access article distributed under the terms and conditions of the Creative Commons Attribution (CC BY) license (https://creativecommons.org/licenses/by/4.0/).