Article

Study on the Economic Operation of a 1000 MWe Coal-Fired Power Plant with CO2 Capture

1
CHN ENERGY New Energy Technology Research Institute Co., Ltd., Beijing 102209, China
2
State Key Laboratory of Clean Energy Utilization, Zhejiang University, Hangzhou 310027, China
3
National Engineering Research Center of Power Generation Control and Safety, Southeast University, Nanjing 210096, China
*
Author to whom correspondence should be addressed.
Energies 2024, 17(19), 4986; https://doi.org/10.3390/en17194986 (registering DOI)
Submission received: 11 September 2024 / Revised: 30 September 2024 / Accepted: 30 September 2024 / Published: 5 October 2024
(This article belongs to the Topic CO2 Capture and Renewable Energy)

Abstract

:
The flexible operation of carbon capture units is crucial for the economic performance of coal-fired power plants equipped with CO2 capture systems. This paper aims to investigate the impact of electricity, CO2, and fuel prices on the economic operation of such plants. A novel economic optimization model is proposed, integrating a static model of the carbon capture system with a particle swarm optimization algorithm. A new concept, the CO2 boundary price, is introduced as a key metric for determining the operating conditions of CO2 capture units. The CO2 boundary price rises when the power load decreases due to the decline in power generation efficiency, and it also increases with rising fuel prices, as the cost of steam for CO2 capture increases. Additionally, when the objective is to meet power load demand, CO2 prices have a great influence on the operation of CO2 capture units, assuming fixed coal and electricity prices. However, when the primary goal is to maximize plant profitability, the system’s operational conditions are strongly influenced by the relative prices of electricity and CO2. The proposed optimization model and the uncovered price-effect mechanisms provide valuable insights into the economic operation of carbon capture power plants.

1. Introduction

Global climate change is presently the most pressing environmental issue faced by humanity. According to the Intergovernmental Panel on Climate Change (IPCC) report, global surface temperatures rose by 1.09 °C from the 1850–1900 period to the 2011–2020 period [1]. In response, numerous countries have implemented measures to reduce greenhouse gas emissions, including enacting policies, developing carbon markets, promoting low-carbon energy, and supporting carbon capture projects [2,3,4,5,6]. Carbon Capture, Utilization, and Storage (CCUS) is defined as the process of capturing carbon dioxide from emission sources and transporting it to appropriate sites for utilization or storage, ultimately reducing carbon dioxide emissions. CCUS is regarded as a crucial technological solution for the large-scale, sustainable, low-carbon utilization of fossil fuels [7]. Most global forecasting scenarios consider CCUS indispensable for achieving carbon neutrality [8]. As of July 2023, there were 392 carbon capture and storage (CCS) facilities worldwide, and the total CO2 capture capacity is about 361 million tons per year [9]. These operational carbon capture and storage (CCS) projects are primarily focused on electricity generation and industries including cement, methanol, and fertilizer manufacturing. However, current CO2 capture capacity remains far from meeting the requirements for achieving carbon neutrality.
China, as the largest carbon emitter in the world, accounts for nearly 30% of global CO2 emissions [10]. In September 2020, China established targets for reaching carbon peaking by 2030 and carbon neutrality by 2060 [11]. Despite a recent decline in coal consumption’s share of energy production, it still exceeds 50% and is expected to maintain its dominant position for a significant period. While coal is the primary energy source in China, it poses a major challenge to achieving the country’s carbon peaking and neutrality goals. As a result, CCUS is considered essential for the low-carbon utilization of coal, especially in the power sector. However, carbon capture demonstration projects within China’s coal-fired power industry remain limited. Notable examples include the completion of CHN ENERGY’s Jinjie 150,000 tons/year carbon capture demonstration project in June 2021 and the Taizhou 500,000 tons/year project in June 2023 [12]. The China Huaneng Group is also constructing a 1.5 million tons/year coal-fired carbon capture project, scheduled to begin operation by the end of 2024. Additionally, China is planning several million-ton-scale coal-fired carbon capture demonstration projects. Despite the commercial success of these coal-fired CCUS demonstrations, challenges such as high energy consumption and low profitability hinder large-scale implementation [13,14,15]. Consequently, optimizing the operation of CO2 capture units to reduce production costs has become a critical issue for the economic operation of carbon capture power plants [16].
Currently, to reduce curtailment of renewable energy, it is crucial to keep the load regulation capabilities of power plants [17]. As a result, coal-fired power plants (CFPPs) frequently operate under off-design conditions, sacrificing power generation efficiency. For power plants equipped with CO2 capture systems, flexible operation is particularly challenging due to the higher efficiency penalties. In future scenarios, the trade-off between CO2 and electricity prices will likely serve as a key principle for allocating CO2 and electricity production, thereby maximizing the profitability of power plants.
The traditional economic dispatch problem entails managing a power plant to satisfy electricity demand while minimizing overall fuel costs [18]. Lu et al. introduced an enhanced MOBCC algorithm to address the challenge of low-carbon emissions and economic dispatch in power systems with carbon capture plants [19]. Yu et al. applied decision-making theories across various scenarios to determine the optimal network configuration and flexible scheduling for carbon capture power plants [20]. Abdilahi et al. proposed an improved framework for the flexible operation of carbon capture power plants within the traditional economic dispatch problem, highlighting the potential to decouple power generation and emission outputs in thermal power systems [21]. Manaf et al. developed a multi-time-scale control-optimization framework to assess the potential net operating revenue of flexible operation in coal-fired power plants with CO2 capture [22]. They also introduced a control-based optimization algorithm, integrating an intelligent model predictive control scheme with mixed-integer nonlinear programming, effectively applied to the energy management of coal-fired power plants with CO2 capture [23]. However, much of the existing literature has focused primarily on control algorithm development, overlooking the impact of variable load and fluctuating market prices on the integrated system’s efficiency and steam extraction costs. Consequently, determining the operational boundaries of carbon capture units in real-world applications remains a challenge.
This paper aims to address this gap by examining the effects of market price fluctuations on the operation of carbon capture units at the thermodynamic level, rather than focusing solely on control issues. A simplified method for optimizing operational conditions in carbon capture power plants is proposed, utilizing presimulation results and optimization algorithms to determine optimal parameters under varying CO2 and electricity prices. Based on the model developed, the influence of fuel, electricity, and CO2 prices on the operation of a coal-fired power plant with CO2 capture was revealed, which is significant for the economic and flexible operation of the integration system.

2. System and Performance Indicator Characterization

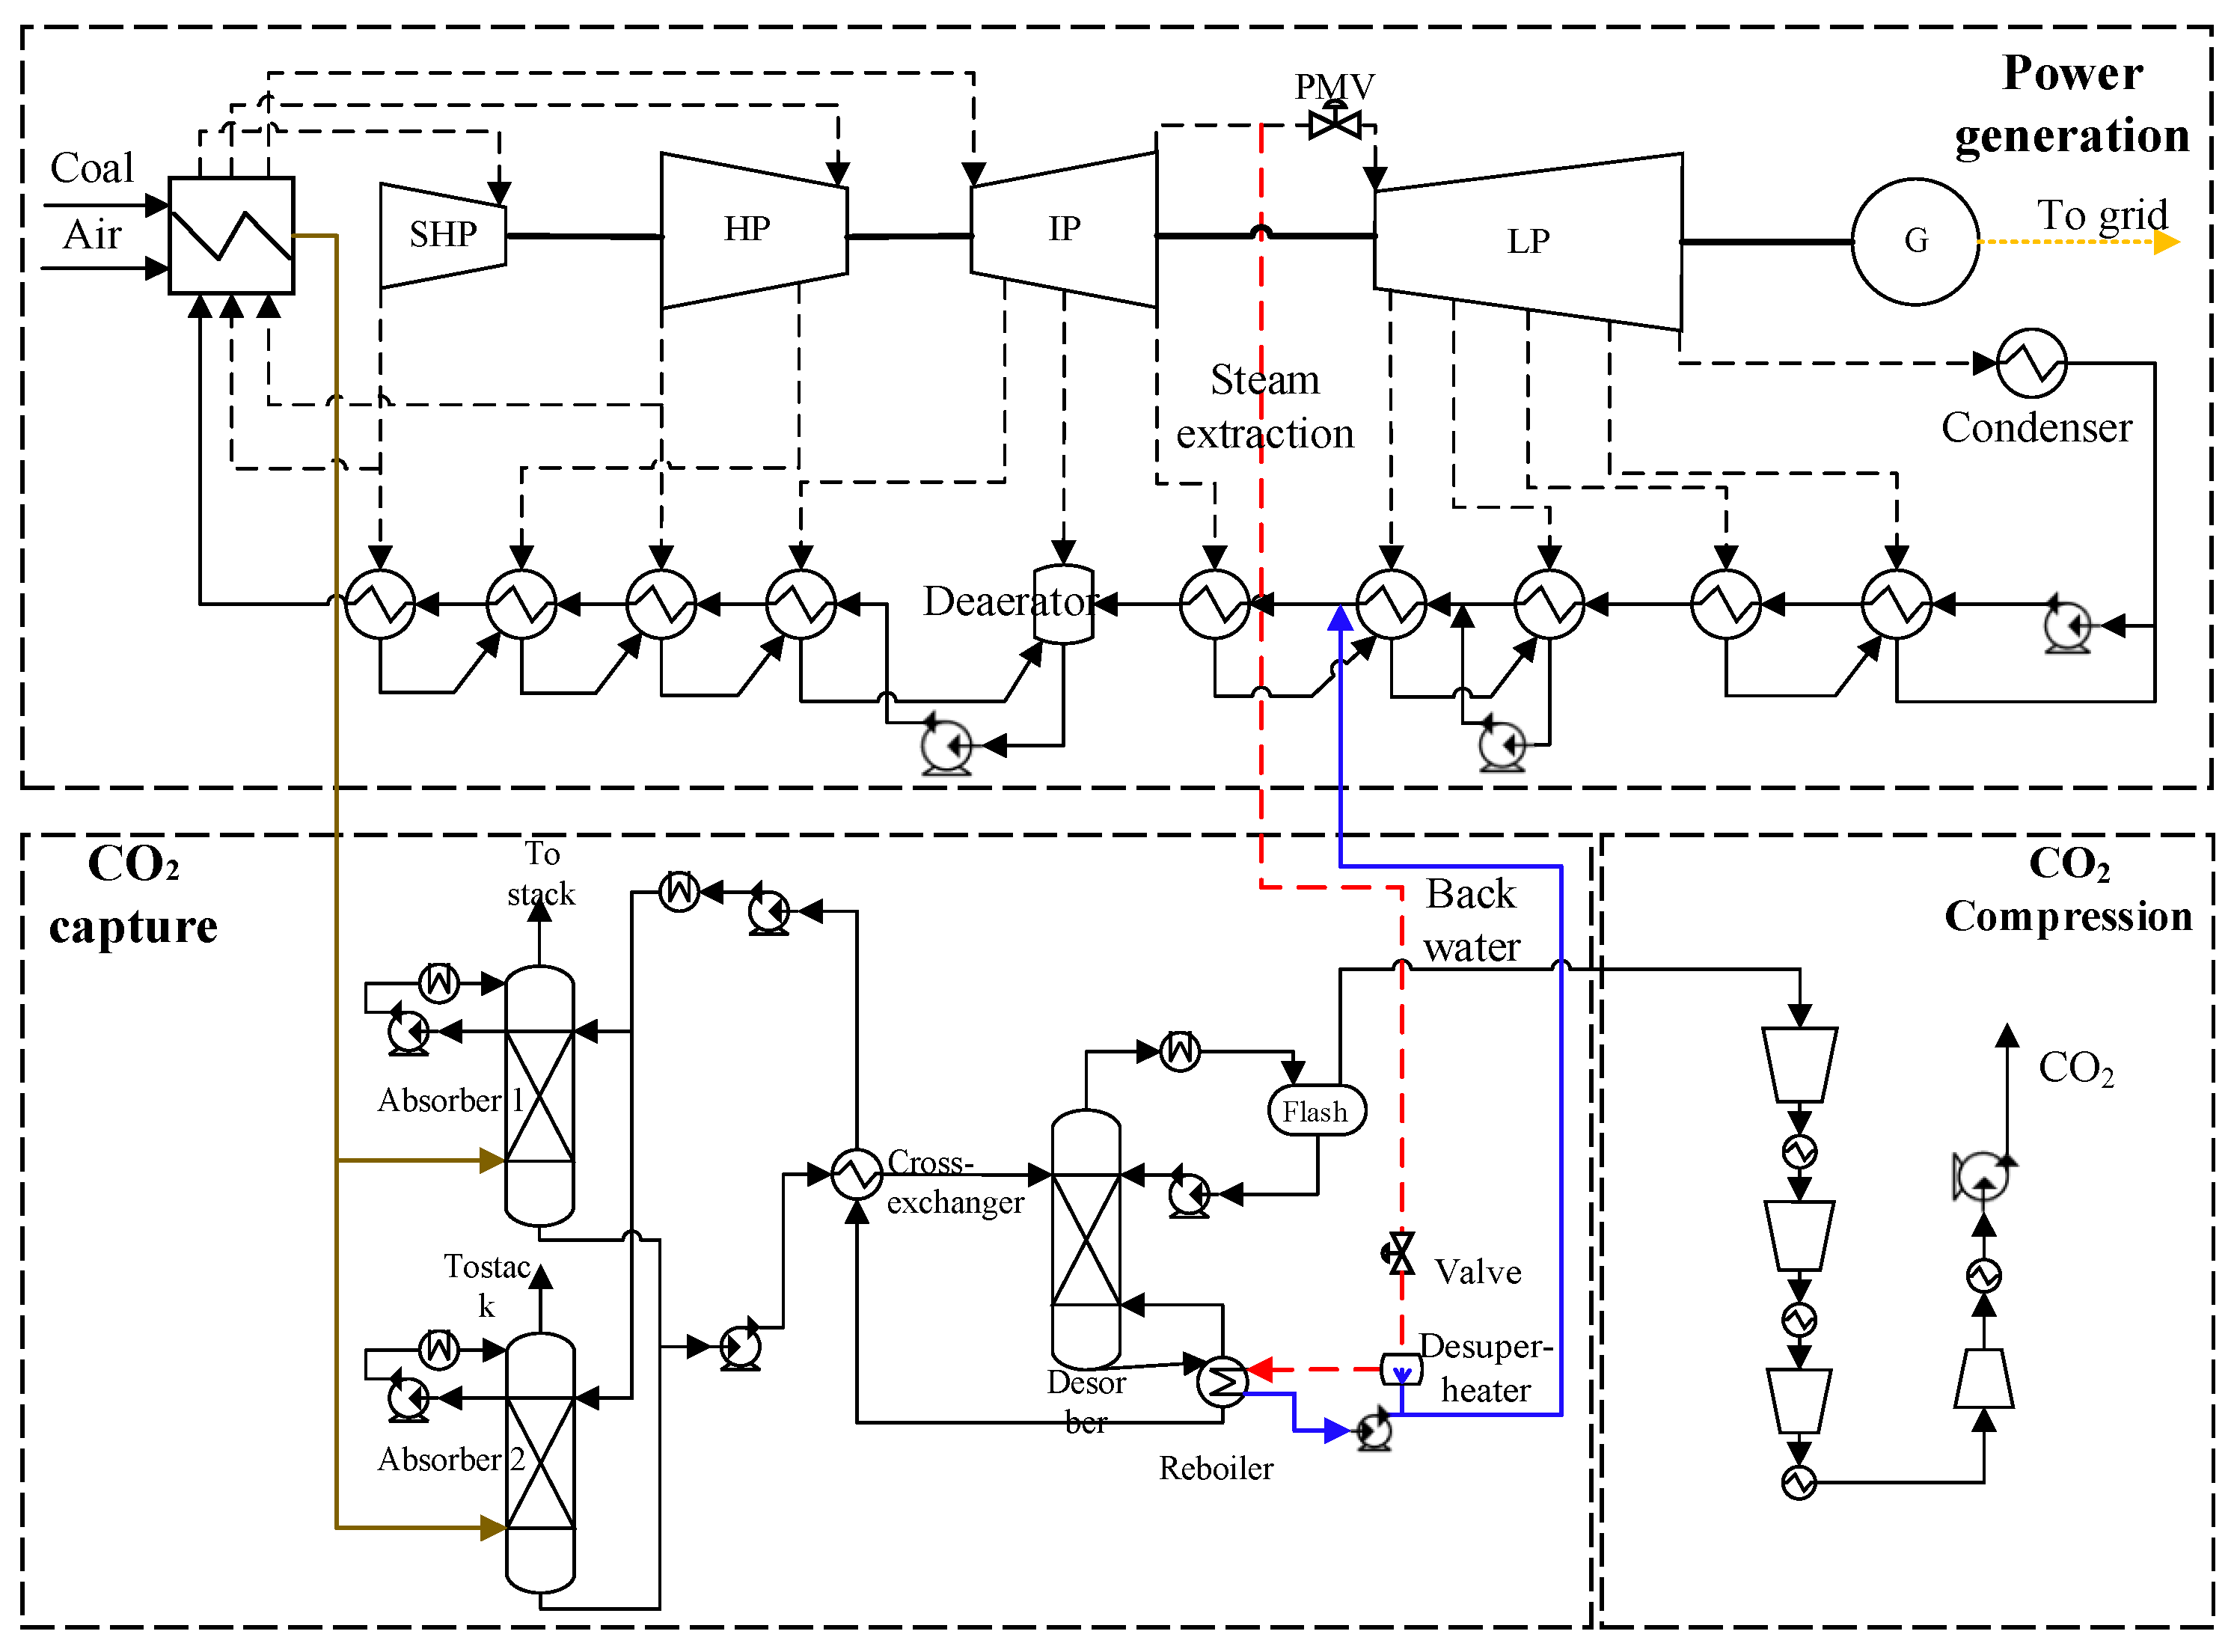
2.1. System Characterization

The system’s process flow is illustrated in Figure 1. The power plant employs a two-stage reheat technology, which refers to that after the main steam expands in the turbine, it is sent back to the boiler for reheating twice for higher generation efficiency. Initially, the feedwater in the preheating system is heated to 361 °C before being transferred to the boiler, where it absorbs heat generated by coal combustion, producing steam of high pressure and high temperature. Then, this steam first expands in the ultra-high-pressure (UHP) turbine, and after two successive reheating stages, it performs work in the high-pressure (HP), intermediate-pressure (IP), and low-pressure (LP) turbines, respectively. This process ultimately drives the power generator. The system utilizes five low-pressure feedwater heaters and four high-pressure feedwater heaters to achieve the preheating of the feedwater.
In the CO2 capture and compression unit, a dual-absorption tower configuration is employed to capture CO2, supported by a desorption tower for solvent regeneration. After water washing and cooling, the flue gas from the chimney is split into two streams, each entering absorption towers 1 and 2, where it counterflows with lean solvent to absorb CO2. After CO2 removal, the treated flue gas is returned to the chimney from the top of the absorption towers and discharged into the atmosphere. The rich solvent, extracted from the absorber, is routed through a heat exchanger before entering the desorption tower, where CO2 is regenerated via reboiler heating. The steam is extracted from the IP-LP crossover for solvent regeneration. However, due to the high-temperature and -pressure steam potentially causing solvent degradation, it is necessary to reduce the steam temperature and pressure to 140 °C and 0.3 Mpaa, respectively [24]. Cooling is achieved by diverting a portion of the reboiler water into the steam stream, with the remaining water returned to the feedwater preheating system. The temperature of the return water aligns with that of the fourth low-pressure feedwater heater, resulting in minimal heat loss. This arrangement also reduces the extraction of steam from the LP turbine for feedwater preheating, thereby enhancing the system’s deep load capacity. The captured CO2 is typically pressurized to 110 bar using a compression device before transportation, storage, or utilization [25,26]. However, in this study, CO2 compression is not considered. There are two main reasons for this. First, the method of CO2 transportation is uncertain; for example, different applications such as enhanced oil recovery, food production, and welding have varying requirements for the state of CO2, which leads to indeterminate costs for CO2 compression and liquefaction. Second, this study does not focus on the energy consumption associated with CO2 compression, but rather on the relationship between carbon capture and power plant operation. Therefore, the production cost of CO2 and the market price discussed herein are based on the state of CO2 at the outlet of the capture system.
Ebsilon is used to simulate the steam–water equilibrium states and processes, such as steam extraction for heating and feedwater under various operating conditions [27,28]. The performance of turbines, pumps, and heat exchangers under partial load conditions is primarily modeled using performance correction factors to account for deviations from full-load performance [29]. The characteristics of the coal used in the simulation are detailed in Table 1. The proximate analysis is a method of analyzing the composition of coal. It includes the total moisture (Mt), the moisture as air dry basis (Mad), the ash content as-received basis (Aar), and the volatile matter as-received basis (Var). The ultimate analysis is based on the as-received state.
The key equipment parameters for the integration system are presented in Table 2. The parameters of the main steam are 30 MPa/600 °C, while the states of reheated steam are 10 MPa/610 °C and 3.1 MPa/610 °C, respectively. In the CO2 separation unit, a 30%wt Monoethanolamine (MEA) solution, commonly used in previous studies, serves as the absorbent [30,31,32]. The CO2 capture ration is set at 90%, which represents the percentage of CO2 captured relative to the total CO2 in the flue gas. Specific parameters of the capture unit are provided in Table 3. The capture unit is simulated using Aspen Plus (https://www.aspentech.com/en/products/engineering/aspen-plus, accessed on 10 September 2024), a software widely applied in process simulation, and a rate-based model is employed to achieve more precise results [33]. Given that a single tower may not be sufficient to handle large volumes of flue gas in practical applications, this study adopts a dual-absorption tower configuration to simulate the CO2 absorption process. As the stripping tower primarily desorbs CO2 from the rich solvent and handles a smaller gas flow compared to the absorber, only one stripping tower is required. All dimensional data are designed to ensure that the system operates within the normal gas–liquid operational range.

2.2. Performance Indicators

Some main indicators are defined in this section to better describe the system performance.
(1) The CO2 capture ratio (CCR) is defined here to indicate the performance of capture unit, as calculated with Equation (1) [34]. M CO 2 (kg/s) and M coal (kg/s) refer to the CO2 captured and coal input, respectively. The incomplete combustion losses are not considered in this paper.
CCR ( % ) = M CO 2 12 / 44 / ( M coal Carbon % ) 100 %
(2) The net generation efficiency is described by Equation (2) [35]. P net e refers to net electricity output.
η net e ( % ) = P net e / ( LHV coal M coal ) 100 %
(3) The specific heat consumption for CO2 capture is calculated by Equation (3). Q reboiler refers to the heat consumption of the reboiler.
Q reg ( GJ / tCO 2 ) = Q reboiler / M CO 2

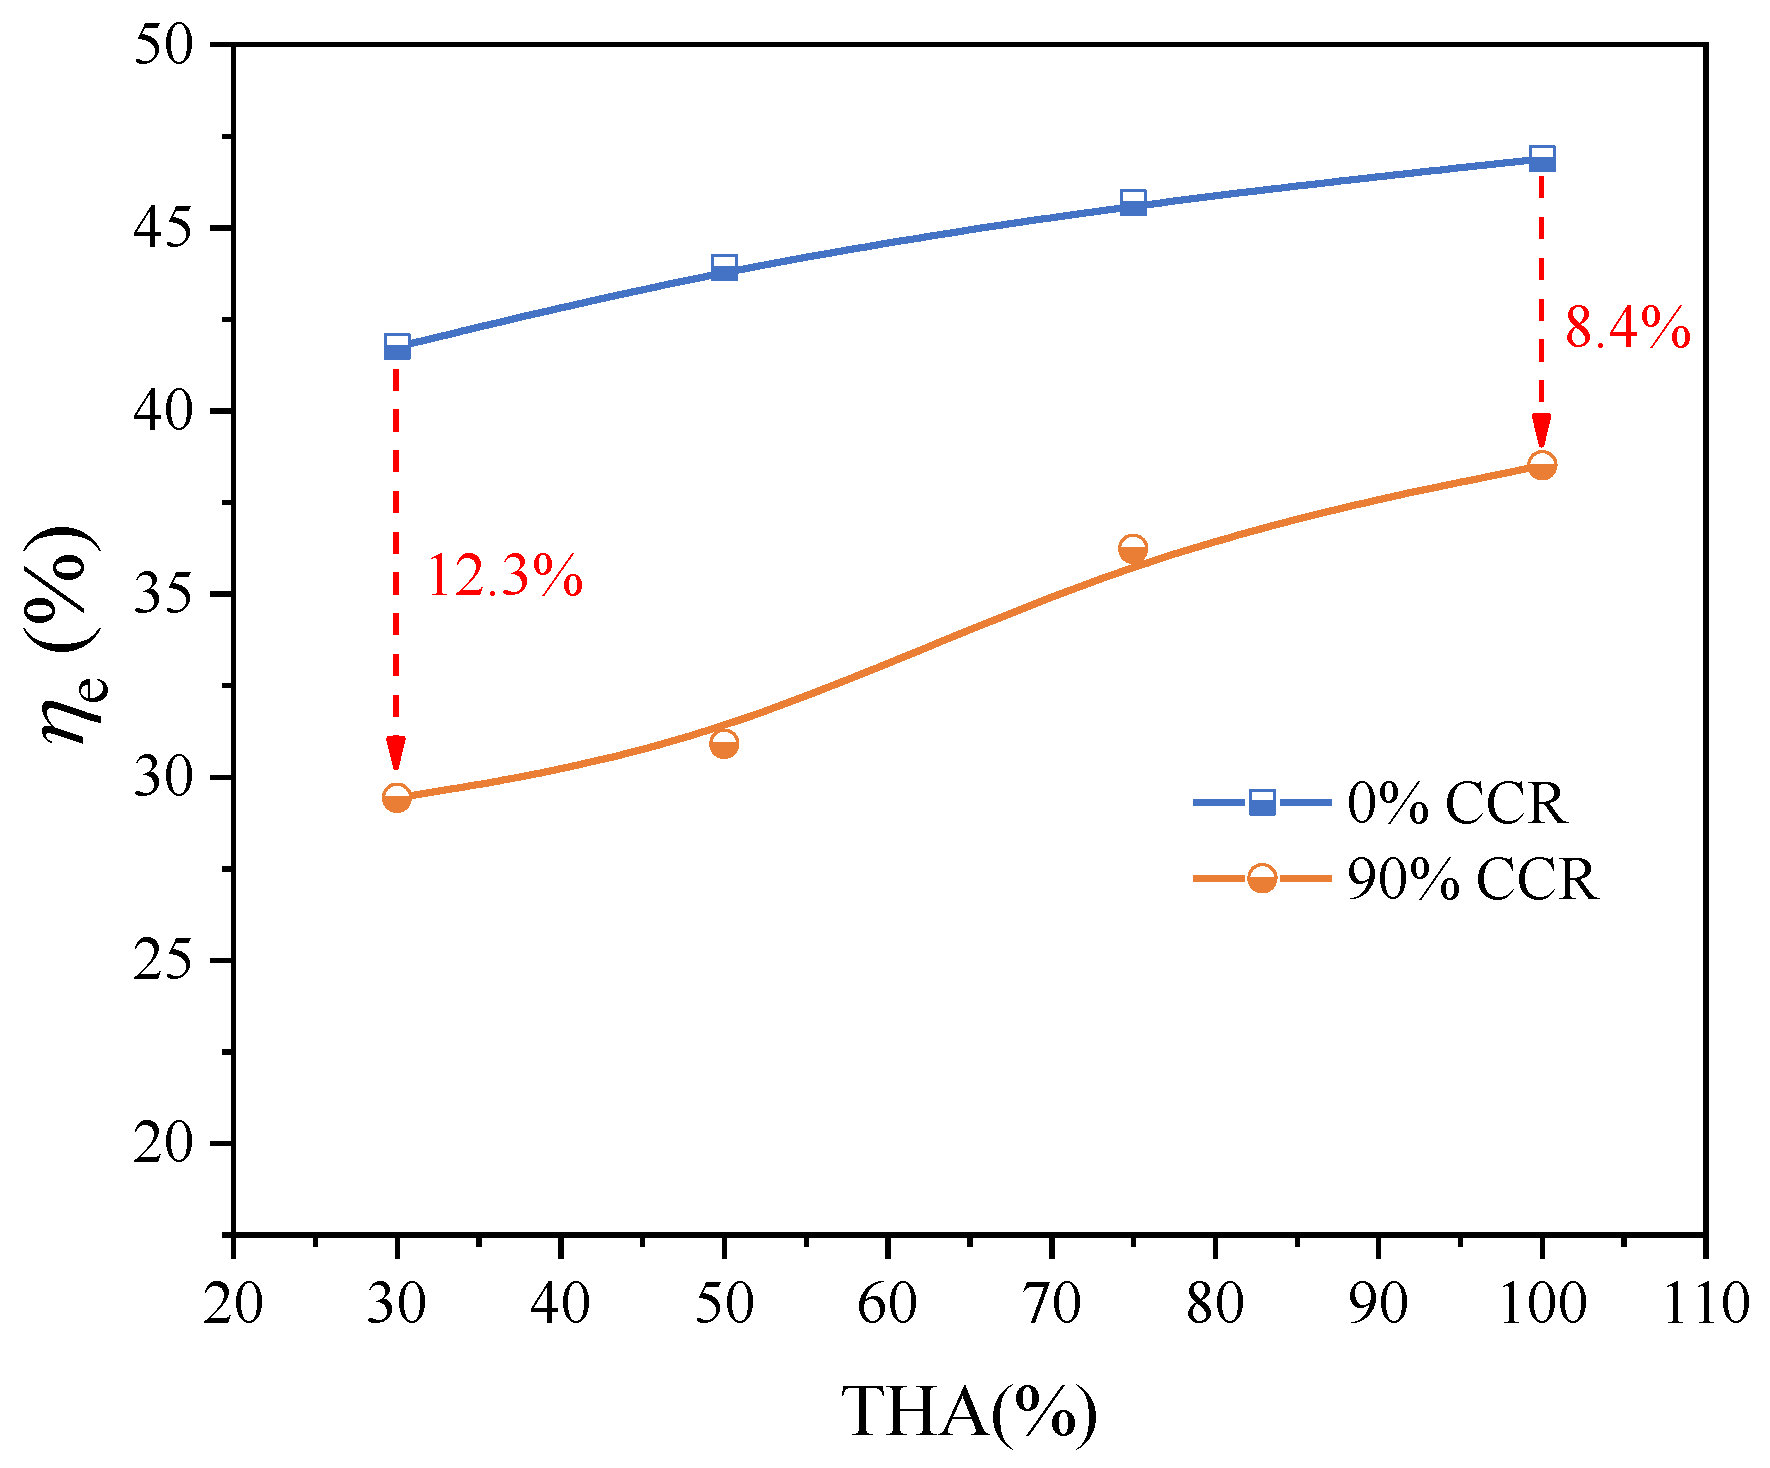
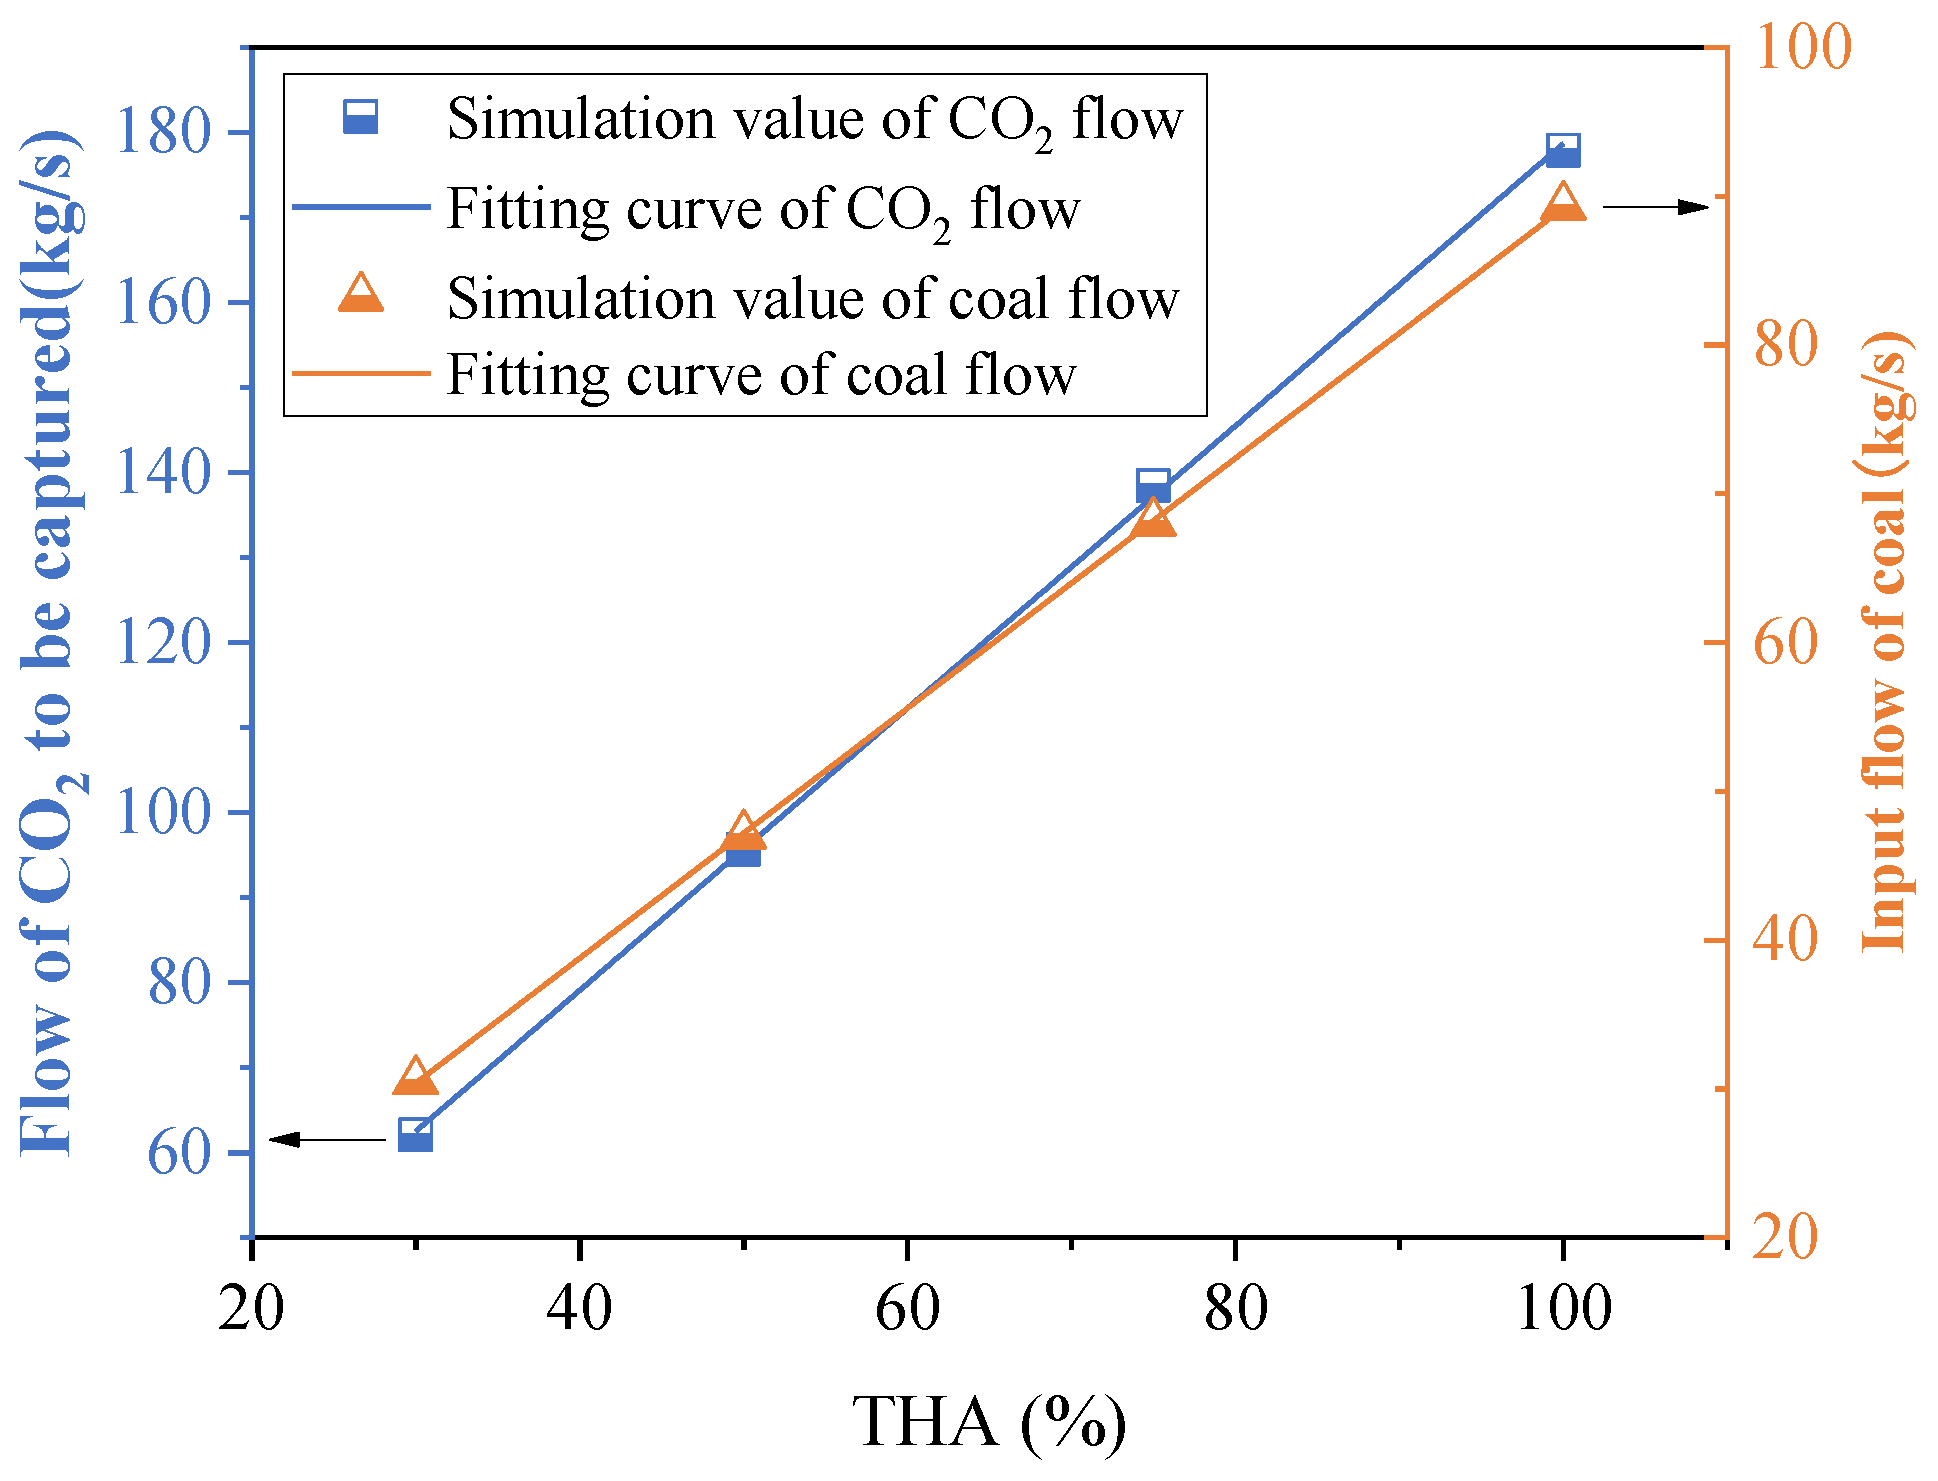
3. Variable Load Operation Characteristics of the Integration System

As the integration of renewable energy into the grid increases, CFPPs increasingly function as regulation power sources, frequently operating under partial load conditions, which leads to significant performance losses [36]. Sliding pressure operation is utilized for variable load operation by controlling the pressure and temperature of the main steam [37]. Table 4 and Table 5 present the system performance results under different loads when operating in sliding pressure mode, where the reference system denotes a power plant without CO2 capture.
When the system load decreases from 100% THA (Turbine Heat Acceptance), which indicates the maximum heat energy the turbine can accept from the incoming steam, to 30% THA, the net power generation efficiency declines from 48.05% to 43%. Additionally, the flue gas composition changes continuously with load reduction, with CO2 concentration declining from 12.85 mol% at 100% THA to 9.23 mol% at 30% THA. This reduction is primarily attributed to an increase in the excess air coefficient during boiler combustion at lower loads.
Table 6 presents the simulation results of the CO2 capture unit. Theoretically, the required solvent volume decreases with the amount of CO2 in the flue gas decreases. Consequently, the liquid-to-gas (L/G) ratio, which refers to the mass flow rate ratio of the absorbent entering the absorption tower to the gas, decreases with the reduction in the load of the power generation unit. There is only a slight increase in specific regeneration energy consumption, because while the CO2 concentration is reduced, the CO2 loading capacity of the solvent remains unaffected. The circulating solvent load can be maintained by adjusting the L/G ratio. Both the total heat consumption and electricity consumption for CO2 capture decrease as the load decreases, owing to the reduced CO2 content in the flue gas. Due to the use of MEA as the absorbent and the lack of extensive integration of heat recovery processes, the heat consumption is relatively high. In the case of using advanced absorbents, this heat consumption would be lower, resulting in a reduced impact on the power generation system.
Due to CO2 capture, there is a reduction in electricity output, as illustrated in Figure 2. The greater the amount of CO2 captured, the lower the power output. The AB line represents electricity output under different CO2 capture quantities at 100% THA (Turbine Heat Acceptance) conditions. Since the L/G ratio can be adjusted to maintain a constant specific CO2 regeneration energy consumption, power output decreases almost linearly with increasing CO2 capture quantity. The BC line depicts electricity generation at a 90% CCR under various THA conditions. During sliding pressure operation, steam pressure at the original extraction points is reduced. Adjusting the steam extraction position to maintain stable operation of the capture unit at 30% THA results in a nonlinear trend in the BC line. The CD line shows electricity output under different CCR values at 30% THA. The AD line represents the power plant net electricity output without CO2 capture. The closed area formed by lines A-B-C-D-A delineates the operational boundary of the entire capture system and serves as the computational boundary for the subsequent optimization study of the operational issues.
Figure 3 depicts the system efficiency at various capture rates. Both the reference system and the CO2 capture-equipped system exhibit a decline in efficiency as the load decreases. This decline is more pronounced at lower loads, primarily due to the increased proportion of steam extraction required under such conditions, which results in greater efficiency losses. Specifically, at a load of 30% THA, the implementation of CO2 capture results in a reduction of 12.3% points in system efficiency. Therefore, the influence of the CO2 capture ratio on the economic performance of the power plant should be closely examined, particularly under low load conditions.

4. System Optimization Development

In China, the installation of carbon capture systems in coal-fired power plants is often a result of policy-driven initiatives. After the completion of the facility, the primary objective becomes optimizing the operation of the integrated system to maximize the recovery of construction costs. In this context, the critical comparison is between the market price of CO2 and its operational costs; once the market price exceeds the operational costs, a portion of the construction costs can be recouped. Therefore, this paper does not consider the construction costs of the facility. Instead, it focuses on examining the influence of coal, electricity, and carbon prices on system operation. Assuming that CO2 transportation costs are borne by the buyer and are already included in the market price, the transport costs are therefore not considered in this paper.
Since carbon capture systems can serve as a means to adjust the power output, determining the optimal operating conditions of the integration system becomes crucial in ensuring its economical operation. In this paper, different operating scenarios under varying fuel prices, carbon prices, and electricity prices will be primarily investigated. While ensuring the stable operation of the system, an optimization algorithm will be employed to obtain the optimal operation conditions for the system.

4.1. Objective Function Establishment

(1) Electricity sales revenue
The formula for the power plant’s electricity generation revenue ( I i e ) is given by Formula (4), where P i e (kW) represents the power generation load during the time period T i (hours), and C i e ($/kWh) denotes the electricity price.
I i e = P i e × T i × C i e
(2) CO2 sales revenue
This paper considers the scenario in which captured CO2 is sold commercially to enhance the economic performance of carbon capture power plants. Potential applications include enhanced oil recovery (EOR), welding, food processing, and other uses. Therefore, selling carbon dioxide can be considered as a source of revenue. The formula for the power plant’s CO2 sales revenue ( I i CO 2 ) is given by Equation (5), where M i CO 2 (t/h) represents the CO2 product flow rate, and C i CO 2 ($/t) is the price of the CO2 in market.
I i CO 2 = M i CO 2 × T i × C i CO 2
(3) The cost of coal consumption
The formula for the power plant’s fuel cost ( I i f ) is given by Equation (6), where M i f (t/h) represents the coal consumption rate, and C i f ($/t) is the unit price of coal.
I i f = M i f × T i × C i f
(4) Objective function
In this paper, the total revenue refers to the portion of construction costs recovered through the sale of CO2 after the facility is completed. The total revenue during time period T i is represented by Formula (7), assuming that the unit prices of various products, such as coal, electricity, and carbon, remain constant during the time period.
F i = P i e × T i × C i e + M i CO 2 × T i × C i CO 2 M i f × T i × C i f
Then, the total profit over a given time period can be described as Formula (8).
F = i F i = i T i ( P i e × C i e + M i CO 2 × C i CO 2 M i f × C i f )

4.2. Mathematical Relationship of Key Parameters of the Power Plant

In theory, to obtain key operating parameters under different operation conditions, establishing a coupled model of the entire power generation and carbon capture systems is necessary. This allows for real-time tracking of the variation characteristics of critical parameters to guide the operation control of the system. However, as large-scale deployment of CFPP with carbon capture is still in the demonstration stage, the development of accurate dynamic simulation software is still in its early stages. Therefore, to establish the mathematical relationships of key parameters of a physical model under different conditions, Ebsilon was employed here to simulate various operating conditions of the capture system. By utilizing THA as an intermediate parameter, the CO2 capture rate, coal consumption, and power generation under various conditions can be correlated. The relationships between CO2 quantity and coal flow rate with THA are represented by Equations (9) and (10), respectively. Figure 4 indicates that both parameters exhibit good linear patterns with THA.
M CO 2 ( kg / s ) = 184.3702 THA + 14.154
M f ( kg / s ) = 84.00235 THA + 5.1935
The power output under different CO2 capture quantities for various THA conditions can be described by Formula (11). P net e is the net power output, which is determined by THA and the quantity of CO2 separated. x is the flow of CO2 separated. The fitting curve aligns well with the simulation results, as shown in Figure 5. Thus, the results obtained can provide a foundation for calculating the operating costs of the system under various conditions. The THA ranges from 0.3 to 1, and the corresponding range for x is represented by Formula (12).
P net e ( MW ) = ( 14.47307 THA 3 + 28.83432 THA 2 16.47305 THA + 1.16915 ) x + ( 976.42917 THA + 0.50661 )
0 < = x < = 165.93318 THA + 13.7386

4.3. Constraint Conditions

(1) Economical optimization with the objective of responding to power demand fluctuations
The load response of a power plant is usually dominated by the power load demand. That is, with the load demand determined, the primary research objective is to optimize system economic benefits by adjusting operating conditions. As revealed in the study from Section 4.2, the power load can only operate within the shaded region in Figure 6, where the closed interval (A-B-C-D-E-A) can be represented by Equation (13), and y refers to the power output. FH represents the range of CO2 capture under the load of Pe, meaning finding a point G on line FH to maximize revenue. The THA can be figured out by Formula (11). Substituting THA back into Equation (14), the value of F can be obtained. Here, Particle Swarm Optimization (PSO) algorithm is employed to find the optimal value of F, which is a commonly used optimization algorithm [38,39,40]. In the initial phase of the calculation, a swarm of particles is randomly initialized. During the optimization process, each particle exhibits both individual and collective behaviors. Specifically, each particle updates its position by learning from two key values: the particle’s own personal best position (historical individual optimal value) and the global best position (historical population optimal value). Based on these values, the particle iteratively adjusts its velocity and position, converging towards an optimal solution. Wang et al. have provided a comprehensive review of the Particle Swarm Optimization algorithm [41].
AB :   0.94265 x + y < = 981.90957 BC :   5.94271 x y < = 242.95885 CD :   3.67831 x y < = 26.801 DE : 1.5653 x y < = 298.78 AE :   x   > = 0 EH :   y = Pe
F = ( P e × C e + x × 3.6 × C CO 2 ( 84.00235 × THA + 5.1935 ) × C f )
(2) System optimization with the objective of maximizing production profit
At the plant level, tracking the power load demand is the control objective, which can be realized by adjusting the solvent flow rate and reboiler heat duty. At the enterprise level, maximizing the plant revenue is the objective, and it is related to the CO2 capture rate and power plant load. Therefore, in this case, the target becomes to find a point N on the known working condition (line LM) to maximize the revenue of selling CO2 and electricity, as described by Figure 7. When THA is between 0.5~1 and 0.3~0.5, respectively, x can be selected according to Formulas (15) and (16). The power output can be calculated by Formula (11), then the maximum profit can be calculated by Formula (14) as well.
0 < = x < = [ ( 976.42917 THA + 0.50661 ) + 242.95885 ] /   [ 5.94271 + 14.47307 THA 3 28.83432 THA 2 + 16.47305 THA 1.16915 ) ]
0 < = x < = [ ( 976.42917 THA + 0.50661 + 26.801 ) ] /   [ 3.67831 + 14.47307 THA 3 28.83432 THA 2 + 16.47305 THA 1.16915 ]

5. Simulation Results Analysis

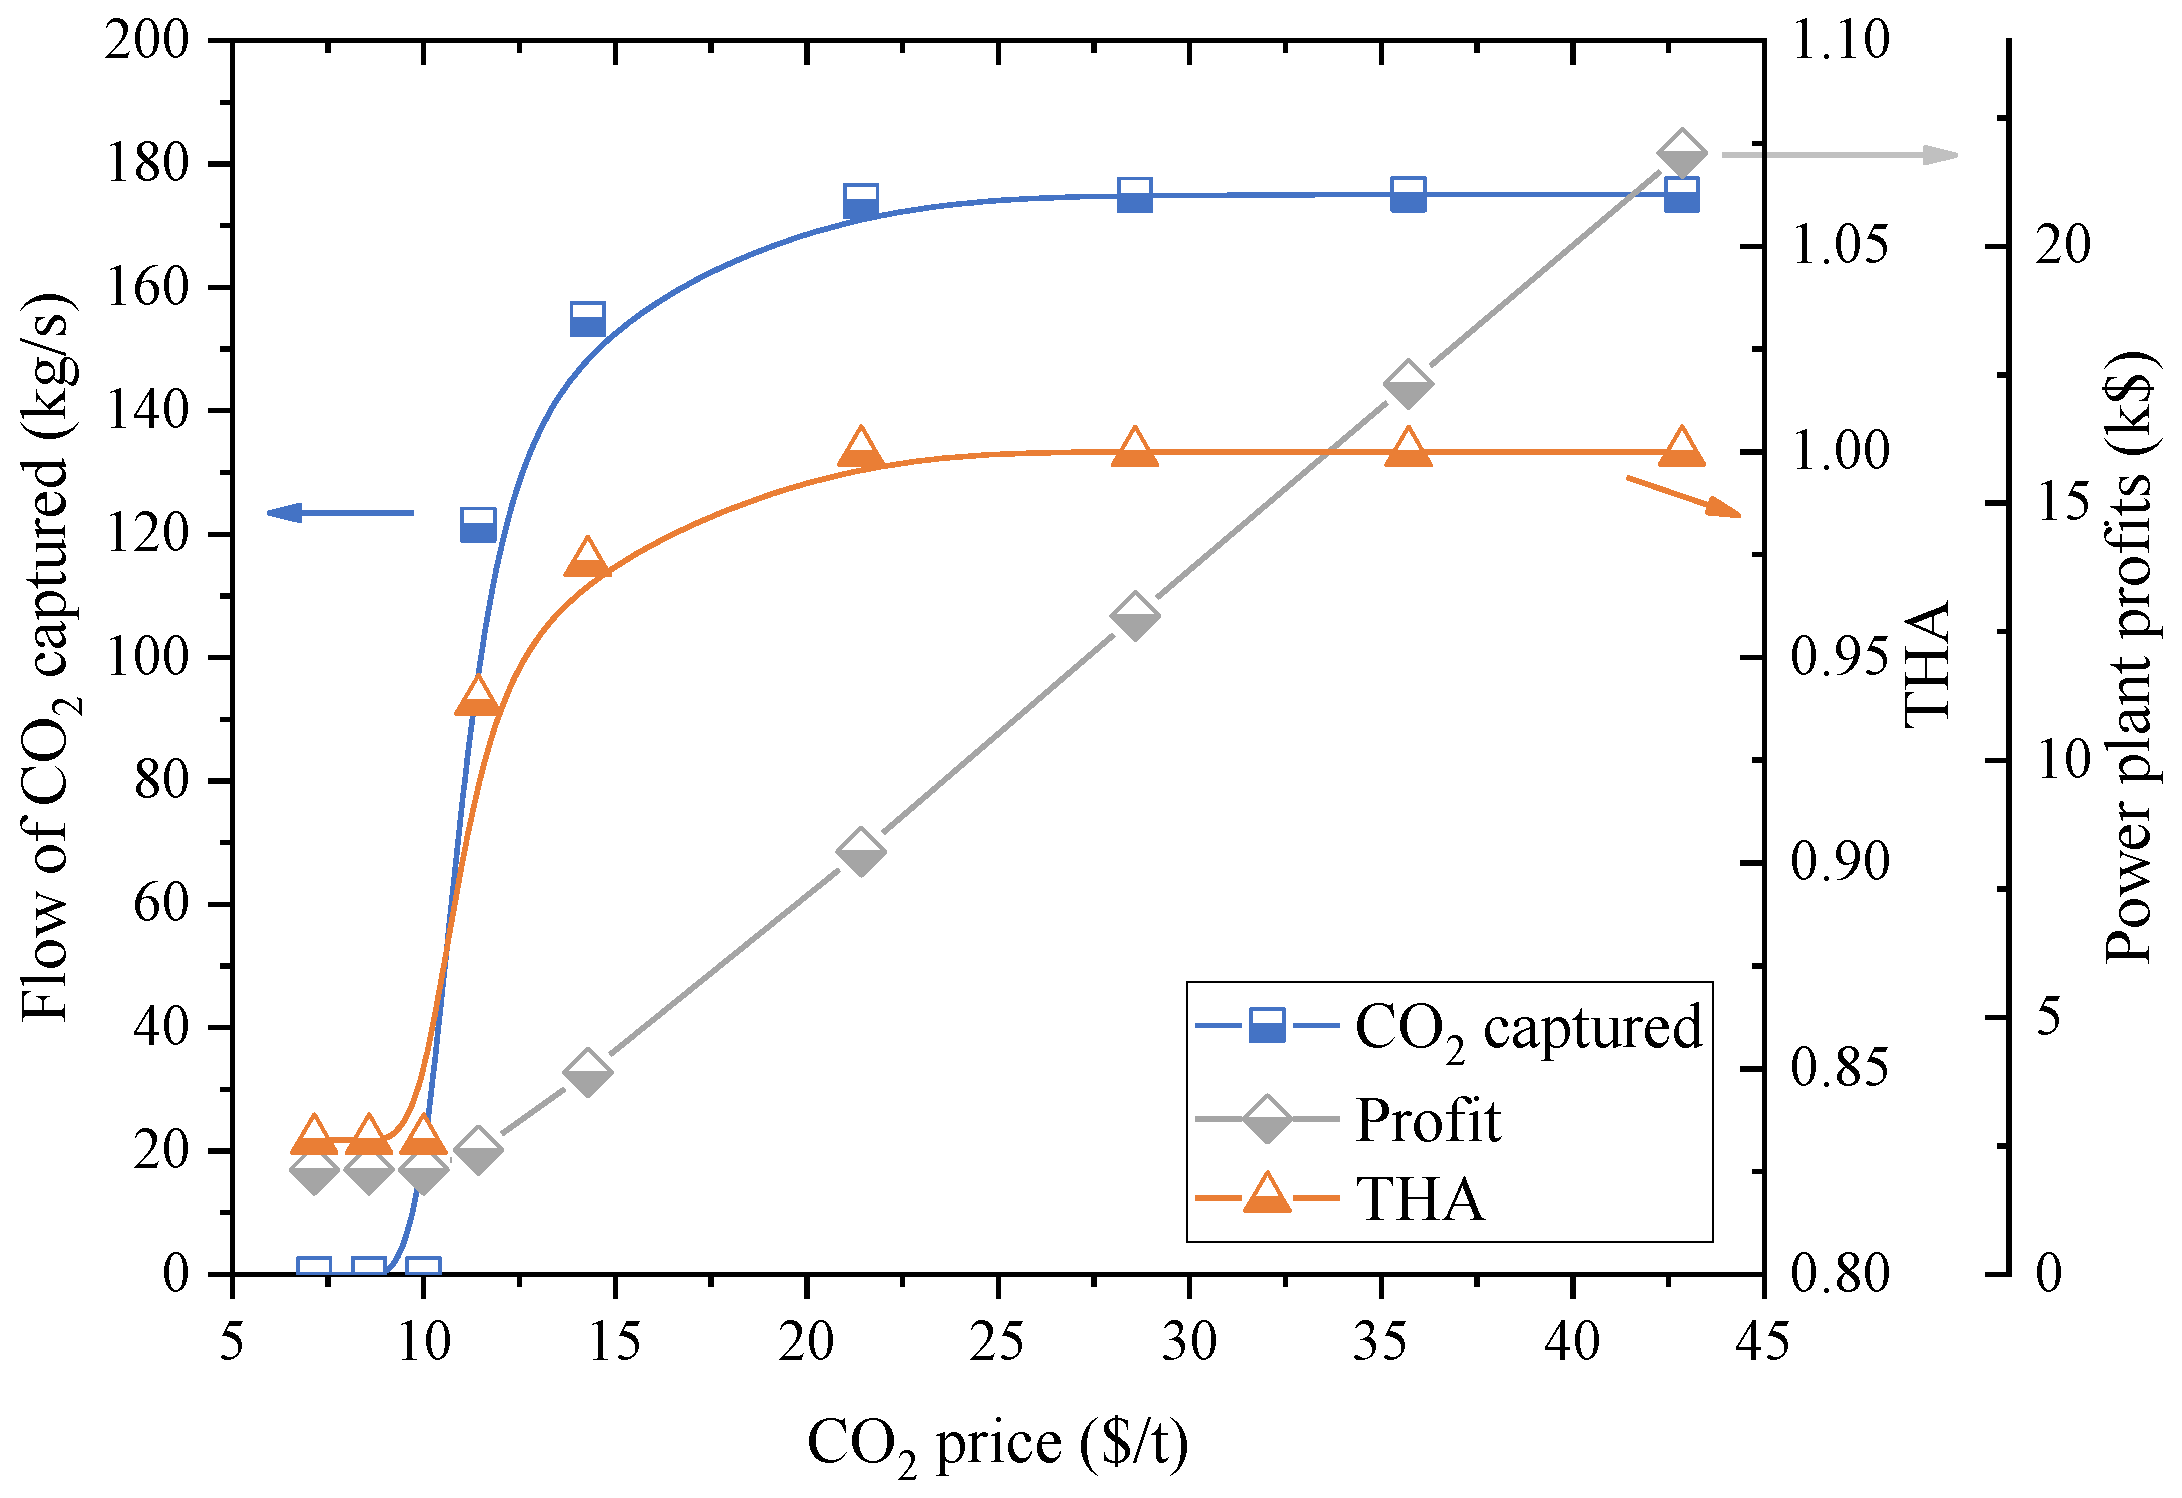
5.1. The Influence of Market Price on System Operation Condition

For CFPPs with CO2 capture, CO2 pricing is a critical factor affecting the operational conditions of the capture unit. Consequently, to maximize the plant’s overall profitability, it is essential to understand how fluctuations in CO2 market prices influence the optimal production conditions. This subsection investigates the CO2 capture quantity, optimal THA conditions, and production revenue under different CO2 prices when the target power generation is 813.5 MW, the fuel price is 142.8 $/t, and the electricity price is 50 $/MWh, as shown in Figure 8.
As the price of CO2 decreases, both the optimal THA and the quantity of CO2 captured adjust continuously to maximize co-production profits while maintaining constant power output. Overall, the system’s sales revenue demonstrates a linear relationship with variations in CO2 price. When the CO2 price falls to approximately 21.4 $/t, both the flow of CO2 captured and the operational conditions of the integration system exhibit significant changes. This is primarily due to the reduction in CO2 price failing to offset the additional fuel costs associated with CO2 capture. Consequently, when the CO2 price drops below 10.3 $/t, CO2 production becomes economically unfeasible, and theoretically, the CO2 capture unit should be deactivated. Under these conditions, steam extraction for the CO2 capture unit will be halted to maintain the target power output. As for the condition of 813.5 MW power output, when the CO2 price falls below 10.3 $/t, the production of CO2 will cause extra cost. This threshold is termed the CO2 boundary price in this study, as it serves as an indicator to determine whether the capture unit should remain operational. Thus, it can be inferred that the CO2 boundary price varies with different power loads due to different costs of steam extraction.
Figure 9 illustrates the CO2 boundary price as a function of power load. As the load decreases from 813.5 MW to 700 MW, the CO2 boundary price exhibits a slight increase. However, with further reductions in load, there is a marked rise in the CO2 boundary price, reaching up to 20.3 $/t CO2 at a load of 300 MW. This trend is primarily attributable to the decrease in power plant efficiency associated with lower system loads, as shown in Figure 3. Under low load, extracting the same amount of steam for CO2 capture requires more coal consumption, leading to the cost for CO2 capture increases. It is essential to recognize that the boundary cost presented is calculated based on fixed electricity and coal prices, and actual boundary costs may fluctuate with changes in these variables. Nevertheless, understanding the CO2 boundary price at various power loads is crucial for guiding the operation of the capture unit, thereby optimizing the overall production profit of the power plant.
Figure 10 illustrates the effects of varying fuel and electricity prices on the CO2 boundary cost. The boundary cost remains constant with fluctuations in electricity prices, while it increases linearly as fuel prices rise. This is because the capture cost of CO2 primarily depends on the cost of steam, which is solely related to fuel prices in this paper and is independent of market electricity prices. Moreover, the electricity consumed for capture is supplied by the power plant itself; therefore, market electricity prices do not affect the production cost of CO2 and, consequently, do not influence the boundary price of CO2. However, higher fuel prices elevate the cost of steam for solvent regeneration. Consequently, the cost of CO2 capture is predominantly influenced by fuel prices, indicating that the relative pricing between CO2 and fuel is an important factor affecting the operation conditions of the capture unit.

5.2. Result Analysis with the Objective of Tracking the Power Load Demand

In a CFPP equipped with CO2 capture, the power output can theoretically be adjusted by regulating the operation of the CO2 capture unit. When electricity demand decreases, the quantity of steam extracted for CO2 regeneration can be increased, thereby reducing the steam available for power generation and capturing more CO2. Since steam extraction primarily affects the steam turbine without directly influencing the boiler’s thermal inertia, the power generation system can, in theory, respond more swiftly to load fluctuations. However, the effects of varying steam extraction on the capture unit’s performance require further investigation. This subsection examines the optimization of capture system operation under different load conditions to maximize overall system profitability. Figure 11 depicts the variation curve of electricity load throughout a day along with the corresponding operation conditions of the system and the optimal flow of CO2 captured. For this scenario, the electricity price is set at 50 $/MWh, the CO2 price at 35.7 $/t, and the fuel price at 142.8 $/t.
Overall, the trend in THA closely parallels the trend in power load demand, with a diminishing correlation as the load increases. This is largely attributed to the fact that higher loads result in more CO2 in flue gas, necessitating an increased volume of steam extraction for CO2 capture. When the load surpasses 813.5 MW, the amount of CO2 captured decreases in order to prioritize electricity output and maintain a stable power supply. At a market price of 14.3 $/tCO2, the cost of CO2 capture exceeds its market value under low load conditions. As illustrated in Figure 11b, the optimal strategy in such scenarios is to cease operation of the CO2 capture unit and focus solely on electricity generation. Therefore, the steam extracted for CO2 regeneration needs to be turned off during the 3–7 h. This observation underscores that, under fixed coal and electricity price conditions, the market price of CO2 is a key factor influencing the capture unit operation, aligning with the result discussed in the study.

5.3. Result Analysis with the Objective of Maximizing the Plant Revenue

This section examines the effects of varying CO2 and electricity prices on system operating conditions while aiming to maximize revenue, as illustrated in Figure 12. The fuel price is fixed at 142.8 $/t, and THA is set at 80%. When the CO2 price falls below13.4 $/t, the CO2 capture cost exceeds the fuel cost for providing the necessary steam for CO2 regeneration, leading to the shutdown of the capture unit. However, when the CO2 price surpasses this threshold, the CCR can reach 90%, marking 13.4 $/t as the CO2 boundary price, as described in the previous section. Although optimal operating conditions around the CO2 boundary price exhibit considerable variability, the corresponding revenue changes remain relatively gradual. Consequently, from a theoretical perspective, gradual adjustments to the capture unit’s operating conditions during this transition have a limited impact on overall system revenue.
Figure 12b illustrates that when the electricity price is below 132.9 $/MWh, the optimal CCR of the capture unit is maintained at approximately 90%. However, as the electricity price increases, the revenue from electricity sales surpasses that from CO2 capture, leading to a decrease in the amount of CO2 captured. Therefore, under the condition of a constant fuel supply, the optimal operating conditions for both power generation and the capture unit are determined by the relative prices of electricity and CO2.

6. Conclusions

This paper examines the optimal operating conditions of a carbon capture power generation system under varying fuel, CO2, and electricity prices and proposes a new method for system optimization. The key findings are as follows:
(1)
The operational range of a 1000 MW coal-fired power plant is determined, based on static simulation results of the coupled power generation and capture system. An optimization model using a particle swarm algorithm is proposed by establishing mathematical relationships between key parameters. This model optimizes the system’s operating conditions across different fuel, CO2, and electricity price scenarios.
(2)
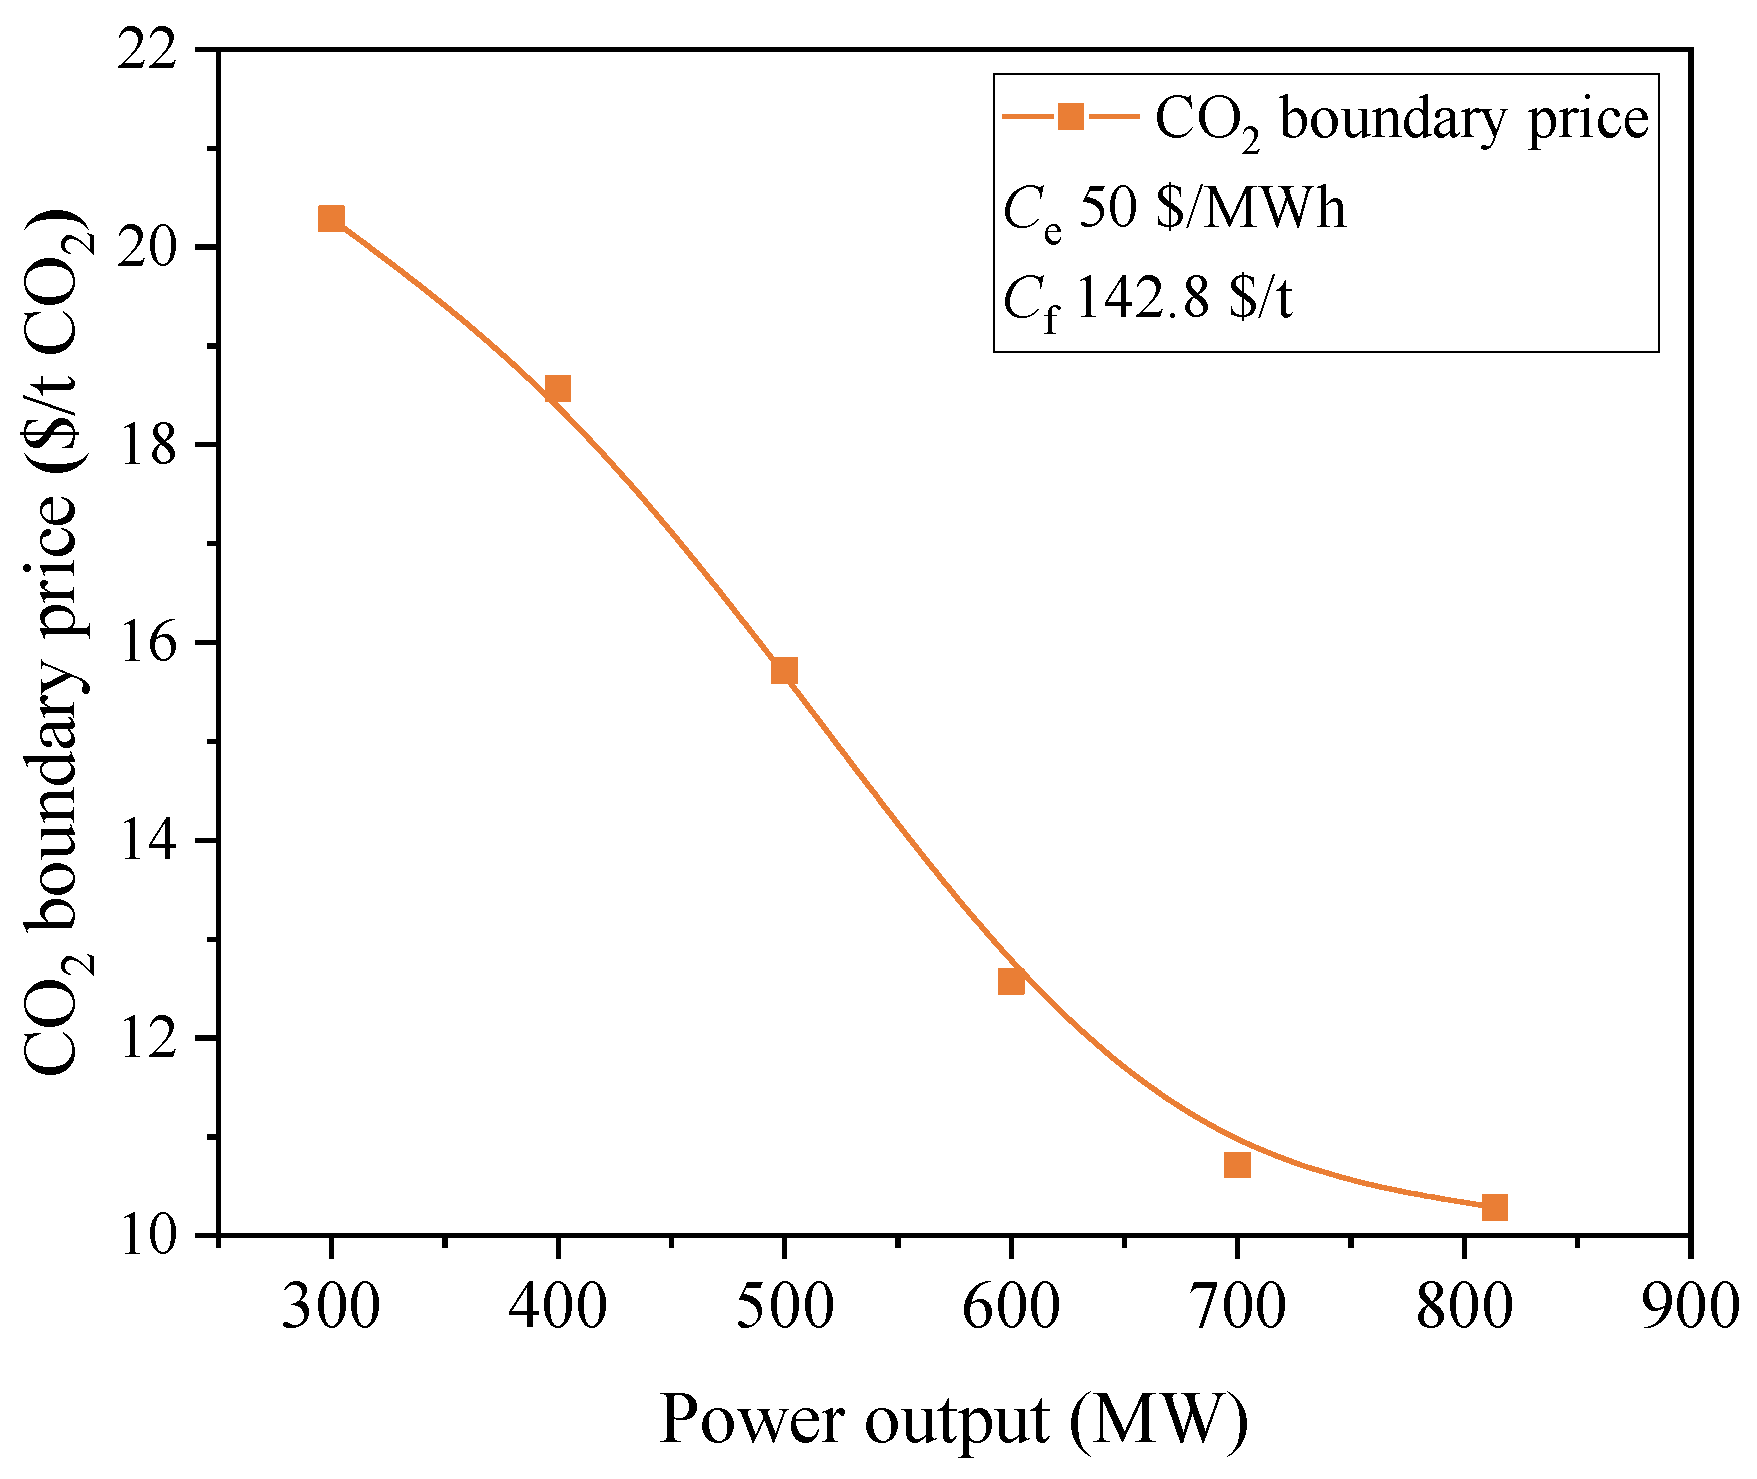
Focusing on power load response and maximizing plant revenue, the study provides varied results for operating conditions under different electricity, CO2, and coal prices. The findings indicate the existence of a CO2 boundary price under fixed fuel and electricity prices. When the CO2 price falls below this boundary, the cost of steam extraction for CO2 regeneration exceeds the fuel cost, leading to the shutdown of the capture unit to enhance revenue. Furthermore, as the load decreases, the CO2 boundary price increases due to reduced power generation efficiency at lower loads, resulting in higher steam costs for CO2 capture. Additionally, the CO2 boundary price rises with higher fuel prices.
(3)
In scenarios where power load response is the primary objective, the operation of the CO2 capture unit is primarily influenced by CO2 market price. When the objective is to maximize power plant revenue under a constant fuel supply, the operation of both the power generation and capture units depends on the relative prices of electricity and CO2.
In conclusion, by simplifying the physical models of the power generation and carbon capture units, this paper introduces a model to optimize the operation of carbon capture power plants and reveals how various price factors influence system performance. This study still has certain limitations, such as the system boundaries not accounting for CO2 compression. Therefore, further research is needed to investigate the changes in CO2 boundary costs resulting from the inclusion of CO2 compression and its effects on unit operation. Generally, this paper provides valuable guidance for optimizing the operation of power plants with carbon capture and supports the large-scale implementation of carbon capture systems.

Author Contributions

Investigation, J.Y. and X.Y.; methodology, J.Y. and C.W.; writing—original draft preparation, J.Y.; writing—review and editing, J.Y. and C.W.; conceptualization, C.W.; resources, D.X.; formal analysis, D.X. and Z.W.; supervision, D.X. and X.Y.; data curation, X.Y., Y.Y., and Z.W.; validation, Y.Y.; software, Y.Y. and X.W.; visualization, X.W. All authors have read and agreed to the published version of the manuscript.

Funding

The authors would like to acknowledge the Carbon Peak-Carbon Neutralization Science and Technology Innovation Project of Jiangsu Province under Grant BE2022602 and CHN ENERGY Science and Technology Project “CHN ENERGY CCUS R&D Innovation Platform Research and Development” under Grant GJNY-22-99.

Data Availability Statement

Data available upon request due to privacy restrictions.

Acknowledgments

We would like to thank the AI tool ChatGPT for its assistance in refining the language of this paper.

Conflicts of Interest

Authors J.Y., C.W., D.X., X.Y., Y.Y. and Z.W. were employed by the company CHN ENERGY New Energy Technology Research Institute Co., Ltd. The remaining authors declare that the research was conducted in the absence of any commercial or financial relationships that could be construed as a potential conflict of interest.

References

  1. IPCC. Summary for Policymakers. In Climate Change 2023: Synthesis Report; IPCC: Geneva, Switzerland, 2023. [Google Scholar]
  2. Wesche, J.; Germán, S.; Gonçalves, L.; Jödicke, I.; López-Asensio, S.; Prades, A.; Preuß, S.; Algado, C.O.; Dütschke, E. CCUS or no CCUS? Societal support for policy frameworks and stakeholder perceptions in France, Spain, and Poland. Greenh. Gases Sci. Technol. 2023, 13, 48–66. [Google Scholar] [CrossRef]
  3. Wettestad, J.; Inderberg, T.H.J.; Gulbrandsen, L.H. Exploring paths and innovation in Norwegian carbon capture and storage policy. Environ. Policy Gov. 2024, 34, 125–136. [Google Scholar] [CrossRef]
  4. Yao, J.; Han, H.; Yang, Y.; Song, Y.; Li, G. A Review of Recent Progress of Carbon Capture, Utilization, and Storage (CCUS) in China. Appl. Sci. 2023, 13, 1169. [Google Scholar] [CrossRef]
  5. Xin-gang, Z.; Ying, Z. Can China’s renewable energy industry policy support the low-carbon energy transition effectively? Environ. Sci. Pollut. Res. 2023, 30, 29525–29549. [Google Scholar] [CrossRef] [PubMed]
  6. Garcia, J.A.; Villen-Guzman, M.; Rodriguez-Maroto, J.M.; Paz-Garcia, J.M. Comparing CO2 Storage and Utilization: Enhancing Sustainability through Renewable Energy Integration. Sustainability 2024, 16, 6639. [Google Scholar] [CrossRef]
  7. Liu, S.; Liu, T.; Zheng, S.; Wang, R.; Sang, S. Evaluation of carbon dioxide geological sequestration potential in coal mining area. Int. J. Greenh. Gas Control 2023, 122, 103814. [Google Scholar] [CrossRef]
  8. Yang, L.; Xu, M.; Yang, Y.; Fan, J.; Zhang, X. Comparison of subsidy schemes for carbon capture utilization and storage (CCUS) investment based on real option approach: Evidence from China. Appl. Energy 2019, 255, 113828. [Google Scholar] [CrossRef]
  9. Global CCS Institute. Global Status of CCS 2023 Scaling Up through 2030; Global CCS Institute: Melbourne, Australia, 2023. [Google Scholar]
  10. Liu, Z.; Deng, Z.; He, G.; Wang, H.; Zhang, X.; Lin, J.; Qi, Y.; Liang, X. Challenges and opportunities for carbon neutrality in China. Nat. Rev. Earth Environ. 2022, 3, 141–155. [Google Scholar] [CrossRef]
  11. Chen, W.; Wang, Y.; Zhang, J.; Dou, W.; Jiao, Y. Planning and Energy–Economy–Environment–Security Evaluation Methods for Municipal Energy Systems in China under Targets of Peak Carbon Emissions and Carbon Neutrality. Energies 2022, 15, 7443. [Google Scholar] [CrossRef]
  12. Fang, M.; Dong, W.; Zhang, Y.; Zhao, R.; Li, Y.; Lu, S.; Wang, T.; Wang, Q. Study on the chemical absorption main heat exchanger and process modification for 150kt/y CCS demonstration project. Int. J. Greenh. Gas Control 2021, 112, 103470. [Google Scholar] [CrossRef]
  13. Tapia, J.F.D.; Lee, J.-Y.; Ooi, R.E.H.; Foo, D.C.Y.; Tan, R.R. A review of optimization and decision-making models for the planning of CO2 capture, utilization and storage (CCUS) systems. Sustain. Prod. Consum. 2018, 13, 1–15. [Google Scholar] [CrossRef]
  14. Goto, K.; Yogo, K.; Higashii, T. A review of efficiency penalty in a coal-fired power plant with post-combustion CO2 capture. Appl. Energy 2013, 111, 710–720. [Google Scholar] [CrossRef]
  15. Gatti, M.; Martelli, E.; Di Bona, D.; Gabba, M.; Scaccabarozzi, R.; Spinelli, M.; Viganò, F.; Consonni, S. Preliminary Performance and Cost Evaluation of Four Alternative Technologies for Post-Combustion CO2 Capture in Natural Gas-Fired Power Plants. Energies 2020, 13, 543. [Google Scholar] [CrossRef]
  16. Liao, P.; Li, Y.; Wu, X.; Wang, M.; Oko, E. Flexible operation of large-scale coal-fired power plant integrated with solvent-based post-combustion CO2 capture based on neural network inverse control. Int. J. Greenh. Gas Control 2020, 95, 102985. [Google Scholar] [CrossRef]
  17. Liu, J.; Chen, H.; Zhao, S.; Pan, P.; Wu, L.; Xu, G. Evaluation and improvements on the flexibility and economic performance of a thermal power plant while applying carbon capture, utilization & storage. Energy Convers. Manag. 2023, 290, 117219. [Google Scholar] [CrossRef]
  18. Gong, D.-w.; Zhang, Y.; Qi, C.-l. Environmental/economic power dispatch using a hybrid multi-objective optimization algorithm. Int. J. Electr. Power Energy Syst. 2010, 32, 607–614. [Google Scholar] [CrossRef]
  19. Lu, Z.-g.; Feng, T.; Li, X.-p. Low-carbon emission/economic power dispatch using the multi-objective bacterial colony chemotaxis optimization algorithm considering carbon capture power plant. Int. J. Electr. Power Energy Syst. 2013, 53, 106–112. [Google Scholar] [CrossRef]
  20. Yu, X.; Zhang, S.; Liu, L.; Du, J. Optimal design and scheduling of carbon capture power plant based on uncertainty decision-making methods. J. Clean. Prod. 2022, 380, 134852. [Google Scholar] [CrossRef]
  21. Abdilahi, A.M.; Mustafa, M.W. Carbon capture power plants: Decoupled emission and generation outputs for economic dispatch. Int. J. Greenh. Gas Control 2017, 63, 12–19. [Google Scholar] [CrossRef]
  22. Abdul Manaf, N.; Qadir, A.; Abbas, A. Temporal multiscalar decision support framework for flexible operation of carbon capture plants targeting low-carbon management of power plant emissions. Appl. Energy 2016, 169, 912–926. [Google Scholar] [CrossRef]
  23. Abdul Manaf, N.; Qadir, A.; Abbas, A. Efficient energy management of CO2 capture plant using control-based optimization approach under plant and market uncertainties. J. Process Control 2019, 74, 2–12. [Google Scholar] [CrossRef]
  24. Braakhuis, L.; Høisæter, K.K.; Knuutila, H.K. Modeling the Formation of Degradation Compounds during Thermal Degradation of MEA. Ind. Eng. Chem. Res. 2022, 61, 2867–2881. [Google Scholar] [CrossRef]
  25. Wetenhall, B.; Aghajani, H.; Chalmers, H.; Benson, S.D.; Ferrari, M.C.; Li, J.; Race, J.M.; Singh, P.; Davison, J. Impact of CO2 impurity on CO2 compression, liquefaction and transportation. Energy Procedia 2014, 63, 2764–2778. [Google Scholar] [CrossRef]
  26. Lin, X.; Liu, Y.; Song, H.; Guan, Y.; Wang, R. Concept design, parameter analysis, and thermodynamic evaluation of a novel integrated gasification chemical-looping combustion combined cycle power generation system. Energy Convers. Manag. 2023, 279, 116768. [Google Scholar] [CrossRef]
  27. Feng, H.; Wang, M.; Wang, N.; Xu, Y.; He, S.; Gao, M. Influence of environmental parameters on the cold-end and thermal system of coal-fired power plant based on Ebsilon simulation. Therm. Sci. Eng. Prog. 2022, 32, 101340. [Google Scholar] [CrossRef]
  28. Li, Y.; Wang, N.; Guan, H.; Jia, Z.; Zhang, Y.; Zhao, G.; Gao, M. Optimization study of CO2 capture unit for subcritical coal-fired power generation unit based on Ebsilon and Aspen plus. Energy Convers. Manag. 2022, 269, 116111. [Google Scholar] [CrossRef]
  29. Wang, C.; He, S.; Liu, L.; Li, X.; Gao, L. Tradeoff between the efficiency penalty and load depth in a coal-fired power plant with CO2 capture under partial load conditions. Energy Convers. Manag. 2023, 278, 116608. [Google Scholar] [CrossRef]
  30. Akinola, T.E.; Oko, E.; Wang, M. Study of CO2 removal in natural gas process using mixture of ionic liquid and MEA through process simulation. Fuel 2019, 236, 135–146. [Google Scholar] [CrossRef]
  31. Amann, J.-M.; Descamp, C.; Kanniche, M.; Bouallou, C. Modeling of the CO2 capture in post-combustion. Sci. Study Res. 2006, III, 77–90. [Google Scholar]
  32. Garcia, M.; Knuutila, H.K.; Gu, S. ASPEN PLUS simulation model for CO2 removal with MEA: Validation of desorption model with experimental data. J. Environ. Chem. Eng. 2017, 5, 4693–4701. [Google Scholar] [CrossRef]
  33. Hanak, D.P.; Biliyok, C.; Manovic, V. Evaluation and Modeling of Part-Load Performance of Coal-Fired Power Plant with Postcombustion CO2 Capture. Energy Fuels 2015, 29, 3833–3844. [Google Scholar] [CrossRef]
  34. Gazzani, M.; Macchi, E.; Manzolini, G. CO2 capture in integrated gasification combined cycle with SEWGS—Part A: Thermodynamic performances. Fuel 2013, 105, 206–219. [Google Scholar] [CrossRef]
  35. Oh, S.-Y.; Yun, S.; Kim, J.-K. Process integration and design for maximizing energy efficiency of a coal-fired power plant integrated with amine-based CO2 capture process. Appl. Energy 2018, 216, 311–322. [Google Scholar] [CrossRef]
  36. de Groot, M.; Crijns-Graus, W.; Harmsen, R. The effects of variable renewable electricity on energy efficiency and full load hours of fossil-fired power plants in the European Union. Energy 2017, 138, 575–589. [Google Scholar] [CrossRef]
  37. Adibhatla, S.; Kaushik, S.C. Energy and exergy analysis of a super critical thermal power plant at various load conditions under constant and pure sliding pressure operation. Appl. Therm. Eng. 2014, 73, 51–65. [Google Scholar] [CrossRef]
  38. Habibollahzade, A.; Houshfar, E.; Ashjaee, M.; Ekradi, K. Continuous power generation through a novel solar/geothermal chimney system: Technical/cost analyses and multi-objective particle swarm optimization. J. Clean. Prod. 2021, 283, 124666. [Google Scholar] [CrossRef]
  39. Liu, M.; Wang, S.; Yan, J. Operation scheduling of a coal-fired CHP station integrated with power-to-heat devices with detail CHP unit models by particle swarm optimization algorithm. Energy 2021, 214, 119022. [Google Scholar] [CrossRef]
  40. Viet, D.T.; Phuong, V.V.; Duong, M.Q.; Tran, Q.T. Models for Short-Term Wind Power Forecasting Based on Improved Artificial Neural Network Using Particle Swarm Optimization and Genetic Algorithms. Energies 2020, 13, 2873. [Google Scholar] [CrossRef]
  41. Wang, D.; Tan, D.; Liu, L. Particle swarm optimization algorithm: An overview. Soft Comput. 2018, 22, 387–408. [Google Scholar] [CrossRef]
Figure 1. Schematic diagram of the carbon capture power generation system.
Energies 17 04986 g001
Figure 2. Electricity output under different capture quantities and work conditions.
Energies 17 04986 g002
Figure 3. The variation in efficiency of power generation under different work conditions.
Energies 17 04986 g003
Figure 4. The mathematical relationships between CO2 quantity, coal flow rate, and THA.
Energies 17 04986 g004
Figure 5. Power output under different CO2 capture quantities for various THA conditions.
Energies 17 04986 g005
Figure 6. Schematic diagram of applying the algorithm to maximize the revenue while keeping tracking power load demand.
Energies 17 04986 g006
Figure 7. Schematic diagram of applying the algorithm to maximize plant revenue without taking the power load demand into account.
Energies 17 04986 g007
Figure 8. The variation characteristics of optimal THA and flow of CO2 captured with changes in CO2 prices.
Energies 17 04986 g008
Figure 9. CO2 boundary price under different power load.
Energies 17 04986 g009
Figure 10. Influence of electricity and fuel prices on the CO2 boundary costs.
Energies 17 04986 g010
Figure 11. Power output regulation by applying the optimization model: (a) CO2 price is 35.7$; (b) CO2 price is 14.3$.
Energies 17 04986 g011
Figure 12. The impact of different CO2 prices and electricity prices on the operation conditions of the system: (a) variable CO2 price; (b) variable electricity price.
Energies 17 04986 g012
Table 1. The characteristics of coal adopted in the simulation.
Proximate Analysis (wt%)Ultimate Analysis (wt%)Heat Value
(MJ/kg, LHV)
MtMadAarVarCHNOS
15.558.438.834.7361.73.671.128.560.623.44
Table 2. Key parameters of the carbon capture power plant.
UnitParametersValue
Power generationMain steam30 MPa/600 °C
Reheat steam 110 MPa/610 °C
Reheat steam 23.1 MPa/610 °C
Inlet water temperature of boiler361 °C
Exhaust steam pressure of turbine0.0045 MPa
CO2 captureSolvent30%wt MEA
CO2 capture ratio90%
Temperature of the reboiler125 °C
Table 3. Key parameters of the capture unit.
UnitParameterValue
Absorber
1 and 2
The height of packing25 m
The diameter of the absorber18 m
Bottom pressure of the absorber0.1 MPa
Pressure drop of the absorber0.001 MPa
Packing material250 Y
StripperThe height of packing in the stripper20 m
The diameter of the stripper22 m
Bottom pressure of the stripper0.219 MPa
Pressure drop of the stripper0.001 MPa
Packing material250 Y
Table 4. System performances under different work conditions of the referencing system.
Load100% THA75% THA50% THA30% THA
Coal input/kg/s89.3068.0947.0530.53
Energy input/MW2093.291596.031102.92715.69
Power output/MW1005.73747.70497.18307.75
η net e /%48.0546.8545.0843.00
Table 5. Compositions of flue gas under different work conditions of the referencing system.
Parameters100% THA75% THA50% THA30% THA
Mole fractions of flue gas (%)H2O8.317.637.076.44
CO212.8511.5510.449.23
N275.4875.8976.2376.61
O23.364.936.267.72
Flue gas flow (kg/s)1047.92886.63676.19495.16
Flow of CO2 (kg/s)197.63153.84106.3068.99
Target capture flow (kg/s)177.87139.0095.6762.09
Table 6. Simulation results of the CO2 capture unit.
Parameters100%75%50%30%
Reboiler heating load (kW)665,338.91520,773.07360,506.37234,205.90
Flow of CO2 captured (kg/s)177.87138.4695.6762.09
CCR (%)90.0090.0090.0089.99
Specific heat consumption (GJ/tCO2)3.743.763.773.77
Electricity consumption (kW)349.23274.65190.15123.46
L/G2.402.222.021.80
Disclaimer/Publisher’s Note: The statements, opinions and data contained in all publications are solely those of the individual author(s) and contributor(s) and not of MDPI and/or the editor(s). MDPI and/or the editor(s) disclaim responsibility for any injury to people or property resulting from any ideas, methods, instructions or products referred to in the content.

