Article

Optimizing Microgrid Load Fluctuations through Dynamic Pricing and Electric Vehicle Flexibility: A Comparative Analysis

1
Faculty of Electronic Information Engineering, Huayin Institute of Technology, Huai’an 223003, China
2
Artificial Intelligence Research Center (AIRC), Ajman University, Ajman P.O. Box 346, United Arab Emirates
*
Authors to whom correspondence should be addressed.
Energies 2024, 17(19), 4994; https://doi.org/10.3390/en17194994
Submission received: 10 September 2024 / Revised: 4 October 2024 / Accepted: 4 October 2024 / Published: 8 October 2024
(This article belongs to the Section A1: Smart Grids and Microgrids)

Abstract

:
In the context of modern power systems, the reliance on a single-time-of-use electricity pricing model presents challenges in managing electric vehicle (EV) charging in a way that can effectively accommodate the variable supply and demand patterns, particularly in the presence of wind power generation. This often results in undesirable peak–valley differences in microgrid load profiles. To address this challenge, this paper introduces an innovative approach that combines time-of-use electricity pricing with the flexible energy storage capabilities of electric vehicles. By dynamically adjusting the time-of-use electricity prices and implementing a tiered carbon pricing system, this paper presents a comprehensive strategy for formulating optimized charging and discharging plans that leverage the inherent flexibility of electric vehicles. This approach aims to mitigate the fluctuations in the microgrid load and enhance the overall grid stability. The proposed strategy was simulated and compared with the no-incentive and single-incentive strategies. The results indicate that the load peak-to-trough difference was reduced by 30.1% and 18.6%, respectively, verifying its effectiveness and superiority. Additionally, the increase in user income and the reduction in carbon emissions verify the need for the development of EVs in tandem with clean energy for environmental benefits.

1. Introduction

In modern power systems, the reliance on a single-time-of-use electricity pricing model has posed challenges in managing electric vehicle (EV) charging to effectively accommodate variable supply and demand patterns, particularly in the presence of wind power generation. This often results in undesirable peak–valley differences in microgrid load profiles. Electric vehicles (EVs) have developed rapidly due to their economic, environmental, and smart advantages.
With the gradual maturity of vehicle-to-grid (V2G) technology, the integration of EVs into microgrids has become increasingly popular [1]. Because clean energy and EV charging are random and uncertain, these characteristics will cause line overload [2], peak on peak [3,4], and other hazards to the system. Therefore, what dispatching strategy should be used to promote the integration of EVs and microgrids? Achieving positive interactions and reducing their negative impacts are issues that need to be solved urgently.
In recent years, there have been many studies on the problem of the large-scale and disorderly access of EVs to the distribution network that affects the reliability of the power supply [5,6]. In [7], the authors established an economic dispatch model with the goal of load fluctuation and user income and guided users to charge at different time periods through electricity prices to solve the load problem. In [8], the authors offer valuable insights into optimizing energy management, which aligns with the goal of mitigating the microgrid load fluctuations through smart strategies like energy storage sharing services. In [9], a method is proposed to utilize the flexible characteristics of EVs to establish a collaborative model for the integration of wind power and grid load. By using the minimum load mean square error as the objective function, the strategy’s effectiveness is verified by comparing positive and negative peak-shaving scenarios under different wind power penetration rates. In [10], electric vehicles are assigned to different agents, a two-layer control model comprising a control center and agents is established, and a load optimization allocation strategy is proposed. This strategy is based on a dynamic time-of-use electricity pricing formulation method to enhance wind power consumption and mitigate the impact of the EV grid connection on the power grid. References [11,12,13] improve the time-of-use electricity pricing model by reasonably dividing the peak and valley periods and conducting simulation analyses of different charging strategies to achieve peak-cutting and valley-filling.
Most of the aforementioned literature focuses on optimal dispatching strategies for load transfer, primarily guided by time-of-use electricity pricing. However, single-incentive measures and inadequate electricity price settings struggle to manage the random fluctuations in load and wind power generation. Additionally, a large number of EVs charging during off-peak hours can inadvertently create new electricity consumption peaks [14]. In [15], a risk-based dynamic pricing model is proposed, utilizing metaheuristic optimization for an EV charging infrastructure integrated with microgrids. This model addresses the need for efficient pricing strategies that balance the interaction between the grid and EVs, ensuring load balancing and grid stability. In [16], the authors employ a game-theoretic approach to alleviate charging anxiety for EV users by incorporating multi-parameter dynamic pricing and real-time traffic data, enhancing user satisfaction and evenly distributing the EV charging load in real time. In [17], the authors highlight a dynamic pricing strategy aimed at reducing congestion in EV charging stations while maximizing revenue, emphasizing the optimization of EV charging station usage, particularly in high-demand urban areas. Similarly, in [18], the authors focus on the planning of fast-charging infrastructure for EVs, integrating a dynamic price prediction model to address the growing demand for high-speed charging solutions that can adapt to fluctuating loads without overburdening the grid. In [19], a deep-weighted ensemble model is introduced to forecast wholesale electricity prices, improving the efficiency of EV charging at the aggregator level by enabling better anticipation of price fluctuations and enhancing grid–EV interactions. In [20], the authors explore optimal load shifting for EVs and heat pumps through model coupling, which focuses on generation adequacy and grid reliability amidst the integration of renewable energy sources, making this work particularly relevant for the future of smart grids. In [21], an improved k-means algorithm is proposed to control EV groups and mitigate wind power fluctuations, showcasing how the flexibility of EVs can be aligned with renewable energy to synchronize supply and demand more effectively. In [22], the authors introduce a predictive control and coordination system for energy communities, integrating EVs, heat pumps, and thermal storage. This system enhances grid flexibility and reliability, promoting more efficient energy usage at the community level. In [23], a real-time scheduling strategy for EV clusters is proposed, utilizing deep reinforcement learning to ensure responsive EV charging and discharging based on electricity prices. In [24], the authors present a method for efficient vehicle-to-grid (V2G) operations, demonstrating how large-scale EV aggregations can contribute additional grid flexibility and support renewable energy integration. In [25], the authors investigate dynamic road pricing in the context of autonomous and shared autonomous vehicles, using simulation-based dynamic traffic assignment to highlight how EVs, combined with smart transportation systems, can alleviate traffic congestion. In [26], a comprehensive review of modeling and optimization approaches for EV–grid–transportation network integration underscores the importance of smart management systems in ensuring efficient EV operations within these networks. In [27], the authors assess the business model potential of spot-market optimized EV charging, showcasing the economic benefits of aligning EV charging strategies with real-time electricity market dynamics. In [28], the authors present a game-theoretic strategy for optimal microgrid scheduling by leveraging demand response programs and EV fleets, highlighting the potential of EVs and smart buildings to enhance grid flexibility and efficiency, Given the flexible energy storage capabilities of EVs [29,30,31,32] and their compatibility with green energy development, further research into these areas holds significant potential for advancing sustainable energy systems.
To address the complex challenge posed by the interplay between variable renewable energy generation and the adoption of electric vehicles (EVs) within modern power systems, this paper presents a novel and integrated approach. This method harmoniously combines the concept of time-of-use (TOU) electricity pricing with the inherent energy storage capabilities offered by EVs. By adopting a dynamic framework, it involves the real-time adjustment of TOU electricity prices and introduces a tiered carbon pricing system that aligns with the environmental objectives. The cornerstone of this approach lies in its dynamic pricing component. Rather than relying on static pricing structures, this strategy adapts TOU electricity prices in real time based on current grid conditions. This ensures that the cost of electricity varies to reflect the supply and demand dynamics, thereby incentivizing more responsive behavior from consumers, especially EV owners.

2. Related Work

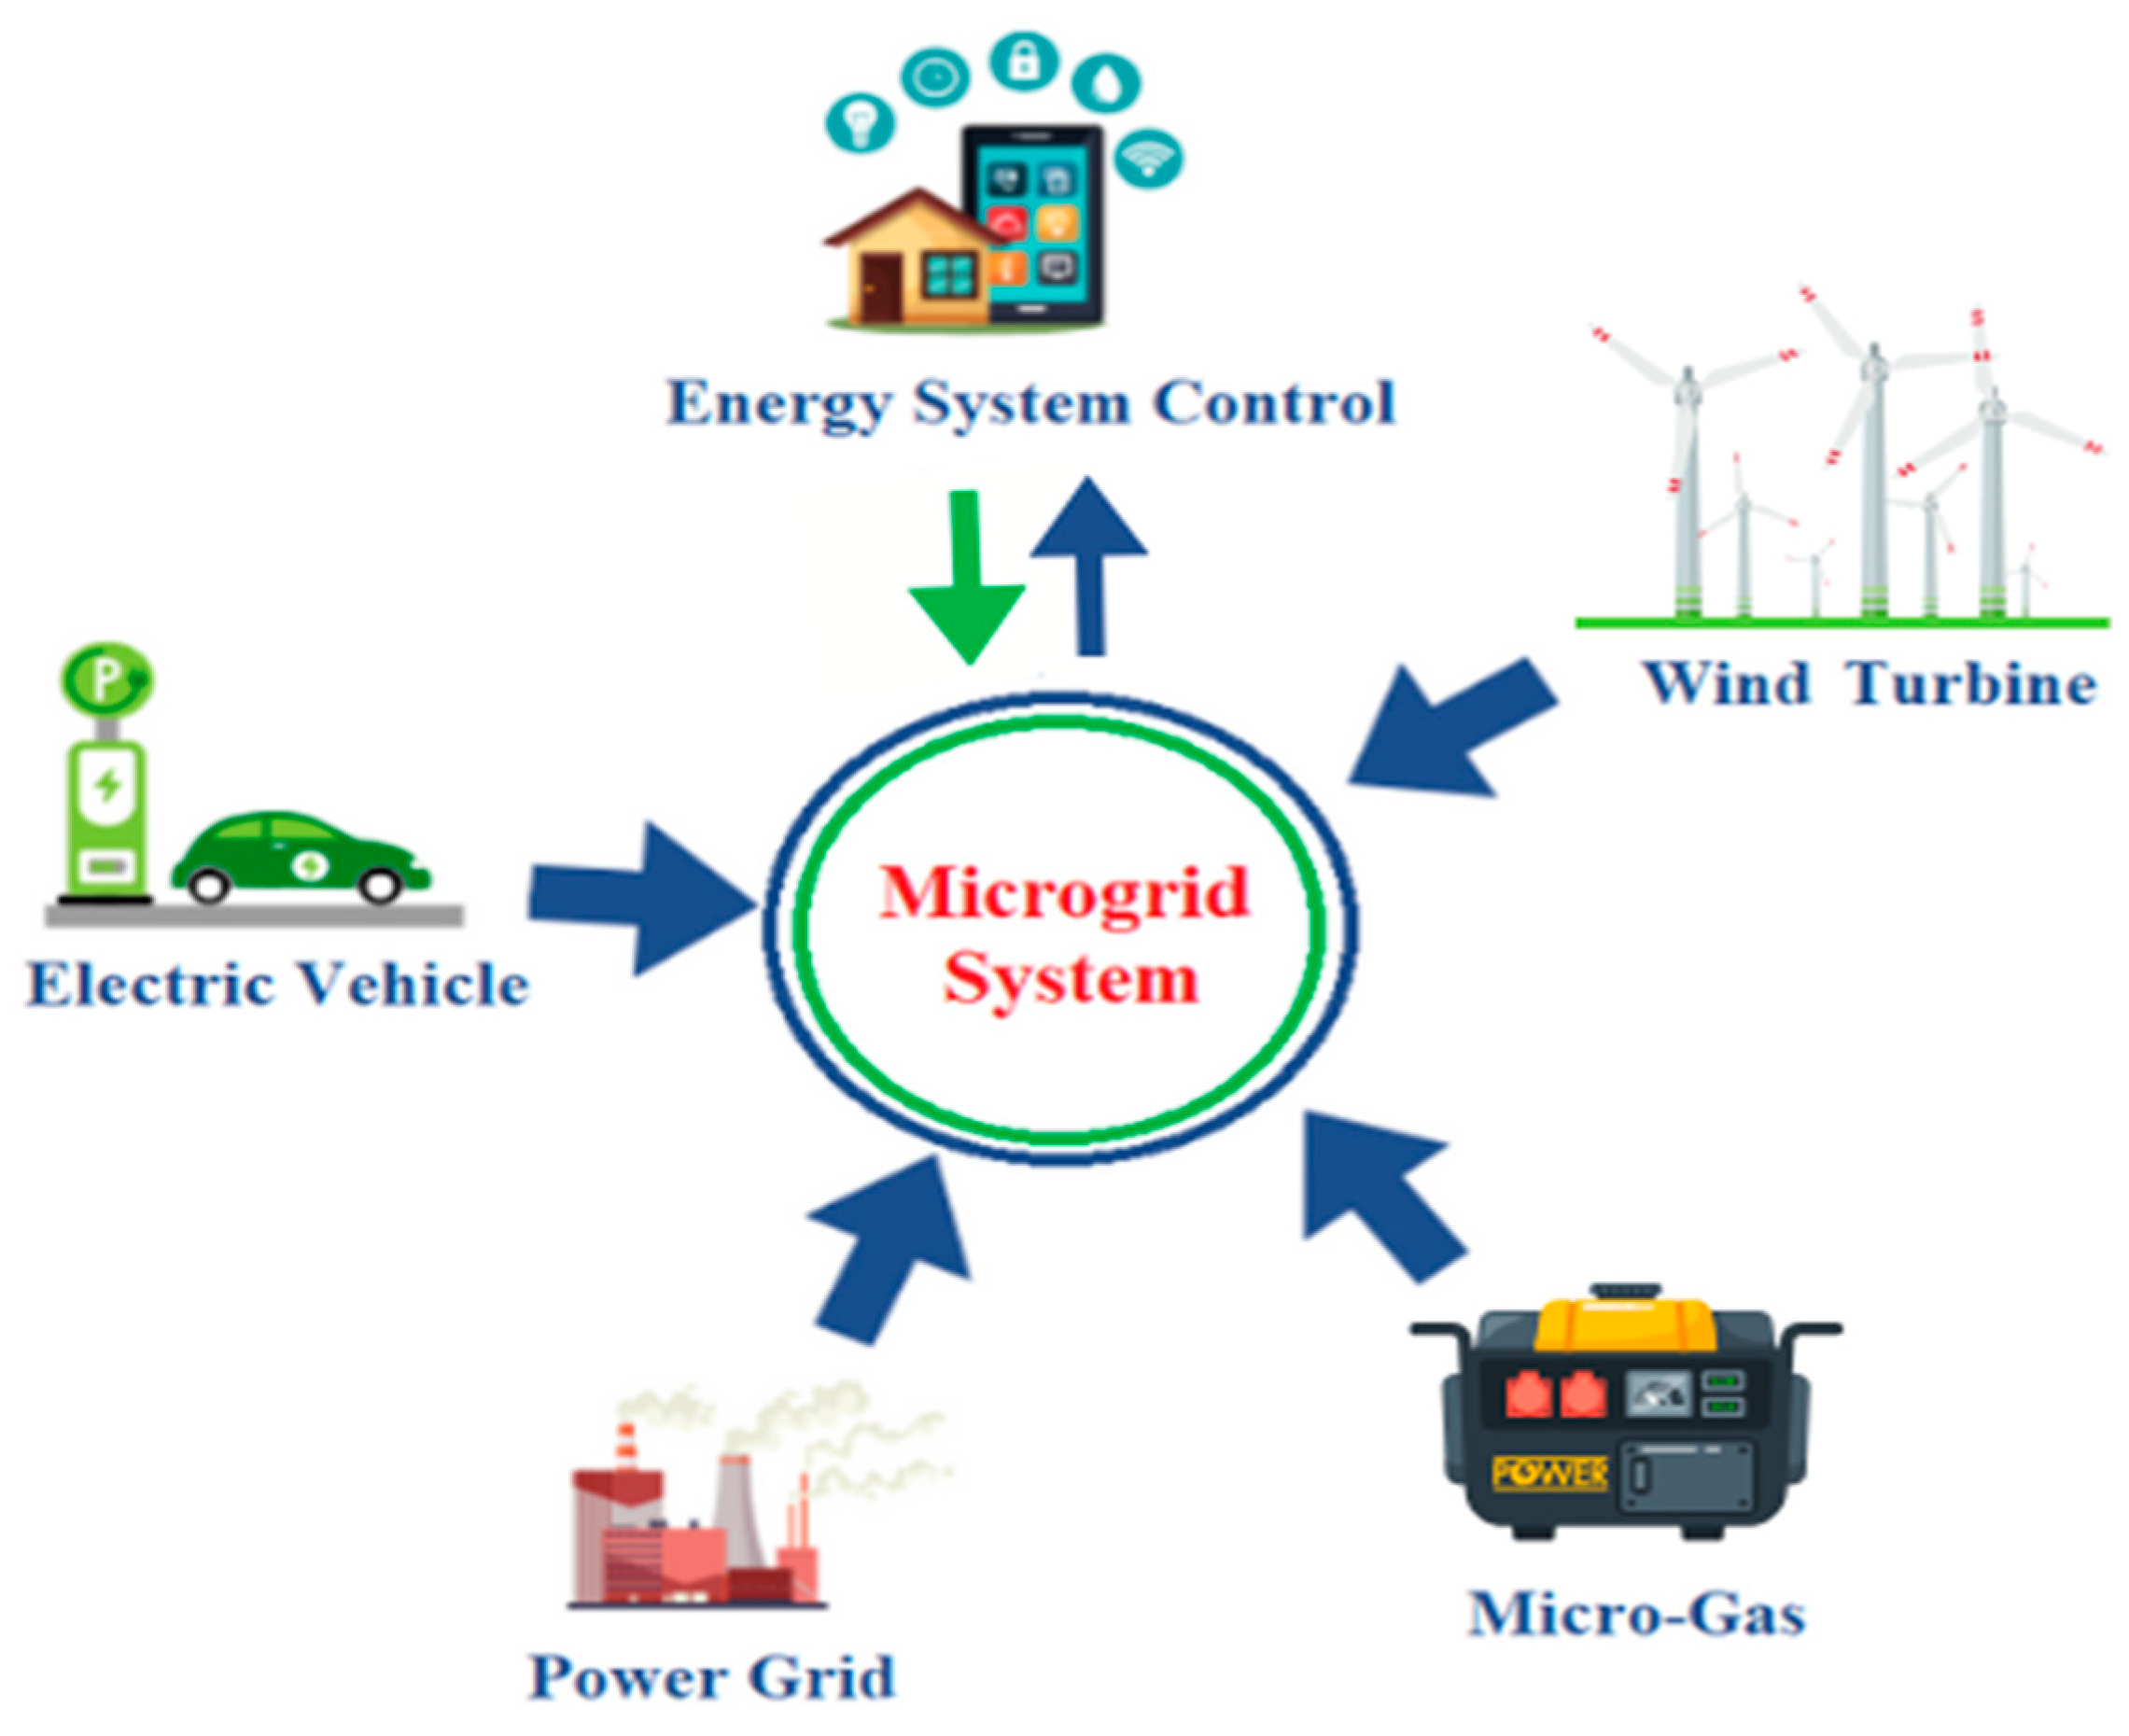
2.1. Description of Microgrid

The microgrid system containing EVs is shown in Figure 1. The system includes wind turbines, micro-gas turbines, and energy storage devices. The load is divided into a conventional load and an EV load. In the microgrid system, wind power managed by the dispatch center to supply power to residents and EVs. When demand is high, power is purchased from the grid, thereby reducing reliance on the microgrid’s own power generation [33].
The prediction of the EV charging load is the basis for the day-to-day dispatch of the microgrid. Therefore, flexible optimization dispatch should be conducted according to the microgrid’s conditions, while prioritizing the user’s expected state of charge (SOC). When charging out of order, the charging time and charging power of each EV are not affected by the outside world. The charging time of a single EV on the day can be obtained according to the microgrid’s conditions
T c = d E 100 100   k m × P c ,
where d is the daily driving distance of an EV; E 100 is the power consumption per 100 km; P c is the charging power of an EV.
After obtaining the charging time of each vehicle, according to the EV’s access time to the network and its charging power, the charging power of the EV in each period can be obtained by the superposition theorem as
P e v ( t ) = n = 1 N P e v , n ( t ) ,
where P e v ( t ) is the total charging power of EVs in period t; P e v , n ( t ) is the charging power of the nth EV in period t.
The relevant functions in the objective function are as follows:
P a v g = 1 T t = 1 T [ P l o a d t + P e v t + P B A t P M T t P w i n d ( t ) ]
C G = C g e n + C C O 2 + C d t + C l o s s ( t )
C g e n = P w t . C w + P M T t . C M T + P g r i d t . C g r i d
C C O 2 = E t h P c ( t )
C l o s s ( t ) = n | P e v ( t ) c ( t )
P M T ( t ) = i = 1 I P M T , i t ,
where C G is the operating cost of the microgrid; C g e n and C C O 2 are the power generation cost and carbon emission cost of the microgrid; C l o s s ( t ) is the power loss cost during EV charging and discharging; eta is the power loss ratio; C W , C M T , and C g r i d are the wind power generation cost, the micro-gas turbine power generation cost, and the power purchase cost from the grid; P w t ,   P M T t ,   a n d   P g r i d t are the power outputs from the wind, micro-turbine, and the grid, respectively.

2.2. Carbon Cost Model

Carbon trading is a mechanism that uses carbon emissions as a legal trading commodity to promote green development. In this mechanism, carbon emission quotas are issued in advance to the entities participating in the transactions.
The carbon process obtained by the wind turbine at time t is as follows:
M w ( t ) = ε P w ( t ) ,
where M w ( t ) is the carbon quota obtained by the wind turbine at time t; ε is the carbon quota distribution coefficient.
The carbon quotas required for micro-gas turbine power generation and external power purchase are as follows:
M c t = E t h P c t P c ε ( t )
P c ( t ) = i = 1 I P M T , i t + P G r i d ( t ) ,
where M c ( t ) is the total carbon quota to be purchased by the micro-gas turbine and external power purchase at time t; E t h is the carbon emission factor per unit power generation; P c ( t ) is the total carbon quota required for micro-gas turbine power generation and external power purchase at time t; P M T , i ( t ) is the power generation of micro-gas turbine i at time t; P G r i d ( t ) is the external power purchase at time t.
To encourage EVs to actively participate in the load-side response of microgrids, they are introduced into the carbon trading system. The carbon emissions of EVs are defined based on the proportion of the sum of micro-gas turbine power generation and external power purchases. Meanwhile, the daily randomness of new energy power generation is accounted for by setting a tiered carbon pricing structure. The carbon quota income of EVs is then determined as follows:
M e v 1 t = P e v t t L e v E g a s
M e v 2 t = P e v t t P c ( t ) P c t + P w ( t ) E t h
M e v t = q e v t [ M e v 1 t M e v 2 t ] ,
where M e v 1 ( t ) is the carbon emissions produced by driving the same mileage of traditional fuel vehicles and EVs; P e v ( t ) is the charging and discharging power of an EV at time t; L e v is the mileage that an EV can travel per unit of electricity; E g a s is the carbon emissions produced by traditional fuel vehicles per unit mileage; M e v 2 ( t ) is the carbon emissions produced by EVs when charging; C e v ( t ) is the income from carbon trading at time t; q e v ( t ) represents the sales of carbon quota at the time t price.

3. Proposed Model

3.1. The Objective Function

The main objective function based on both microgrid power and charging cost is
F = F 1 + F 2 .
The minimum grid-connected power variance of the microgrid is used as the system operation stability index, and the microgrid operation penalty cost is added as follows:
F 1 = t = 1 T ( P l o a d ( t ) + P e v ( t ) + P B A ( t ) + P M T ( t ) P w i n d ( t ) ) + · ( P a v g ( t ) + C G ( t ) ) .
The economic function that minimizes the user’s charging and discharging cost is
F 2 = t = 1 T P e v ( t ) c ( t ) + C e v ( t ) ,
where c ( t ) is the electricity price of EV charging and discharging at time t.

3.2. Constraints

The power balance constraints are
P l o a d t + P e v t + P B A t + P l o s s t = P M T t + P w i n d t + P g i r d .
The micro-gas turbine output constraints are
P M T , i m i n t P M T , i t P M T , i m a x t ,
where P M T , i m i n ( t ) and P M T , i m a x ( t ) are the upper and lower power limits of the i-th micro-combustion unit in period t.
The wind power output constraints are
P w m i n P w ( t ) P w m a x ,
where P W m i n and P W m a x , are the minimum power generation and maximum power generation of the wind turbine at time t, respectively.
The EV power constraints are
P D m a x ( t ) P e v ( t ) P c m a x ( t ) ,
where P D m a x ( t ) and P C m a x ( t ) are the maximum discharge power and maximum charging power of an EV at time t, respectively.
The EV SOC constraints are
S O C d e s i n e S O C e n d S O C m a x ,
where S O C d e s i r e is the desired state of charge of the EV; S O C e n d is the state of charge when the EV ends charging; S O C m a x is the maximum state of charge of the EV.
The battery power constraints are
P B A , D m a x ( t ) P B A ( t ) P B A , C m a x ( t ) ,
where P B A , D m a x ( t ) and P B A , C m a x ( t ) are the maximum power of the battery discharge and charge, respectively.
Additional battery power constraints are
S B A m i n ( t ) S B A ( t ) S B A m a x
where S B A m i n ( t ) and S B A m a x ( t ) are the upper and lower limits of the battery power, respectively; S B A ( t ) is the battery power at time t.

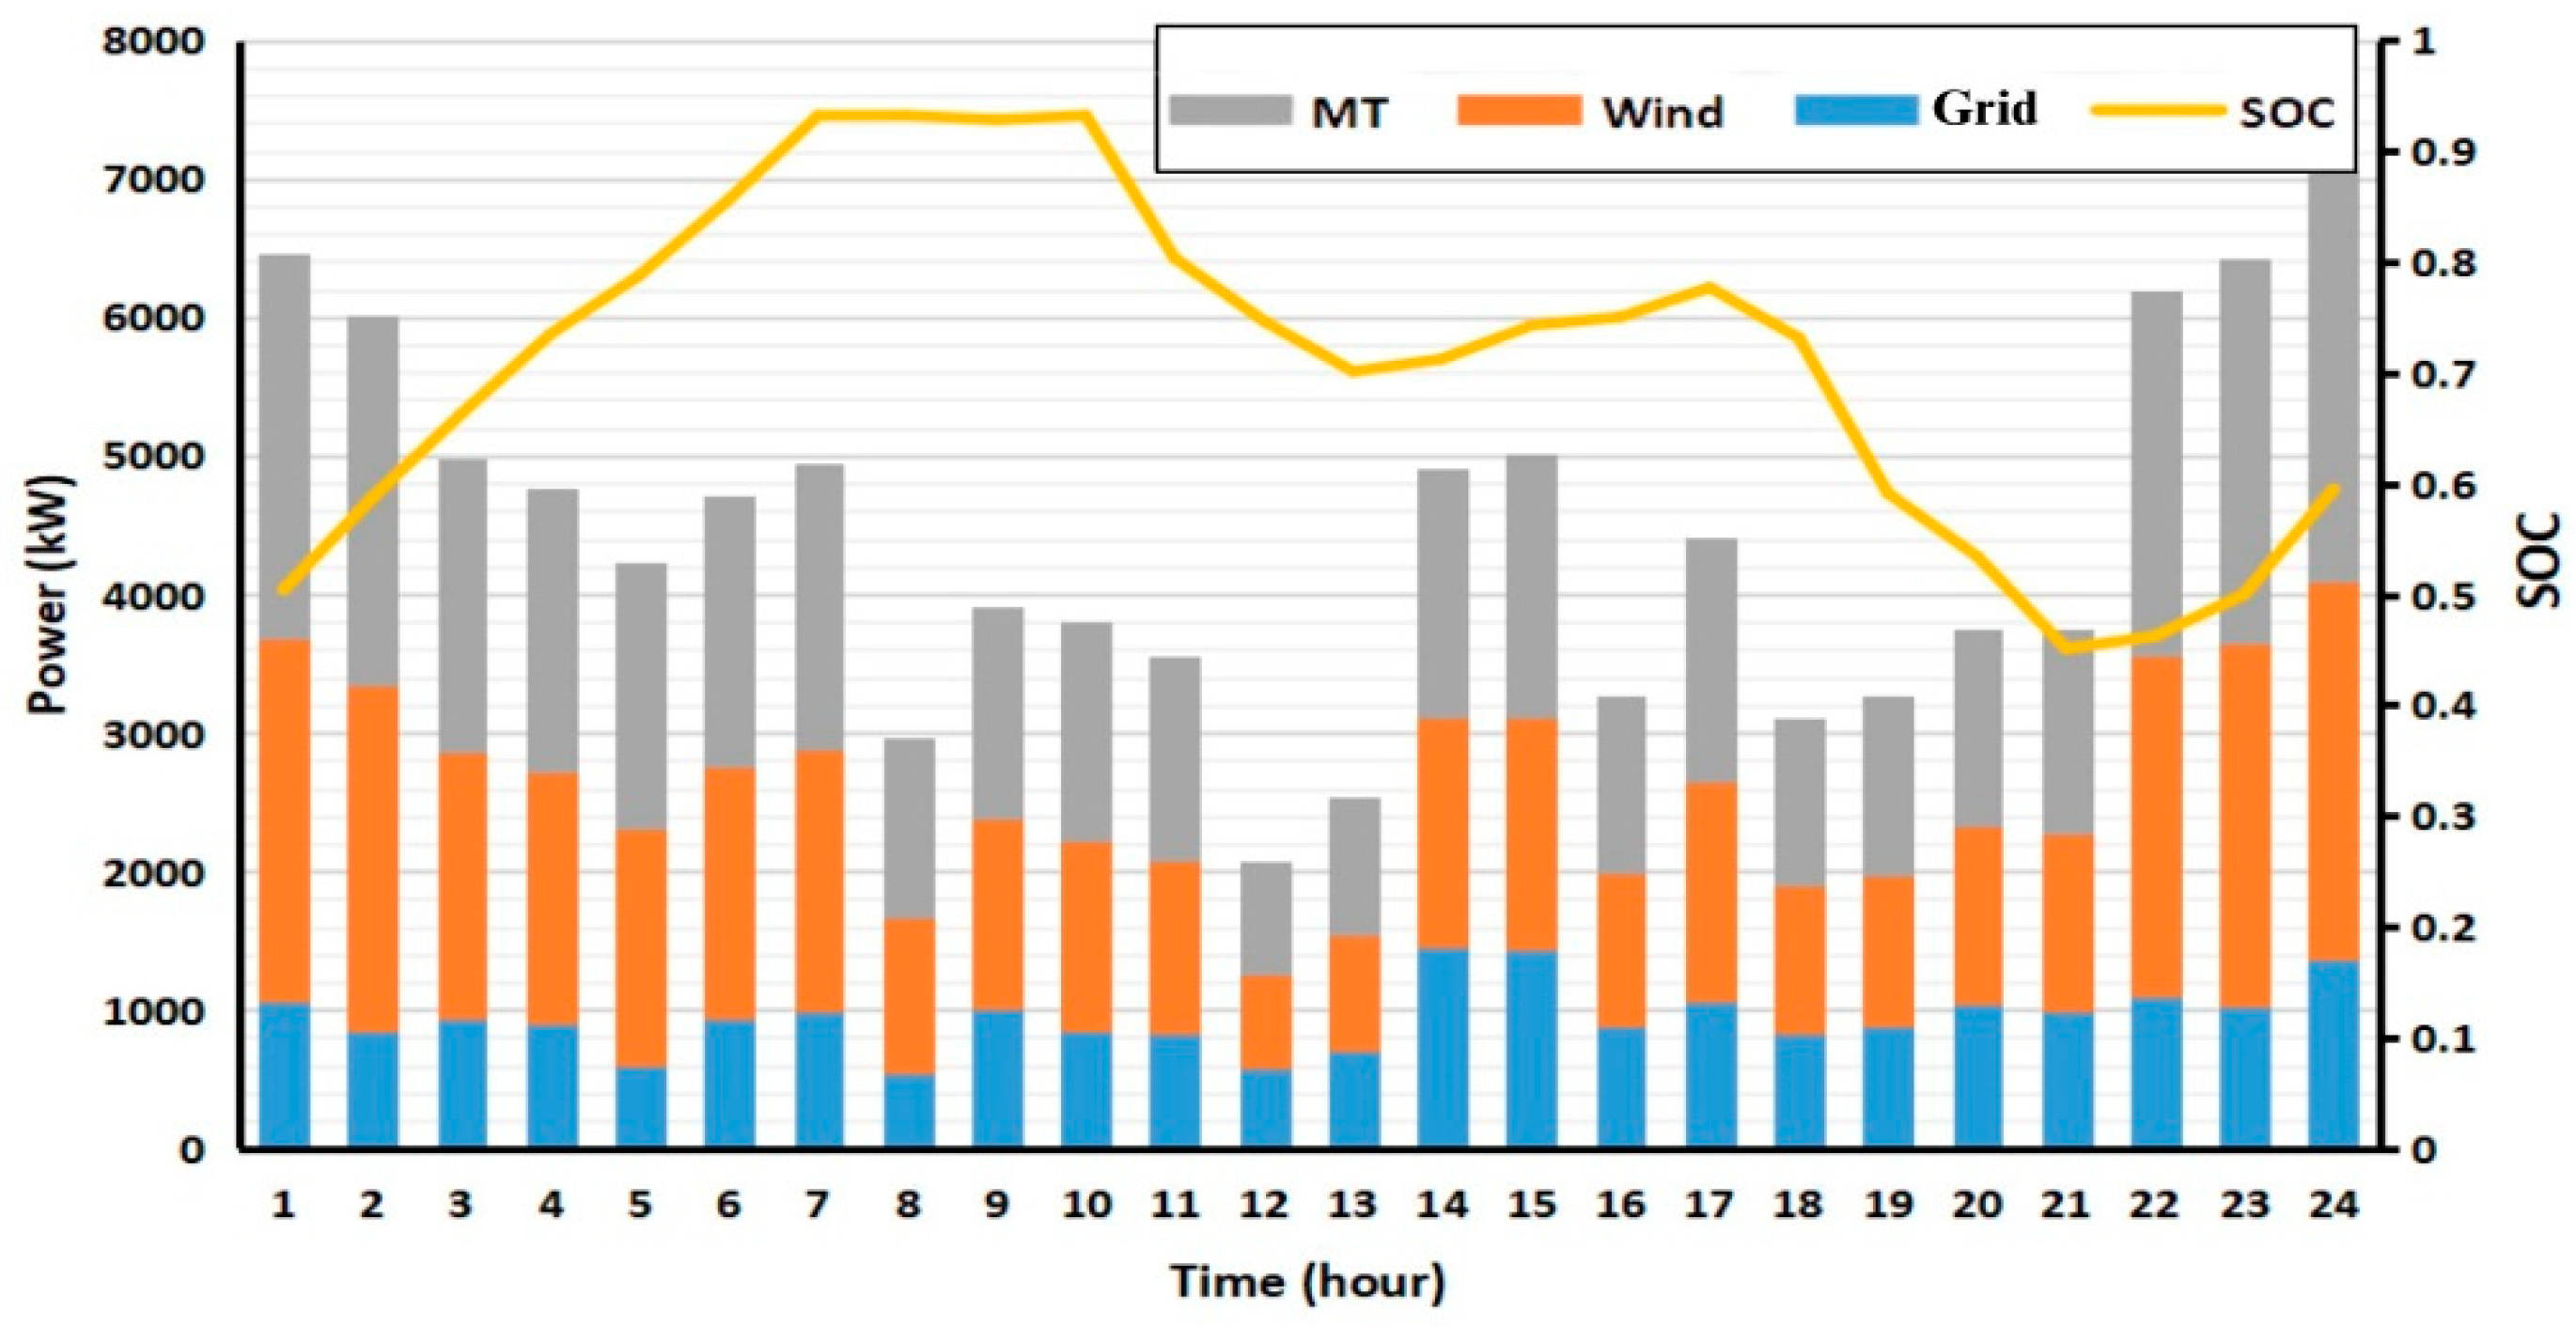
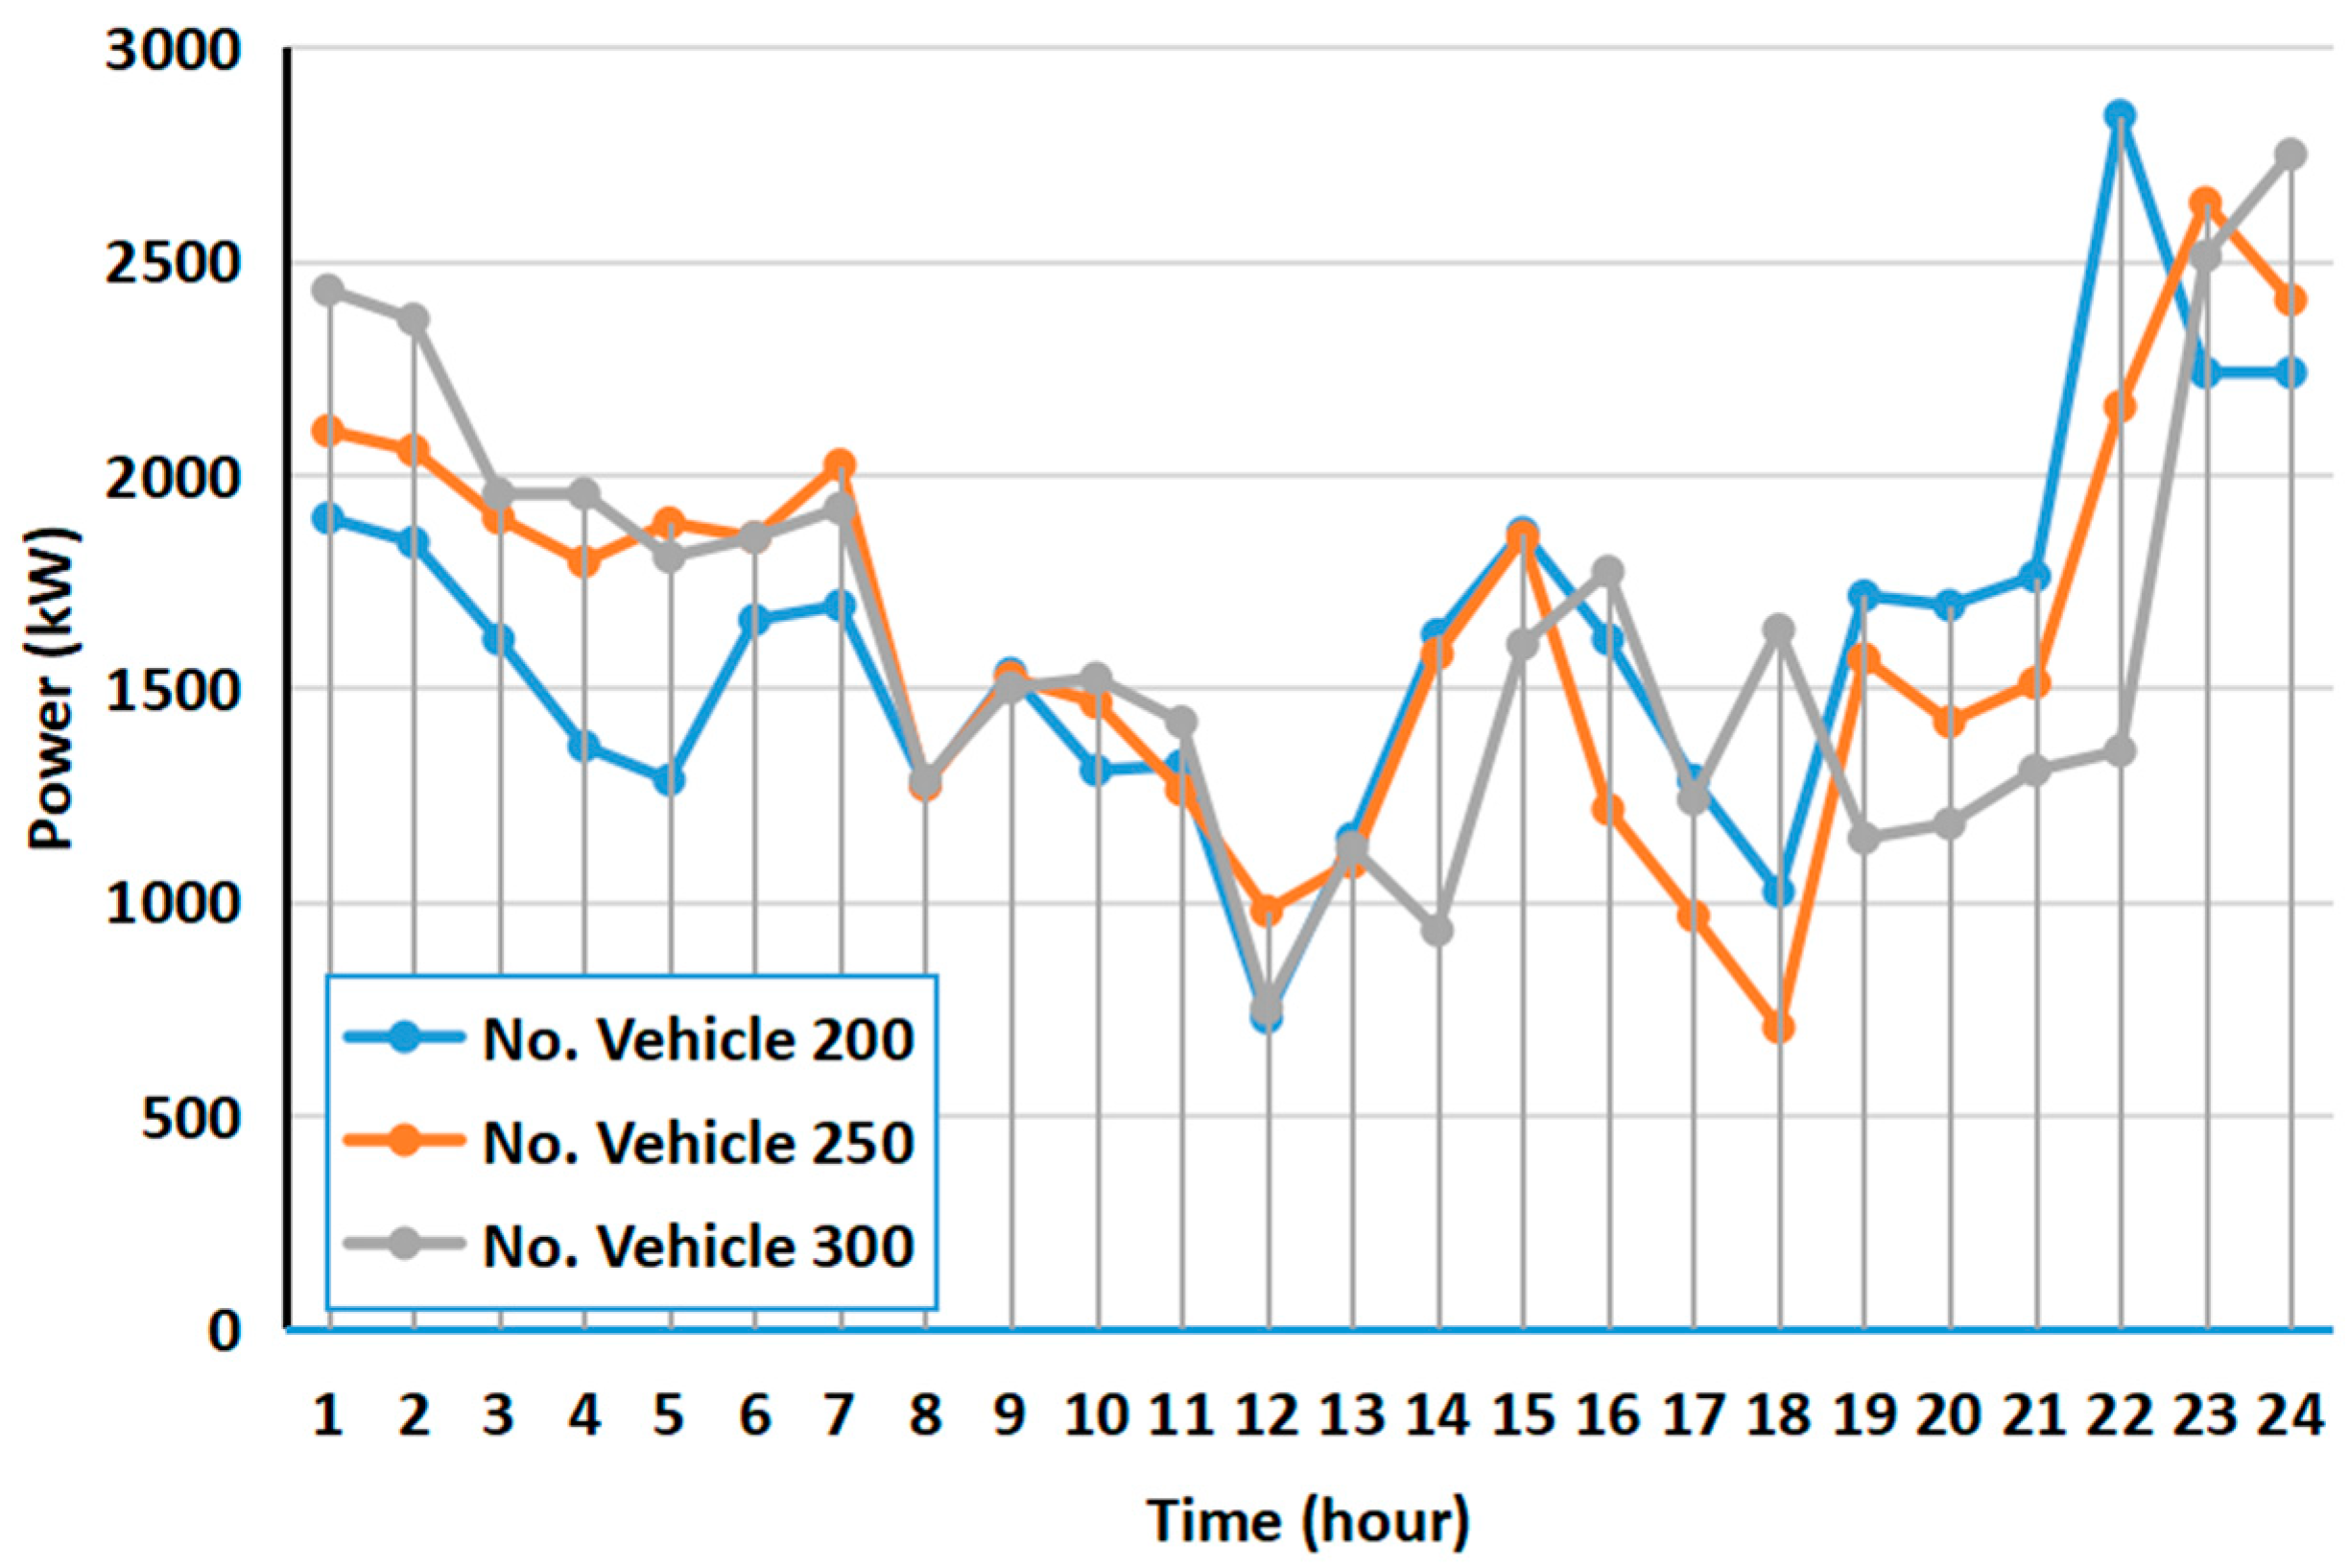
4. Results and Discussion

Taking wind power as clean energy, the installed capacity of the wind turbine is 2 MW, and the voltage level of the micro grid is 10 kV. The charging and discharging power of EVs in normal mode is 5.35 kW, the driving mileage per unit of electricity is 6 km per kWh, and the maximum power generation power of the micro-gas turbine is 300 kW. The relevant parameters of the carbon quota are detailed in Table 1.
Figure 2 shows a comparison of the microgrid’s equivalent load under two conditions: before and after chaotic charging of electric vehicles (EVs). Notably, the wind power generation is relatively low, while residents experience high electricity demand during the peak hours between 18:00 and 21:00. During this period, the fundamental load significantly increases, which can potentially disrupt the stable operation of the microgrid.
Figure 3 illustrates the time-of-use electricity pricing scheme, derived from day-ahead electricity price predictions. This pricing model considers both carbon quotas and carbon emissions across different time periods. To incentivize carbon reduction efforts, a corresponding carbon quota reward system and a tiered carbon pricing structure have been developed.
To assess the efficacy of the proposed strategy, various scenarios were selected for comparative analysis. Table 2 provides a detailed overview of the specific case configurations considered in this study. The outcomes of these cases are measured in terms of the average state of charge (SOC) of the equipment output and electric vehicles (EVs). Figure 4 presents the results for case 3, highlighting the average SOC of the equipment output and EVs in this specific case.
The electricity price refers to the rate per unit of electricity (USD/kWh) that consumers pay at different times of the day, based on a time-of-use pricing scheme. On the other hand, cost reflects the additional expense incurred for electricity usage, which considers the carbon trading during each time period. Therefore, while the price fluctuates based on the time-of-use scheme, the cost of carbon trading will vary depending on both the price and the level of electricity consumption.
Figure 5 shows case 2, which a comparison of the equivalent load curves in different cases. Here, 12:00–13:00 is a period of high electricity prices. It can be seen that during this period, the output of the wind turbines continues to decrease, and the load of residents increases slightly, resulting in a rising power deficit. In addition, after adding carbon quota incentives, the equivalent load curve of the microgrid is more effectively smoothed, and compared with case 1, the equivalent load peak-to-valley difference in case 3 is reduced by 31.12%, reduced by 19.26% compared with case 2. However, due to the single influence of electricity price incentives, some EVs choose to discharge intensively when electricity prices are high. Table 3 shows the comparison of the load peak and valley differences, user income, and microgrid operating costs in different cases.
Table 3 shows that, when users meet the expected off-grid SOC, the conversion of carbon quotas can increase user income by more than 100% compared to the single incentive of time-of-use electricity prices. However, due to the costs associated with the line loss and battery wear during EV charging and discharging, the operating cost for a single incentive increases slightly compared to that of a disordered charging microgrid.
Figure 6 shows that after the static carbon quota price is added, although new incentives are introduced, the fixed carbon quota price does not have a strong guiding effect on users. Consequently, new troughs in electricity demand will still form around the noon period. In contrast, the addition of dynamic carbon quota prices provides more and better options for parked vehicles or those not in a hurry to charge, allowing for a better adaptation to the daily randomness faced by microgrids.
In this study, 200, 250, and 300 EVs were selected for comparison under case 3. The typical daily load curve for the area is shown in Figure 7. The peak-to-trough difference and daily load variance in their equivalent loads are presented in Table 4. It can be observed that when the number of EVs was 300, the peak-to-trough difference was reduced by 15.23% compared to 200 vehicles and by 7.12% compared to 250 vehicles. Therefore, within a certain range, as the number of EVs increases, the peak-shaving and valley-filling effect becomes more pronounced, enhancing the stability of the microgrid.

5. Conclusions

The dual incentive dispatching strategy proposed in this study effectively addresses the issue of peak–valley differences caused by the randomness of EV charging and new energy generation:
  • The implementation of the dual incentive strategy, incorporating EVs into the carbon trading system, resulted in a 31.12% reduction in peak–valley differences compared to the original load curve. When compared to the single time-of-use electricity pricing strategy, the reduction was 19.26%, and user income doubled. This highlights significant improvements in the peak–valley management while also increasing the user participation in microgrid dispatching.
  • The use of dynamic carbon pricing and reward–punishment mechanisms proved to be more adaptable to the variability of wind power compared to static carbon quota pricing. This effectively smoothed the load curve. Moreover, increasing the number of EVs by 50 can reduce the peak–valley difference by approximately 7%, contributing to the optimal dispatch of the microgrid.
  • A broader range of scenarios across typical days should be considered to enhance the general applicability of the strategy and ensure its effectiveness under various conditions.
Future research should explore the integration of additional renewable energy sources, such as solar and hydro, to further enhance the robustness of the dual-incentive dispatching strategy. Additionally, scaling the strategy for larger microgrids or regional grids would provide insights into its scalability and coordination potential across multiple energy sources.

Author Contributions

Conceptualization, A.N.A., L.L., R.J. and H.B.; methodology, L.L. and R.J.; validation, A.N.A., M.A.M. and T.H.; formal analysis, A.N.A. and M.A.M.; investigation, L.L., R.J. and H.B.; resources, R.J. and H.B.; data curation, T.H.; writing—original draft preparation, M.A.M. and A.N.A.; writing—review and editing, A.N.A., L.L. and R.J.; visualization, H.B. and H.B. All authors have read and agreed to the published version of the manuscript.

Funding

This research received no external funding.

Data Availability Statement

Data available on request.

Conflicts of Interest

The authors declare no conflicts of interest.

References

  1. Datta, J.; Das, D. Energy management of multi-microgrids with renewables and electric vehicles considering price-elasticity based demand response: A bi-level hybrid optimization approach. Sustain. Cities Soc. 2023, 99, 104908. [Google Scholar] [CrossRef]
  2. Huang, Y.; Masrur, H.; Lipu, M.S.H.; Howlader, H.O.R.; Gamil, M.M.; Nakadomari, A.; Mandal, P.; Senjyu, T. Multi-objective optimization of campus microgrid system considering electric vehicle charging load integrated to power grid. Sustain. Cities Soc. 2023, 98, 104778. [Google Scholar] [CrossRef]
  3. Sun, J.; Ruze, N.; Zhang, J.; Shi, J.; Shen, B. Capacity planning and optimisation for integrated energy system in industrial park considering environmental externalities. Renew. Energy 2021, 167, 56–65. [Google Scholar] [CrossRef]
  4. Rangu, S.K.; Lolla, P.R.; Dhenuvakonda, K.R.; Singh, A.R. Recent trends in power management strategies for optimal operation of distributed energy resources in microgrids: A comprehensive review. Int. J. Energy Res. 2020, 44, 9889–9911. [Google Scholar] [CrossRef]
  5. Mulvey, J.M.; Vanderbei, R.J.; Zenios, S.A. Robust optimisation of large-scale systems. Oper. Res. 1995, 43, 264–281. [Google Scholar] [CrossRef]
  6. Suganthi, L.; Iniyan, S.; Samuel, A.A. Applications of Fuzzy Logic in Renewable Energy Systems—A Review. Renew. Sustain. Energy Rev. 2015, 48, 585–607. [Google Scholar] [CrossRef]
  7. Nazir, M.S.; Din, S.U.; Shah, W.A.; Ali, M.; Kharal, A.Y.; Abdalla, A.N.; Sanjeevikumar, P. Optimal Economic Modelling of Hybrid Combined Cooling, Heating, and Energy Storage System Based on Gravitational Search Algorithm-Random Forest Regression. Complexity 2021, 2021, 5539284. [Google Scholar] [CrossRef]
  8. Zhang, H.; Li, Z.; Xue, Y.; Chang, X.; Su, J.; Wang, P.; Guo, Q.; Sun, H. A stochastic bi-level optimal allocation approach of intelligent buildings considering energy storage sharing services. IEEE Trans. Consum. Electron. 2024. [Google Scholar] [CrossRef]
  9. Rudberg, M.; Waldemarsson, M.; Lidestam, H. Strategic perspectives on energy management: A case study in the process industry. Appl. Energy 2013, 104, 487–496. [Google Scholar] [CrossRef]
  10. Cinar, D.; Kayakutlu, G. Scenario analysis using Bayesian networks: A case study in energy sector. Knowl. Based Syst. 2010, 23, 267–276. [Google Scholar] [CrossRef]
  11. Gabbar, H.A.; Zidan, A. Modeling, evaluation, and optimisation of gas-power and energy supply scenarios. Front. Energy 2016, 10, 393–408. [Google Scholar] [CrossRef]
  12. Kiriyama, E.; Kajikawa, Y. A multilayered analysis of energy security research and the energy supply process. Appl. Energy 2014, 123, 415–423. [Google Scholar] [CrossRef]
  13. Faccio, M.; Gamberi, M.; Bortolini, M.; Nedaei, M. State-of-art review of the optimisation methods to design the configuration of hybrid renewable energy systems (HRESs). Front. Energy 2018, 12, 591–622. [Google Scholar] [CrossRef]
  14. Aghaei, J.; Shayanfar, H.; Amjady, N. Joint market clearing in a stochastic framework considering power system security. Appl. Energy 2009, 86, 1675–1682. [Google Scholar] [CrossRef]
  15. Nandini, K.K.; Jayalakshmi, N.S.; Jadoun, V.K. Risk-based dynamic pricing by metaheuristic optimization approach for electric vehicle charging infrastructure powered by grid integrated microgrid system. Electr. Power Syst. Res. 2024, 230, 110250. [Google Scholar]
  16. Rasheed, M.B.; Llamazares, Á.; Oca, M.; Revenga, P. A game-theoretic approach to mitigate charging anxiety for electric vehicle users through multi-parameter dynamic pricing and real-time traffic flow. Energy 2024, 304, 132103. [Google Scholar] [CrossRef]
  17. Kazemtarghi, A.; Mallik, A.; Chen, Y. Dynamic pricing strategy for electric vehicle charging stations to distribute the congestion and maximize the revenue. Electr. Power Energy Syst. 2024, 158, 109946. [Google Scholar] [CrossRef]
  18. Moses Babu, V.S.; Chakraborty, P.; Pal, M. Planning of fast charging infrastructure for electric vehicles in a distribution system and prediction of dynamic price. Electr. Power Energy Syst. 2024, 155, 109502. [Google Scholar]
  19. Hussain, S.; Prasad Teni, A.; Hussain, I.; Hussain, Z.; Pallonetto, F.; Eichman, J.; Irshad, R.R.; Alwayle, I.M.; Alharby, M.; Hussain, A.; et al. Enhancing electric vehicle charging efficiency at the aggregator level: A deep-weighted ensemble model for wholesale electricity price forecasting. Energy 2024, 308, 132823. [Google Scholar] [CrossRef]
  20. Misconel, S.; Zimmermann, F.; Mikurda, J.; Möst, D.; Kunze, R.; Gnann, T.; Kühnbach, M.; Speth, D.; Pelka, S.; Yu, S. Model coupling and comparison on optimal load shifting of battery electric vehicles and heat pumps focusing on generation adequacy. Energy 2024, 305, 132266. [Google Scholar] [CrossRef]
  21. Yu, Y.; Liu, M.; Chen, D.; Huo, Y.; Lu, W. Dynamic grouping control of electric vehicles based on improved k-means algorithm for wind power fluctuations suppression. Glob. Energy Interconnect. 2024, 6, 542–553. [Google Scholar] [CrossRef]
  22. Srithapon, C.; Månsson, D. Predictive control and coordination for energy community flexibility with electric vehicles, heat pumps, and thermal energy storage. Appl. Energy 2023, 347, 121500. [Google Scholar] [CrossRef]
  23. Wang, K.; Wang, H.; Yang, J.; Feng, J.; Li, Y.; Zhang, S.; Okoye, M.O. Electric vehicle clusters scheduling strategy considering real-time electricity prices based on deep reinforcement learning. Energy Rep. 2022, 8, 695–703. [Google Scholar] [CrossRef]
  24. Seo, M.; Kodaira, D.; Jin, Y.; Son, H.; Han, S. Development of an efficient vehicle-to-grid method for massive electric vehicle aggregation. Energy Rep. 2024, 11, 1659–1674. [Google Scholar] [CrossRef]
  25. Shatanawi, M.; Alatawneh, A.; Mészáros, F. Implications of static and dynamic road pricing strategies in the era of autonomous and shared autonomous vehicles using simulation-based dynamic traffic assignment: The case of Budapest. Res. Transp. Econ. 2022, 95, 101231. [Google Scholar] [CrossRef]
  26. Li, M.; Wang, Y.; Peng, P.; Chen, Z. Toward efficient smart management: A review of modeling and optimization approaches in electric vehicle-transportation network-grid integration. Green Energy Intell. Transp. 2024. [Google Scholar] [CrossRef]
  27. Ziemsky, V.; Biedenbach, F. Attractiveness and business model potential of the spot market optimized charging of electric vehicles. Transp. Res. Procedia 2023, 70, 99–106. [Google Scholar] [CrossRef]
  28. Mansouri, S.A.; Paredes, Á.; González, J.M.; Aguado, J.A. A three-layer game theoretic-based strategy for optimal scheduling of microgrids by leveraging a dynamic demand response program designer to unlock the potential of smart buildings and electric vehicle fleets. Appl. Energy 2023, 347, 121440. [Google Scholar] [CrossRef]
  29. Bilbao, E.; Barrade, P.; Etxeberria-Otadui, I.; Rufer, A.; Luri, S.; Gil, I. Optimal Energy Management Strategy of an Improved Elevator with Energy Storage Capacity Based on Dynamic Programming. IEEE Trans. Ind. Appl. 2013, 50, 1233–1244. [Google Scholar] [CrossRef]
  30. Sheibani, M.R.; Yousefi, G.R.; Latify, M.A.; Dolatabadi, S.H. Energy storage system expansion planning in power systems: A review. IET Renew. Power Gener. 2018, 12, 1203–1221. [Google Scholar] [CrossRef]
  31. Abdulla, K.; de Hoog, J.; Muenzel, V.; Suits, F.; Steer, K.; Wirth, A.; Halgamuge, S. Optimal Operation of Energy Storage Systems Considering Forecasts and Battery Degradation. IEEE Trans. Smart Grid 2016, 9, 2086–2096. [Google Scholar] [CrossRef]
  32. Javadi, M.A.; Khodabakhshi, S.; Ghasemiasl, R.; Jabery, R. Sensitivity analysis of a multi-generation system based on a gas/hydrogen-fueled gas turbine for producing hydrogen, electricity and freshwater. Energy Convers. Manag. 2022, 252, 115085. [Google Scholar] [CrossRef]
  33. Abdalla, A.N.; Ju, Y.; Nazir, M.S.; Tao, H. A Robust Economic Framework for Integrated Energy Systems Based on Hybrid Shuffled Frog-Leaping and Local Search Algorithm. Sustainability 2022, 14, 10660. [Google Scholar] [CrossRef]
Figure 1. Microgrid system structure including an EV station.
Energies 17 04994 g001
Figure 2. Comparison of equivalent loads before and after EV access to the network.
Energies 17 04994 g002
Figure 3. Electricity pricing and costs under a time-of-use scheme.
Energies 17 04994 g003
Figure 4. The unit output and EV SOC in case 3.
Energies 17 04994 g004
Figure 5. Comparison of equivalent loads in different cases.
Energies 17 04994 g005
Figure 6. Comparison of dynamic and static carbon quota prices and equivalent loads.
Energies 17 04994 g006
Figure 7. Typical daily load curves for different numbers of EVs.
Energies 17 04994 g007
Table 1. Carbon quota-related parameters.
Carbon Quota-Related ParametersValue (kg/kW)
Micro-gas turbine0.6113
Electricity generated by the micro-gas turbine0.7110
Emissions per kilometer of fuel vehicles0.1962
Power purchased by the grid0.7202
Purchased from the grid0.8892
Table 2. Setting schemes for differences.
CaseConsiders Time-of-Use Electricity PricesConsiders Carbon Trading
1××
2×
3
Table 3. Peak-to-valley difference ratios in different cases.
CaseLoad Peak and Valley Difference (kW)User Income (USD)Microgrid Operating Cost (USD)
case 12655.6-54,353
case 22280.21549.357,262
case 31856.23683.254,390
Table 4. Comparison of different numbers of electric vehicles.
VehiclesPeak to Valley Difference (kW)Daily Load Variance (kW)
2002180.2137,370.0
2501998.7110,740.0
3001856.251,962.0
Disclaimer/Publisher’s Note: The statements, opinions and data contained in all publications are solely those of the individual author(s) and contributor(s) and not of MDPI and/or the editor(s). MDPI and/or the editor(s) disclaim responsibility for any injury to people or property resulting from any ideas, methods, instructions or products referred to in the content.

