Abstract
This study investigates a novel method of utilizing Direct Air Capture (DAC) technology for fertilizer production. Unlike traditional Direct Air Carbon Capture and Utilization (DACCU) technologies, Direct Air Carbon Capture for Fertilizers (FDAC) has the potential to produce fertilizers directly. This study aims to assess the feasibility of FDAC-based fertilizer production by examining the current state of traditional DAC technologies, evaluating the CO2 fixation potential of FDAC, and analyzing the decarbonization effect of producing fertilizers using FDAC. Our evaluation results indicate that CO2 emissions from producing 1 ton of conventional chemical fertilizer, FDAC fertilizer (current status), FDAC fertilizer with ingredient adjustment (sodium hydroxide), and FDAC fertilizer with ingredient adjustment (magnesium hydroxide) are 1.69, 1.12, 1.04, and 1.06 tons of CO2, respectively. The FDAC fertilizer (current status) emits 0.57 tons of CO2 per ton less than commercial fertilizers. FDAC fertilizers also have the potential to reduce CO2 emissions further when the fertilizer composition is adjusted, offering a promising solution for lowering the environmental impact of fertilizer production. Significant CO2 reduction can be expected by replacing conventional low-intensity chemical fertilizers with FDAC-produced fertilizers.
1. Introduction
Direct air capture (DAC) technology is an advanced technology that efficiently captures carbon dioxide (CO2) from the atmosphere and utilizes it for a variety of applications. This technology is realized using specific adsorption materials, solutions, and engineered system designs and can include carbon capture and storage (CCS) and carbon cycle utilization (CCU) [1]. The development of DAC technology is considered essential for combating global warming and reducing greenhouse gases; CCS, CCU, and other CO2 reduction methods focus primarily on controlling the source of emissions, and DAC is being touted as a new solution to remove CO2 already released into the atmosphere [1].
The main challenge of DAC technology is its high energy demand. Both alkali liquid absorption and solid adsorbent methods require large amounts of electricity and thermal energy to regenerate the adsorbent and drive the equipment. Therefore, priority use of renewable energy is required to increase the carbon reduction benefits of DAC [2]. This, in turn, limits the adoption of DAC technology and has greatly affected the development of DAC.
DAC technology has remarkable carbon reduction potential as an innovative way to capture CO2 directly from the atmosphere. Through technology optimization and policy support, DAC technology could become an important tool for addressing global climate change in the future.
Although DAC technology shows great potential in emission reduction, the existing Direct Air Carbon Capture and Utilization (DACCU) technology has several significant drawbacks. Firstly, the energy consumption issue with DACCU technology is particularly pronounced. While DAC technology can efficiently capture CO2, the methods involving alkaline liquid absorption and solid adsorbents require large amounts of electricity and thermal energy. This not only increases the operational costs but also limits the technology large-scale application [3].
Secondly, the current utilization process of captured carbon in DACCU technology often involves high-energy chemical conversion reactions, which may offset the carbon emission reductions achieved during capture. Additionally, the market for DACCU technology products is still immature, which raises concerns about its economic viability and sustainability [1,4].
Furthermore, the complexity of DACCU technology’s system design and equipment is another issue. The existing DACCU systems require complex engineering design and maintenance, increasing the difficulty of technology deployment. In practical applications, this complexity may lead to higher equipment failure rates, further impacting the overall efficiency and economics of the technology [5].
Therefore, although DACCU technology has potential in theory, its high energy consumption and system complexity pose challenges in practical applications. These shortcomings drive researchers to explore new ways to improve the technology’s energy efficiency, reduce costs, and simplify the system design.
In recent years, using CO2 captured by DAC technology for fertilizer production has become a new application area [6]. This method not only sequesters CO2 from the atmosphere but also provides an efficient and environmentally friendly production of fertilizer for the agricultural industry; the combination of DAC technology and fertilizer production can form a carbon cycle system that effectively reduces the carbon footprint of agricultural production.
This study was conducted to investigate a new method of using DAC technology with Direct Air Carbon Capture for Fertilizers (FDAC)-based fertilizer production technology. Unlike traditional DACCU technology, FDAC-based technology has potential for fertilizer production. This study aimed to evaluate the feasibility of producing fertilizers with FDAC-based technology and the effect of carbon removal.
The present study is organized as follows: Section 2 provides a literature review on DAC technology; Section 3 describes the technology used in this study to produce fertilizers via the FDAC method and the Life Cycle Carbon Dioxide (LCCO2) evaluation method; Section 4 analyzes and discusses the decarbonization effect of the technology used to produce fertilizers via the FDAC method or the effect of using fertilizers produced via the FDAC method. Moreover, this Section also proposes an adjustment scenario of the FDAC composition and calculates the decarbonization effect of the technology; and finally in Section 5, we summarize the results and provide proposals for practitioners. The outcomes of this study provide a new approach of using DAC technology in the production of fertilizers via the FDAC method.
2. Literature Review
2.1. Current Status of DAC Technology
The DAC technology is a cutting-edge solution for achieving net-zero in response to the global climate change, with the primary objective of capturing CO2 from the atmosphere and permanently storing or converting it into useful products, thereby reducing greenhouse gas emissions. The main difference between CCUS, which aims to capture and utilize CO2 emitted from large-scale CO2 emission sources such as power generation facilities and various types of factories, and DAC, which aims to remediate and absorb CO2 from the air, is that the remediation of atmospheric CO2 for stationary storage and utilization is referred to as DACCS or DACCU.
The development of DAC technology involves a variety of innovative technological routes and methods, including chemical absorption, solid adsorption, and electrochemical methods [7].
Chemical absorption methods utilize specific chemical absorbents, such as those utilized in amine solutions, to react with airborne CO2 and form carbonates or similar products [8]. This method has shown good CO2 capture efficiency in laboratory and small-scale tests but faces challenges in terms of its high energy consumption and cost.
Solid adsorption methods utilize solid materials with a high surface area, such as metal–organic frameworks [9] (MOFs) or porous adsorbents [10,11,12], to capture carbon dioxide directly from the air. These materials typically exhibit high capture efficiency at lower temperatures and have the potential to be recycled by adjusting the temperature to release the captured CO2.
Electrochemical methods [13,14,15] convert carbon dioxide from the air into other chemicals through an electrolytic reaction or store it on the surface of an electrode. These methods rely on the supply of electrical energy, involve high energy consumption, and require technological sophistication, but are highly controllable and selective, allowing for the customized production of chemical products.
2.2. Environmental Effects of DAC Technology
A comprehensive LCCO2 evaluation method is a key tool for assessing the environmental impacts of DACCU technologies. Through the LCCO2 evaluation methodology, one can comprehensively assess all carbon emissions of DACCU technologies from the construction of the facility to the operational phase, including the impacts of energy consumption, raw material use, and waste disposal. This comprehensive analysis will not only help one to understand the technology’s contribution to the overall carbon footprint, but also provide the data necessary to optimize design and operations.
In summary, the use of the LCCO2 assessment methodology provides a comprehensive understanding of the environmental impacts of DACCU technology, providing a scientific basis for decision makers, technology developers, and investors to promote the sustainable development and widespread application of this technology.
Compared with the LCCO2 assessment of CCUS technology, the existing studies on the environmental and economic evaluation of DAC are relatively rare but can still demonstrate the current status and topics of DAC technology. For example, in one study of LCCO2 evaluation of DAC technology [16], the GHG intensity of the grid power structure was found to be a key factor in determining the configuration of grid-coupled DACCS. In scenarios where renewable energy is not the main power supply energy source, the system-wide CO2 emission reduction was greatly affected. In addition, GHG emissions from CO2 storage and transportation were found to be significant. The relative contributions of storage and transportation to GHG emissions fluctuated between 11% and 52%, driven primarily by the electricity demand for CO2 compression, recompression, and injection, as well as by CO2 leakage during long-distance CO2 transportation.
2.3. Application of Replenished Carbon Dioxide in Production
CO2 captured in conventional CCUS has been utilized in a variety of fields. For example, in CCS, CO2 is injected into the ground or used in Enhanced Oil Recovery (EOR) technologies. In EOR, CO2 applications also include deep fracturing and sequestration of gas hydrate or shale reservoirs, which can also enable CO2 utilization and sequestration [17,18,19]. In CCU, CO2 has been attempted to be used to produce synthetic fuels, chemicals, and mineralization or to produce high-value products through electrochemical conversion. Additionally, the conversion of CO2 into biomass or other organic compounds using biotechnology such as microorganisms or plants is also a form of utilization of captured CO2. Other substances and organic compounds have also been targeted as a utilization output for the captured CO2 [20].
In addition, solid CO2, a stabilized form of carbonate, exhibits the advantages of chemical stability and long-term storage during adsorption. The application of solid CO2 to fertilizer production can effectively and permanently convert CO2 into components of organic fertilizers, thus achieving the goal of a circular carbon economy [6].
3. Research Methodology
This Section includes an introduction to FDAC fertilizers and the LCCO2 environmental assessment methodology used in this study.
3.1. Introduction to the FDAC Fertilizer
In FDAC fertilizer production technology, air is aspirated, the CO₂ concentration is reduced, and then CO₂ is converted using mineral fixation methods and stored and used as a fertilizer. The FDAC fertilizer consists of FDAC fertilizer raw material 1 (the main ingredient is sodium hydroxide), FDAC fertilizer raw material 2 (the main ingredient is magnesium hydroxide), and a chemical compound fertilizer.
The chemical formulas of the CO2 absorption processes are as follows:
With sodium hydroxide,
2NaOH + CO2 → Na2CO3 + H2O;
With magnesium hydroxide,
2Mg(OH)2 + CO2 → H2O + Mg2CO3(OH)2
The FDAC fertilizer is produced by mixing 50% of FDAC fertilizer raw material (Equation (1)), 35% of FDAC fertilizer raw material (Equation (2)), and 15% of a commercial chemical fertilizer through a manufacturing process in which CO2 is absorbed by the absorbent material.
Energy consumption in the fertilizers manufacturing process is 2 kW for processing and 5 kW/t for reaction agitation in the production of FDAC fertilizer raw material 1 (Equation (1)). The time and energy required to produce 1 t of FDAC fertilizer raw material 2 (Equation (2)) are 3 h/t and 40 kW/t using an electric furnace.
An image of the FDAC fertilizer production process is shown in Figure 1. Figure 2 shows the E-Plus DAC equipment.
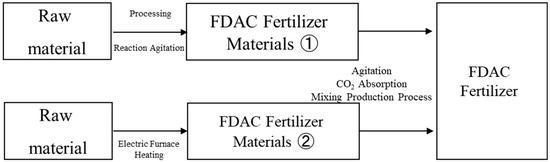
Figure 1.
Diagram of the FDAC fertilizer production process. FDAC Fertilizer Materials ① is with sodium hydroxide and FDAC Fertilizer Materials ② is with magnesium hydroxide.
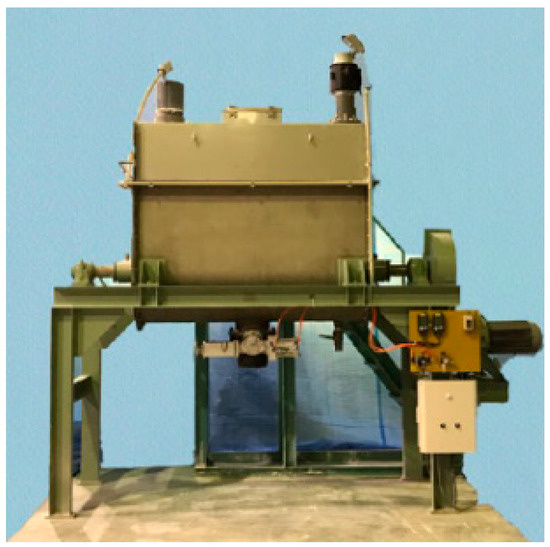
Figure 2.
E-plus DAC device [21].
The results of the property analysis of the produced FDAC fertilizer are shown in Table 1. The CO2 suction capacity data were obtained based on the CO2 absorption capacity and composition of the CO2 absorbing components in the fertilizer ratios provided by E-plus Co (Osaka, Japan).

Table 1.
FDAC fertilizer property analysis.
Based on the results of the property analysis of the FDAC fertilizer, the following can be observed:
- FDAC fertilizers are more effective at maintaining plant cells and tissues and promoting root growth than ordinary low-grade chemical compound fertilizers because of their highly soluble bitter soil content.
- The NPK content is lower than in low-temperature chemical fertilizers (if the purpose is to supplement NPK, the amount of fertilizer required will increase).
- FDAC fertilizers are alkaline.
- Although the NPK content is not sufficient to evaluate fertilizers simply because the fertilizer applied depends on the intended use, this study focused on the CO2 reduction effect of FDAC fertilizers and compared their performance with that of chemical compound fertilizers.
3.2. LCCO2 Environmental Evaluation Method
3.2.1. Evaluation Scope and Method
The scope of evaluation in this study covered the entire process from raw material production to product manufacturing, utilization, final treatment, and recirculation, including raw material acquisition and refinement, carbon fixation, product blending and manufacturing, transportation to Osaka city, and agricultural land utilization. For the part of sea transportation, the raw materials of the municipal chemical fertilizer used in this paper were transported to the port of Yokohama, Japan, via foreign countries. In order to make a more appropriate comparison with FDAC fertilizers, the final mixing site of the FDAC fertilizers was located in Osaka Prefecture, and they were transported by land from Yokohama Port to Osaka Prefecture. For the part of the land transportation of the FDAC fertilizers, this paper set the distance of each link based on the location of the demonstration plant, which contained sodium hydroxide, potassium silicate, sodium silicate, and magnesium hydroxide. Depending on the type of raw materials, sodium hydroxide was transported to Gifu City, Gifu Prefecture, for treatment, the rest of the raw materials were transported to Shirakawa City, Fukushima Prefecture, for treatment, and the treated materials were transported to the final treatment plant in Osaka Prefecture for treatment. The purpose of this evaluation was to determine whether the fertilizers produced by FDAC technology are more effective at reducing CO2 emissions than are conventional chemical fertilizers. The setup of the evaluation system is shown in Figure 3.
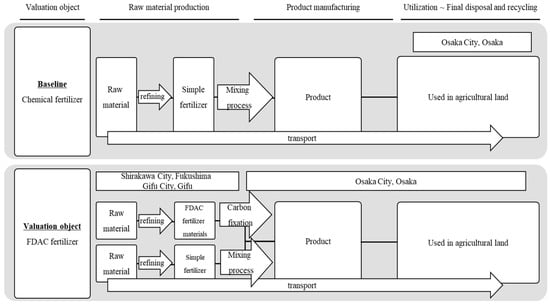
Figure 3.
LCCO2 evaluation system boundary.
We set the functional unit and evaluation details to evaluate fertilizers in general and to evaluate the LCCO2 of fertilizers as follow:
- Unit weight: the functional unit is the weight of the product, assuming that products are equally effective as fertilizers when used in the same quantity.
- Unit performance: the content of each of the three elements of the fertilizer—nitrogen (N), phosphorus (P), and potassium (K)—was used as the functional unit of performance.
In this study, a low-grade chemical compound fertilizer with an NPK ratio of 878 was used as a control.
3.2.2. Chemical Compound Fertilizer
In this study, a low-grade chemical compound fertilizer with an NPK ratio of 878 was used as a control. The detailed formulation of the chemical fertilizer 878 is shown in Table 2.
Table 2.
Chemical fertilizer 878 raw materials with cuts [22].
Inventory data on the calculations of the chemical fertilizer production process were collected through a literature review and are presented in Table 3.
Table 3.
Production process of chemical fertilizers, inventory data [23].
3.2.3. Transportation
The calculation of CO2 emissions from transportation in this study is shown in Figure 4.
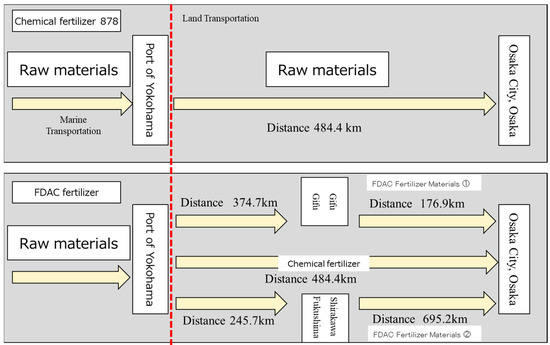
Figure 4.
Calculated CO2 emissions from transportation. FDAC Fertilizer Materials ① is with sodium hydroxide and FDAC Fertilizer Materials ② is with magnesium hydroxide.
3.2.4. CO2 Emissions Intensity
The CO2 emissions intensity used in this calculation was based on data from the Japan Carbon Footprint System Trial Project CO2 Equivalent Common Unit Database ver. 4 (domestic data) and the list of emission factors by electric utility of the Ministry of the Environment of Japan. The CO2 emissions intensity used is shown in Table 4 below as a value equivalent to the emissions from resource extraction to the products.
Table 4.
CO2 emissions intensity [24,25].
Due to the lack of data on potassium chloride as a raw material in the database, estimates were made through calculations (Table 5). For the estimation method, we referred to Hisashi Kobayashi [25] and calculated the carbon dioxide emissions associated with the transportation of potassium chloride based on the potassium chloride import volume in Japan in 2013 [24]. In the calculations presented in Table 5, we excluded land transportation within the country for potassium chloride production and focused on calculating the CO2 emission factor for maritime transportation of potassium chloride, specifically between ports. For calculations related to potassium chloride mining, we referred to mineral mining electricity consumption and energy consumption in potassium chloride refining [26] in Natural Resources Canada’s Energy Benchmarking [27] and calculated the CO2 emissions from the mining activities.
Table 5.
Estimated transportation energy consumption and CO2 emissions associated with potassium chloride transportation (using [28] data with a method previously described [25]).
4. Evaluation Results and Discussion
4.1. Results of the LCCO2 Evaluation for Unit Weight
We assumed equal effectiveness of the fertilizers when the same amount of fertilizer was used and used product weight as the functional unit (unit weight). Figure 5 shows the LCCO2 evaluation results for a 1 ton of chemical fertilizer and a 1 ton of FDAC fertilizer. The following results and insights were gained:
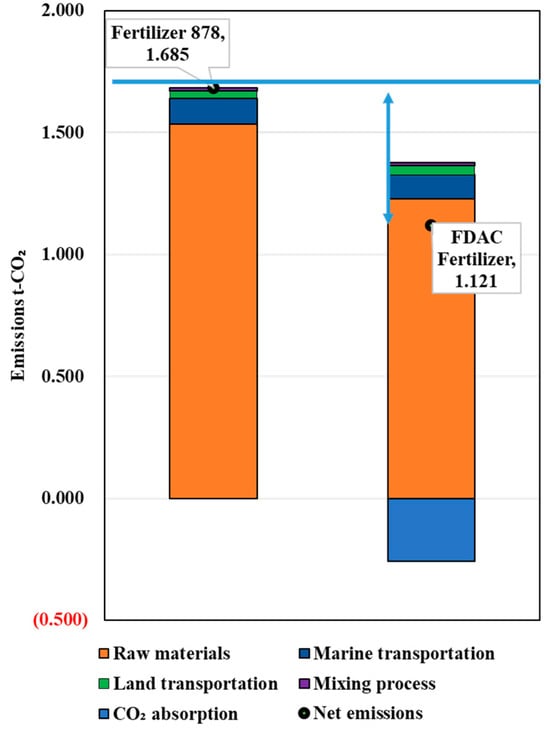
Figure 5.
LCCO2 evaluation results in terms of unit weight.
- (a)
- The CO2 emissions during the production of the chemical and FDAC fertilizers were 1.685 t-CO2/t-fertilizer and 1.121 t-CO2/t-fertilizer, respectively.
- (b)
- The results of the LCCO2 assessment of unit weight showed that the FDAC fertilizer emitted 0.57 t-CO2/t less CO2 than the control fertilizer.
- (c)
- Replacing the baseline commercial low-intensity chemical fertilizer with the FDAC fertilizer is expected to reduce CO2 emissions.
Regarding the reasons for the above evaluation results, fertilizer 878 comprises ammonium sulfate, liquid ammonia, calcium superphosphate, and potassium chloride, none of which possess CO2 absorption properties. Consequently, fertilizer 878 did not exhibit CO2 uptake capacity in the LCCO2 assessment. In contrast, the FDAC fertilizers demonstrated CO2 reduction due to the CO2 sequestration effects of their ingredients sodium hydroxide and magnesium hydroxide.
4.2. Results and Discussion of the LCCO2 Unit Performance Evaluation
To evaluate the content of each of the three elements in the fertilizer—nitrogen (N), phosphorus (P), and potassium (K)—as functional units, the CO2 emissions of the chemical compound fertilizers and FDAC fertilizers were evaluated with the same amount of unified NPK.
The calculation results of the amount of FDAC fertilizer that could provide the NPK replenishment performance of 1 t of chemical compound fertilizer are shown in Table 6. The results of CO2 emissions in the process of producing the chemical fertilizers, the FDAC fertilizers supplemented with N, the FDAC fertilizers supplemented with P, and the FDAC fertilizers supplemented with K are shown in Figure 6, Figure 7, Figure 8 and Figure 9. These values were 1.685, 5.108, 2.009, and 2.525 t-CO2/t-fertilizer, respectively.
Table 6.
Fertilizer demand by purpose.
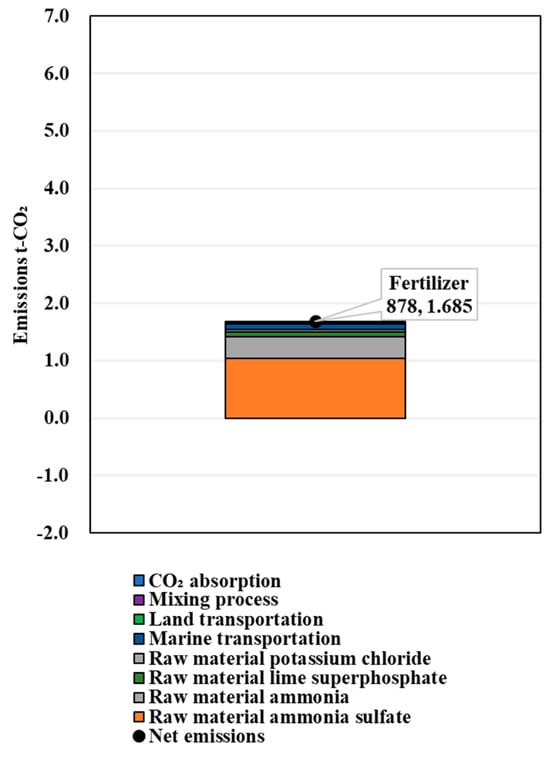
Figure 6.
Results of LCCO2 evaluation in unit performance (chemical compound fertilizer 878).
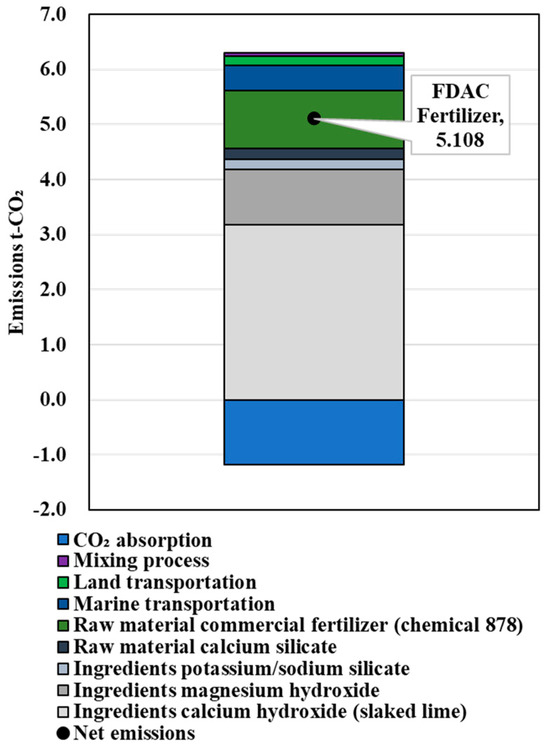
Figure 7.
Results of LCCO2 evaluation in unit performance (N).
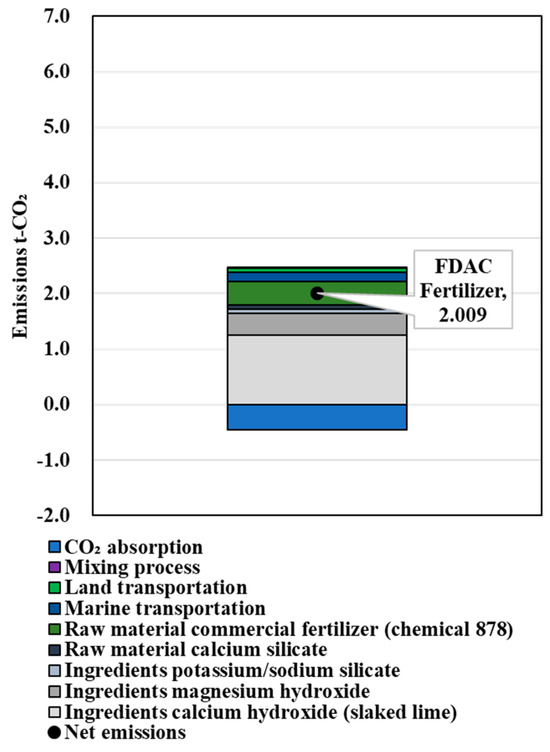
Figure 8.
Results of LCCO2 evaluation in unit performance (P).
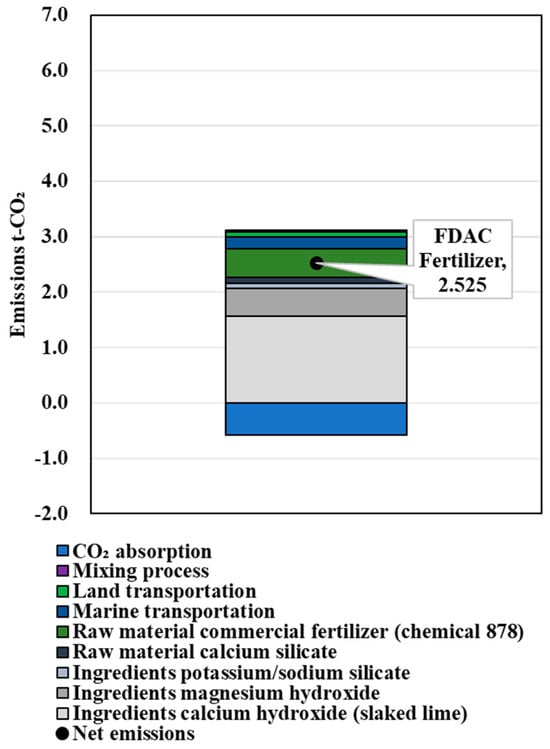
Figure 9.
Results of LCCO2 evaluation in unit performance (K).
The LCCO2 evaluation results for unit performance were as follows:
Since the NPK component of the FDAC fertilizer was lower than that of the control fertilizer, the demand increased for the NPK content objective. This was accompanied by an increase in CO2 emissions.
When used as a P fertilizer, it appeared possible to supply the same level of P with relatively close net emissions.
N and K are not desirable as supplemental fertilizers.
4.3. Results and Discussion of the Sensitivity Analysis of Electricity Emission Factors in the Assessment Scenarios
The CO2 emissions of the chemical fertilizers and FDAC fertilizers evaluated in this study can be divided into emissions from raw material production and emissions from electricity consumption in the manufacturing process. In particular, more electricity is consumed during the mining of potassium chloride than during the mixing and manufacturing process. Therefore, this study investigated the electricity composition of potassium chloride-producing countries, and the results are shown in Table 7. The calculated electricity CO2 emission factors for each country are shown in Table 8 and Figure 7.
Table 7.
Power supply composition by country [29,30].
Table 8.
Estimated electricity emissions intensity by country (kg-CO2/kWh).
A sensitivity analysis of the electricity emission factors for the evaluated scenarios was also performed. The results are shown in Figure 10. For both chemical fertilizers and FDAC fertilizers, the electricity emission intensity had a small impact on the overall emissions. Therefore, the comparison based on the emissions calculated for the tentative values set seems reasonable.
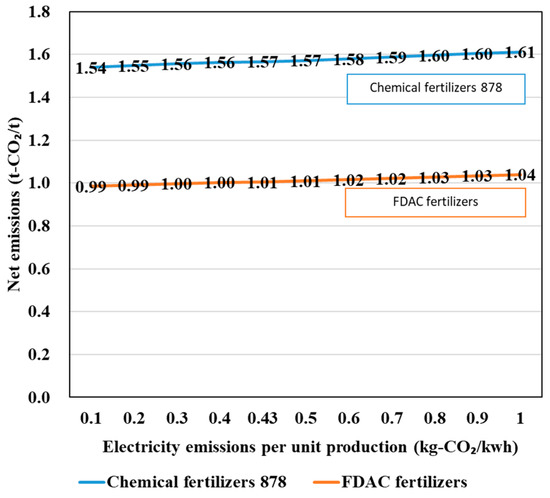
Figure 10.
Results of the sensitivity analysis of the electricity emission factors for the evaluated scenarios.
4.4. FDAC Fertilizer Component Adjustment
The results of the LCCO2 evaluation of unit performance in Section 4.2 of this study showed that the NPK element supplementation performance of the FDAC fertilizers was deficient compared to that of the chemical fertilizers. The CO2 emissions of the FDAC fertilizers (component adjustment (Equation (1))) and FDAC fertilizers (component adjustment (Equation (2))) produced by adding urea and ammonium nitrate as N sources, lime superphosphate as a P source, and potassium chloride as a K source, which were used as single fertilizers for component adjustment, were compared and evaluated. The NPK element content of the added single fertilizers and their respective emission factors are shown in Table 9.
Table 9.
Properties of single fertilizers for component adjustment [26].
The composition of the FDAC fertilizer after component adjustment is shown in Table 10.
Table 10.
FDAC fertilizer component percentage (weight).
The results of the LCCO2 assessment of CO2 emissions in the production of the FDAC fertilizers (1) and (2) after component adjustment are shown in Figure 11.
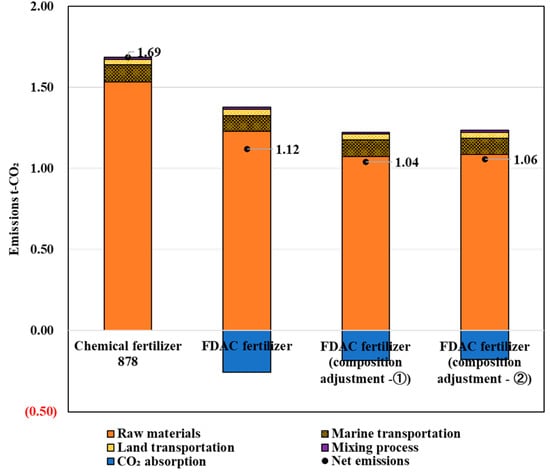
Figure 11.
LCCO2 evaluation results of FDAC fertilizers with component adjustments.
The evaluation results showed that the CO2 emissions in the process of producing 1 t of 878 chemical fertilizer, FDAC fertilizer (current status), FDAC fertilizer (ingredient adjustment (Equation (1))), and FDAC fertilizer (ingredient adjustment (Equation (2))) were 1.69, 1.12, 1.04, and 1.06 t-CO2, respectively.
In summary, the FDAC fertilizers have the potential to reduce CO2 emissions beyond the current level if their composition is adjusted. At the same time, they could have the same level of NPK element replenishment performance as chemical fertilizers.
5. Conclusions
This study evaluated the decarbonization benefits of a process that fixes CO2 and produces fertilizers using Direct Air Capture and Carbon Utilization (DACCU) technology in a small-scale FDAC plant. The results showed that the evaluated fertilizers produced by FDAC technology emitted 0.57 tons less CO2 per ton than those produced by the commercial fertilizer production process. This indicates that replacing baseline commercial low-intensity chemical fertilizers with FDAC fertilizers can be expected to reduce CO2 emissions. Furthermore, it was confirmed that changes in the electricity emission factor did not have a significant impact.
On the other hand, to evaluate the contents of nitrogen (N), phosphorus (P), and potassium (K), the major components of fertilizers, as functional units, the CO2 emissions of the chemical compound fertilizers and FDAC fertilizers were compared by standardizing the amount of NPK. Since the NPK content of the FDAC fertilizers was lower than that of the control, when the NPK content was the objective, the amount of fertilizer required increased, resulting in a corresponding increase in CO2 emissions. In particular, the results indicated that FDAC fertilizers are not suitable for use as supplemental fertilizers for N and K, although they may be able to provide the same level of P with relatively close net emissions when used as P fertilizers.
In contrast, the results suggest that FDAC fertilizers have the potential to further reduce CO2 emission compared with the current FDAC fertilizers if NPK elements are supplemented through component adjustment. Future research is expected to develop a more efficient and environmentally friendly fertilizer production technology through further component adjustment and process optimization.
This study demonstrated the potential of DACCU technology as a complement to conventional DAC technology, which is not limited by high cost or energy consumption challenges. This technology is expected to be less dependent on regional and climatic conditions and to have few social acceptability issues. Therefore, similar small-scale and decentralized DACCU technologies could be promising options for building a decarbonized society.
There are several limitations to this study. First, data collection relied heavily on publicly available CO2 emissions data, leaving space for further refinement and completeness. Second, because of the study’s cross-sectional design, we could not capture dynamic effects over time; we could only provide analytical results at a certain time. In addition, while we tried our best to control for the effects of other factors, the policy environment and market conditions in different countries or regions may lead to limitations in the external validity of the results.
Specific future perspectives include the following:
- Conducting demonstration trials: it is important to verify the effectiveness of FDAC fertilizers in actual agricultural fields and to assess their long-term CO2 reduction and impact on crops.
- Economic evaluation: a detailed cost-effectiveness evaluation of FDAC fertilizers and cost comparisons between FDAC fertilizers and conventional fertilizers should be conducted to determine their commercial feasibility.
- Scale-up of the technology: a scale-up of the technology from small to large scale is necessary, with the aim of establishing a mass production system and reducing costs; a larger scale of the technology is expected to increase the diffusion and commercialization of FDAC technology and contribute to the realization of sustainable agriculture and a decarbonized society.
Author Contributions
Conceptualization, T.C. and H.O.; methodology, T.C. and H.O.; software, T.C.; validation, T.C., A.H.P. and H.O.; formal analysis, T.C.; investigation, T.C., A.H.P. and H.O.; resources, T.H.; data curation, T.C. and H.O.; writing—original draft preparation, T.C., A.H.P. and H.O.; writing—review and editing, T.C. and A.H.P.; visualization, T.C.; supervision, H.O., A.H.P. and T.H.; project administration, H.O. and T.H.; funding acquisition, A.H.P., H.O. and T.H. All authors have read and agreed to the published version of the manuscript.
Funding
This research received no external funding.
Data Availability Statement
Data will be made available upon reasonable request.
Acknowledgments
This study summarizes some of the results of a joint research project with E-Plus Corporation. We would like to thank all the involved parties for their cooperation and guidance.
Conflicts of Interest
Author Takeji Hirota was employed by E-Plus Co. The remaining authors declare that the research was conducted in the absence of any commercial or financial relationships that could be construed as potential conflicts of interest.
References
- Erans, M.; Sanz-Pérez, E.S.; Hanak, D.P.; Clulow, Z.; Reiner, D.M.; Mutch, G.A. Direct Air Capture: Process Technology, Techno-Economic and Socio-Political Challenges. Energy Environ. Sci. 2022, 15, 1360–1405. [Google Scholar] [CrossRef]
- Mostafa, M.; Antonicelli, C.; Varela, C.; Barletta, D.; Zondervan, E. Capturing CO2 from the Atmosphere: Design and Analysis of a Large-Scale DAC Facility. Carbon Capture Sci. Technol. 2022, 4, 100060. [Google Scholar] [CrossRef]
- Breyer, C.; Fasihi, M.; Bajamundi, C.; Creutzig, F. Direct Air Capture of CO2: A Key Technology for Ambitious Climate Change Mitigation. Joule 2019, 3, 2053–2057. [Google Scholar] [CrossRef]
- Gambhir, A.; Tavoni, M. Direct Air Carbon Capture and Sequestration: How It Works and How It Could Contribute to Climate-Change Mitigation. One Earth 2019, 1, 405–409. [Google Scholar] [CrossRef]
- McQueen, N.; Gomes, K.V.; McCormick, C.; Blumanthal, K.; Pisciotta, M.; Wilcox, J. A Review of Direct Air Capture (DAC): Scaling up Commercial Technologies and Innovating for the Future. Prog. Energy 2021, 3, 032001. [Google Scholar] [CrossRef]
- Milani, D.; Kiani, A.; Haque, N.; Giddey, S.; Feron, P. Green Pathways for Urea Synthesis: A Review from Australia’s Perspective. Sustain. Chem. Clim. Action 2022, 1, 100008. [Google Scholar] [CrossRef]
- Sanz-Pérez, E.S.; Murdock, C.R.; Didas, S.A.; Jones, C.W. Direct Capture of CO2 from Ambient Air. Chem. Rev. 2016, 116, 11840–11876. [Google Scholar] [CrossRef]
- Barzagli, F.; Giorgi, C.; Mani, F.; Peruzzini, M. Screening Study of Different Amine-Based Solutions as Sorbents for Direct CO2 Capture from Air. ACS Sustain. Chem. Eng. 2020, 8, 14013–14021. [Google Scholar] [CrossRef]
- Sadiq, M.M.; Batten, M.P.; Mulet, X.; Freeman, C.; Konstas, K.; Mardel, J.I.; Tanner, J.; Ng, D.; Wang, X.; Howard, S.; et al. A Pilot-Scale Demonstration of Mobile Direct Air Capture Using Metal-Organic Frameworks. Adv. Sustain. Syst. 2020, 4, 2000101. [Google Scholar] [CrossRef]
- Zhang, Y.; Zhao, S.; Li, L.; Feng, J.; Qiu, W.; Wei, Z.; Li, X.; Huang, Z.; Lin, H. Revealing the Correlation between the Performance of Silica-Based DAC Adsorbents and Their Pore Natures. Gas Sci. Eng. 2024, 123, 205251. [Google Scholar] [CrossRef]
- Wu, J.; Zhu, X.; Chen, Y.; Wang, R.; Ge, T. The Analysis and Evaluation of Direct Air Capture Adsorbents on the Material Characterization Level. Chem. Eng. J. 2022, 450, 137958. [Google Scholar] [CrossRef]
- Madden, D.G.; Scott, H.S.; Kumar, A.; Chen, K.-J.; Sanii, R.; Bajpai, A.; Lusi, M.; Curtin, T.; Perry, J.J.; Zaworotko, M.J. Flue-Gas and Direct-Air Capture of CO2 by Porous Metal–Organic Materials. Phil. Trans. R. Soc. A 2017, 375, 20160025. [Google Scholar] [CrossRef] [PubMed]
- Gutiérrez-Sánchez, O.; De Mot, B.; Daems, N.; Bulut, M.; Vaes, J.; Pant, D.; Breugelmans, T. Electrochemical Conversion of CO2 from Direct Air Capture Solutions. Energy Fuels 2022, 36, 13115–13123. [Google Scholar] [CrossRef]
- Shu, Q.; Legrand, L.; Kuntke, P.; Tedesco, M.; Hamelers, H.V.M. Electrochemical Regeneration of Spent Alkaline Absorbent from Direct Air Capture. Environ. Sci. Technol. 2020, 54, 8990–8998. [Google Scholar] [CrossRef] [PubMed]
- Muroyama, A.P.; Pătru, A.; Gubler, L. Review—CO2 Separation and Transport via Electrochemical Methods. J. Electrochem. Soc. 2020, 167, 133504. [Google Scholar] [CrossRef]
- Terlouw, T.; Treyer, K.; Bauer, C.; Mazzotti, M. Life Cycle Assessment of Direct Air Carbon Capture and Storage with Low-Carbon Energy Sources. Environ. Sci. Technol. 2021, 55, 11397–11411. [Google Scholar] [CrossRef]
- Du, F.; Nojabaei, B. A Review of Gas Injection in Shale Reservoirs: Enhanced Oil/Gas Recovery Approaches and Greenhouse Gas Control. Energies 2019, 12, 2355. [Google Scholar] [CrossRef]
- Li, Q.; Han, Y.; Ansari, U.; Cheng, Y.; Yan, C. Hydrate as a By-Product in CO2 Leakage during the Long-Term Sub-Seabed Sequestration and Its Role in Preventing Further Leakage. Environ. Sci. Pollut. Res. 2022, 29, 77737–77754. [Google Scholar] [CrossRef]
- Li, Q.; Wang, Y.; Wang, Y.; San, J.; Li, Q.; Foster, G. Synthetic Process on Hydroxyl-Containing Polydimethylsiloxane as a Thickener in CO2 Fracturing and Thickening Performance Test. Energy Sources Part A Recovery Util. Environ. Eff. 2018, 40, 1137–1143. [Google Scholar] [CrossRef]
- Jiang, L.; Liu, W.; Wang, R.Q.; Gonzalez-Diaz, A.; Rojas-Michaga, M.F.; Michailos, S.; Pourkashanian, M.; Zhang, X.J.; Font-Palma, C. Sorption Direct Air Capture with CO2 Utilization. Prog. Energy Combust. Sci. 2023, 95, 101069. [Google Scholar] [CrossRef]
- E-Plus Corporation Website. Available online: http://eplus32.co.jp/technology/358/ (accessed on 22 March 2024).
- Noguchi, T. Caking and its Prevention of the Granular Mixed Fertilizers. J. Res. Assoc. Powder Tech. 1970, 7, 545–553. [Google Scholar] [CrossRef]
- Fadare, D.A.; Bamiro, O.A.; Oni, A.O. Energy and Cost Analysis of Organic Fertilizer Production in Nigeria. Energy 2010, 35, 332–340. [Google Scholar] [CrossRef]
- Japan Ministry of the Environment List of Emission Factors by Electric Utility. Available online: https://ghg-santeikohyo.env.go.jp/files/calc/r05_coefficient_rev4.pdf (accessed on 18 September 2024).
- Kobayashi, H.; Sago, R. A Study on Life Cycle Assessment of Energy Consumption and CO2 Emissions in the Manufacturing and Transportation Processes of Nitrogen and Phosphate Fertilizers. Jpn. J. Farm Work Res. 2001, 36, 141–151. [Google Scholar] [CrossRef][Green Version]
- Davis, J.; Haglund, C. Life Cycle Inventory (LCI) of Fertiliser Production: Fertiliser Products Used in Sweden and Western Europe; SIK: Chalmers University of Technology. Department of Chemical Environmental Science, Institutionen för livsmedelsvetenskap (Göteborg), Swedish Institute for foood and Biotechnology; Institut för Livsmdel och Bioteknik, CTH: Göteborg, Sweden, 1999; ISBN 91-7290-196-9. [Google Scholar]
- The Canadian Fertilizer Institute (CFI). Energy Benchmarking:—Canadian Potash Production Facilities. Available online: https://natural-resources.canada.ca/sites/www.nrcan.gc.ca/files/oee/pdf/publications/infosource/pub/cipec/Potash-production/potashE.pdf (accessed on 18 September 2024).
- Jogmeg Mineral Resources Information Mineral Resource Material Flow. 2014. Available online: https://mric.jogmec.go.jp/public/report/2015-03/32_201504_K.pdf (accessed on 22 March 2024).
- General Incorporated Association: Overseas Electric Power Research Institute. Electricity Industry in Each Country (Major Countries). Available online: https://www.jepic.or.jp/data/w2022/w00.html (accessed on 7 May 2024).
- The Agency for Natural Resources and Energy (Japan), T.A. for N.R. and E. Comparison of the Energy Supply Structures of Major Countries. Available online: https://www.enecho.meti.go.jp/category/electricity_and_gas/electric/denkijigyobinran/pdf/2017_03.pdf (accessed on 7 May 2024).
Disclaimer/Publisher’s Note: The statements, opinions and data contained in all publications are solely those of the individual author(s) and contributor(s) and not of MDPI and/or the editor(s). MDPI and/or the editor(s) disclaim responsibility for any injury to people or property resulting from any ideas, methods, instructions or products referred to in the content. |
© 2024 by the authors. Licensee MDPI, Basel, Switzerland. This article is an open access article distributed under the terms and conditions of the Creative Commons Attribution (CC BY) license (https://creativecommons.org/licenses/by/4.0/).