
Impacts of Electric Vehicles Charging in Low-Voltage Distribution Networks: A Case Study in Malta

Abstract
:1. Introduction
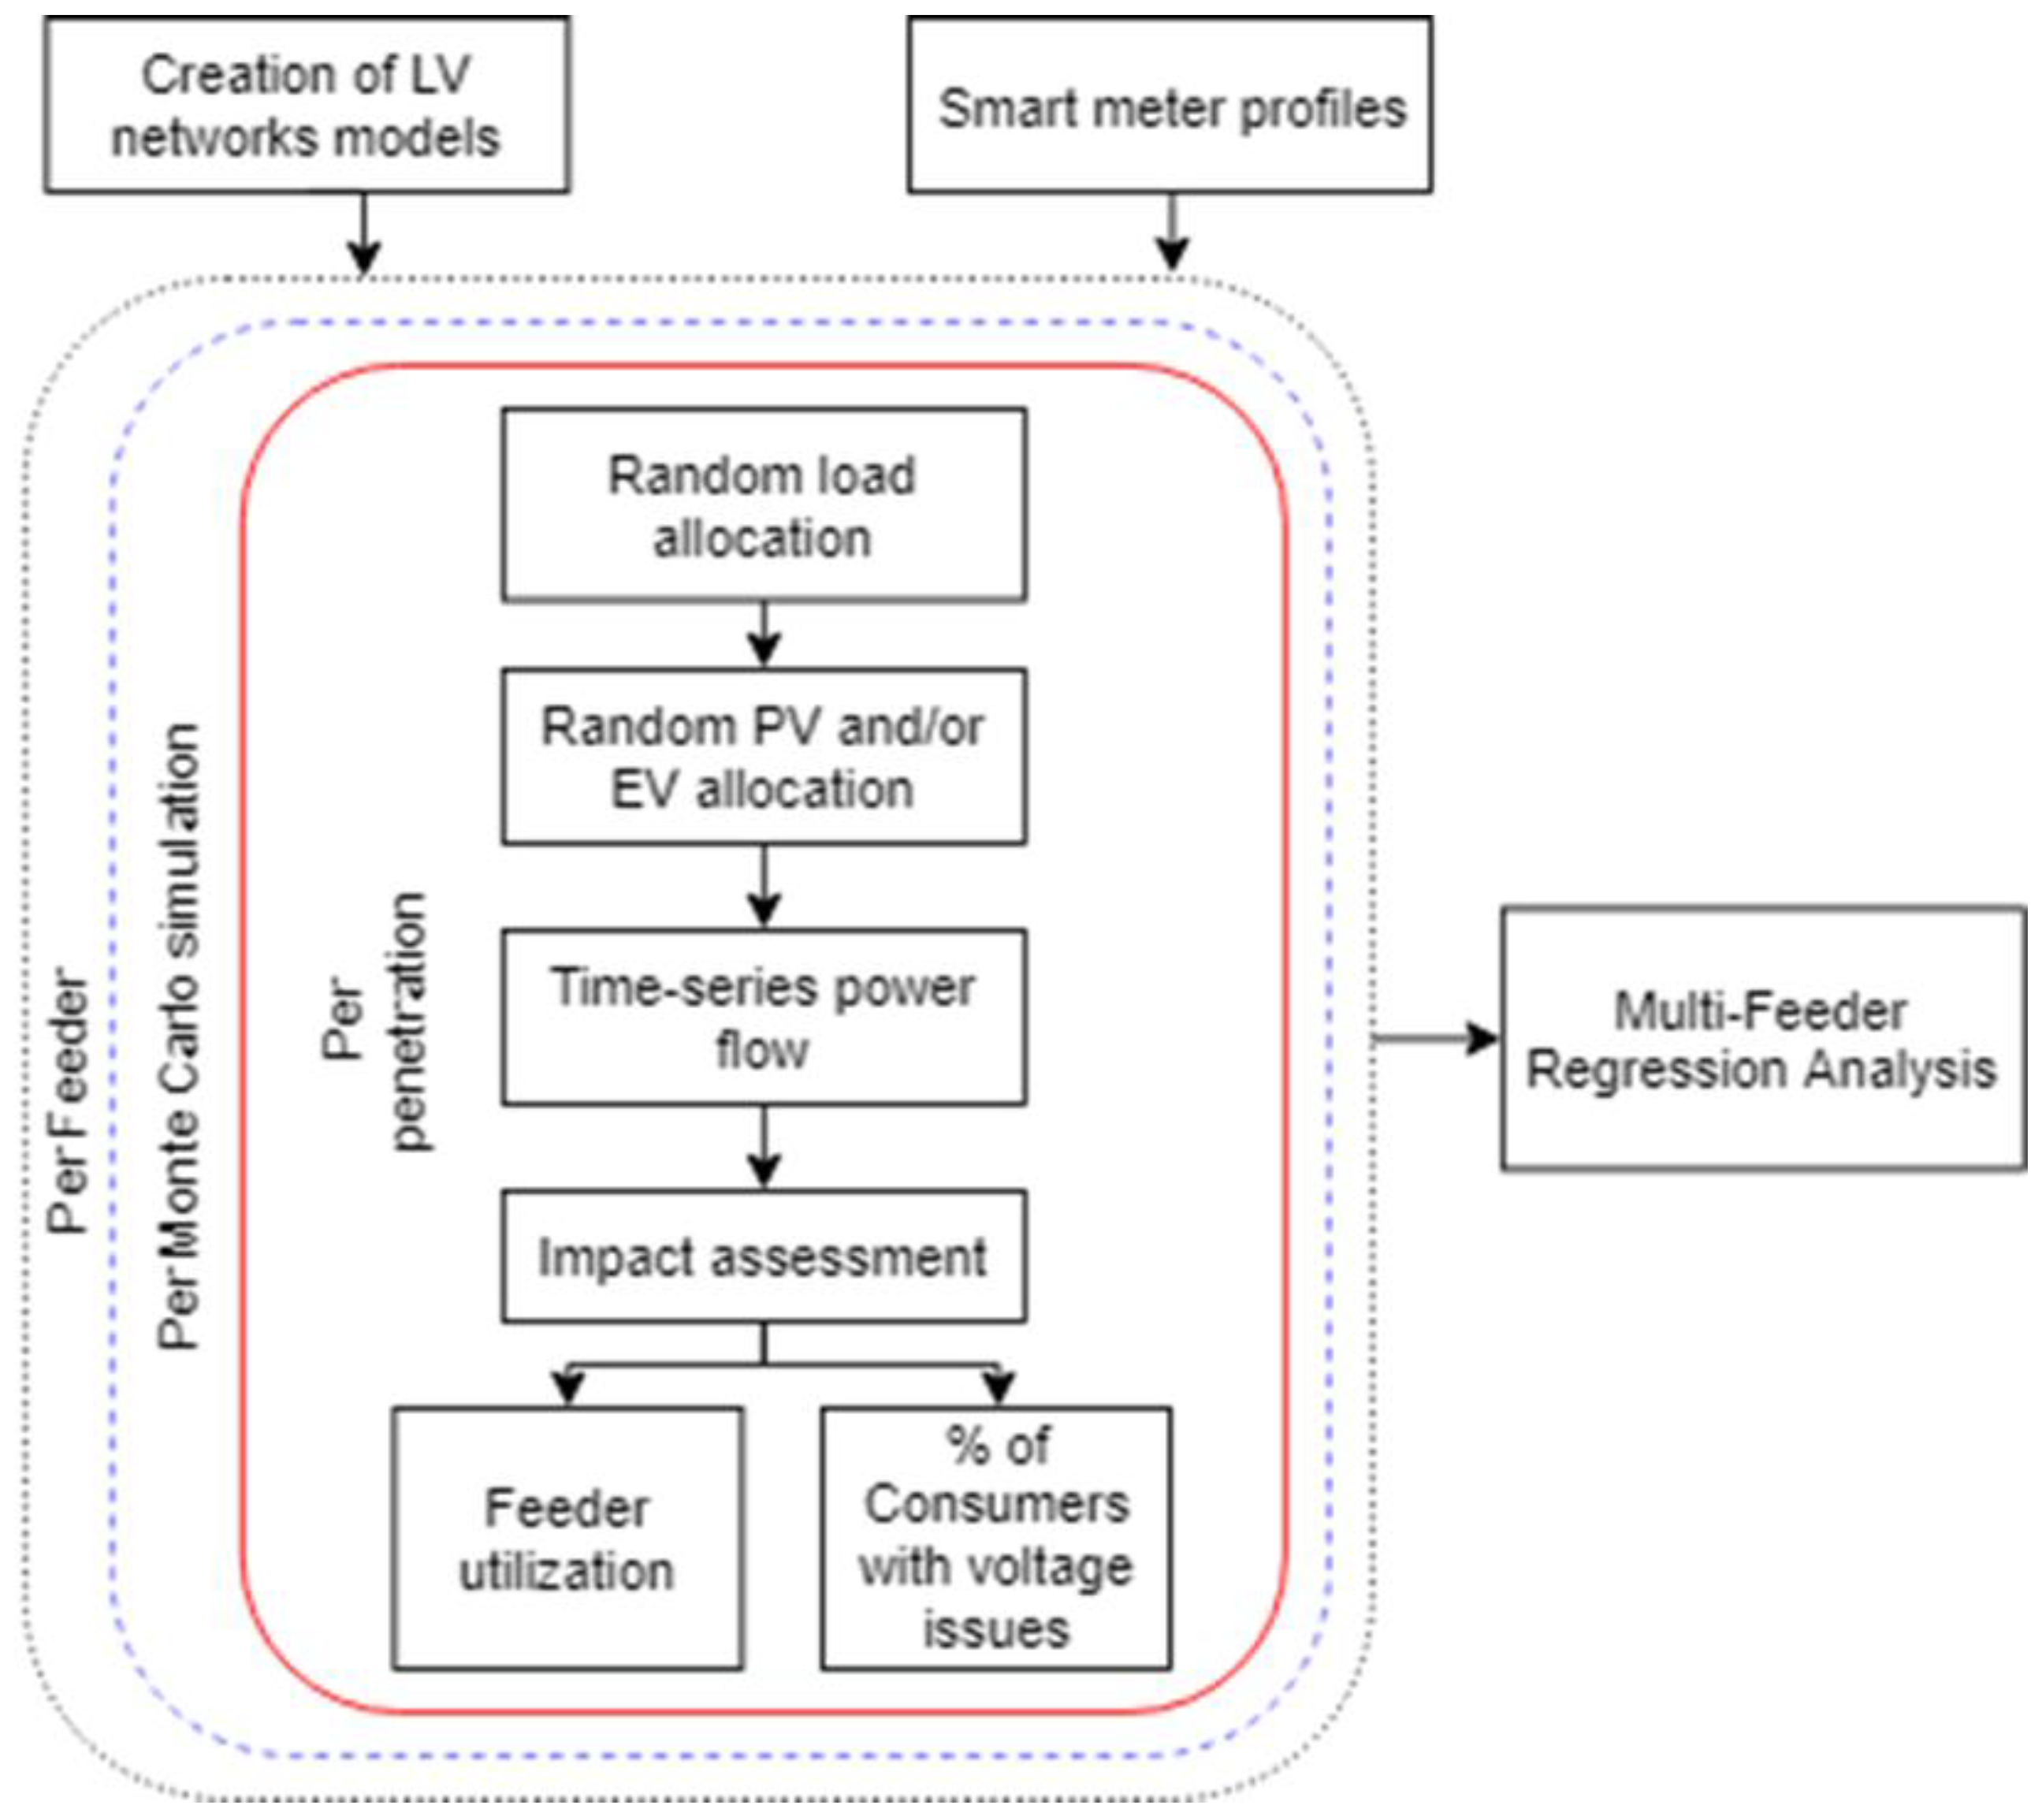
2. The Methodology-Based Framework
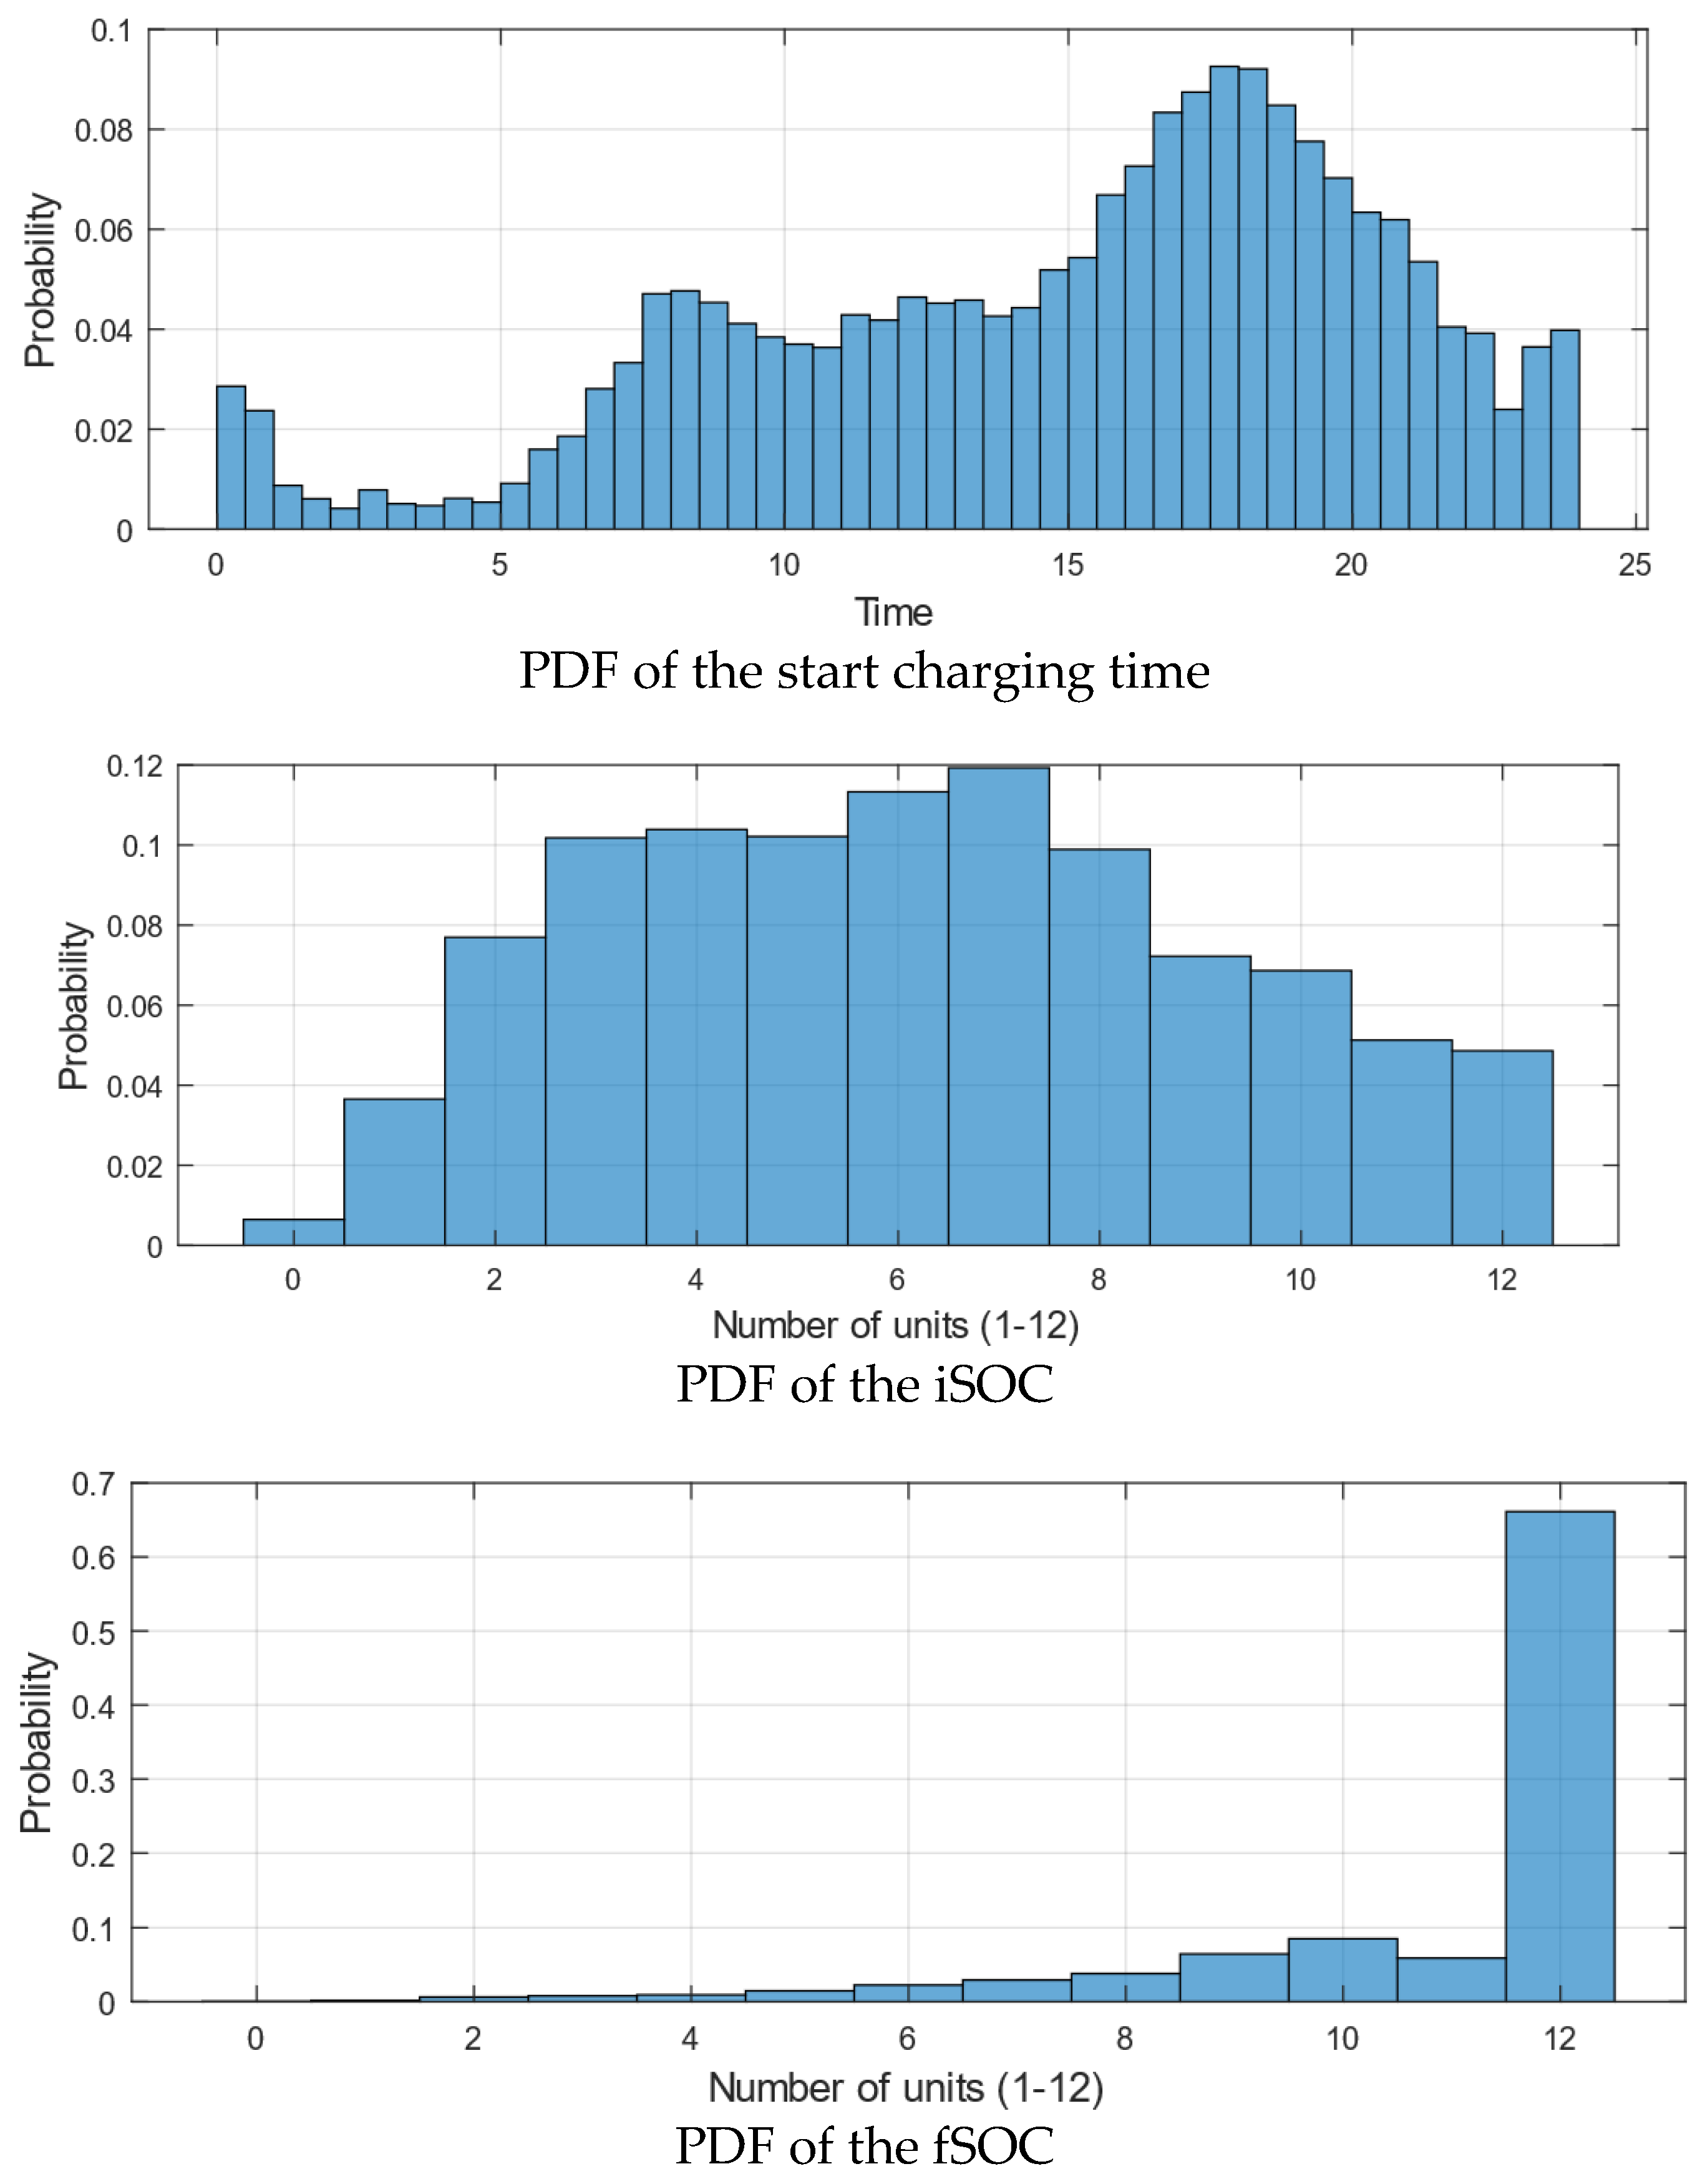
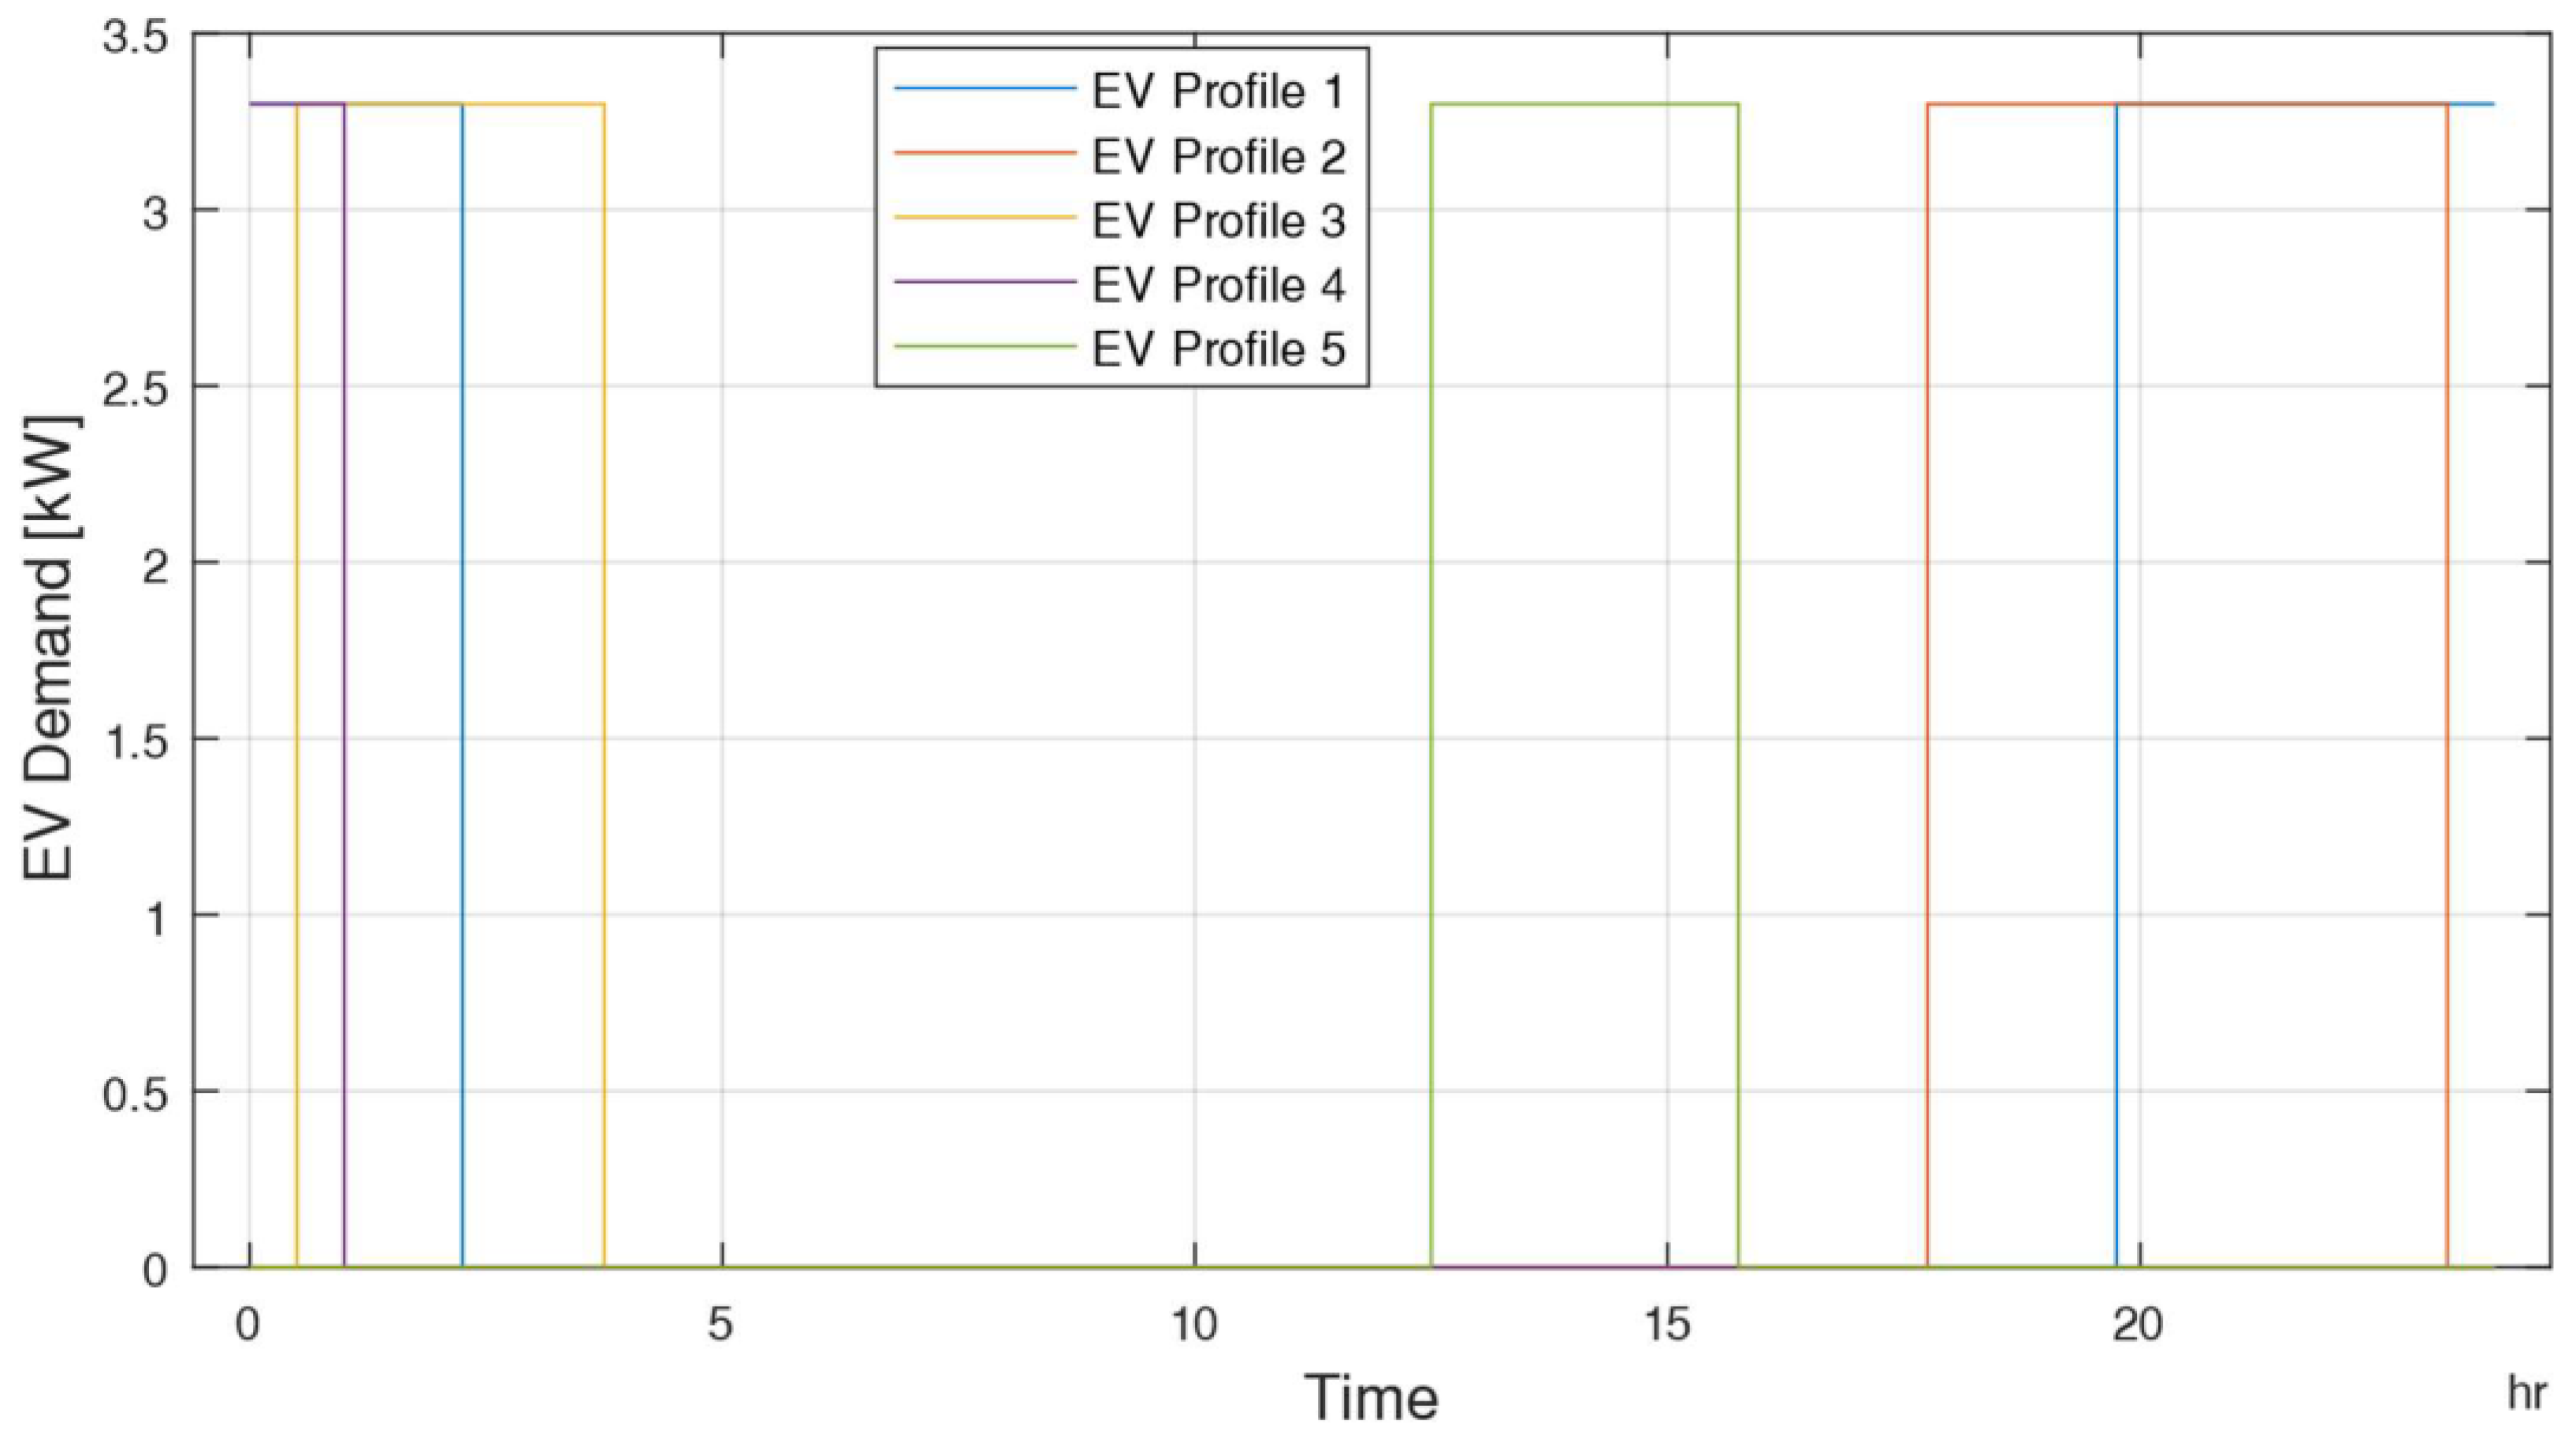
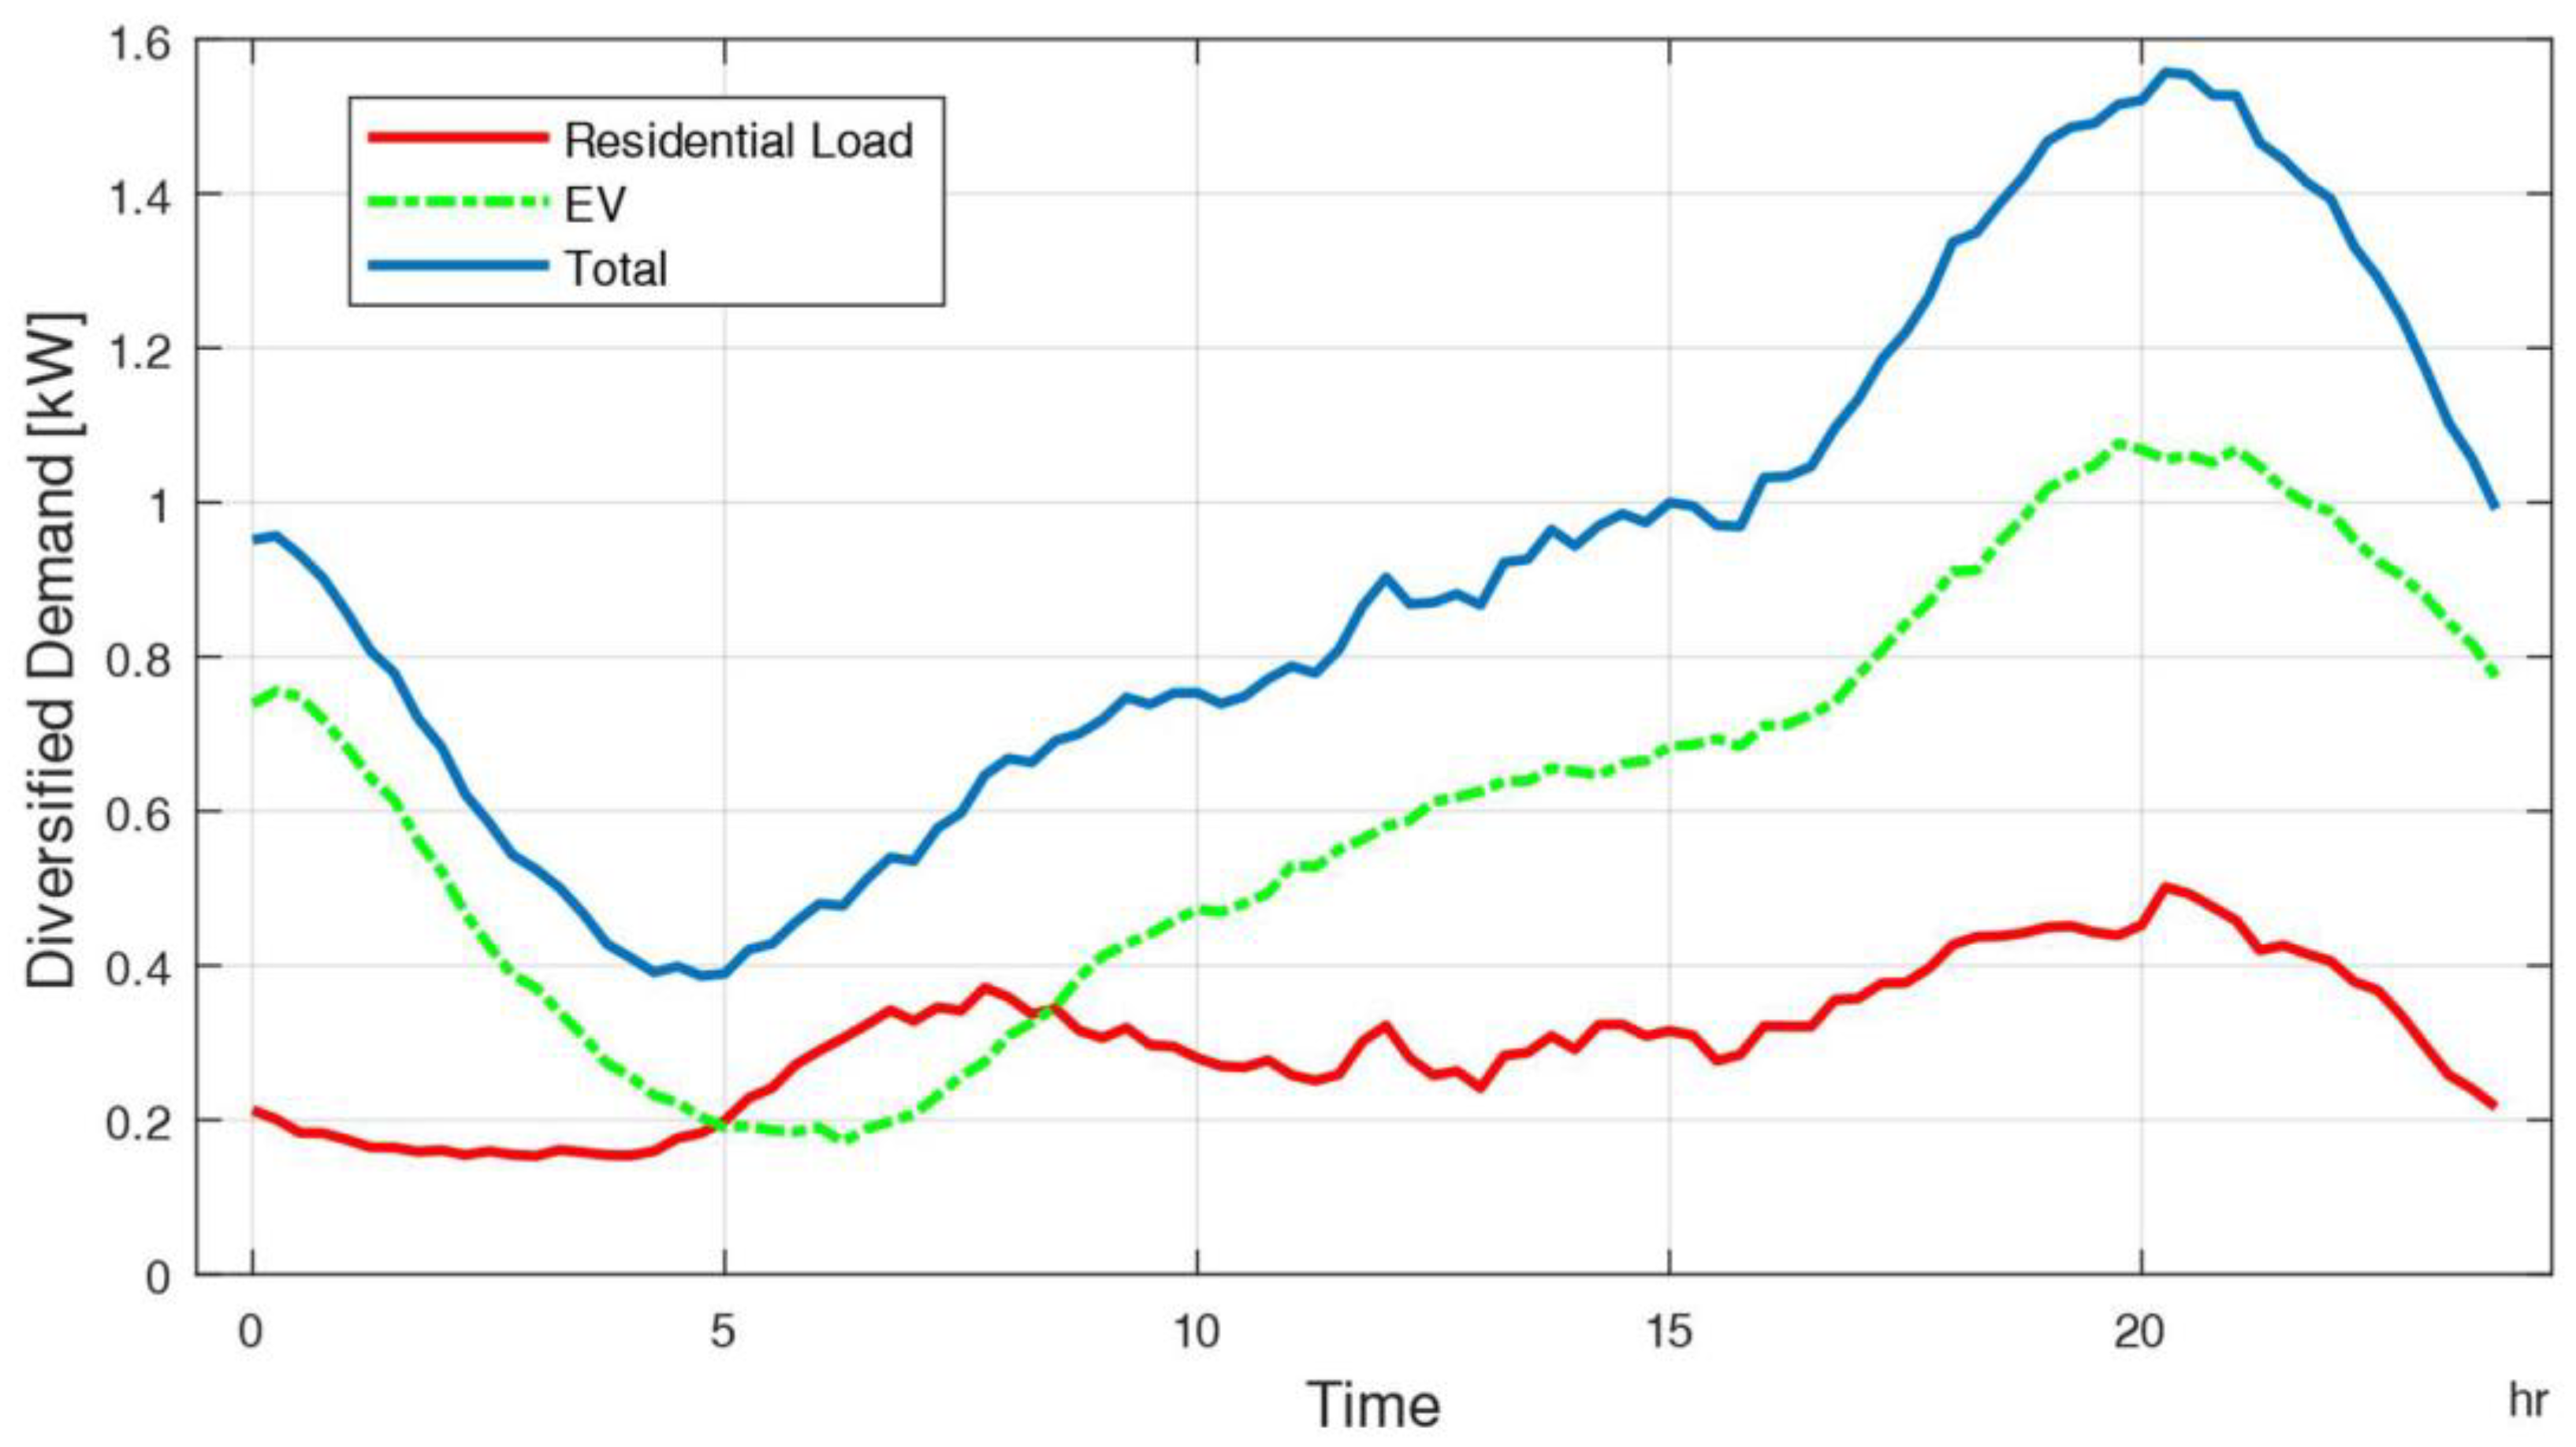
2.1. Data Energy Profiles
2.2. Impact Assessment
3. Application of the Methodology Framework
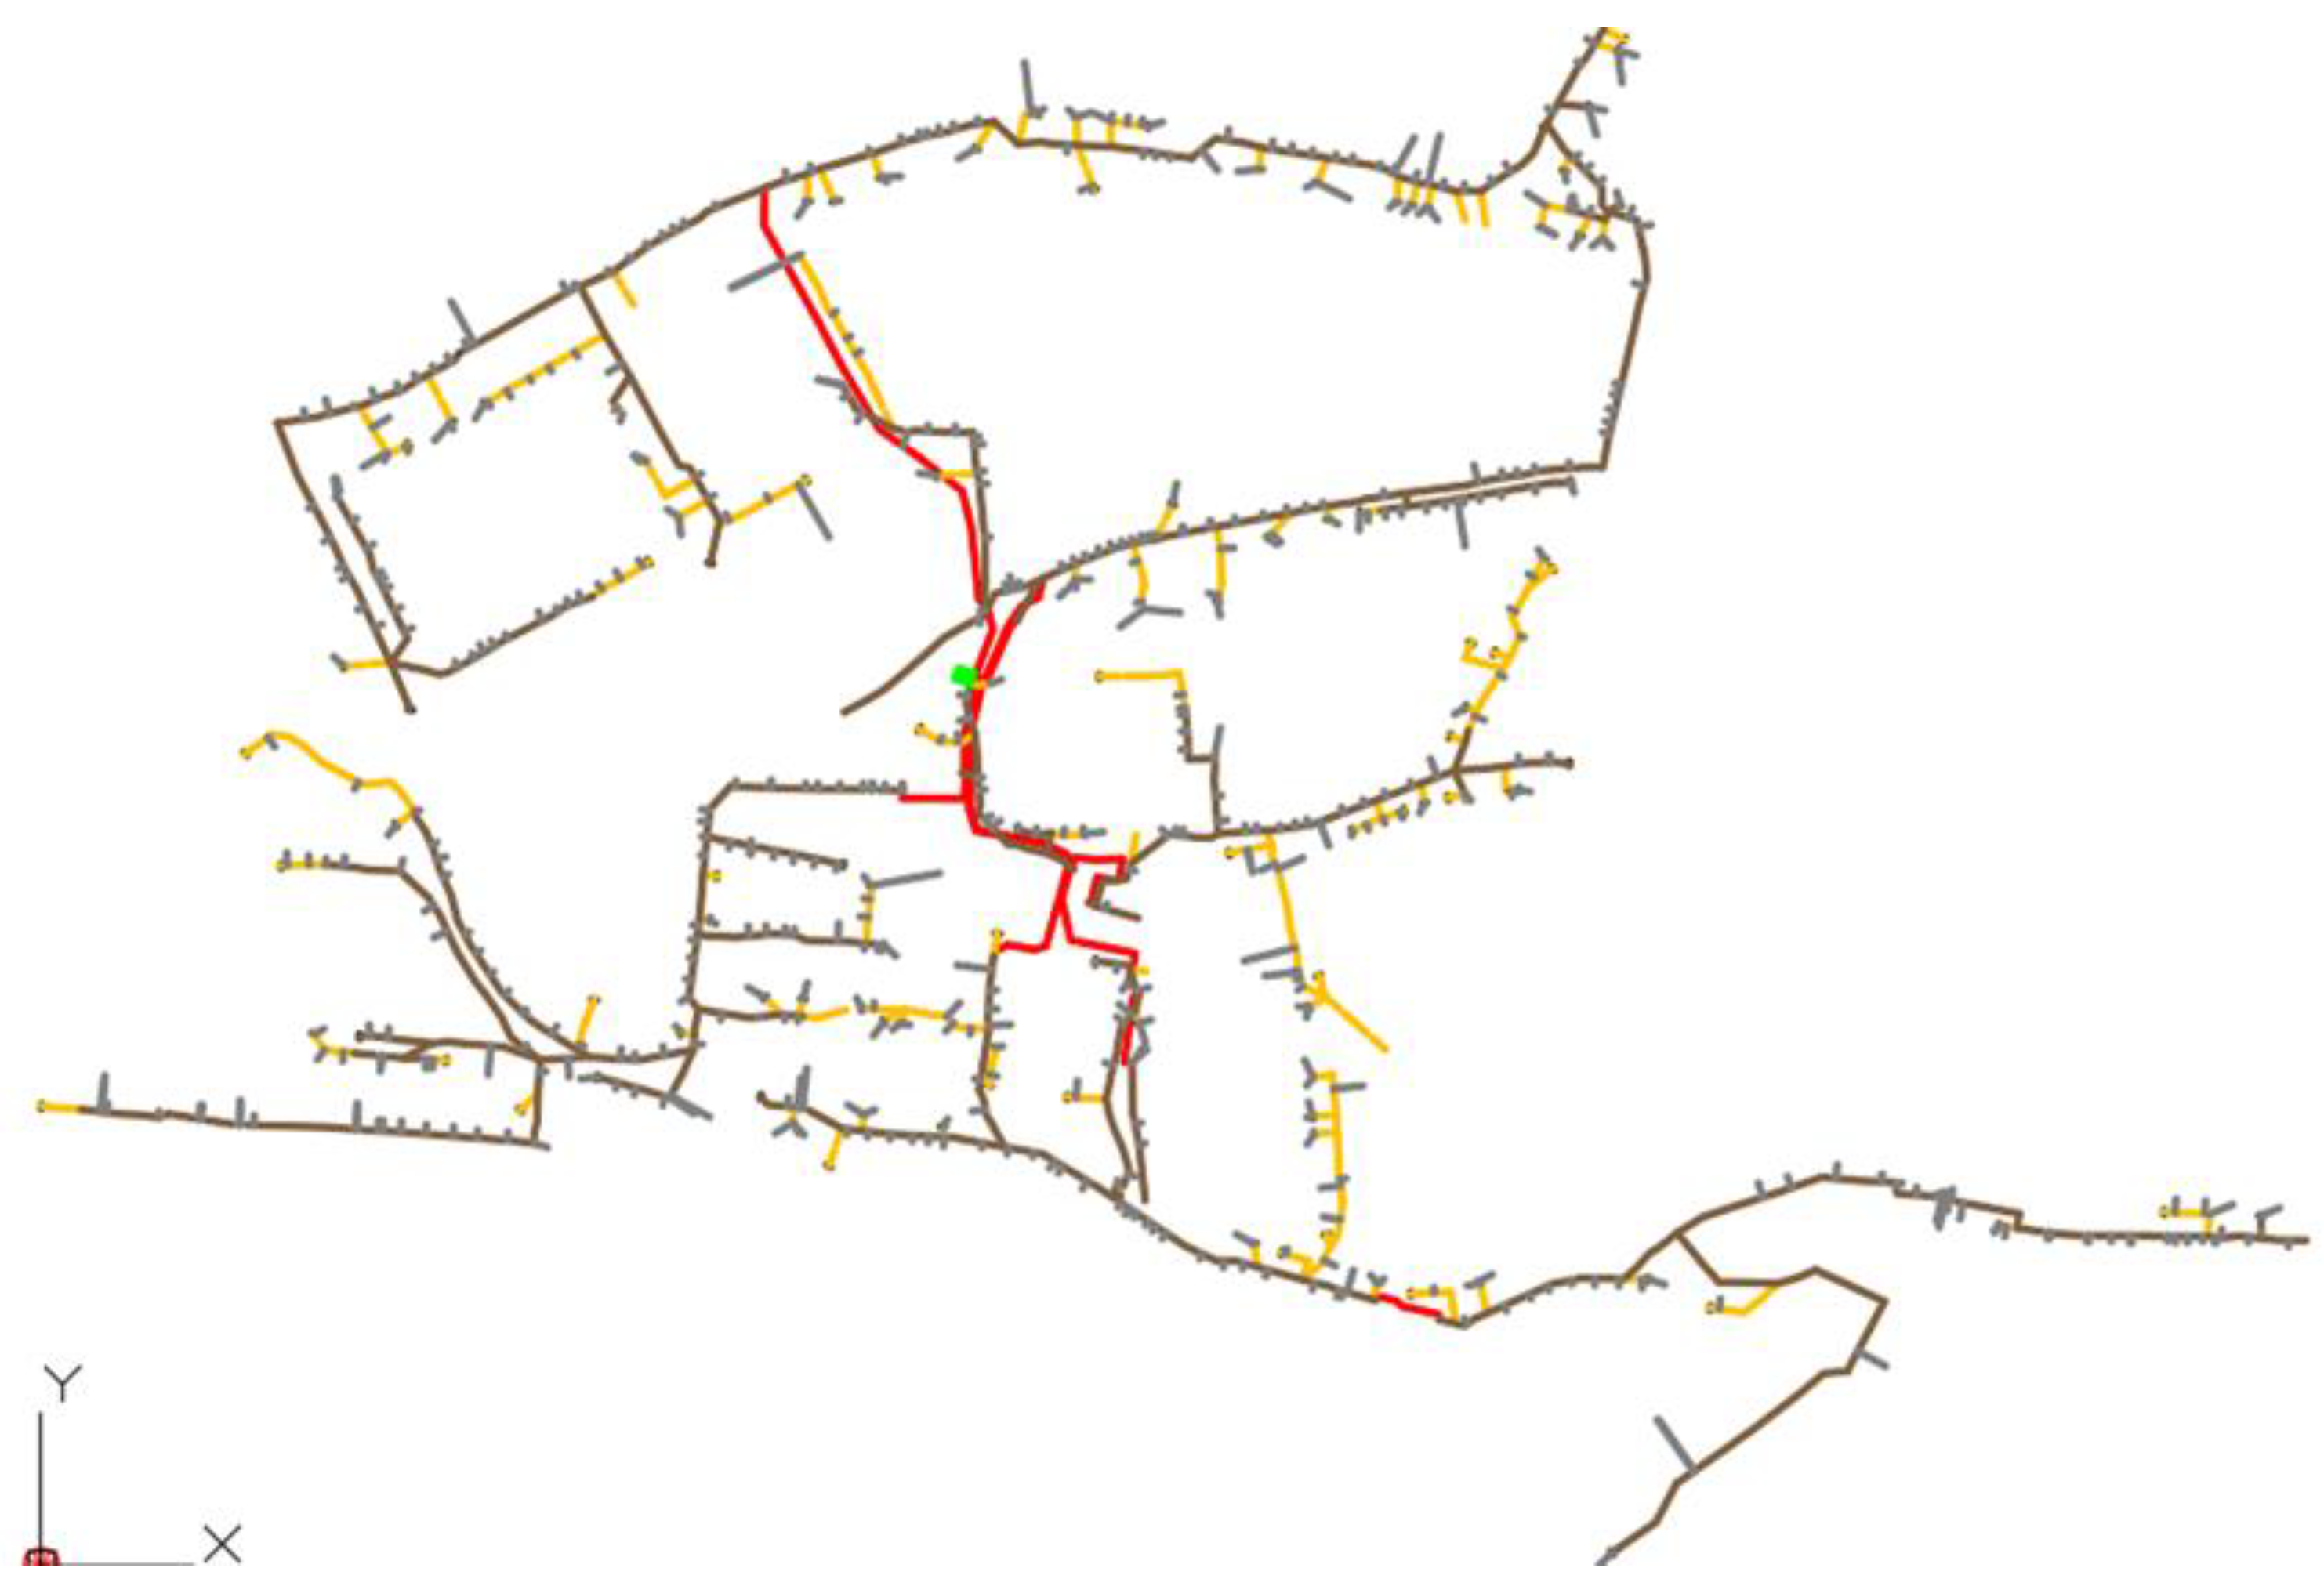
3.1. Real-Life Maltese LV Network
3.2. Summary of Results for Real-Life Maltese LV Network
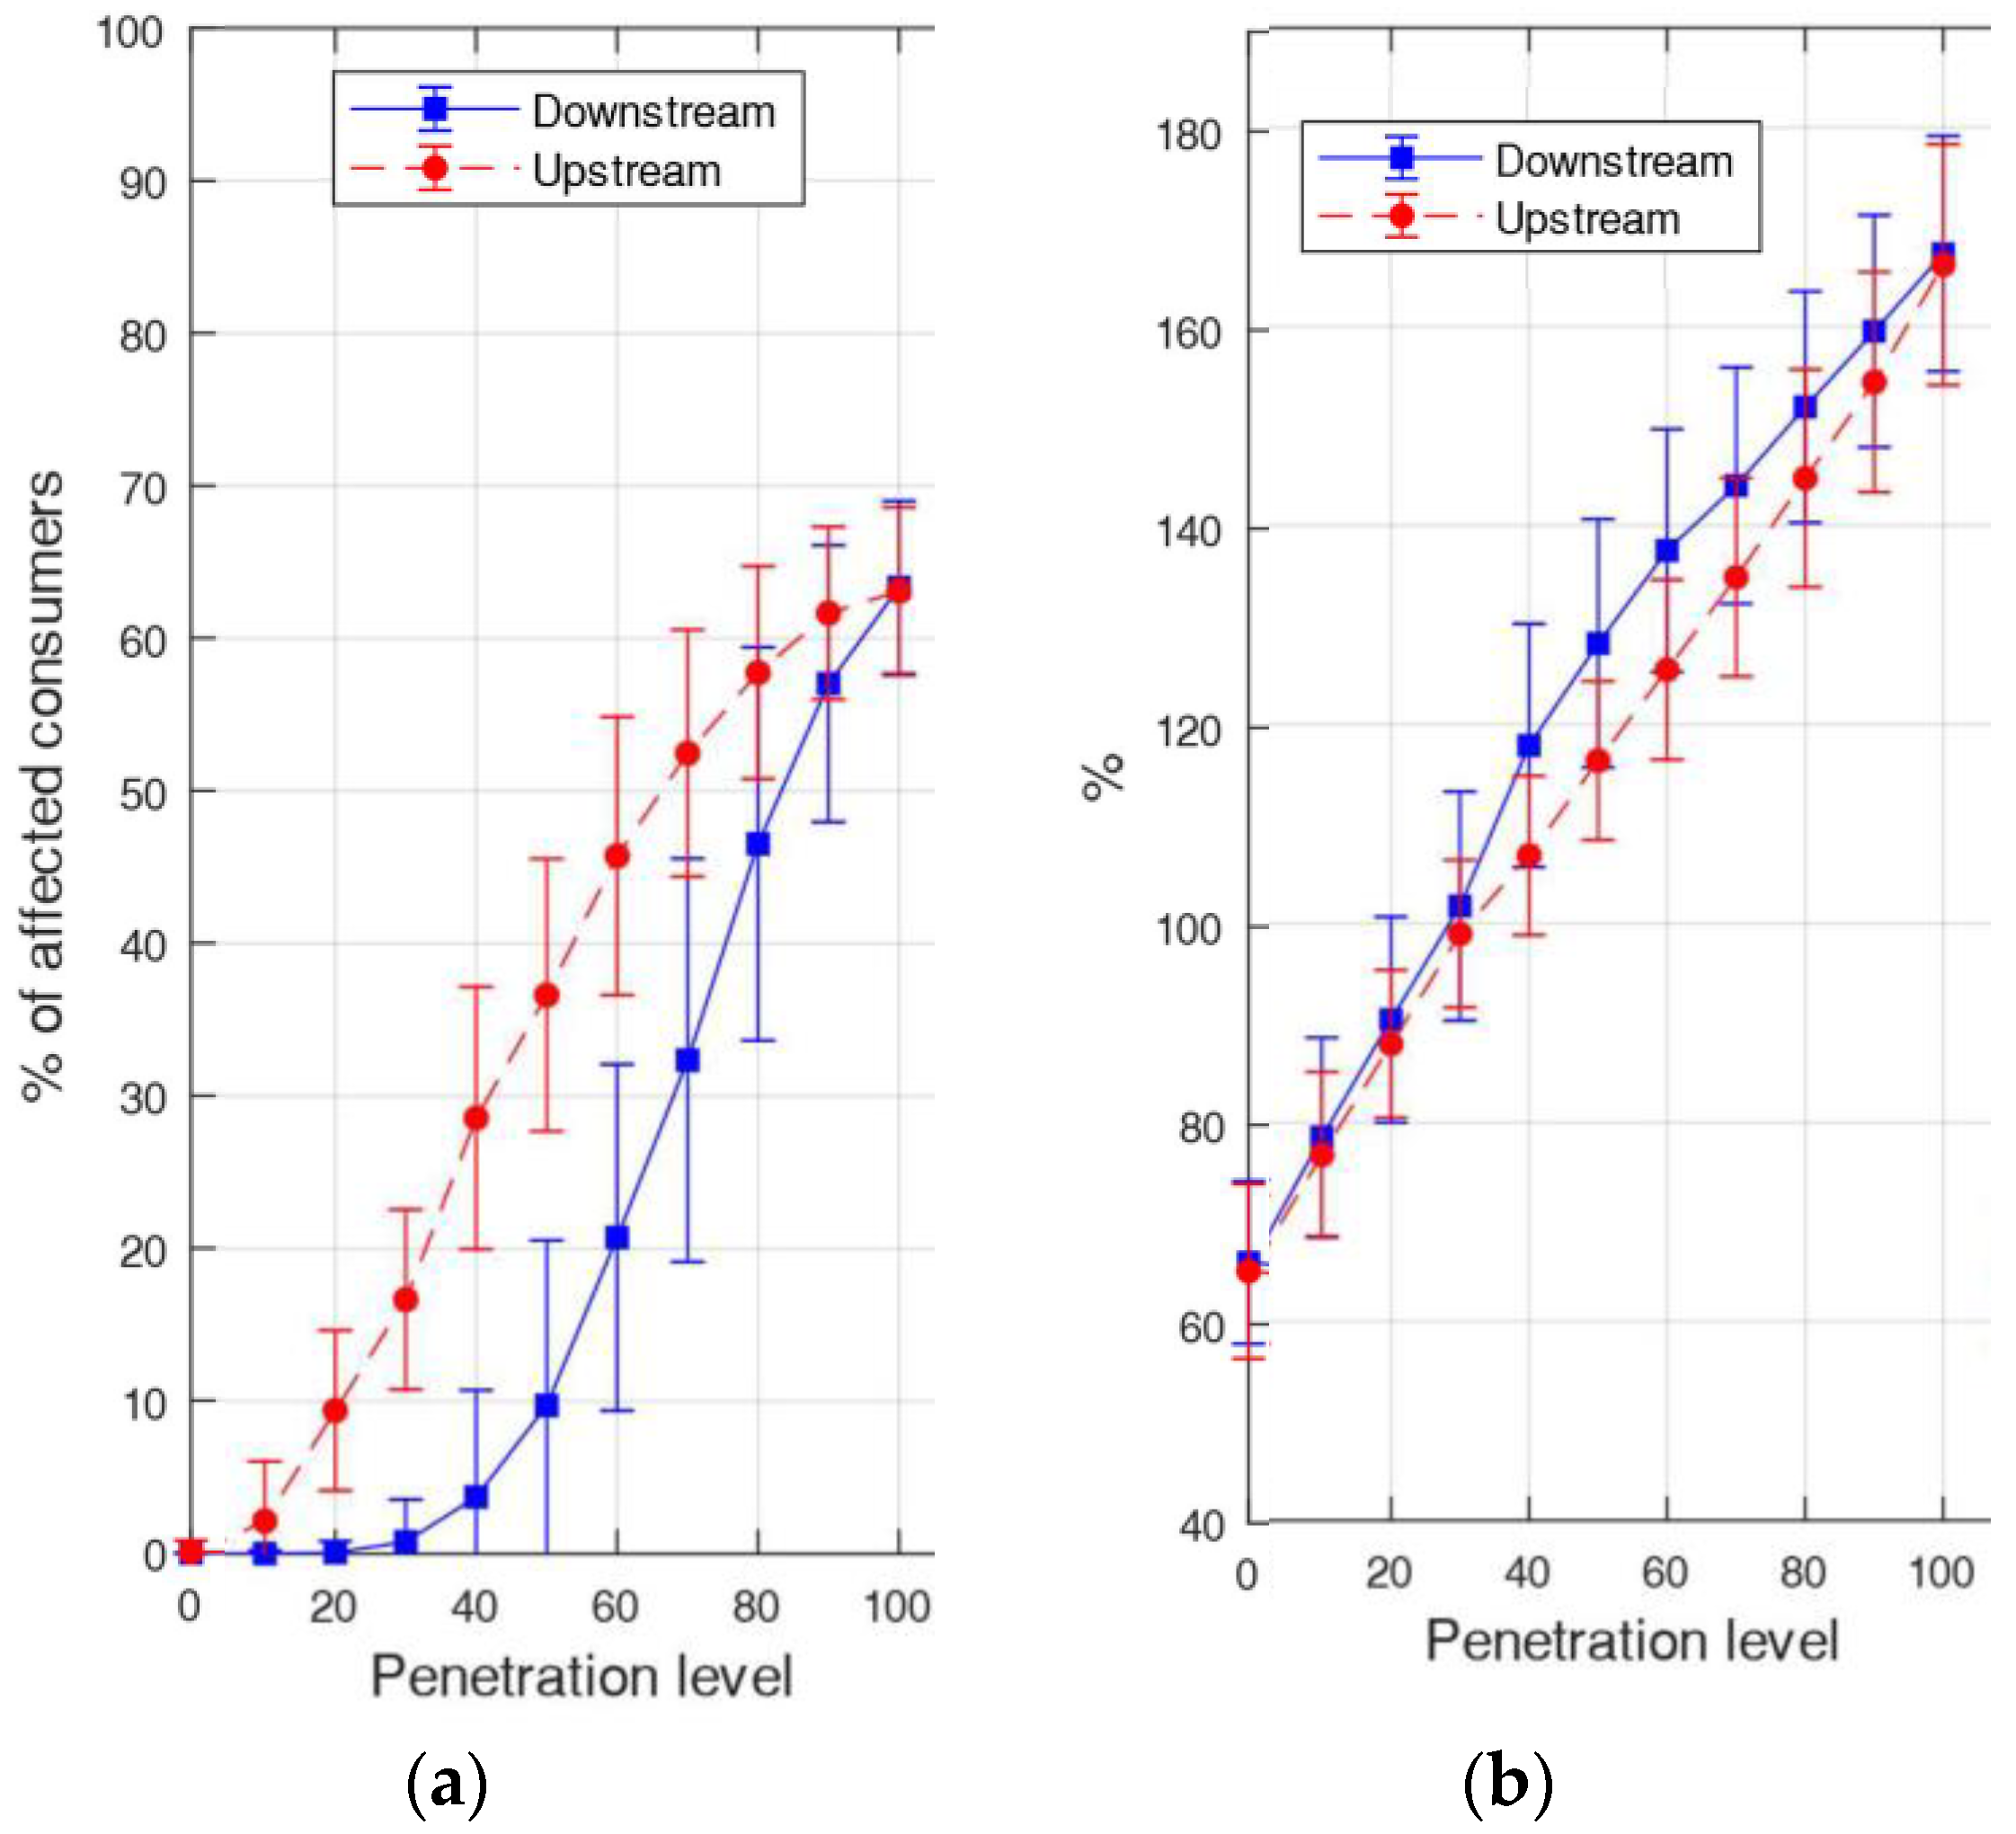
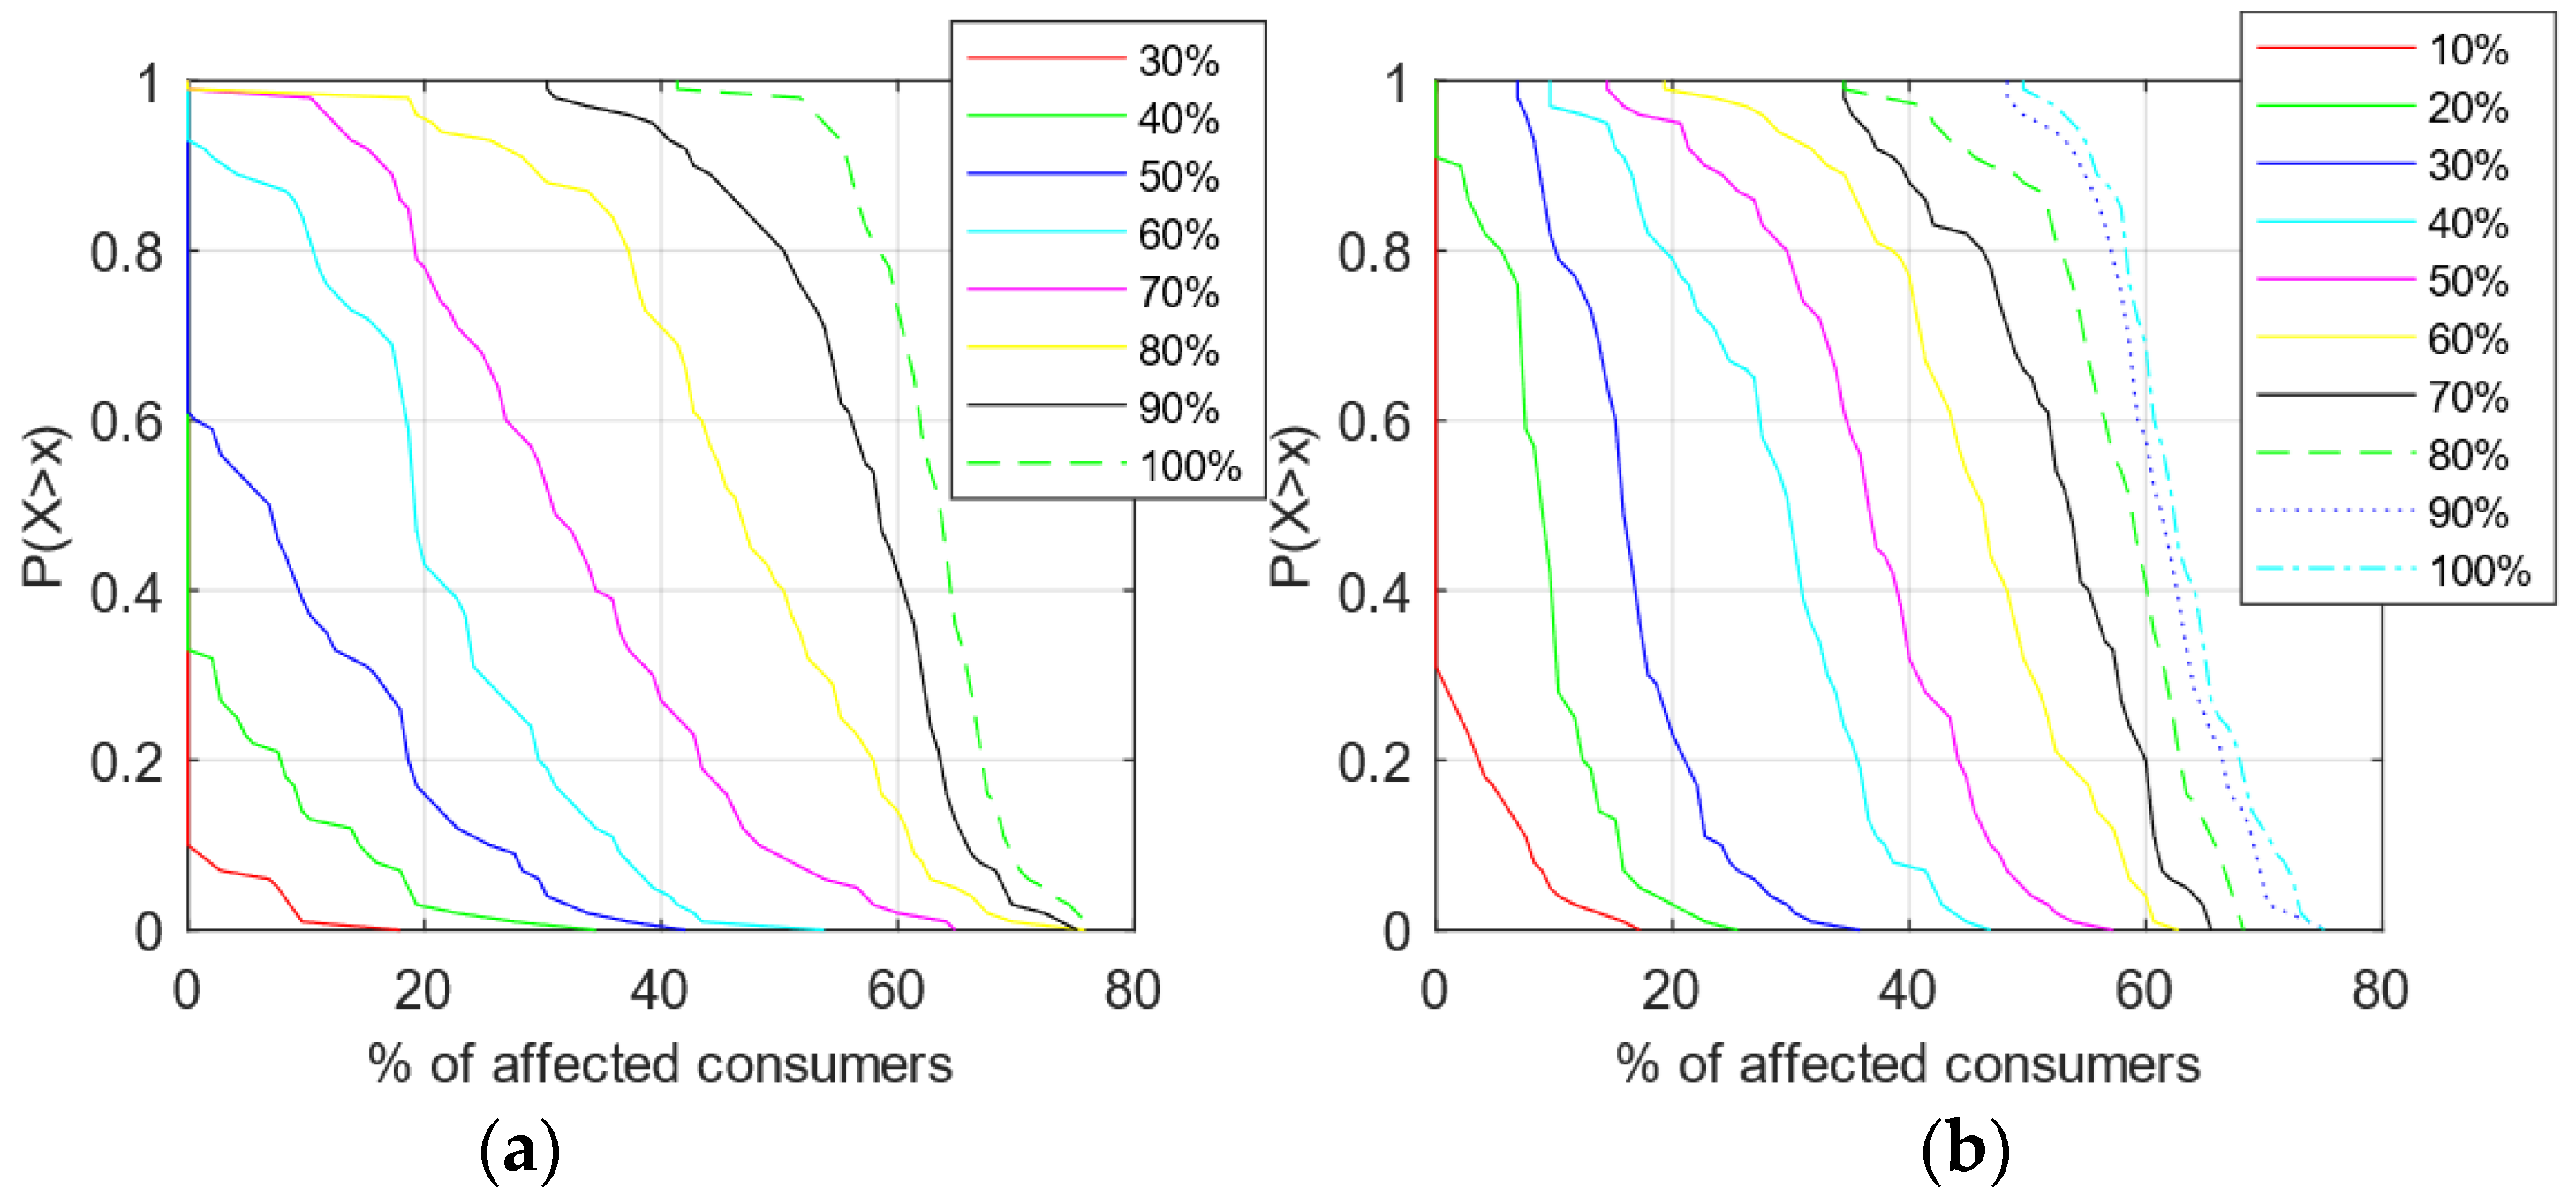
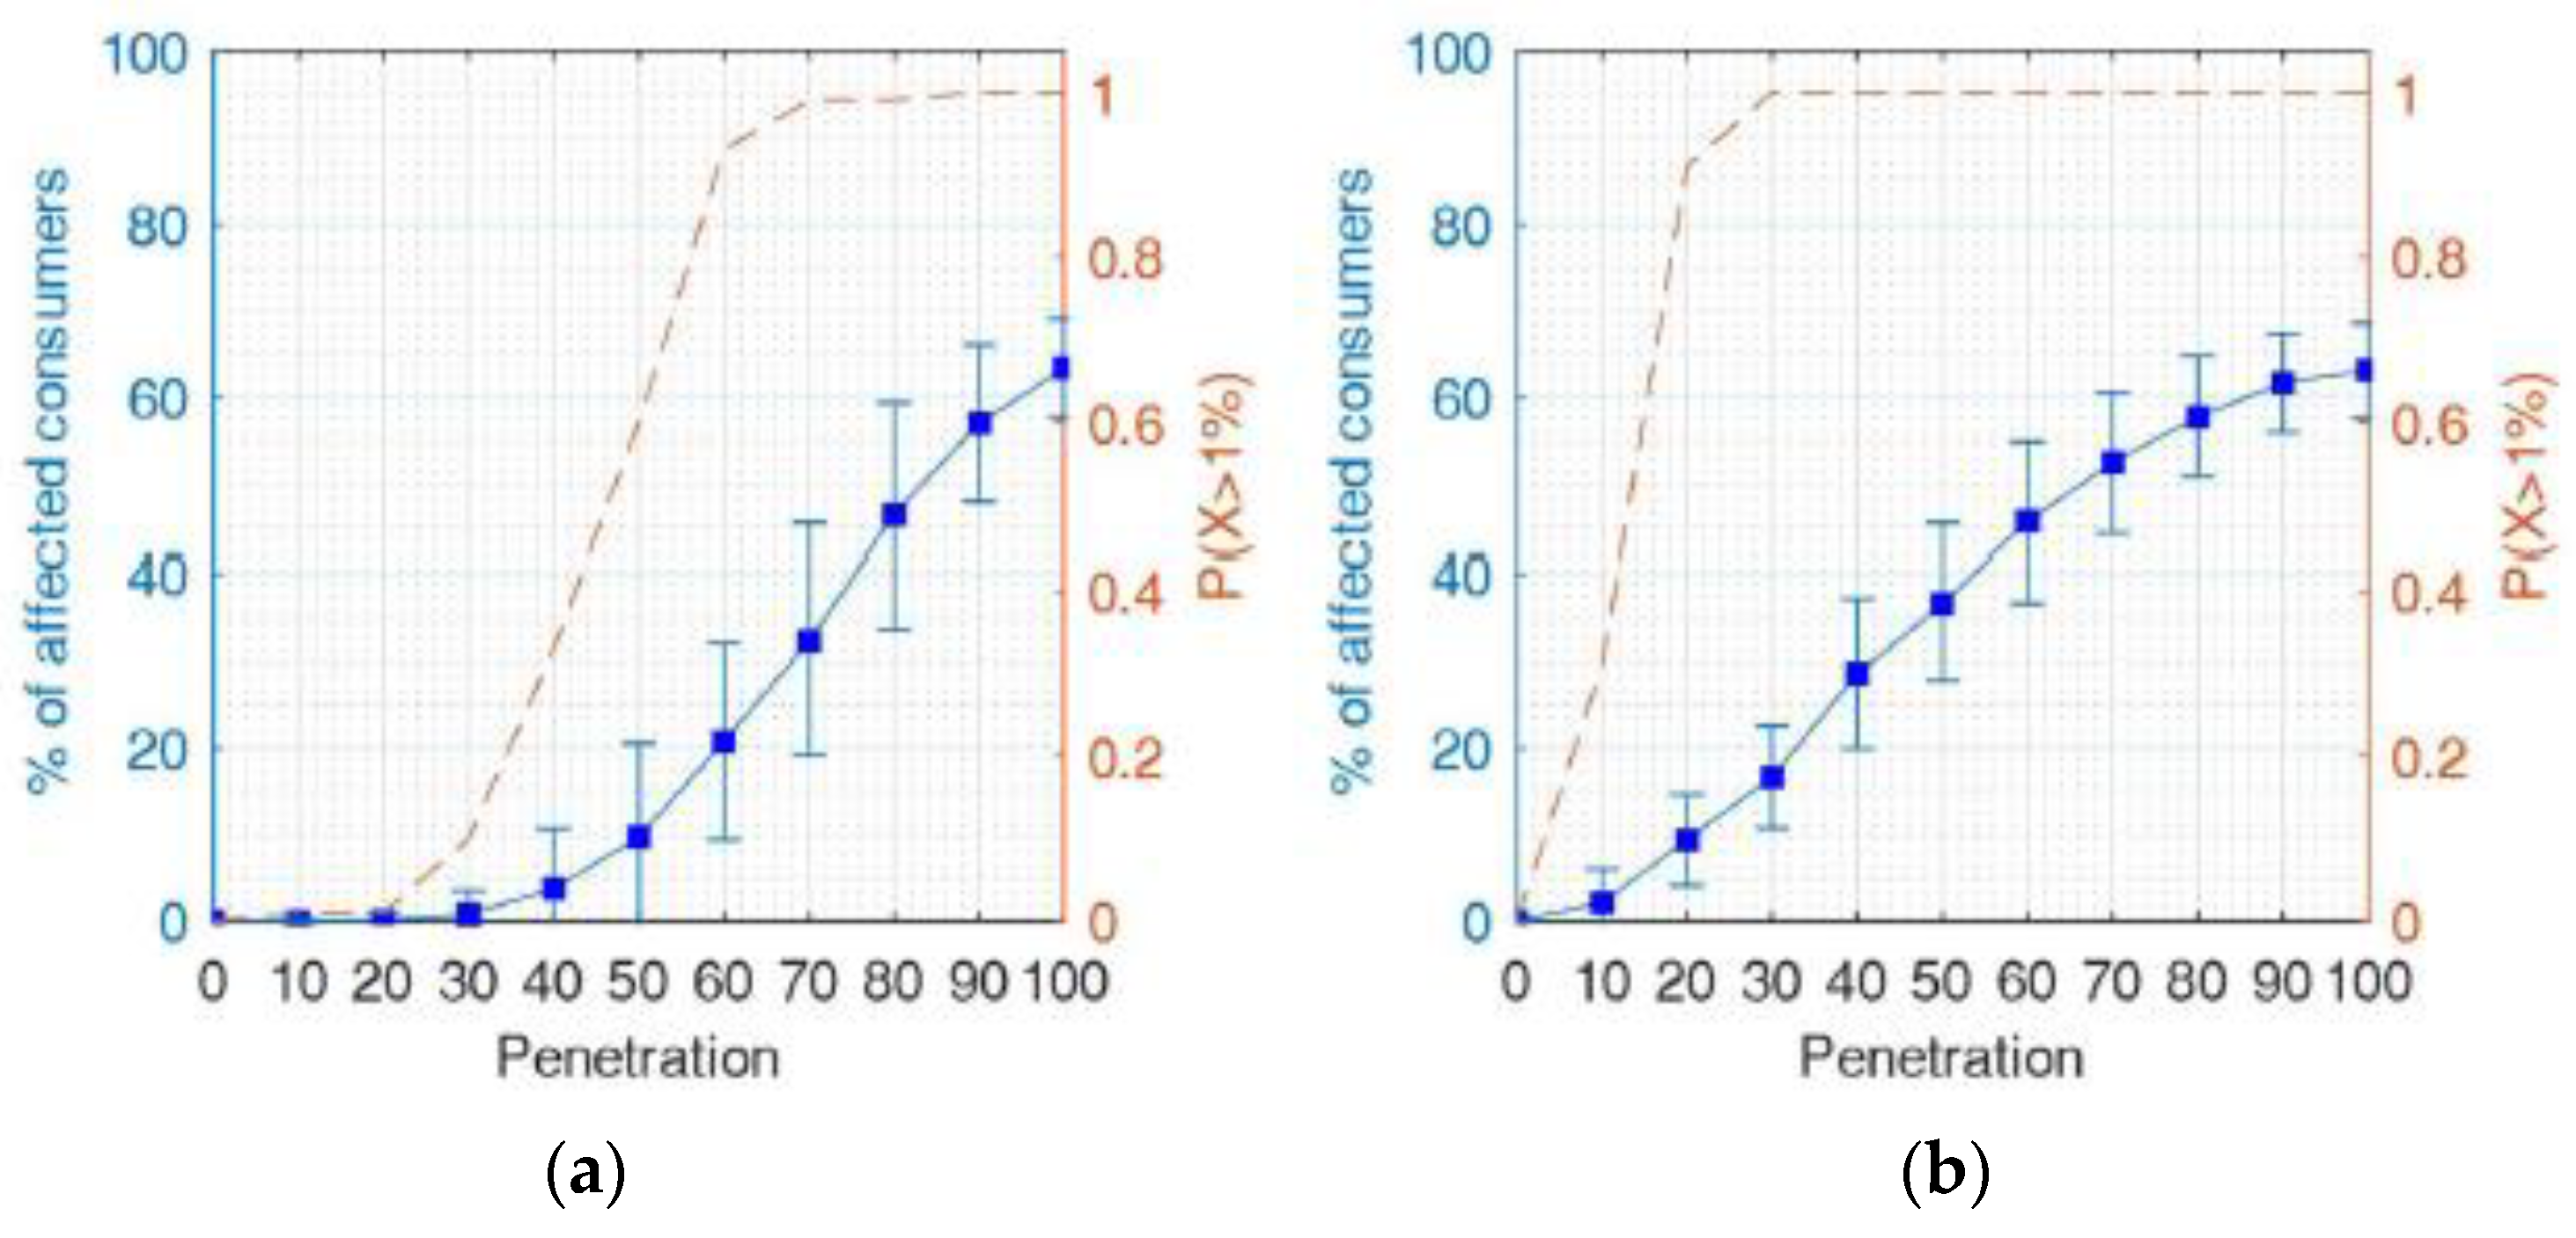
3.3. Voltage Issues
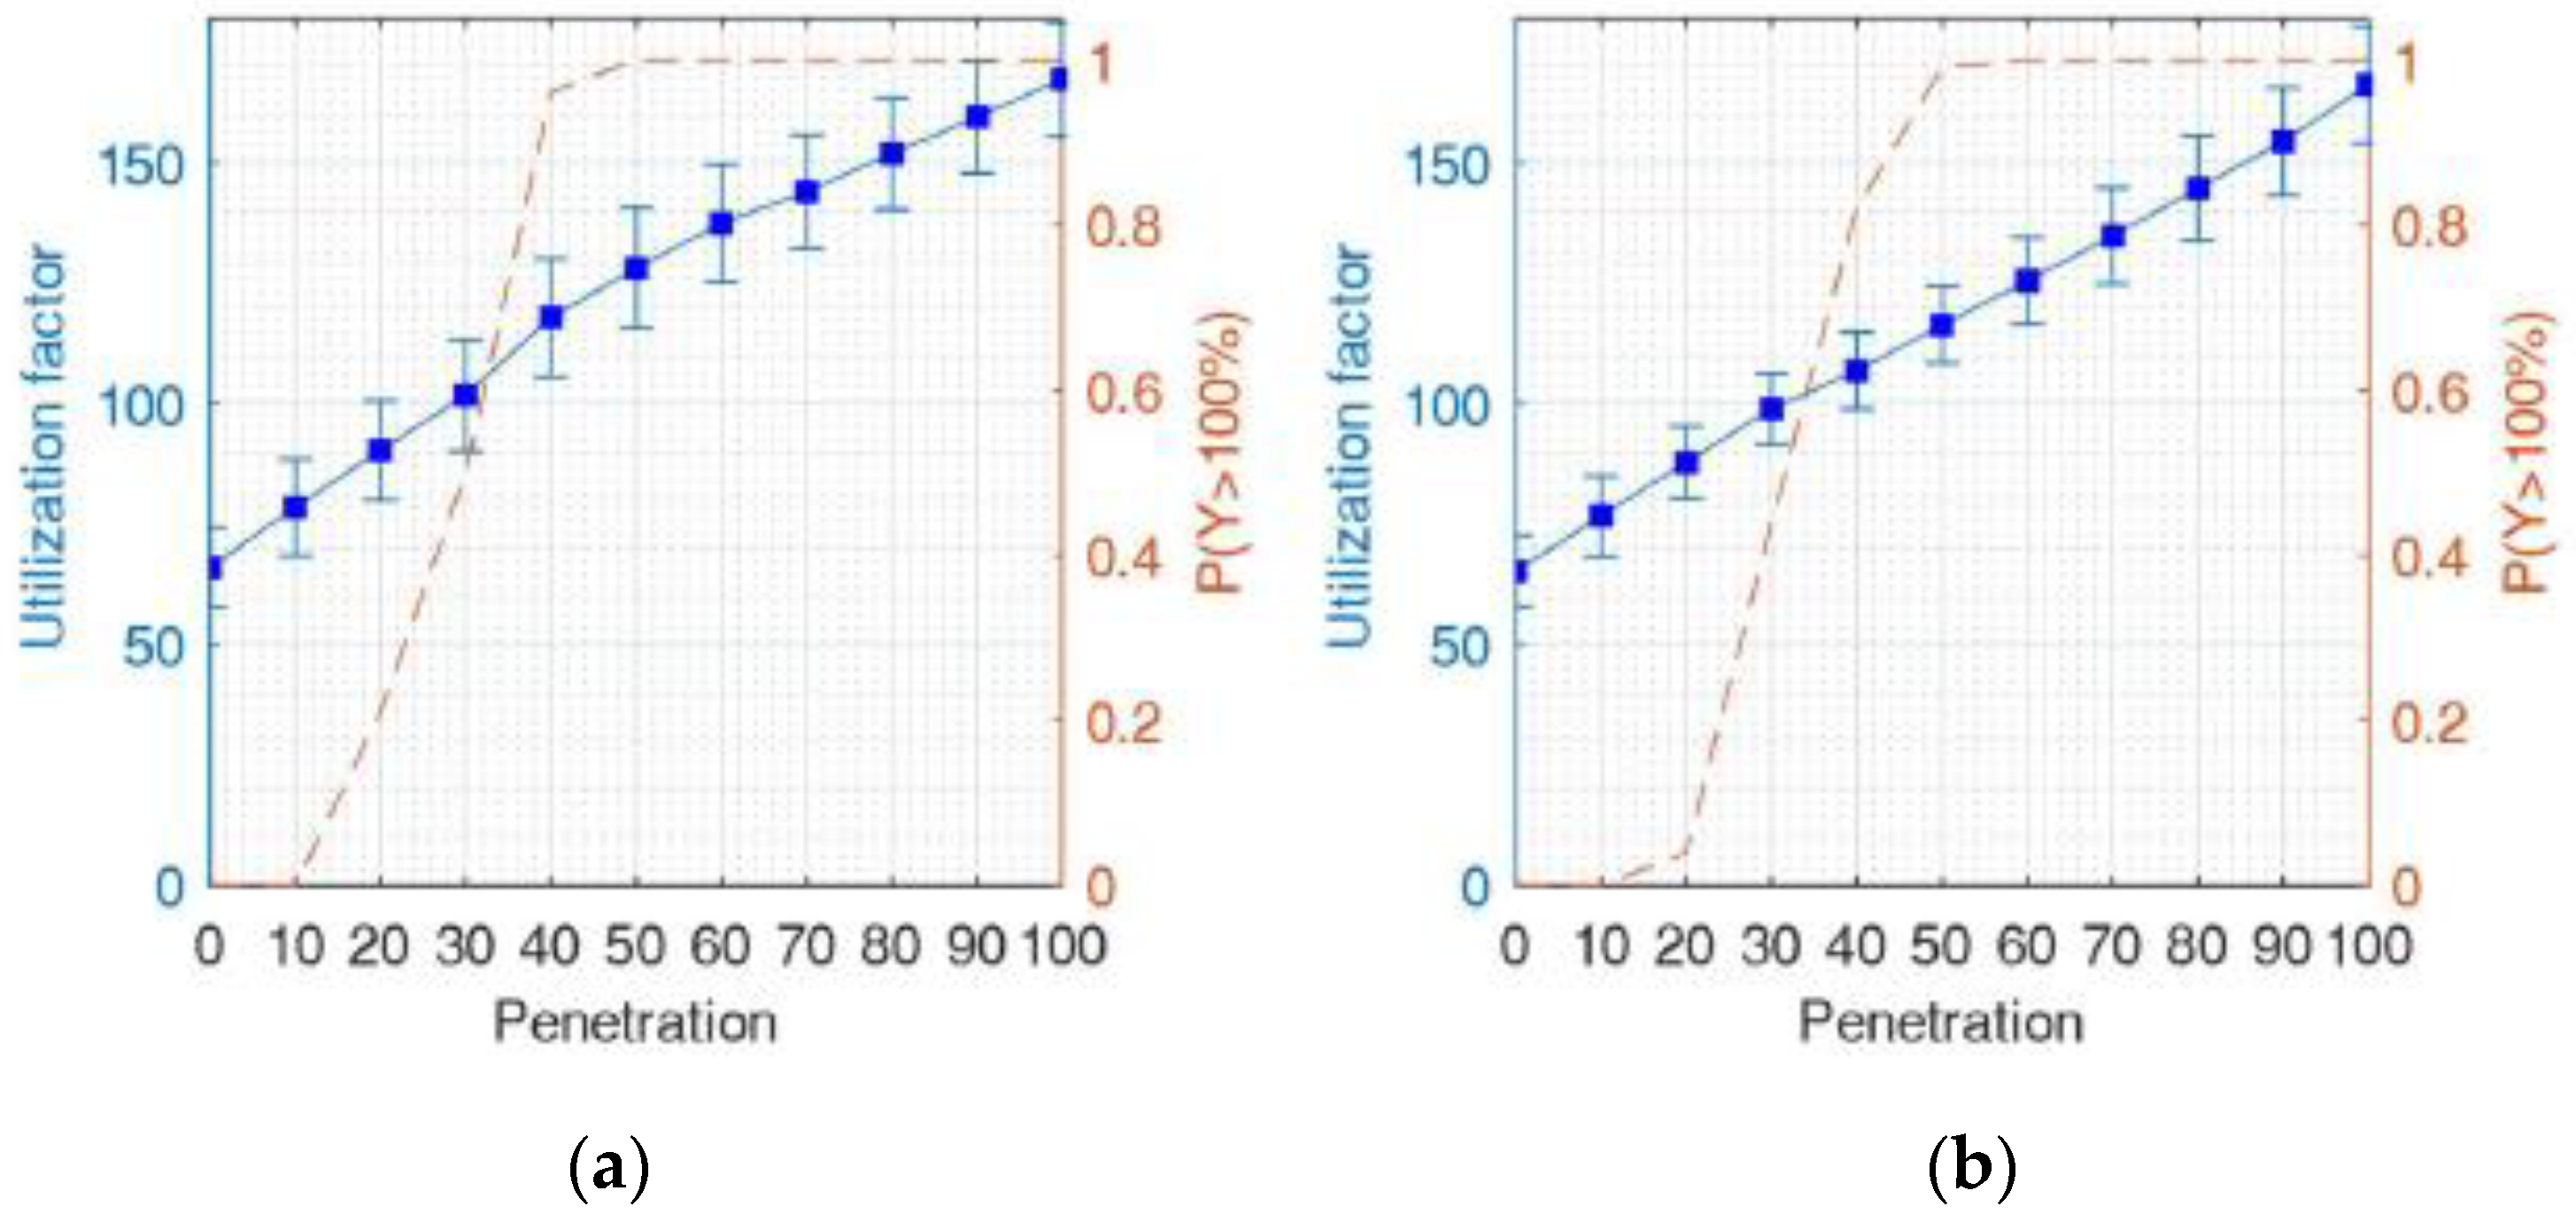
3.4. Utilization
3.5. Conclusion on Single LV Network Analysis
4. Likelihood of LV Network Challenges
5. Multi-Feeder EV Charging Impact Analysis
5.1. First Occurrence of LV Network Challenges
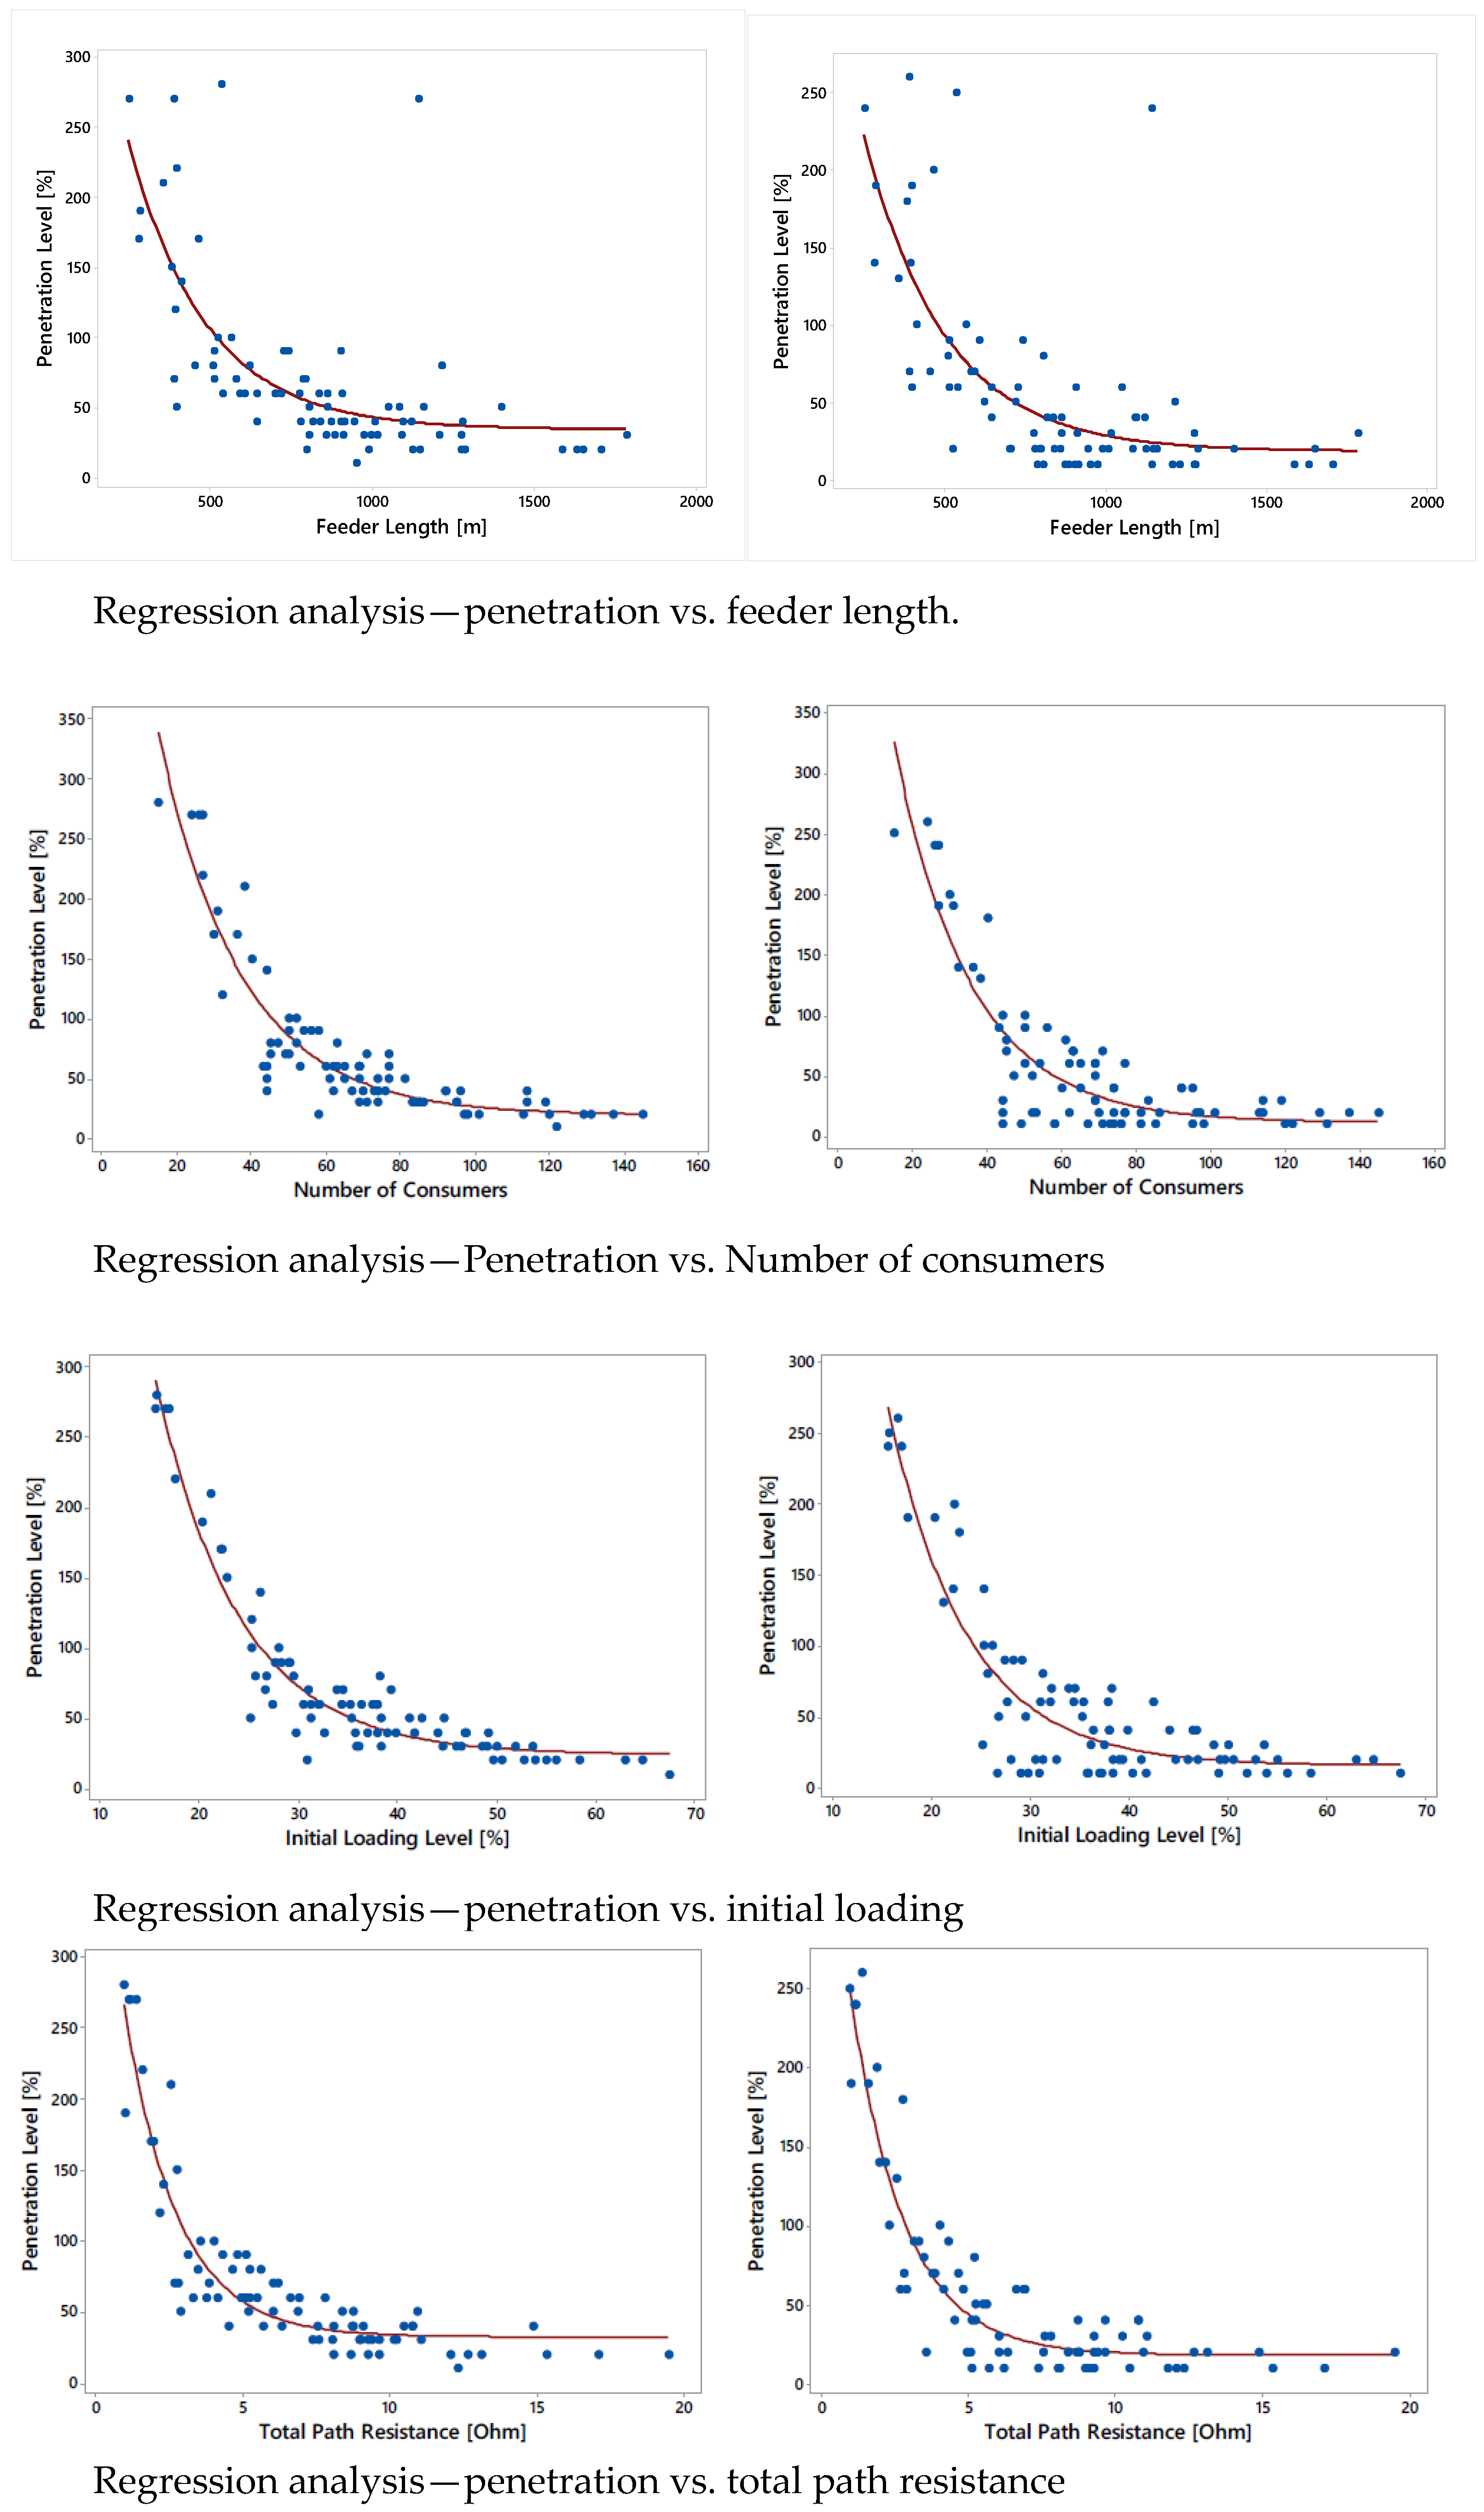
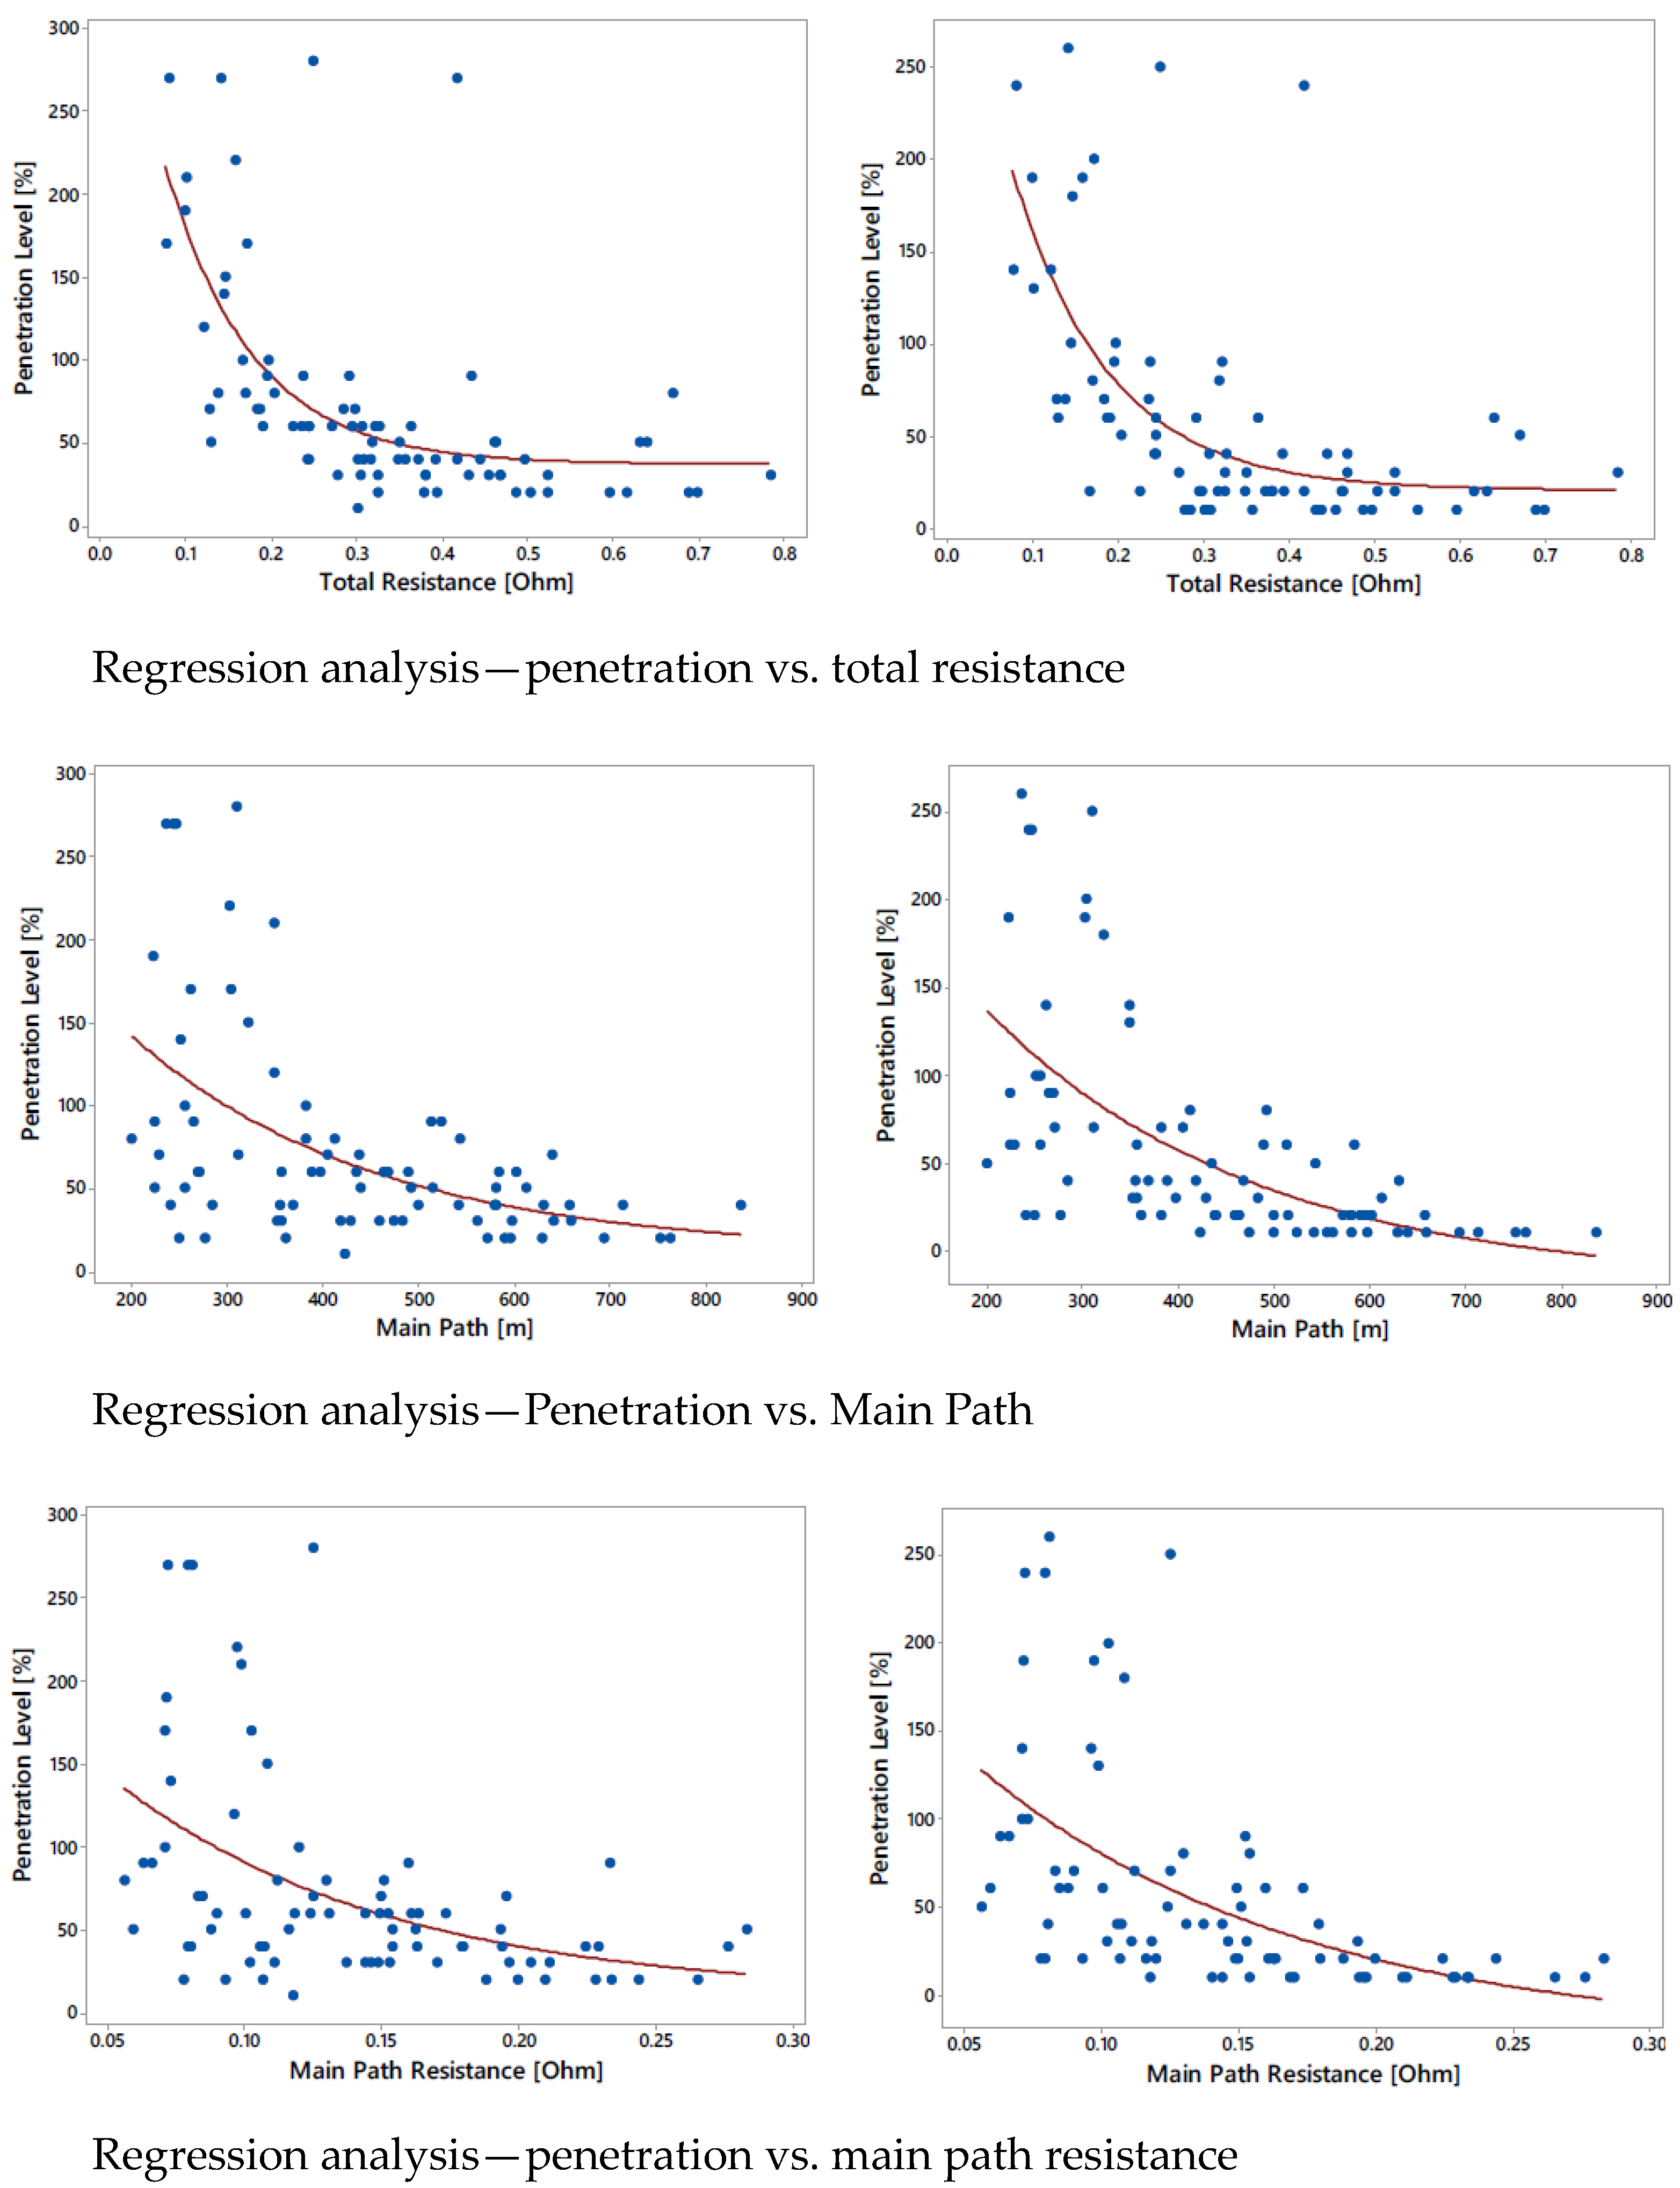
6. A Tool for Predicting Impacts through Regression Analysis
6.1. Defining Characteristics of LV Feeders
- i.
- The feeder length refers to the complete length of the feeder, encompassing both underground and aerial cables;
- ii.
- The number of customers is the amount of individual utility service connections on the grid for a feeder;
- iii.
- The total path resistance (TPR) refers to the cumulative resistance values that exist between the busbar and individual consumers within an electrical circuit as defined in [1];
- iv.
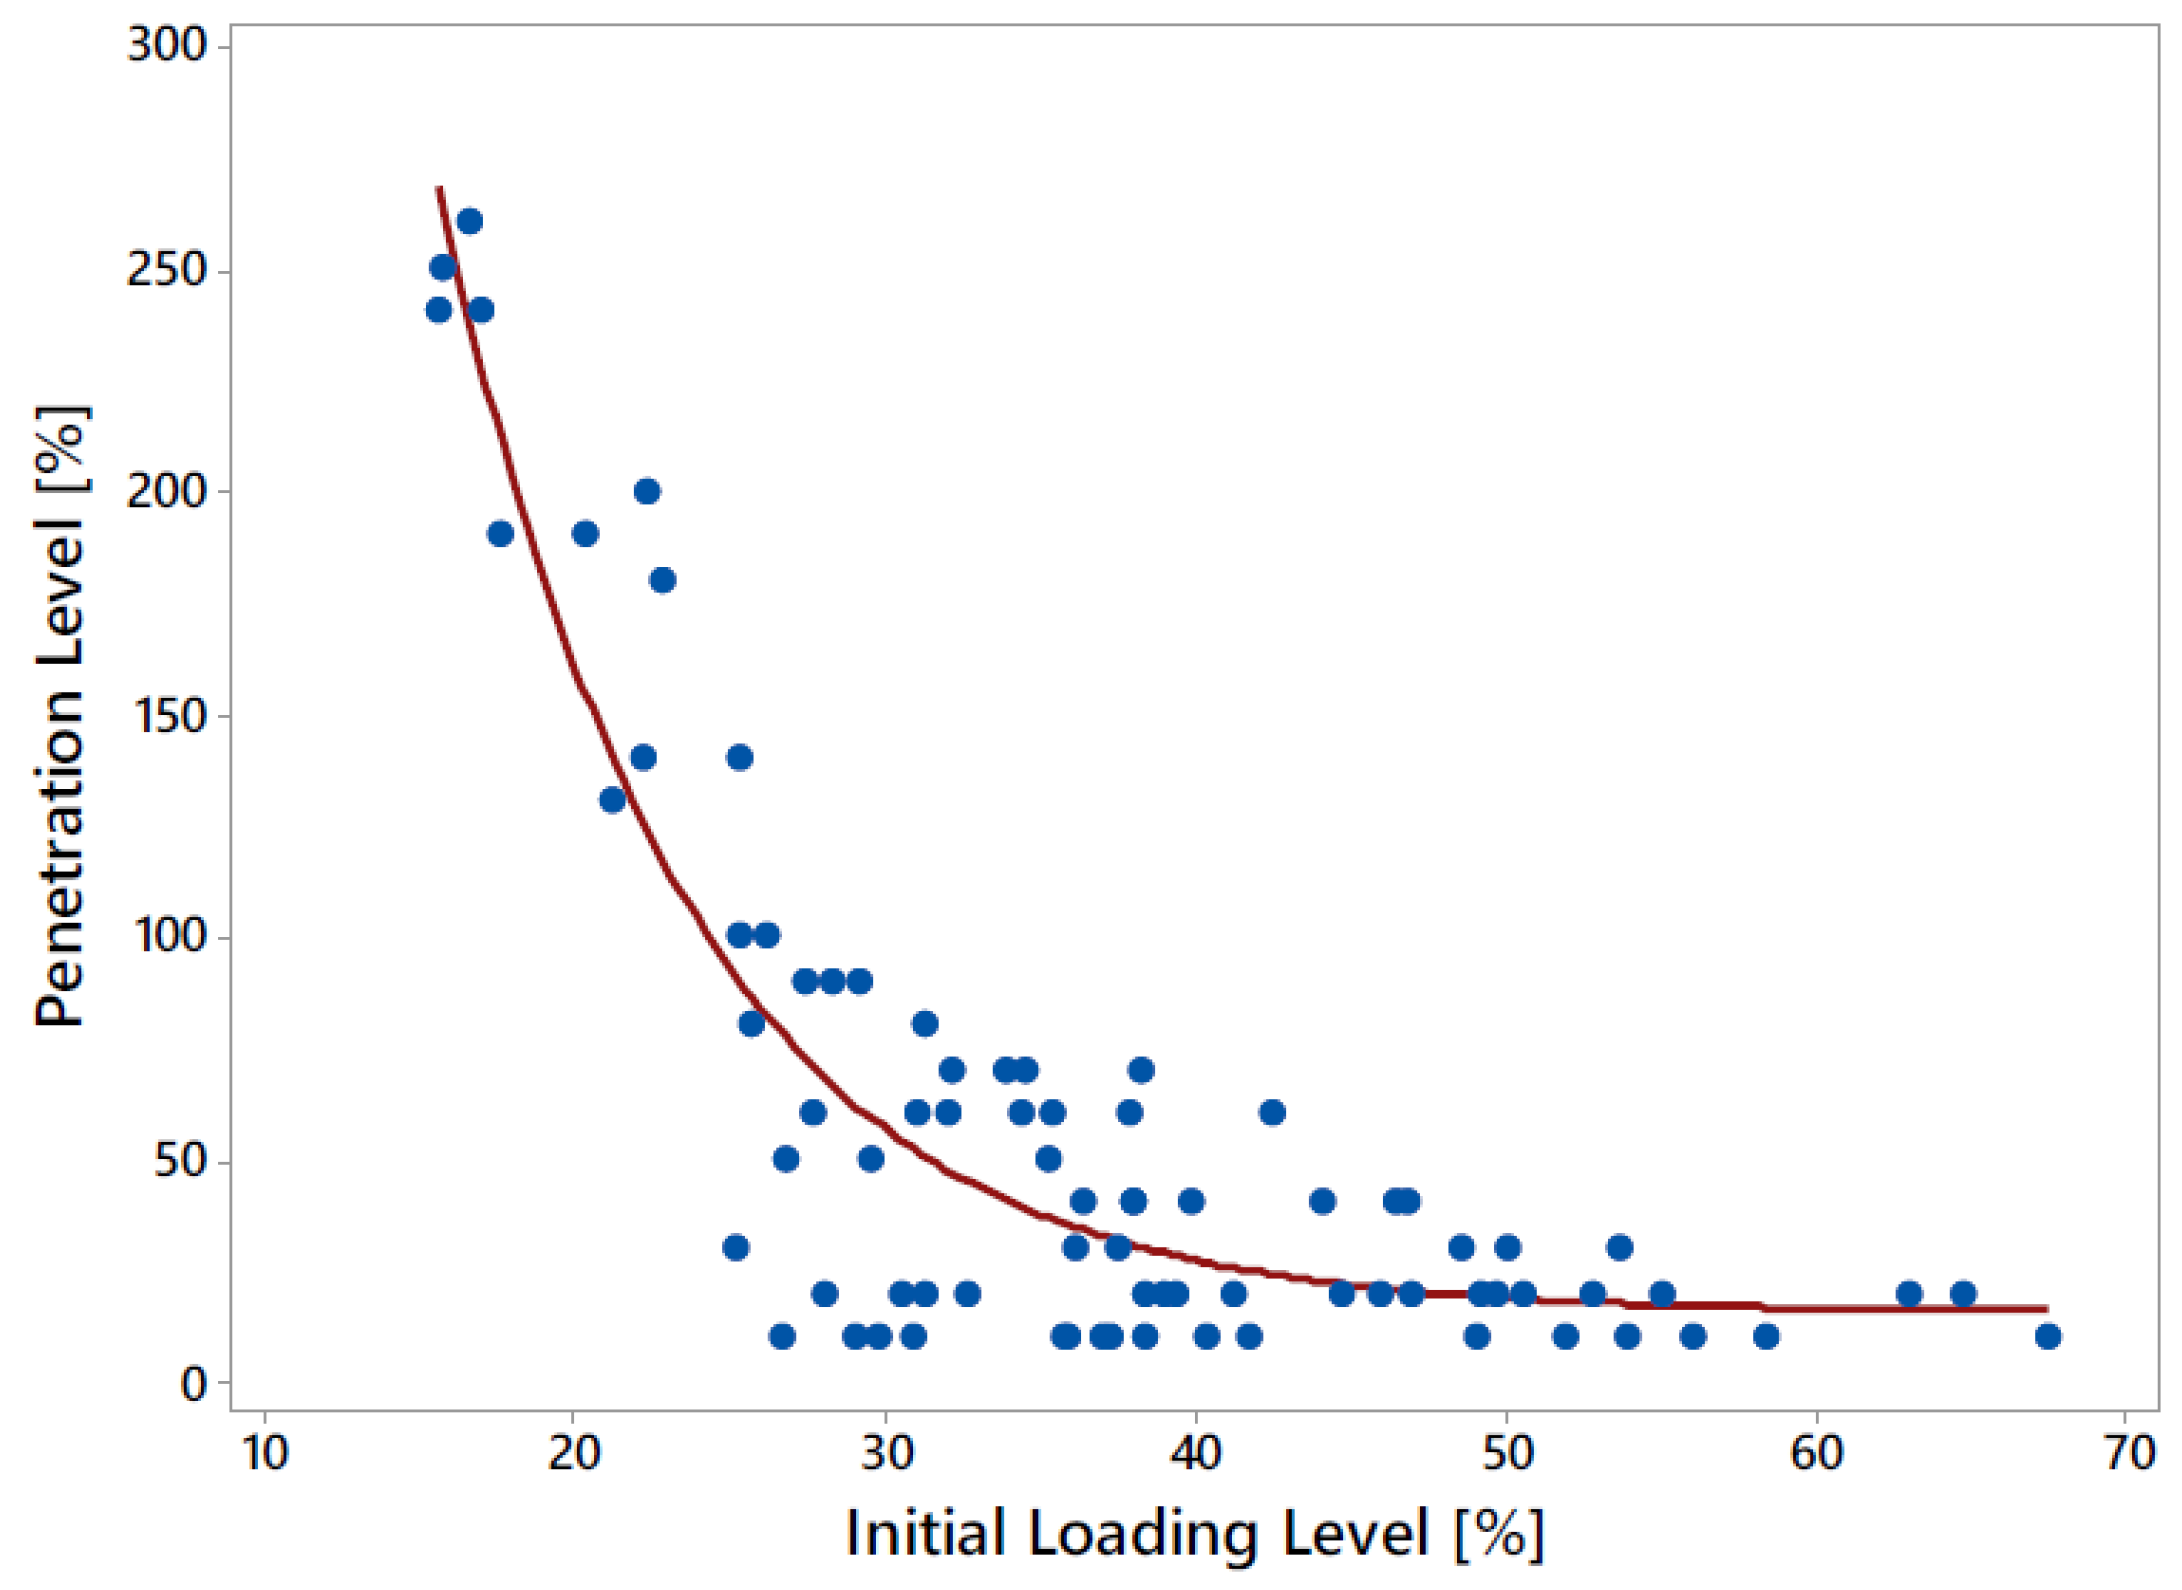
- The initial utilization factor pertains to the initial usage of a resource or system. The average utilization factor is determined by dividing the maximum current by its corresponding ampacity at the feeder’s head based on 100 simulations that do not incorporate EV integration;
- v.
- The main path is the measurement of the distance separating the busbar from the farthest consumer;
- vi.
- Main path resistance (MPR) is the cumulative resistance along the primary path from the substation to the final consumer;
- vii.
- Total resistance encompasses all feeder resistances, including both underground and overhead cables.
6.2. Regression Analysis Tool Methodology
6.3. Regression Tool Analysis
7. Conclusions
Author Contributions
Funding
Data Availability Statement
Conflicts of Interest
Appendix A
References
- Gabdullin, Y.; Azzopardi, B. Impacts of Photovoltaics in Low-Voltage Distribution Networks: A Case Study in Malta. Energies 2022, 15, 6731. [Google Scholar] [CrossRef]
- Voumvoulakis, E.; Leonidaki, E.; Papoutsis, G.; Hatziargyriou, N. Evaluation of the impact of plug-in electric vehicles in Greek distribution network. CIRED Open Access Proc. J. 2017, 2017, 2270–2274. [Google Scholar] [CrossRef]
- Haidar, A.M.; Muttaqi, K.M.; Haque, M.H. Multistage time-variant electric vehicle load modelling for capturing accurate electric vehicle behaviour and electric vehicle impact on electricity distribution grids. IET Gener. Transm. Distrib. 2015, 9, 2705–2716. [Google Scholar] [CrossRef]
- Leemput, N.; Geth, F.; Van Roy, J.; Delnooz, A.; Buscher, J.; Driesen, J. Impact of Electric Vehicle On-Board Single-Phase Charging Strategies on a Flemish Residential Grid. IEEE Trans. Smart Grid 2014, 5, 1815–1822. [Google Scholar] [CrossRef]
- Marah, B.; Bhavanam, Y.R.; A Taylor, G.; O Ekwue, A. Impact of electric vehicle charging systems on low voltage distribution networks. In Proceedings of the 2016 51st International Universities Power Engineering Conference (UPEC), Coimbra, Portugal, 6–9 September 2016; pp. 1–6. [Google Scholar]
- Ihekwaba, A.; Kim, C. Analysis of electric vehicle charging impact on grid voltage regulation. In Proceedings of the 2017 North American Power Symposium (NAPS), Morgantown, WV, USA, 17–19 September 2017; pp. 1–6. [Google Scholar]
- Nour, M.; Ramadan, H.; Ali, A.; Farkas, C. Impacts of plug-in electric vehicles charging on low voltage distribution network. In Proceedings of the 2018 International Conference on Innovative Trends in Computer Engineering (ITCE), Istanbul, Turkey, 25–26 April 2018; pp. 357–362. [Google Scholar]
- Rahman, S.; Khan, I.A.; Khan, A.A.; Mallik, A.; Nadeem, M.F. Comprehensive review & impact analysis of integrating projected electric vehicle charging load to the existing low voltage distribution system. Renew. Sustain. Energy Rev. 2022, 153, 111756. [Google Scholar] [CrossRef]
- Crozier, C.; Morstyn, T.; Deakin, M.; McCulloch, M. The case for Bi-directional charging of electric vehicles in low voltage distribution networks. Appl. Energy 2020, 259, 114214. [Google Scholar] [CrossRef]
- Crozier, C.; Morstyn, T.; McCulloch, M. The opportunity for smart charging to mitigate the impact of electric vehicles on transmission and distribution systems. Appl. Energy 2020, 268, 114973. [Google Scholar] [CrossRef]
- Ramadhani, U.H.; Fachrizal, R.; Shepero, M.; Munkhammar, J.; Widén, J. Probabilistic load flow analysis of electric vehicle smart charging in unbalanced LV distribution systems with residential photovoltaic generation. Sustain. Cities Soc. 2021, 72, 103043. [Google Scholar] [CrossRef]
- Carrión, M.; Zárate-Miñano, R.; Domínguez, R. Integration of Electric Vehicles in Low-Voltage Distribution Networks Con-sidering Voltage Management. Energies 2020, 13, 4125. [Google Scholar] [CrossRef]
- Dugan, R.C.; McDermott, T.E. An open source platform for collaborating on smart grid research. In Proceedings of the 2011 IEEE Power & Energy Society General Meeting, Detroit, MI, USA, 24–28 July 2011; pp. 1–7. [Google Scholar]
- Buttigieg, C. The Implementation of Smart Meters in Malta; Sustainable Energy and Water Conservation Unit, 2015. Available online: https://www.ca-eed.eu/ia_document/the-implementation-of-smart-meters-malta/ (accessed on 25 May 2023).
- Quiros-Tortos, J.; Ochoa, L. Work Activity 3 ‘Model Validation and Data Analysis’; Report for Deliverables 3.1, 3.2, 3.3. and 3.4.; EA Technology—My Electric Avenue, 2014; Available online: https://www.escholar.manchester.ac.uk/uk-ac-man-scw:244664 (accessed on 25 May 2023).
- European Committee for Electrotechnical Standardization. Voltage Characteristics of Electricity Supplied by Public Distribution Systems (EN50160:2022). European Committee for Electrotechnical Standardization. 2022. Available online: https://standards.cencenelec.eu/dyn/www/f?p=CENELEC:110:::::FSP_PROJECT,FSP_ORG_ID:71003,1258595&cs=177F89A233554A3CA651BC5AAA21C3EB3 (accessed on 25 May 2023).
- Pengxin; Zhao, Z. Analysis of electric vehicles’ impact to the electric grid. In Proceedings of the 2012 China International Conference on Electricity Distribution (CICED), Shanghai, China, 10–14 September 2012; pp. 1–5. [Google Scholar]
- Azzopardi, B.; Gabdullin, Y.; Simkoniene, G. Photovoltaics and electrical vehicles mitigation on the low-voltage distribution network in Malta. In Proceedings of the 13th Mediterranean Conference on Power Generation, Transmission, Distribution and Energy Conversion (MEDPOWER 2022), Valletta, Malta, 7–9 November 2022; pp. 554–556. [Google Scholar]


| Feeder | Total Length (m) | No of Loads | Phase Connectivity | ||
|---|---|---|---|---|---|
| 1 | 2 | 3 | |||
| 1 | 1706.3 | 121 | 0.31 | 0.39 | 0.3 |
| 2 | 461.9 | 30 | 0.33 | 0.33 | 0.33 |
| 3 | 1558.1 | 128 | 0.294 | 0.319 | 0.387 |
| 4 | 1391.4 | 146 | 0.28 | 0.372 | 0.348 |
| 5 | 1015.6 | 83 | 0.351 | 0.378 | 0.271 |
| 6 | 778.1 | 71 | 0.354 | 0.384 | 0.262 |
| 7 | 565.2 | 50 | 0.25 | 0.375 | 0.375 |
| Feeder | Technical Challenges Due to EV Charging Penetration Levels | |||
|---|---|---|---|---|
| Voltage Issues Downstream | Voltage Issues Upstream | Utilization Factor > 70% Downstream | Utilization Factor > 70% Upstream | |
| 1 | 20% | 20% | 20% | 20% |
| 2 | - | - | - | - |
| 3 | 10% | 10% | 20% | 20% |
| 4 | 30% | 10% | 10% | 10% |
| 5 | 80% | 50% | 30% | 30% |
| 6 | 80% | 30% | 40% | 50% |
| 7 | - | - | 90% | 100% |
| Case | α = 0 | α = 0.05 | ||
|---|---|---|---|---|
| Voltage Issues | Overloading | Voltage Issues | Overloading | |
| Downstream | 63.1% | 76.2% | 58.3% | 71.4% |
| Upstream | 65.5% | 76.2% | 58.3% | 69.1% |
| Parameter | Downstream | Upstream |
|---|---|---|
| Feeder length | 44.4 | 42.9 |
| Number of customers | 24.8 | 28.6 |
| Total path resistance | 23.1 | 22.2 |
| Initial loading | 17.6 | 25.9 |
| Main path | 54.7 | 50.1 |
| Main path resistance | 56.5 | 52.8 |
| Total resistance | 47.9 | 47.4 |
Disclaimer/Publisher’s Note: The statements, opinions and data contained in all publications are solely those of the individual author(s) and contributor(s) and not of MDPI and/or the editor(s). MDPI and/or the editor(s) disclaim responsibility for any injury to people or property resulting from any ideas, methods, instructions or products referred to in the content. |
© 2024 by the authors. Licensee MDPI, Basel, Switzerland. This article is an open access article distributed under the terms and conditions of the Creative Commons Attribution (CC BY) license (https://creativecommons.org/licenses/by/4.0/).
Share and Cite
Azzopardi, B.; Gabdullin, Y. Impacts of Electric Vehicles Charging in Low-Voltage Distribution Networks: A Case Study in Malta. Energies 2024, 17, 289. https://doi.org/10.3390/en17020289
Azzopardi B, Gabdullin Y. Impacts of Electric Vehicles Charging in Low-Voltage Distribution Networks: A Case Study in Malta. Energies. 2024; 17(2):289. https://doi.org/10.3390/en17020289
Chicago/Turabian StyleAzzopardi, Brian, and Yesbol Gabdullin. 2024. "Impacts of Electric Vehicles Charging in Low-Voltage Distribution Networks: A Case Study in Malta" Energies 17, no. 2: 289. https://doi.org/10.3390/en17020289