Article

Assessment of Regulatory and Market Challenges in the Economic Feasibility of a Nanogrid: A Brazilian Case

by
Fernando A. Assis
1,2,*,
Francisco C. R. Coelho
1,2,*,
José Filho C. Castro
1,3,*,
Antonio R. Donadon
1,
Ronaldo A. Roncolatto
1,
Pedro A. C. Rosas
1,3,
Vittoria E. M. S. Andrade
1,3,
Rafael G. Bento
4,
Luiz C. P. Silva
5,
João G. I. Cypriano
5 and
Osvaldo R. Saavedra
6
1
Electrical Engineering Department, IATI—Advanced Institute of Technology and Innovation, Recife 50751-310, Brazil
2
Electrical Engineering Department, UFSJ—Federal University of São João del-Rei, São João del-Rei 36307-352, Brazil
3
Electrical Engineering Department, UFPE—Federal University of Pernambuco, Recife 50670-901, Brazil
4
CPFL Energy, Campinas 13088-900, Brazil
5
Electrical Engineering Department, UNICAMP—Campinas State University, Campinas 13083-970, Brazil
6
Instituto de Energia Elétrica, UFMA—Federal Univerisity of Maranhão, Av. dos Portugueses s/n, Bacanga, São Luís 65080-040, Brazil
*
Authors to whom correspondence should be addressed.
Energies 2024, 17(2), 341; https://doi.org/10.3390/en17020341
Submission received: 5 December 2023 / Revised: 22 December 2023 / Accepted: 29 December 2023 / Published: 9 January 2024
(This article belongs to the Section A1: Smart Grids and Microgrids)

Abstract

:
Microgrids have emerged as a popular solution for electric energy distribution due to their reliability, sustainability, and growing accessibility. However, their implementation can be challenging, particularly due to regulatory and market issues. Building smaller-scale microgrids, also known as nanogrids, can present additional challenges, such as high investment costs that need to be justified by local demands. To address these challenges, this work proposes an economic feasibility assessment model that is applied to a real nanogrid under construction in the Brazilian electrical system, with electric vehicle charging stations as its main load. The model, which takes into account uncertainties, evaluates the economic viability of constructing a nanogrid using economic indicators estimated by the Monte Carlo simulation method, with the system operation represented by the OpenDSS software. The model also considers aspects of energy transactions within the net-metering paradigm, with energy compensation between the nanogrid and the main distribution network, and investigates how incentives can impact the viability of these microgrids.

1. Introduction

The importance assumed by electric energy for economic and social development worldwide, as well as the growing concern regarding environmental sustainability, points to the need for increasingly reliable, sustainable, and accessible electric power systems. Within this framework, microgrids are becoming popular as a solution for electric power distribution [1,2]. Essentially, microgrids are decentralized electric power systems that can operate connected or disconnected (i.e., islanded) from the main electric power distribution grid and are composed of distributed generation ((DG) mostly from renewable energy sources), energy storage systems (ESSs), and control devices.
However, while implementing microgrids may offer many benefits, their implementation can be challenging, especially considering regulatory and market issues [3]. In general, most electric power regulation systems were designed for centralized generation and distribution systems. Additionally, the traditional business model for electric power generation, transmission, and distribution may not fit the needs of decentralized microgrids. Therefore, implementing microgrids requires changes in electric power regulation to allow better use of distributed energy resources (DERs) and ensure the economic viability of these systems.
From this perspective, building smaller-scale microgrids, known as nanogrids [4,5], may present its own challenges, mainly related to the high investment costs that need to be justified by local demands. That is, the limitation of scale can make the nanogrid less attractive to investors and energy service providers. Therefore, the economic viability of building a nanogrid requires a careful evaluation of the available technology options for DERs and the presence of favorable local incentives and regulations in order to ensure that the necessary investment is justified.
This work proposes an economic feasibility assessment model taking into account the uncertainty aspects of electrical nanogrid-type microgrids, which can be defined as small-scale microgrids connected in low voltage and limited to a single consumer unit. The main results and innovations discussed in this work are derived from the results of studies that are part of a research and development (R&D) initiative, the MERGE project (Microgrids for Efficient, Reliable and Greener Energy) [6]. This project is financed by the distribution companies of the CPFL Energia Group, with resources from the ANEEL R&D program.
In the proposed evaluation model, the economic viability of building a nanogrid is analyzed through economic indicators estimated by the Monte Carlo simulation (MCS) method. When employing the MCS method, each evaluated sample corresponds to the operation of the microgrid during a defined time horizon, subdivided into intervals. The assessment of the total number of samples considers the consumption variation within the nanogrid, where electric vehicle (EV) charging stations constitute the primary load to be accommodated. Additionally, it factors in the availability of energy generation from sources based on known probability distributions. The assessment of samples generated through the MCS method, featuring an appropriate representation of DERs and loads, is conducted utilizing the OpenDSS software [7], controlled through the Python programming language. The aspects of energy transactions defined through compensation systems between the microgrid and the main distribution network, as well as any necessary incentives for the viability of these microgrids, are considered and investigated based on the model.
The main contributions of this work are as follows:
  • Proposal of an economic evaluation model specifically designed for nanogrids, taking into account the uncertainties associated with both consumption and generation;
  • Evaluation of the impact of tariff incentives on the economic viability of nanogrid-type microgrids with EV charging stations. In the Brazilian context, the results can be used by policy-makers to make well-founded decisions;
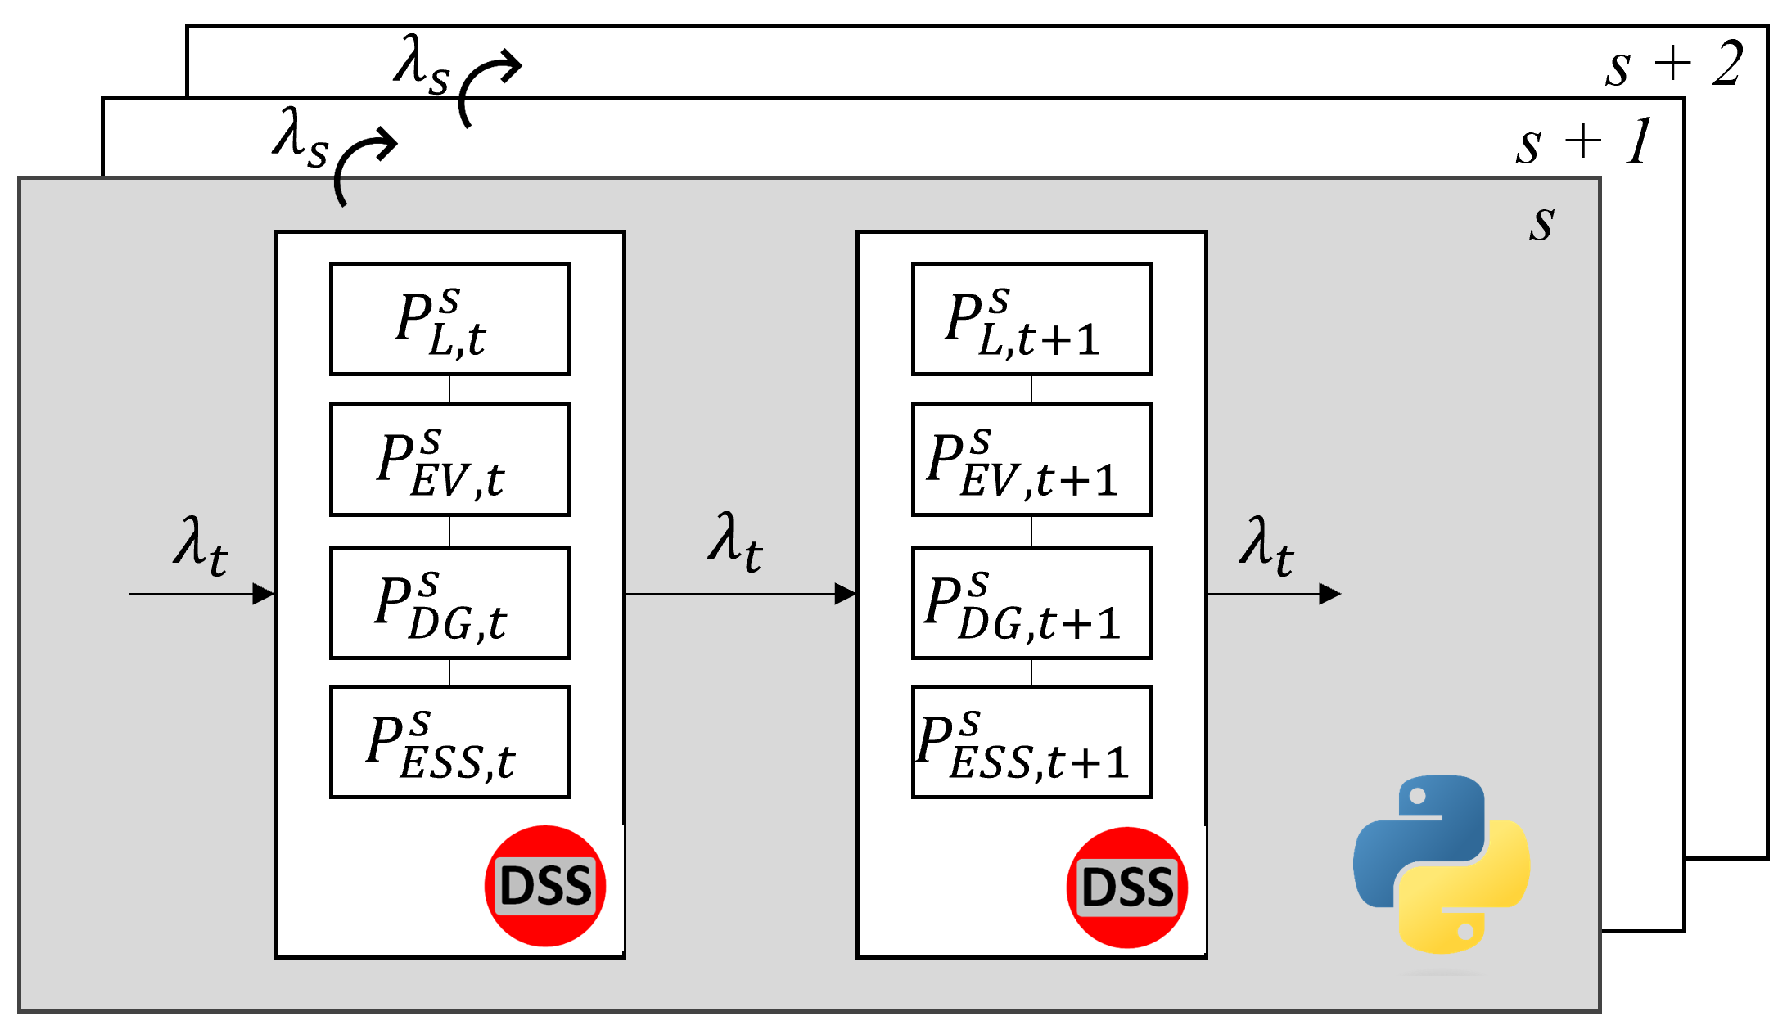
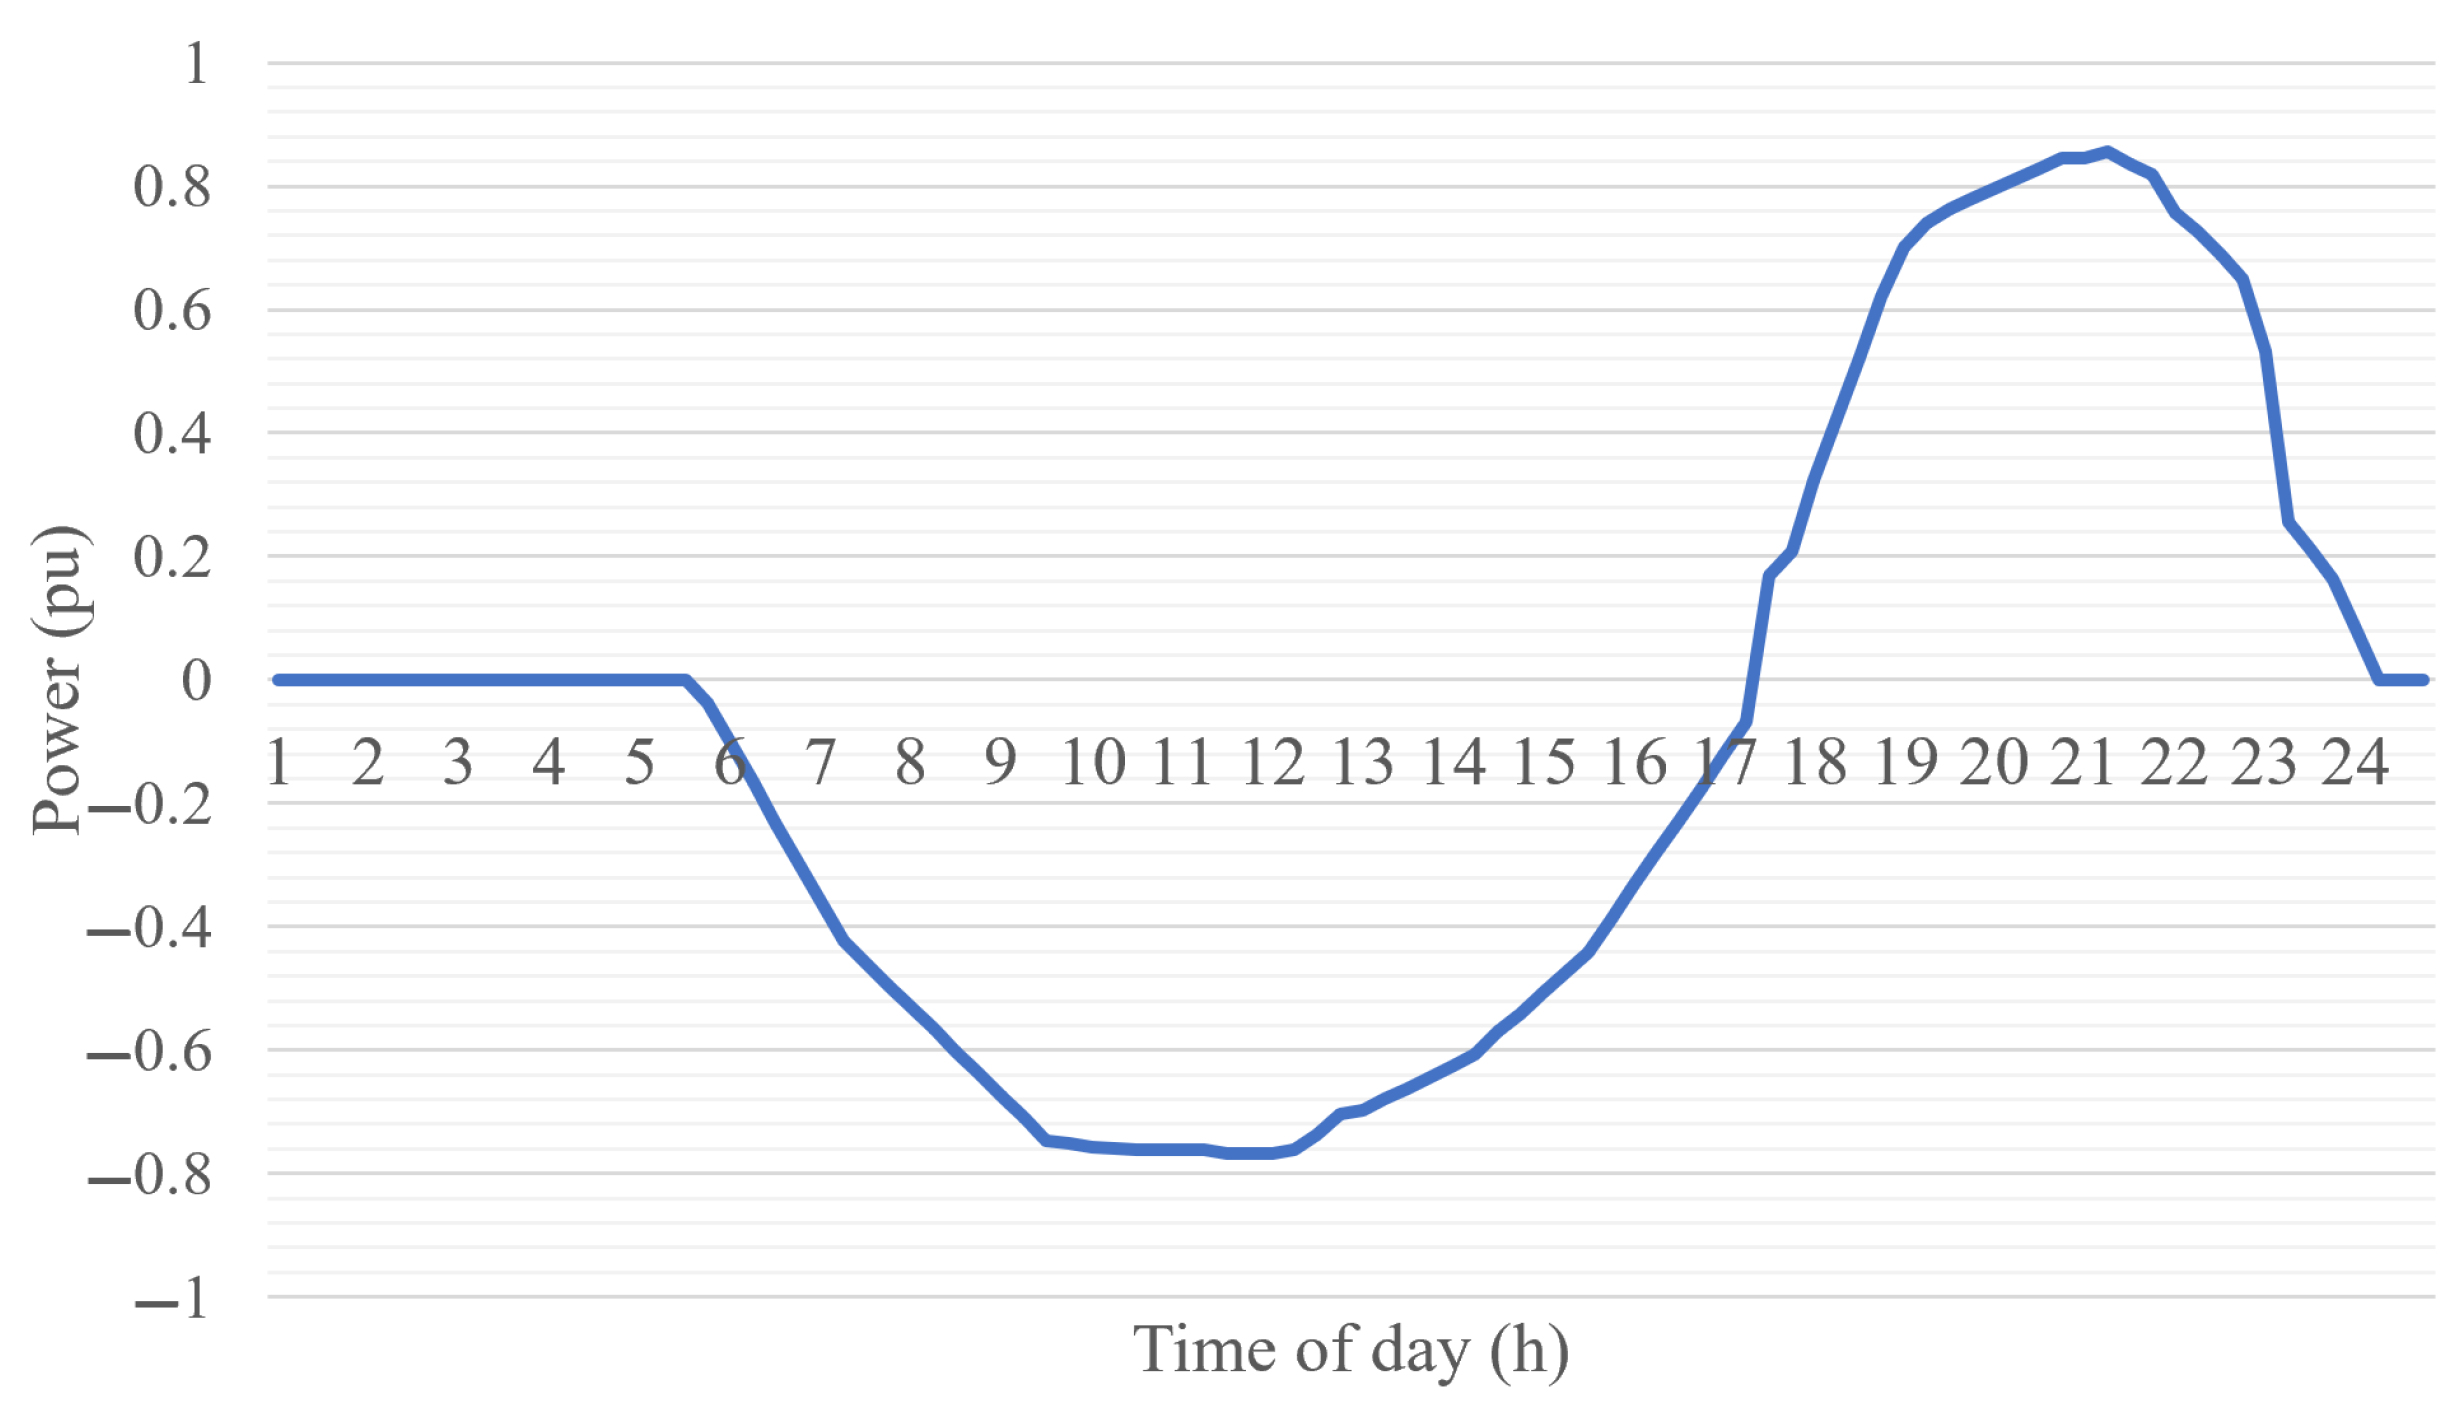
  • An economic model based on electric quantities that allows monitoring of power, voltages, and currents on the nanogrid components throughout the entire evaluation period. Additionally, the technical impacts on the main grid, in connected mode, are available for analysis.
In addition to this introductory section, this manuscript comprises four main sections. Section 2 provides an overview of nanogrids, focusing on their feasibility for implementation. Section 3 outlines the proposed evaluation model, including the economic indicators used and the relevant equations. Section 4 presents a case study with a real nanogrid under construction in the Brazilian electrical system, where EV charging stations are the main load. In this section, the impacts of regulatory and market incentives on the economic feasibility of constructing these microgrids are explored. Finally, Section 5 offers a detailed discussion of the main conclusions drawn from the developed work.

2. Background of Nanogrids
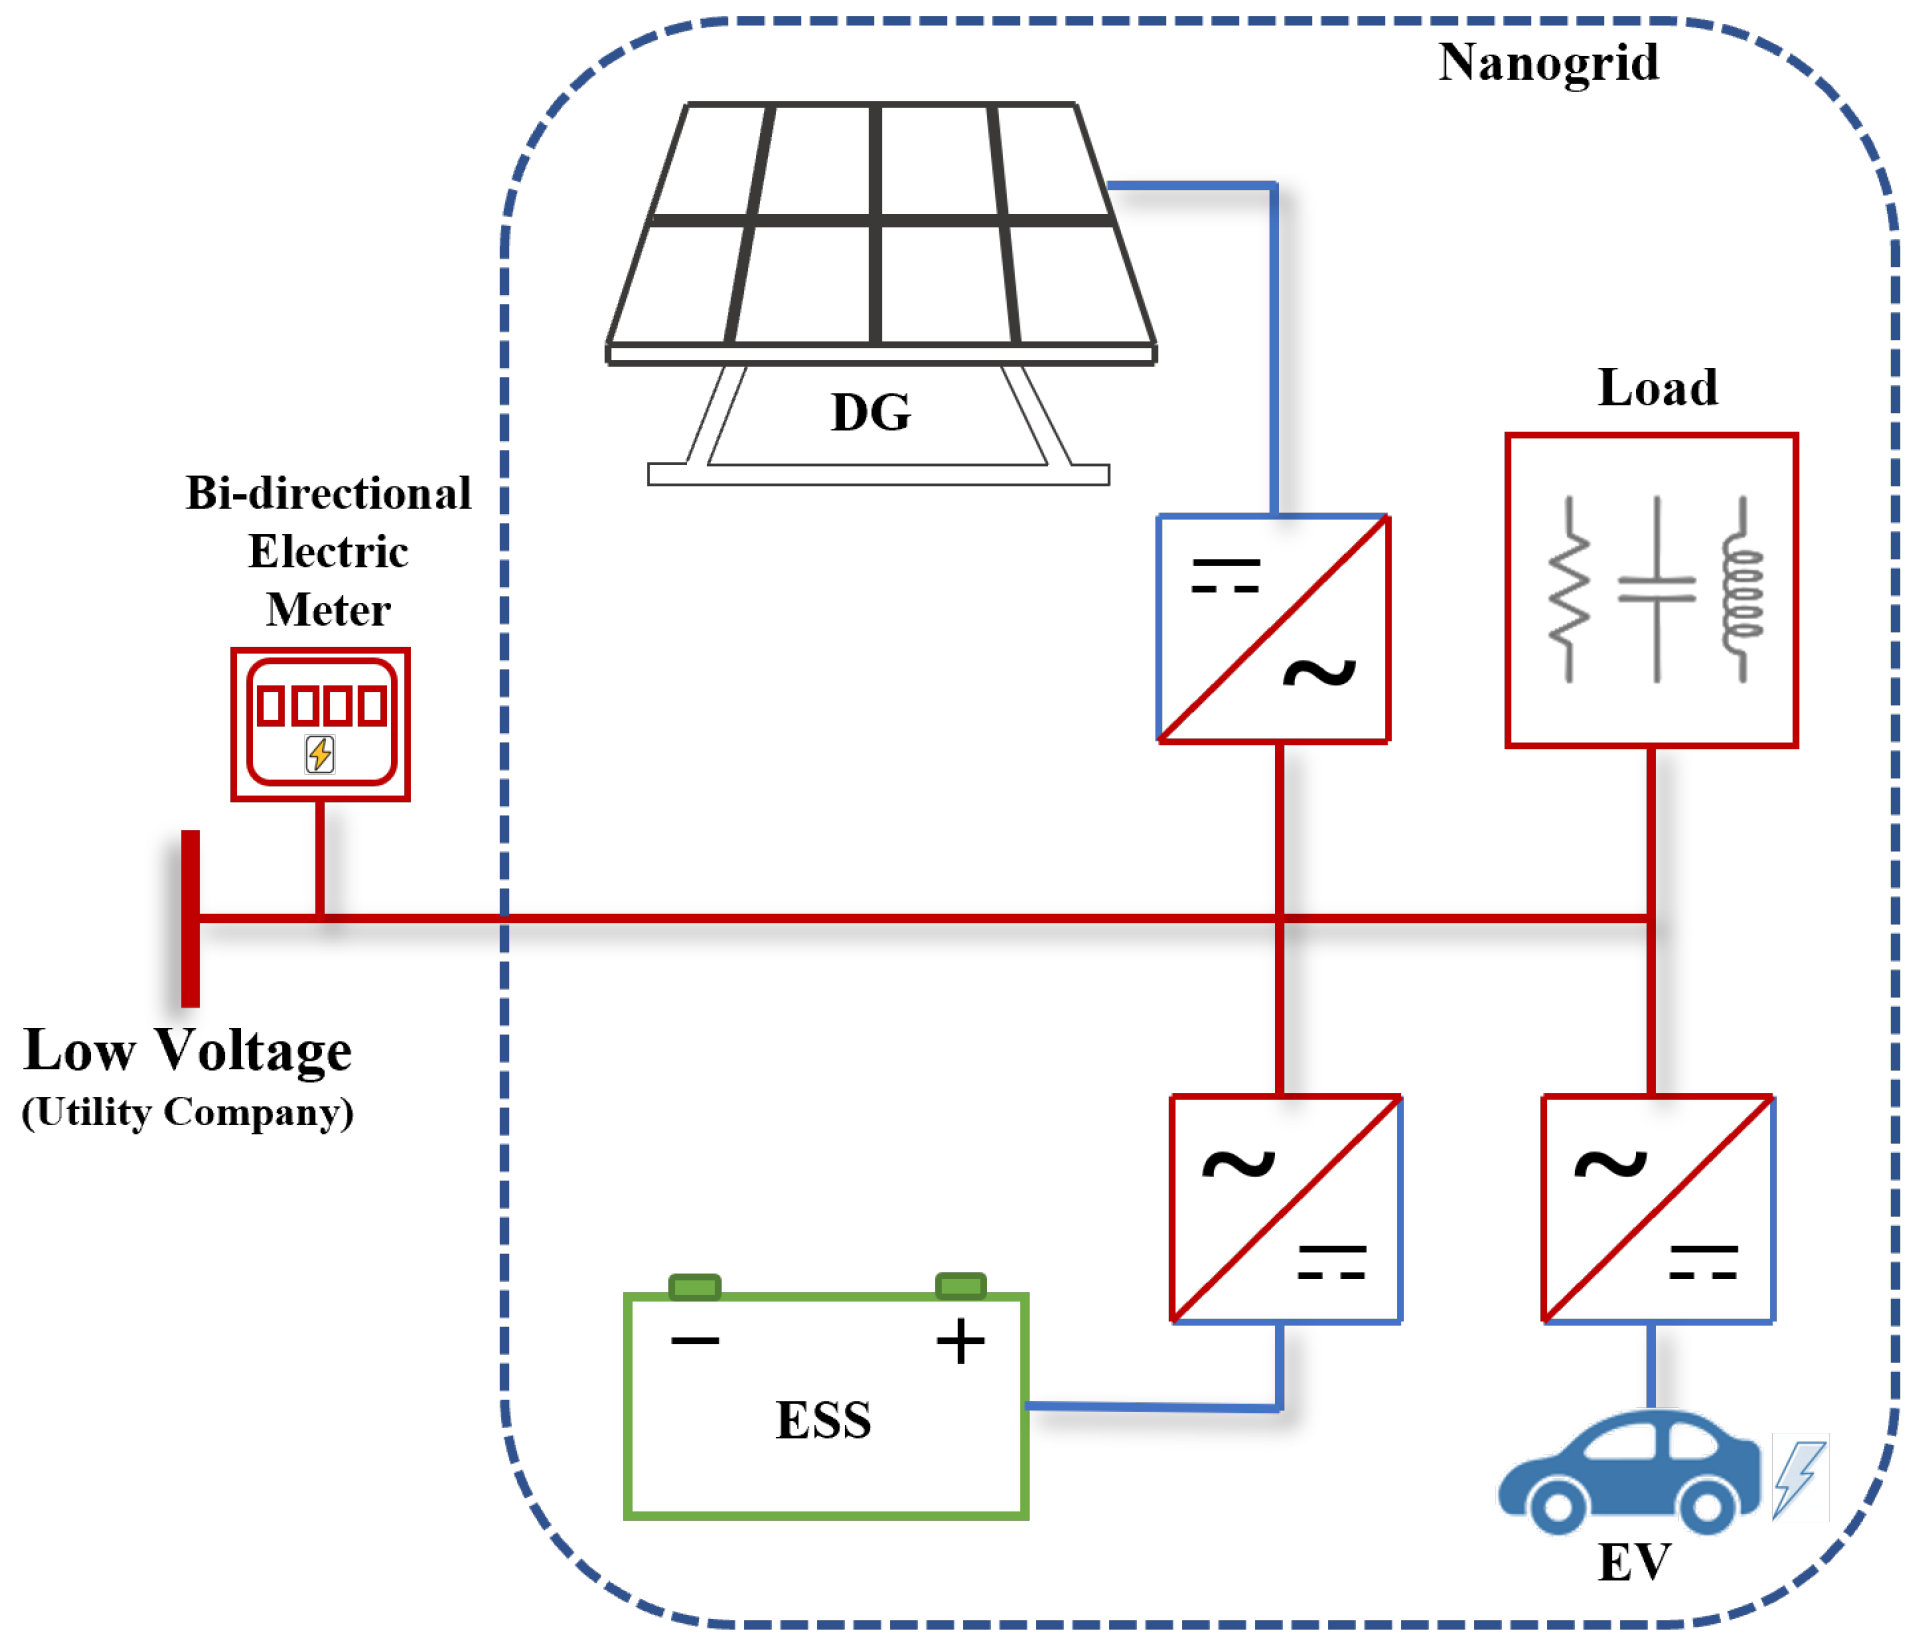
2.1. Basic Concepts

A nanogrid is a small-scale single-unit version of a microgrid, which is a localized group of electricity sources and loads that can operate independently from the main power grid or connect to it. Like a microgrid, a nanogrid can include multiple energy sources, such as solar panels, wind turbines, and energy storage devices [4,5]. A simple representative diagram of the structure of a residential nanogrid is presented in Figure 1.
The current concern about the growth of EV infrastructure can be supported by building nanogrids. As a load, EVs can be connected to the nanogrid and use energy generated from renewable sources.
In this work, a nanogrid is defined as a single-customer unit equipped with DERs operating in a coordinated manner, connected at low voltage, and capable of functioning connected to the distribution network or in an islanded way, even if only momentarily, provided it is adequately sized and in compliance with current operational agreements and technical standards.
In summary, nanogrids present a promising approach for delivering reliable, efficient, and sustainable energy solutions for small-scale purposes. With the ongoing reduction in the costs of renewable energy resources and energy storage technologies, the adoption of nanogrids is projected to rise, addressing the energy requirements of diverse applications. Nevertheless, the economic feasibility of establishing nanogrids hinges on regulatory incentives and market adaptations, which are a focal point of inquiry in this study. Numerous endeavors have been undertaken to enhance the feasibility of constructing these systems, as briefly outlined in the following subsection.

2.2. Literature Review

Amid the current challenges in the technical, market, and regulatory domains, various countries have undertaken efforts to evaluate and enhance the economic viability of nanogrids. This aspect is crucial for the development of this electricity-providing model. Related studies can be broadly categorized into two main groups. The first group focuses on optimizing the design and energy management of nanogrids, while the second group primarily conducts economic analyses on real-life case studies. However, it should be mentioned that intersections do occur. Finally, an important point raised from this brief literature review is that regulatory issues are rarely taken into consideration in cost-effectiveness evaluations.
Since an Energy Management System (EMS) can facilitate economic operations by making decisions that optimize the customer’s usage of resources, ref. [8] presents a hardware and software solution based on the Internet of Things (IoT) for a smart home nanogrid. The EMS responds to the 24 h day-ahead electricity tariff, operating the nanogrid’s distributed energy resources (DERs) to minimize costs. Although investment costs are not extensively discussed, there are indications that the proposed EMS application can lead to monetary and energy savings. In [9], a DC nanogrid is operated via a bilevel EMS, having as the primary control strategy the droop characteristic of BESS and V2G (vehicle-to-grid), if available, absorbing the intermittency of renewables, while power economic dispatch is pursued in longer timescales. The methodology is validated through simulations in the MATLAB Simulink platform, which is also employed to design feasible nanogrids in [10].
Regarding the survey of economic indicators in the context of micro- and nanogrids, the HOMER software [11] is widely employed. In [12], the levelized cost of electricity (LCOE) and the net present cost (NPC) are estimated by considering a 25-year hourly simulation for a nanogrid in Nigeria. The study highlights that applying the proposed hybrid optimization of multiple DERs can result in a lower LCOE than the tariff rate. In their work in [13], the authors present an optimization problem solved using linear programming relaxation to minimize LCOE and NPC, with the help of the HOMER software. The optimization algorithm is developed using MATLAB scripts and compared with the particle swarm optimization metaheuristic, showing promising results. In the economic analysis conducted by [14], HOMER is used to find that an on-grid, PV-based nanogrid with a relatively small BESS is the most cost-effective solution for rural communities in the Himalayas. The authors in [15] present an off-grid nanogrid design approach considering the Indian market environment. It is worth mentioning that local factors always play a central role in this type of viability/feasibility study. Other studies that utilize HOMER software along with optimization tools to pursue economic benefits can be found in [16,17,18].
Economic evaluations of real-world nanogrids are occasionally reported in the literature. In the case study presented by [19], a residential grid/PV/BESS nanogrid is compared with a configuration without BESS. The study estimates net present value (NPV) and payback indicators under different regulatory conditions. The findings indicate that the BESS nanogrid is feasible only if a grant for its cost or relatively high feed-in tariffs (FiT) are implemented. It is worth noting that in Algeria, where the study is conducted, there is currently no regulatory framework considering residential distributed generation (DG). The significance of these results lies in providing support for policy-maker decisions that can promote the decentralized and renewable generation model. The same indication regarding how the costs of BESS push nanogrid payback indicators further is found in real-world cases in Thailand [20] and South Korea [21], where the nanogrids are formed for a lighting road system and distribution substations, respectively.
Other research initiatives to assess nanogrids from a technoeconomic perspective have recently been developed, considering further opportunities such as hydrogen energy storage [22], cryptocurrency [23], second-life battery usage [24], and the compartmentalization of larger networks into nanogrids [25].

3. Technoeconomic Evaluation Model

This section introduces the proposed economic evaluation model designed to identify regulatory and market requisites essential for the viability of establishing nanogrid-type microgrids within distribution systems. The economic metrics are estimated via Monte Carlo simulation (MCS), where each assessed sample represents the microgrid’s operation throughout a defined time horizon, denoted as T and subdivided into time intervals, t (in this study, each interval spans 15 min). A total of S samples are examined, accounting for consumption variations, including the uncertainties related to EV charging, and the availability of energy sources for generation based on known probability distributions.
The technoeconomic evaluation methodology is implemented using Python scripts, and the OpenDSS software (via DLL) is employed to model and track energy exchanges between the nanogrid and the primary grid, as depicted in the schematic representation in Figure 2. Within this figure, P L , t s signifies the power consumed by the nanogrid loads, P E V , t s represents the power used by EV charging stations, P D G , t s denotes the power generated by the internal generation system, and P E S S , t s corresponds to the power derived from the Energy Storage System (ESS) operation. All values are expressed in kilowatts (kW) and are evaluated within the interval t of scenario s.

3.1. Total Cost of Investment and Operation

The total cost ( C t o t a l ), in USD, incurred by the nanogrid, including both investment and operational costs, over the time horizon T, is an indicator estimated by the model, with its value calculated as follows:
C t o t a l = I n p v + s = 1 S B n p v s S
where I n p v , in USD, corresponds to the investment, in net present value, made for the installation of DERs, and B n p v s , also in USD, represents the net present value of energy bills verified during the entire time horizon T of microgrid operation for sample s generated in the evaluation by the MCS method.
The I n p v investment corresponds to a deterministic value equal for all samples generated via the MCS method (i.e., no uncertainty is considered for its determination). Basically, in the computation of I n p v , the costs and life cycle of each of the elements that compose the DG and ESS resources (i.e., inverters, batteries, and photovoltaic generation modules) are observed. For each component, the calculation of a uniform series of payments equivalent to the net present value of the investment is considered. Then, the value of each portion of the uniform series, including replacements, is used to account for the total investment of the component considering the evaluation time horizon T. With this representation, the residual value of this equipment is discounted at the end of the time horizon, as considered in [26]. More details on the calculation of the investment I n p v are presented in Appendix A. It is possible to note that, from this model for calculating the total investment of the microgrid, it is even possible to represent the installation of new DERs at any time within the given time horizon T.
The energy bills from purchasing electricity supplied by the main distribution network, which represent the operating cost, are used to calculate B n p v s . These bills are calculated for each month m of Ω M (set of months that form the evaluation time horizon T). As the amount of energy purchased depends on the internal generation and consumption observed each month during the operation of the nanogrid, due to uncertainty models, B n p v s varies between the different samples generated and evaluated via MCS. Therefore, for each sample s, B n p v s is given by the sum of the equivalent net present value of all the electricity bills paid in the time horizon T:
B n p v s = m Ω M B m s ( 1 + r ) m
where B m s , in USD, corresponds to the energy bill in the month m and sample s, and r corresponds to the monthly discount rate applied to calculate the net present value. It is noteworthy that, by definition, B n p v s can only present positive values, since B m s will always be positive in the problem under analysis. However, this assumption may be relaxed in a local market setup, contingent upon innovative business models.
In order to calculate the energy bills for each month (i.e., B m s ), the net power demanded from the distribution network at the nanogrid point of common coupling (PCC) is calculated following (3), adapted from [27]:
P N , t s = P L , t s + P E V , t s P D G , t s + P E S S , t s t T
where P N , t s represents the net power demanded from the distribution network in the PCC over the interval t of time horizon T, in kW, which can be positive, when the energy is actually being demanded from the network, or negative, when it is being injected into the network. In (3), P L , t s , P E V , t s , and P D G , t s present only positive values, while P E S S , t s can exhibit both positive values, during the intervals t when the ESS is being charged, and negative values, when the ESS is supplying energy to the microgrid, discounting the losses inherent to the process. It is worth mentioning that the amount of energy injected into the distribution network in the intervals in which the power P N , t s is negative is accumulated, forming an electric energy credit according to the net-metering model. This energy credit to be used a posteriori can be calculated as presented in (4):
E C m s = E C ( m 1 ) s U m s + t T m E t
where E C ( m 1 ) s and E C m s , in kWh, represent, respectively, the amounts of energy credit verified at the end of months ( m 1 ) and m; U m s represents the amount of energy used (if available) for compensation within the same month m, following the rules of the net-metering regime, that allows self-generated power to offset utility electricity purchases; T m is the subperiod of T that corresponds to the month m; and E t , given by (5), is equivalent to the energy injected into the distribution network, corresponding to the surplus verified in t.
E t = 0 , P N , t s 0 t × P N , t s , P N , t s < 0
Therefore, for each month m of the time horizon T of the sample s, the bill to be paid by the nanogrid, in USD, can then be calculated as
B m s = m a x B 1 m s ; B 2 m s
where B 1 m s and B 2 m s are given, respectively, by (7) and (8).
B 1 m s = C m × t T m t × P t s U m s + C t + C B × U m s
B 2 m s = C m × E m i n + C t × U m s
where C m , in USD/kWh, is the value of the energy tariff in the month m, including taxes; P t s is equal to P N , t s when P N , t s 0 or null when P N , t s < 0 ; C t , in USD/kWh, is the tax cost related to the used energy transaction of the energy credit; C B , in USD/kWh, is the cost associated with paying for the use of the distribution network, called component B in this work; and E m i n , in kWh, is the minimum availability of energy to be paid by the customer, which arises from the Brazilian regulatory framework. The use of energy credit U m s depends on the existence of energy credit E C m s , accumulated according to (4).
As defined in (6), B m s corresponds to the highest value between B 1 m s , which represents the bill formed by the cost of energy consumed plus costs associated with the energy transaction tax used from the energy credit and with the energy transport in the distribution network (component B), and B 2 m s , which corresponds to the invoice comprising the minimum energy availability cost that the consumer must pay, along with the tax associated with the energy transaction [28].

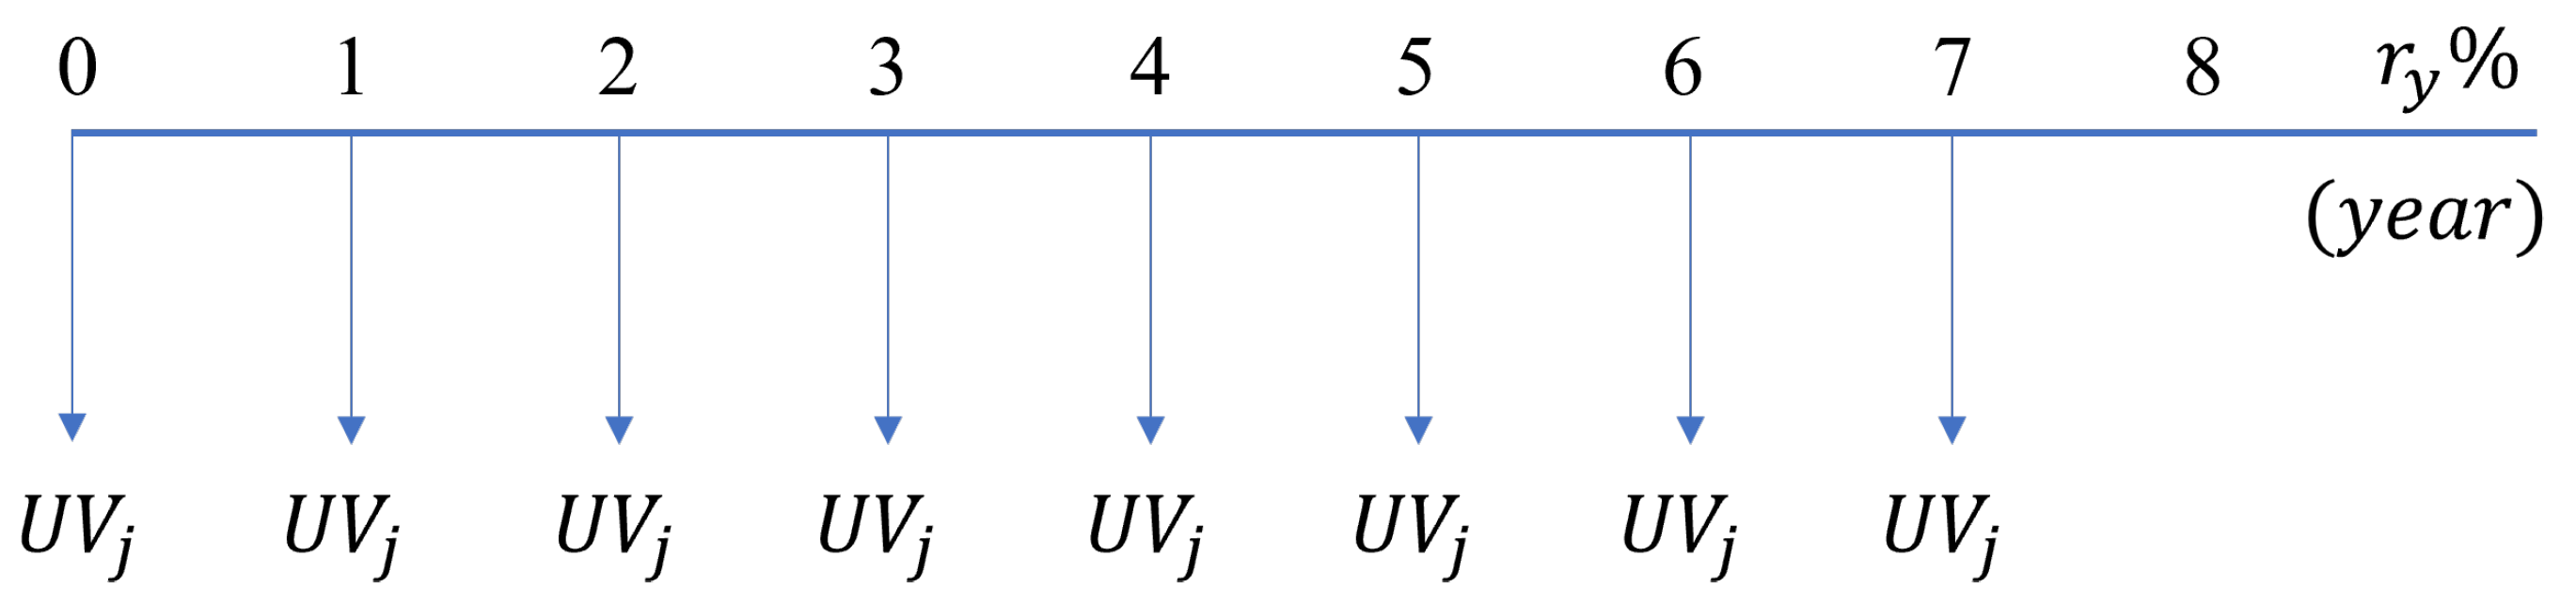
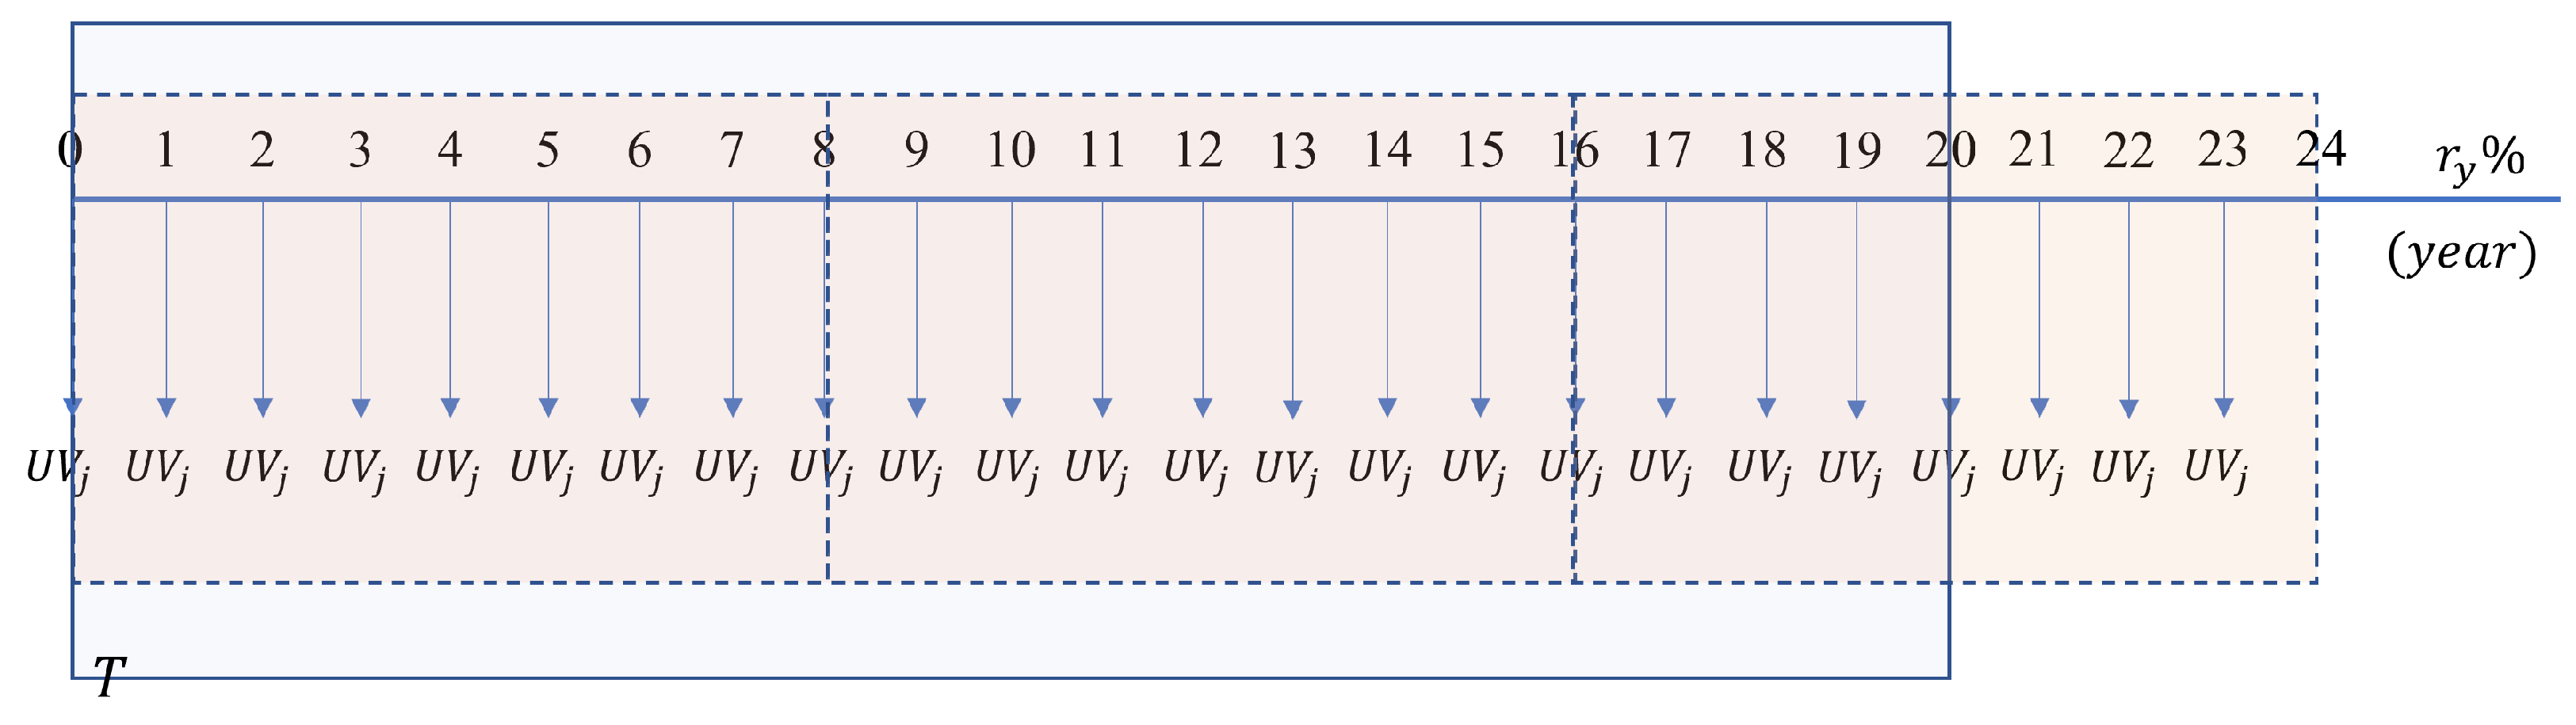
3.2. Expected Discounted Payback

The estimated investment recovery time for the project is represented here by the expected discounted payback ( P B D ), which accounts for the anticipated time in months for the project’s investment recovery. This indicator considers the “time value of money” and factors in the electricity bill reduction resulting from the initial investment in DERs for microgrid deployment. It distinguishes itself from a simple payback analysis.
P B D = s = 1 S P B D s S
where P B D s corresponds to the discounted payback observed in sample s, which is equal to the number of months required for the investment made in the project to be recovered.
In the proposed model, the value of P B D s is calculated considering the operating cost of the nanogrid without the installation of DERs (i.e., as if the consumer unit had not become a nanogrid). The reference bill B m r e f s is calculated for each month m according to (6) considering P N , t s = P L , t s + P E V , t s (i.e., P D G , t s = P E S S , t s = 0 , t T ). Therefore, the value of P B D s corresponds to the month in which the total cost of investment and operation verified for the nanogrid ( C t o t a l ) becomes less than the total reference cost ( C t o t a l r e f ), with these costs calculated in net present value for each sample.

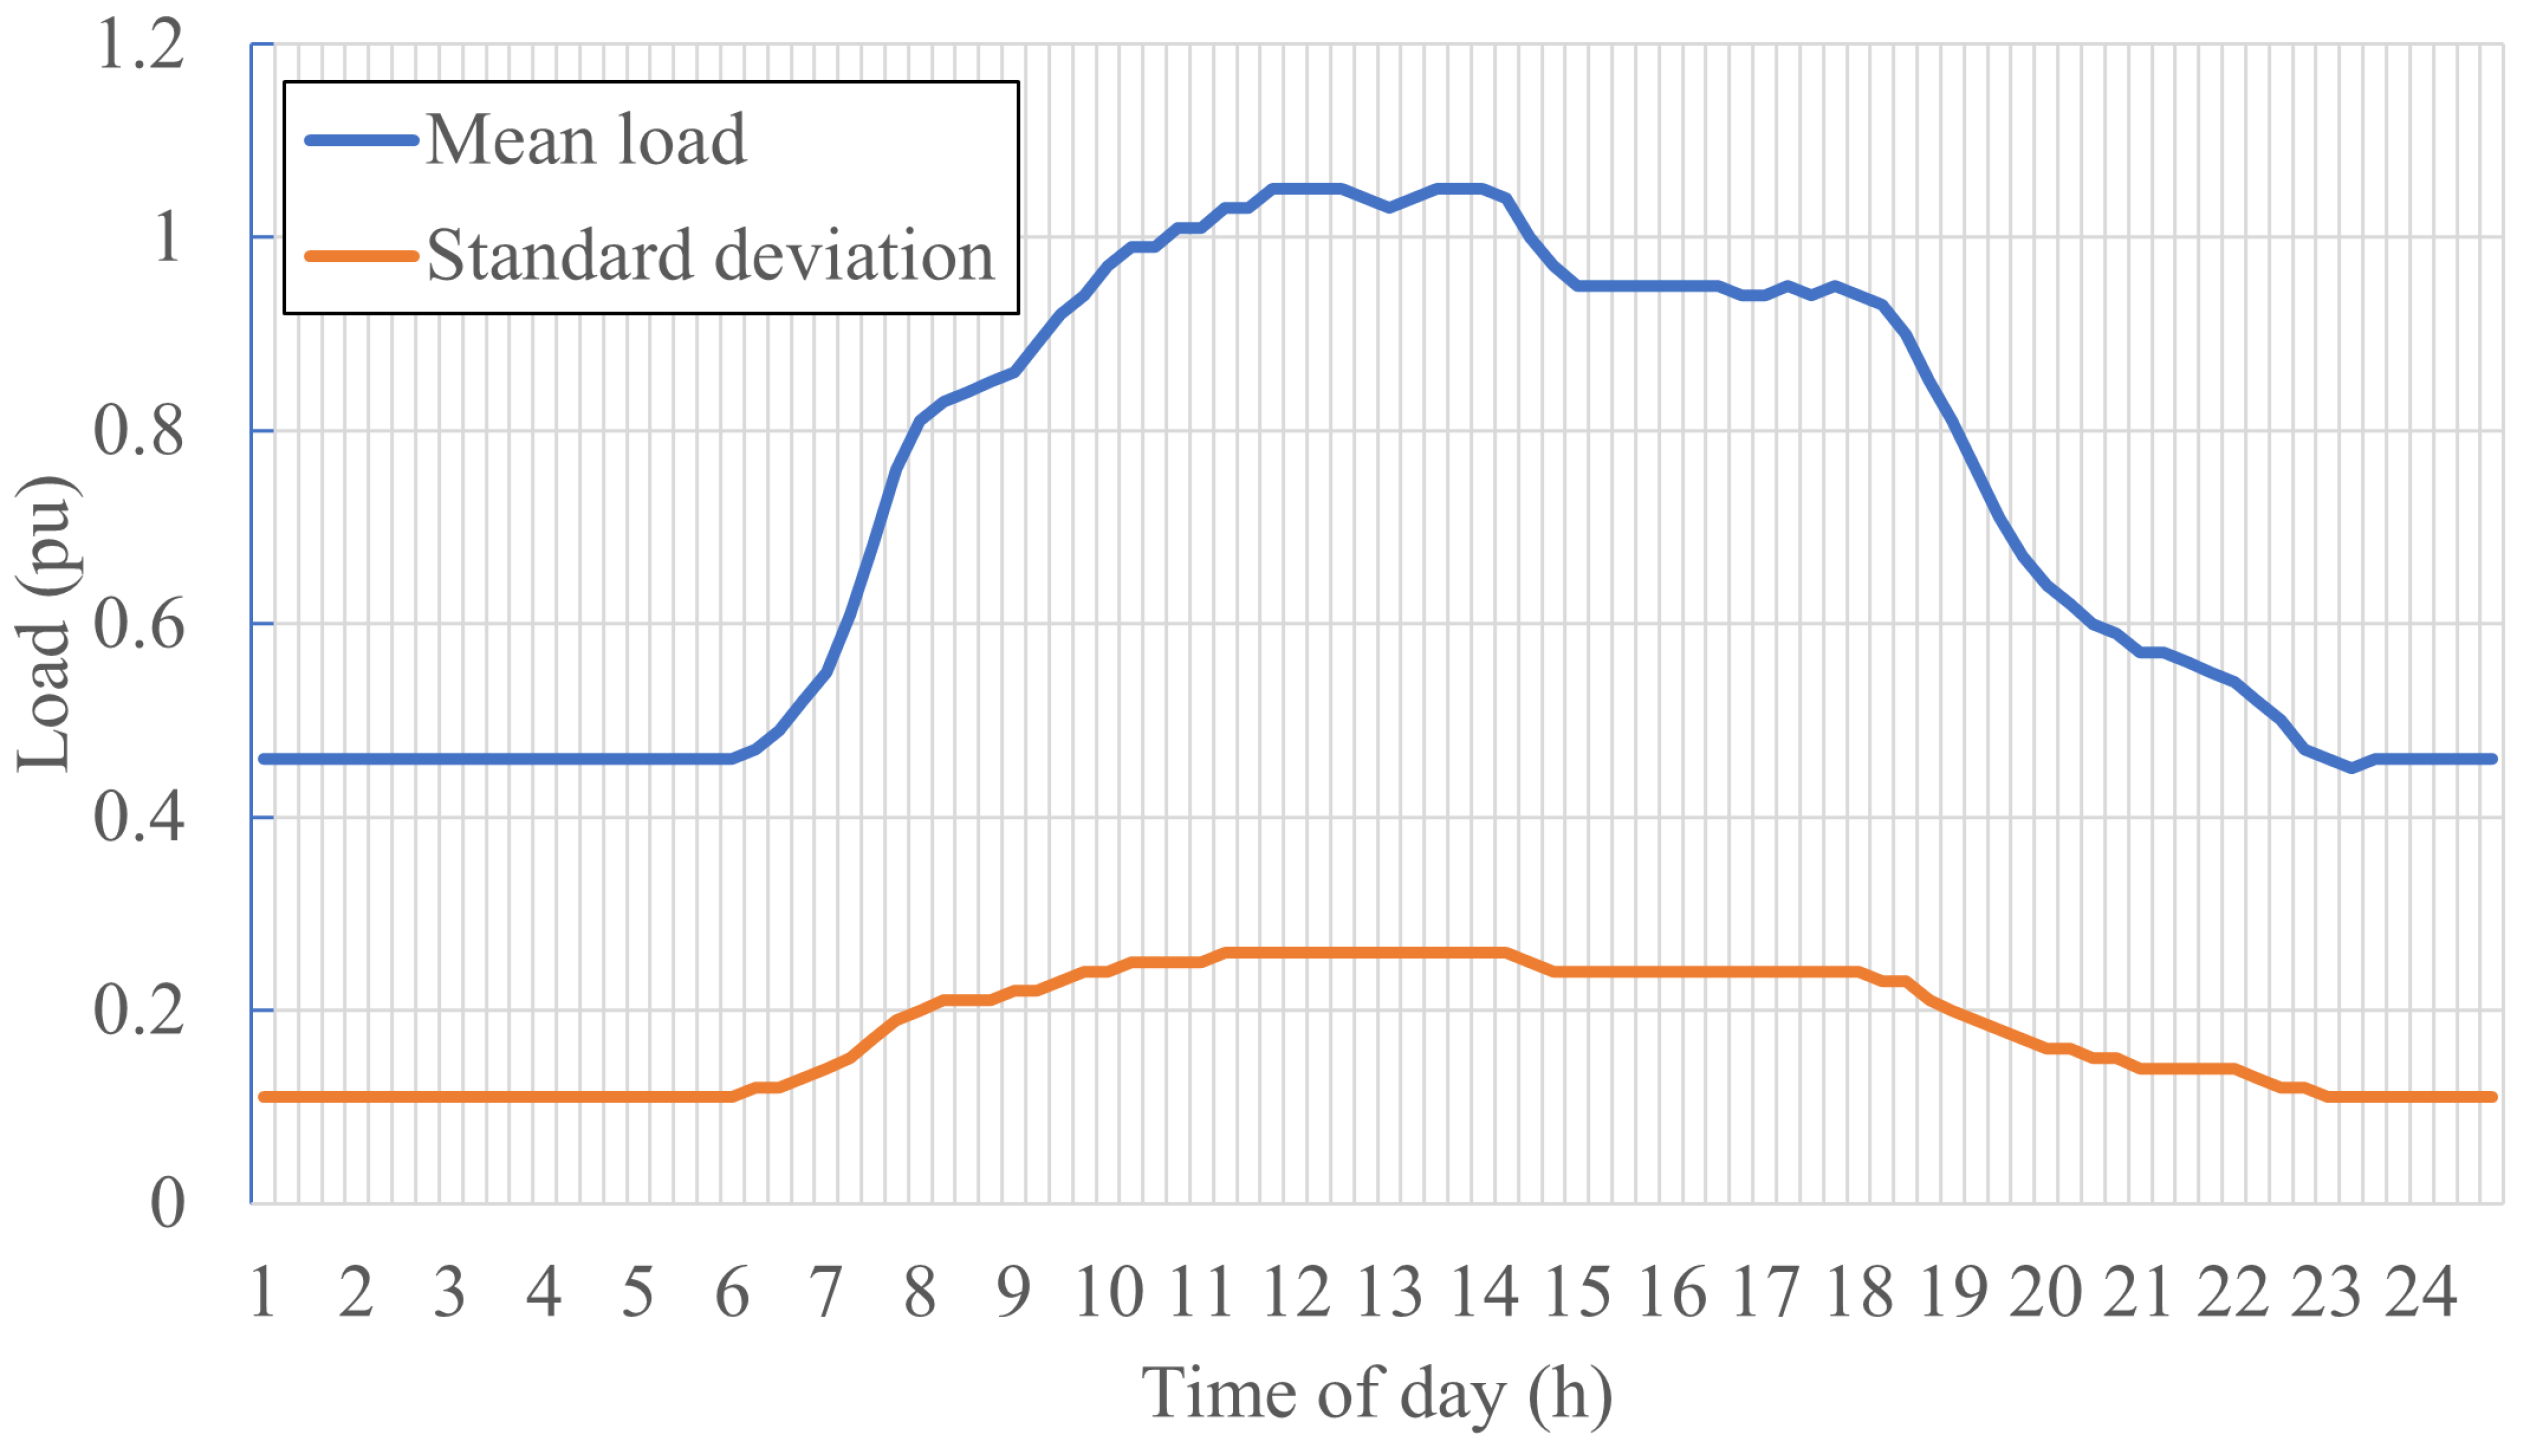
3.3. Uncertainties Representation

The total load of the microgrid is represented by a curve containing a consumption value for each time interval t within the evaluation time horizon T. In this case, in sample s generated via the MCS method, the values of P L , t s for each interval t to be applied in (3) are obtained from a normal distribution with known mean and standard deviation. The mean value and standard deviation of the load can vary at different time points of the day, week, and year, with appropriate representations of peak and off-peak hours, weekdays, holidays and weekends, seasons, and natural changes in load characteristics and growth.
The uncertainty of EV charging in the nanogrid is represented by a daily draw from a uniform distribution to determine the integer number of vehicles to be charged, ranging from a minimum number (e.g., zero) to a maximum number. Then, for each vehicle to be charged on the day, a second draw, also performed from a uniform distribution, defines the starting point of time of charging, and this charging is performed according to a known charging curve.
In the case of generation, uncertainties are considered for the availability of the primary energy source. In this study, photovoltaic generation is used; therefore, the uncertainties are introduced through the irradiance and temperature observed at each interval t, which are input parameters for the DG model implemented in OpenDSS. Each of these parameters is represented by a normal distribution, with the mean value and standard deviation being known for different intervals within the evaluation time horizon T.

4. Application of the Technoeconomic Evaluation Model

4.1. Case Study Definition

Technoeconomic simulations for three different study configurations were conducted considering a three-phase consumer unit:
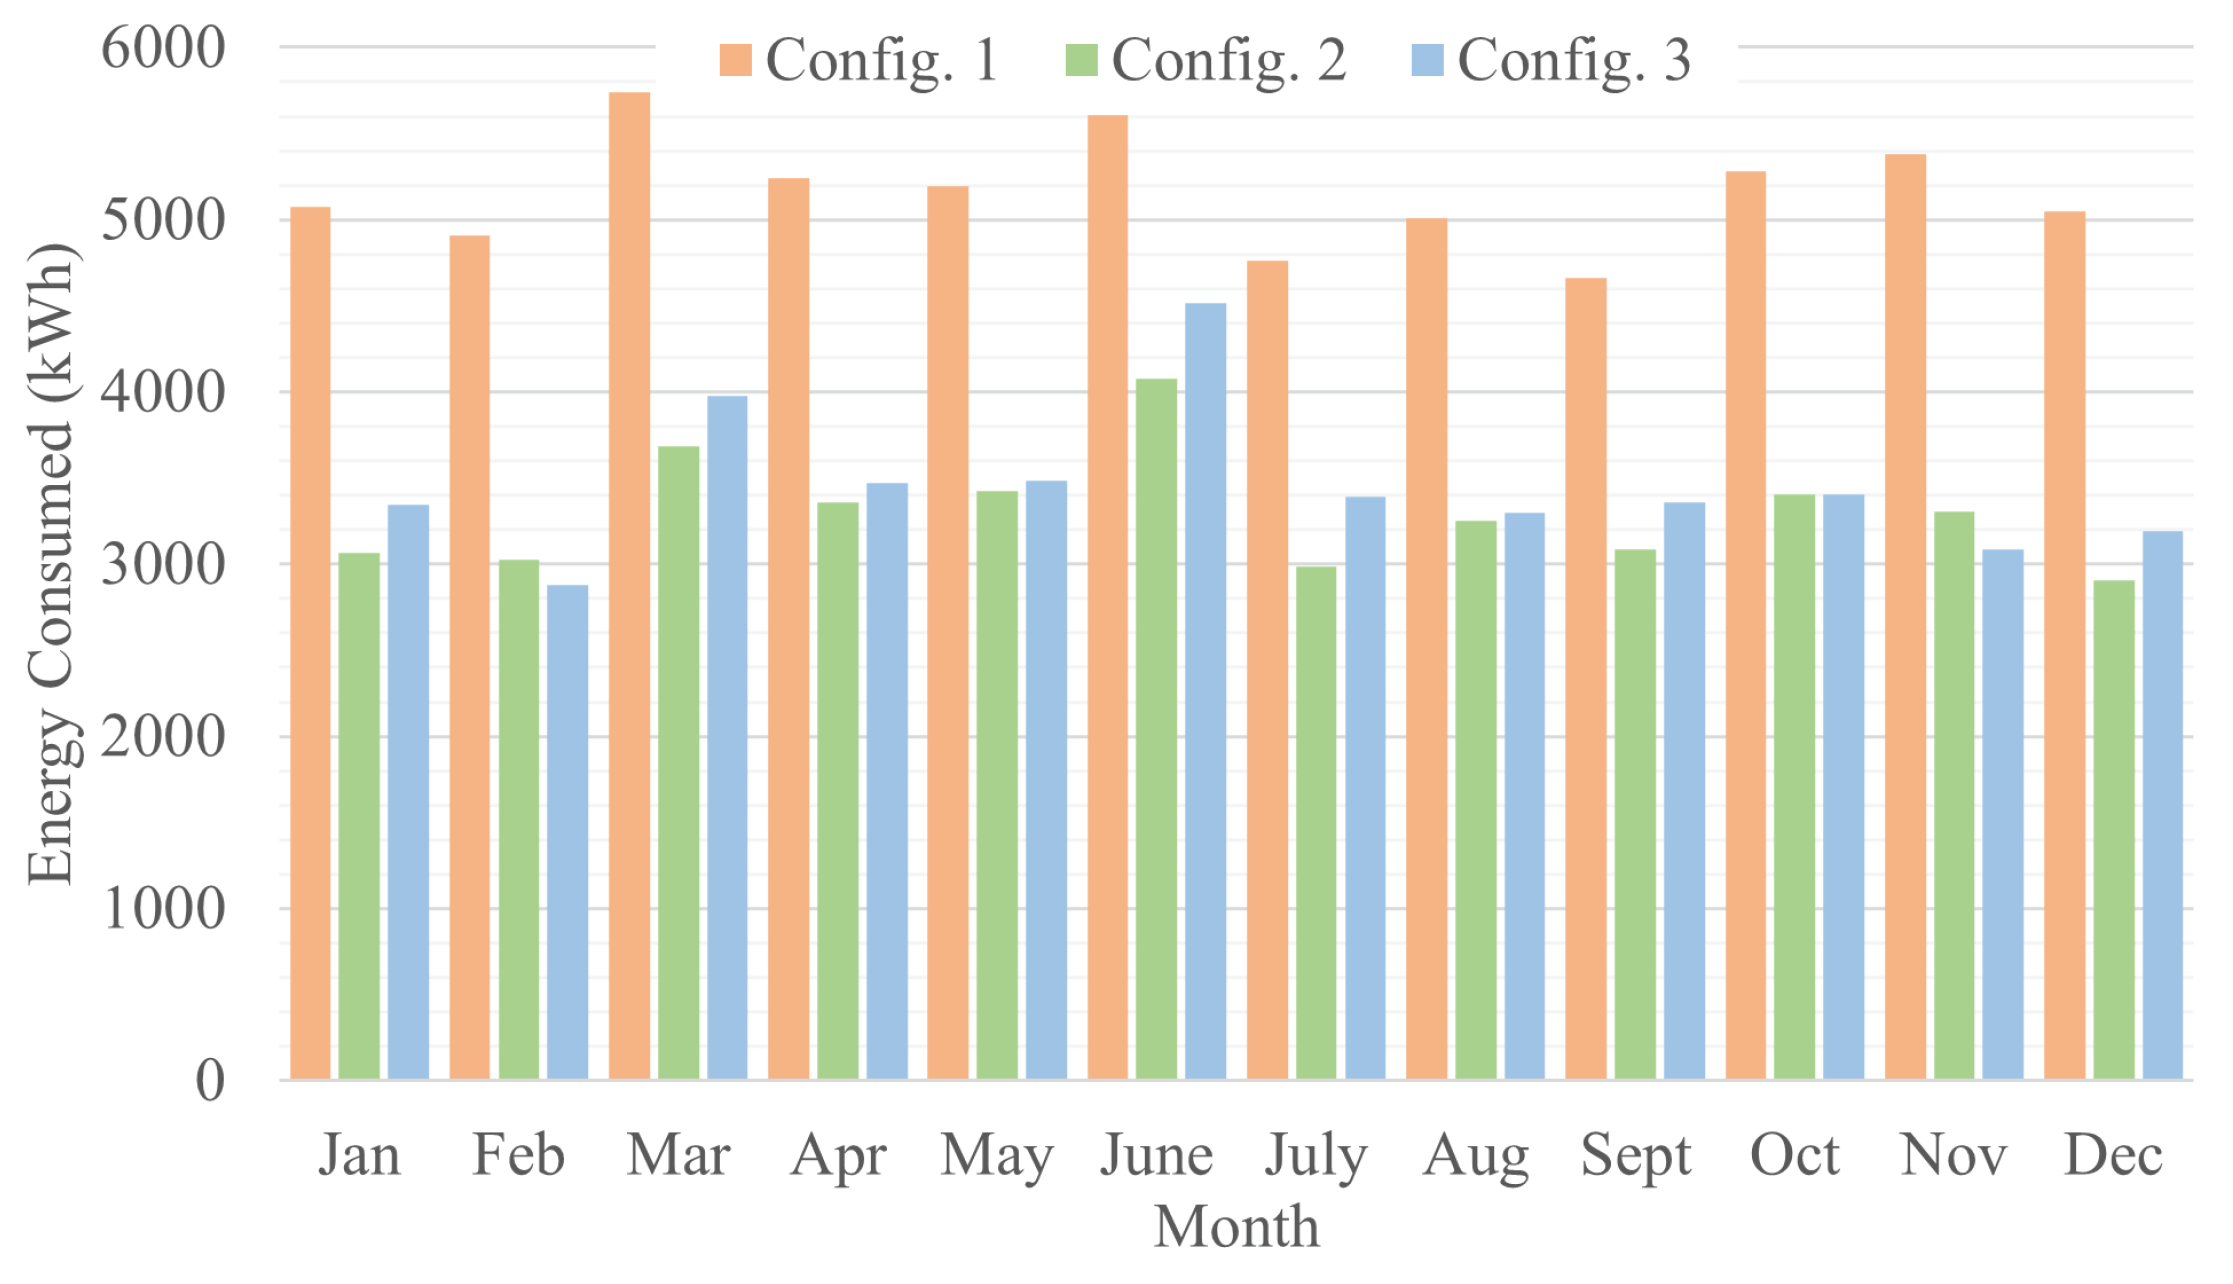
  • Config. 1: Consumer unit without DG and ESS. This configuration represents a reference (“benchmark”) for evaluating the economic indicators related to the implementation of the nanogrid;
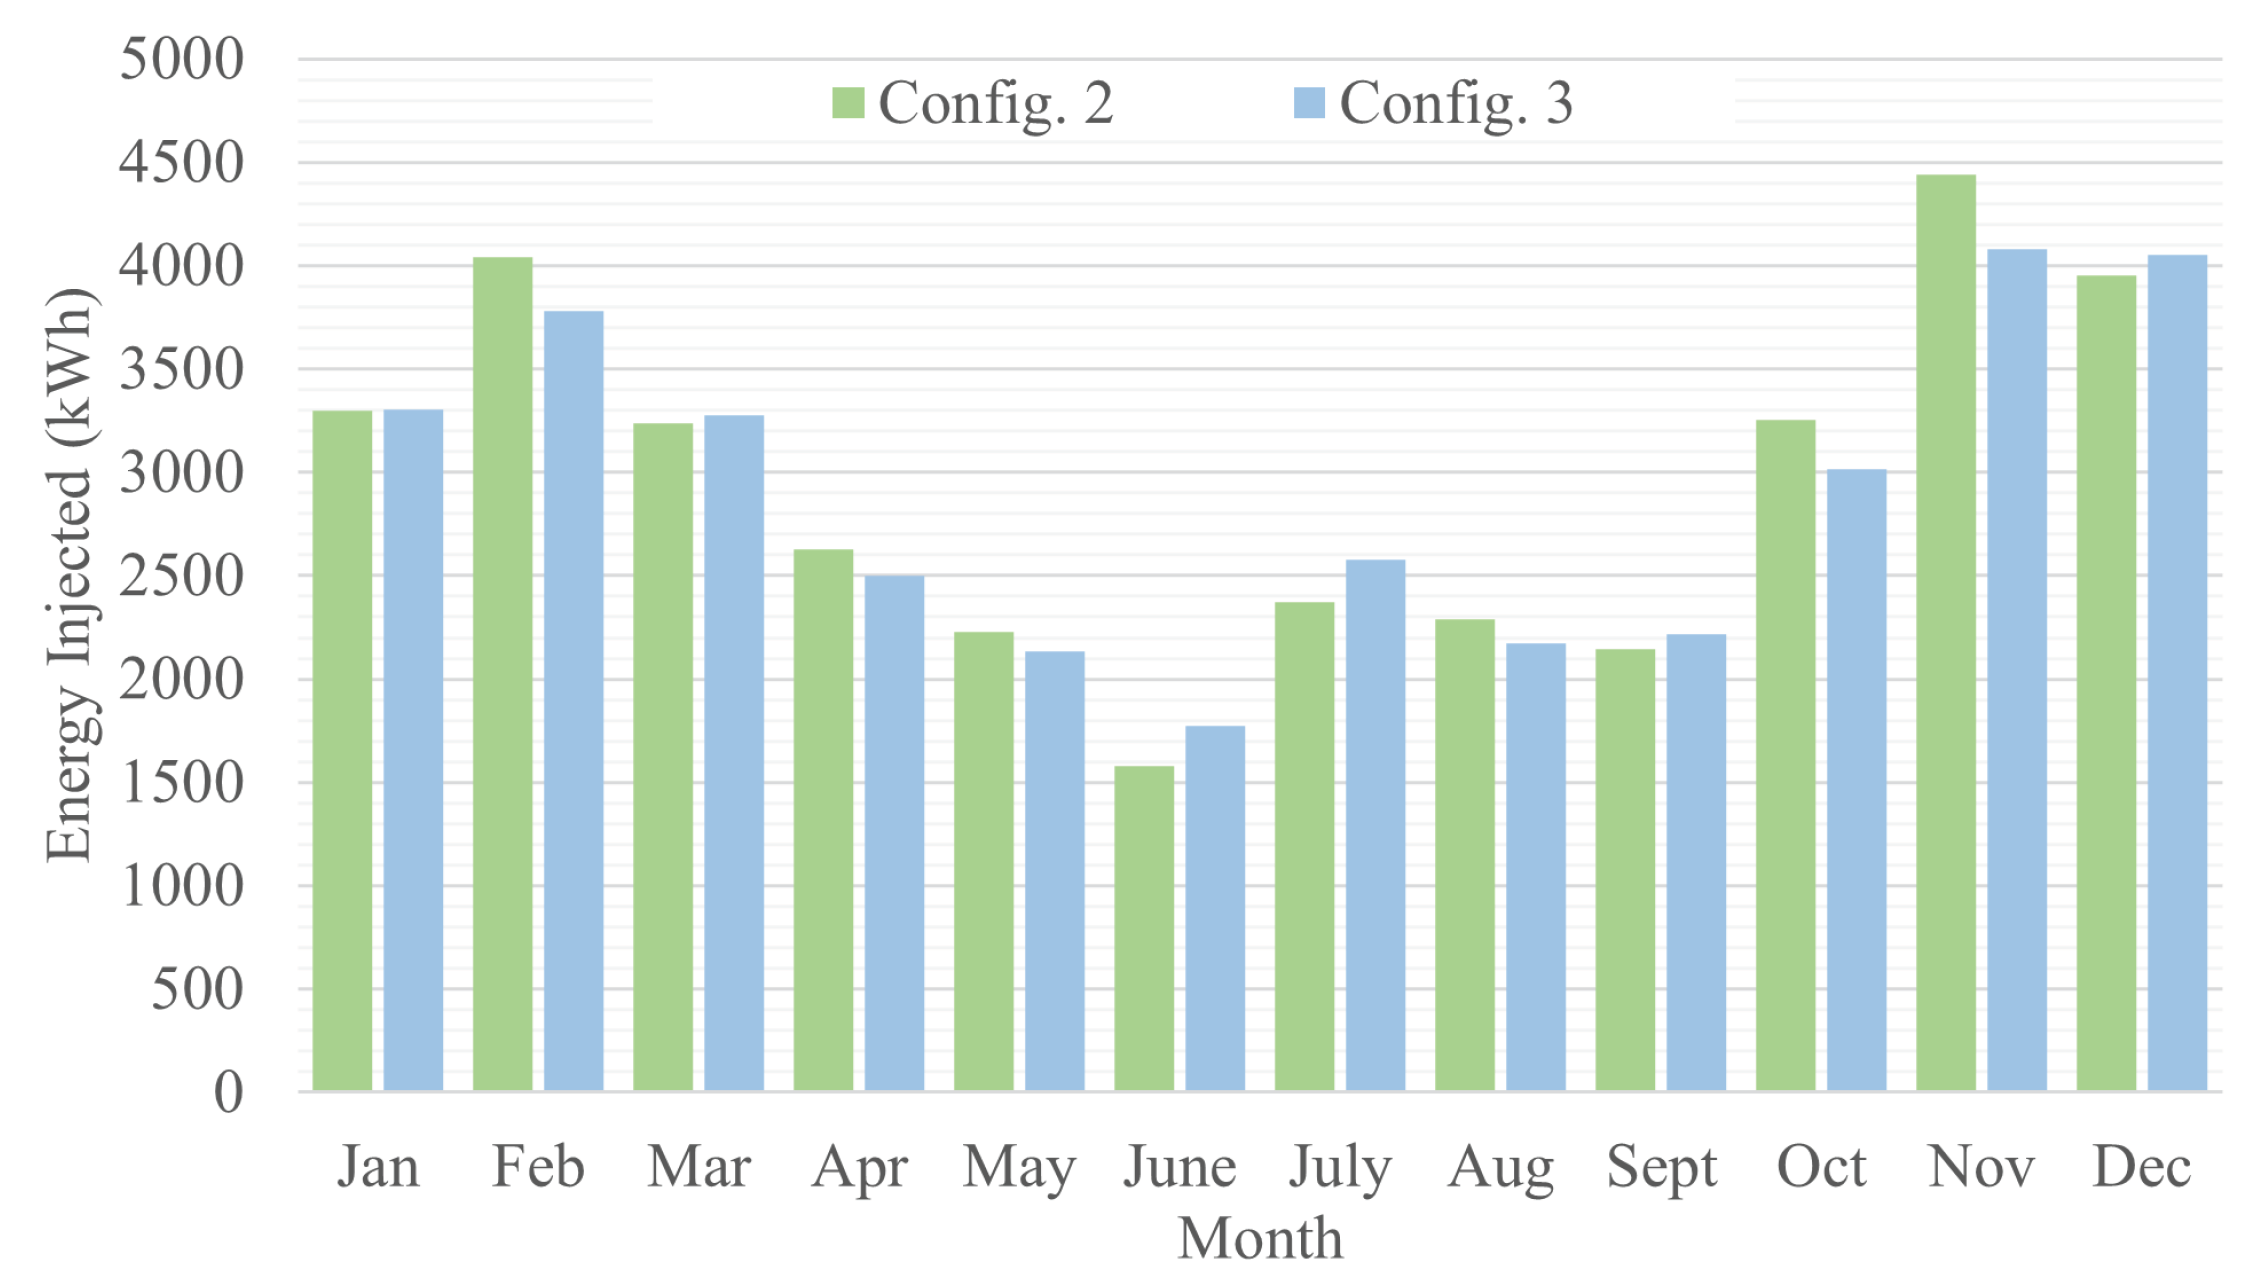
  • Config. 2: Consumer unit equipped with photovoltaic distributed generation (PVDG) but without the use of ESS;
  • Config. 3: Nanogrid composed of PVDG and ESS, consisting of a battery energy storage system (BESS), which is a real microgrid developed within a Brazilian research and development (R&D) project called MERGE.
The load characteristics of the consumer under evaluation are described in Table 1. The demand in this table is represented by nominal peak values observed for active and reactive power. The daily load consumption profile is represented by the mean values and standard deviations shown in Figure 3. To represent the load variation over each year of the time horizon T, the monthly factors indicated in Table 2 are applied to the mean demand values. These factors point to a higher consumption of refrigeration in the hottest months of the year, considering the weather in Brazil. In addition, all configurations considered in the study have charging stations for EVs, for which the possibility of daily charging up to two vehicles is considered and whose charging profile is shown in Figure 4. Each EV has a maximum charging power of 50kW, thus being the main load of the consumer unit.
For the photovoltaic generation systems in Config. 2 and Config. 3, the features considered in the studies are presented in Table 3. The mean values of temperature and irradiance in the normal distribution were obtained from the meteorological database of the National Institute of Meteorology (INMET) [29] for the year 2022 in the city of São Paulo. Mean values for the first week are illustrated in Figure 5. Constant standard deviations of 5 °C for temperature and 0.098 kW/m 2 for irradiance were applied.
The features of the BESS in Config. 3 (nanogrid) are described in Table 4. The sizing of this system aims at “zero grid” operation, considering the PVDG system and the consumption characteristics of the nanogrid (load and EVs). The operation of the BESS is initially performed based on the observed charge level at each time interval t, utilizing charging and discharging “thresholds” (or “triggers”) defined for the system based on its consumption characteristic. This type of operation reflects the interest of the nanogrid, which seeks to minimize the exchange of energy with the main grid in order to reduce invoice amounts paid toward energy transaction taxes and distribution network usage (component B). Threshold values of 0.1 and 0.5 pu of total demand are considered for battery charging and discharging, respectively.
For the calculation of energy bills, a unified tariff of 0.6905 BRL/kWh is employed, comprising 0.3188 BRL/kWh for the energy tariff and 0.3716 BRL/kWh for distribution network usage. These values are subject to tax rates totaling 23.62%, resulting in C m = 0.6905 / ( 1 23.62 / 100 ) = 0.9040 BRL/kWh. Within this taxation, 18.00% pertains to the cost associated with energy commercial transactions on the grid, yielding C t = 0.3716 × ( 1 / ( 1 23.62 / 100 ) 1 / ( 1 5.62 / 100 ) ) = 0.0928 BRL/kWh. This cost is applied to offset the energy from the credit formed by surplus injection into the grid.
As for the payment for distribution network usage in cases of energy credit compensation (Component B), the rate is defined as C B = 0.1960 / ( 1 23.62 / 100 ) = 0.2566 BRL/kWh. By the regulations established in the Brazilian electrical system, this charge is phased in progressively. In 2023, only 15% of this amount was applied, with annual increments of 15% until 2029, when 100% of the charge for this component comes into effect [30].
The calculation of energy bills incorporates a minimum availability fee from the distribution grid, equivalent to the consumption of 100 kWh, as defined by E m i n in (8). Furthermore, an average annual adjustment of 9.05% (obtained from the last five-year averaging) is factored into all tariffs. Lastly, a monthly discount rate of 1.12% (Brazilian Selic rate, the primary benchmark for interest rates in the country) is applied for the net present value calculations inherent in the estimation of economic indicators.

4.2. Numerical Results

The operation of the three configurations proposed in the previous subsection (i.e., Configs. 1, 2, and 3) is analyzed for a 20-year time horizon T (240 months), starting in 2023. A total of 1000 samples are evaluated using the MCS method, following the assessment model proposed in Section 3. For Config. 1, which does not have PVDG and BESS, there is no creation of energy credits, and therefore, U m s is zero for all months of the evaluation time horizon. Furthermore, uncertainties are represented only for consumption (load and EV charging). For Config. 2, the bills are calculated following the same approach as the nanogrid (Config. 3).

4.2.1. Initial Analysis

The economic indicators for the three configurations, with Config. 1 as the reference, are summarized in Table 5 (mean values due to the uncertainty model). Both investment and operational costs are presented as NPV. Config. 1, not involving PVDG or BESS systems, incurs no investment cost. In Config. 2, there is an investment cost that encompasses two inverter reinvestments, without residual value at the end of the 20-year period. For modules with a lifecycle exceeding T, no reinvestment is required, and a residual cost is considered at the end of year 20. Config. 3 incorporates the investment of Config. 2, further accounting for the BESS installation cost, which entails complete reinvestment in both the inverter and the battery bank.
In Table 5, it is observed that Config. 1 incurs higher operational costs compared with Configs. 2 and 3, as expected due to its lack of a dedicated generation source. Notably, Config. 3 exhibits a higher operational cost than Config. 2. Surprisingly, even though the BESS operation in Config. 3 is optimized based on the nanogrid’s load level, reducing energy exchange with the grid and lowering associated transaction and grid usage costs through offset energy credits generated from surplus generation, this expected reduction in operational cost is counterbalanced by the expenses related to supplying the significant electrical losses inherent in utilizing this storage system. These losses are particularly pronounced given the system’s design to accommodate EV charging.
In terms of total cost ( C t o t a l ), the lowest value observed corresponds to Config. 2, which has a payback period ( P B D ) of 36 months (3 years). For Config. 3, which has a C t o t a l close to that of Config. 1, P B D is equal to 223 months (approximately 18.58 years). The higher total cost of Config. 3 is primarily due to the high investment cost of the BESS, which corresponds to a technology that still directly impacts the economic feasibility of building a microgrid.
To further analyze the economic outcomes, we present the energy consumption figures for Configurations 1, 2, and 3 during the first year of the initial sampled scenario, as depicted in Figure 6. It is evident that Config. 1 exhibits higher energy consumption than Configs. 2 and 3, a consequence of its lack of self-generation. Between Configs. 2 and 3, there is a balance in these consumption levels, with Config. 3 having a slightly higher mean value (3449.96 kWh) compared with Config. 2 (3296.95 kWh). It is crucial to highlight that in Config. 3, which incorporates the nanogrid and BESS, the charging and discharging operations are determined by load thresholds. This operation primarily reduces the maximum energy demand, particularly during EV charging.
For an insight into surplus energy generation injected into the distribution grid during the first year, refer to Figure 7. Here, we observe that the amount of energy injected in Config. 3 (mean value of 2906.05 kWh) is slightly lower compared with Config. 2 (mean value of 2954.81 kWh) due to the presence of the BESS. Regarding energy bills, presented in Figure 8 for the first year, there is a significant reduction in Configs. 2 and 3 compared with Config. 1. This reduction is primarily attributed to the presence of the PVDG system in these configurations.

4.2.2. Evaluation of Regulatory Incentives

Based on the analyses conducted in the preceding section, it becomes evident that Configuration 3 (nanogrid) exhibits a significantly extended payback period in comparison with Configuration 2. This prolonged payback period is due to the substantial upfront investment required for the installation of the BESS, which, in the context of the applied tariff structure, lacks economic justification based on its operational performance. This study confines its evaluation to the immediate financial aspects and does not encompass other potential benefits associated with BESS installation, such as ensuring a continuous power supply in the event of grid disconnection.
It is worth considering, nevertheless, that implementing a nanogrid might stimulate the interest of both the power system and the utility company, as it opens up opportunities to leverage the advantages offered by BESS operation. Therefore, this subsection assesses the impact on the economic viability of a nanogrid when regulatory incentives are provided to the consumer, in exchange for granting the utility company access to BESS operation.
To model the utility interest in the BESS operation, adjustments are made based on the consumption patterns of the connected distribution grid. Instead of using load-based charging and discharging thresholds that mirror the nanogrid’s consumption characteristics, an operation strategy is implemented to support the grid during periods of high demand, dispatching the BESS, and absorbing excess energy during times of surplus generation considering the region in which the microgrid is located.
For this BESS operation, the “follow” mode of OpenDSS [7] is used, as illustrated in Figure 9. In this curve, expressed in per unit (pu) of the nominal power, negative values indicate battery charging periods, while positive values indicate energy injection into the grid. It is important to note that the specified power values in the curve may not always be achievable, as operational reserve constraints and maximum storage capacity can limit these actions.
With the operation in this mode, there is an increase in energy exchange between the nanogrid and the main distribution grid, resulting in higher values for the energy bill due to transaction tax and network usage charge (component B) related to the use of energy credits. In this case, for the first evaluated year, with the new BESS operation mode, the average monthly energy consumption by the nanogrid increases from 3226.61 kWh to 5333.46 kWh, and the average monthly energy injected into the grid due to excess generation increases from 3493.60 kWh to 4763.66 kWh. With this increased energy interaction between the nanogrid and the utility company, there is an increase in energy bills (approximately 22.14%). In the evaluation of the 20-year horizon, the total cost of the nanogrid is C t o t a l = BRL 707,741.89, and the payback does not happen in this case (i.e., there is no recovery of the investment within the analyzed horizon time).
Therefore, three possibilities for consumer incentives are evaluated:
  • Incentive 1: No tax on the energy transaction offset from the energy credit, whose cost is given by C t in (7) and (8);
  • Incentive 2: No charge for the use of the distribution network C b (component B) for energy offset from the energy credit, whose cost is given by (7);
  • Incentive 3: No charge for minimum availability fee, according to the charge given in (8) through E m i n .
Table 6 displays the estimated economic indicators resulting from the application of each incentive, as well as their combination. The investment cost is omitted in this table as it remains unchanged compared with the previous subsection (BRL 528,942.42).
It is evident that Incentive 1 has the most substantial positive impact on the nanogrid’s viability, leading to the most significant reductions in both C t o t a l and P B D when applied individually or in combination with other incentives. This effect can be attributed to the tax reduction on compensated energy transactions, as outlined in both (7) and (8). Significantly, with the implementation of Incentive 1, the P B D values become even lower than when optimizing the BESS operation mode to minimize energy exchange with the main grid, which results in a P B D of 223 months. These results can serve as an initial technoeconomic foundation for discussions among policy-makers.
Not charging a minimum fee for the availability of the distribution network (Incentive 3) is what least contributes to the viability of implementing the nanogrid. When this incentive is applied alone, for instance, there is no recovery of the investment within the analyzed horizon time.
Finally, a considerable reduction in C t o t a l is observed when all three incentives are applied together. In this scenario, the operational cost arises when there is a need to purchase electricity from the grid during months when the energy generated by the PVDG system, along with any accrued credits, is insufficient to meet the entire energy demand. Essentially, this situation involves procuring additional electricity from the grid when the self-generated power falls short. However, it is interesting to note that even though it has the lowest value of C t o t a l , this case has the same value of P B D as the case where only Incentives 1 and 2 are applied together (191 months). This means that in terms of investment recovery, Incentive 3 does not provide any contribution, which can be explained by the fact that this incentive only impacts in the months when B 2 m s (calculated as (8)) is greater than B 1 m s (calculated as (7)), which occurs in few cases for the evaluated nanogrid. It is worth highlighting that a nanogrid that has generation resources capable of supplying all its consumption, presenting values of B 2 m s greater than B 1 m s for all months, will realize greater benefits with the application of Incentive 3; therefore, this incentive cannot be discarded.

4.3. Final Considerations

From the proposed evaluation model, it is possible to conduct additional studies with different approaches to encourage the formation of a nanogrid that is capable of further reducing operating costs and investment recovery time. A more radical change concerning the net-metering regime, for example, such as considering the option to sell surplus generation injected into the grid, may enable the nanogrid owner to profit from participating in the market. This possibility can considerably reduce the value of P B D and justify the installation of the BESS that characterizes the nanogrid.

5. Conclusions

This work presents a technoeconomic evaluation model for the operation of nanogrid-type microgrids, aiming to investigate the impact of tariff incentives on their economic viability. The model is capable of simulating the operation of the nanogrid and estimating economic evaluation indicators for a specific time horizon. The Monte Carlo simulation method is employed to handle uncertainties in consumption and the availability of the primary energy generation source within the microgrid. The operation of the network, with proper representation of distributed generation and energy storage systems, is carried out with the assistance of OpenDSS.
A real nanogrid, currently being implemented in Brazil within the framework of the MERGE (Microgrids for Efficient, Reliable, and Sustainable Energy) research and development (R&D) project, is assessed using the proposed technoeconomic evaluation model. The primary energy demand for this nanogrid is associated with feeding electric vehicle batteries.
Drawing from the analyses performed in this study, it becomes evident that employing the BESS in alignment with the utility company’s grid operations, as opposed to optimizing it for the nanogrid’s interests, adversely impacts the economic feasibility of nanogrids. Nevertheless, specific tariff structures and economic incentives hold the potential to enhance these prospects, to the extent that they can even result in shorter discounted payback periods compared with when the BESS is operated with a focus on minimizing energy transactions with the main grid, as seen from the nanogrid’s perspective.
On the other hand, even when all the regulatory incentives are combined, the investment recovery period for constructing the nanogrid remains significantly longer than when the consumer relies solely on their own generation system. It is essential to note that this study does not assess certain inherent advantages of energy storage system installation, like ensuring a continuous power supply during nanogrid disconnection from the main grid. Additionally, advancements in energy storage technology are expected to lower investment costs, thereby enhancing the economic feasibility of implementing nanogrids within the distribution network.
Finally, it is important to highlight that each microgrid must be examined and evaluated individually since the feasibility of the application depends on variables such as location, configuration, objectives, available technologies, and local costs. Therefore, although the proposed evaluation model can be used to study different nanogrid-type microgrids, the results and conclusions presented here cannot be generalized.

Author Contributions

Conceptualization, F.A.A., F.C.R.C., J.F.C.C., A.R.D., R.A.R., P.A.C.R., V.E.M.S.A., R.G.B., L.C.P.S., J.G.I.C. and O.R.S.; Data curation, V.E.M.S.A.; Formal analysis, F.A.A., F.C.R.C., R.A.R., L.C.P.S., J.G.I.C. and O.R.S.; Funding acquisition, A.R.D., P.A.C.R., R.G.B., L.C.P.S. and O.R.S.; Investigation, F.A.A., F.C.R.C., A.R.D., L.C.P.S., J.G.I.C. and O.R.S.; Methodology, F.A.A., F.C.R.C., J.F.C.C., A.R.D., R.A.R., P.A.C.R., V.E.M.S.A. and J.G.I.C.; Project administration, A.R.D., P.A.C.R., R.G.B., L.C.P.S., J.G.I.C. and O.R.S.; Resources, F.A.A., F.C.R.C., J.F.C.C., R.A.R., P.A.C.R., V.E.M.S.A., R.G.B. and L.C.P.S.; Software, F.A.A. and F.C.R.C.; Supervision, F.A.A., F.C.R.C., J.F.C.C., A.R.D., P.A.C.R., R.G.B., L.C.P.S., J.G.I.C. and O.R.S.; Validation, F.A.A., J.F.C.C., A.R.D., R.A.R., R.G.B., L.C.P.S. and O.R.S.; Visualization, F.A.A., F.C.R.C., A.R.D., P.A.C.R., V.E.M.S.A., L.C.P.S., J.G.I.C. and O.R.S.; Writing—original draft, F.A.A., F.C.R.C. and R.G.B.; Writing—review & editing, F.A.A., F.C.R.C., J.F.C.C., P.A.C.R., V.E.M.S.A., R.G.B., L.C.P.S., J.G.I.C. and O.R.S. All authors have read and agreed to the published version of the manuscript.

Funding

This research was funded by the Program of R&D of the National Electricity Regulatory Agency (ANEEL) and CPFL Energy. This work is related to Project “PD-00063-3058/2019—MERGE: Microgrids for Efficient, Reliable and Greener Energy”.

Data Availability Statement

Data are contained within the article.

Acknowledgments

The authors thank the Electricity Sector R&D program regulated by ANEEL through the project PD-00063-3058/2019, entitled “PA3058—Merge: Microgrids for Efficient, Reliable and Greener Energy”. The main contributions and results presented in this work originate from the experience of implementing a “Living Lab Microgrid” in the region of Campinas, São Paulo, Brazil. The project is part of a research and development (R&D) initiative, which involves teams from the State University of Campinas (UNICAMP), the Federal University of Maranhão (UFMA), Eletra Energy Solutions, and the Advanced Institute of Technology and Innovation (IATI), financed by the CPFL Energy Group distributors, with R&D resources from the ANEEL Regulatory Agency. The authors would like to thank the CPFL group for technical and financial support through the Research and Development project PD-00063-3058/2019, with resources from ANEEL’s R&D program. Furthermore, the authors would like to thank the anonymous reviewers and the editor for their valuable comments and suggestions.

Conflicts of Interest

Author Rafael G. Bento was employed by the company CPFL Energy. The remaining authors declare that the research was conducted in the absence of any commercial or financial relationships that could be construed as a potential conflict of interest.

Abbreviations

ANEELBrazilian electricity regulatory agency
BESSBattery energy storage system
DERDistributed energy resource
DGDistributed generation
EMSEnergy management system
ESSEnergy storage system
EVElectric vehicle
FiTFeed-in tariff
IoTInternet of Things
LCOELevelized cost of electricity
MCSMonte Carlo simulation
MERGEMicrogrids for efficient, reliable and greener energy
NPCNet present cost
NPVNet present value
PVDGPhotovoltaic distributed generation
V2GVehicle-to-grid

Appendix A

To calculate the investment I n p v , consider, for example, a given component j with an investment in present value equal to I j and with a life cycle of 8 years. The uniform series of payments for the investment over its life cycle can be represented by the cash flow in Figure A1, where U V j is the portion of the uniform series obtained by (A1) considering an annual discount rate given by r y .
Figure A1. Uniform investment payments of component j over its useful life.
Energies 17 00341 g0a1
U V j = I j r y ( 1 + r y ) 8 ( 1 + r y ) 8 1
If considering a 20-year evaluation time horizon (T) for the microgrid in this example, it becomes apparent that reinvestments for component j will be necessary, given its shorter life cycle compared with the 20-year horizon. Figure A2 illustrates the cash flow, with dashed–bordered boxes representing the initial investment and the two subsequent reinvestments related to component j within the 20-year evaluation timeframe (T). The investment portion remains constant, as determined by Equation (A1). Notably, the last four installments, corresponding to the final reinvestment and payable at the beginning of years 20 to 23, should be excluded when calculating the total investment cost. These last four installments are omitted because they account for the component’s value at the end of the 20-year evaluation period (T), taking into account that the component could potentially continue operating for an additional four years, according to its life cycle.
Figure A2. Uniform investment payments of component j in valuation time horizon T.
Energies 17 00341 g0a2
Considering the cash flow in a 20-year time horizon T, the net present value of the total investment I n p v j made in relation to component j is given by (A2). Finally, the net present value of the total investment for the implantation of the microgrid ( I n p v in Equation (1)), considering the set Ω j of all the components of the installed DERs, can then be calculated using (A3).
I n p v j = U V j ( 1 + r y ) 20 1 r y ( 1 + r y ) 20
I n p v = j Ω j I n p v j

References

  1. Hamidieh, M.; Ghassemi, M. Microgrids and Resilience: A Review. IEEE Access 2022, 10, 106059–106080. [Google Scholar] [CrossRef]
  2. Rana, M.M.; Atef, M.; Sarkar, M.R.; Uddin, M.; Shafiullah, G. A Review on Peak Load Shaving in Microgrid—Potential Benefits, Challenges, and Future Trend. Energies 2022, 15, 2278. [Google Scholar] [CrossRef]
  3. Saeed, M.H.; Fangzong, W.; Kalwar, B.A.; Iqbal, S. A Review on Microgrids’ Challenges & Perspectives. IEEE Access 2021, 9, 166502–166517. [Google Scholar] [CrossRef]
  4. Burmester, D.; Rayudu, R.; Seah, W.; Akinyele, D. A review of nanogrid topologies and technologies. Renew. Sustain. Energy Rev. 2017, 67, 760–775. [Google Scholar] [CrossRef]
  5. Naik, K.R.; Rajpathak, B.; Mitra, A.; Kolhe, M. A Review of Nanogrid Technologies for Forming Reliable Residential Grid. In Proceedings of the 2020 IEEE First International Conference on Smart Technologies for Power, Energy and Control (STPEC), Nagpur, India, 25–26 September 2020; pp. 1–6. [Google Scholar] [CrossRef]
  6. Castro, J.F.C.; Roncolatto, R.A.; Donadon, A.R.; Andrade, V.E.M.S.; Rosas, P.; Bento, R.G.; Matos, J.G.; Assis, F.A.; Coelho, F.C.R.; Quadros, R.; et al. Microgrid Applications and Technical Challenges—The Brazilian Status of Connection Standards and Operational Procedures. Energies 2023, 16, 2893. [Google Scholar] [CrossRef]
  7. OpenDSS Documentation. (Reference Guide—Version 9.0.0). Available online: https://www.epri.com/pages/sa/opendss (accessed on 10 May 2023).
  8. Alhasnawi, B.N.; Jasim, B.H.; Esteban, M.D.; Guerrero, J.M. A Novel Smart Energy Management as a Service over a Cloud Computing Platform for Nanogrid Appliances. Sustainability 2020, 12, 9686. [Google Scholar] [CrossRef]
  9. Yu, H.; Shang, Y.; Niu, S.; Cheng, C.; Shao, Z.; Jian, L. Towards energy-efficient and cost-effective DC nanaogrid: A novel pseudo hierarchical architecture incorporating V2G technology for both autonomous coordination and regulated power dispatching. Appl. Energy 2022, 313, 118838. [Google Scholar] [CrossRef]
  10. Olukan, T.A.; Santos, S.; Al Ghaferi, A.A.; Chiesa, M. Development of a solar nano-grid for meeting the electricity supply shortage in developing countries (Nigeria as a case study). Renew. Energy 2022, 181, 640–652. [Google Scholar] [CrossRef]
  11. Lambert, T.; Gilman, P.; Lilienthal, P. Micropower system modeling with HOMER. Integr. Altern. Sources Energy 2005, 1, 379–418. [Google Scholar]
  12. Dahiru, A.T.; Tan, C.W. Optimal sizing and techno-economic analysis of grid-connected nanogrid for tropical climates of the Savannah. Sustain. Cities Soc. 2020, 52, 101824. [Google Scholar] [CrossRef]
  13. Dahiru, A.T.; Tan, C.W.; Salisu, S.; Lau, K.Y. Multi-configurational sizing and analysis in a nanogrid using nested integer linear programming. J. Clean. Prod. 2021, 323, 129159. [Google Scholar] [CrossRef]
  14. Kumar, A.; Deng, Y.; He, X.; Kumar, P.; Bansal, R.C.; Naidoo, R.M. A Renewable based Nano-grid for Smart Rural Residential Application. In Proceedings of the 2021 International Conference on Smart Energy Systems and Technologies (SEST), Vaasa, Finland, 6–8 September 2021; pp. 1–5. [Google Scholar] [CrossRef]
  15. Baruah, A.; Basu, M. Modelling of an off-grid roof-top residential photovoltaic nano grid system for an urban locality in India. Energy Sustain. Dev. 2023, 74, 471–498. [Google Scholar] [CrossRef]
  16. Dahiru, A.T.; Tan, C.W.; Bukar, A.L.; Yiew Lau, K. Energy cost reduction in residential nanogrid under constraints of renewable energy, customer demand fitness and binary battery operations. J. Energy Storage 2021, 39, 102520. [Google Scholar] [CrossRef]
  17. Arévalo, P.; Tostado-Véliz, M.; Jurado, F. A novel methodology for comprehensive planning of battery storage systems. J. Energy Storage 2021, 37, 102456. [Google Scholar] [CrossRef]
  18. Di Florio, G.; Macchi, E.G.; Mongibello, L.; Baratto, M.C.; Basosi, R.; Busi, E.; Caliano, M.; Cigolotti, V.; Testi, M.; Trini, M. Comparative life cycle assessment of two different SOFC-based cogeneration systems with thermal energy storage integrated into a single-family house nanogrid. Appl. Energy 2021, 285, 116378. [Google Scholar] [CrossRef]
  19. Mohand Kaci, G.; Mahrane, A.; Ghedamsi, K.; Chikh, M. Techno-economic feasibility analysis of grid-connected residential PV systems in Algeria. Energy Environ. 2022, 0958305X2211469. [Google Scholar] [CrossRef]
  20. Yoomak, S.; Ngaopitakkul, A. Investigation and Feasibility Evaluation of Using Nanogrid Technology Integrated Into Road Lighting System. IEEE Access 2020, 8, 56739–56754. [Google Scholar] [CrossRef]
  21. Bae, J.; Lee, S.; Kim, H. Comparative study on the economic feasibility of nanogrid and microgrid electrification: The case of Jeju Island, South Korea. Energy Environ. 2021, 32, 168–188. [Google Scholar] [CrossRef]
  22. Bahri, R.; Zeynali, S.; Nasiri, N.; Keshavarzi, M.R. Economic-environmental energy supply of mobile base stations in isolated nanogrids with smart plug-in electric vehicles and hydrogen energy storage system. Int. J. Hydrogen Energy 2023, 48, 3725–3739. [Google Scholar] [CrossRef]
  23. Ahmadi Jirdehi, M.; Sohrabi Tabar, V. Risk-aware energy management of a microgrid integrated with battery charging and swapping stations in the presence of renewable resources high penetration, crypto-currency miners and responsive loads. Energy 2023, 263, 125719. [Google Scholar] [CrossRef]
  24. Wangsupphaphol, A.; Chaitusaney, S.; Salem, M. A Techno-Economic Assessment of a Second-Life Battery and Photovoltaics Hybrid Power Source for Sustainable Electric Vehicle Home Charging. Sustainability 2023, 15, 5866. [Google Scholar] [CrossRef]
  25. Zhou, Q.; Shahidehpour, M.; Li, Z.; Che, L.; Alabdulwahab, A.; Abusorrah, A. Compartmentalization Strategy for the Optimal Economic Operation of a Hybrid AC/DC Microgrid. IEEE Trans. Power Syst. 2020, 35, 1294–1304. [Google Scholar] [CrossRef]
  26. Newnan, D.G.; Eschenbach, T.G.; Lavelle, J.P. Engineering Economic Analysis, 11th ed.; Oxford University Press: New York, NY, USA, 2012. [Google Scholar]
  27. Jaglal, D.; Procopiou, A.T.; Petrou, K.; Ochoa, L.F. Bottom-up modeling of residential batteries and their effect on system-level generation cost. Electr. Power Syst. Res. 2020, 189, 106711. [Google Scholar] [CrossRef]
  28. Electricity Regulatory Agency (ANEEL). ResoluÇÃO Normativa Aneel Nº 1.059, DE 7 de Fevereiro de 2023. Available online: https://www2.aneel.gov.br/cedoc/ren20231059.html (accessed on 1 June 2023). (In Portuguese)
  29. National Institute of Meteorology (INMET). Available online: https://bdmep.inmet.gov.br/ (accessed on 1 April 2023).
  30. Presidency of the Republic of Brazil. Lei Nº 14.300, de 6 de Janeiro de 2022. Available online: https://www.planalto.gov.br/ccivil_03/_ato2019-2022/2022/lei/l14300.htm (accessed on 1 June 2023). (In Portuguese)
Figure 1. Representative diagram of the structure of a residential nanogrid.
Energies 17 00341 g001
Figure 2. Representative diagram of the uncertainty evaluation model.
Energies 17 00341 g002
Figure 3. Daily load curves.
Energies 17 00341 g003
Figure 4. Charging profile for the EVs.
Energies 17 00341 g004
Figure 5. Temperature and irradiance values for the first week.
Energies 17 00341 g005
Figure 6. Monthly amounts of energy consumed in the first year.
Energies 17 00341 g006
Figure 7. Monthly amounts of energy injected into the grid in the first year.
Energies 17 00341 g007
Figure 8. Monthly values of energy bills in the first year.
Energies 17 00341 g008
Figure 9. BESS operation—follow mode.
Energies 17 00341 g009
Table 1. Load characteristics of the consumer unit.
VoltagePeak Active PowerPeak Reactive Power
Phase APhase BPhase CPhase APhase BPhase C
220 V2.00 kW2.00 kW2.00 kW0.05 kVAr0.05 kVAr0.05 kVAr
Table 2. Consumption monthly adjustment factor in pu of consumption power peaks.
JanFebMarAprMayJuneJulyAugSeptOctNovDec
1.001.001.000.990.960.940.920.930.950.980.991.00
Table 3. Features of the PVDG system.
ParameterValues
Modules: Investment (BRL)/Lifecycle (years)50,000.00/25
Inverter: Investment (BRL)/Lifecycle (years)50,000.00/7
Rated module power (kWp)0.450
Number of modules44
Inverter rated power (kW)20.00
Inverter rated efficiency (%)97.00
Table 4. Features of BESS.
ParameterValues
Batteries: Investment (BRL)/Lifecycle (years)160,000.00/10
Inverter: Investment (BRL)/Lifecycle (years)160,000.00/10
Nominal battery bank power (kW)70.00
Total storage capacity (kWh)90.00
Rated inverter power (kW)70.00
Charge efficiency (%)95.00
Efficiency of discharge (%)95.00
Operating reserve (%)15.00
Battery bank stand-by losses (%)0.50
Table 5. Economic indicators for a 20-year time horizon (NPV, when applicable).
Config.Investment Cost
(BRL)
Operation Cost
(BRL)
C total
(BRL)
PB D
(Month)
1-685,381.58685,381.58-
2124,860.49100,402.63225,263.1236
3528,942.42132,227.22586,589.93223
Table 6. Nanogrid economic indicators for a 20-year time horizon with regulatory incentives.
IncentiveOperation Cost
(BRL)
C total
(BRL)
PB D
(Month)
1112,584.66641,527.08211
2138,642.03667,584.45228
3180,690.13709,632.55-
1, 272,427.22601,369.65191
1, 3115,264.32644,206.74214
2, 3137,606.20666,548.62227
1, 2, 372,180.38601,122.80191
Disclaimer/Publisher’s Note: The statements, opinions and data contained in all publications are solely those of the individual author(s) and contributor(s) and not of MDPI and/or the editor(s). MDPI and/or the editor(s) disclaim responsibility for any injury to people or property resulting from any ideas, methods, instructions or products referred to in the content.

