Article

Study on Reliability of PACSs with Integrated Consideration of Both Basic and Mission Reliability

School of Electrical Engineering, Southeast University, Nanjing 210096, China
*
Author to whom correspondence should be addressed.
Energies 2024, 17(2), 365; https://doi.org/10.3390/en17020365
Submission received: 14 December 2023 / Revised: 7 January 2024 / Accepted: 9 January 2024 / Published: 11 January 2024
(This article belongs to the Section F1: Electrical Power System)

Abstract

:
Protective relays play a fundamental role in power systems, whose functions consist of three parts, namely protection, automation, and control, thus called the PAC altogether. It turns out that the architecture of a PACS (protection, automation, and control system) may exert a direct impact on the reliability of protective relay systems, previous studies of which are often conducted on the assumption that intelligent electronic devices (IEDs) have a constant fault rate with only mission reliability of the systems considered. To obtain a more accurate evaluation of system reliability bearing system maintenance in mind, this article proposes a novel method to appraise the reliability of PACSs with integrated consideration of basic and mission reliability. Firstly, the basic reliability of IEDs is calculated by parts count prediction, which will provide a more precise fault rate of IEDs. Secondly, the reliability of PACSs is analyzed by the reliability diagram and Markov model. By using the parts count prediction method to calculate the failure rate of the device, the steady-state probability rate will be accurate more than 0.0107%. At last, a quantitative criterion is finalized for selecting a suitable architecture easily.

1. Introduction

The protective relay system is the frontline of power systems in terms of safe operation. Since the 1970s, experts have begun to study the reliability of protective relays; they employ the probability of protective relays’ misoperation as metrics of reliability and the losses caused by it as system cost to evaluate the quality of the protective relay system [1]. A method of evaluating reliability by economic benefits can also be proposed [2,3]. Considering different configuration schemes, researchers dwell on the reliability of protective relay systems [4,5], whose essays not only focus on the reliability of a single protection relay, but also on the overall reliability of protective relay systems. The reliability analysis of the condition-based maintenance [6,7] provided in it gives out a theoretical basis for guiding substation maintenance. All the research has already laid a solid foundation for understanding the reliability of protective relays and their corresponding application from the aspects of operation and maintenance practices. However, most research only focuses on the mission reliability. Concerning the reliability of the system architecture, a constant IED failure rate is assumed, which surely affects the accurate calculation of the reliability of protective relay systems and may misguide the selection of the suitable architecture for the systems.
After the application of digital substation, researchers have conducted more reliability studies. The reliabilities of different PACS architecture have been studied [8,9,10,11,12], while some other studies focus on the reliability of the system using network communication [13,14].
To resolve the problem that the lifespan of protective relays is much shorter than that of primary equipment, the CIGRE B5.60 working group had been devoted to a technical brochure, “Protection, Automation and Control Architectures with Functionality Independent of Hardware” [15] since 2017, which proposes novel architectures of PACS. The technical brochure introduces five varieties of PACS architectures and makes comparisons between them from 10 aspects, including equipment complexity, reliability, difficulties of software upgrade, and complexities of IED update, where the expert scoring method is employed for preliminary evaluation.
The reliability studies can propose some suitable PACS architectures to the utilities and industry substation owners, which can meet their investment and maintenance requirements. To obtain high mission reliability, some redundancy must be performed, while the basic reliability will decrease with the increase of components or IEDs. The studies have either focused only on mission reliability or on some factors, such as the impact of communication on reliability, but have not considered both mission and basic reliability, and they also lack quantitative methods to combine both reliability factors.
This article proposes a method to consider both mission and basic reliability, which gives a quantitative evaluation of different PACS architectures. This quantitative approach makes it easy to compare different PACS architectures which makes the selection of PACS architectures easy. This article also gives some MTBF (mean time between failures) calculations of IEDs using the parts count prediction method, which gives a more accurate evaluation of PACS reliability.
The exponential distribution model [16] and the Weibull distribution model [17,18,19,20] are often used in the evaluation of the lifetime of electronic devices. These models give analytical methods to calculate the lifetime of devices, which need the selection of appropriate parameters of the models. In this article, the device lifetime evaluation standard is used to calculate the MTBF of IEDs, which is a more practical way.
This paper first analyzes the reliability of different PACS architectures from the following three facets:
a.
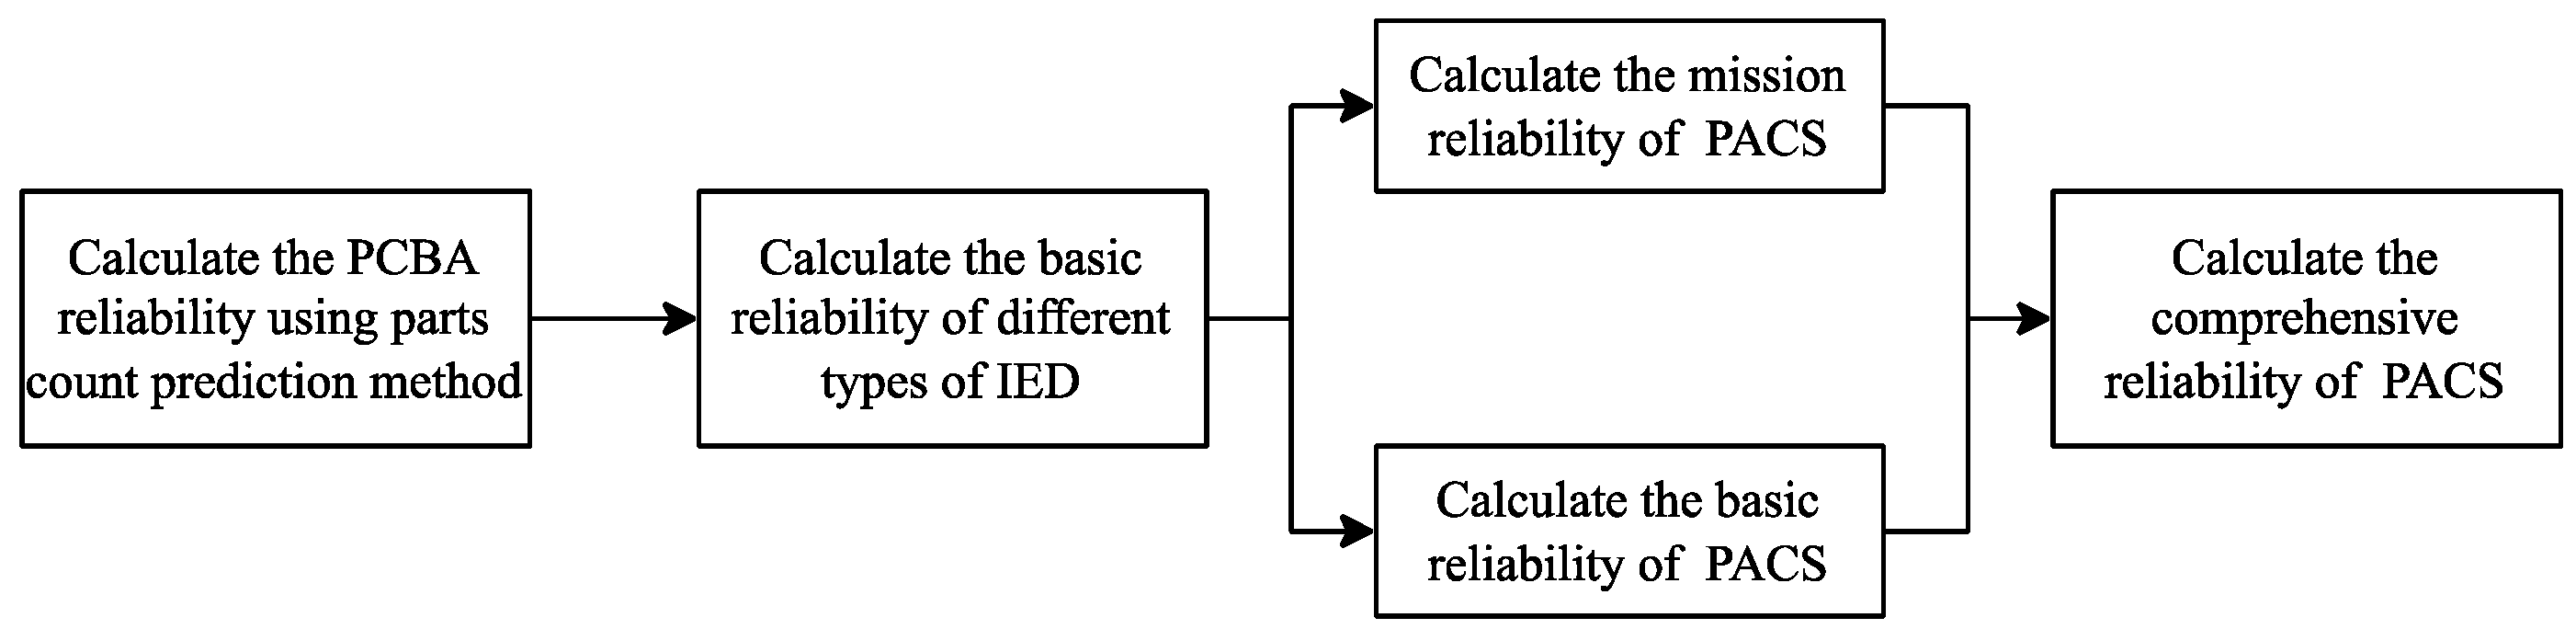
Based on the analysis of architectures of IEDs, a multi-level model analogous to that of devices widely used in digital substations is proposed to provide the groundwork for fault severity judgment of protective relay devices and the mission reliability of PACSs.
b.
The basic reliability of different types of IEDs is analyzed by the parts count prediction method.
c.
Taking four out of five PACS architectures proposed in CIGRE B5.60 TB as the objects under investigation, a quantitative analysis of mission reliability is performed. Consequently, a comprehensive reliability evaluation method is proposed, which takes both basic and mission reliability into consideration. The PACS architecture reliability is compared by the comprehensive reliability evaluation method.
The reliability analysis flow is shown in Figure 1.

2. Reliability of PACSs

2.1. Definition of Reliability

Reliability is defined as the probability that a product or system accomplishes its intended functions for a predefined period of time, or it will operate in specific environments without failure. The reliability model is the foundation of reliability prediction, analysis, and evaluation, which is divided into basic reliability and mission reliability models.
Basic reliability is defined as the duration or probability of a product being trouble-free under specified conditions while mission reliability is the ability of a product to perform a specified function according to a specified mission profile. The “mission profile” is a time-series description of the events and environments experienced by the system within a time span during which it completes the specified mission, including criteria for determining the success or failure of missions. The basic reliability model of the relay system is a series model, so the more subsystems and components are contained inside it, the lower the reliability will become. As the mission reliability model is a mixed one composed of series and parallel subsystems, it is evident that it can be improved by adopting more parallel subsystems.

2.2. Basic Reliability and Mission Reliability of PACSs

For PACSs, the basic reliability directly determines the maintenance interval. The ideal way to obtain robust system design is to improve the basic and mission reliability simultaneously, which is difficult to achieve in practice. By adding redundant loops (or redundant devices) for mission reliability will inevitably sacrifice basic reliability. In the slang of PACS, the “mission profile” is the function of the systems to cut off various faults that occur on primary equipment. If the whole system can fulfill its protective functionality successfully, even with the failure of some IEDs, the system is still considered reliable. From a maintenance view, the mission reliability determines whether the maintenance is urgent while the basic reliability determines the maintenance interval.

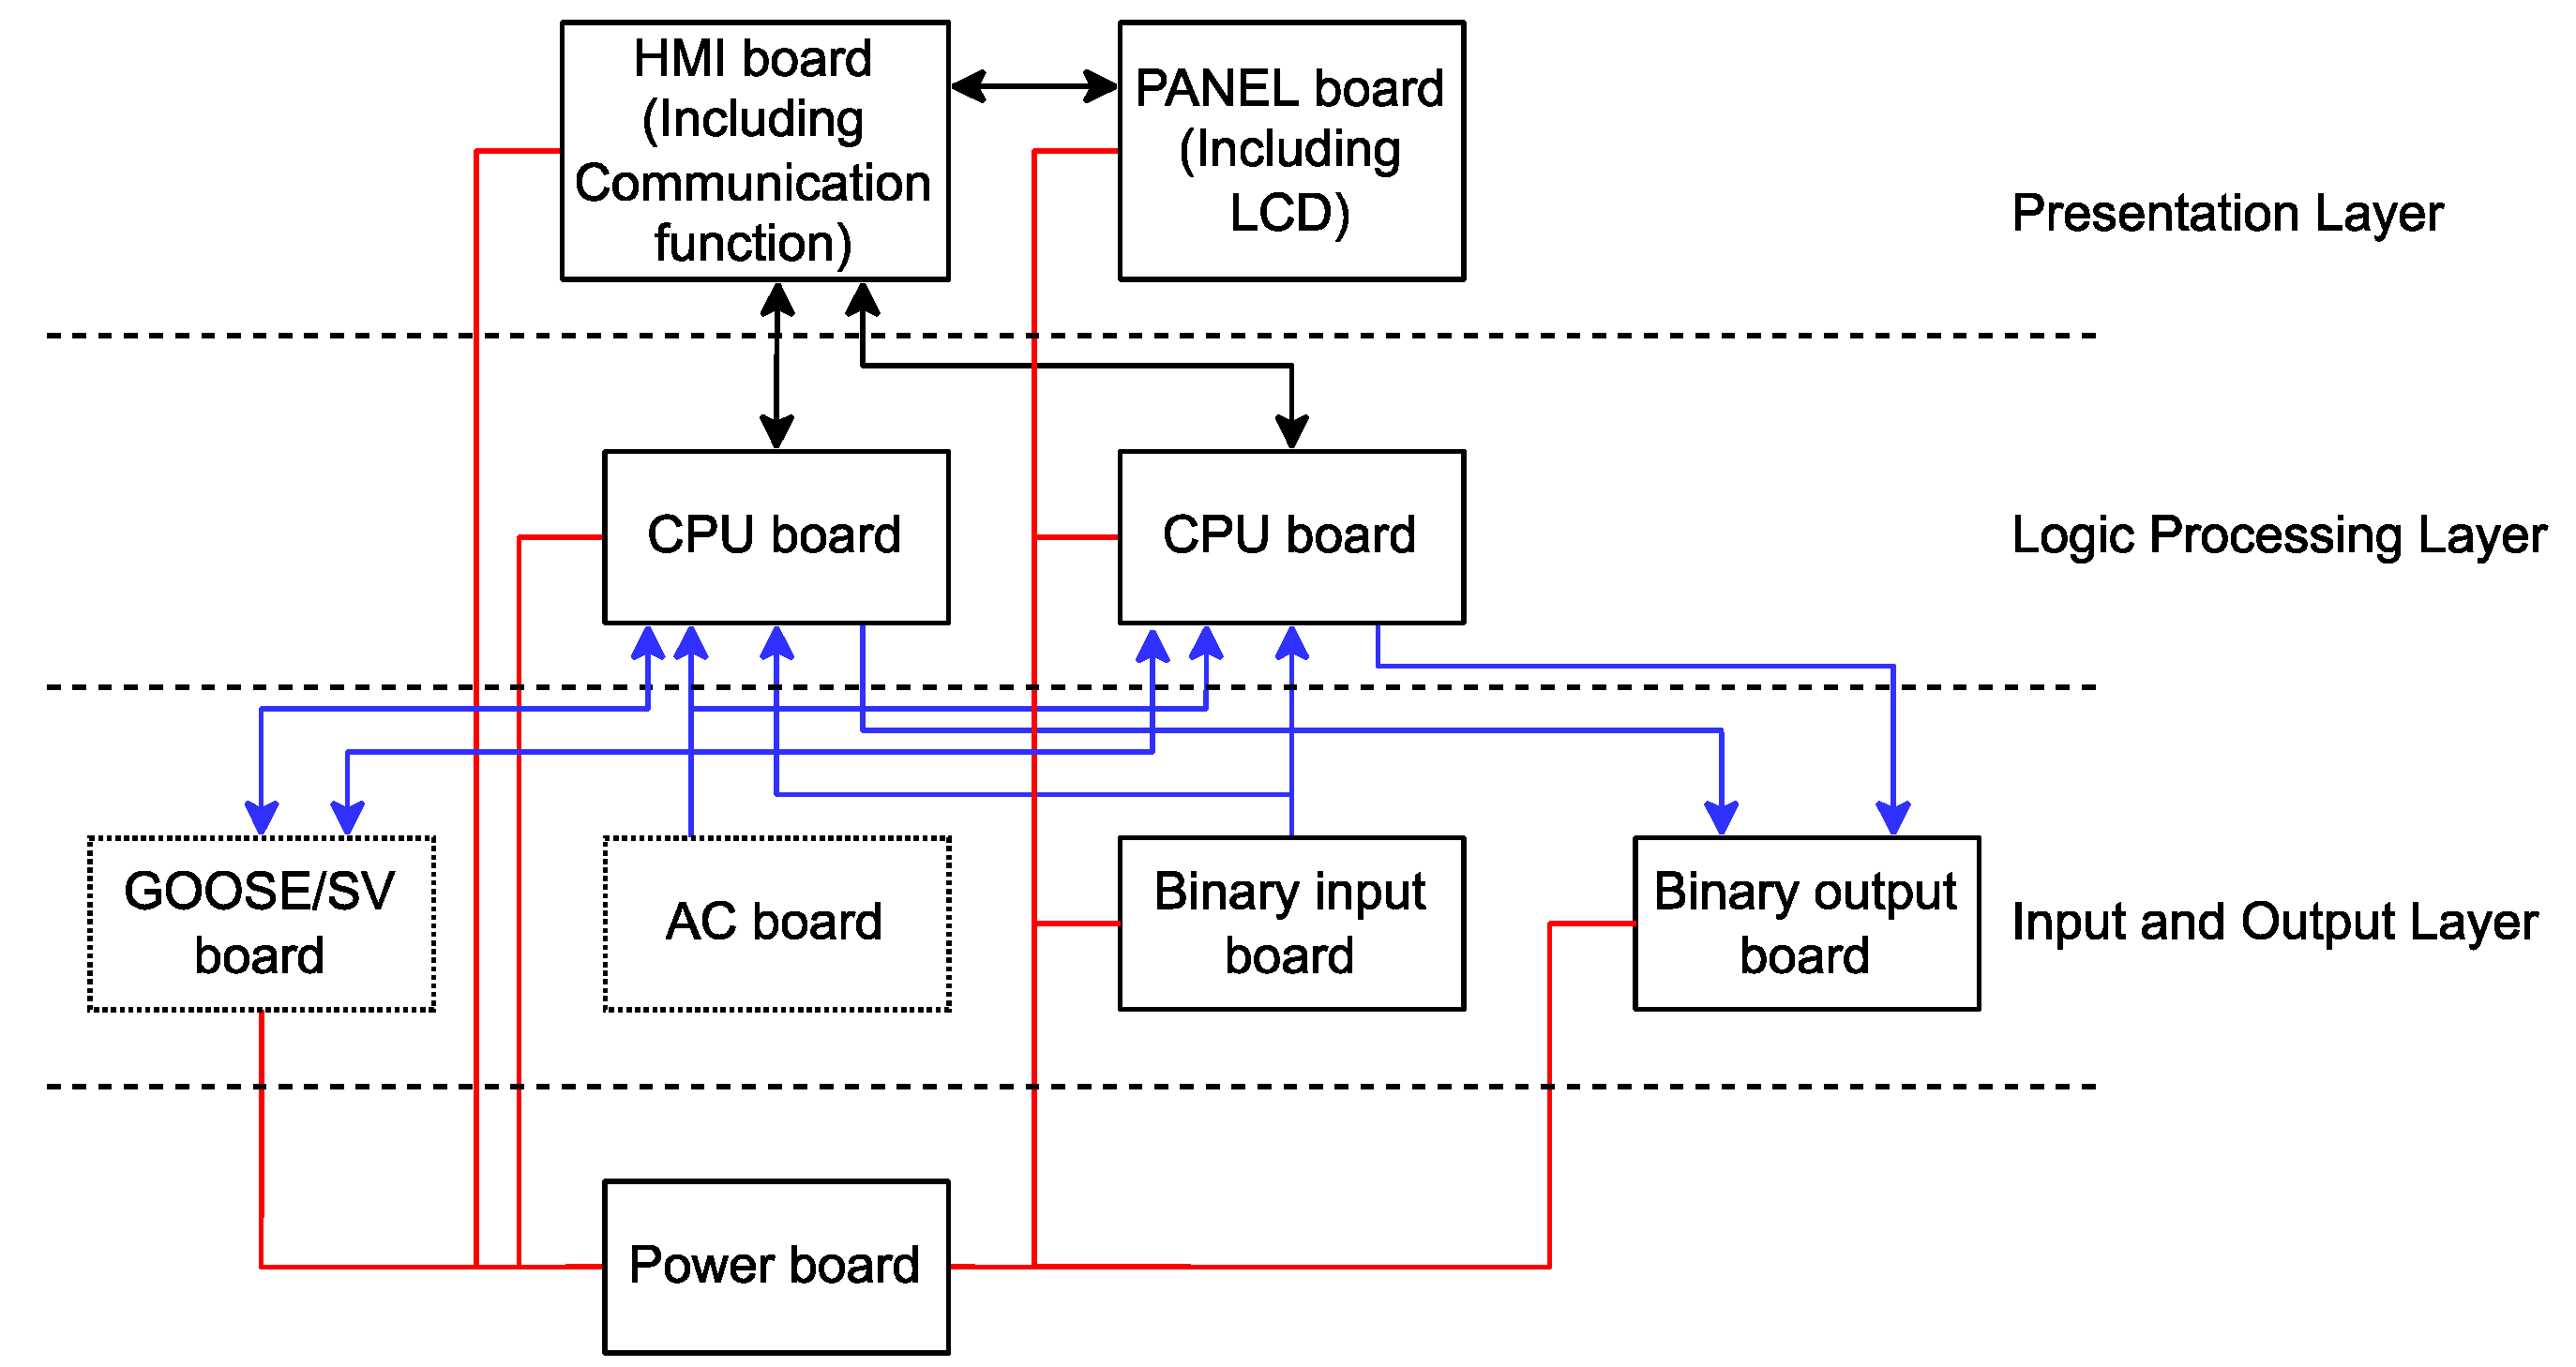
2.3. The Architecture of Protective Relay IED

As is well known, protective relay IEDs have multiple functions such as input, output, and protection. Accordingly, the logic functions of a protective relay IED can be seen as three layers stacked together, namely an input and output layer sitting at the bottom, a logic processing layer in the middle, and a presentation layer on the top, as shown in Figure 2. The analog (alternating current) and digital sampling boards provide corresponding input quantities, respectively, for the CPU board, the brain of one IED, while the binary output board executes output commands issued by it. For an IEC 61850-based protective relay IED, it is also necessary to include a GOOSE (generic object-oriented substation event) and (or) SV (sampled value) board(s) to carry out the same functions on fully digitalized interfaces. These boards constitute the so-called input and output layer of a protective relay IED. The CPU board performs the core function of protection calculation, which serves as the logical processing layer of the protective relay IED. HMI (human–machine interface) and PANEL board offer information display and modification interfaces for users to interact with IEDs, which are in the presentation layer. Faults that occur on the presentation layer boards do not immediately affect the protective functionality, and thus are not a critical defect, whereas the failure on the boards of the input and output or logic processing layer do constitute a critical defect on the contrary.

3. Basic Reliability of PAC IEDs

3.1. Reliability Estimation Methods and Standards

Reliability prediction methods encompass parts count prediction, part stress prediction, reliability block diagram analysis, failure rate prediction, and expert scoring, etc. Since different reliability prediction manuals also provide different prediction methods, some of the most referenced reliability prediction manuals are listed in Table 1 as a reference.
The reliability calculated as per different reliability prediction manuals is quite diversified [24]. For instance, the failure rate calculated by the military standards is much higher than that calculated by the commercial ones.

3.2. Predication Method for Basic Reliability

Since the protective relay IED can be classified as repairable equipment, the basic reliability of PAC IEDs might be measured by MTBF [5,25]. The reliability prediction method is adopted in this essay, where the reliability prediction data calculated is utilized as the fundamental data to evaluate the overall reliability of the PACS. As most of the components making up a PAC IED are imported, with only a few produced domestically, such as signal transformers, the reliability data of both domestic and imported components can be found in the GJB/Z 299C-2006 electronic equipment reliability prediction manual (hereinafter referred to as GJB 299C). This essay employs the parts count method which is widely used in electronic device reliability prediction [26,27]. All the data calculated are only meaningful when contrasting the reliability of various IEDs; they only need to exhibit relative differences, rather than the absolute values. The equation of parts count prediction method is:
λ s = i = 0 n N i λ G i π Q i
In Equation (1):
λ s : The total failure rate of an IED
N i : The quantity of a component of type i
λ G i : The generic failure rate of a component of type   i
π Q i : The quality factor of a component of type i
n : The count of various component types
The generic failure rate of component λ G i and quality factor π Q i are taken from Appendix A of GJB 299C imported electronic components reliability prediction data.
The basic reliability of each individual board in an IED is given according to Equation (1) while the reliability of the whole IED is as per Equation (2).
λ s = i = 0 n N i λ G i
In the Equation (2):
λ s : The failure rate of the whole IED
N i : The number of all boards of types i
λ G i : The generic failure rate of a board of type i

3.3. Basic Reliability Line Protection Relay IED

Take a line protective relay IED as an example to demonstrate the reliability calculation of a PAC IED. The reliability of each board can be obtained based on the reliability data from GJB 299C; the results are listed in Table 2. Since there is no LCD failure rate available from GJB 299C, an MBTF of 132,617.7 h quoted from reference [28] is adopted, and hence the failure rate of LCD is set to 7.5405 × 10⁻⁶/h. Power boards contain electrolytic capacitors, which make the lifespan of power boards short [29], so the lifespan of power board is shorter than the other boards in IED. Given that the power boards are usually replaced every 6 years, the failure rate of power boards is consequently not included.
Failure rates of various board types can be consulted from Table 2 while synthetic board fault rates (considering the usual number for each board type) and the gross IED failure rate are available in Table 3.
Moreover, the failure rate can be converted to MBTF:
MBTF = 1 / λ s = 1 / ( 13.51175 × 10 6 ) 74009   h
The failure rate of PANEL boards is the highest among all the boards as demonstrated in Table 3, the reason for which boils down to the fact that LCD, a component of high fault rate, is often deployed. For a PANEL located in the presentation layer, its failure never affects the protection or communication functions. If the IED reliability calculation precludes the influence of the LCD-adopted PANEL, the overall failure rate of IEDs decreases to 5.85995 × 10⁻⁶/h, MBTF rising to 170,649 h, about 19.48 years.

3.4. Basic Reliability of PAC IEDs

Calculated by the methods mentioned in Section 3.3, the basic reliability of different PAC IEDs is shown in Table 4.
It is obvious that IEDs without LCD (100 Mbit optical switch, merging unit, PIU, binary input, and output IED) have longer MBTF than those with LCD, which leads to the conclusion that the high failure rate of LCD screen on the PANEL board is the most weighted factor for a low MTBF.
Table 5 catalogs the failure rate of the protective relay IEDs without PANEL boards.

4. Mission Reliability of PAC IEDs

The CIGRE B5.60 TB deliberately constructs a case of 1 transformer bay and 2 line bays, where 5 PACS architectures are contrasted on 10 aspects by the expert scoring method. This paper analyzes and compares the reliability of four of them except architecture 2 (IEDs with integrated PIU and multi-feeder protection), which provides a valuable reference for the selection of an appropriate PACS architecture. The four architectures are recorded in Table 6.
The methods mostly used in reliability analysis include the analytical method, Monte Carlo method [5,30], and network methods, among which the analytical method can be further split into the fault tree method, GO method [31], Markov method [32,33,34,35,36], and reliability block diagram method [30,37]. In this paper, the reliability block diagram method and Markov method are adopted to analyze the mission reliability of PACS architectures. In CIGRE B5.60 TB, when the PACS architecture is introduced, the switch is omitted in the structure diagram, but in digital substations where IEDs with full digital functions are deployed, the switch is indispensable for data transferring across IEDs belonging to different bays, such as bus bar protection IEDs, disturbance recorders and network analyzers. Proportionally, the switch is also considered in reliability analysis under this scenario.

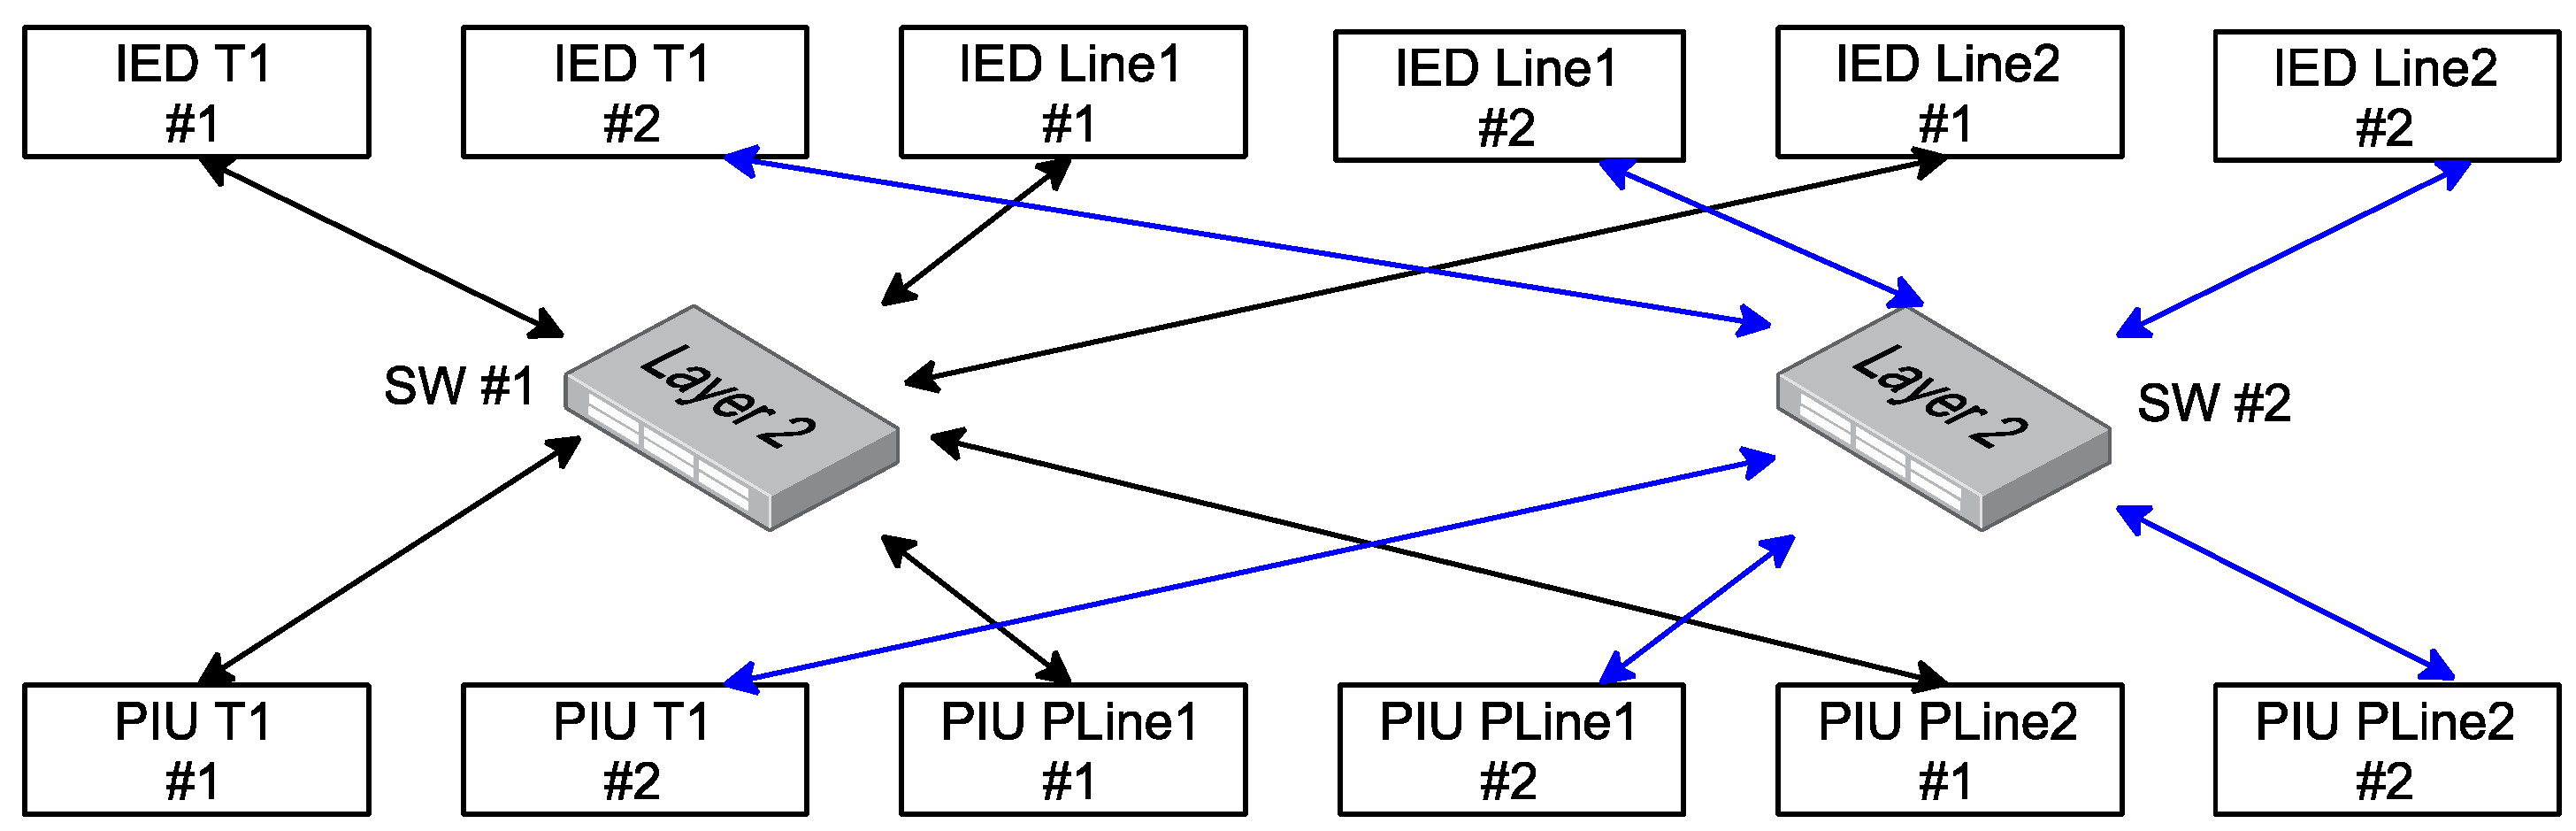
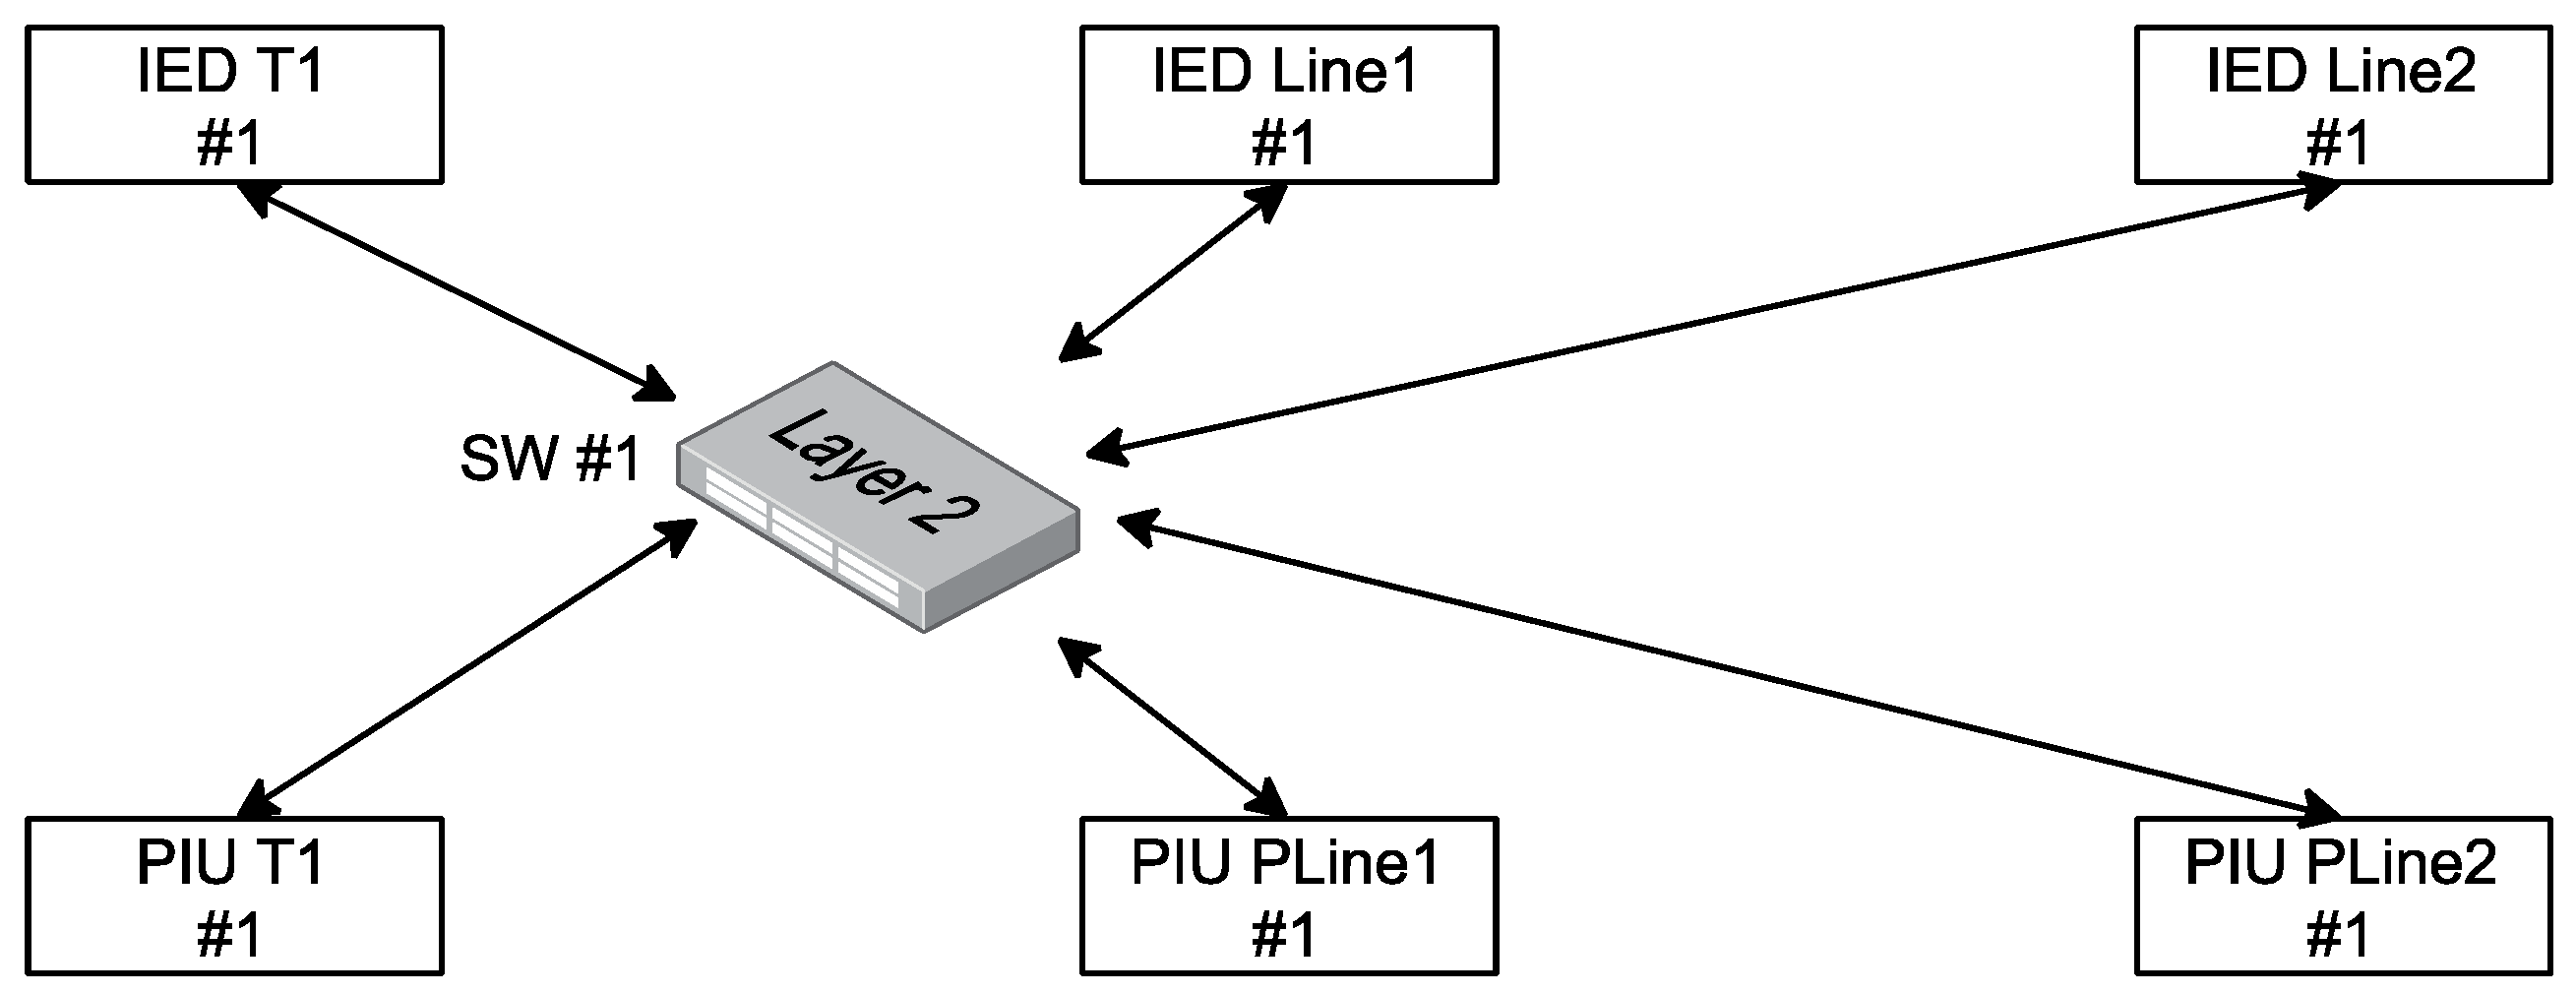
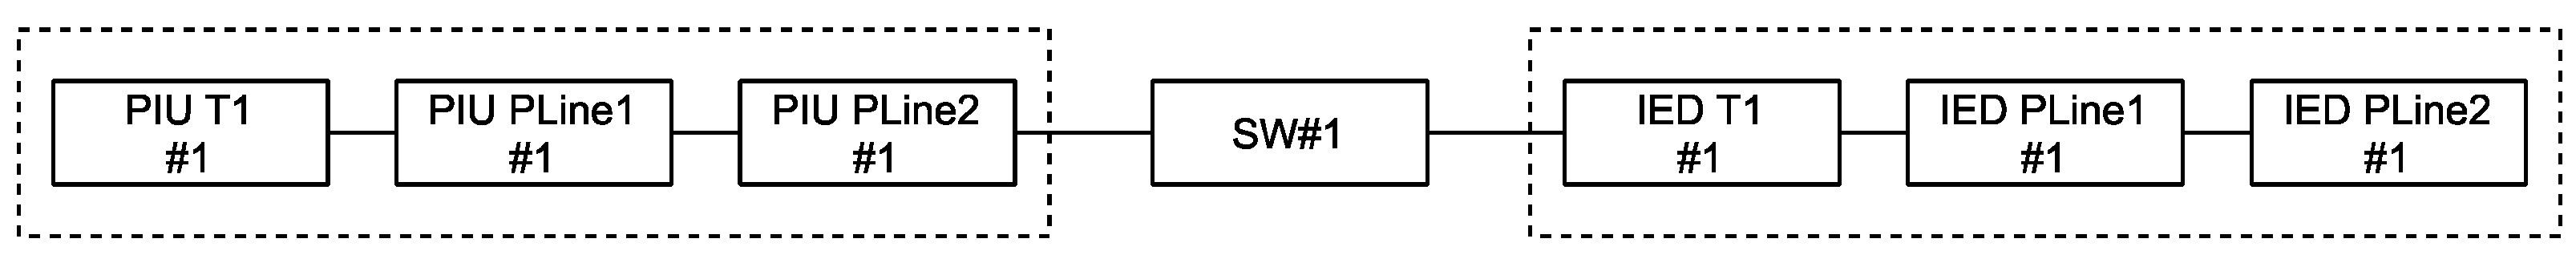
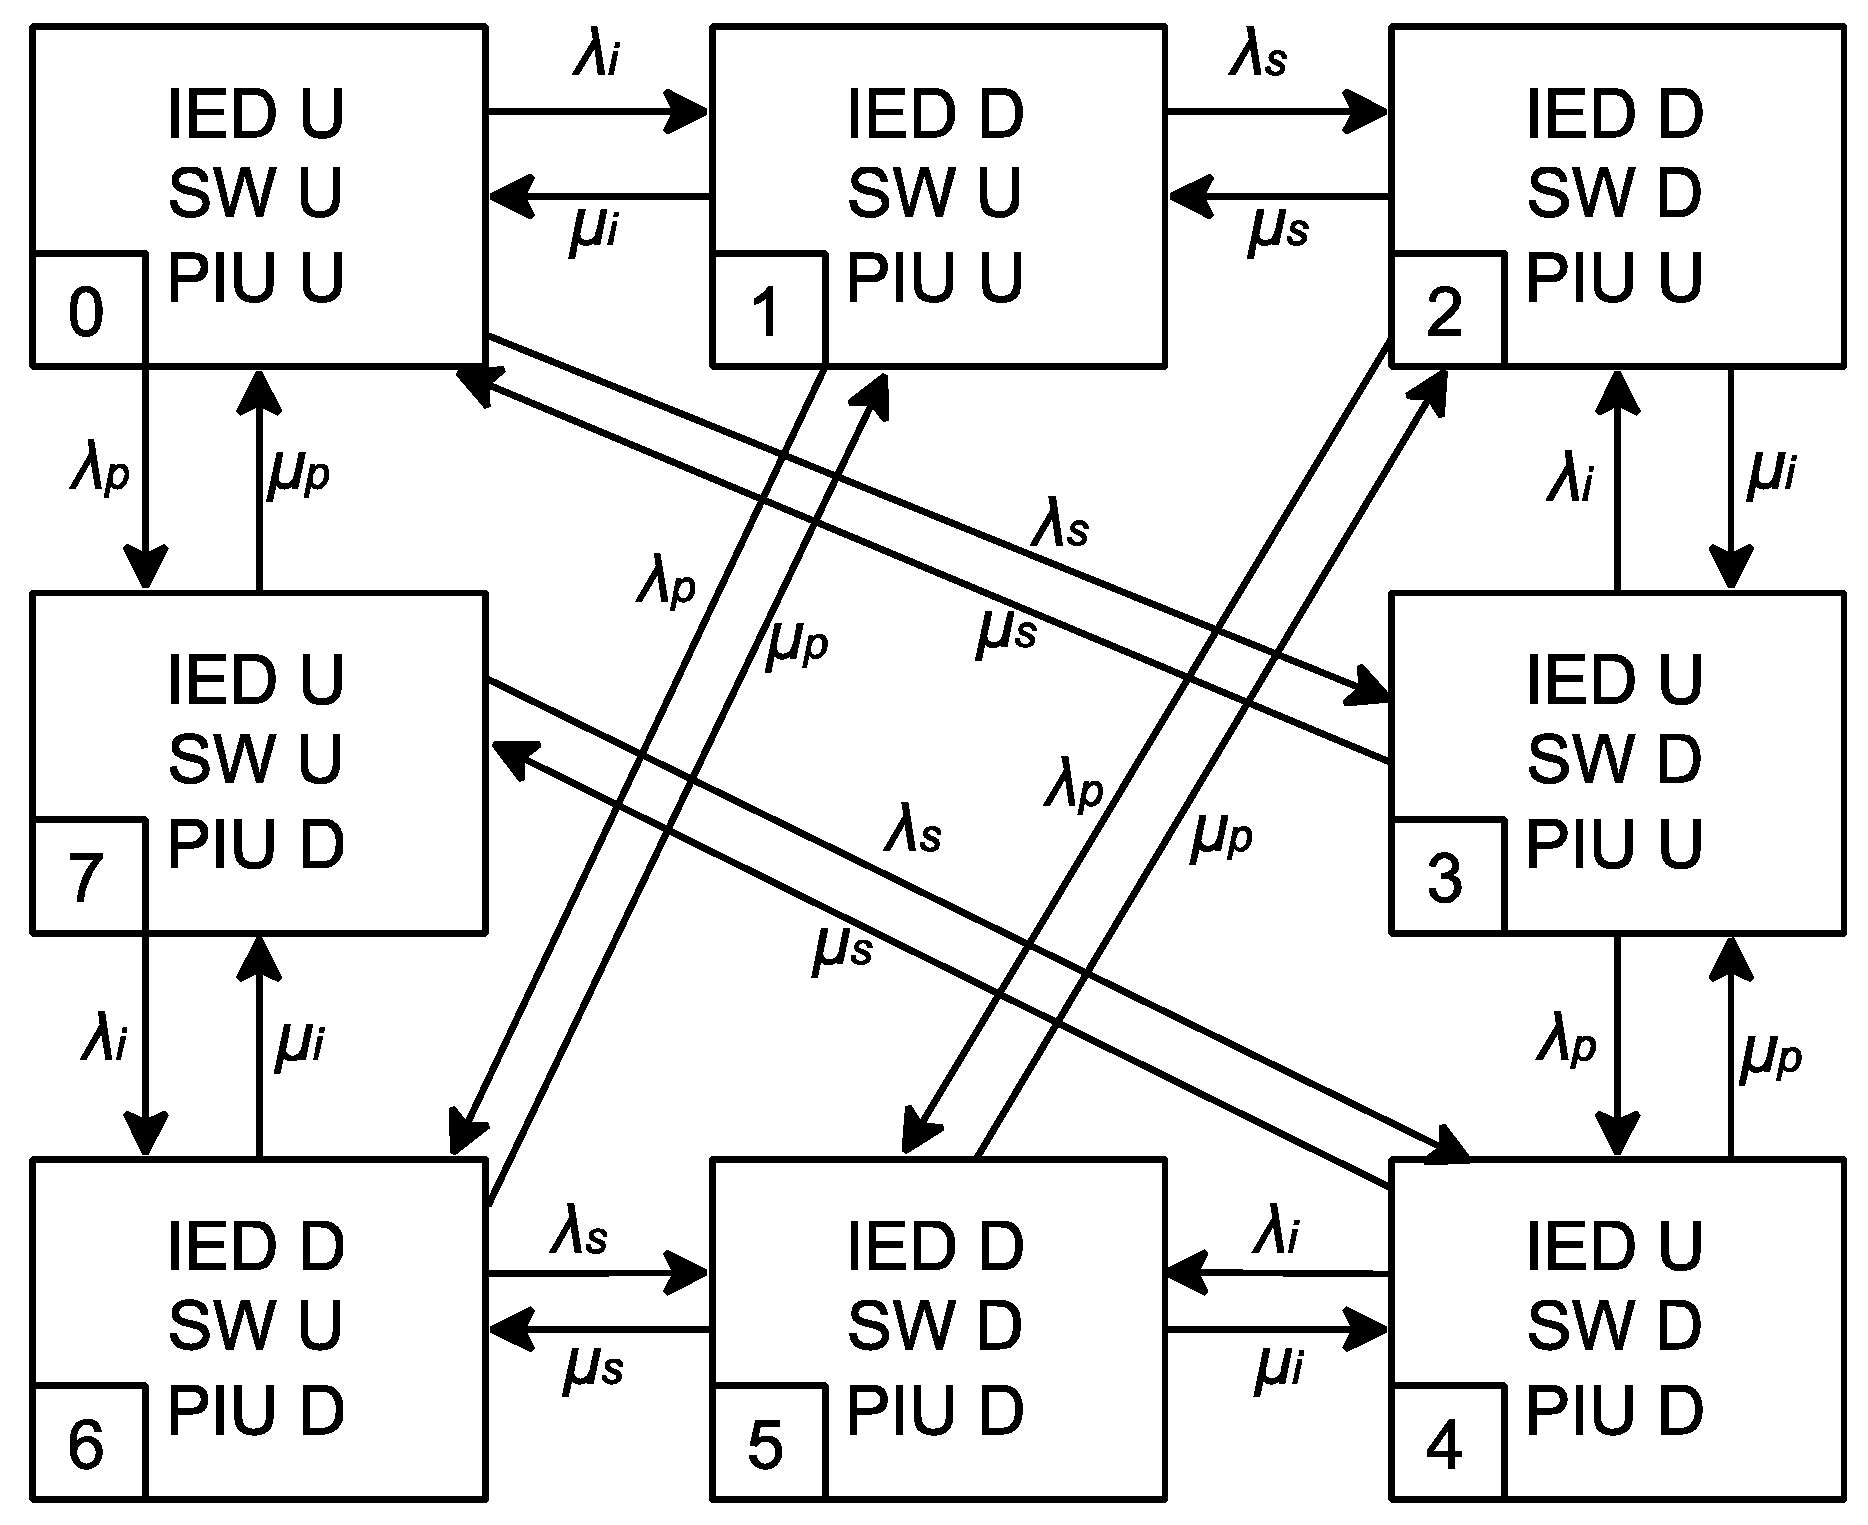
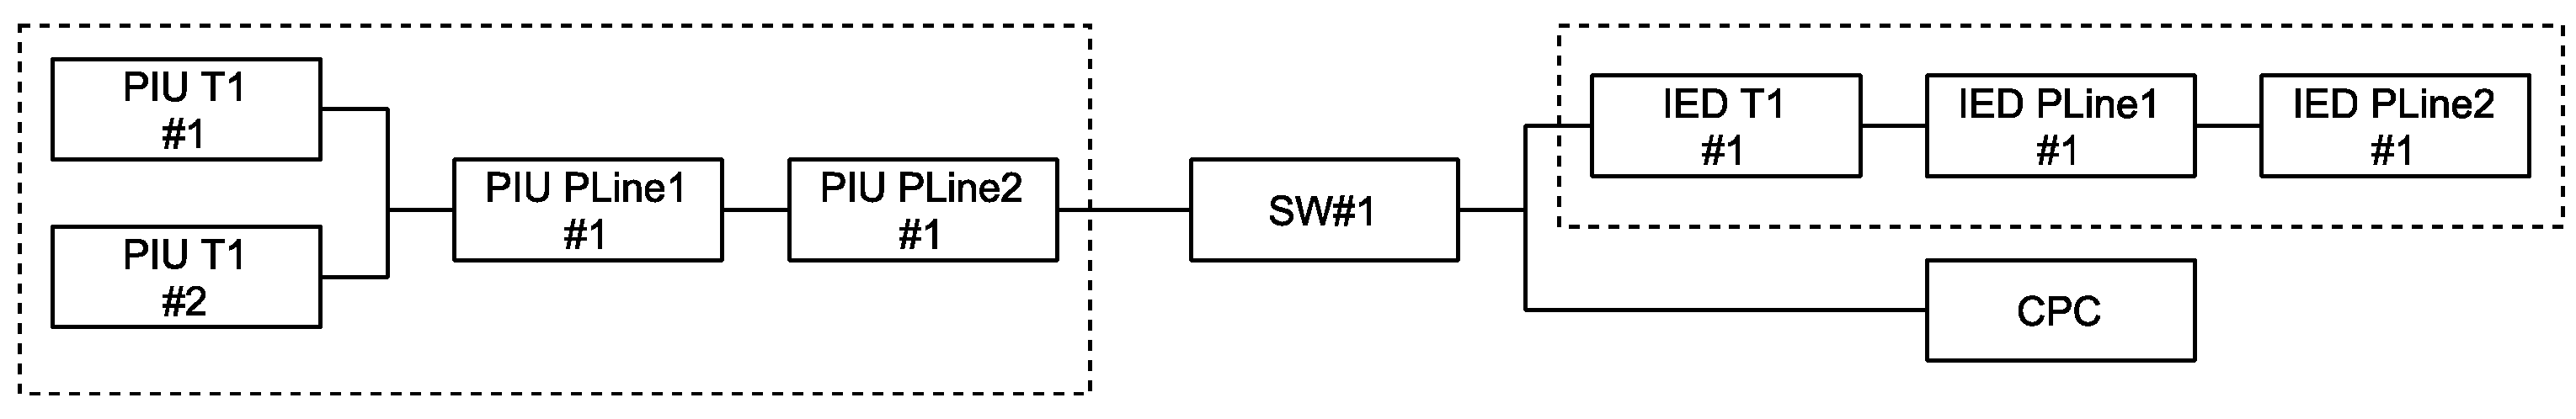
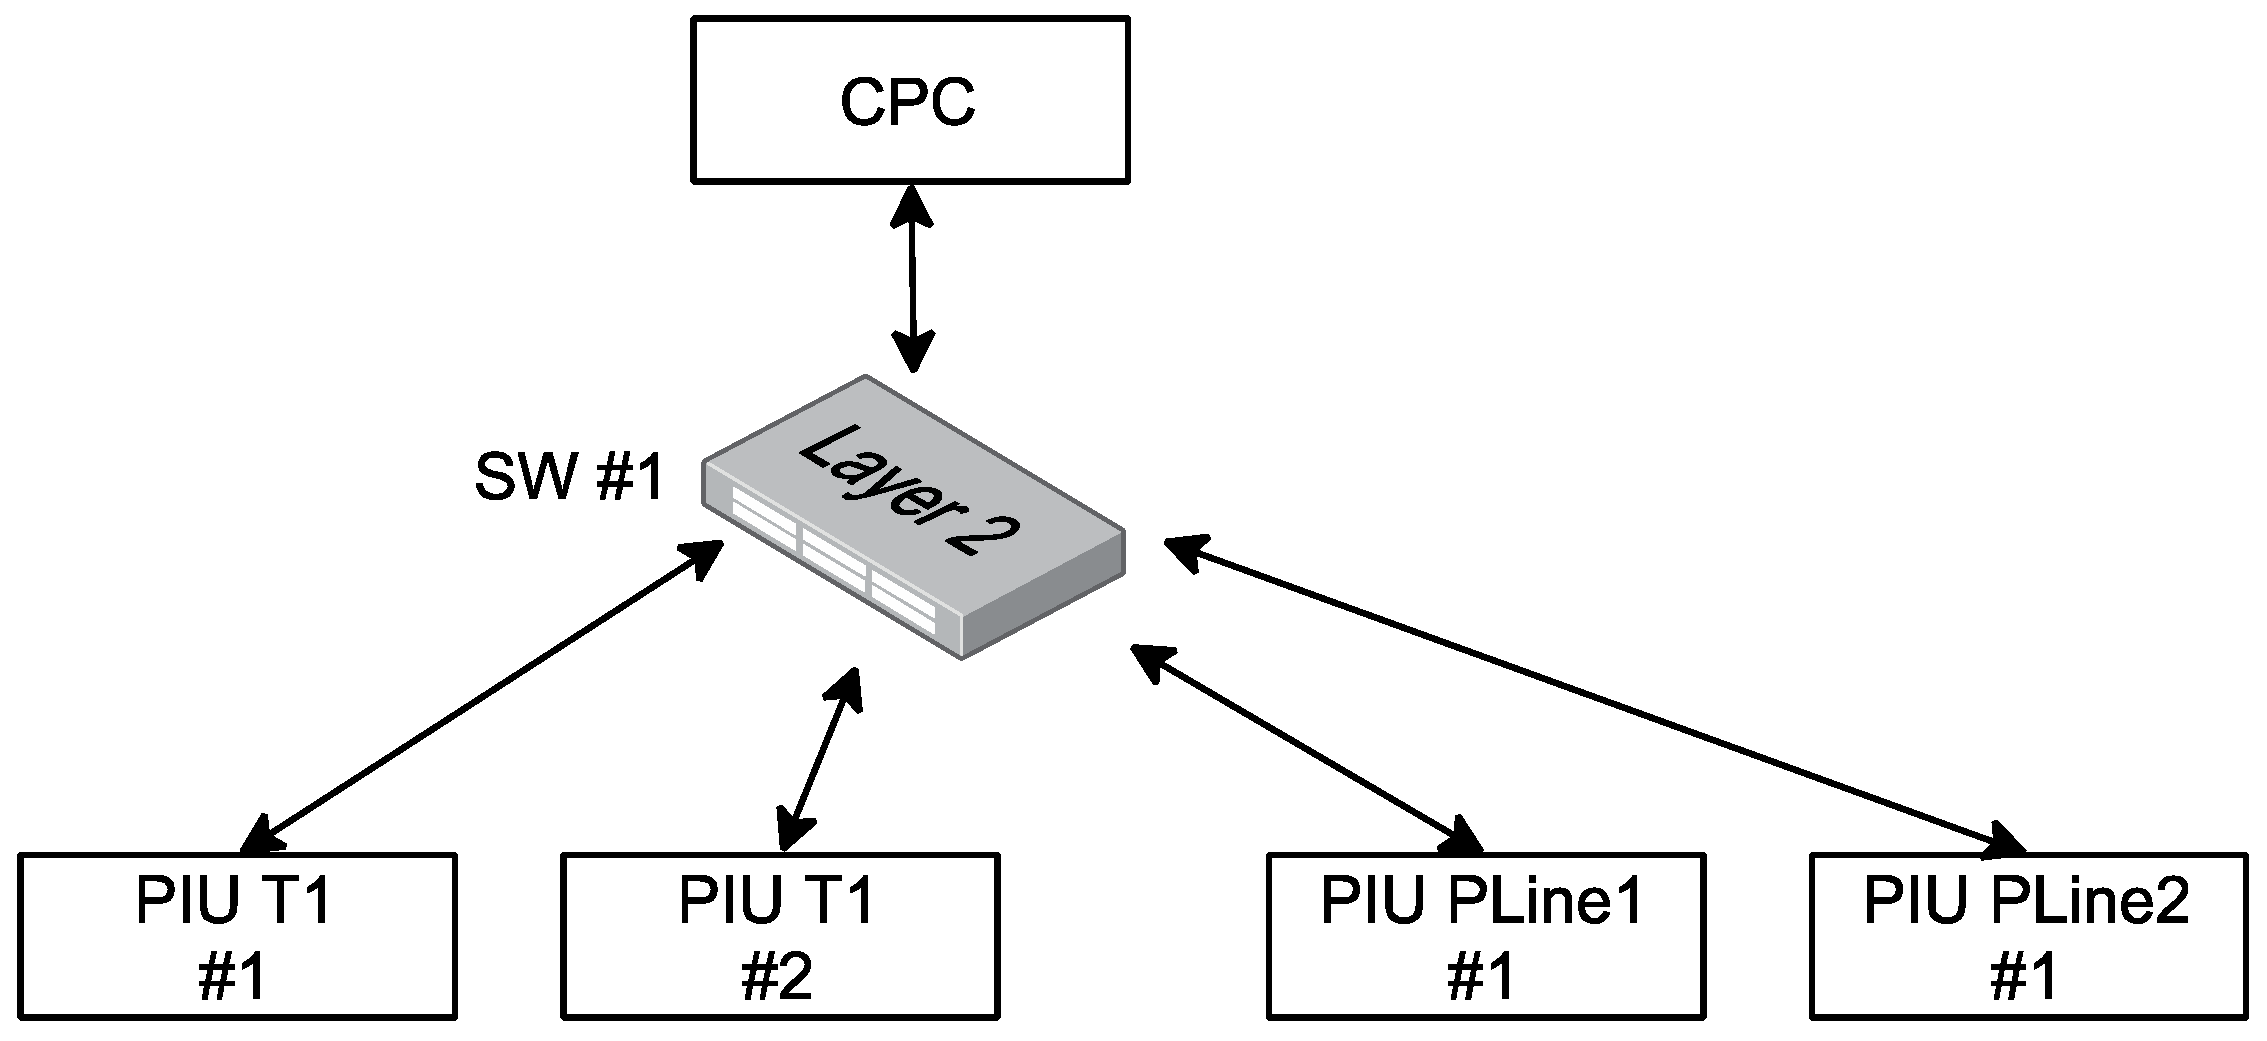
4.1. Reliability Analysis of Architecture 1

The architecture of IEDs with process buses is shown in Figure 3. The system consists of two identical PACSs to form a redundant system. Each PACS consists of PIUs, a switch, and protective relay IEDs. The PIU and the protective relay IEDs are configured according to the bay.
In a redundant system, the reliability of the whole system is that of two independent groups of IEDs (including protective relay IED, switch, and PIU) working in parallel. The architecture of a single set system is illustrated in Figure 4 whose reliability diagram is shown in Figure 5.
For a system composed of 7 IEDs, there are 27 = 128 possible states in total. It is not hard to reach the conclusion that its state transition diagram and transition probability matrix will be very complicated, to say nothing of their corresponding analysis. With the concept of equivalent component group introduced in reference [38], it is possible to analyze the state transition process after a combination of some components, greatly reducing analysis difficulties. If the transition probabilities between the combined state transitions remain the same as before the merging, the analytical results will still hold without degradation. Therefore, the protective relay IEDs (Simplified as IED), the switch (simplified as SW), and PIUs are divided into 3 groups with only 1 group changing its state at a time. Eight states can be coded in binary gray code, where U(Up) indicates working normally and D(Down) working abnormally, as itemized in Table 7:
The state transition diagram is sketched in Figure 6. The state number is labeled in the box at the lower left corner of the box, and the status of the three groups of devices is shown in the box. Taking state 0 for clarification, all devices in each IED group work normally. λi, λs, λp represent each failure rate at which the IED, switch and PIU group transit from working normally to abnormally, respectively, and conversely μi, μs, μp represent the repair rate at which the IED group, switch, and PIU group transit in the reverse direction, from working abnormally to normally.
According to Markov state space theory and references [34,39,40,41], Equation (3) denotes the state transition probability matrix of the PACS.
T 1 ( t ) = a 0 λ i t 0 λ s t 0 0 0 λ p t μ i t a 1 λ s t 0 0 0 λ p t 0 0 μ s t a 2 μ i t 0 λ p t 0 0 μ s t 0 λ i t a 3 λ p t 0 0 0 0 0 0 μ p t a 4 λ i t 0 μ s t 0 0 μ p t 0 μ i t a 5 μ s t 0 0 μ p t 0 0 0 λ s t a 6 μ i t μ p t 0 0 0 λ s t 0 λ i t a 7
where the values of a 0 to a 7 can be calculated by Equation (4):
a 0 = 1 ( λ i + λ s + λ p ) t a 1 = 1 ( μ i + λ s + λ p ) t a 2 = 1 ( μ s + μ i + λ p ) t a 3 = 1 ( μ s + λ i + λ p ) t a 4 = 1 ( μ p + λ i + μ s ) t a 5 = 1 ( μ p + μ i + μ s ) t a 6 = 1 ( μ p + λ s + μ i ) t a 7 = 1 ( μ p + λ s + λ i ) t
The transition density matrix can be obtained by Equation (5):
A 1 = lim t 0 T 1 t I t = b 0 λ i 0 λ s 0 0 0 λ p μ i b 1 λ s 0 0 0 λ p 0 0 μ s b 2 μ i 0 λ p 0 0 μ s 0 λ i b 3 λ p 0 0 0 0 0 0 μ p b 4 λ i 0 μ s 0 0 μ p 0 μ i b 5 μ s 0 0 μ p 0 0 0 λ s b 6 μ i μ p 0 0 0 λ s 0 λ i b 8
where the values of b 0 to b 7 can be calculated by Equation (6):
b 0 = ( λ i + λ s + λ p ) b 1 = ( μ i + λ s + λ p ) b 2 = ( μ s + μ i + λ p ) b 3 = ( μ s + λ i + λ p ) b 4 = ( μ p + λ i + μ s ) b 5 = ( μ p + μ i + μ s ) b 6 = ( μ p + λ s + μ i ) b 7 = ( μ p + λ s + λ i )
When t , the steady-state probability of the system in each state Pi approaches Pi( ) (Pi = Pi( )). Thus, the steady-state probability vector can be written as P = [P0, P1, P2, P3, P4, P5, P6, P7]. The steady-state probability of each state can be obtained by solving the group of equations in Equation (7).
P A 1 = 0 i = 0 7 P i = 1
Because the IED and PIU group are each constituted by 3 devices in series, the failure rate is 3 times that of a single device. The values of λ i ,   λ s , and λ p are shown in Table 8. The repair time of the devices, whether the fault is caused by one single IED or multiple IEDs simultaneously, should be less than 24 h, so the repair rate is uniformly recorded as 1/24 ≈ 0.041667(1/h). The failure rate of the device groups can be quantified by referring to Table 4, and the results are shown in Table 8.
Substituting the failure rate of the device groups into Equation (5), it will result in the Equation (8):
6.4332 × 10 5 3.4775 × 10 5 0 3.5580 × 10 6 0 0 0 2.5999 × 10 5 0.041667 0.041697 3.5580 × 10 6 0 0 0 2.5999 × 10 5 0 0 0.041667 0.08336 0.041667 0 2.5999 × 10 5 0 0 0.041667 0 3.4775 × 10 5 0.041728 2.5999 × 10 5 0 0 0 0 0 0 0.041667 0.083369 3.4775 × 10 5 0 0.041667 0 0 0.041667 0 0.041667 0.125010 0.041667 0 0 0.041667 0 0 0 3.5580 × 10 6 0.083338 0.041667 0.041667 0 0 0 3.558 × 10 6 0 3.4775 × 10 5 0.041705
Similarly, the Equation (8) being substituted into Equation (7), the steady-state probability of each state can be gotten as shown in Table 9.
The steady-state probability at which the system works normally is 99.8458%.
State 1, 3, and 7 correspond to the probability of the IED group, SW and PIU group’s failure to work normally, respectively. The steady-state probability of these three states is linearly correlated with the failure rate, and the device group with higher failure rate also has higher steady-state probability. Table 9 also shows the probability of simultaneous failing of more than one device group is almost zero.
For a dual redundant PACS, the devices containing IED, SW, and PIU are treated as a group of devices whose reliability block diagram is shown in Figure 7.
The state transition diagram of Figure 7 is redrawn in Figure 8.
The SET_A and SET_B represent PACS device group A and device group B. λa and λb denote the failure rate of their transiting from a normal state to an abnormal one, respectively, while μa and μb indicate the opposite transition, from an abnormal state to a normal one, named recovery rate. The state transition density matrix of the PACS might be depicted by Equation (9).
A 2 = ( λ a + λ b ) λ a 0 λ b μ a ( μ a + λ b ) λ b 0 0 μ b ( μ b + μ a ) μ a μ b 0 λ a ( μ b + λ a )
According to Figure 8, the failure rate of one device group, working state transiting from normal to abnormal, will be described by Equation (10).
λ a = λ b = λ i + λ s + λ p
Similarly, the recovery rate, symbolizing working state from abnormal to normal, can be well illustrated by Equation (11).
μ a = μ b = μ i + μ s + μ p
The failure rates of device groups are shown in Table 8. The failure rate of one set of PACS is 64.33163 × 10⁻⁶/h, and the recovery rate of each device group is 0.125001 (1/h). The IEDs in the systems of group A and B are identical, so the failure rates and recovery rates of the two systems are equal, respectively, as a consequence. Substituting the values into Equation (9), the steady-state probability of each state can be deduced as results are itemized in Table 10.
The steady-state reliability probability of this architecture is 99.8971%, which is higher than the value of 99.8485% as for a single set PACS.

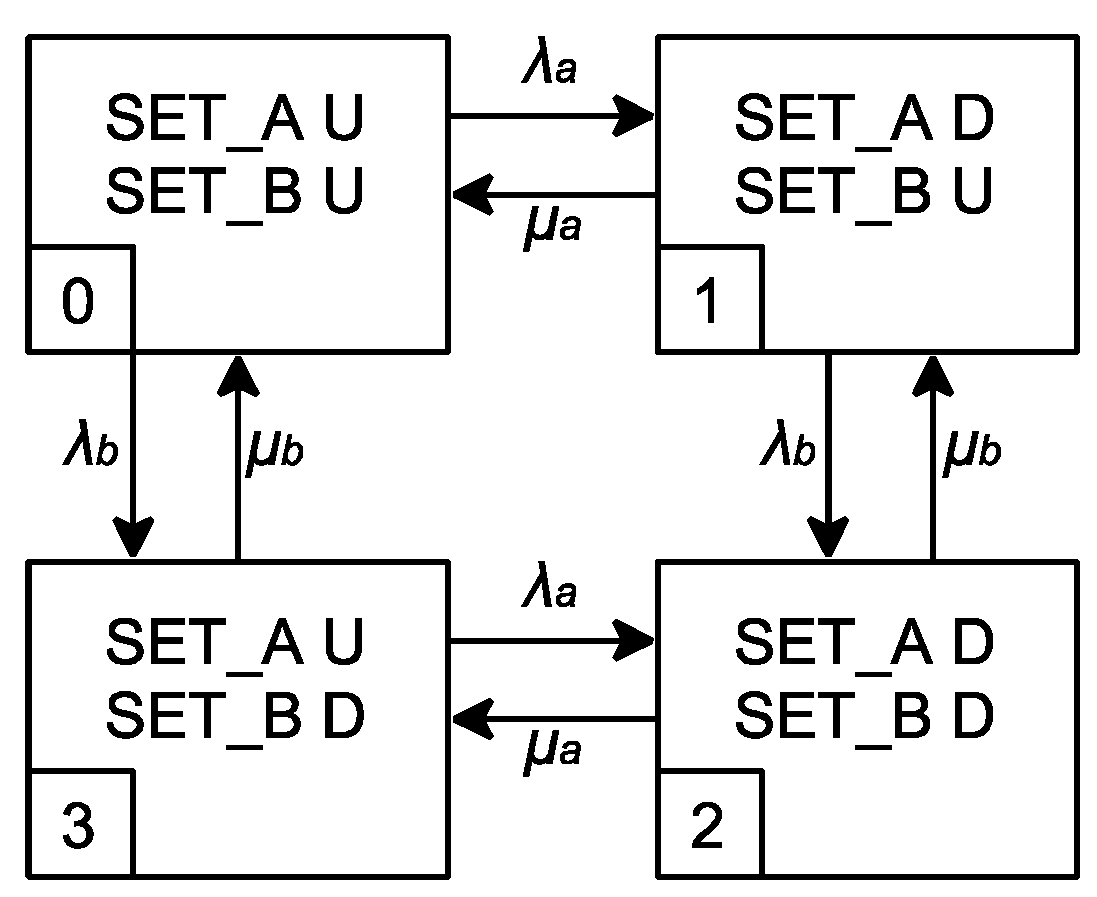
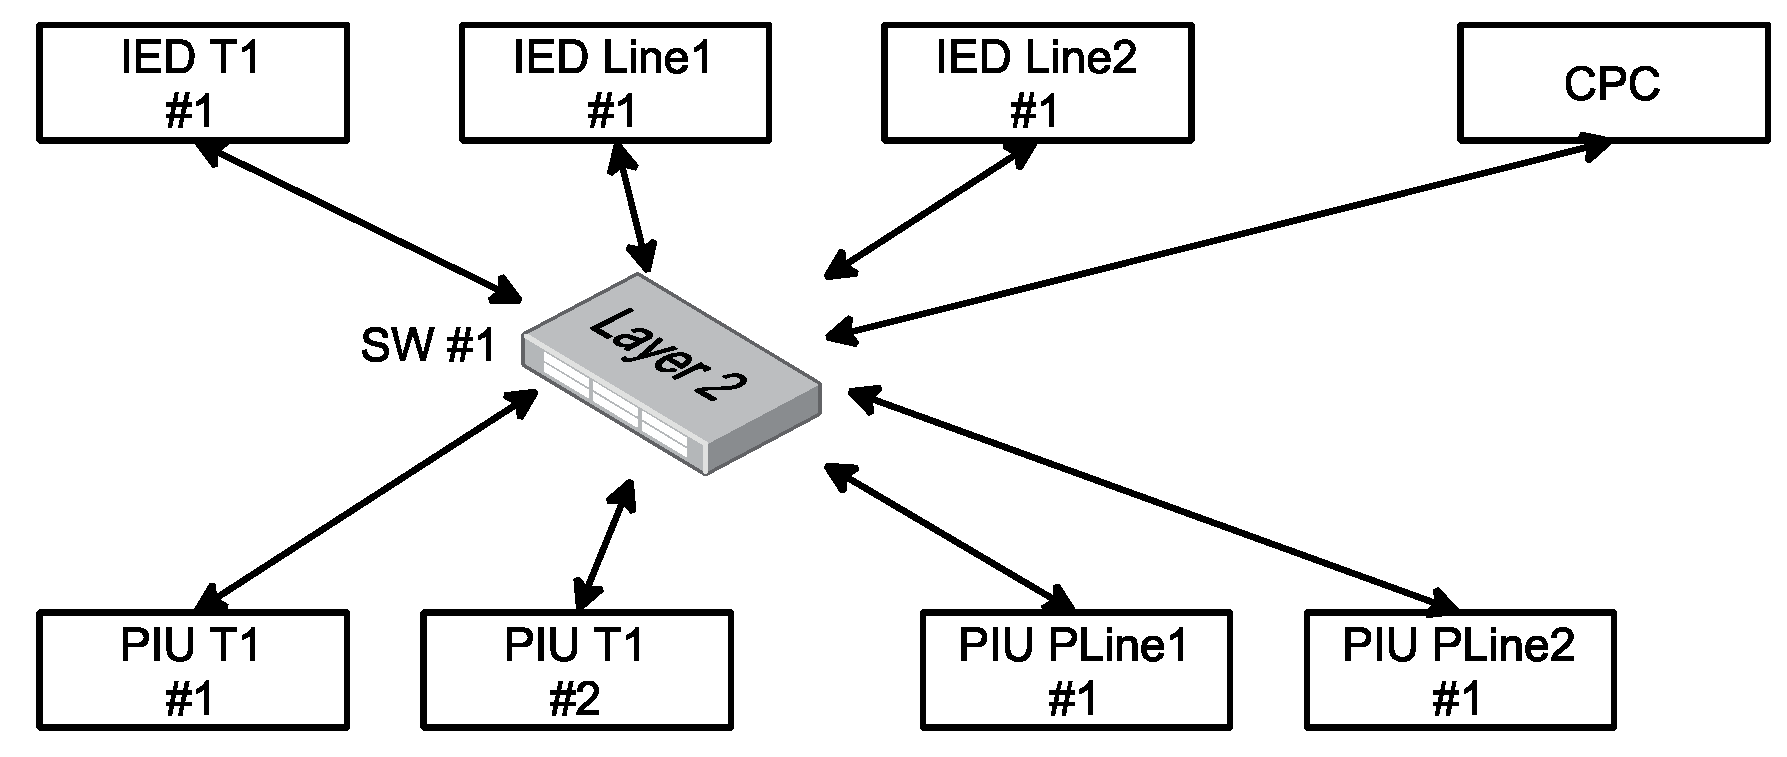
4.2. Reliability Analysis of Architecture 2

The architecture 3 in reference [15] adopts CPC as back-up in addition to IEDs with process bus, as shown in Figure 9, whose corresponding reliability diagram is illustrated in Figure 10.
The devices are divided into 4 groups, according to their types, which leads to PIUs, switch, bay-oriented protective relay IED, and CPC groups, each containing all the devices of the same kind. For the two transformer PIUs that are connected in parallel, the MBTF raises to 3/2 of that of a single one [27]. Then they are connected in sequence with the other two line PIUs connected in series. All repair time is represented on a 24 h basis, so the repair rate is 0.041667 (1/h). Then the failure rates are shown in Table 11.
According to the reliability diagram shown in Figure 10 may be expanded and expounded in a state transition diagram shown in Figure 11. State 0 and 8 stand for normal working of the PACS.
According to the state transition diagram, the steady-state probability of each state is shown in Table 12.
For state 0 and state 8, the PACS works normally, with a steady-state probability of 99.8620%.

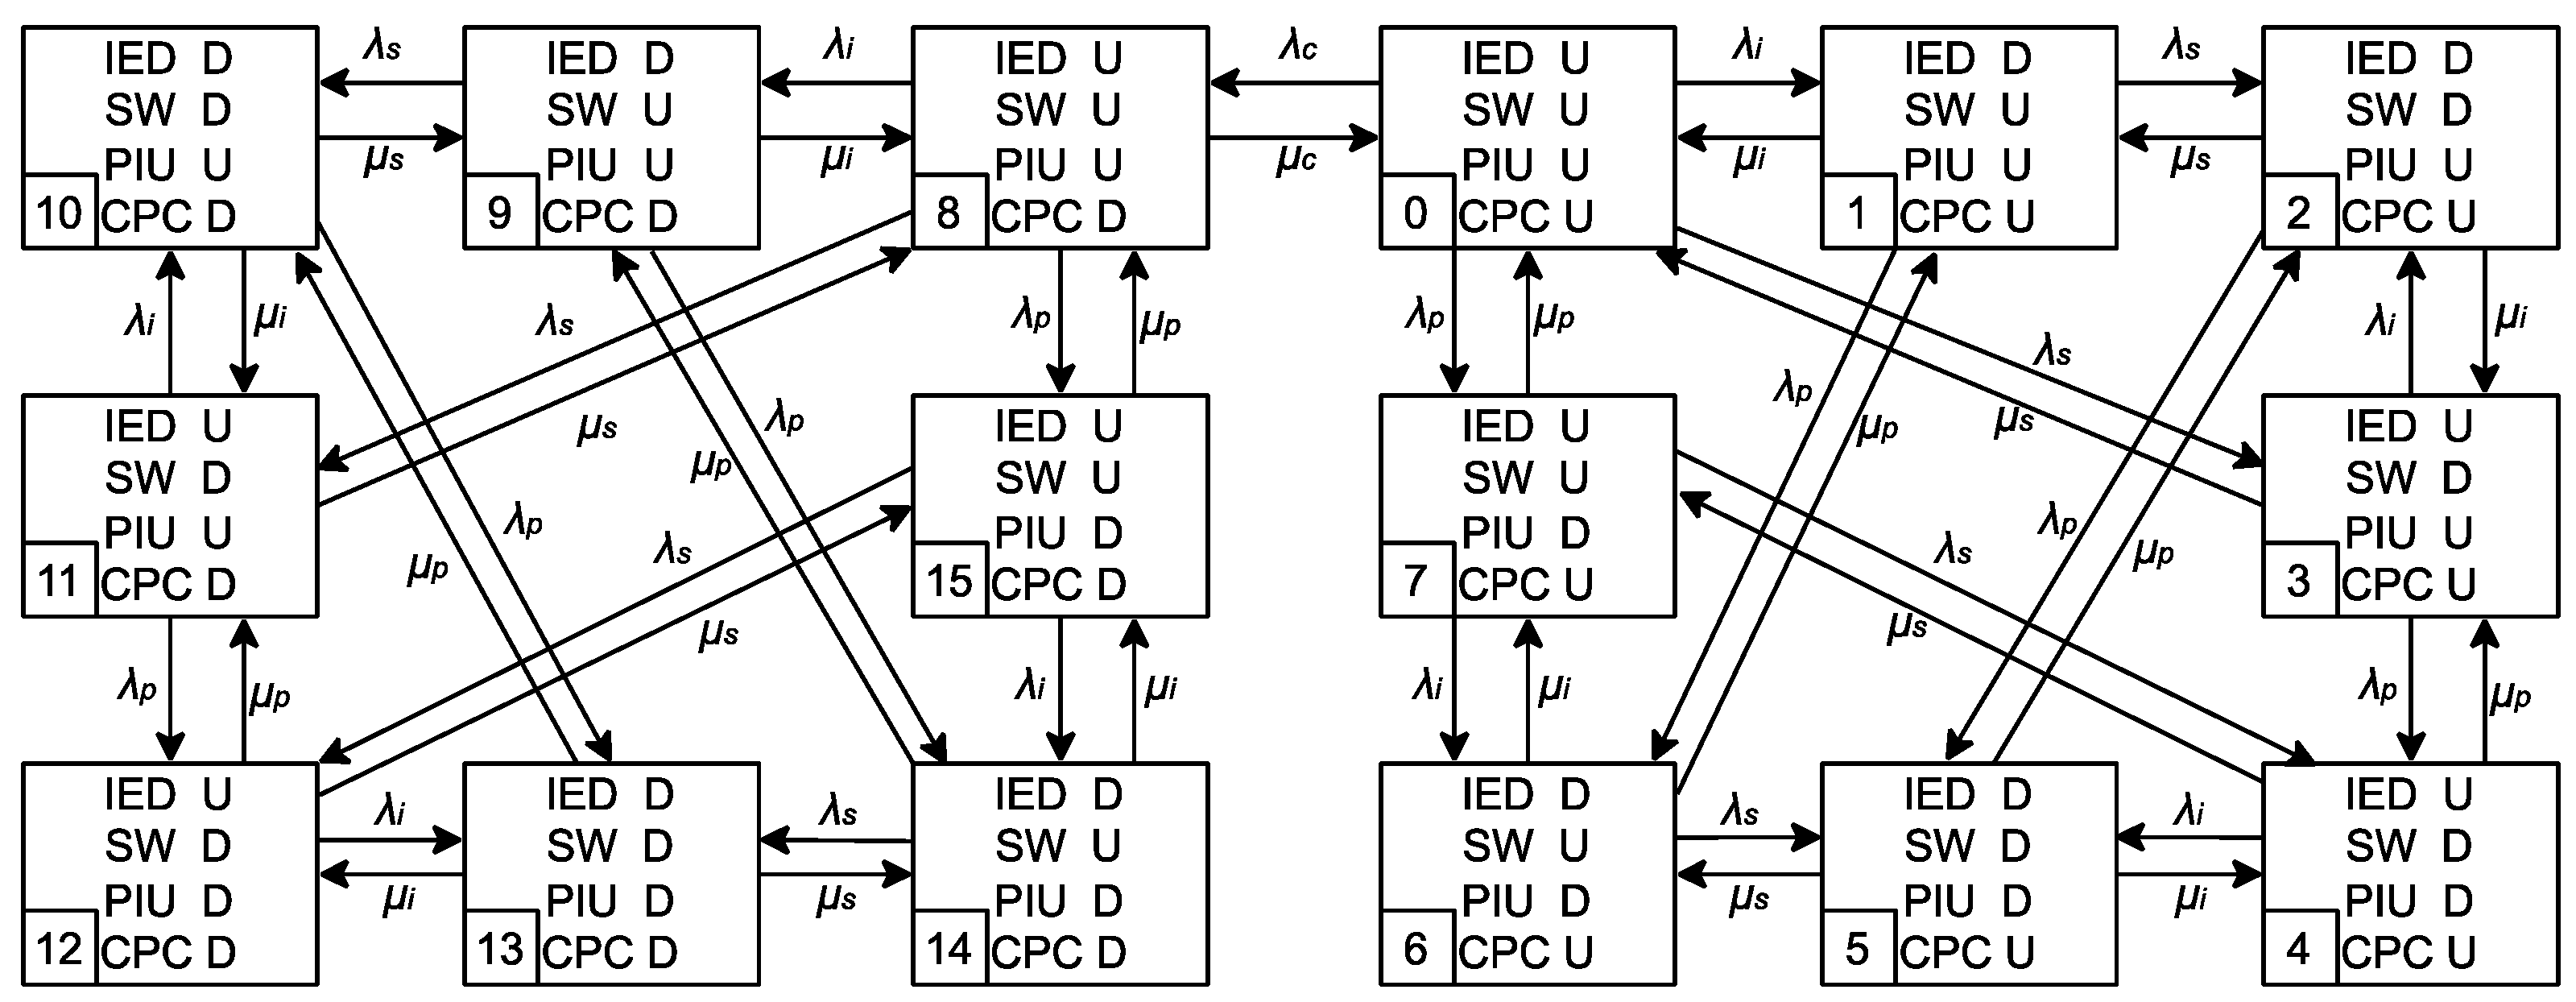
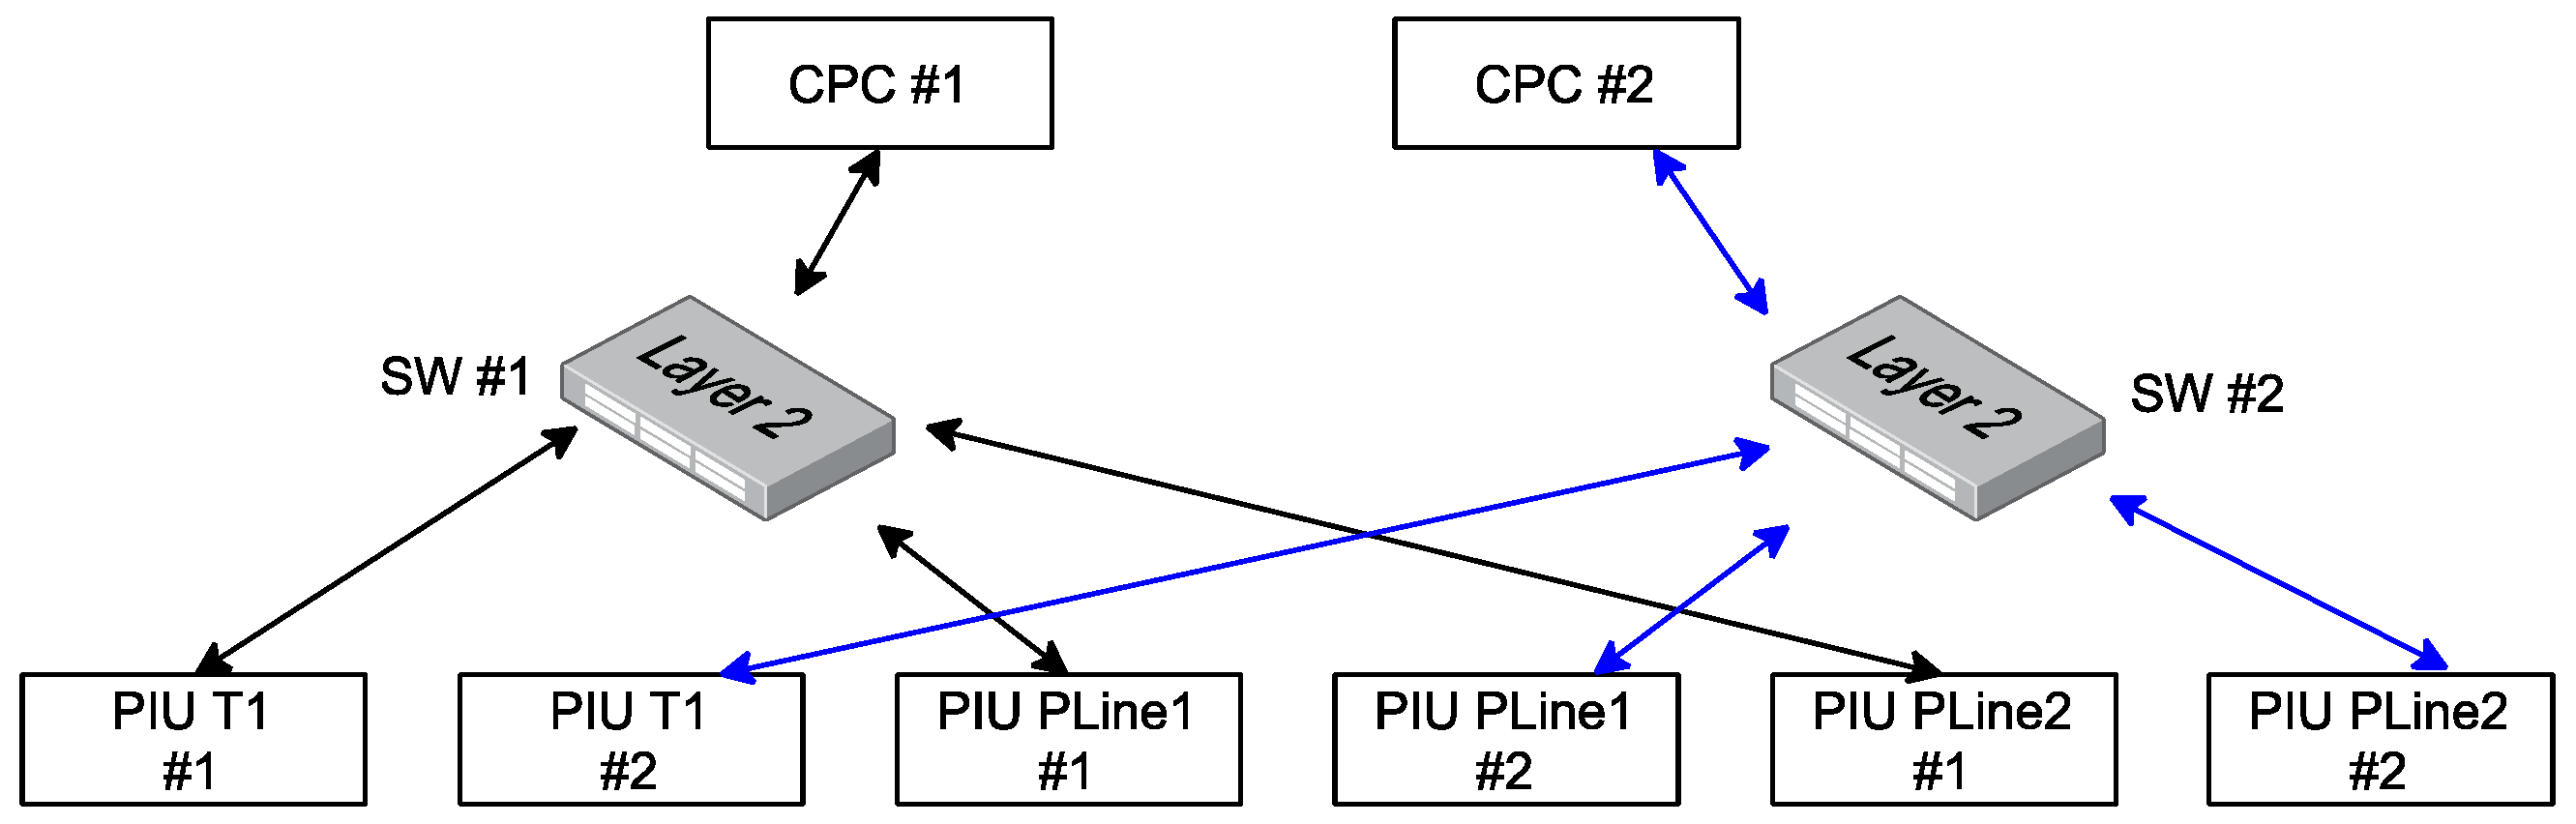
4.3. Reliability Analysis of Architecture 3 and Architecture 4

With the application of the method offered in Section 4.1, steady-state probabilities of normal working states for the architecture 3 and 4 can be obtained: CPC system with PIUs providing back-up-protection (shown in in Figure 12) is deduced to be 99.8993% while redundant CPC system (shown in Figure 13) 99.9282%.

4.4. Comparison of the 4 Architectures

Table 13 makes comparison of the ranks of the 4 architectures, among which the mission reliability of redundant CPC system is the highest.
Comparing architectures 3 and 4 reveals that system reliability is enhanced by redundancy. Among architectures 1 and 4, both utilizing redundancy, architecture 4 with fewer IEDs exhibits superior reliability. Architecture 2 solely employs CPC as a backup for the bay oriented protective IEDs. However, since the process layer IEDs lack redundancy in this architecture, any failure of these IEDs renders the entire system unable to function properly, which results in its lowest reliability. When comparing architecture 1 and architecture 3, it becomes evident that although architecture 3 does not employ redundant architecture, the probability of issues occurring is reduced due to its smaller number of IEDs. So, it can conclude that there are two ways to enhance the mission reliability of PACS, one is to simplify the system, the other is to using redundancy.
Table 14 depicts the unavailable hours per year of different PACS architectures. Though the steady-state probabilities of these four architectures are very close, the unavailable hours differences are quite large. Then, the difference of architectures should be considered.
In existing studies, the failure rate of devices is given the same value, which affects the unavailable hours greatly.
Three schemes are put in comparison:
Scheme A: The failure rate is based on Table 4
Scheme B: The IED and PIU using IED’s failure rate
Scheme C: The IED and PIU using PIU’s failure rate
The steady-state probability and variance are listed in Table 15. The steady-state probability ranking will be different when using different scheme. And the absolute value of steady-state probability variance will at least accurate 0.0107%. Though it is a small value, it will affect the unavailable hours more than 0.93 h.

5. Comprehensive Reliability Selection Method of PACSs

In Section 3 and Section 4, the basic and mission reliabilities of PACSs are studied, respectively. Therefore, an appropriate evaluation method will be proposed to select an architecture which results in the best comprehensive effect for both reliabilities of the system.

5.1. Principles and Calculation Steps of Comprehensive Reliability Comparison Method

The basic idea behind the comprehensive reliability comparison is to treat pairs of indexes as points in the orthogonal system by first normalizing them into a value range of [−1, 1]. Among all the points falling in the first quadrant, the one which possesses the furthest distance from the origin is deemed to be best scheme point. If occasionally no points appear in the first quadrant, move all points towards the first quadrant by an equal amount of displacement in both axes simultaneously until at least one point satisfying the precondition emerges.
The essence of this mechanism is to find out a scheme where both parameters exceed the same threshold at once and prefer the optimal solution by choosing the one with the greatest geometric distance. There are several possible variations:
(1)
If you have a certain preference for either parameter, you can choose one with a smaller angle from the corresponding axis.
(2)
If the two parameters are expected to have different weights, all points are preprocessed in a way that the values on the less-weighted axis is uniformly multiplied by a known coefficient between (0, 1), normalized by using the larger weight as a base value, after which the same procedures still apply.
(3)
Detailed steps:
i.
Take the two parameters (basic and mission reliability) of multiple schemes as two individual number sequences and normalize them into the range of [−1, 1] with the help of Equation (12).
x n o r m = 2 ( x x m i n ) x m a x x m i n 1
In Equation (12):
x n o r m Normalized value
x The value to be normalized
x m i n The minimal value in the sequence
x m a x The maximal value in the sequence
ii.
Pair the two normalized values into a point suitable for the placement in the orthogonal coordinate system.
iii.
Select points in the first quadrant as candidates for comparison. If no candidates are available, all points are moved an equal amount of displacement in both directions towards the 1st quadrant until at least one point does appear in it.
iv.
Use Equation (13) to calculate Euclidean distance for each point and select the point of the largest value as the optimal solution.
d = x m 2 + x b 2
In Equation (13):
d The distance from the coordinate point to the origin (also known as Euclidean distance)
x m Normalized mission reliability value
x b Normalized basic reliability value

5.2. Basic Reliability of the 4 PACS Architectures

When MBTF is selected as the basic reliability parameter, the basic reliability of the PACS is the reciprocal of the sum of the failure rate of all the IEDs in the system. Based on the failure rates of the various IEDs in Table 4 and the architectures in Figure 3, Figure 9, Figure 12, and Figure 13, the reliability of the various architectures can be derived.
Take the dual sets of redundant PACS with process level as an example in Figure 3, and its overall failure rate is elucidated by Equation (14):
λ 1 = 6 λ i + 2 λ s + 6 λ p
In Equation (14):
λ 1 Failure rate of architecture 1
λ i Failure rate of digital sampling protective relay IED
λ s Failure rate of the switch
λ p Failure rate of PIUs
Substituting the failure rates of the corresponding devices in Table 4 into Equation (14), λ 1 is 128.66326 × 10⁻⁶/h and MTBF 7772 h. With the application of the same method, the basic reliability of PACS of 4 different architectures can be calculated, as cataloged in Table 16.

5.3. Architecture Selection Using Existing Method

In Section 4.4, the mission reliabilities of four architectures are compared. The architecture 4 whose steady-state probability is the greatest will be chosen.
In Section 5.2, MTBFs of each architecture, which represent the basic reliability of these architecture are calculated. Architecture 3 who has the longest MTBF will be the most suitable architecture to the meet basic reliability requirement.

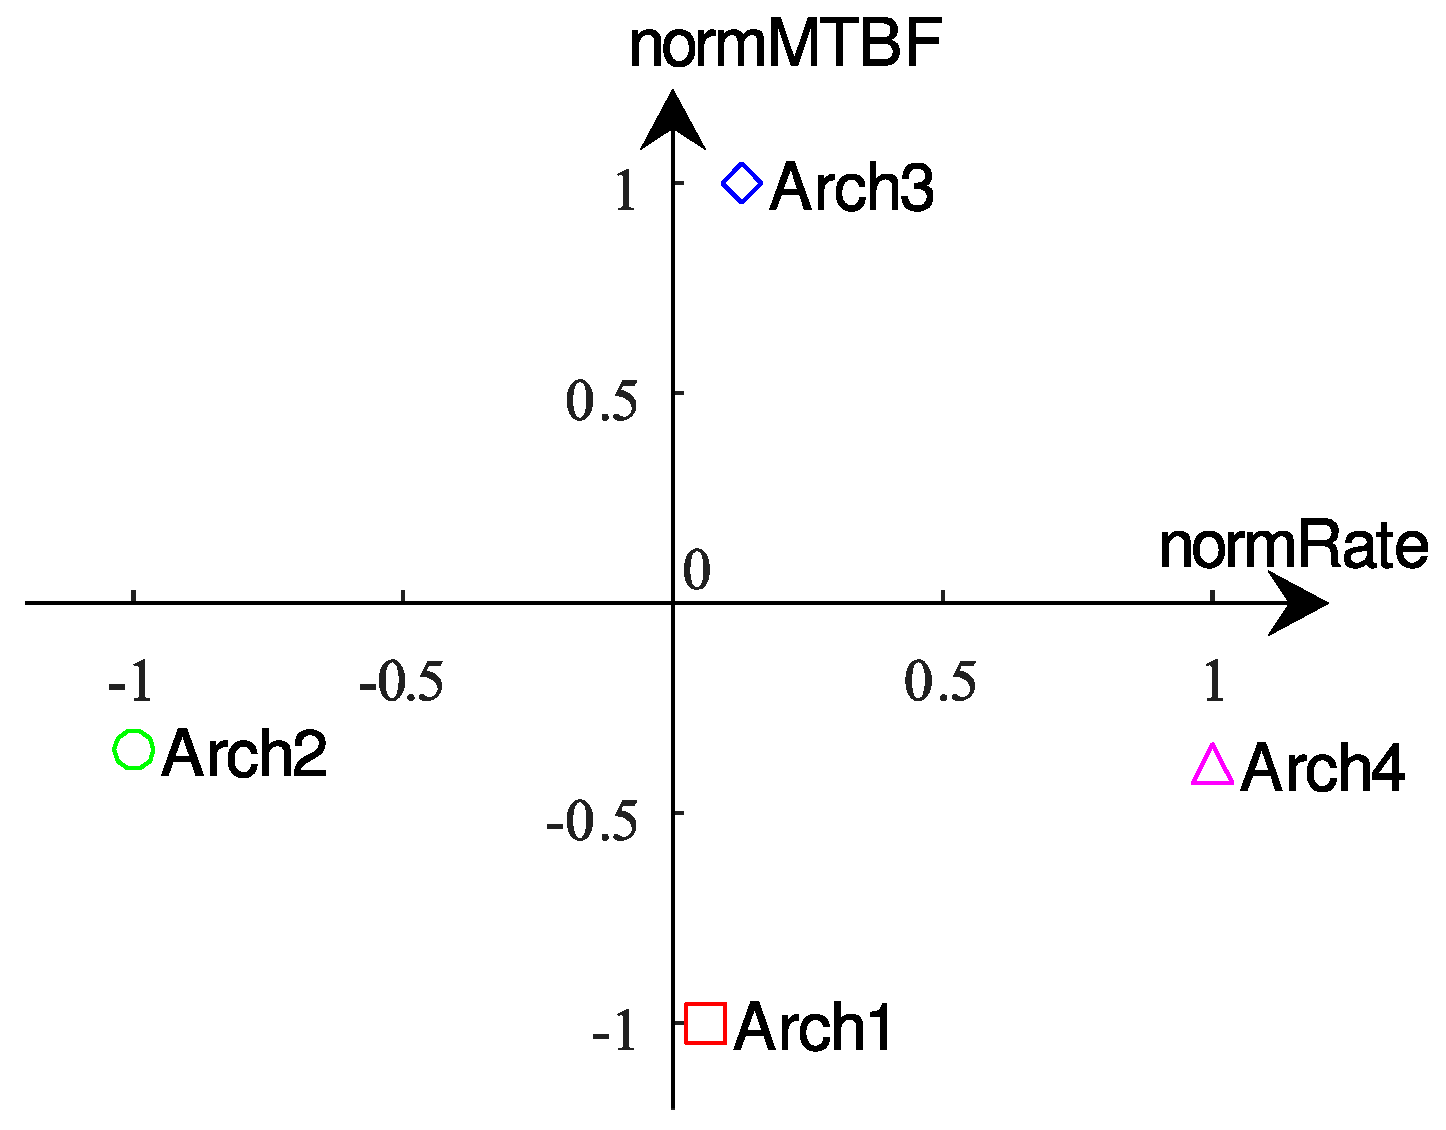
5.4. Comprehensive Reliability Analysis of 4 PACS Architectures

The reliability value pairs of 4 PACS architectures (steady-state probability, MTBF) are listed in Table 17, the device counts in each architecture also included.
Comparing the MTBF and device counts of these architectures, it can be concluded that the less device counts will give the longer MTBF.
Equation (12) is utilized to normalize the steady-state probability and MTBF into the range of [−1, 1], as shown in Table 18.
Drawing the 4 reliability pairs in the rectangular coordinate system, as shown in Figure 14. The horizontal coordinate normRate stands for the normalized steady-state probability of normal operation, while the vertical coordinate the normalized value of MTBF. The square symbolizes the comprehensive reliability point of architecture 1, the circle architecture 2, the diamond architecture 3, and the triangle is architecture 4. The fact can be easily observed from the figure that only architecture 3 is in the first quadrant, which means that architecture 3 is the solution of the best comprehensive reliability. There is no need to compare the geometric distances to the origin of all the reliability points representing different architectures to the origin at all.

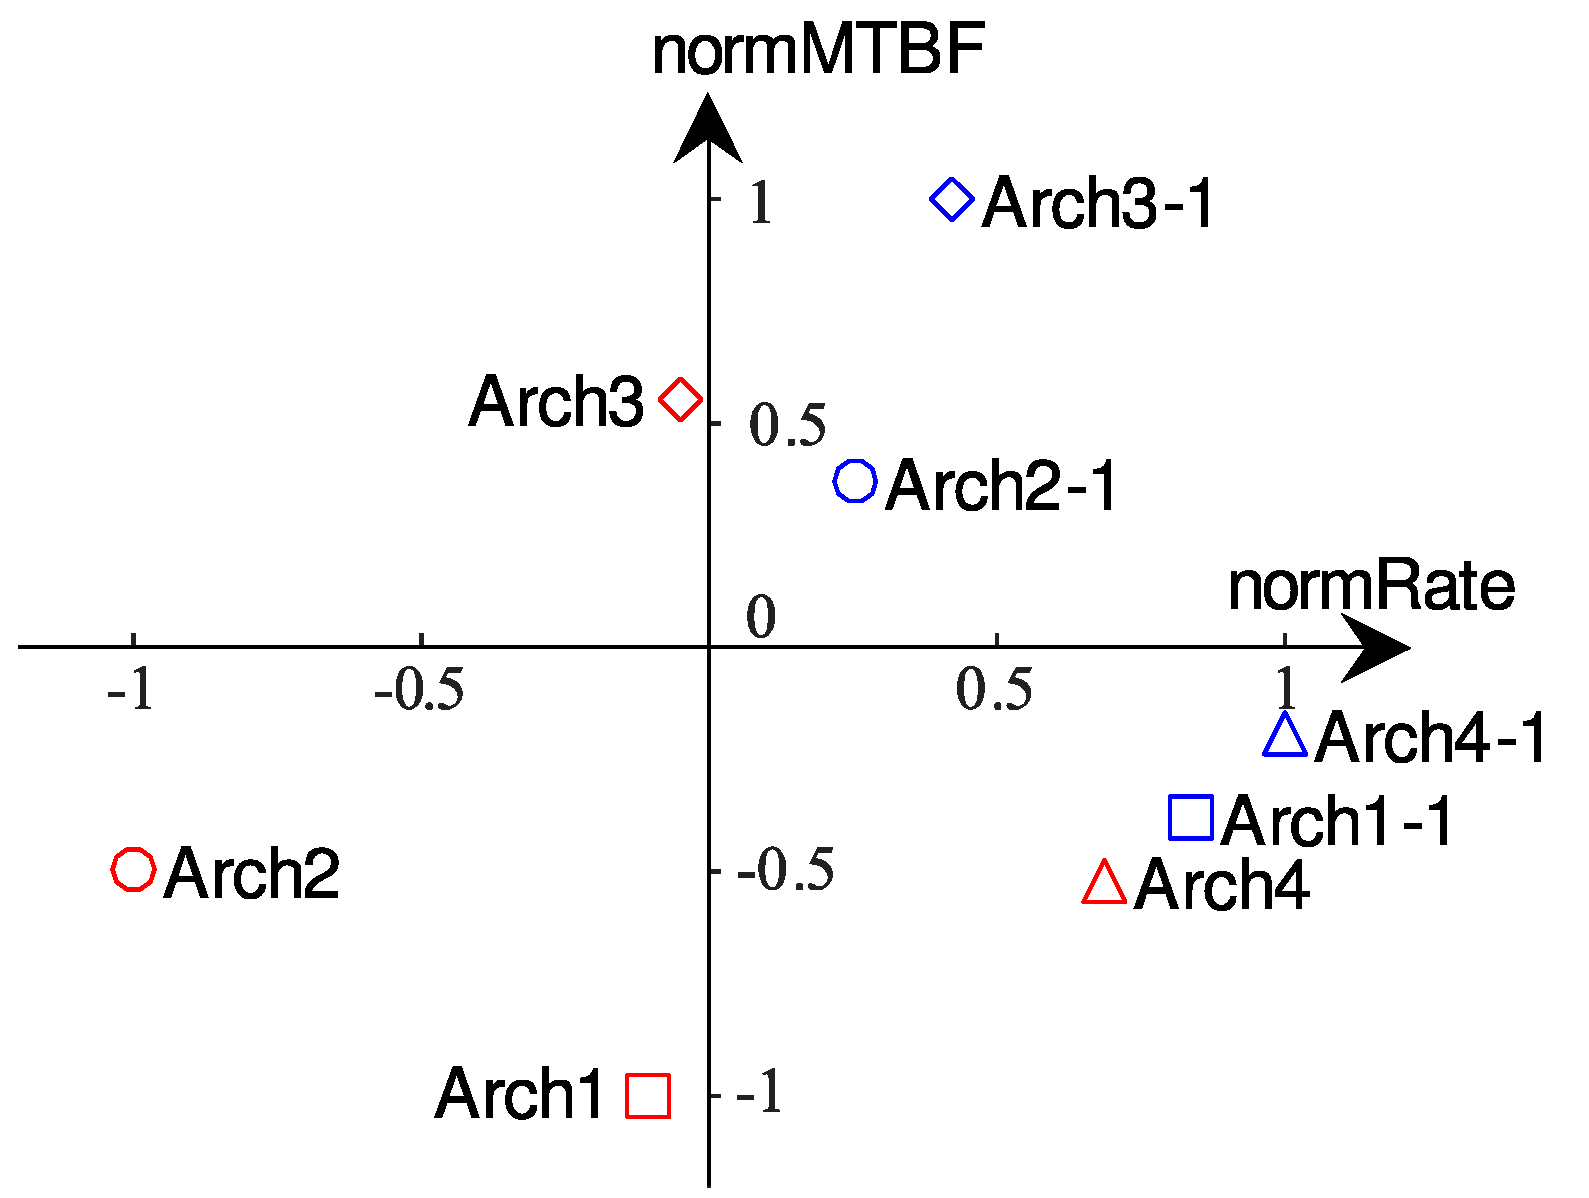
5.5. Comprehensive Reliability Analysis of 4 PACS Architectures (IED without LCD)

In Section 3, the basic reliability of the protective relay IEDs with and without LCD is listed. By applying the reliability data of the protection relay IEDs without LCD, the steady-state probabilities and MBTF of the 4 PACS architectures in normal operation are calculated, respectively, and afterwards the reliability pairs after normalization can be obtained, as shown in Table 19.
Eight reliability pairs are placed in the rectangular coordinate system, as shown in Figure 15. The red one denotes the comprehensive reliability point for a protective relay IED equipped with LCD, and the blue one for not equipped with LCD (Arch with ‘−1’ suffix). As it is obvious from the figure, when LCD is absent, both the basic and mission reliabilities have greatly improved. As a result, the comprehensive reliability of architecture 2 and 3 both move into the first quadrant. The d value of Arch3-1 and Arch2-1 is 1.0853 and 0.4490, respectively, which implies that architecture 3-1 possesses the highest comprehensive reliability. It stands out as the best PACS architecture out of the discussed 8 architectures.
Eviscerating an IED of the LCD will be a simple and easy means to ameliorate the comprehensive reliability of a PACSs.

6. Conclusions

Reliability evaluation is one of the most important things in selection of PACS architecture, which will affect the functionality and maintenance of the system. Existing studies of reliability on protective relay and PACS are reviewed, and it shows that current studies do not consider both basic and mission reliability at the same time. And the steady-state probability accurate can also be improved.
In this article, the basic reliability of protective relay devices, switches, and PIUs is calculated by means of part count prediction method, which solves the common pitfall shared by many essays that device reliability is assumed to be a constant value. And it also provides basic data for more accurate reliability calculation. Then, the mission reliability of 4 PACS architectures introduced in CIGRE B5.60 TB is analyzed. The steady-state probability of PACS architectures using parts count prediction and Markov model can get at least 0.0107% more accurate than existing method. Though it seems a small value, it will cause 0.93 h of system unavailability. After comparing the mission reliability of the 4 PACS architectures, it shows that reducing device or using redundancy can both improve the mission reliability of PACS.
By integrating considering basic reliability and mission reliability of PACSs, this paper proposes a comprehensive reliability comparison method, which use Euclidean distance to form an index, to select a more suitable architecture. It makes a tradeoff between making functional and maintenance efforts achievable. The utilities and industry substation owners can use this method to find a suitable PACS architecture.
Some future work can be performed to enhance the accuracy of mission reliability calculation and this method. Firstly, the reliability of communication links can be added to evaluation, which is one of the common fault parts in digital substation. Secondly, some other methods, such as the GO method and Monte Carlo method, can be used to evaluate the mission reliability of PACS. Thirdly, software portion can be considered to enrich the reliability estimation dimension.

Author Contributions

Methodology, X.C.; Investigation, X.C.; Data curation, X.C.; Writing—original draft, X.C.; Writing—review & editing, L.J.; Supervision, L.J. All authors have read and agreed to the published version of the manuscript.

Funding

This research received no external funding.

Data Availability Statement

Data are contained within the article.

Conflicts of Interest

The authors declare no conflict of interest.

References

  1. Grimes, J.D. On Determining the Reliability of Protective Relay Systems. IEEE Trans. Reliab. 1970, R-19, 82–85. [Google Scholar] [CrossRef]
  2. He, J.; Guo, Z.; Yang, X.; Li, Y. Reliability and dynamic performance simulation of protective relayings. Power Syst. Technol. 2004, 28, 18–22. [Google Scholar]
  3. Wang, Q.; Wang, X. Reliability analysis of protective relays in low voltage distribution network. In Proceedings of the 2009 International Conference on Sustainable Power Generation and Supply, SUPERGEN’09, Nanjing, China, 6–7 April 2009; pp. 1–5. [Google Scholar] [CrossRef]
  4. Xiong, X.; Chen, F.; Zhou, J.; Shen, Z. Reliability of Protection Relay Systems with Different Configurations. Autom. Electr. Power Syst. 2008, 32, 21–24. [Google Scholar] [CrossRef]
  5. Xiao, F.; Zhang, Z.; Yin, X. Reliability evaluation of protection system in smart substation based on process layer network. In Proceedings of the 2015 50th International Universities Power Engineering Conference (UPEC), Stoke on Trent, UK, 1–4 September 2015; pp. 1–5. [Google Scholar] [CrossRef]
  6. Tavares, H.; Leite, H.; Pinto, A.; Vidal, P.; Santos, J. Applying Reliability Centered Maintenance to a digital protective relay. In Proceedings of the 2012 3rd IEEE PES Innovative Smart Grid Technologies Europe (ISGT Europe), Berlin, Germany, 14–17 October 2012; pp. 1–5. [Google Scholar] [CrossRef]
  7. Ye, Y.; Huang, T.; Xie, M.; Liu, H.; Zhao, Z. Research on the reliability analysis method of condition-based maintenance of relay protection equipment in substation. Power Syst. Prot. Control 2021, 49, 170–177. [Google Scholar] [CrossRef]
  8. Zhang, P.; Portillo, L.; Kezunovic, M. Reliability and Component Importance Analysis of All-Digital Protection Systems. In Proceedings of the 2006 IEEE PES Power Systems Conference and Exposition, Atlanta, GA, USA, 29 October–1 November 2006; pp. 1380–1387. [Google Scholar] [CrossRef]
  9. Zhang, P.; Huo, C.; Kezunovic, M. A Novel Measure of omponent Importance Considering Cost for All-Digital Protection Systems. In Proceedings of the 2007 IEEE Power Engineering Society General Meeting, Tampa, FL, USA, 24–28 June 2007; pp. 1–6. [Google Scholar] [CrossRef]
  10. Kanabar, M.G.; Sidhu, T.S. Reliability and availability analysis of IEC 61850 based substation communication architectures. In Proceedings of the 2009 IEEE Power & Energy Society General Meeting, Calgary, AB, Canada, 26–30 July 2009; pp. 1–8. [Google Scholar] [CrossRef]
  11. Kolesnikov, A.; Kulikov, A.; Lukicheva, I. Increasing the Reliability of the Centralized Protection of the Digital Substation. In Proceedings of the 2021 International Ural Conference on Electrical Power Engineering (UralCon), Magnitogorsk, Russian, 24–26 September 2021; pp. 42–48. [Google Scholar] [CrossRef]
  12. Das, N.; Islam, S. Analysis of power system communication architectures between substations using IEC 61850. In Proceedings of the 5th Brunei International Conference on Engineering and Technology (BICET 2014), Bandar Seri Begawan, Brunei, 1–3 November 2014; pp. 1–6. [Google Scholar] [CrossRef]
  13. Falahati, B.; Chua, E. Failure modes in IEC 61850-enabled substation automation systems. In Proceedings of the 2016 IEEE/PES Transmission and Distribution Conference and Exposition (T&D), Dallas, TX, USA, 3–5 May 2016; pp. 1–5. [Google Scholar] [CrossRef]
  14. Loenders, R.; Van Hertem, D.; Beerten, J.; Chaffey, G.; Yang, L. Testing reliability performance of IEC61850-based digital substations. In Proceedings of the 15th International Conference on Developments in Power System Protection (DPSP 2020), Liverpool, UK, 9–12 March 2020; pp. 1–7. [Google Scholar] [CrossRef]
  15. CIGRE B5.60 WG; Protection, Automation and Control Architectures with Functionality Independent of Hardware; CIGRE: Paris, France, 2023.
  16. Ali, S.; Ali, S.; Shah, I.; Siddiqui, G.F.; Saba, T.; Rehman, A. Reliability Analysis for Electronic Devices Using Generalized Exponential Distribution. IEEE Access 2020, 8, 108629–108644. [Google Scholar] [CrossRef]
  17. Chen, L.; Qiu, Y.; Chen, J.; Huang, X. Reliability analysis of autonomous controllable protection device in power system. In Proceedings of the 2020 8th International Conference on Power Electronics Systems and Applications (PESA), Hong Kong, China, 7–10 December 2020; pp. 1–5. [Google Scholar] [CrossRef]
  18. Xiao, J.; Song, K.; Wang, F.; Xu, H.; Xiong, F. The Risk Assessment Optimization for the Relay Protection System Based on Proportional Intensity Model. In Proceedings of the 2019 IEEE 3rd Conference on Energy Internet and Energy System Integration (EI2), Changsha, China, 8–10 November 2019; pp. 2519–2523. [Google Scholar] [CrossRef]
  19. Liao, Q.; Wang, X.; Ling, D.; Xiao, Z.; Huang, H.-Z. Equipment reliability analysis based on the Mean-rank method of two-parameter Weibull distribution. In Proceedings of the 2011 International Conference on Quality, Reliability, Risk, Maintenance, and Safety Engineering, Xi’an, China, 17–19 June 2011; pp. 361–364. [Google Scholar] [CrossRef]
  20. Lu, Z.; Li, J.; Yang, S.; Han, S.; Lu, Z. Research on Decision-making of Secondary Equipment Maintenance Based on Online Monitoring. In Proceedings of the 2019 IEEE 8th International Conference on Advanced Power System Automation and Protection (APAP), Xi’an, China, 21–24 October 2019; pp. 1578–1582. [Google Scholar] [CrossRef]
  21. MIL-HDBK-217F Notice 2; Military Handbook Reliability Prediction of Electronic Equipment. U.S. Department of Defense: Arlington County, VA, USA, 1995.
  22. GJB/Z 299C; Reliability Prediction Handbook for Electronic Equipment. 2006.
  23. SR-332 Issue 4; Reliability Prediction Procedure for Electronic Equipment. Telcordia: Piscataway Township, NJ, USA, 2016.
  24. Butnicu, D. POL DC-DC Converter Output Capacitor Bank’s Reliability Comparison using Prediction Standard MIL-HDBK-217F and SN 29500. In Proceedings of the 2021 IEEE 27th International Symposium for Design and Technology in Electronic Packaging (SIITME), Timisoara, Romania, 27–30 October 2021; pp. 169–172. [Google Scholar] [CrossRef]
  25. Hussain, B.; Beck, C.E.; Wiedman, T.E.; Sufana, C.R. Transmission system protection: A reliability study. IEEE Trans. Power Deliv. 1997, 12, 675–680. [Google Scholar] [CrossRef]
  26. Choudhary, K.; Sidharthan, P. Reliability prediction of Electronic Power Conditioner (EPC) using MIL-HDBK-217 based parts count method. In Proceedings of the 2015 International Conference on Computer, Communication and Control (IC4), Indore, India, 10–12 September 2015; pp. 1–4. [Google Scholar] [CrossRef]
  27. Liu, F.; Liu, P. Reliability Prediction of an Unmanned Ground Vehicular Computer Based Parts Count Method. In Proceedings of the 2019 IEEE International Conference on Unmanned Systems (ICUS), Beijing, China, 17–19 October 2019; pp. 536–541. [Google Scholar] [CrossRef]
  28. Kong, L.; Ren, L. Evaluation of LCD Life. Chin. J. Liq. Cryst. Disp. 2011, 26, 154–157. [Google Scholar] [CrossRef]
  29. Zhu, J.; Ge, X.; Xie, R.; Sun, Z.; Zheng, X.; Tian, H. Study on the Constraints on Integration of Digital Distribution Substation Equipment and Necessary Maintenace Adjustment. In Proceedings of the 2020 International Symposium on Autonomous Systems (ISAS), Guangzhou, China, 6–8 December 2020; pp. 153–157. [Google Scholar] [CrossRef]
  30. Benabid, R.; Merrouche, D.; Bourenane, A.; Alzbutas, R. Reliability Assessment of Redundant Electrical Power Supply Systems using Fault Tree Analysis, Reliability Block Diagram, and Monte Carlo Simulation Methods. In Proceedings of the 2018 International Conference on Electrical Sciences and Technologies in Maghreb (CISTEM), Algiers, Algeria, 28–31 October 2018; pp. 1–7. [Google Scholar] [CrossRef]
  31. Xu, L.; Liu, Y.; Chen, J.; Xu, S.; Chen, X.; Li, L. A Goal Oriented Reliability Assessment of System Protection Devices. In Proceedings of the 2022 4th Asia Energy and Electrical Engineering Symposium (AEEES), Chengdu, China, 25–28 March 2022; pp. 757–761. [Google Scholar] [CrossRef]
  32. Anderson, P.M.; Agarwal, S.K. An improved model for protective-system reliability. IEEE Trans. Reliab. 1992, 41, 422–426. [Google Scholar] [CrossRef]
  33. Anderson, P.M.; Chintaluri, G.M.; Magbuhat, S.M.; Ghajar, R.F. An improved reliability model for redundant protective systems-Markov models. IEEE Trans. Power Syst. 1997, 12, 573–578. [Google Scholar] [CrossRef]
  34. Wang, C.; Xu, Z.; Zheng, S. Reliability analysis of protective relays in fault information processing system in China. In Proceedings of the 2006 IEEE Power Engineering Society General Meeting, Montreal, QC, Canada, 18–22 June 2006; p. 5. [Google Scholar] [CrossRef]
  35. Wang, X.; Chen, Y.; Wen, M.; Yin, X. A Novel Markov Model for Protective Relay Reliability. IEEE Trans. Power Deliv. 2023, 38, 2110–2118. [Google Scholar] [CrossRef]
  36. Wang, X.; Zhao, J.; Wang, G.; Wang, T. Research on reliability evolutionary optimization of relays device based on Multi-Markov model. SN Appl. Sci. 2023, 5, 86. [Google Scholar] [CrossRef]
  37. Zhang, Y.; Zhao, Y.; Xing, F.; Wang, S.; Liu, Z.; Song, Z.; Jia, T.; Zhang, X.; Wang, L.; Xu, Y. Research on relay reliability evaluation based on information flow block diagram in smart substations. In Proceedings of the 2021 3rd International Academic Exchange Conference on Science and Technology Innovation (IAECST), Guangzhou, China, 10–12 December 2021; pp. 1676–1680. [Google Scholar] [CrossRef]
  38. Xie, K.; Ma, H.; Hu, B.; Cao, K.; Li, C. Reliability Evaluation of Converter Transformer System in HVDC Transmission System Based on Markov State Space Graph Algorithm. Power Syst. Technol. 2011, 35, 71–78. [Google Scholar]
  39. Brito, M.P.; Griffiths, G. A Markov Chain State Transition Approach to Establishing Critical Phases for AUV Reliability. IEEE J. Ocean. Eng. 2011, 36, 139–149. [Google Scholar] [CrossRef]
  40. Etemadi, A.H.; Fotuhi-Firuzabad, M. Design and Routine Test Optimization of Modern Protection Systems with Reliability and Economic Constraints. IEEE Trans. Power Deliv. 2012, 27, 271–278. [Google Scholar] [CrossRef]
  41. Trofimov, A.; Khalyasmaa, A. Redundant Relay Protection Devices for Power Systems Reliability Model. In Proceedings of the 2020 5th International Conference on Green Technology and Sustainable Development (GTSD), Ho Chi Minh City, Vietnam, 27–28 November 2020; pp. 651–656. [Google Scholar] [CrossRef]
Figure 1. Steps of analysis of reliability of PACSs.
Energies 17 00365 g001
Figure 2. A typical architecture of protection relay IEDs.
Energies 17 00365 g002
Figure 3. Redundant system architecture of IEDs with process bus.
Energies 17 00365 g003
Figure 4. Single set architecture of IEDs with process bus.
Energies 17 00365 g004
Figure 5. The reliability diagram of IEDs with process bus.
Energies 17 00365 g005
Figure 6. State transition diagram of simplified architecture of IEDs with process bus IED.
Energies 17 00365 g006
Figure 7. The reliability diagram of dual redundant architecture of IEDs with process bus.
Energies 17 00365 g007
Figure 8. State transition diagram of dual redundant architecture of IEDs with process bus.
Energies 17 00365 g008
Figure 9. A hybrid PACS with IEDs, process bus, and back-up CPC system.
Energies 17 00365 g009
Figure 10. The reliability diagram of a hybrid PACS with IEDs, process bus, and back-up CPC system.
Energies 17 00365 g010
Figure 11. State transition diagram of a hybrid PACS with IEDs, process bus, and back-up CPC system.
Energies 17 00365 g011
Figure 12. CPC system with PIUs providing back-up protection.
Energies 17 00365 g012
Figure 13. Redundant CPC system.
Energies 17 00365 g013
Figure 14. Comparison of comprehensive reliability of the 4 PACS architectures.
Energies 17 00365 g014
Figure 15. Comparison of comprehensive reliability of 4 PACS architecture based on PAC IEDs with or without LCD.
Energies 17 00365 g015
Table 1. Some of the most referenced reliability prediction manuals.
ManualIssue DateMain Character
MIL-HDBK-217F Notice 2 [21]1995United States military standard, including parts count prediction method and part stress prediction method
GJB/Z 299C [22]2006Chinese national military standards, including the parts count prediction method and part stress prediction method; include reliability data for domestic and imported materials
Telcordia SR-332 Issue 4 [23]2016Applicable to the telecommunications industry, providing three prediction methods: parts count prediction method, integrating laboratory test data on units method, and integrating field data on units method
Table 2. Basic reliability estimation table of other boards.
Board Categories Failure   Rate   λ s (10−6/h)MTBF (h)
HMI board0.907961,101,370
PANEL board7.64980130,722
CPU board0.756961,321,074
Binary input board0.297263,364,058
Binary output board0.516261,937,008
AC board0.0541018,484,288
Mother board0.209454,774,409
Table 3. Failure rate estimation table of conventional sampling line protective relay IEDs.
Board CategoriesNumber of Boards N Failure   Rate   λ G (10−6/h) N λ G (10−6/h)
PANEL board17.651807.65180
HMI board10.906660.90666
CPU board20.756961.51392
Binary input board50.516262.58130
Binary output board20.297260.59452
Mother board10.209450.20945
AC board10.054100.05410
Sum 13.51175
Table 4. Failure rate estimation table of PAC IEDs.
IED CategoriesFailure Rate
λ (10−6/h)
MTBF (h)MTBF (Year)
100 Mbit optical switch3.55796281,06032.08
Merging unit3.55902280,97632.07
PIU (Process Interface Unit)8.66631115,38913.17
Digital sampling line protection relay IED11.5915886,2709.85
Conventional sampling line protection relay IED13.5117574,0108.45
Station domain protection relay IED15.3310565,2277.45
Table 5. Failure rate estimation table of protection relay IEDs without LCD.
IED CategoriesFailure Rate λ (10−6/h)MTBF (h)MTBF (Year)
Digital sampling line protection relay IED3.88196257,60229.41
Conventional sampling line protection relay IED5.85995170,65019.48
Station domain protection relay IED7.62143131,20914.98
Table 6. Comparison table of architectures in this paper and B5.60 TB.
This ArticleB5.60 TBDescription
11IEDs with process bus
23Hybrid PACS with IEDs, process bus, and back-up CPC (centralized protection and control) system
34CPC system with PIUs providing back-up-protection
45Redundant CPC system
Table 7. States of single set architecture of IEDs with process bus.
StatePIUSWIED
0UUU
1UUD
2UDD
3UDU
4DDU
5DDD
6DUD
7DUU
Table 8. Failure rate of the device groups.
Failure Rate of Device GroupFailure Rate of Single Device
(10−6/h)
Failure Rate of Device Group
(10−6/h)
IED ( λ i )11.5915834.77474
SW ( λ s )3.557963.55796
PIU ( λ p )8.6663125.99893
Table 9. The steady-state probability of architecture of IEDs with process bus.
State01234567
Steady-state probability99.8458%0.0833%0.0000%0.0085%0.0000%0.0000%0.0001%0.0623%
Table 10. The steady-state probability of dual redundant architecture of IEDs with process bus.
State0123
Steady-state probability99.8971%0.0514%0.0000%0.0514%
Table 11. The failure rate of hybrid a PACS with IEDs, process bus, and back-up CPC system.
Failure Rate of Device GroupFailure Rate of Single Device
(10−6/h)
Failure Rate of Device Group
(10−6/h)
IED ( λ i )11.5915830.91090
SW ( λ s )3.557963.55796
PIU ( λ p )8.6663123.11016
CPC ( λ c )15.3310515.33105
Table 12. The steady-state probability of a hybrid PACS with IEDs, process bus, and back-up CPC system.
State01234567
Steady-state probability99.8252%0.0741%0.0000%0.0085%0.0000%0.0000%0.0000%0.0554%
State89101112131415
Steady-state probability0.0367%0.0000%0.0000%0.0000%0.0000%0.0000%0.0000%0.0000%
Table 13. Comparison of steady-state probabilities of the 4 architectures.
IndexArchitectureSteady-State ProbabilityReliability Rank
1IEDs with process bus99.8971%3
2Hybrid PACS with IEDs, process bus and back-up CPC system99.8620%4
3CPC system with PIUs providing back-up-protection99.8993%2
4Redundant CPC system99.9282%1
Table 14. Unavailable hours of each architecture.
IndexSteady-State ProbabilityUnavailable Hours Per Year
8760   × (1 − Steady-State Probability)
199.8971%9.01
299.8620%12.09
399.8993%8.82
499.9282%6.29
Table 15. Unavailable hours of each architecture using different failure rate.
IndexSteady-State ProbabilitySteady-State Probability Variance
SchemeABC B − AC − A
199.8971%99.8831%99.9112% −0.0140%0.0141%
299.8620%99.7955%99.8806% −0.0665%0.0186%
399.8993%99.8567%99.9153% −0.0426%0.0160%
499.9282%99.8963%99.9389% −0.0319%0.0107%
Table 16. Basic reliability of different architectures.
ArchitectureFailure Rate Equation of PACS ArchitectureFailure Rate λ (10−6/h)MTBF (h)
16 λ i + 2 λ s + 6 λ p 128.663267772
23 λ i + λ c + λ s + 4 λ p 88.3289911,321
3 λ c + λ s + 4 λ p 53.5542518,673
42 λ c + 2 λ s + 6 λ p 89.7758811,139
Table 17. Reliability value pair of the 4 PACS architectures.
ArchitectureSteady-State Probability of Working NormallyMTBF (h)Device Counts
199.8971%777214
299.8620%11,3219
399.8993%18,6736
499.9282%11,13910
Table 18. Normalized reliability value pair of the 4 PACS architectures.
ArchitectureNormalized Steady-State Probability of Working NormallyNormalized MTBF
10.0604−1.0000
2−1.0000−0.3489
30.12691.0000
41.0000−0.3823
Table 19. The normalized reliability value pair of 4 PACS architectures (IEDs with or without LCD).
ArchitectureNormalized Steady-State Probability of Working NormallyNormalized MTBF
1−0.1057−1.0000
2−1.0000−0.4945
3−0.04970.5527
40.6866−0.5204
1-10.8369−0.3785
2-10.25350.3706
3-10.42171.0000
4-11.0000−0.1914
Disclaimer/Publisher’s Note: The statements, opinions and data contained in all publications are solely those of the individual author(s) and contributor(s) and not of MDPI and/or the editor(s). MDPI and/or the editor(s) disclaim responsibility for any injury to people or property resulting from any ideas, methods, instructions or products referred to in the content.

