Next Article in Journal
Three-Dimensional Spatial Microscopic Characteristics and Developmental Influencing Factors of Tight Gas Layers in Hangjinqi Prospect Area, Ordos Basin, China
Previous Article in Journal
Towards a Bioeconomy: Supplying Forest Residues for the Australian Market
Previous Article in Special Issue
A Novel Method for Diagnosing Power Electronics Devices Using Elastic Wave Emission
 
 
Correction published on 5 September 2024, see Energies 2024, 17(17), 4454.
Article

Emergency Prevention Control as a Means of Power Quality Improvement in a Shipboard Hybrid Electric Power System

by
Sergii Tierielnyk
* and
Valery Lukovtsev
Educational and Scientific Institute of Automation and Electrical Mechanics, National University “Odessa Maritime Academy”, 65029 Odesa, Ukraine
*
Author to whom correspondence should be addressed.
Deceased author.
Energies 2024, 17(2), 398; https://doi.org/10.3390/en17020398
Submission received: 29 November 2023 / Revised: 2 January 2024 / Accepted: 6 January 2024 / Published: 13 January 2024 / Corrected: 5 September 2024

Abstract

:
The problems associated with the greenhouse effect have increased the desire to limit carbon dioxide (CO2) emissions into the atmosphere, including emissions produced by shipboard electrical power systems. This has led to a further search for solutions in this area, such as shipboard hybrid electric power systems (SHEPSs). These systems do not yet have a wide application compared with traditional shipboard electrical power systems for several reasons, including the lack of studies establishing the fault tolerance of such systems. Therefore, in this work, problems related to generated power quality deterioration under large disturbances are studied. To achieve the fault-free operation of SHEPS, an emergency prevention control (EPC) system based on controlled parameter forecasting, along with a system structure and operation algorithm, is developed. The goals of improving electrical power quality are achieved by increasing the control efficiency of the power system’s generating sources. To validate the feasibility of the proposed control system, a computer simulation was carried out after developing a mathematical model of the SHEPS under study. The results of the study show that the use of the proposed EPC system will improve power quality when the controlled parameters are within acceptable limits. At the same time, further research is needed, as the problem of false control action as a consequence of EPC system hardware or software faults remains unstudied.

1. Introduction

Increasing environmental requirements for electricity production standards [1] define the current stage of shipping development and the evolution of shipboard electrical power systems. This has led to the creation and application growth of SHEPSs, changing the principles of power distribution with a transition from traditional vertical system configurations to a distributed system approach with respect to electrical power resources. In addition, increased survivability is achieved because of the flexibility of power distribution for both shipboard consumers and generating sources.
The development of SHEPSs is driving interest in energy storage systems (ESSs) [2], which have become a key component along with traditional power sources, such as diesel generators (DGs). Furthermore, an ESS can optimize power production depending on load changes, optimizing DG fuel consumption. ESSs can be distinguished based on electrochemical, mechanical, electromagnetic, and thermal accumulators. The advantages and disadvantages of each type can be found in [3,4,5]. In this paper, an electrochemical system based on rechargeable batteries is considered. Additionally, the ESS relies on electrical converters to charge the batteries when a power reserve at the main switchboard (MSB) is available; the ESS can then be used as a source during a power shortage.
Because DGs have larger time constants than ESSs [6], which are based on high-performance modulation controllers (MC) and power semiconductors [7,8], the use of traditional DGs and ESSs in shipboard electrical power systems leads to the need for a control system capable of achieving the reliable operation of SHEPS power sources in both normal and emergency modes.
To date, several papers have been devoted to research into electrical power systems in general, as well as to the study of the fault-free operation of shipboard power sources within the framework of a unified hybrid electrical power system. For example, the authors of [9] present a new control method to balance ship load demands and power generation from renewable energy systems, based on an accurate model and solutions in real conditions. The energy management system was designed and implemented in a finite state machine structure using the logical design of state transitions. The results showed that a reduction in consumption of fossil fuels is feasible, and, if this is combined with renewable energy sources, it reduces CO2 emissions. The authors of [10] proposed an adaptive equivalent consumption minimization strategy, which was simulated and compared to the state-based and fuzzy logic energy management systems under the simulation of the real operating conditions of the ship. The paper [11] describes different marine applications of battery energy storage systems in relation to peak shaving, load leveling, spinning reserve, and load response. The researchers of [12] describe a high-fidelity benchmark for hybrid electric vessels, combining diesel generators and batteries. The benchmark consists of detailed models, the parameters of which are provided so that the models can be reproduced. The authors of [13] considered a comparison of a virtualized synchronous generator (SG) and droop control characteristics during the use of inverter-based distributed generators. Similarly, researchers in [14,15,16] studied the possibility of virtualizing converter operation algorithms to achieve synchronization with a synchronous generator. The above-mentioned virtualization method was adopted in this paper for the invertor-based ESS, with the aim of carrying out a simulation of DG and ESS in parallel operation.
Electrical power quality requirements are set by international standards [17] and a set of marine classification society [18] standards and requirements for electrical equipment. Various control systems, such as automatic voltage regulators (AVRs) and engine speed governors (ESGs), have been designed with the aim of generating the required power quality. These systems have a control effect on power sources through the executive elements of these systems, for example, by increasing or decreasing the diesel engine (DE) fuel supply or regulating the generator excitation based on the feedback values of the controlled parameter. However, these devices and systems cannot reliably perform their assigned functions under conditions of large disturbances [19]. In addition, the control of parameters characterizing the power quality, such as voltage and frequency, is carried out through shipboard protective automatic systems. These systems use shutdown and tripping functions to prevent the operation of electrical power system components if the controlled parameters are not within acceptable limits. Furthermore, interruption of the power supply to ship consumers can also occur, causing a possible emergency state of one scale or another.
Therefore, a control system is needed that can provide fast-acting control of SHEPS components to improve the electrical power quality. To achieve this goal, we propose a novel software- and hardware-integrated EPC system designed to perform the functions of monitoring and proactive control based on the forecasting of controlled parameters. While the basic principles involved in developing EPC systems were discussed in [20], this paper studies a particular case of DG and ESS operation as part of a SHEPS under large disturbances that occur during the direct start of the induction motor (IM). The voltage and frequency of power sources as evaluation parameters, among other parameters characterizing the electrical power quality, form the basis of this investigation.
This study was conducted in several stages, which are described in the paper in individual sections. Section 2 describes the materials and methods, where, besides the problem statement, the development of the EPC system, including system structure and operation algorithm, is discussed along with the development of the SHEPS mathematical model used for further simulation. Section 3 presents and analyzes the results of the simulations. In Section 4, the EPC system implementation features as well as the limitations which might have had a significant impact on the results are discussed. Finally, Section 5 concludes the paper.

2. Materials and Methods

The SHEPS’s EPC system, based on the forecasting of controlled parameters, is the subject of the study. Here, the computer modeling method was employed, which is a typical approach used in the study of complex system processes [21].

2.1. Problem Statement

A part of a vessel’s SHEPS was taken as the initial system under study. This was one of the sections of the main switchboard operated in split bus mode of the DP3 dive support vessel. The single-line diagram of the system under study, presented in Figure 1, includes the following: a synchronous diesel generator, DG1, consisting of a drive diesel engine, DE1, and synchronous generator, SG1; a synchronous diesel generator, DG2, consisting of a drive diesel engine, DE2, and synchronous generator, SG2; an energy storage system, ESS, which consists of the battery pack, B, and converter, C; the thrusters’ variable frequency drives, VFD1 and VFD2; the thrusters’ induction motors, IM1 and IM2; the power supply system for the hydraulic pump drive motor of the electro-hydraulic crane, with a lifting capacity of 400 tons, which consist of local distribution board, DB, and induction motor, IM3; and circuit breakers CB1, CB2, CB3, CB4, CB5, CB6, CB7, and CB8.
The vessel operation mode is assumed as follows:
  • The vessel is considered as being operated offshore with calm seas where the thruster load does not exceed 5% and does not have a significant effect on the total consumption load and, thus, is not considered further.
  • Synchronous diesel generator DG2 is assumed to be offline as a standby power source and is therefore also not considered.
Based on the above-mentioned assumptions, the single-line diagram of the system under study is presented in Figure 2.
The single-line diagram of the system under study, presented in Figure 2, includes the following: synchronous diesel generator, DG, which consists of drive diesel engine DE and synchronous generator SG; main switchboard MSB; local distribution board DB; circuit breakers CB1, CB2, CB3, CB4, and CB5; induction motor IM; energy storage system ESS, which consists of the battery pack, B; and converter C.
The basic parameters of the system’s key elements are presented in Table 1, where P s g n o m , P i m n o m , and P e s s n o m are the SG’s, IM’s, and ESS’s nominal active power values, respectively; U s g n o m , U i m n o m , and U e s s n o m are the SG’s, IM’s, and ESS’s nominal voltage values, respectively; and E n o m is the ESS battery pack’s nominal capacity value.
During the direct start of the IM (Figure 1), an inrush current creates a braking torque for the DG and ESS, leading to a deterioration in the power quality, with deviations in frequency and voltage from nominal values. Thus, the developed SHEPS EPC system must realize an improvement in power quality.
Currently, various protection devices [22,23] are widely used to determine the degree of power quality, allowing operation if the controlled parameters (voltage and frequency) of the parallel-operating power sources are within acceptable limits. Depending on the levels of deviation of the controlled parameters, these devices form control signals to disconnect the power source from the MSB, resynchronizing it or unloading the power sources by tripping non-essential consumers. In these cases, the uninterrupted power supply to the power consumers is not guaranteed, leading to partial or complete blackout, a major disadvantage of such systems.
Practically, consumer start block methods are widely used if the available reserve power at the MSB is below a certain threshold. However, additional costs are associated with the installation of additional power sources at the design stage of the SHEPS. Moreover, starting reserve power sources will lead to an increase in emissions, which, along with the cost of the fuel, will decrease the equipment’s lifetime.
To solve this problem, the development of a SHEPS EPC system that can increase the control and management efficiency of the power system is proposed. The efficiency increase is introduced through the formation of a proactive EPC signal and is implemented via secondary control channels for the SHEPS power sources.

2.2. Development of SHEPS EPC System

The DG and ESS have different physical features, which are based on different principles of power generation. Despite this, the SHEPS’s components, as technical objects, are controlled via mode parameters, and the transient processes in this case can be controlled through a set of parameters that change according to certain laws. Therefore, the information characteristics of the ongoing processes can be presented in the form of a vector, x   i j = ( x i j   1 ,   x i j   2 ,   ,   x i j   n ) , which uniquely represents a technical object’s mode, j, at fixed times, i. After normalizing the input data [24], the vector of normalized parameters, x i j   N = ( x i j   1   N ,   x i j   2   N ,   ,   x i j   N   n ) , describes a certain trajectory that allows us to study the behavior of the object and to determine the state and mode of operation.
The proposed EPC system is based on a central processing unit (CPU) that forms the vectors of proactive control for SHEPS power sources via secondary control channels based on the forecasted values of the controlled parameters. The implementation of forecasting is proposed based on using the first and second derivatives of the controlled parameters [20], which describe controlled transient processes. In this case, the first and second derivatives are the speed and acceleration of the controlled parameter change, respectively, as shown by Equation (1).
λ i j   n = f ( d x i j   N   n d t , d 2 x i j   N   n d t 2 )
In Equation (1), λ i j   n is the output function of the controlled parameter forecasted values; x i j   N   n are the normalized parameter values. Consequently, the vector of the forecasted values of the controlled parameters can be represented as λ i j = ( λ i j   1 ,   λ i j   2 ,   ,   λ i j   n ) .
However, while using derivative links in control laws, a problem occurs, which is associated with the loss of an output signal (equal to zero) when a controlled parameter becomes a constant value [20]. Therefore, the control law based on the first and second derivatives is supplemented with a third component that characterizes traditional control algorithms. This component is based on the normalized measured values of the controlled parameters. Thus, the control signal is based on the generalized parameter, σ i j , which is formed as a sum of the normalized controlled parameter, x i j   N   n , and its first, d x i j   N   n d t ,  and second, d 2 x i j   N   n d t 2 ,  derivatives, as per Equation (2).
σ i j   n = K 2 d 2 x i j   N   n d t 2 + K 1 d x i j   N   n d t + K 0 x i j   N   n
In Equation (3), K 0 , K 1 , and K 2 are the proportionality coefficients.
Considering Equations (1) and (2), the control law can be expressed by Equation (3).
y i j   n = f d 2 x i j   N   n d t 2 , d x i j   N   n d t , x i j   N   n = f σ i j   n
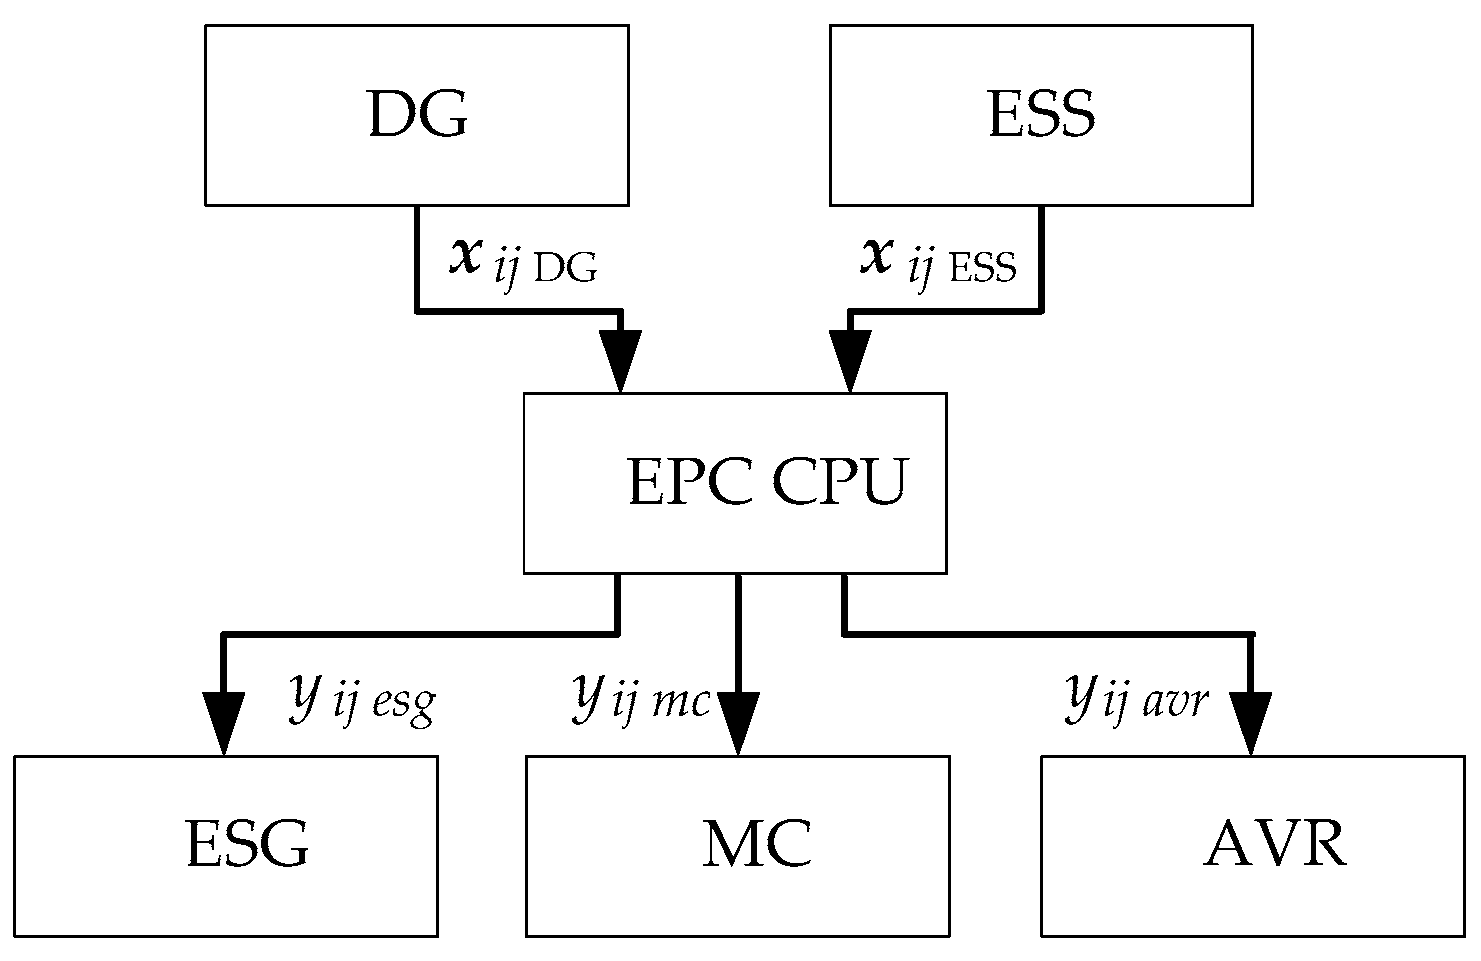
Thus, the EPC control vectors take the form y i j = ( y i j 1 , y i j 2 , , y i j n ) .
The calculation and formation of the EPC vector can be represented as a block diagram, as shown in Figure 3.
Because the derivative of a constant is zero, the secondary control channel does not significantly impact the control of DG and ESS in the SHEPS’ normal operating mode when the speed and acceleration of the changes in the controlled parameters are within acceptable limits. In other words, since the formed EPC vectors are based on mathematical models and physical properties of the DG’s and ESS’s local control systems, in normal mode, the EPC system duplicates traditional control algorithms. Thus, by assessing the speed and acceleration of changes in the controlled parameters, we can forecast and anticipate emergency state and fault conditions.
Figure 4 shows the block diagram of the EPC system at any time, i, of mode j for the SHEPS under study, where x i j   D G = ( ω i j D G , U i j D G ) and x i j   E S S = ( ω i j E S S , U i j E S S ) are the EPC system input vectors, defining the controlled parameters of DG and ESS, respectively.
By monitoring the parameters of the SHEPS’s elements (Figure 4), the EPC system can determine the speed and acceleration of controlled parameter changes. This allows us to determine the pre-fault mode and subsequent deviations in the power system voltage and frequency and, using the secondary control channels, provide proactive actions via the local control actuators of the power sources, such as increasing/decreasing the DE fuel supply, regulating the field excitation of the SG, and changing the modulation coefficients in the control circuits of the ESS inverter. Thus, using the controlled parameter vectors of the SHEPS’s elements, the EPC system is designed to monitor and improve the power quality by calculating and forming the EPC control signals (Figure 3) as follows:
  • The ESG’s control signal, y i j   e s g .
  • The control signal for the ESS’s MC, y i j   m c .
  • The AVR’s control signal, y i j   a v r .
These control signals form the EPC vector y i j = ( y i j   e s g ,   y i j   m c ,   y i j   a v r ) and provide proactive control for the local actuators of the power sources via secondary control channels, allowing us to improve the power quality of the SHEPS. Based on the above, increasing the control efficiency becomes possible by implementing controlled parameter forecasting in the control laws.

2.3. SHEPS EPC Algorithm

The SHEPS is characterized by multi-component, multi-mode, and multi-functional elements. General tasks and a common goal of the SHEPS operation help to form a generalized control algorithm, the peculiarity of which is the following set of subtasks, which should be solved by the automatic (automated) control system:
  • Collection of SHEPS information;
  • Processing of collected information according to specified and newly formed algorithms, determined by the state of the SHEPS and the EPC system;
  • Forming of monitoring and control signals.
The specification of individual tasks allows us to consider the general operating algorithm as a set of particular algorithms executed in a certain time sequence and a prioritized functional relationship, implementing the common information processing task in the required direction with the preset accuracy and discreteness for control signal formation.
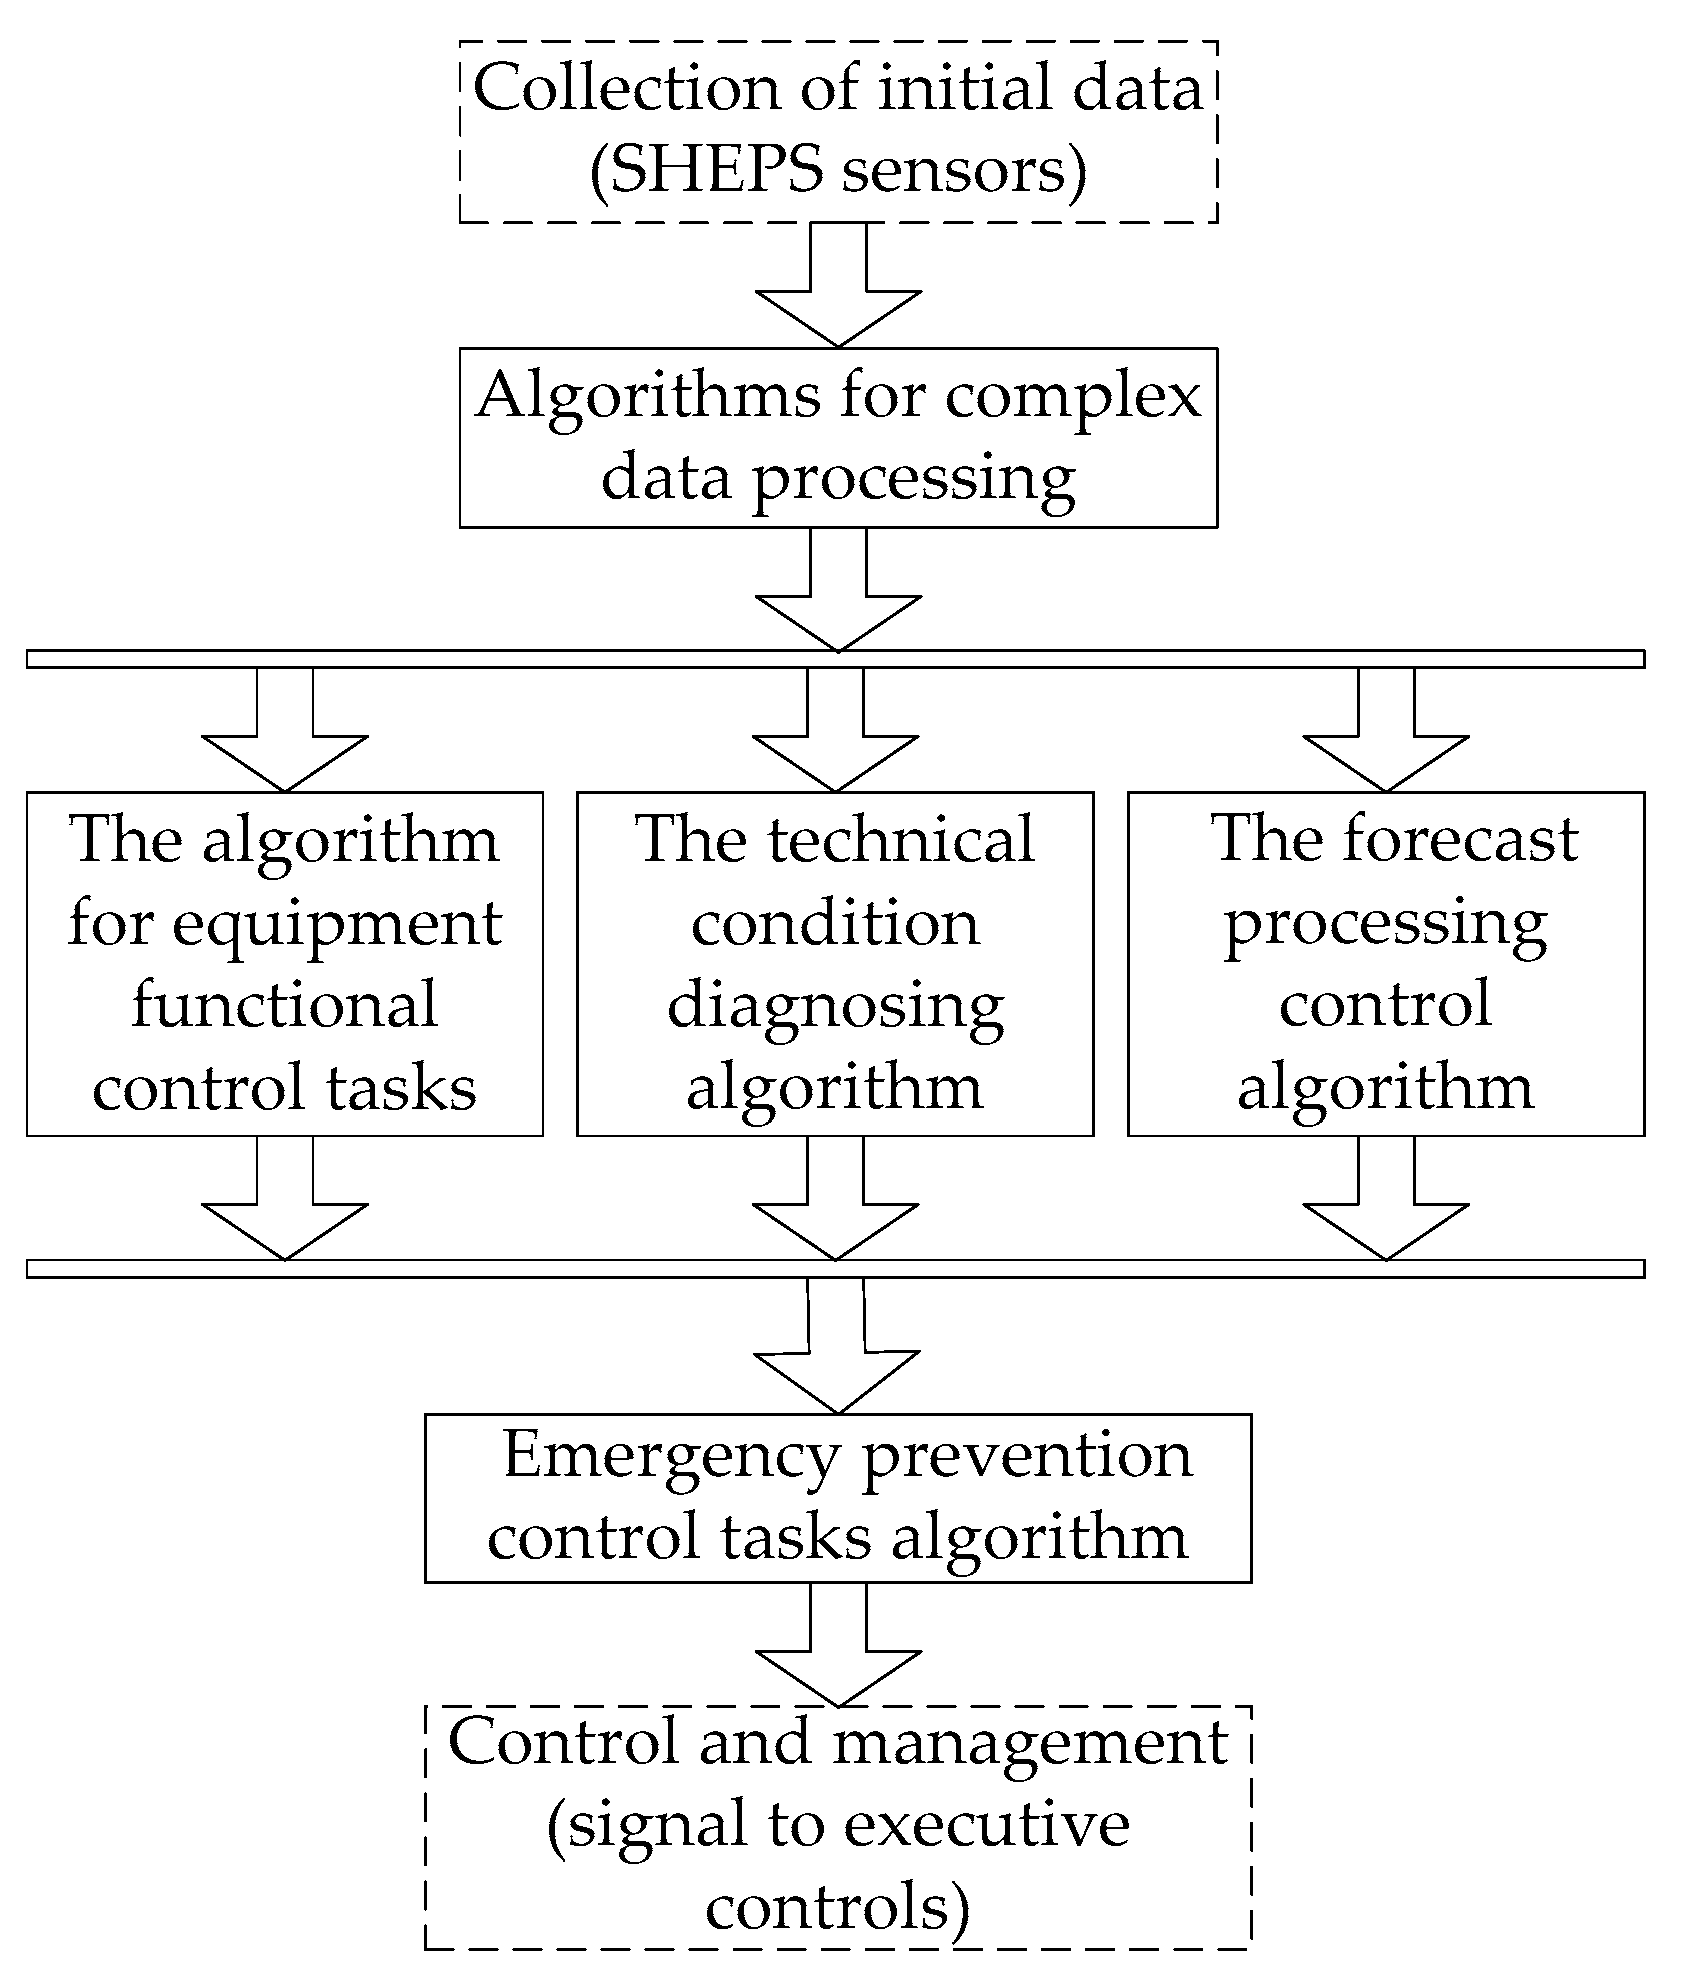
The generalized algorithm (Figure 5) can be represented by a flow diagram, which includes the following sub-algorithms:
  • Algorithms for complex processing of input data. The optimization of input data processing is based on eliminating their redundancy to increase the accuracy and reliability of the input parameter assessment. It is implemented as time- and function-dependent processing.
  • Algorithms for control tasks of the SHEPS (functional algorithms). This set of algorithms is for control tasks determined by the power system tasks, which reflect the composition of input data, control, and monitoring interfaces. These algorithms determine the main characteristics of the entire power system.
  • Algorithms for diagnosing the technical condition of the SHEPS, protecting the functional algorithms. These consist of test algorithms and performance monitoring and allow us to check the performance of equipment by testing under known conditions and to determine the location of faults.
  • A forecast processing and management control algorithm based on the forecast results. This algorithm provides preparatory measures, for example, by turning off potentially faulty equipment in advance or turning on redundancy power sources. Based on the analysis of the possible fault scenarios or changes in the nature of the processes ongoing in the SHEPS operation, the algorithm prevents emergency modes and conditions. In addition, it provides the formation of control actions on changes in the state of SHEPS elements and modes to prevent the transition of the entire power system to the pre-fault area of operation.
  • Algorithms for EPC tasks. These allow us to detect and correct errors in the control algorithms and forecast and prevent fault states and emergency conditions.
Sub-algorithms 3–4 are parallelly processed for organizing the computational work of a given application such that multiple parts of the workload can be performed concurrently to reduce the time to a solution and increase performance.
Analysis of the algorithm flow diagram (Figure 4) identifies the necessary control actions to achieve reliable operation of the SHEPS. To enable automated control systems to solve the above tasks, they, in addition to subsystems for localizing the fault and restoring normal operation, must include algorithms that implement EPC based on the forecasting of the controlled parameters.

2.4. Mathematical Model of SHEPS under Study

For further study of the proposed solution’s feasibility, computer modeling was carried out. A mathematical model of the SHEPS under study, presented in Figure 1, was developed for this purpose.

2.4.1. Model of Diesel Engine and Engine Speed Governor

The IEEE general model for drive engines and speed governors presented in [25,26] was adopted as the basis for this study. The mechanical motion in proportional units is expressed by the nonlinear differential equation, Equation (4).
d ω D G d t = 1 τ d e T D   m T D   e ,   T D   m   m i n T D   m T D   m   m a x
In Equation (4), ω D G is the DG frequency; τ d e is the DG time constant; T D   m and T D   e are the mechanical torques of the DE and SG, respectively; and T D   m   m i n and T D   m   m a x are the maximum and minimum DE torque values, respectively. Differential equations describing the ESG can be represented by a system, as per Equation (5):
d T D   m d t = η e s g d η e s g d t = τ c τ s e 2 η e s g k c τ s e 2 T D   m k a c t τ s e 2 T D   m ε a c t 1 τ s e 2 ω D G d ε a c t d t = 1 τ e s g ( T D   m ε a c t )
where η e s g is the fuel rack position; k c and k a c t are the droop coefficients of the ESG controller and the ESG actuator, respectively; τ c , τ s e , and τ a c t are the time constants of the ESG controller, sensing element, and actuator, respectively; and ε a c t is the ESG actuator feedback signal.

2.4.2. Model of the Synchronous Generator and Automatic Voltage Regulator

For the mathematical description of the SG, Park’s equations are used in the d-q coordinate system with simplifying assumptions [27,28], i.e., transformer and rotational EMFs, as well as generator saturation, are not considered. Excitation and damping windings are considered on the d-axis to reflect the corresponding transient and sub-transient time constants. Taking these assumptions into account, an SG can be represented by the differential and algebraic Equations (6)–(17). Equation (6) denotes the excitation system’s winding flux linkage, ψ f .
d ψ f d t = 1 τ f   s g U f i f
In Equation (6), τ f   s g is the AVR time constant, and U f and i f are the excitation system voltage and current, respectively. The flux linkages of the damping winding along the d-axis, ψ D , take the form of Equation (7):
d ψ D d t = 1 τ D   s g i D
where τ D   s g is the time constant of damping winding along the d-axis; and i D is the current of damping winding along the d-axis. Equation (8) represents the flux linkages of the damping winding along the q-axis, ψ Q .
d ψ Q d t = 1 τ Q   s g i Q
In Equation (8), τ Q   s g is the time constant of damping winding along the q-axis, and i Q is the damping winding current along the q-axis. The generator voltage, U D G , can be represented by the following algebraic Equation (9):
U D G = U d 2 + U q 2
where U d and U q are the voltage components along the d- and q-axes, respectively. U d is represented by Equation (10):
U d = r s g i d + ψ q
where r s g is the active stator resistance, and ψ q is the stator windings flux linkage along the q-axis. The voltage component, U q , along the q-axis can be written using Equation (11):
U q = r s g i q + ψ d
where ψ d is the flux linkage of the stator windings along the d-axis, which can be written as Equation (12):
ψ d = i f x d   s g i d + i D
In Equation (12), x d   s g denotes the inductive resistance along the d-axis; i d is the stator current along the d-axis; and i D is the damping winding current along the d-axis. The stator windings flux linkage along the q-axis,   ψ q , takes the form of Equation (13):
ψ q = x q   s g i q + i Q
where i Q is the damping winding current along the q-axis; i q is the stator current along the q-axis; and x q   s g denotes the inductive resistance along the q-axis. The field excitation winding current, i f , can be described as per Equation (14).
i f = ψ f + µ d   s g x d   s g i d g 1   s g i D
In Equation (14), µ d   s g is the coefficient of the magnetic flux linkage between the phase windings and the excitation system windings along the d-axis, and g 1   s g is the magnetic flux linkage coefficient between the excitation and damping windings along the d-axis. The above-mentioned damping winding current along the d-axis, i D , is shown in Equation (15):
i D = ψ D + µ d   s g x d   s g i d g 2   s g i f
where µ d   s g is the coefficient of the magnetic flux linkage of the phase windings with damper winding along the d-axis, and g 2   s g are the magnetic flux linkage coefficients between the excitation and damping windings along the q-axis. The damping winding current along the q-axis, i Q , can be represented by Equation (16):
i Q = ψ Q µ q   s g x q   s g i q
In Equation (16), µ q   s g is the coefficient of the magnetic flux linkage of the phase windings with damper winding along the q-axis. The mechanical torque, T D   e , created by the SG is described by Equation (17):
T D   e = ψ d i q + ψ q i d
For the mathematical description of excitation systems, the general IEEE AVR models [29] are commonly used. The differential equations of the AVR model can be written both in matrix and analytical forms, but for practical purposes, the voltage control model can be described using fairly simple nonlinear equations. Thus, the excitation system voltage, U f , is represented by Equation (18):
U f = i f Δ E ,   0 U f U f   m a x
where i f is the excitation system current as defined in Equation (14); U f   m a x denotes the maximum excitation voltage limit; and Δ E f characterizes the AVR voltage correction value, which takes the form of Equation (19):
d Δ E f d t = K a v r τ a v r K k U r e f U D G Δ E f ,   Δ E f   m i n Δ E f Δ E f   m a x
In Equation (19), Δ E f   m i n and Δ E f   m a x are the minimum and maximum AVR voltage correction values, respectively; k a v r is the droop coefficient; K k is the voltage corrector gain coefficient; τ a v r is the AVR time constant; and U D G and U r e f are the DG’s output and reference voltages, respectively.

2.4.3. Model of Energy Storage System

A mathematical description of the ESS’s inverter in the d-q system [30,31] can be represented by the differential equations that follow. The output current along the d-axis, i d   L , is written as per Equation (20):
L d i d   L d t = r i n v i d   L + ω E S S L i q   L + U d c m d U d   C
where U d c is the DC bus voltage; m d is the modulation coefficient along the d-axis; U d   C is the inverter’s output voltage along the d-axis; r i n v is the inverter’s active resistance; and ω E S S is the output frequency of the inverter. Note that, by defining ω E S S = ω D G ( t τ i n v ) , the output frequency is the frequency from the DG model taking into consideration the inverter time constant, τ i n v . The output current along the q-axis, i q   L , is represented by Equation (21):
L d i q   L d t = r i n v i q   L ω E S S L i d   L + U d c m q U q   C
In Equation (21), U d   C is the inverter’s output voltage along the q-axis, and m q is the modulation coefficient along the q-axis. Equation (22) represents the inverter’s output voltage along the d-axis, U d   C .
C d U d   C d t = ω E S S C U q   C + i d   L i d   L o a d
where i d   L o a d is the load current along the d-axis. The inverter’s output voltage along the q-axis, U q   C , is shown in Equation (23).
C d U q   C d t = ω E S S C U d   C + i q   L i q   L o a d
In Equation (23),   i q   L o a d is the load current along the q-axis. The inverter current, i i n v , is determined as the root mean square value of the components along the d- and q-axes, as per Equation (24):
i i n v = i d   L 2 + i q   L 2
Similarly, the inverter voltage, U E S S , can be represented as per Equation (25):
U E S S = U d   C 2 + U q   C 2
The control strategy of the ESS is designed in two stages: (1) internal current control loops and (2) external voltage control loops [6,31].

2.4.4. Model of the Induction Motor

For the mathematical description of the IM, Park’s equations are used [28,32]. In the d-q system and proportional units, the model of the induction motor is described by differential and algebraic equations (Equations (26)–(36)), which follow below. The flux linkage of the stator winding along the d-axis, ψ d   i m , is represented by Equation (26):
d ψ d   i m d t = ω i m ( U d + ψ q   i m r i m i d   i m )
where U d is the voltage along the d-axis; ω i m is the frequency; r i m is the active resistance; i d   i m is the current along the d-axis; and ψ q   i m is the flux linkage of the stator winding along the q-axis, which can be written as Equation (27):
d ψ q   i m d t = ω i m ( U q + ψ d   i m r i m i q   i m )
In Equation (27), U q and i q   i m are the voltage and current along the q-axis, respectively. The flux linkage of the damper winding along the d-axis,   ψ D   i m , takes the form shown in Equation (28).
d ψ D   i m d t = ω i m s i m ψ Q   i m e D   i m
where s   i m is the IM’s slip; e D   i m is the EMF value along the d-axis; and ψ Q   i m is the flux linkage of the damper winding along the q-axis, which can be described by Equation (29).
d ψ Q   i m d t = ω i m s i m ψ D   i m + e Q   i m
In Equation (29), e Q   i m denotes the IM EMF value along the q-axis. The IM slip, s   i m , is described by Equation (30):
d s i m d t = 1 τ i m ψ q   i m i d   i m ψ d   i m i q   i m + T m
where τ i m is the IM time constant, and T m is the hydraulic pump mechanical torque. The IM current along the d-axis, i d   i m , is shown in Equation (31):
i d   i m = 1 x i m μ i m x i m ψ d   i m ψ D   i m
In Equation (31), x i m is the inductive resistance, and μ i m is the magnetic flux linkage coefficient. The IM current along the q-axis, i q   i m , is represented by Equation (32):
i q   i m = 1 x i m μ i m x i m ψ q   i m ψ Q   i m
The IM EMF along the d-axis, e D   i m , takes the form of Equation (33).
e D   i m = x i m x i m μ i m x i m ψ D   i m μ i m x i m x i m μ i m x i m ψ d   i m
Furthermore, the IM EMF along the q-axis, e Q   i m , takes the form of Equation (34).
e Q   i m = x i m x i m μ i m x i m ψ Q   i m μ i m x i m x i m μ i m x i m ψ q   i m
The hydraulic pump braking torque, T m , can be written as per Equation (34) below:
T m = K l m 0 + m n 1 s   i m 2
where K l is the load coefficient of IM, and m 0 and m n are the initial and nominal torque values of the driven hydraulic pump, respectively. Finally, the IM braking torque, T i m , takes the form of Equation (36):
T i m = ψ q   i m i d   i m ψ d   i m i q   i m

3. Computer Simulation Results

The computer simulation [21] was carried out based on the SHEPS model described above. The coefficients of the DE, ESG, SG, AVR, and IM were taken in accordance with the manufacturers’ technical datasheets [33]. The required coefficients of ESS were taken based on the Siemens Sivacon 8PT converter [34] parameters. The required coefficients of the system under study are shown in Table 2.
During the simulation, the developed model elements were set as follows: (a) the coefficients from Table 2 were substituted into the equations of the system under study; (b) the obtained equations were transformed in such a way that the variables on the left sides of the equations had unit values.
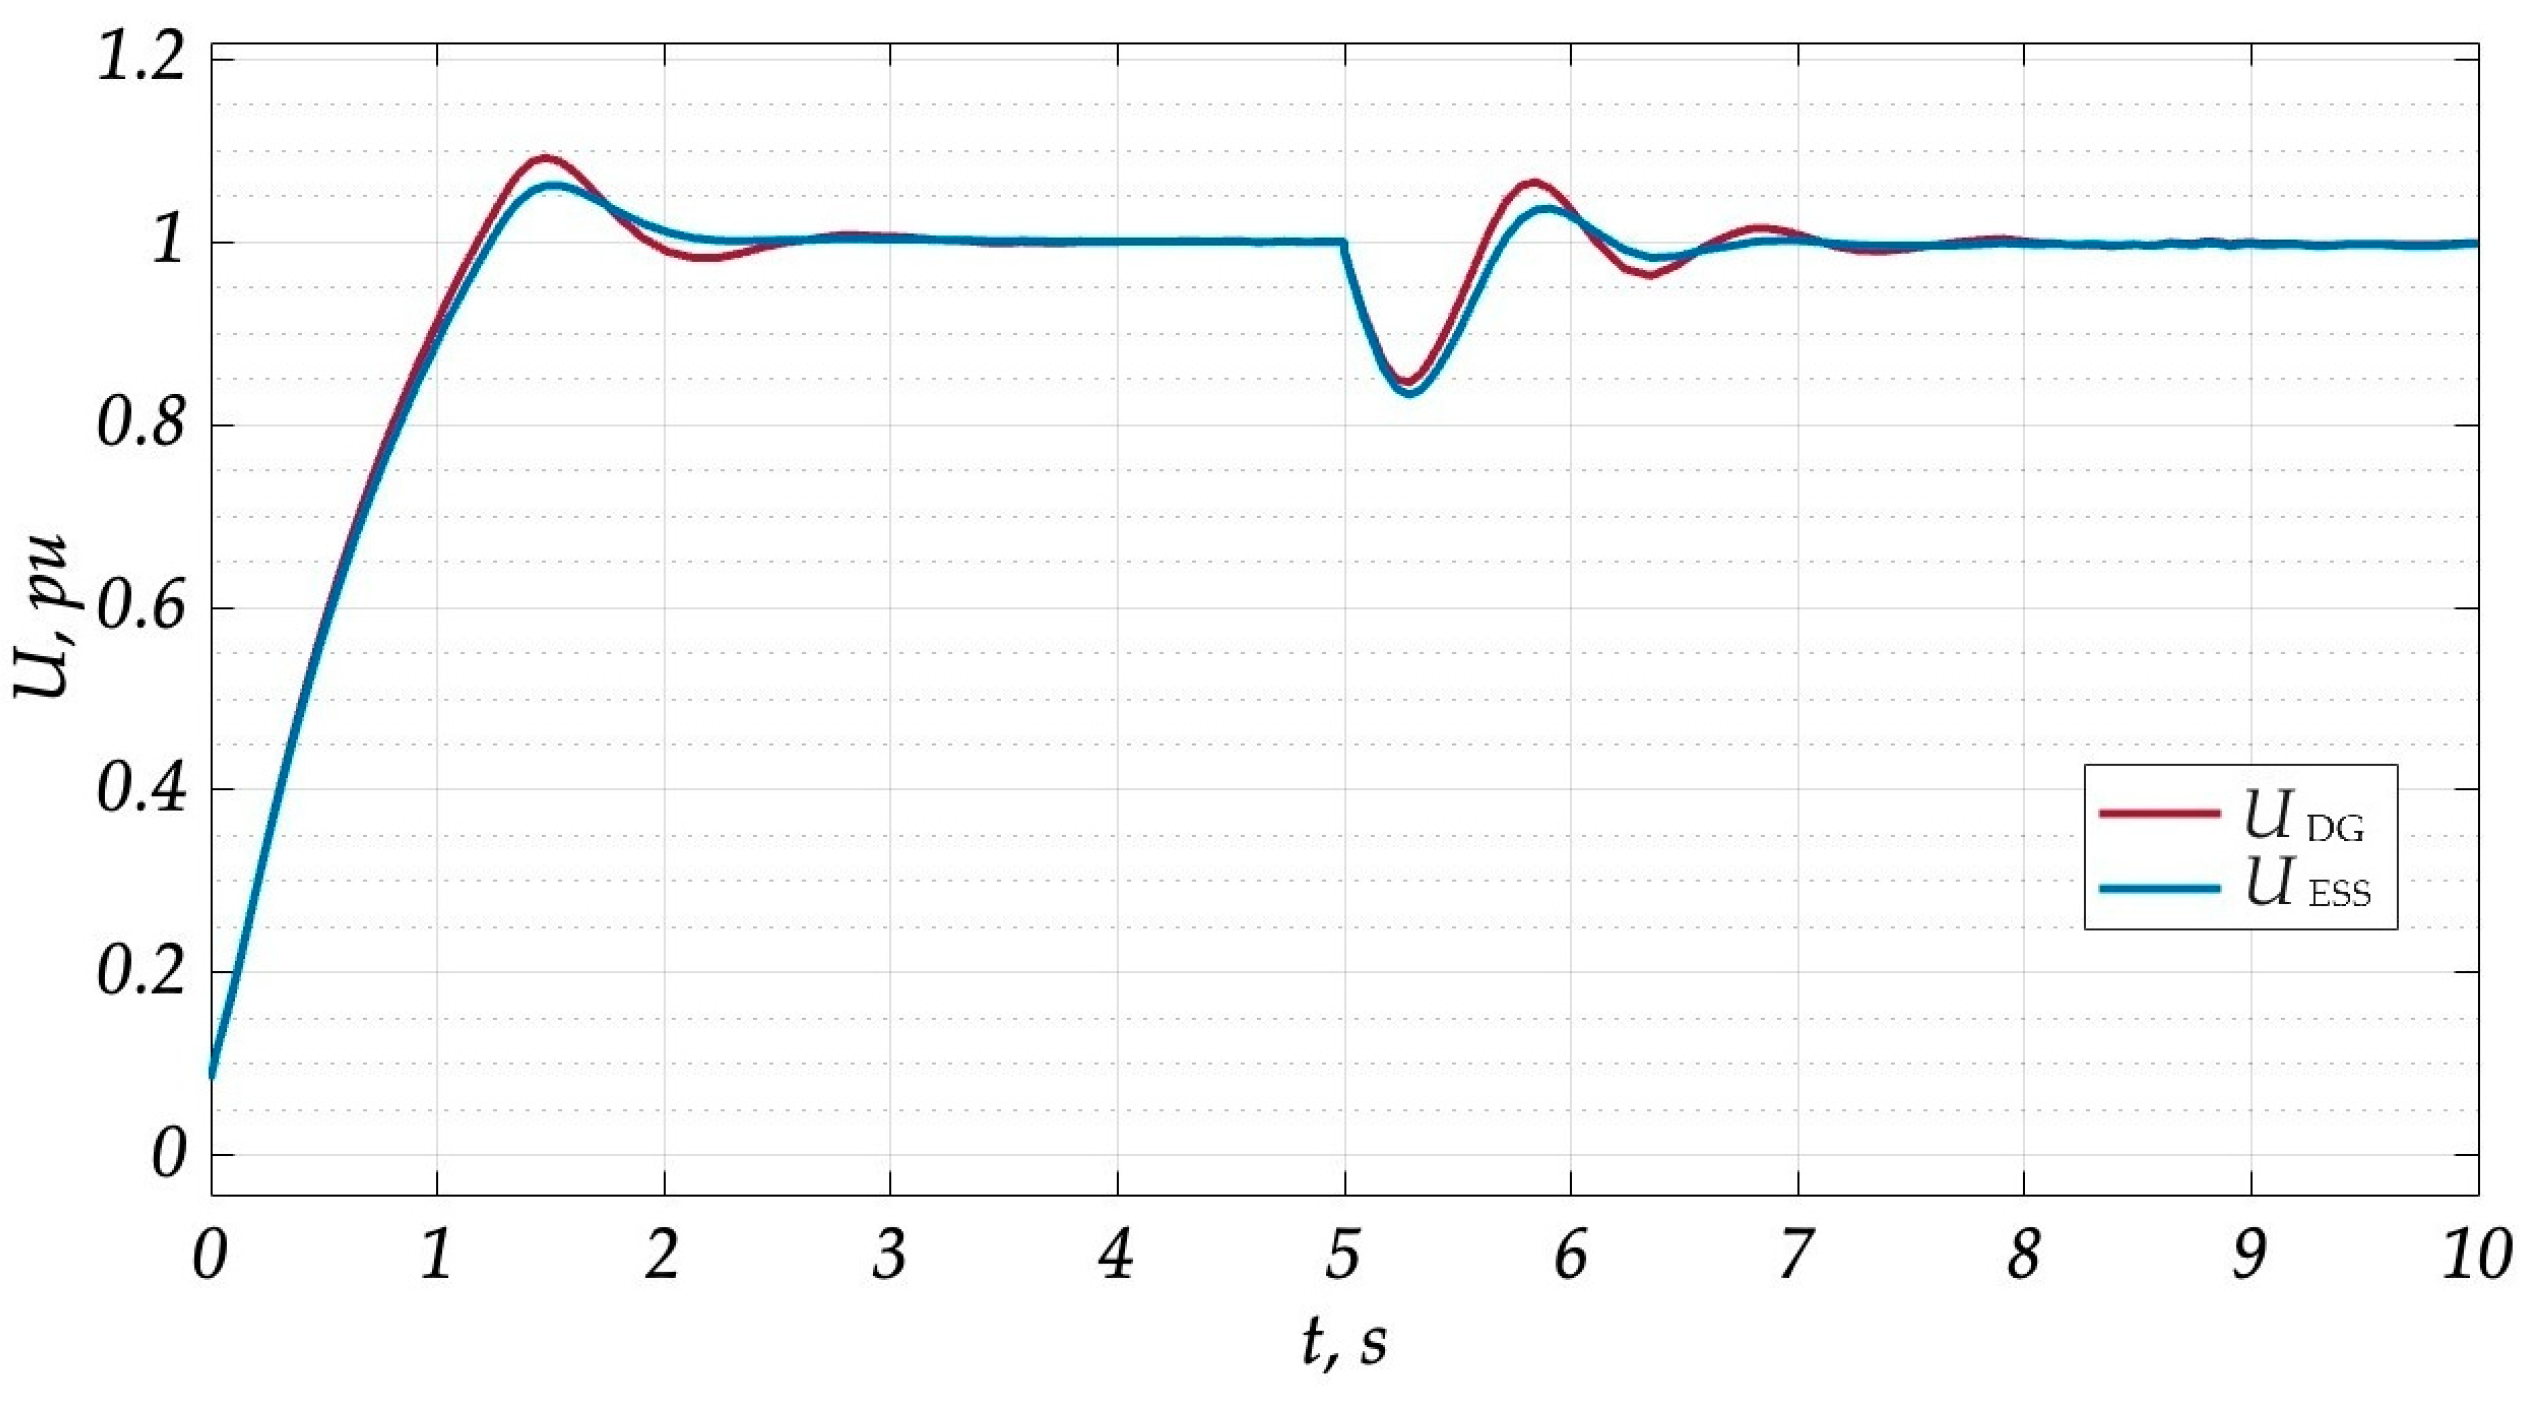
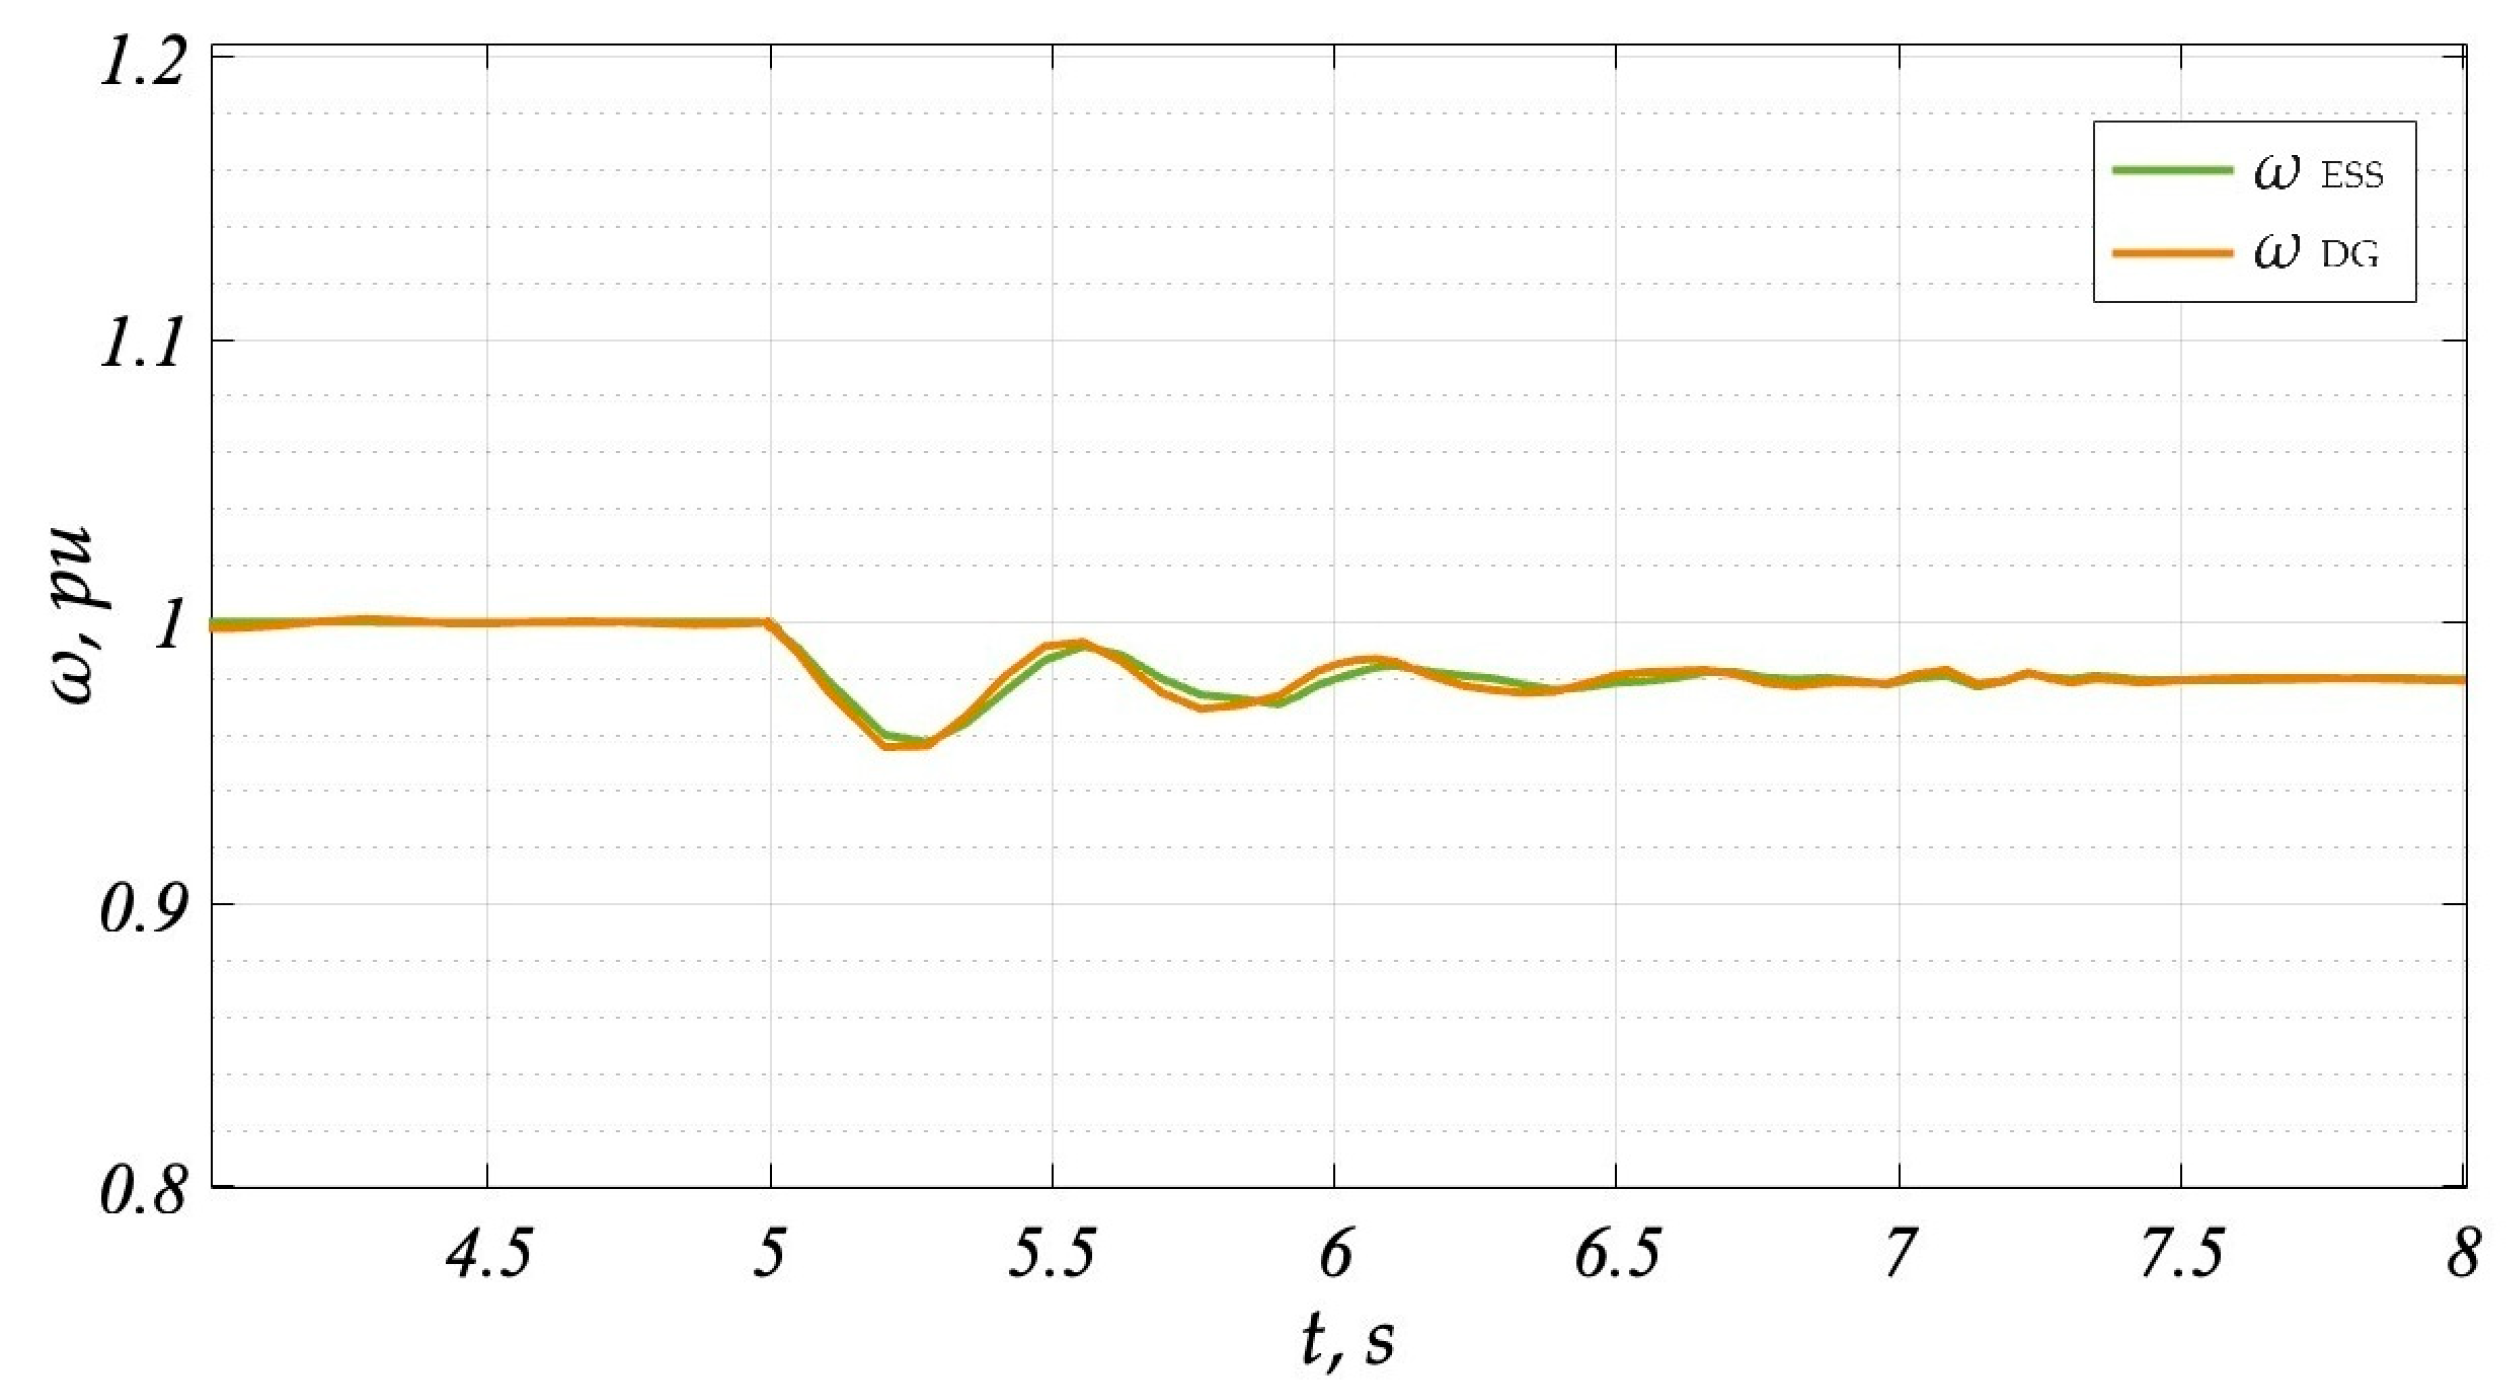
The simulation of the SHEPS model under study was carried out using the Simulink application of the MATLAB programming language. The simulation time was set to 10 s. The IM start was set to 5 s into the transient process simulation.
To check the feasibility of the proposed control system, the simulation was carried out with and without the use of the proposed EPC system.
The results of the transient process simulations are shown below. Figure 6 and Figure 7 illustrate the voltage and frequency fluctuations, respectively, of the power system under study caused by the IM direct start without using the proposed EPC system. Based on the simulation results, the voltage drop and frequency deviation are 18.3% and 5.1%, respectively. This will lead to the subsequent activation of undervoltage and underfrequency protection devices [18,35], followed by tripping in both SHEPS power sources and consumers.
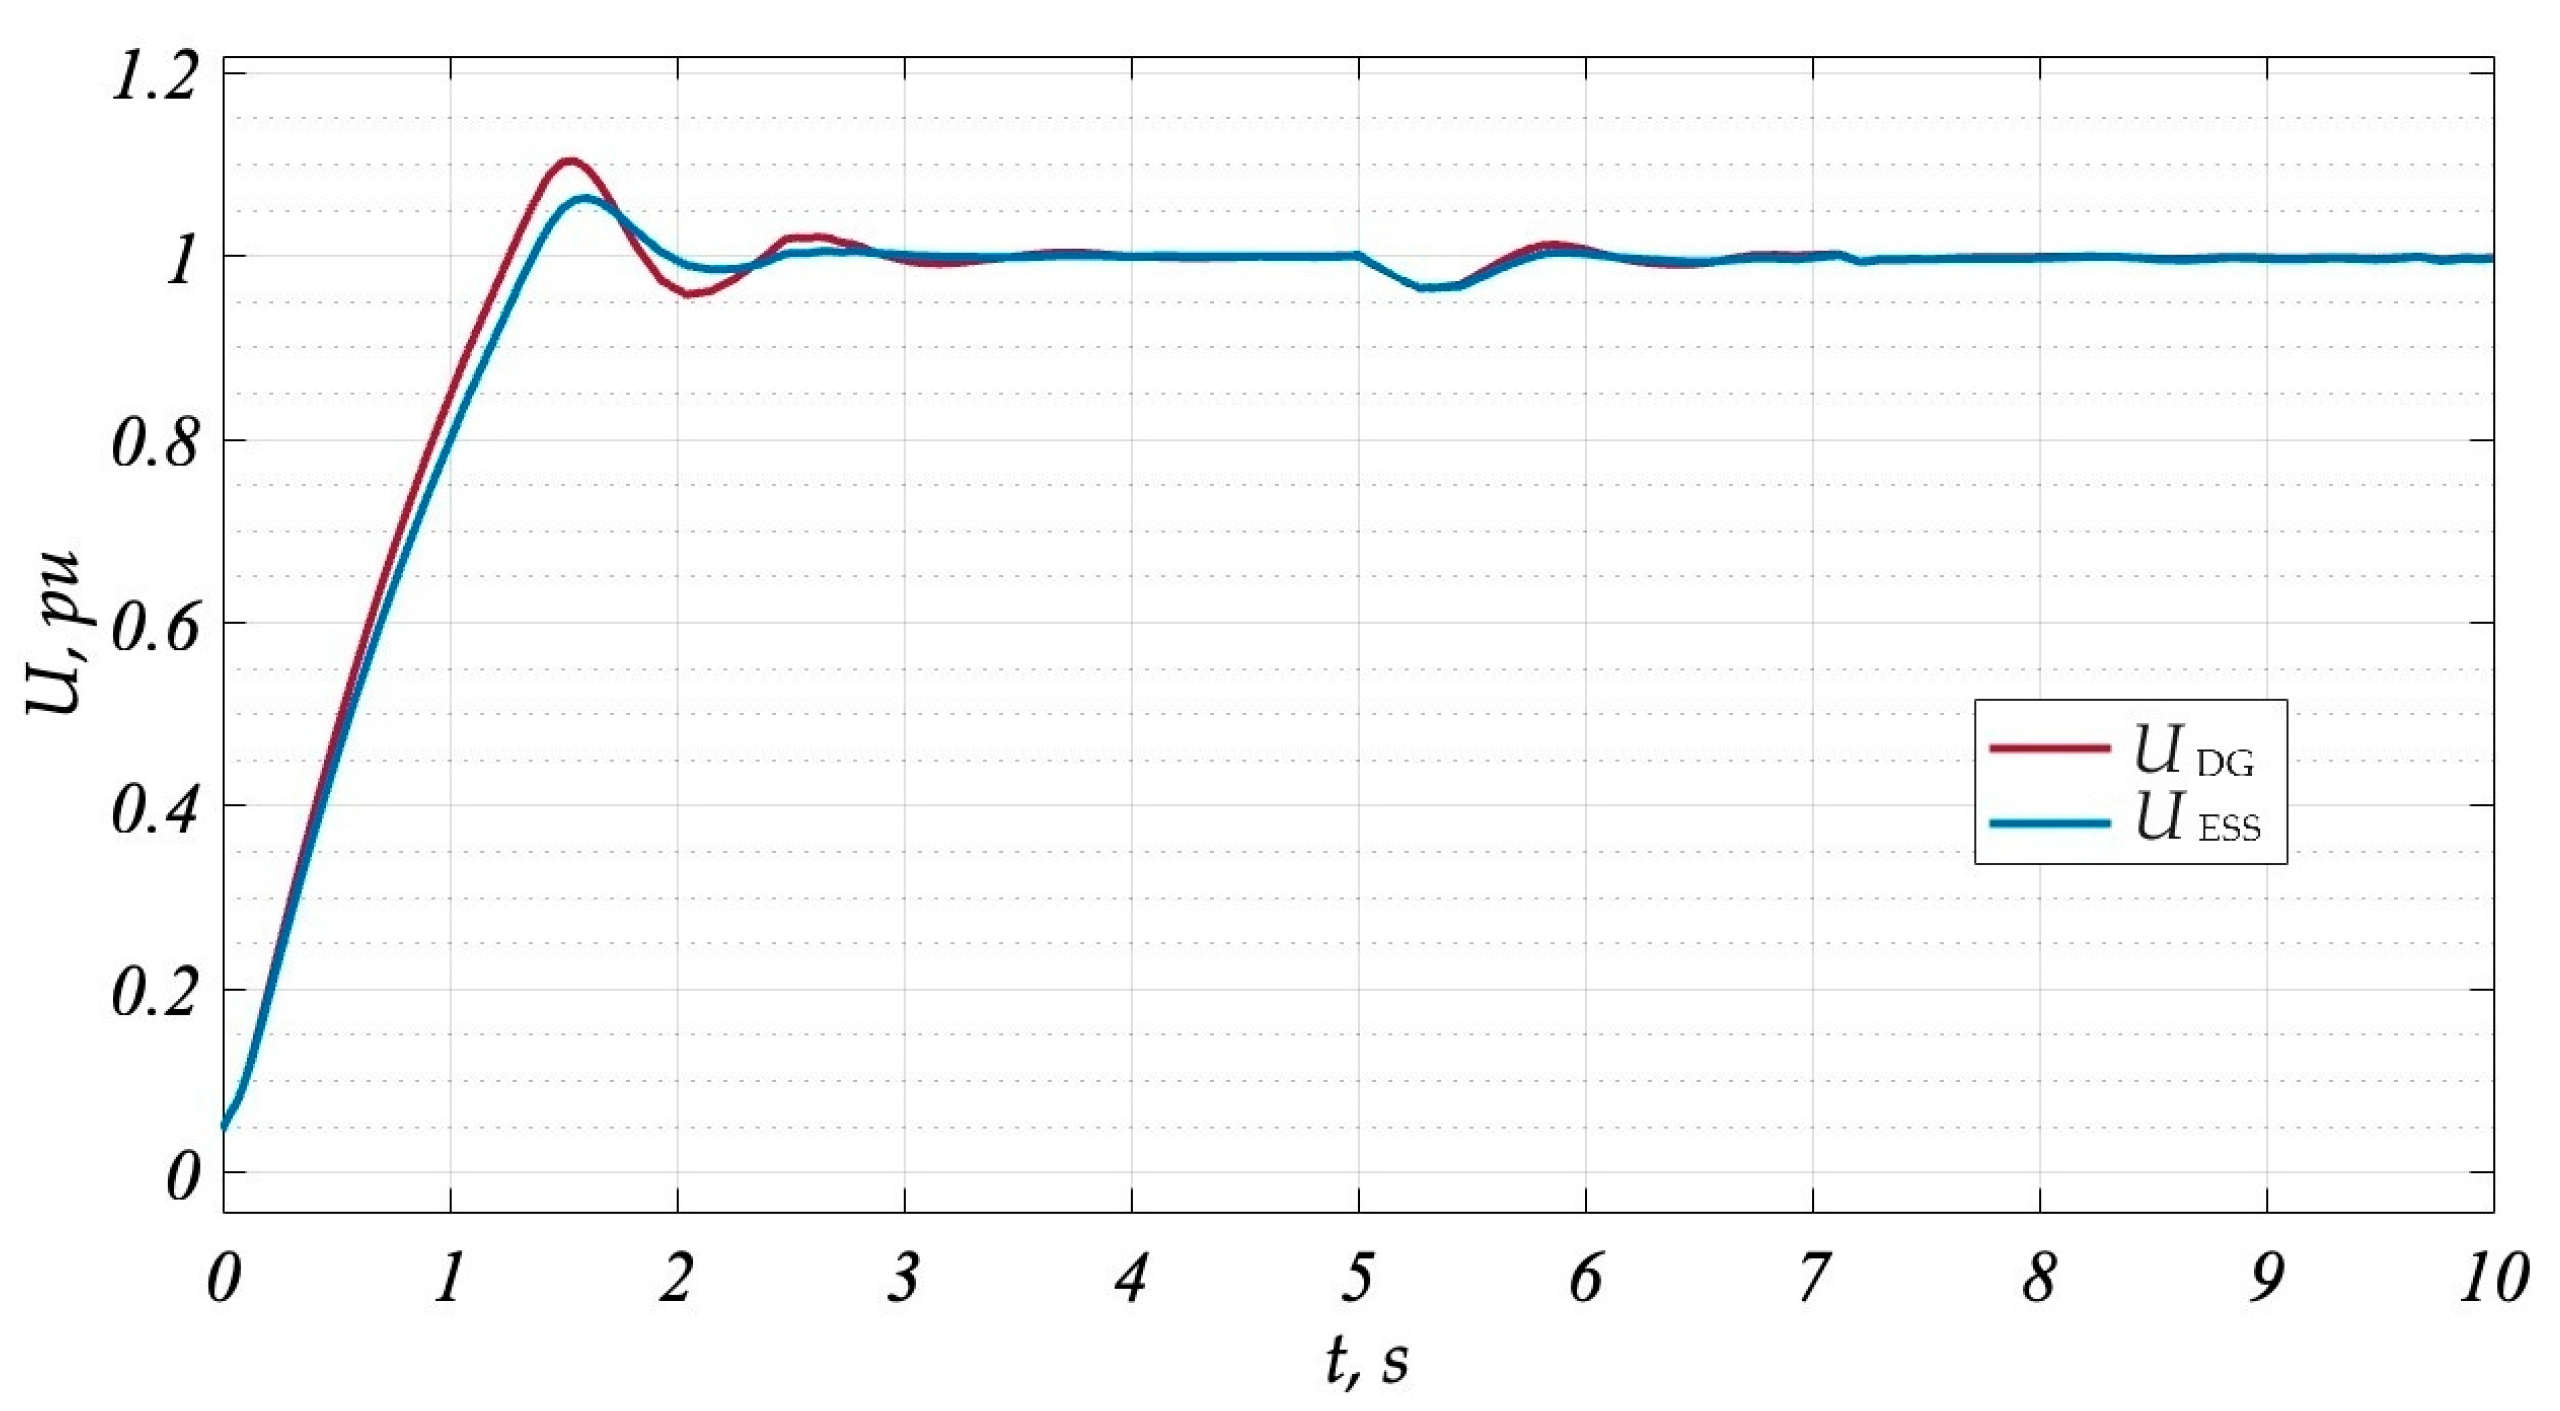
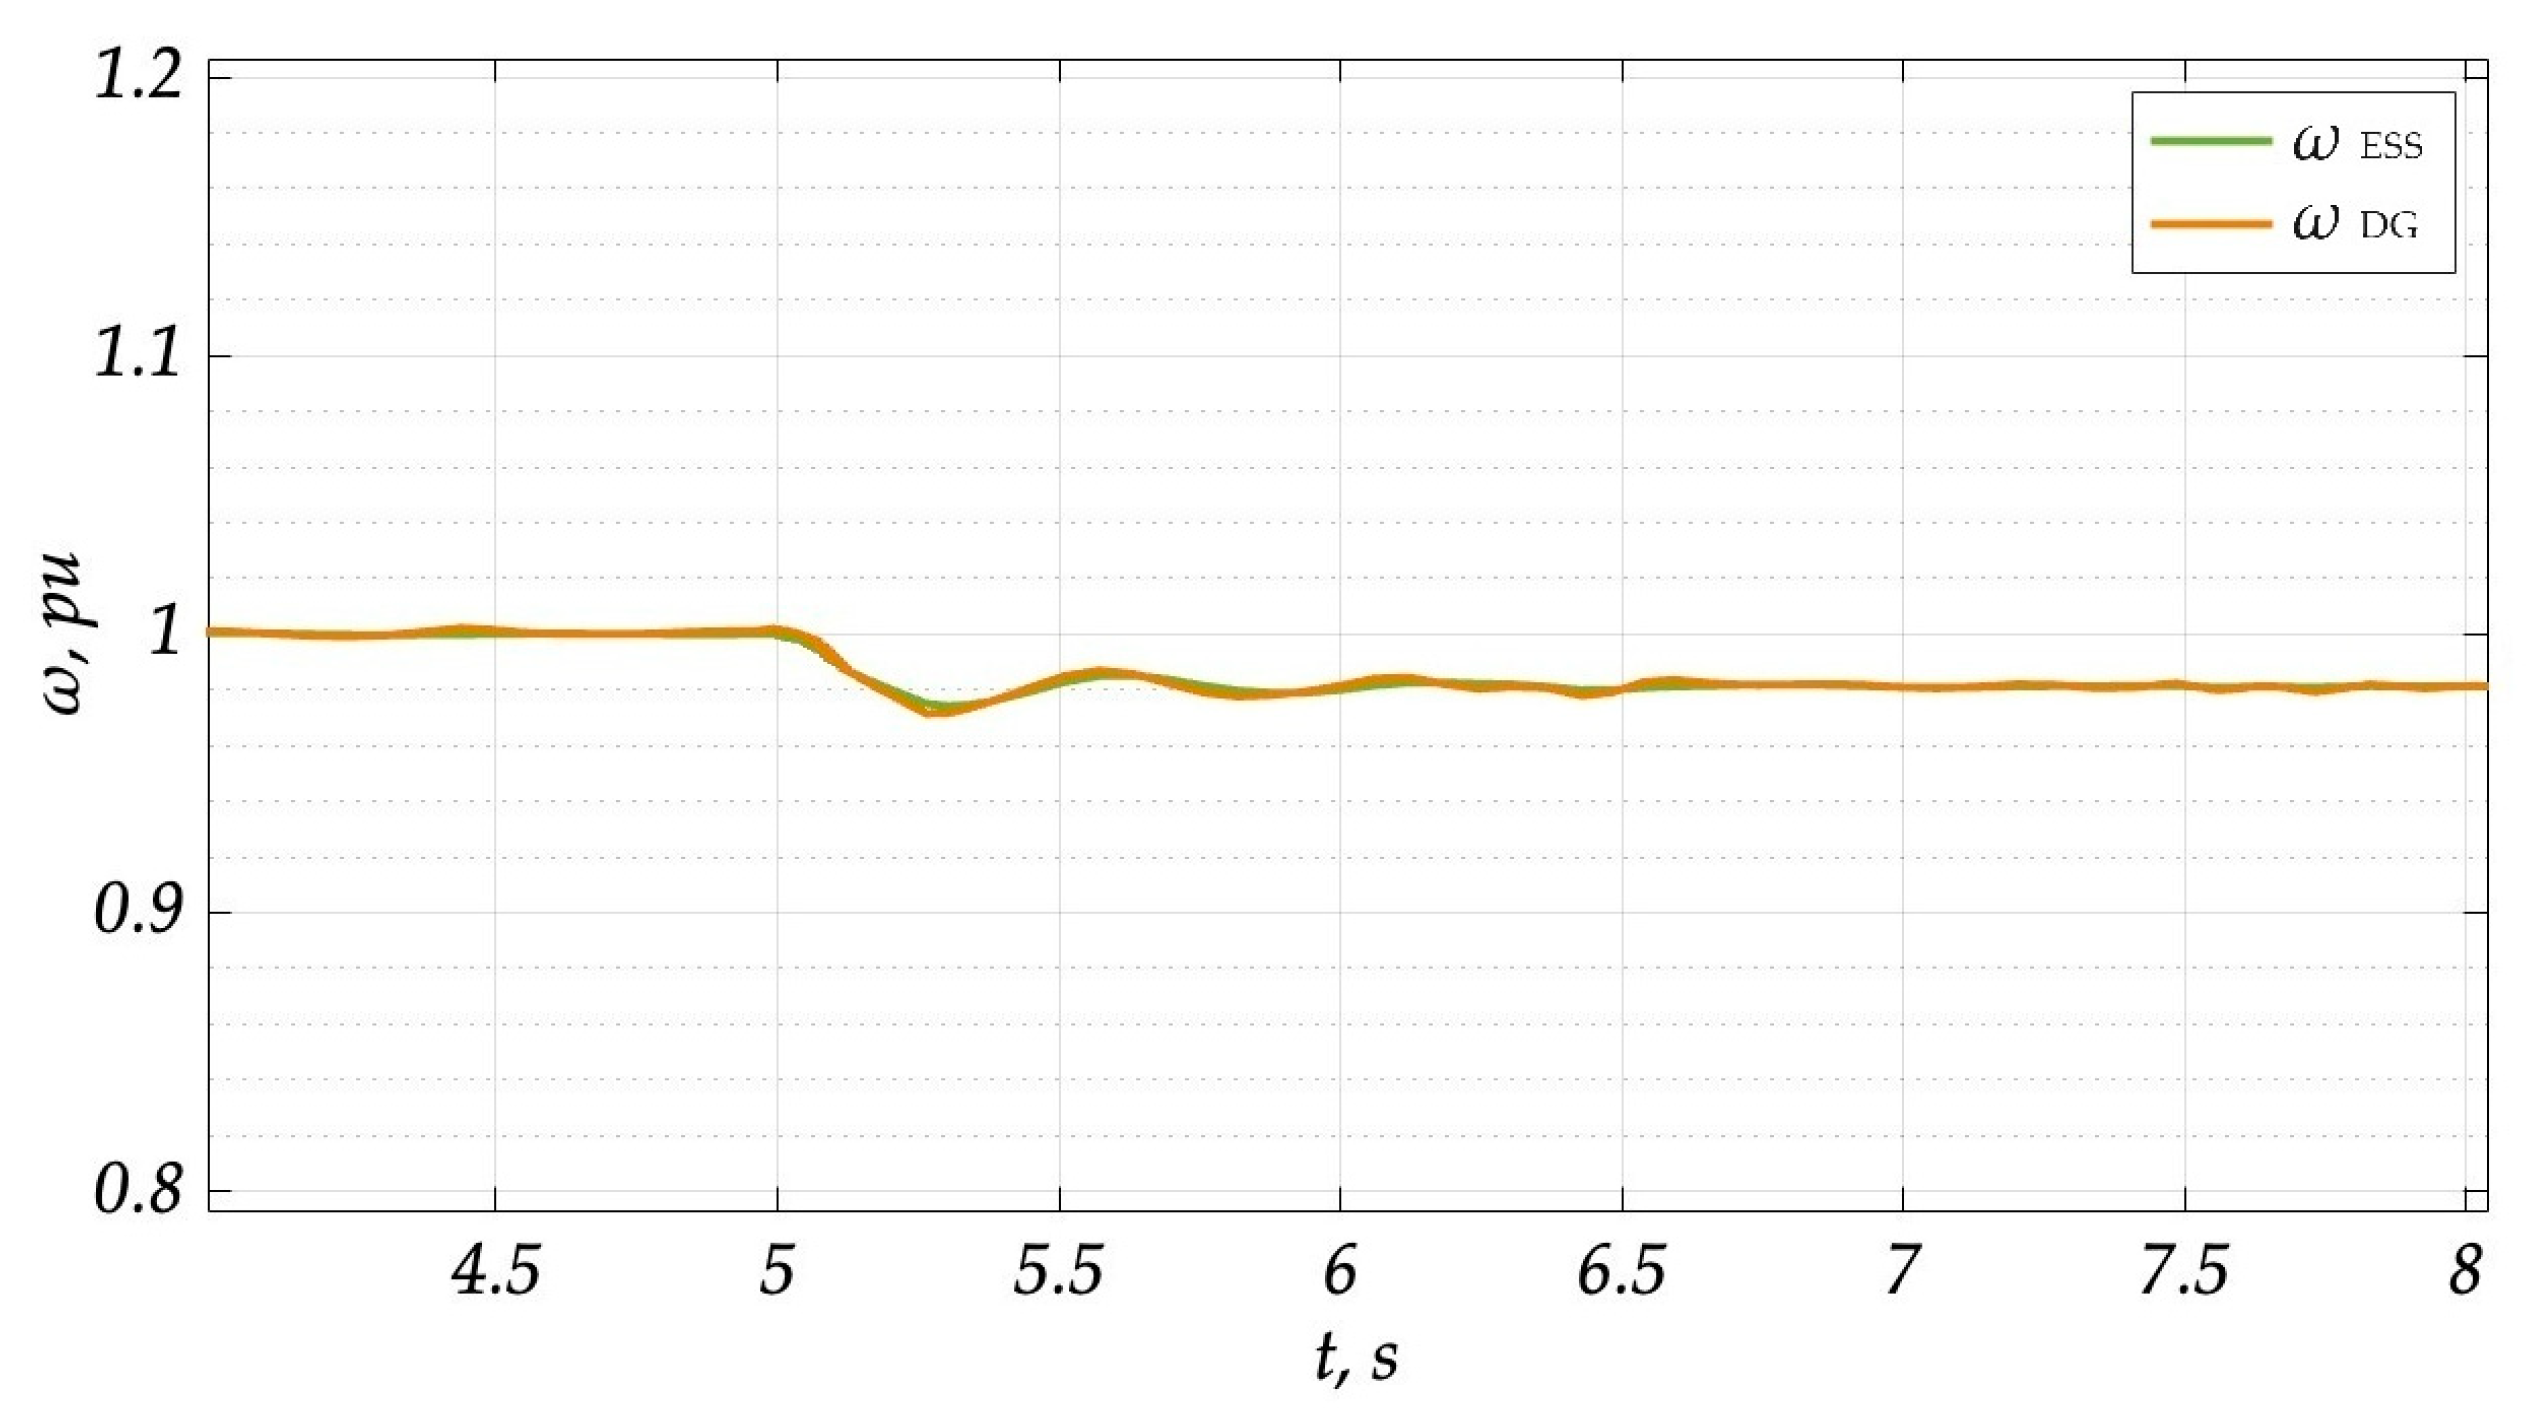
Figure 8 and Figure 9 illustrate the voltage drop and frequency deviations, respectively, of the SHEPS power sources under large disturbances caused by the direct start of the IM using the proposed EPC system via a secondary control channel.
While using the proposed EPC system, the maximum voltage deviation is 4.9%, which is within the acceptable voltage deviation range [18]. The maximum deviation of the frequency is 1.8%, which is also acceptable during transient processes [35] under conditions of large disturbances.

4. Discussion

4.1. Implementation of EPC System

The EPC system can be implemented as an independent control system or a software system integrated into traditional control systems, such as a power management system. The integration of the EPC system via secondary control channels is possible only if local electronic control systems (e.g., ESGs and AVRs) are used. The implementation of the proposed EPC system with mechanical ESGs, as well as analog AVRs, should become a separate research subject.
Secondary EPC is implemented using a cascade control [36], which involves the use of two controllers, with the output of the first controller providing the set point for the second controller, as shown in Figure 10.
The first controller reflects the implementation of the proposed EPC system and control algorithms, while the second controller reflects the operation of traditional control systems based on the PID controller.
While monitoring transient processes, the EPC system compares the controlled parameters’ first and second derivative values with the preset threshold. As soon as the threshold is exceeded, the EPC system forms the maximum counteractive control signal for certain executive controls, such as ESG, MC, and AVR, to compensate for the deviation of the controlled parameters in advance. This control signal exceeds and overrides the counterreaction of the traditional control systems while the forecasted values exceed the threshold. On the other hand, this type of counterreaction can cause the opposite controlled parameter deviation; however, this negative effect can be eliminated by adjusting the threshold for forecasted values while going through the simulation process to achieve acceptable deviation values when a controlled parameter is within the acceptable limits. Furthermore, the threshold values of speed and acceleration (first and second derivatives), which characterize the controlled parameters’ dynamics and thereby determine the operating mode of the SHEPS, can be found in each particular case using the methods of expert assessment or experimental measurement at the stage of designing and building the SHEPS. At the same time, the problem of false control action as a consequence of EPC system hardware or software failure remains unstudied and would benefit from becoming the focus of future research.

4.2. Limitations

Several limitations that might have had a significant impact on the results in this paper have been determined and will become subjects for further research:
  • The inverter model was adopted with the assumption that the battery discharge process is not considered but assumed to be constant, corresponding to the maximum charge level.
  • The mathematical models of the monitoring circuits and instrumentation such as frequency and voltage sensors are not considered, assuming them to be ideal sensors without time constants.
  • The generated harmonics of voltage and frequency are not considered while assessing the power quality.

5. Conclusions

All SHEPS elements are defined by the inertia of technical processes, characterized by a finite rate of change in controlled parameters and, therefore, a finite time for developing an emergency state and the fault itself. As a result, EPC for SHEPS can be implemented.
Gaining time to prevent an emergency mode and a fault state can be achieved by expanding the range of equipment control system functions by implementing control principles that allow the anticipation and prevention of emergency factors.
This research shows that the electrical power quality improvement goals can be achieved by increasing the control efficiency of the power system generating sources. The feasibility of the proposed control system was proven using a computer simulation, which was carried out after developing a mathematical model of the SHEPS under study. The results of the study conducted here show that the use of the proposed EPC system will improve power quality when the controlled parameters are within acceptable limits. The voltage and frequency fluctuations of the power system’s generating sources caused by the IM direct start without using the proposed EPC system are 18.3% and 5.1%, respectively. While using the proposed EPC system, the maximum voltage and frequency deviations are 4.9% and 1.8%, respectively, which are acceptable during transient processes under conditions of large disturbances. Thus, the EPC system should become a fundamentally important protective component in the field of SHEPS control systems, as well as a power management component that can employ management functions such as the direct shutdown and start of power sources and consumers. At the same time, further research is needed, as the problem of false control action as a consequence of EPC system hardware or software faults remains unstudied.

Author Contributions

Conceptualization, S.T. and V.L.; methodology, S.T.; writing—original draft preparation, S.T. and V.L.; writing—review and editing, S.T.; software, S.T.; investigation, S.T.; visualization, S.T.; validation, S.T.; supervision, S.T.; project administration, S.T. All authors have read and agreed to the published version of the manuscript.

Funding

This research received no external funding.

Data Availability Statement

The data presented in this study are available on request from the author.

Conflicts of Interest

The authors declare no conflict of interest.

References

  1. Sabin, D.; Norwalk, M.; Kittredge, K.; Johnston, S. IEEE Power Quality Standards. In Proceedings of the 2022 20th International Conference on Harmonics & Quality of Power (ICHQP), Naples, Italy, 29 May–1 June 2022; p. 21846300. [Google Scholar] [CrossRef]
  2. Amrouche, S.O.; Rekioua, D.; Rekioua, T.; Bacha, S. Overview of energy storage in renewable energy systems. Int. J. Hydrogen Energy 2016, 41, 20914–20927. [Google Scholar] [CrossRef]
  3. Ibrahim, H.; Ilinca, A.; Perron, J. Energy storage systems: Characteristics and comparisons. Renew. Sustain. Energy Rev. 2008, 12, 1221–1250. [Google Scholar] [CrossRef]
  4. Hadjipaschalis, I.; Poullikkas, A.; Efthimiou, V. Overview of current and future energy storage technologies for electric power applications. Renew. Sustain. Energy Rev. 2009, 13, 1513–1522. [Google Scholar] [CrossRef]
  5. Tan, X.; Li, Q.; Wang, H. Advances and trends of energy storage technology in microgrid. Int. J. Electr. Power Energy Syst. 2013, 44, 179–191. [Google Scholar] [CrossRef]
  6. Liu, J.; Yushi, M.; Ise, T.; Yoshizawa, J.; Watanabe, K. Parallel Operation of a Synchronous Generator and a Virtual Synchronous Generator under Unbalanced Loading Condition in Microgrids. In Proceedings of the 2016 IEEE 8th International Power Electronics and Motion Control Conference (IPEMC-ECCE Asia), Hefei, China, 22–26 May 2016; pp. 3741–3748. [Google Scholar] [CrossRef]
  7. Yuan, W.; He, Y.; Li, Z.; Ruan, Y.; Lu, L.; Li, B. A real-time aging monitoring method of parallel-connected IGBT modules. Mater. Sci. Semicond. Process. 2021, 124, 105555. [Google Scholar] [CrossRef]
  8. Sathik, M.M.; Prasanth, S.; Sasongko, F.; Pou, J. Online condition monitoring of IGBT modules using voltage change rate identification. Microelectron. Reliab. 2018, 88–90, 486–492. [Google Scholar] [CrossRef]
  9. Stamatakis, M.E.; Ioannides, M.G. State Transitions Logical Design for Hybrid Energy Generation with Renewable Energy Sources in LNG Ship. Energies 2021, 14, 7803. [Google Scholar] [CrossRef]
  10. Ge, Y.; Zhang, J.; Zhou, K.; Zhu, J.; Wang, Y. Research on Energy Management for Ship Hybrid Power System Based on Adaptive Equivalent Consumption Minimization Strategy. J. Mar. Sci. Eng. 2023, 11, 1271. [Google Scholar] [CrossRef]
  11. Kolodziejski, M.; Michalska-Pozoga, I. Battery Energy Storage Systems in Ships’ Hybrid/Electric Propulsion Systems. Energies 2023, 16, 1122. [Google Scholar] [CrossRef]
  12. Torreglosa, J.P.; González-Rivera, E.; García-Triviño, P.; Vera, D. Performance Analysis of a Hybrid Electric Ship by Real-Time Verification. Energies 2022, 15, 2116. [Google Scholar] [CrossRef]
  13. Liu, J.; Miura, Y.; Ise, T. Comparison of Dynamic Characteristics between Virtual Synchronous Generator and Droop Control in Inverter-Based Distributed Generators. IEEE Trans. Power Electron. 2016, 31, 3600–3611. [Google Scholar] [CrossRef]
  14. Khajesalehi, J.; Afjei, S.E. Fault-tolerant virtual synchronous generator control of inverters in synchronous generator-based microgrids. Electr. Power Syst. Res. 2023, 218, 109173. [Google Scholar] [CrossRef]
  15. Liu, J.; Hossain, M.J.; Lu, J.; Rafi FH, M.; Li, H. A hybrid AC/DC microgrid control system based on a virtual synchronous generator for smooth transient performances. Electr. Power Syst. Res. 2018, 162, 169–182. [Google Scholar] [CrossRef]
  16. Ghodsi, M.R.; Tavakoli, A.; Samanfar, A. Microgrid Stability Improvement Using a Deep Neural Network Controller Based VSG. Int. Trans. Electr. Energy Syst. 2022, 2022, 7539173. [Google Scholar] [CrossRef]
  17. IEEE Guide for Identifying and Improving Voltage Quality in Power Systems. In IEEE Std 1250-2018 (Revision of IEEE Std 1250-2011); IEEE: Piscataway, NJ, USA, 2018; pp. 1–63. [CrossRef]
  18. Abs Rules for Building and Classing. Part 6: Rules For Equipment and Machinery Certification. Updated July 2018. [Electronic Resource]. Available online: https://ww2.eagle.org (accessed on 25 October 2023).
  19. Maity, A.; Bhattacharya, K.; Sanyal, A.N. Asynchronous operation of synchronous generators under field failure. In Proceedings of the 2014 First International Conference on Automation, Control, Energy and Systems (ACES), Adisaptagram, India, 1–2 February 2014; pp. 1–6. [Google Scholar] [CrossRef]
  20. Tierielnyk, S.; Lukovtsev, V. Emergency Prevention Control System for Shipboard Electrical Power Plant. Int. J. Energy Environ. Econ. 2021, 29, 341–354. [Google Scholar]
  21. Fikari, S.G.; Sigarchian, S.G.; Chamorro, H.R. Modeling and Simulation of an Autonomous Hybrid Power System. In Proceedings of the 2017 52nd International Universities Power Engineering Conference (UPEC), Heraklion, Greece, 28–31 August 2017; Volume 52, pp. 1–6. [Google Scholar] [CrossRef]
  22. Tamrakar, I.; Shilpakar, L.; Fernandes, B.; Nilsen, R. Voltage and frequency control of parallel operated synchronous generator and induction generator with STATCOM in micro hydro scheme. IET Gener. Transm. Distrib. 2007, 1, 743–750. [Google Scholar] [CrossRef]
  23. Tian, P.; Guerrero, J.M.; Mahtani, K.; Platero, C.A. Instantaneous Specific Protection Method Against Faulty Synchronizations of Synchronous Machines. IEEE Access 2021, 9, 88868–88878. [Google Scholar] [CrossRef]
  24. Gvozdeva, I.; Lukovtsev, V.; Tierielnyk, S. Forecasting of the performance of the shipboard electric power system on the basis of the artificialneural Network. Technol. Audit. Prod. Reserves 2017, 4, 43–49. [Google Scholar] [CrossRef]
  25. IEEE Committee Report. Dynamic Models for Steam and Hydro Turbines in Power System Studies. IEEE Trans. Power Appar. Syst. 1973, PAS-92, 1904–1915. [Google Scholar] [CrossRef]
  26. Stavrakakis, G.; Kariniotakis, G. A general simulation algorithm for the accurate assessment of isolated diesel-wind turbines systems interaction. I. A general multimachine power system model. IEEE Trans. Energy Convers. 1995, 10, 577–583. [Google Scholar] [CrossRef]
  27. Olive, D.W. Digital Simulation of Synchronous Machine Transients. IEEE Trans. Power Appar. Syst. 1968, PAS-87, 1669–1675. [Google Scholar] [CrossRef]
  28. Krause, P.; Wasynczuk, O.; Sudhoff, S.; Pekarek, S. Analysis of Electric Machinery and Drive Systems, 3rd ed.; Wiley-IEEE Press: Hoboken, NJ, USA, 2013; ISBN 9781118024294. [Google Scholar]
  29. IEEE Committee Report. Computer representation of excitation systems. IEEE Trans. Power Appar. Syst. 1968, PAS-87, 1460–1464. [Google Scholar] [CrossRef]
  30. Rashid, M.H. Power Electronics Handbook, 3rd ed.; Butterworth-Heinemann Elsevier Ltd.: Oxford, UK, 2011; ISBN 978-0-12-581650-2. [Google Scholar]
  31. Torres, M.; Lopes, L.A.C. Inverter-Based Diesel Generator Emulator for the Study of Frequency Variations in a Laboratory-Scale Autonomous Power System. Energy Power Eng. 2013, 5, 274–283. [Google Scholar] [CrossRef]
  32. Stagg, G.; Ahmed, E.-A. Computer Methods in Power System Analysis; McGraw Hill: Singapore, 1968. [Google Scholar]
  33. Huang, C.; Huang, Y.; Chen, S.; Yang, S. A Hierarchical Optimization Method for Parameter Estimation of Diesel Generators. IEEE Access 2020, 8, 176467–176479. [Google Scholar] [CrossRef]
  34. Matlab Simulink—Simulation and Model-Based Design. Available online: https://www.mathworks.com/products/simulink.html (accessed on 26 March 2023).
  35. Seyedi, H.; Sanaye-Pasand, M. Design of New Load Shedding Special Protection Schemes for a Double Area Power System. Am. J. Appl. Sci. 2009, 6, 317–327. [Google Scholar] [CrossRef]
  36. Flower, J.; Parr, E. 13—Control Systems. In Electrical Engineer’s Reference Book, 6th ed.; Newnes: Oxford, UK, 2003; pp. 13–63. ISBN 9780750646376. [Google Scholar] [CrossRef]
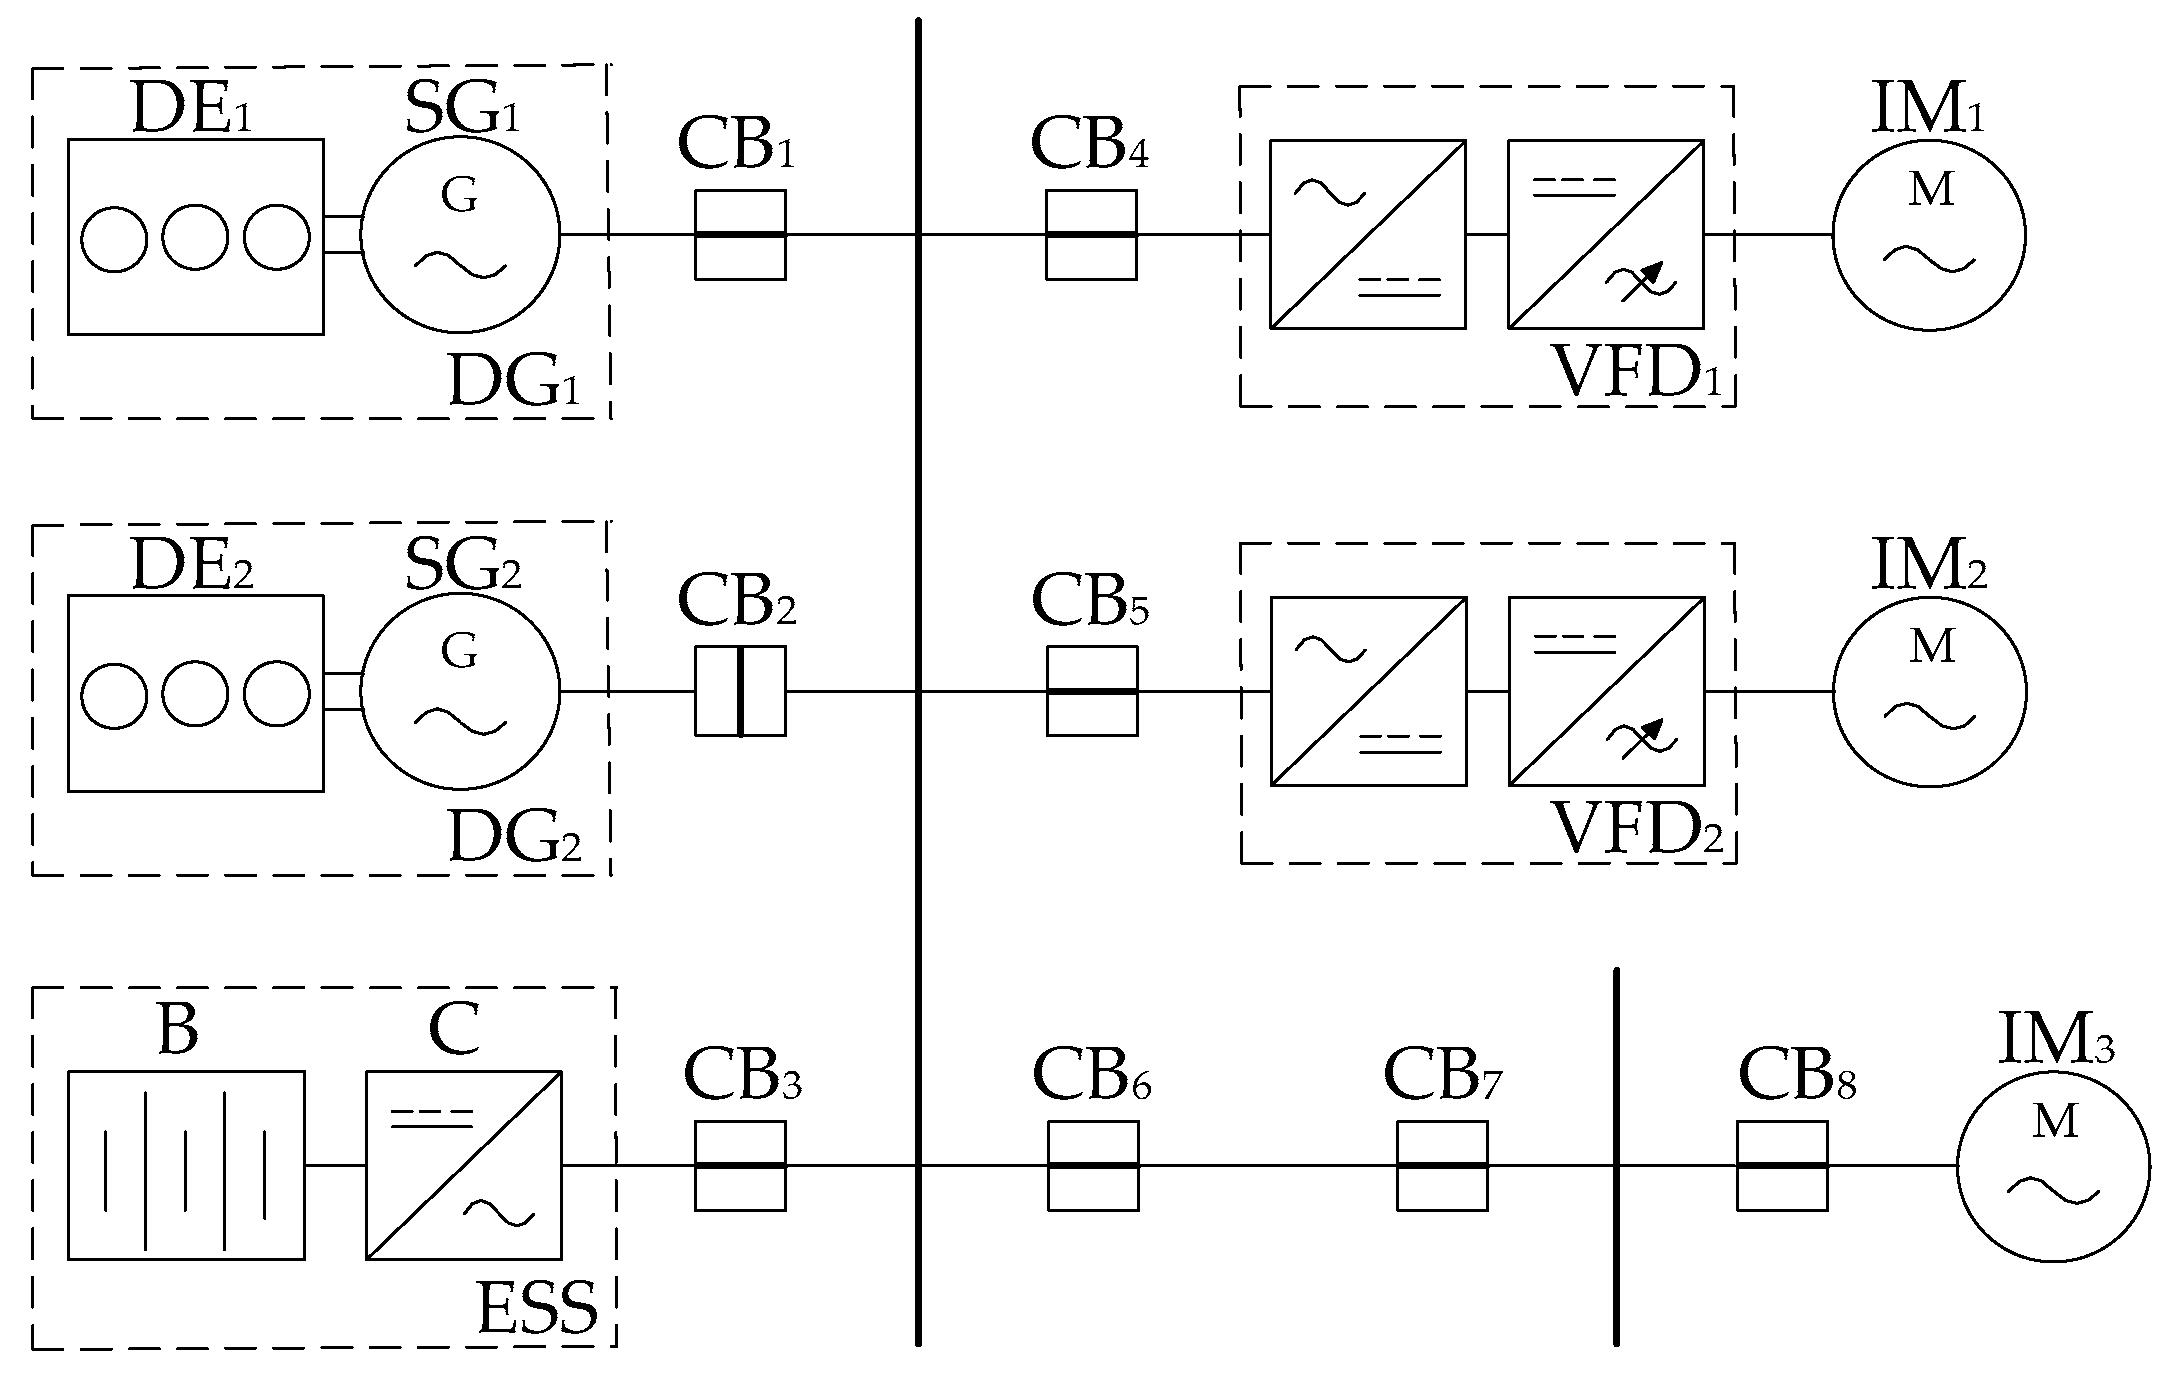
Figure 1. Initial single-line diagram of the system under study.
Energies 17 00398 g001
Figure 2. Single-line diagram of the system under study.
Energies 17 00398 g002
Figure 3. Block diagram of EPC vector formation.
Energies 17 00398 g003
Figure 4. Block diagram of the SHEPS EPC system.
Energies 17 00398 g004
Figure 5. SHEPS generalized control algorithm.
Energies 17 00398 g005
Figure 6. Voltage simulation results obtained without using the proposed EPC system.
Energies 17 00398 g006
Figure 7. Deviation of DG and ESS frequencies due to direct start of IM obtained without using the proposed EPC system.
Energies 17 00398 g007
Figure 8. Voltage deviation of SHEPS power sources obtained while using the proposed EPC system.
Energies 17 00398 g008
Figure 9. Generated frequency deviations of SHEPS power sources obtained while using the proposed EPC system.
Energies 17 00398 g009
Figure 10. Implementation of the secondary EPC.
Energies 17 00398 g010
Table 1. Parameters of key elements of the system under study.
System ComponentParameters
Synchronous generator P s g n o m = 1900 kW, U s g n o m = 690 V
Induction motor P i m n o m = 735 kW, U i m n o m = 690 V
Energy storage system P e s s n o m = 1800 kW, U e s s n o m = 690 V, E n o m = 1415 kWh
Table 2. SHEPS model parameter values.
DE and ESG
ParameterValueParameterValueParameterValue
ω r e f 0.99 pu T D M m a x 1.1 pu τ d e 1.23 s
k c 0.03 pu T D M m i n −0.25 pu τ e s g 0.2 s
k a c t 0.012 pu τ s e 10 5 s τ c 10 4 s
SG
ParameterValueParameterValueParameterValue
τ f   s g 2.183 s r s g 0.011 pu µ q   s g 0.895 pu
τ D   s g 0.893 s µ d   s g 0.929 pu g 1   s g 0.947 pu
τ Q   s g 0.592 s µ d   s g 0.932 pu g 2   s g 0.983 pu
x d   s g 1.94 pu x q   s g 1.94 pu
AVR
ParameterValueParameterValueParameterValue
U r e f 1 pu τ a v r 0.2 s Δ E f   m i n 1.5
K k 10 U f   m i n 0 Δ E f   m a x 1.5
k a v r 0.03 pu U f   m a x 6.5
ESS
ParameterValueParameterValueParameterValue
U a c 1 pu L d c 0.0942 pu ω i n v   r e f 1 pu
τ i n v 0.01 s r i n v 0.015 pu C d c 0.087 pu
IM
ParameterValueParameterValueParameterValue
x i m 0.204 pu μ i m 0.944 pu m 0 0.12 pu
r i m 0.046 pu τ i m 0.23 s m n 0.79 pu
K l 0.53 pu
Disclaimer/Publisher’s Note: The statements, opinions and data contained in all publications are solely those of the individual author(s) and contributor(s) and not of MDPI and/or the editor(s). MDPI and/or the editor(s) disclaim responsibility for any injury to people or property resulting from any ideas, methods, instructions or products referred to in the content.