Article

Implementation and Adaptability Analysis of Numerical Simulation for Shale Oil CO2 Huff and Puff

1
College of Petroleum Engineering, China University of Petroleum (Beijing), Beijing 102249, China
2
Changqing Oilfield Branch No. 1 Oil Production Plant, Yan’an 716009, China
*
Author to whom correspondence should be addressed.
Energies 2024, 17(2), 454; https://doi.org/10.3390/en17020454
Submission received: 10 November 2023 / Revised: 21 December 2023 / Accepted: 9 January 2024 / Published: 17 January 2024
(This article belongs to the Section H: Geo-Energy)

Abstract

:
Carbon dioxide (CO2) is being considered for use to enhance oil recovery and resource utilization and storage, with wide technical adaptability. In this paper, a numerical simulation method is used to study the adaptability of CO2 huff and puff in shale reservoirs. A fluid model introduces the nanoconfinement effect and reflects the nanoconfinement effect using the fluid pT phase diagram. This method uses local grid refinement and changes the permeability near the grid to characterize the reservoir reconstruction volume (SRV) fracture network while considering the CO2 diffusion effect. The results indicate that by using the incremental recovery rate and oil change rate as references, adaptive charts can be obtained for different Kf/Km and oil saturation. When Kf/Km is 1000 and the increase in the CO2 recovery rate reaches 1.5%, the lower limit of oil saturation is 0.54. When Kf/Km is 1000 and the increase in the CO2 recovery rate reaches 2%, the lower limit of oil saturation is 0.57. When the oil saturation is 0.5 and the CO2 huff and puff oil change rate reaches 0.3, the lower limit of Kf/Km is 700. Finally, when the oil saturation is 0.548 and the CO2 huff and puff oil change rate reaches 0.6, the lower limit of Kf/Km is 10. The research results are significant and can guide the design and application of on-site CO2 throughput test plans.

1. Introduction

Under China’s vision of “peak carbon emissions by 2030 and carbon neutrality by 2060”, the development and application of CCUS technology for carbon capture, utilization, and storage are garnering increasing attention. CO2 technology has a wide adaptability, a significant oil-increasing effect, and can be recycled, gradually becoming one of the most attractive applications of CCUS technology [1,2,3]. Shale reservoirs have high geological reserves of crude oil with good properties, but shale reservoirs cannot achieve high recovery rates due to water injection difficulties. Gas injection has technical advantages for this type of reservoir and can effectively improve oil recovery, while CO2 can significantly improve crude oil fluidity and supplement formation energy. CO2 huff and puff can increase single-well production in a relatively short period of time. Therefore, the systematic study of shale oil CO2 huff and puff adaptability is highly significant [4,5,6].
Hydraulic fracturing is widely used in unconventional oil and gas resource development as a means of effectively increasing the permeability of unconventional reservoirs [7]. In unconventional fractured reservoirs, previous discrete fracture network modeling techniques have been able to characterize natural fracture networks efficiently and establish the corresponding numerical simulation models to predict the propagation patterns of hydraulic fracturing [8]. A variety of theoretical solution models for hydraulic fracturing have been developed [9] due to the limited factors considered in theoretical derivations. These assume that fractures formed by hydraulic fracturing in reservoirs are straight while the rock matrix is isotropic and that corresponding theoretical solutions can be derived following further assumptions of the cross-sectional characteristics of hydraulic fractures. This significantly facilitates preliminary predictions regarding reservoir hydraulic fracturing, which were made by engineers in early research. However, with the development of monitoring technology, it has been confirmed that hydraulic fractures are characterized by bending and branching in rocks and reservoirs [10], indicating that theoretical models are insufficient in precisely predicting the morphology of reservoir hydraulic fractures. In addition, there are difficulties in the preparation of samples for laboratory experiments and high costs associated with field trials, making it difficult to quantify complex fractures in theoretical derivations. As a result, numerical simulation has become an effective approach for investigating the propagation patterns of hydraulic fractures in heterogeneous reservoirs. One oil field in Jiangsu, China, conducted the first CO2 huff and puff test on Well Su 88. The cumulative CO2 injection volume was 116 t, and the recovery rate increased by 5%. This indicates that CO2 huff and puff has a good adaptability for fault block reservoirs with a small reservoir area, low reserves, and poor interlayer continuity. Jin et al. conducted carbon dioxide huff and puff experiments using core samples, and the results showed that supercritical CO2 can extract hydrocarbons such as methane, ethane, and propane from the core. Based on the experimental results, the feasibility of CO2 huff and puff in improving oil recovery and CO2 storage in Bakken shale oil reservoirs was proposed [11]. Francisco D Tovar et al. conducted the first comprehensive experimental evaluation of organic rich shale, as well as 18 core CO2 huff and puff experiments to evaluate the effects of the shut-in time, injection pressure, and minimum miscibility pressure on oil recovery, demonstrating the potential for CO2 to replace crude oil in organic shale reservoirs [12]. Gamadi T.D. et al. conducted simulation research on gas injection huff and puff based on the established single-well model for the multi-stage fracturing of horizontal wells. The results showed that the recovery rate improved after gas injection and stimulation but that the recovery rate of highly heterogeneous formations was higher than that of homogeneous formations. This is because, for homogeneous formations, injected CO2 is prone to diffusion into the interior of the reservoir, resulting in poor pressure suppression during the closed-well stage and lower oil recovery [13]. Chen et al. established a component model to simulate the CO2 throughput process. Research has shown that compared to depleted mining, the recovery rate after CO2 huff and puff decreases and that the longer the gas injection time, the greater the reduction in the recovery rate. Therefore, it can be concluded that in depleted mining or CO2 huff and puff, the stronger the heterogeneity of shale oil reservoirs, the lower the recovery rate [14]. Orozco et al. conducted historical fitting on the field data of gas injection huff and puff experiments in the Eagle Ford block, and, based on this, conducted CO2 huff and puff prediction. The results indicated that CO2 throughput can significantly improve the recovery efficiency of the Eagle Ford block [15]. In summary, worldwide, there is relatively little research on the mathematical modeling of CO2 throughput related to the comprehensive consideration of the nanoconfinement effect and the complex fracture network in shale oil, and there is no corresponding evaluation of the advantages and disadvantages of shale oil reservoirs. In addition, the adaptability limit of oil reservoirs has not been determined. Therefore, it is necessary to conduct a systematic analysis of the adaptability of shale oil CO2 huff and puff.
The Chang 7 reservoir in the Ordos Basin is a typical shale oil reservoir with poor reservoir properties and developed natural fractures. Therefore, in response to the current problems of energy depletion and low recovery after depleted development, an evaluation of the adaptability of shale oil CO2 huff and puff was carried out, and the ratio of the permeability to matrix permeability (Kf/Km) and the adaptability range of oil saturation CO2 huff and puff in the SRV transformation area were studied, providing a theoretical reference for shale oil development.

2. Establishment of a Numerical Model for Shale Oil Fracturing Horizontal Wells

The natural fractures in the Ordos Basin were developed and connected to each other. Artificial fractures control the oil drainage area, making them a storage space and seepage channel for shale reservoirs [16,17]. A dual medium model was established based on geological data of the Chang 7 shale reservoir, with a component model size of 76 × 21 × 4, each grid in the i-direction being 20 m, each grid in the j-direction being 20 m, and a layer thickness of 12 m. The top buried depth was 2100 m, the reference pressure was 18.1 MPa, the porosity was 10%, the matrix permeability was 0.02 × 10⁻³ μm2, the reservoir temperature was 71.71 °C, and the initial oil saturation was 0.6. There was a single horizontal well in the middle of the model, with a perforated interval in the third layer and a horizontal interval length of 1200 m. The established CO2 huff and puff numerical model for shale oil horizontal wells is shown in Figure 1.
Before conducting numerical simulation experiments, a model with 4 and 12 vertical layers was established for comparison, while the other parameters remained unchanged. The CO2 mole fraction field in the oil phase after well closure is shown in Figure 2. Figure 2a shows 4 vertical layers, while Figure 2b shows 12 vertical layers.
As seen in Figure 2, there is little difference in the CO2 mole fraction field in the oil phase after the model is divided into 4 and 12 vertical layers. Considering the calculation speed and performance characterization of the model, this study was conducted on the model with four vertical layers.
Oil water and oil gas relative permeability curves are shown in Figure 3.
The basic parameter values of the model are shown in Table 1, which were determined based on the physical properties of the Chang 7 shale oil reservoir, and the relative permeability curves are shown in Figure 3.

3. A Fluid Model Considering the Nanoconfinement Effect

Nanoscale pore throat systems are commonly developed in shale oil reservoirs, and the main reservoir space is composed of pores with pore sizes of 50–300 nm, with locally developed micron-sized pores. Research in the field of shale oil reservoir development has shown that the presence of nanoscale pores and throats in shale reservoirs can lead to significant capillary pressure. Capillary pressure affects the thermodynamic phase behavior of crude oil components, and phase behavior affects the calculation of components and fluid flow in porous media, thereby affecting crude oil production [18,19,20,21]. Therefore, application of the nanoconfinement effect is of great significance in shale oil reservoir development.
According to the literature, it is known that critical pressure and temperature changes can be used to simulate the influence of nanoconfinement effects on phase behavior [22]. The research results indicate that the shift in critical properties of nanoconfined fluids is related to the ratio of the Lennard-Jones size parameters to the pore radius (dimensionless pore radius, σ LJ/rp). The relationship between critical pressure and critical temperature is shown in Equations (1)–(3) [23,24,25].
Δ T c = T cb T cp T cb = 0.9409 σ LJ r p 0.2415 ( σ LJ r p ) 2
Δ p c = p cb p cp p cb = 0.9409 σ LJ r p 0.2415 ( σ LJ r p ) 2
σ LJ = 0.244 T cb p cb 3
In the equation, ΔTc* is the change in relative critical temperature caused by the nanoconfinement effect, K; Δpc* is the change in relative critical pressure caused by the nanoconfinement effect, atm; Tcb is the critical temperature of the component, K; Tcp is the component-corrected critical temperature, K; pcb is the critical pressure of the component, atm; pcp is the component corrected critical pressure, atm; rp is the aperture radius, nm; and σ LJ is the Lennard-Jones size parameter, nm.
Due to the significant impact of the number of fluid model components on the accuracy and speed of numerical simulation calculations, it is necessary to balance calculation accuracy and time. To avoid affecting the simulation results, multiple components of crude oil were merged into seven pseudo-components based on the principle of similar composition properties, as shown in Table 2.
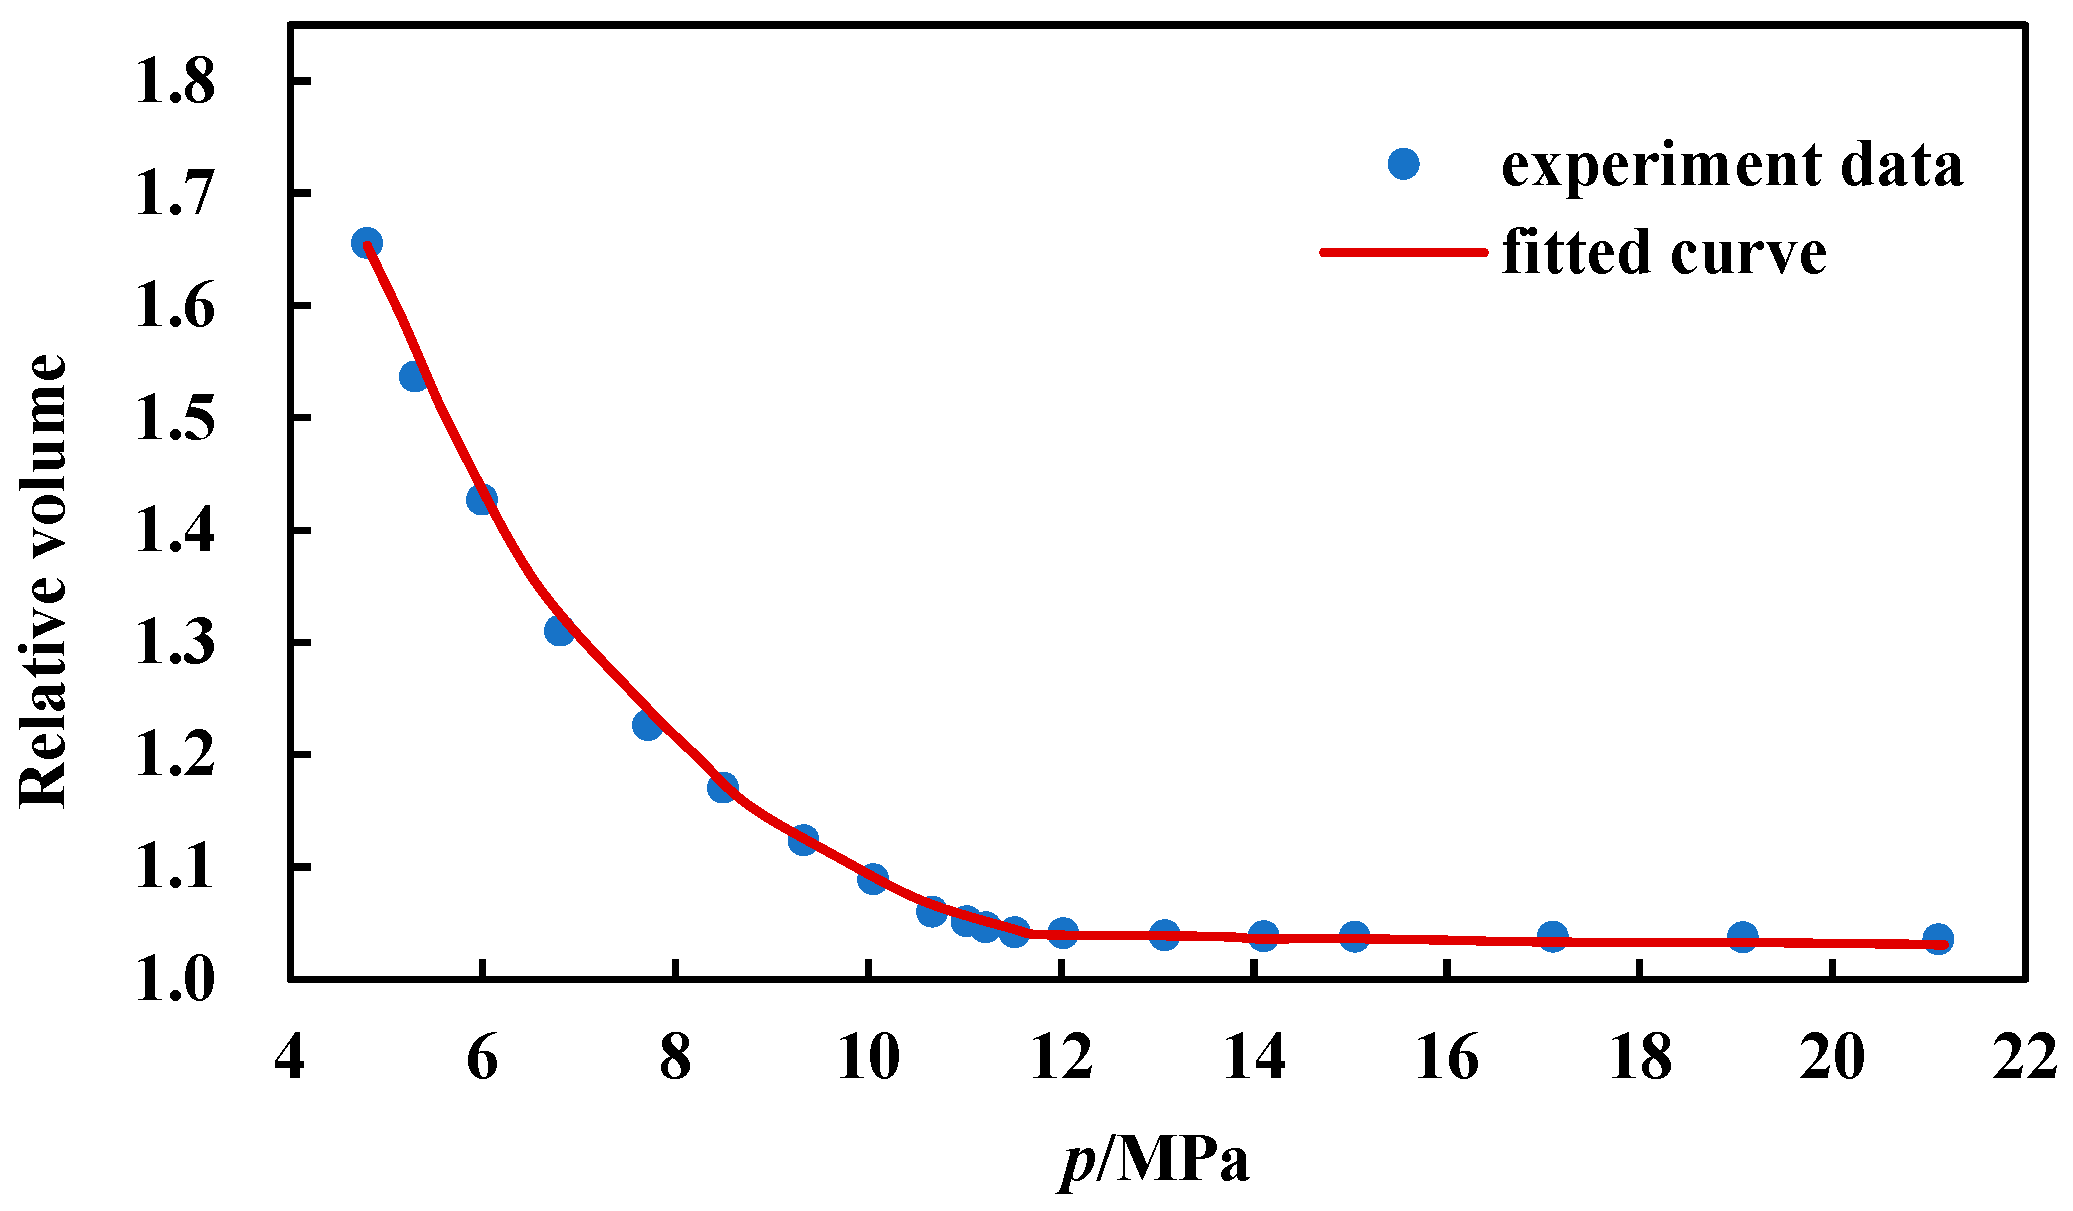
The relative volume fitting of the constant component expansion experiment (CCE) is shown in Figure 4. It can be seen that the fitting degree of the pseudo-component crude oil phase is relatively high, so this model can be used for subsequent numerical simulation research. The pore throat structure of block Chang 7 varies greatly, with pore radii ranging from 2 to 8 μm. The throat radius range is 20 to 150 nm [26]. In the process of fluid migration, the nano throat has a significant impact on the phase behavior of fluid components. The critical parameters of pseudo-components in crude oil are shown in Table 3.
Since the pore throat structure of the actual block is complex, the arithmetic mean standard value of the throat is 80 nm. The corrected critical parameters are shown in Table 4.
Figure 5 shows the pT phase diagram of the original and modified critical parameters. It can be seen that the corrected pT phase diagram shifts upwards and the bubble point pressure increases, thereby affecting crude oil simulation development. Therefore, this demonstrates the significance of the nanoconfinement effect in studying CO2 huff and puff development.

4. SRV Regional Fracture Network Model for Shale Oil Horizontal Wells

Hydraulic fracturing simulation is an important component of shale oil development. At present, there are four types of crack models: continuous medium model, equivalent continuous medium model, discrete crack, and embedded discrete crack [27,28]. The continuous medium and equivalent continuous medium models have a wide range of applications and simple processing methods, resulting in high computational efficiency. However, they cannot accurately characterize the complex fracture network formed by natural and artificial fracture systems. The division of discrete crack grids is complex and can represent complex crack networks, but the computational efficiency is low and deviations are prone to occurring during the calculation process. Embedded discrete cracks reduce computational bias and improve computational efficiency by replacing unstructured grids with regularized grids.
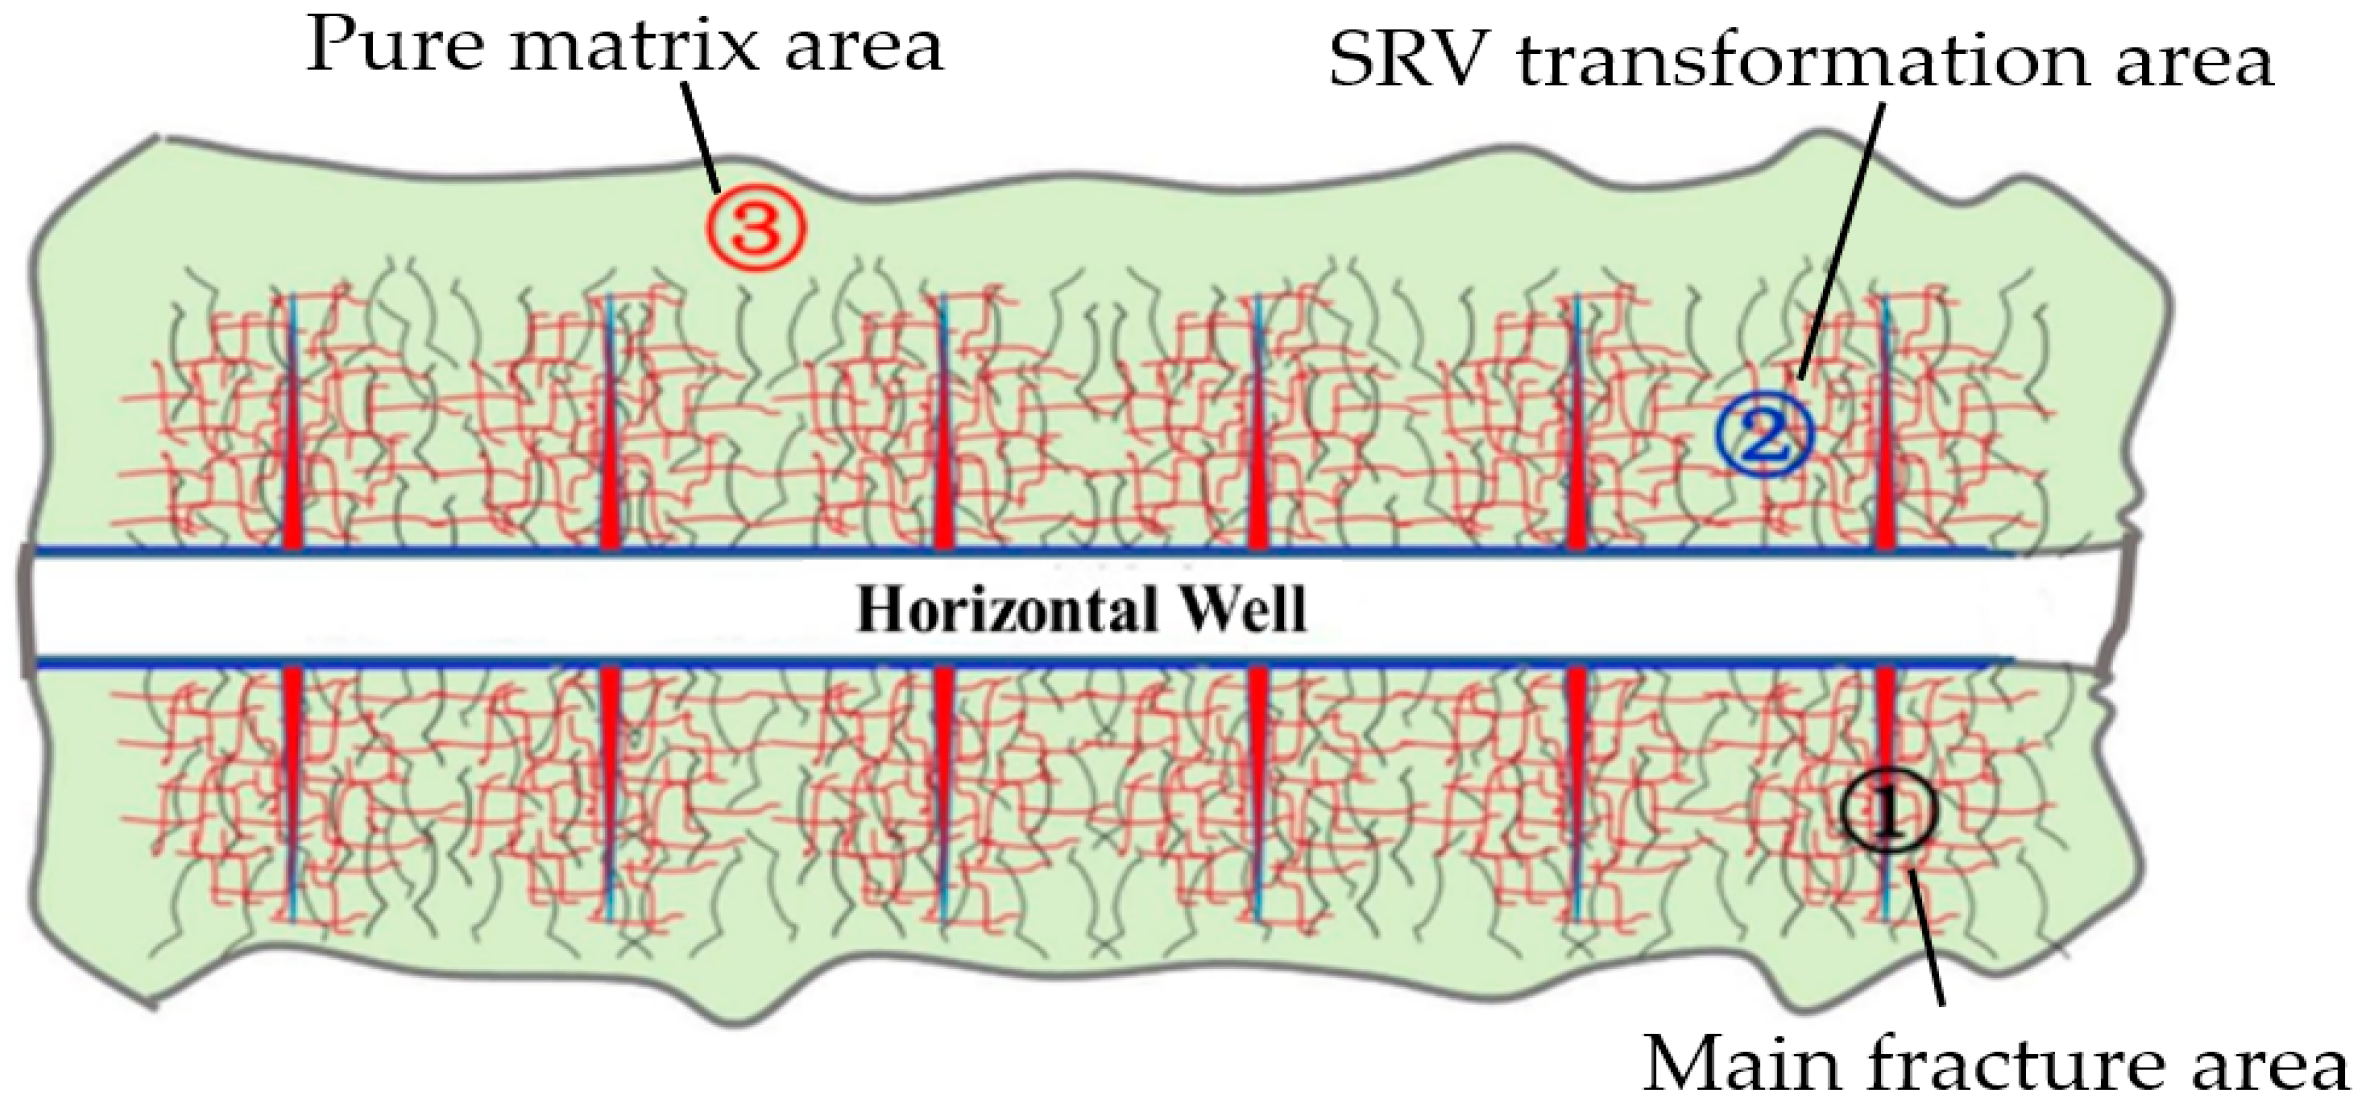
The schematic diagram of the actual SRV fracture network after fracturing is shown in Figure 6, where ① is the main fracture area, ② is the SRV transformation area, and ③ is the pure matrix area.
(1)
Construction of a matrix and natural fracture system
We established a dual medium model, input the permeability of the matrix system and natural fracture system, and then divided the model into two regions based on the equivalent continuous medium model, namely, the equivalent region composed of the natural fracture system and the matrix region, and the pure matrix region.
(2)
Construction of a hydraulic fracturing system
Due to the complex distribution of natural and artificial fractures after volume fracturing, it is easy to form a complex network of fractures; however, this results in an inability of the continuous medium model to accurately depict the fracture morphology after fracturing. Therefore, artificial fractures are created through local grid refinement, i.e., by locally densifying the grid where the artificial crack is located into multiple sub-grids, setting the width of the middle sub-grid to represent the width of the main crack, changing the initial permeability of the sub-grid, and characterizing the conductivity of the main crack through effective permeability. The calculation formula for effective permeability is determined using Equation (4):
K eff = ( W f × K int ) ÷ W inner + K f
In the equation, Keff refers to the effective permeability, 10−3 μm2; Winner refers to the calculation of the effective permeability parameter (the crack width set to maintain the original crack conductivity, usually taken as the default value of 0.6096 m), 10−3 μm2; Wf refers to the width of the main crack, m; Kint refers to the initial original permeability, 10−3 μm2; and Kf is the set natural fracture permeability, 10−3 μm2.
The effective permeability of artificial fractures was calculated to be 500 × 10−3 μm2 according to Equation (4).
(3)
Simulation of SRV fracture network
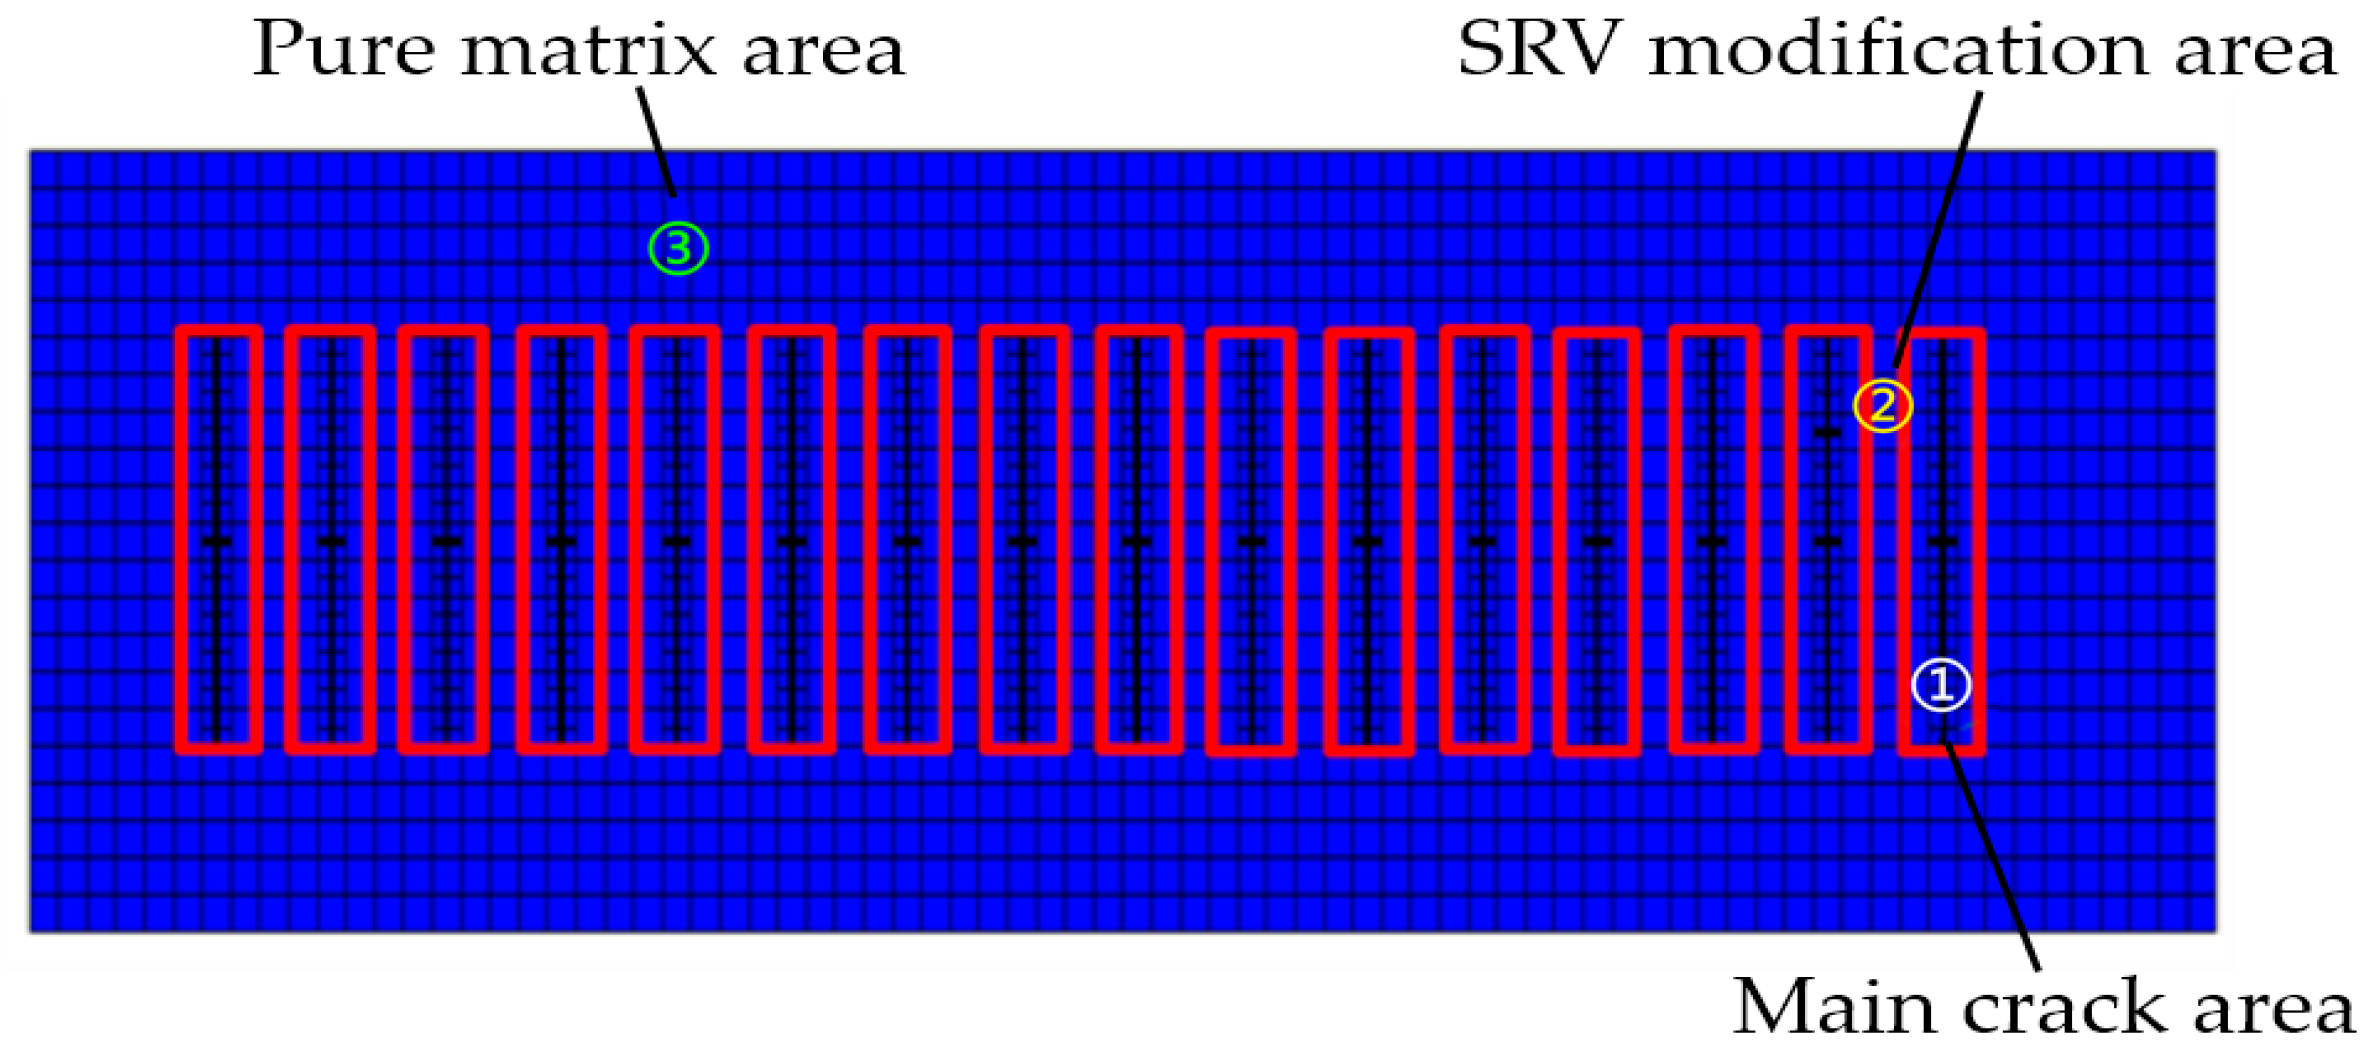
To simulate the SRV area around the main fracture more accurately after hydraulic fracturing, the permeability of the grid refinement area, except for the main fracture, was appropriately increased, thereby simulating the high-conductivity area formed after fracturing. The crack network model established using the numerical simulation method is shown in Figure 7, where ① is the main crack area, ② is the SRV modification area, and ③ is the pure matrix area.
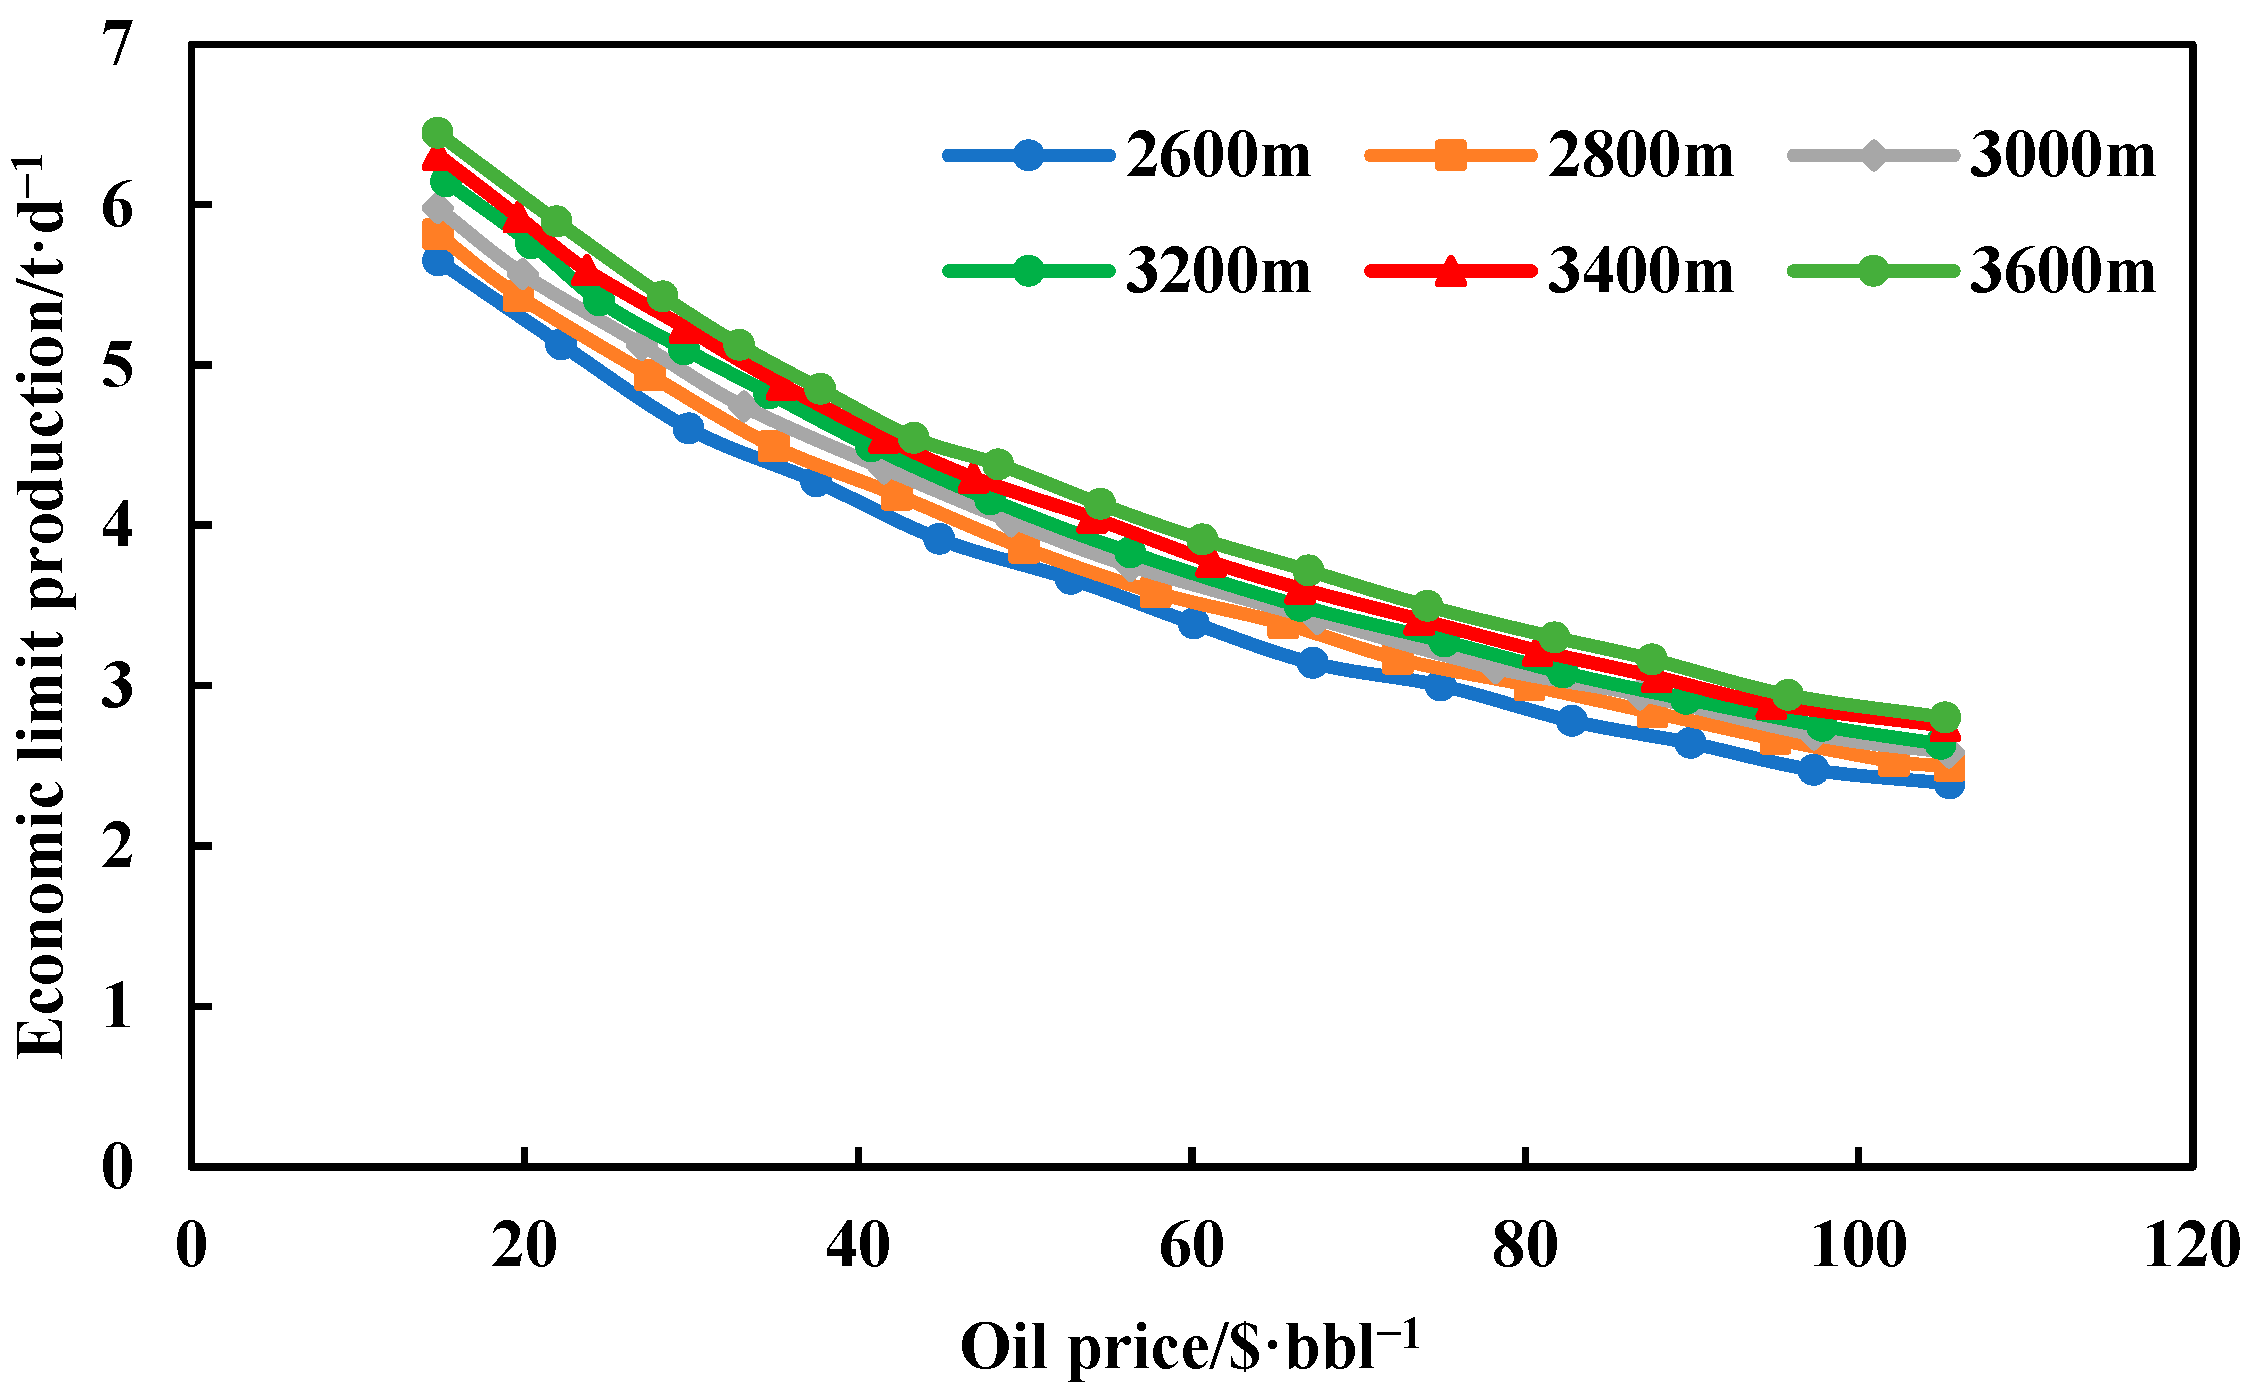
From the perspective of economy and production development, each production well has a limited production capacity. Once the actual production capacity is less than this limited production capacity, taking into account the production cost and other factors, there is no need to continue mining under this technical plan. Further measures to increase production capacity need to be established during the development process, taking the oil production rate as the standard, comprehensively considering the factors of drilling, completion, and operating costs, and determining the production time. Therefore, in conjunction with the site, the maximum production capacity of the wellhead can be introduced. The economic limit chart of deep CO2 flooding in different oil layers is shown in Figure 8 [29].
As shown in Figure 8, when the middle depth of the oil layer is 2106 m, based on the current oil price of USD 80 per barrel, the economic limit production of CO2 flooding in the chart is close to 3 m3/d. Therefore, based on the chart and the actual development situation of the Chang 7 shale reservoir, the maximum production capacity of the wellhead is set at 3 m3/d. If the actual production rate is greater than 3 m3/d, it will normally proceed to the next round of stimulation, and when the daily oil production rate is less than 3 m3/d, the production well will be closed and the production stopped.
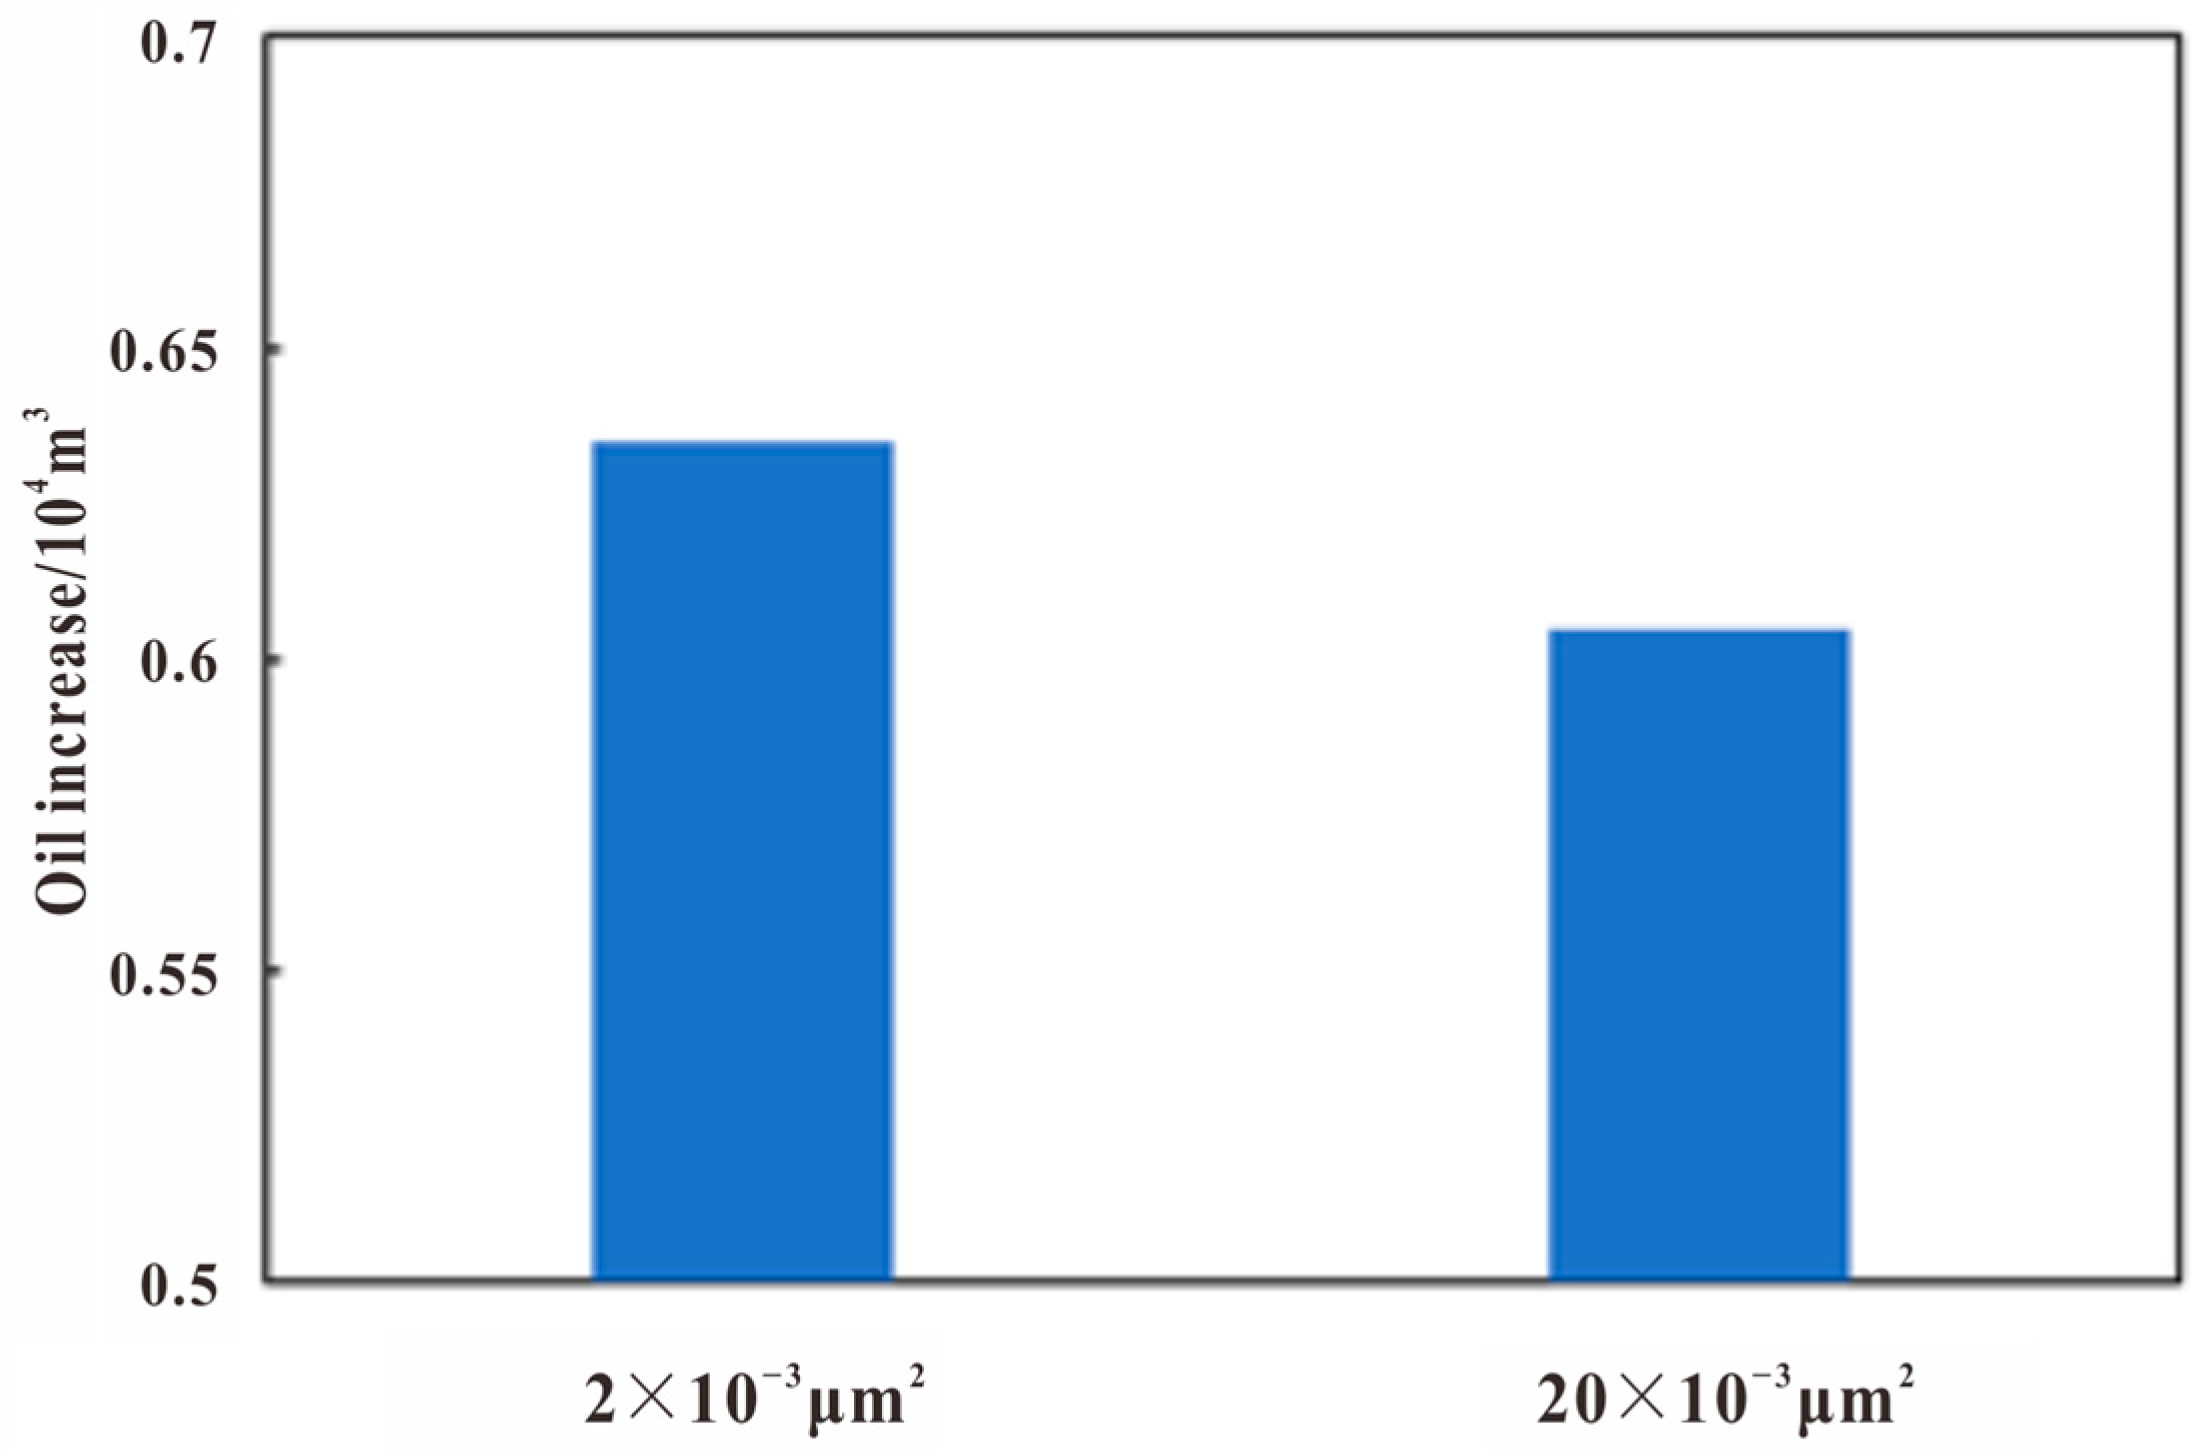
Taking the increase in oil production (the difference between the cumulative oil production of throughput development and the cumulative oil production of depletion development) as a reference indicator, the influence of the SRV region’s fracture network on the throughput development effect is characterized by changing the permeability of the SRV region, thereby demonstrating the applicability of the established fracture network model. The permeability Kf of the SRV renovation area was changed to 2 × 10⁻³ μm2 and 20 × 10−3 μm2, and the throughput development effects were compared under two different permeability sizes, as shown in Figure 9.
It can be seen in Figure 9 that as Kf increases, the oil increase declines and the CO2 stimulation effect weakens. This is because as Kf increases, CO2 gas is prone to gas channeling. At the same time, during the development process, gas will be extracted along the seepage channel, resulting in a less significant stimulation effect. Therefore, the established seam mesh model has a good applicability and can be used in subsequent research.

5. Considering the CO2 Diffusion Effect

The diffusion of gas molecules plays an extremely important role in improving oil recovery during CO2 throughput. Research has shown that the diffusion coefficient affects the dissolution and diffusion time of CO2 in oil. During the CO2 huff and puff process, the injection effect of huff and puff is greatly affected by the CO2 diffusion coefficient, which in turn affects the final recovery degree of crude oil. Therefore, the influence of CO2 molecular diffusion should be properly considered in the model to simulate the CO2 throughput process more effectively and provide a foundation for subsequent research.
The CO2 diffusion coefficient is a complex function of reservoir temperature, pressure, and fluid properties. In some cases, the estimated values obtained using the above equations have significant deviations from experimental data, and research has shown that the diffusion coefficients of specific reservoirs are generally determined experimentally, while the diffusion coefficients of multi-component oil and gas systems are more difficult to determine in this way [30,31,32]. The measured values of some crude oil diffusion coefficients are shown in Table 5, based on comprehensive research in the literature [33,34,35]. In this case, the software can choose to input diffusion coefficients from experimental data or published articles. The reference literature refers to a tight oil reservoir with similar physical parameters, and thus a diffusion coefficient of 500 × 10−9 m2/s can be set.
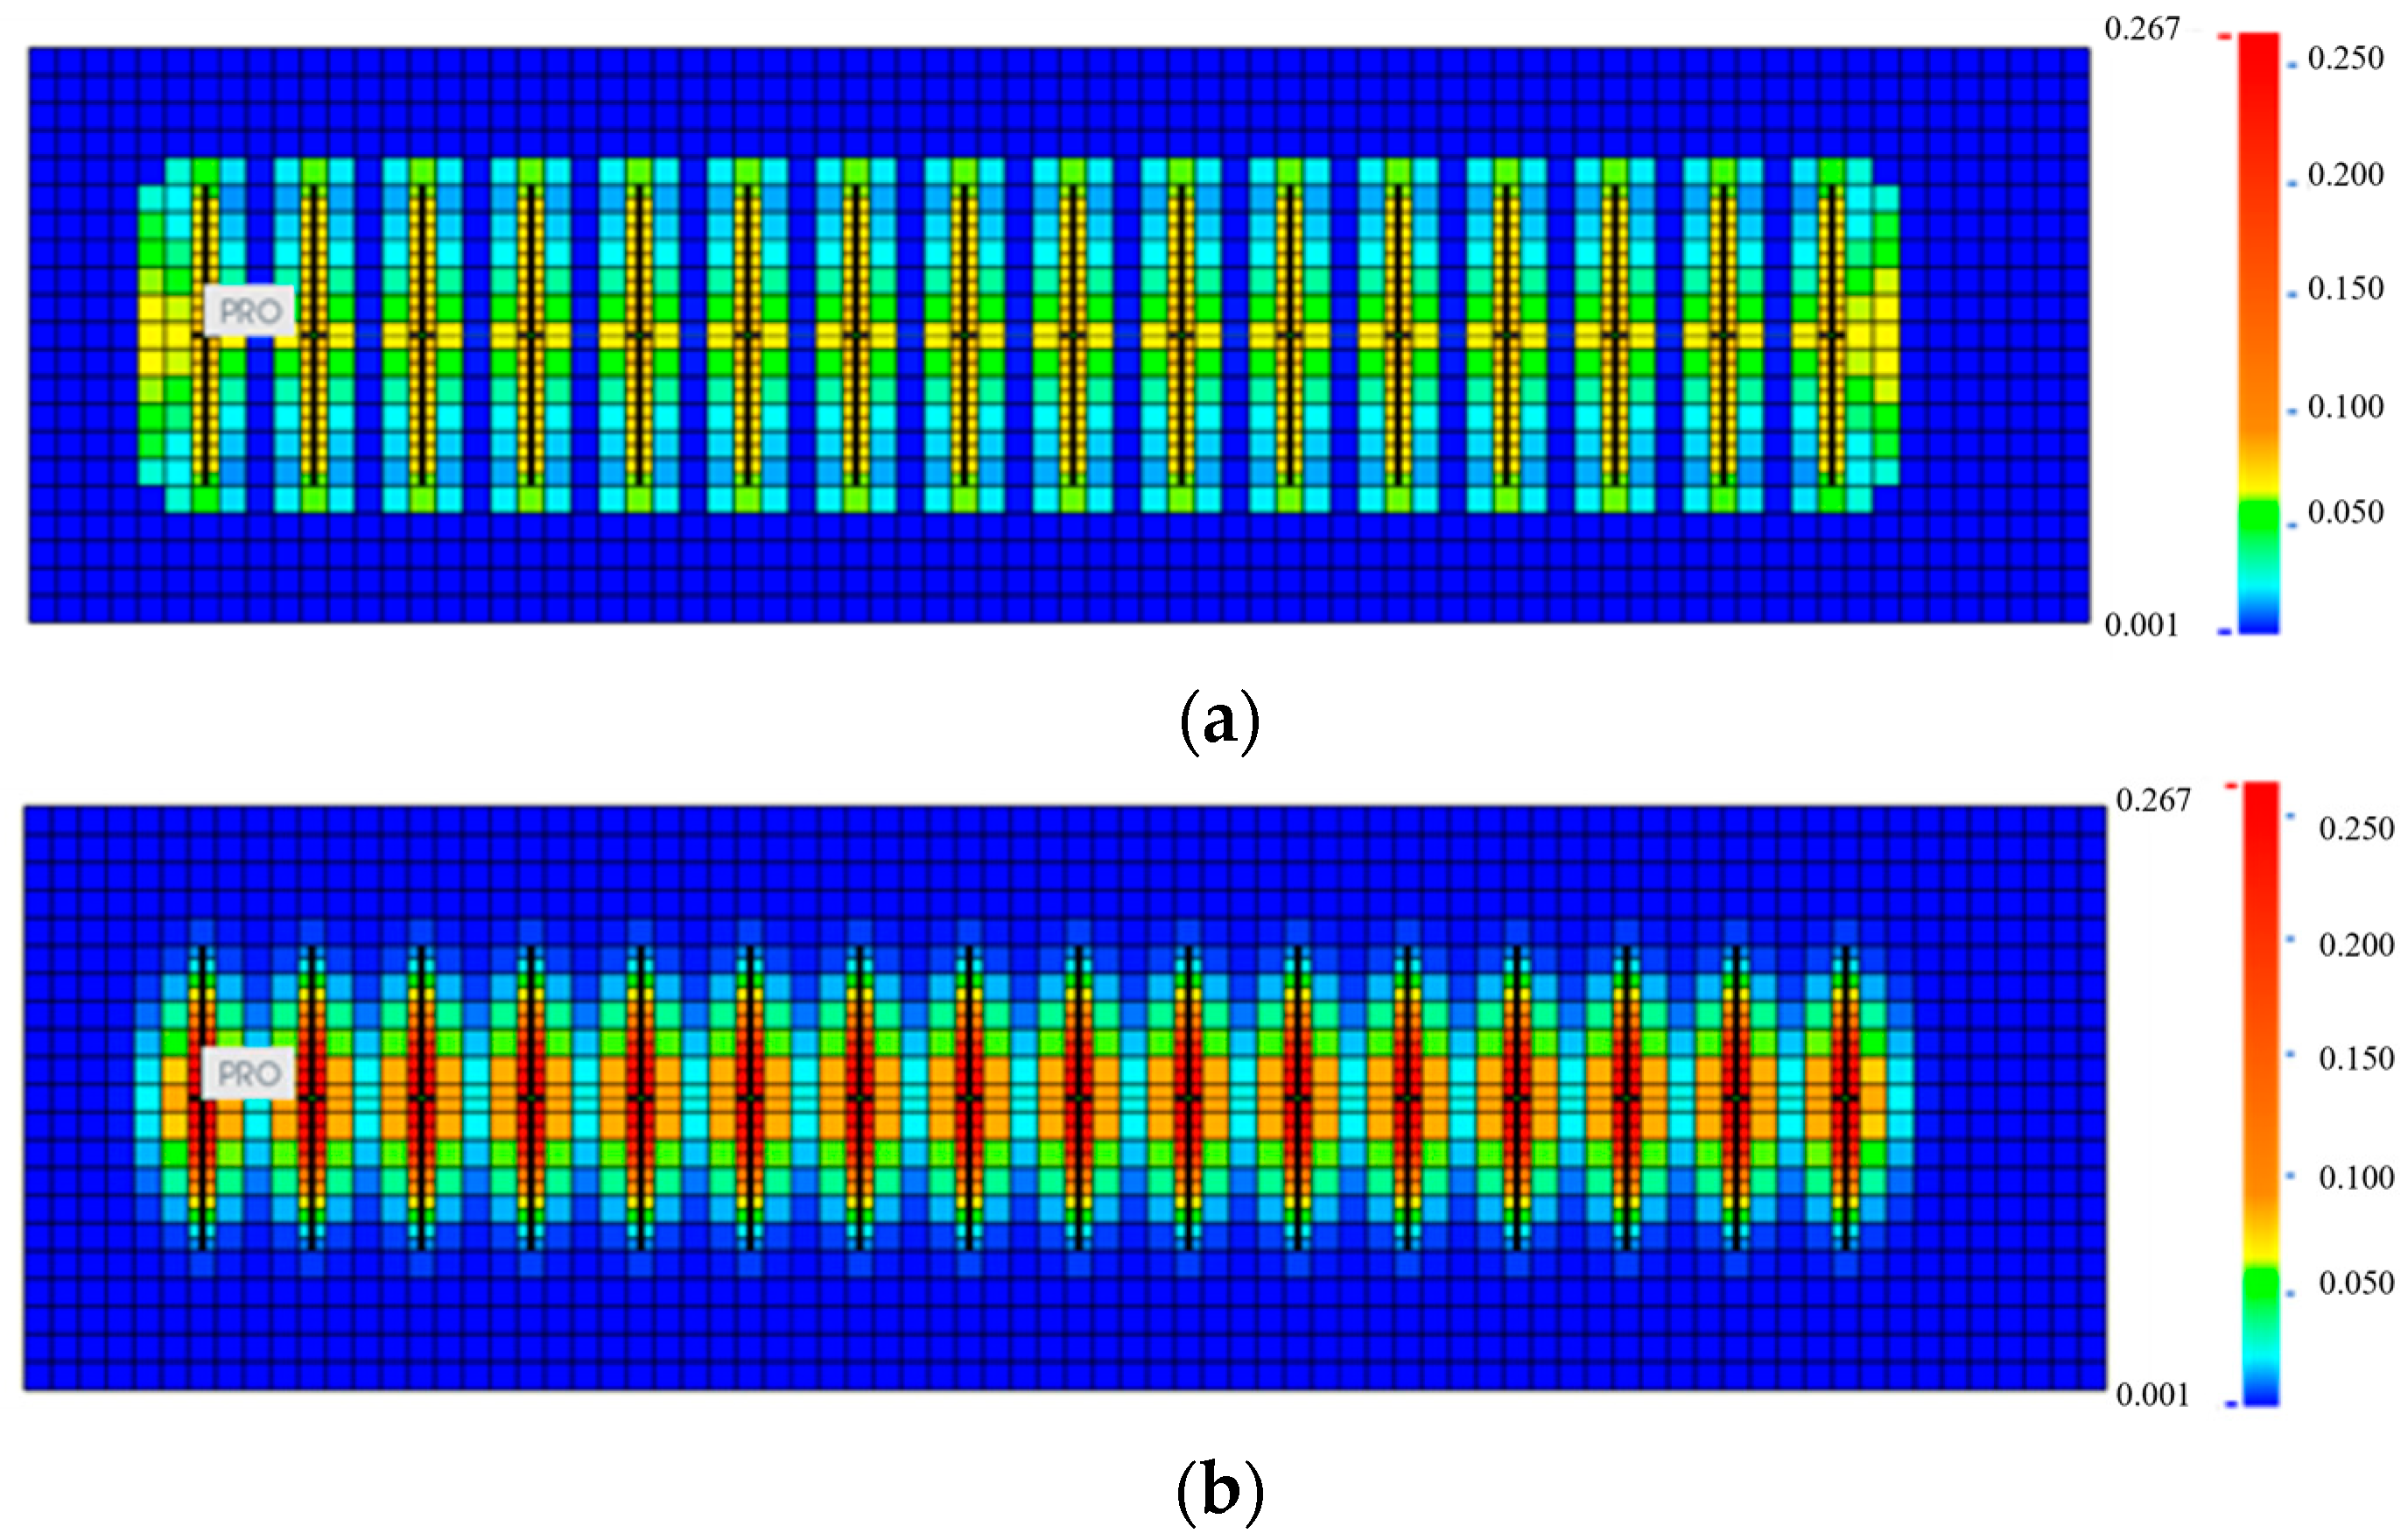
To better reflect the influence of molecular diffusion during the shale oil CO2 huff and puff process, taking the first round of huff and puff as a reference, the CO2 molar fraction fields in the oil phase after gas injection and after the end of the closed well were compared, with and without the consideration of molecular diffusion, as shown in Figure 10 and Figure 11.
Figure 10a represents the variation in the CO2 mole fraction in the oil phase after a gas injection, considering the effect of CO2 diffusion, while Figure 10b represents the variation in the CO2 mole fraction in the oil phase after a gas injection but without considering CO2 diffusion. After gas injection, the extension of the grid considering CO2 diffusion is wider than that without diffusion, and the mole fraction of CO2 in the oil phase, considering diffusion in the corresponding grid, is smaller. This is because at the same gas injection rate, the diffusion-considered CO2 diffuses more into the matrix. Figure 11 represents the variation in the CO2 mole fraction in the oil phase with and without CO2 diffusion consideration after well closure, resulting in a smaller mole fraction of CO2 in the matrix grid near the fracture zone, compared to when CO2 diffusion was not considered, and a wider coverage range.
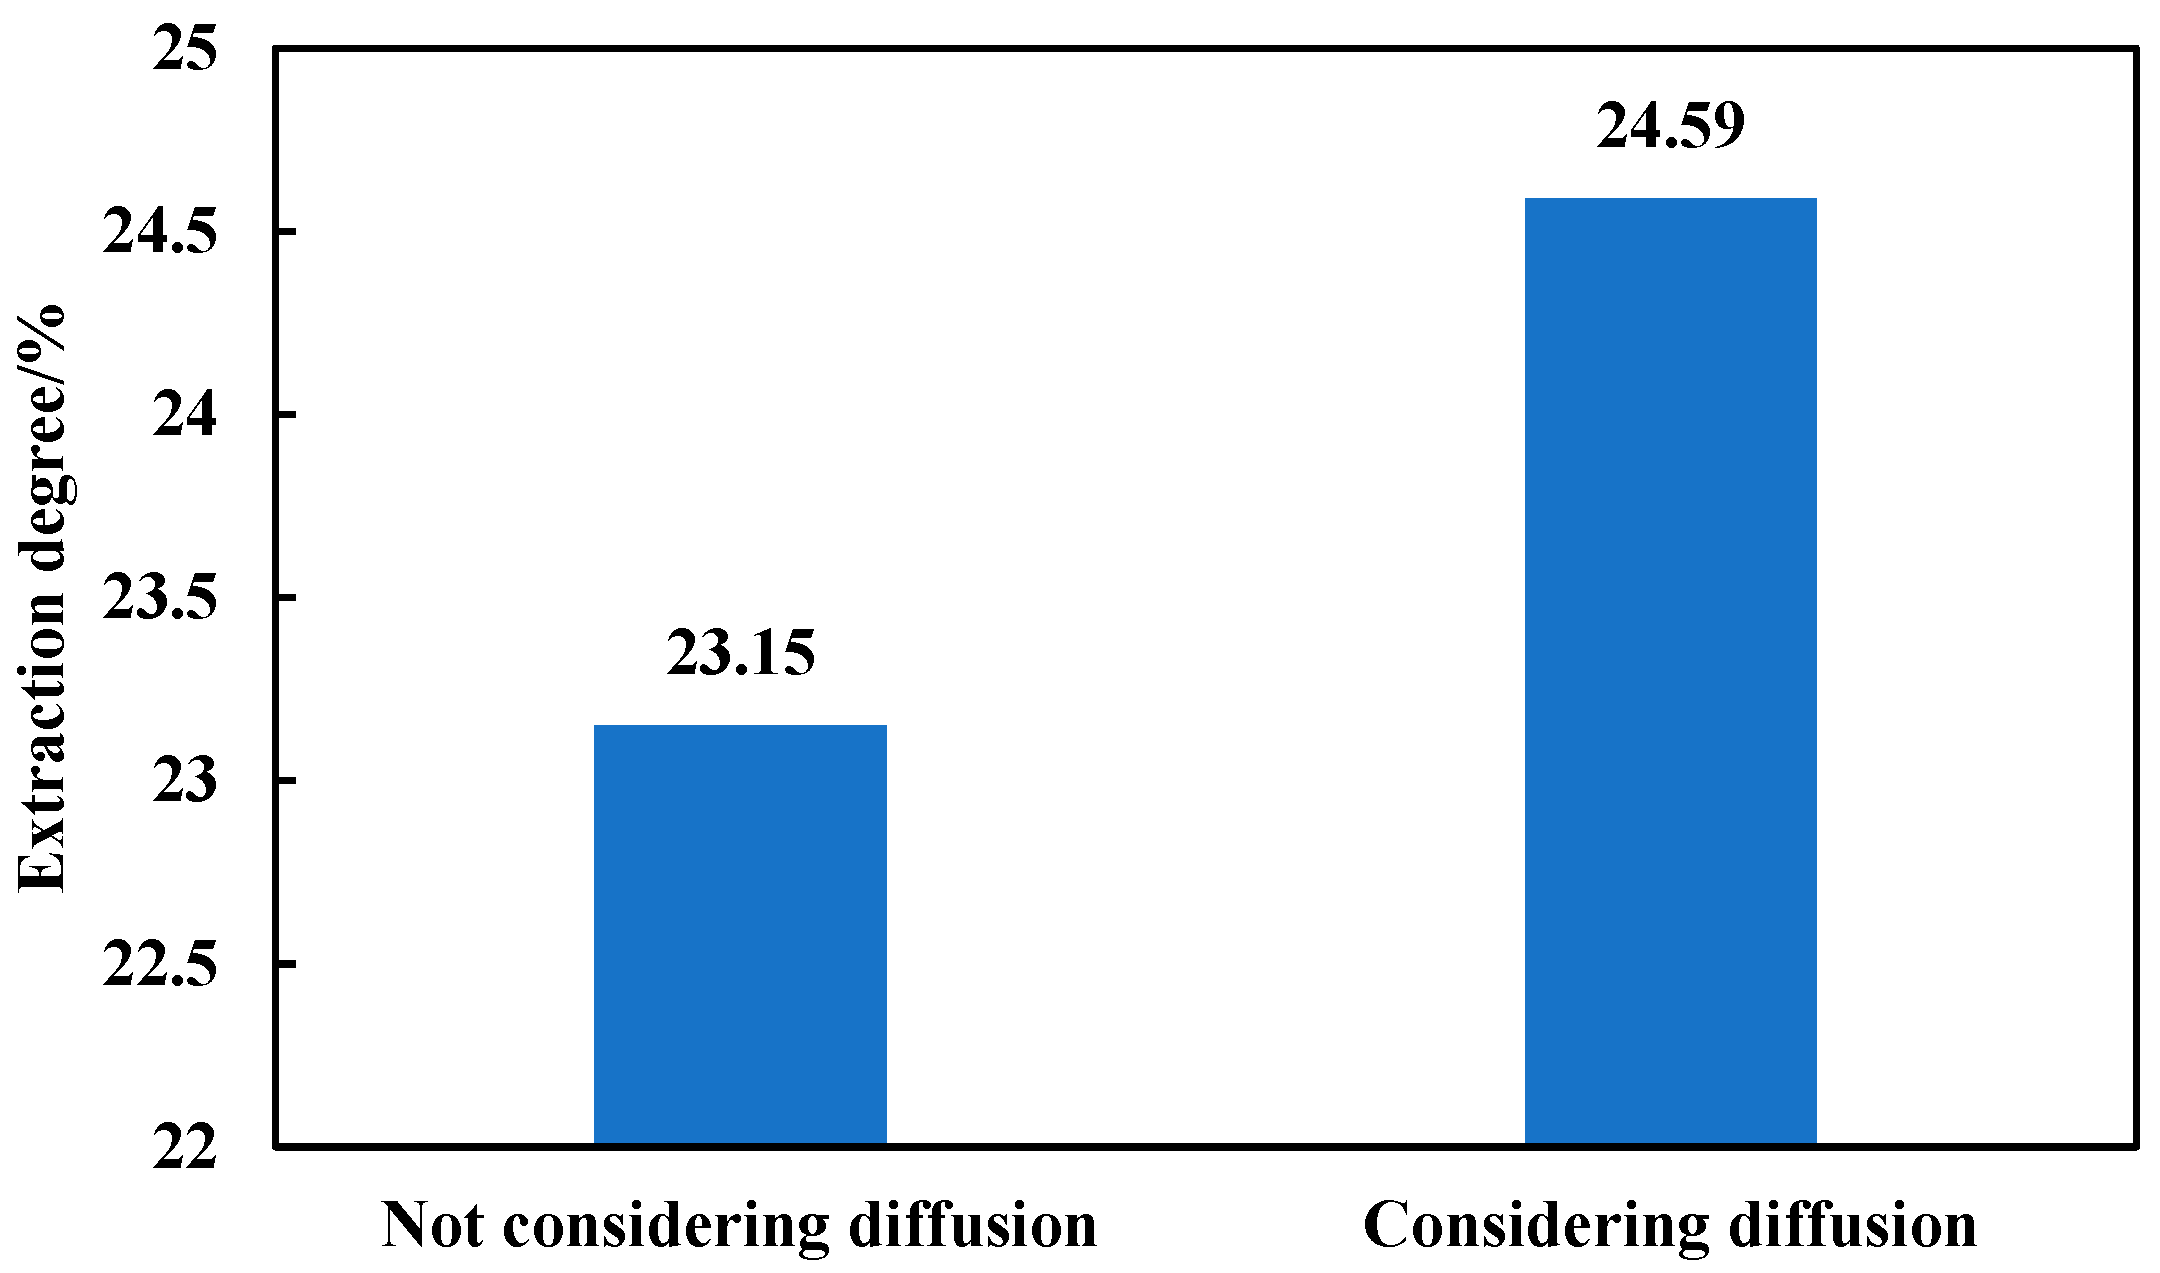
The final recovery degree with and without diffusion consideration is shown in Figure 12. It can be seen from the graph that the recovery rate corresponding to CO2 diffusion is 24.59%, which is 1.44 percentage points higher than that without CO2 diffusion. Therefore, the diffusion effect in CO2 throughput cannot be ignored and is an important mechanism in the simulation process.

6. Adaptability Analysis of Shale Oil CO2 Huff and Puff

In order to explore the development effect of CO2 huff and puff under the coupling effect of Kf/Km and oil saturation, numerical simulation methods were used to study the adaptability limits of CO2 huff and puff development, with the increase in the recovery degree and oil change rate being reference indicators.
The incremental recovery degree is defined as the difference between the recovery degree of huff and puff development and the recovery degree of depletion development. The oil change rate is the ratio of the increased oil amount to the cumulative CO2 injection amount during the huff and puff process. The depletion production time is set to be the same as the actual huff and puff production time [36]. The oil change rate is determined using Equations (5)–(7):
Δ Q = Q 1 Q 2
Δ Q = ρ o Δ Q
R = Δ Q G g
In the equations, Q1 represents the cumulative oil production through throughput, 104 m3; Q2 represents the cumulative oil production due to depletion, 104 m3; △Q represents the oil increase, 104 m3; △Q′ represents the oil increase, 104 t; ρo represents the density of crude oil, taken as 840 kg/m3; Gg represents the cumulative injection amount of CO2, 104 t; and R represents the oil change rate, t/t.

7. Adaptability Analysis of Kf/Km

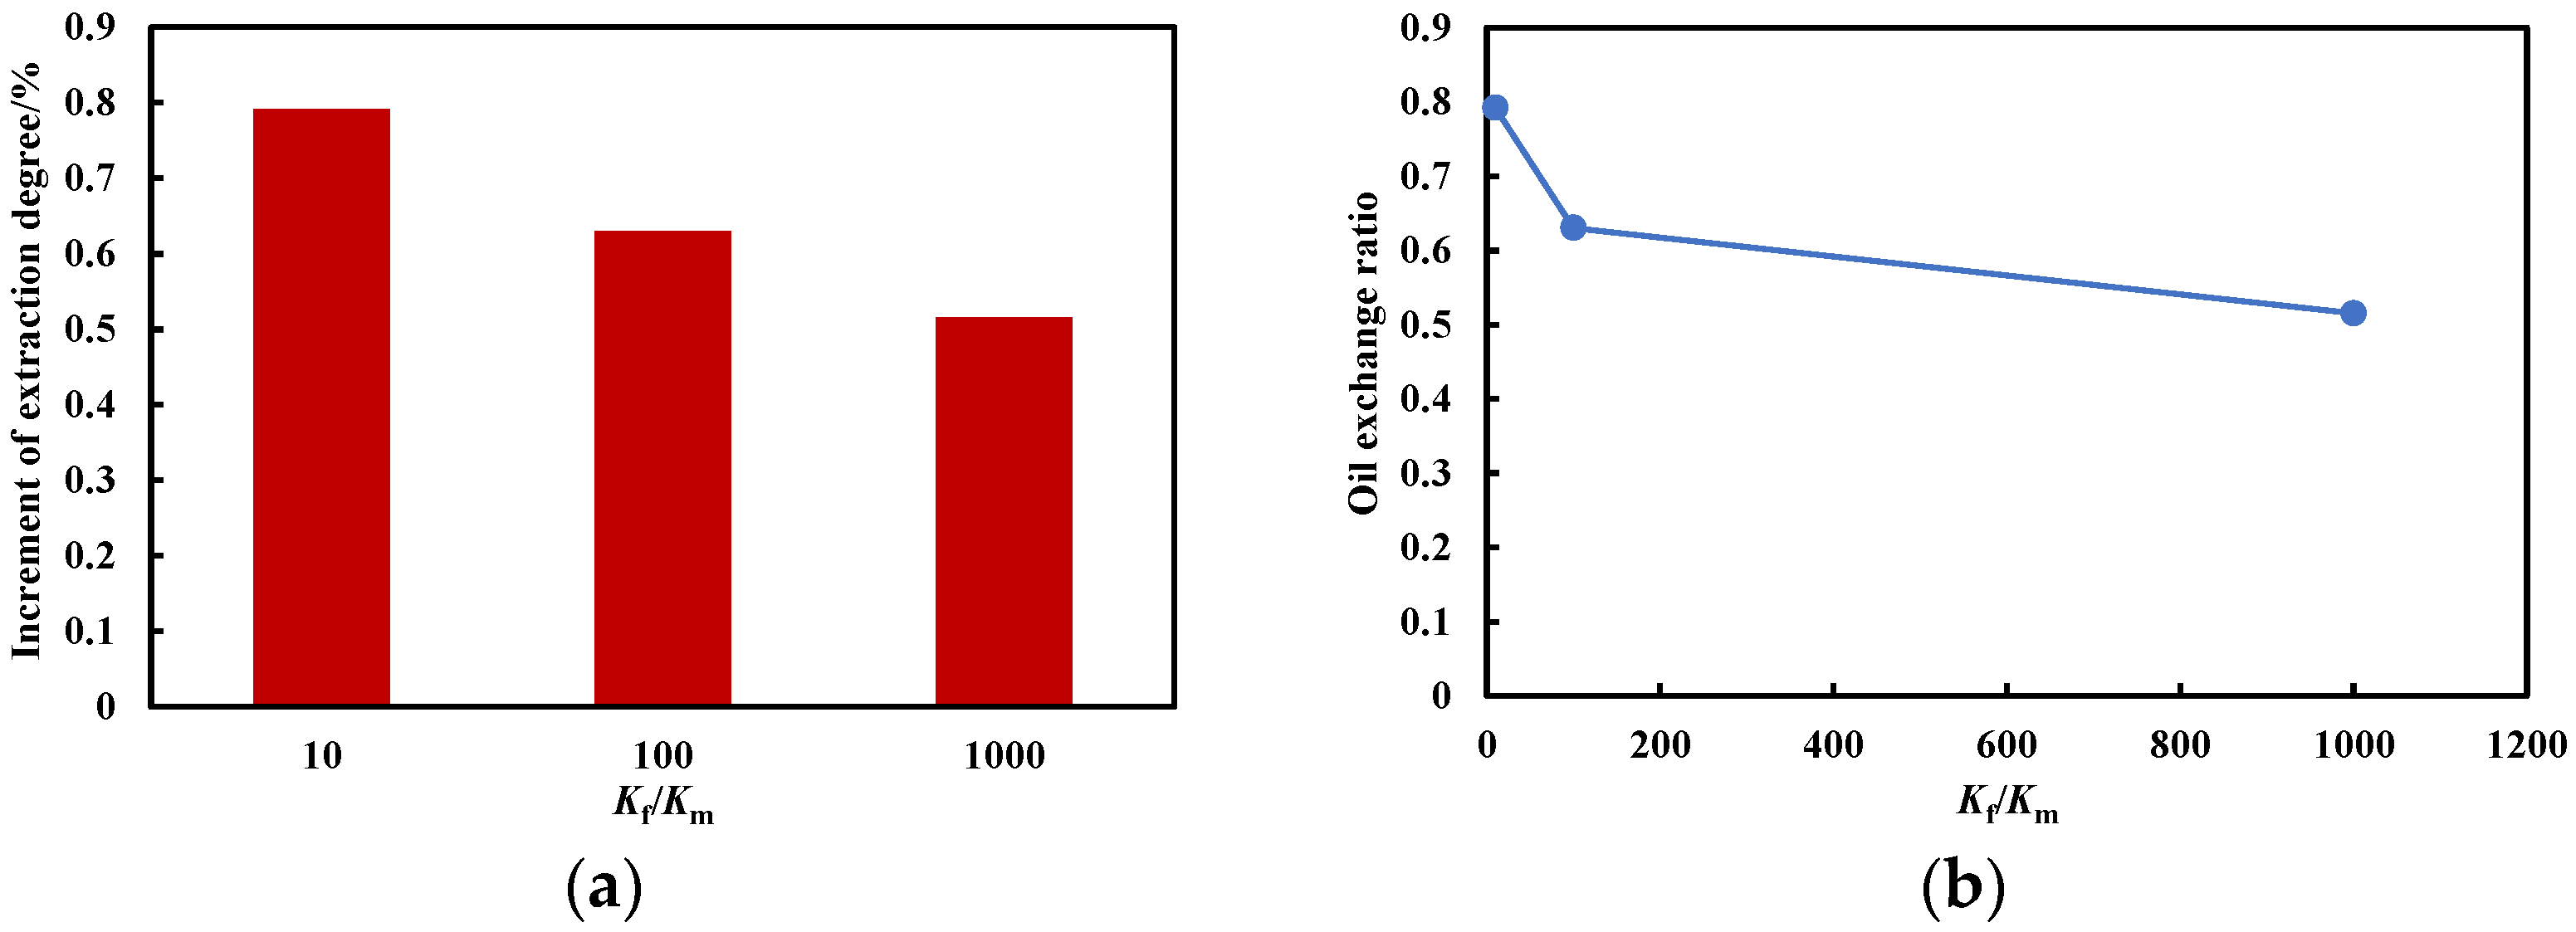
Kf/Km is an important parameter that affects shale oil reservoir development. In order to study the incremental recovery and oil change rate of CO2 huff and puff under different Kf/Km conditions, CO2 huff and puff simulations were conducted by setting Kf/Km to 10, 100, and 1000, respectively, when the oil saturation was 0.6. Using the incremental recovery rate and oil change rate as evaluation indicators for development effectiveness, the development effectiveness under different Kf/Km was compared, and the results are shown in Table 6 and Figure 13.
When the oil saturation is constant, with the increase in Kf/Km, the incremental recovery degree and oil change rate continue to decrease. The decrease in recovery degree is slow, and the oil change rate first increases and then decreases slightly. When Kf/Km is 10, the values of the two indicators reach their maximums, which are 2.2032% and 0.7919, respectively. This is because the larger the Kf/Km, the more prone CO2 gas is to gas channeling during the injection and shut-in stages. At the same time, the higher the Kf/Km, the easier CO2 gas production is, thereby affecting the development effect.

8. Adaptability Analysis of Oil Saturation

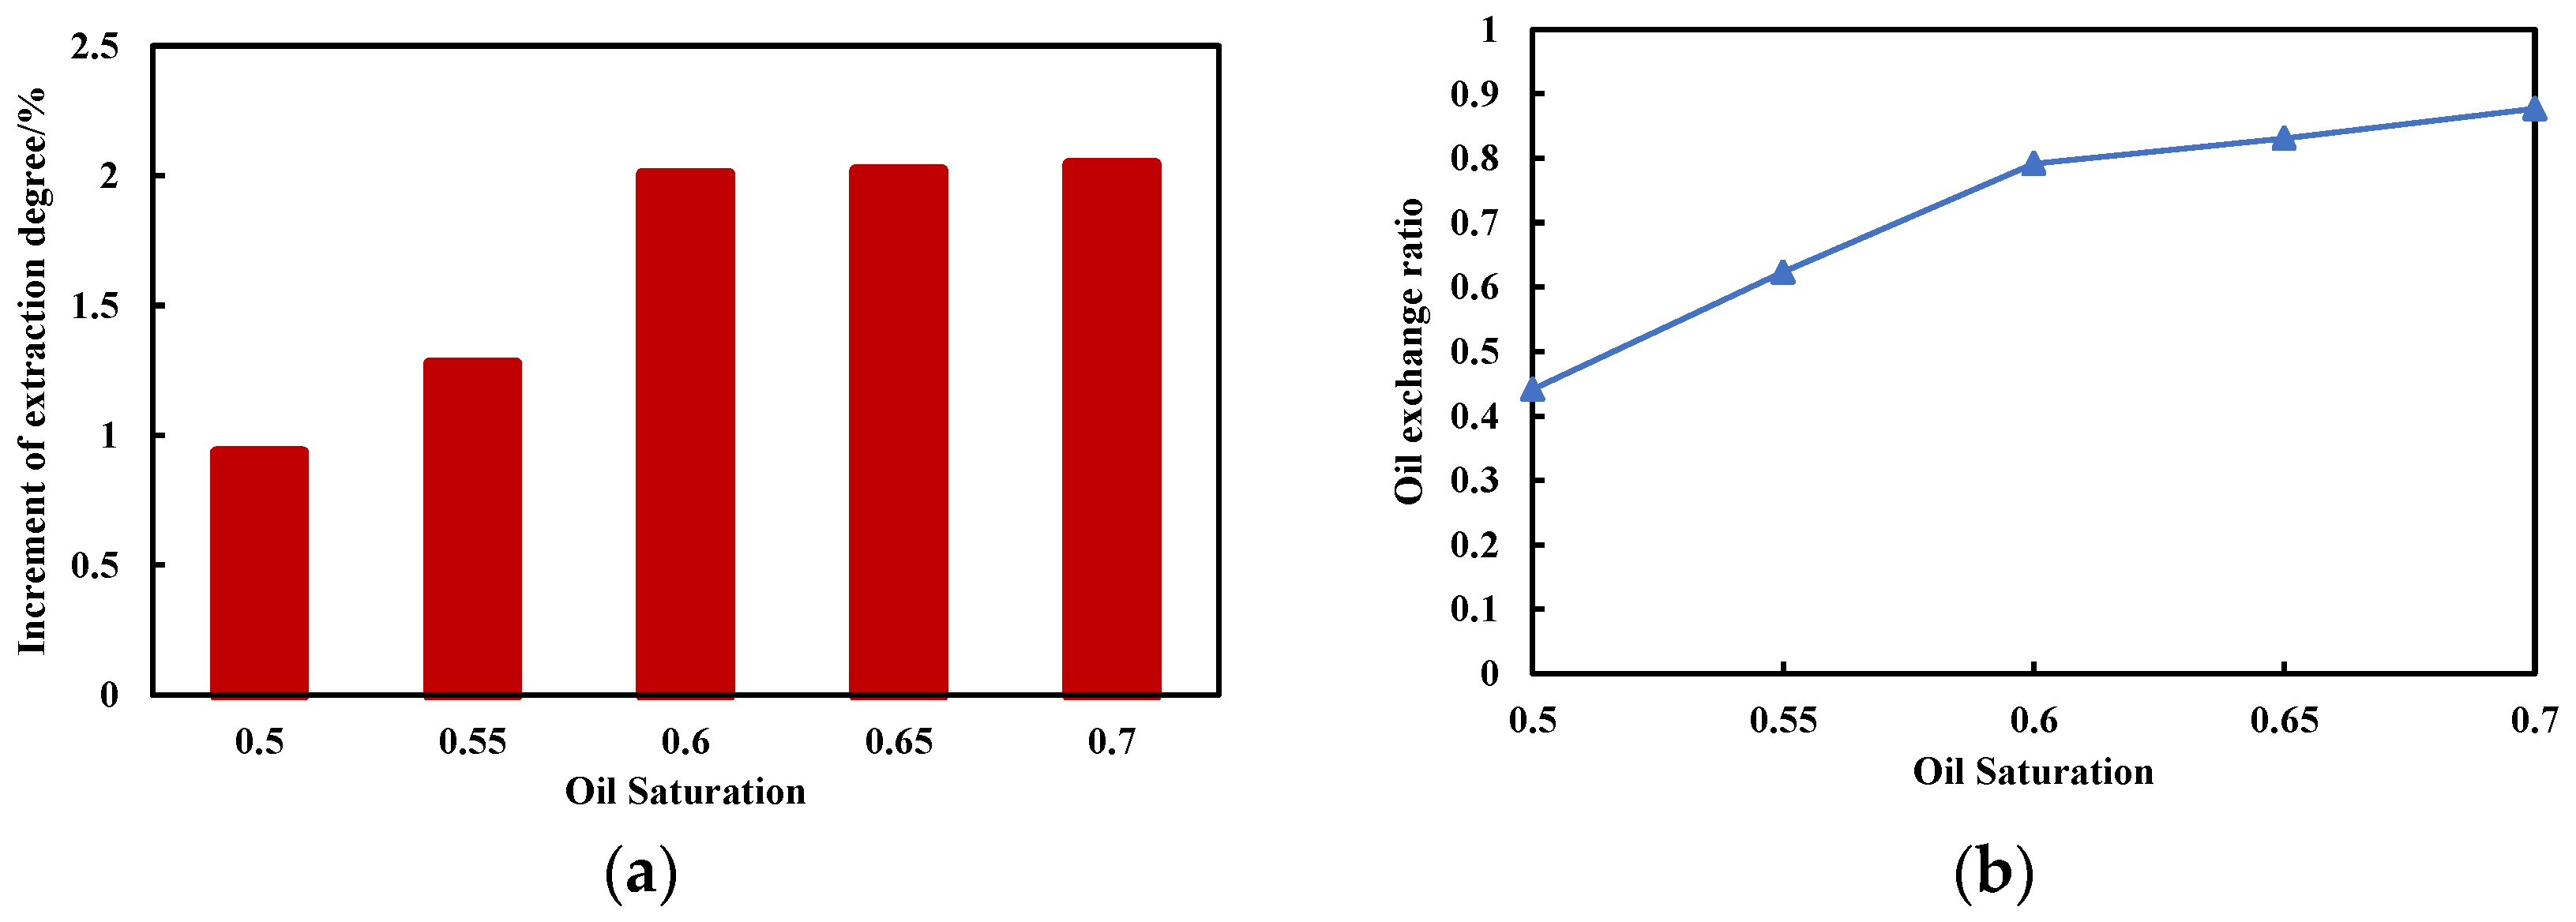
Due to the continuous changes in reservoir oil saturation at different developmental stages, the effectiveness of CO2–oil interactions dynamically varies, resulting in significant development performance differences of reservoirs at different stages [37]. Therefore, in order to study the recovery degree and incremental recovery degree of CO2 huff and puff under different oil saturations, CO2 huff and puff simulations were conducted at oil saturations of 0.5, 0.55, 0.6, 0.65, and 0.7 when Kf/Km was 10. The development effects were compared under different oil saturation levels using incremental recovery and the oil change rate as indicators, and the results are shown in Table 7 and Figure 14.
The development effect curves under different oil saturations are shown above. When Kf/Km is constant, the increase in the recovery degree and oil change rate increases with the increase in oil saturation. However, the amplitude of changes in the two indicators gradually decreases. When the oil saturation is greater than 0.6, the increase in the recovery degree and oil change rate slows down. When the oil saturation is 0.7, the maximum increases in the recovery rate and oil change rate are 2.0413% and 0.8771, respectively.

9. Kf/Km—Oil Saturation Chart Determination

Under different Kf/Km and oil saturation values, the final increase in the recovery degree and oil change rate exhibit different trends. Therefore, to further explore the development effect of CO2 huff and puff under the coupling effect of Kf/Km and oil saturation, a basic model was used to study the Kf/Km oil saturation adaptability of CO2 huff and puff and to determine the adaptability limit. Using the incremental recovery degree and oil change rate as reference standards, when the oil saturations are 0.5, 0.55, 0.6, 0.65, and 0.7, Kf/Km is selected to be 10, 100, and 1000 for CO2 huff and puff simulation experiments. Then, simulation experiments are conducted to obtain the data points of the recovery degree increment and oil change rate under different schemes. By creating contour maps, the Kf/Km oil saturation adaptability chart is obtained, as shown in Figure 15.
It can be seen from the Kf/KmSo chart that with the increase in oil saturation and Kf/Km, the increase in the recovery degree and oil change rate both increase, and there is no inflection point in the chart. Overall, the better the physical properties of the reservoir and the permeability of the transformed area, the better the development effect of shale oil CO2 huff and puff. From the perspective of the oil increase effect, when Kf/Km is 1000 and the increase in CO2 huff and puff recovery reaches 1.5%, the lower limit of oil saturation is 0.54. When Kf/Km is 1000 and the increase in the CO2 recovery rate reaches 2%, the lower limit of oil saturation is 0.57. From the perspective of the oil change effect, when the oil saturation is 0.5 and the CO2 huff and puff oil change rate reaches 0.3, the lower limit of Kf/Km is 700. Finally, when the oil saturation is 0.548 and the CO2 huff and puff oil change rate reaches 0.6, the lower limit of Kf/Km is 10. The adaptability limits under different Kf/Km and oil saturation values can be determined through the CO2 huff and puff Kf/KmSo chart, which can provide a reference for shale oil CO2 huff and puff development.

10. Conclusions

A carbon dioxide huff and puff model for shale oil horizontal wells was established based on typical shale oil samples and reservoir physical parameters, and an adaptive evaluation of the development effect of CO2 huff and puff in horizontal wells was conducted. The following conclusions were obtained:
(1)
By correcting the critical parameter of the average pore throat radius and using the fluid pT phase diagram shift to reflect the nanoconfinement effect, it was found that the corrected pT phase diagram shifts upwards, causing an increase in bubble point pressure, and thus affecting the properties of each component in crude oil.
(2)
By comparing the cases of CO2 diffusion coefficient consideration and non-consideration, it was found that during the injection and shut-in stages, the CO2 content and recovery degree in the oil phase of the matrix corresponding to CO2 diffusion were high.
(3)
Taking the incremental recovery rate and oil change rate as references, the development effect of CO2 huff and puff under the coupling effect of Kf/Km and oil saturation was explored, and K–So charts under different Kf/Km and oil saturation values were obtained. The chart results show that when Kf/Km is 1000 and the increases in the CO2 recovery rate reach 1.5% and 2%, the lower limits of oil saturation are 0.54 and 0.57%, respectively. When the oil saturation is 0.5 and the CO2 huff and puff oil change rate reaches 0.3, the lower limit of Kf/Km is 700. Finally, when the oil saturation is 0.548 and the CO2 huff and puff oil change rate reaches 0.6, the lower limit of Kf/Km is 10.

Author Contributions

Conceptualization, F.Z.; methodology, F.Z.; validation, M.L.; formal analysis, Y.W.; investigation, S.H.; data curation, Y.W.; writing—original draft preparation, Y.W.; writing—review and editing, M.L. and C.Y.; visualization, C.Y.; supervision, S.H. All authors have read and agreed to the published version of the manuscript.

Funding

This research was funded by the National Natural Science Foundation of China (NO. 52174039) and China Petroleum Strategic Cooperation Technology Special Project (NO. ZLZX2020–02–04).

Data Availability Statement

Data are contained within the article.

Conflicts of Interest

Author Yu Wang was employed by the company Changqing Oilfield Branch No. 1 Oil Production Plant. The remaining authors declare that the research was conducted in the absence of any commercial or financial relationships that could be construed as a potential conflict of interest.

References

  1. Zhang, X.; Li, K.; Ma, Q.; Fan, J. Position and prospect of CCUS technology development under carbon neutrality. China Popul. Resour. Environ. 2021, 31, 29–33. [Google Scholar]
  2. Hu, Y.; Hao, M.; Chen, G.; Sun, R.; Li, S. Technology and practice of CO2 flooding and storage in China. Pet. Explor. Dev. 2019, 46, 716–727. [Google Scholar] [CrossRef]
  3. Yang, Y. Research and practice of CO2 flooding technology for ultra-low permeability reservoirs in Shengli Oilfield. Pet. Geol. Recovery Effic. 2020, 27, 11–19. [Google Scholar]
  4. Li, D.; Saraji, S.; Jiao, Z.; Zhang, Y. CO2 injection strategies for enhanced oil recovery and geological sequestration in a tight reservoir: An experimental study. Fuel 2021, 284, 119013. [Google Scholar] [CrossRef]
  5. Huang, X.; Gu, L.; Li, S.; Du, Y.; Liu, Y. Absolute adsorption of light hydrocarbons on organic–rich shale: An efficient determination method. Fuel 2022, 308, 121998. [Google Scholar] [CrossRef]
  6. Zeng, T.; Miller, C.S.; Mohanty, K.K. Combination of a chemical blend with CO2 huff-n-puff for enhanced oil recovery in oil shales. J. Pet. Sci. Eng. 2020, 194, 107546. [Google Scholar] [CrossRef]
  7. Zhao, P.; Gray, K.E. Finite discrete-element modeling of multifracture propagation in fractured reservoirs. J. Pet. Sci. Eng. 2021, 208, 109229. [Google Scholar] [CrossRef]
  8. Wang, H. Hydraulic fracture propagation in natural fractured reservoirs complex fracture or fracture networks. J. Nat. Gas Sci. Eng. 2019, 68, 102911. [Google Scholar] [CrossRef]
  9. Zhang, F.; Dontsov, E. Modeling hydraulic fracture propagation and proppant transport in a two-layer formation with stress drop. Eng. Fract. Mech. 2018, 199, 705–720. [Google Scholar] [CrossRef]
  10. Deng, B.; Yin, G.; Li, M.; Zhang, D.; Lu, J.; Liu, Y.; Chen, J. Feature of fractures induced by hydrofracturing treatment using water and L-CO2 as fracturing fluids in laboratory experiments. Fuel 2018, 226, 35–46. [Google Scholar] [CrossRef]
  11. Jin, L.; Hawthorne, S.; Sorensen, J.; Pekot, L.; Kurz, B.; Smith, S.; Heebink, L.; Bosshart, N.; Torres, J.; Dalkhaa, C.; et al. Extraction of oil from the Bakken shales with supercritical CO2. In Proceedings of the SPE/AAPG/SEG Unconventional Resources Technology Conference, Austin, TX, USA, 24–26 July 2017. [Google Scholar]
  12. Tovar, F.D.; Barrufet, M.A.; Schechter, D.S. Gas injection for EOR in organic rich shale. part i: Operational philosophy. In Proceedings of the SPE Improved Oil Recovery Conference, Oklahoma City, OK, USA, 14–18 April 2018. [Google Scholar]
  13. Gamadi, T.D.; Elldakli, F.; Sheng, J.J. Compositional simulation evaluation of EOR potential in shale oil reservoirs by cyclic natural gas injection. In Proceedings of the SPE/AAPG/SEG Unconventional Resources Technology Conference, OnePetro, Denver, CO, USA, 25–27 August 2014. [Google Scholar]
  14. Chen, C.; Balhoff, M.; Mohanty, K.K. Effect of reservoir heterogeneity on primary recovery and CO2 huff-n-puff recovery in shale-oil reservoirs. SPE Reserv. Eval. Eng. 2014, 17, 404–413. [Google Scholar] [CrossRef]
  15. Orozco, D.; Fragoso, A.; Selvan, K.; Noble, G.; Aguilera, R. Eagle ford huff-n-puff gas-injection pilot: Comparison of reservoir-simulation, material balance, and real performance of the pilot well. SPE Reserv. Eval. Eng. 2020, 23, 247–260. [Google Scholar] [CrossRef]
  16. Lu, J.; Wang, X.; He, Y.; Yang, C.; Deng, N. Diagenesis and pore evolution of tight sandstone of Chang 7 oil-bearing formation in Fuxian area, Ordos Basin. J. Northeast Pet. Univ. 2017, 41, 9–20. [Google Scholar]
  17. Li, Z.; Qu, X.; Liu, W.; Lei, Q.; Sun, H.; He, Y. Discussion on reasonable development mode of tight oil in Chang 7 member of Ordos Basin. Pet. Explor. Dev. 2015, 42, 217–221. [Google Scholar] [CrossRef]
  18. Li, Y.; Shang, Y.; Yang, P. Modeling fracture connectivity in naturally fractured reservoirs: A case study in the Yanchang Formation, Ordos Basin, China. Fuel 2018, 211, 789–796. [Google Scholar] [CrossRef]
  19. Zhou, X.; Zhang, L.; Fan, K. Current status and progress in research on fracture prediction of low permeability reservoirs in oil and gas basins. Geol. Rev. 2006, 52, 777–782. [Google Scholar]
  20. Nojabaei, B.; John, R.T.; Chu, L. Effect of capillary pressure on fluid density and phase behavior in tight rocks and shales. In Proceedings of the SPE 159258, SPE Annual Technical Conference and Exhibition, San Antonio, TX, USA, 8–10 October 2012. [Google Scholar]
  21. Barsotti, E.; Tan, S.P.; Saraji, S.; Piri, M.; Chen, J.H. A review on capillary condensation in nanoporous media: Implications for hydrocarbon recovery from tight reservoirs. Fuel 2016, 184, 344–361. [Google Scholar] [CrossRef]
  22. Pitakbunkate, T.; Balbuena, P.B.; Moridis, G.J.; Blasingame, T.A. Effect of confinement on pressure/volume/temperature properties of hydrocarbons in shale reservoirs. SPE J. 2016, 21, 621–634. [Google Scholar] [CrossRef]
  23. Li, L.; Su, Y.; Sheng, J.J.; Hao, Y.; Wang, W.; Lv, Y.; Zhao, Q.; Wang, H. Experimental and numerical study on CO2 sweep volume during CO2 huff-n-puff enhanced oil recovery process in shale oil reservoirs. Energy Fuels 2019, 33, 4017–4032. [Google Scholar] [CrossRef]
  24. Lee, J.H.; Lee, K.S. Investigation of asphaltene-derived formation damage and nano-confinement on the performance of CO2 huff-n-puff in shale oil reservoirs. J. Pet. Sci. Eng. 2019, 182, 106–304. [Google Scholar] [CrossRef]
  25. Zarragoicoechea, G.J.; Kuz, V.A. Critical shift of a confined fluid in a nanopore. Fluid Phase Equilibria 2004, 220, 7–9. [Google Scholar] [CrossRef]
  26. Fu, J.; Guo, W.; Li, S.; Liu, X.; Cheng, D.; Zhou, X. Characteristics and exploration potential of multi type Shale oil in Chang 7 Member of Ordos Basin. Nat. Gas Geosci. 2021, 32, 1749–1761. [Google Scholar]
  27. Zhang, L.; Liu, S.; Yong, R.; Li, B.; Zhao, Y.L. Numerical simulation of staged fracturing horizontal wells in tight reservoirs based on EDFM. J. Southwest Pet. Univ. 2019, 41, 1–11. [Google Scholar]
  28. Zhu, D.; Hu, Y.; Cui, M.; Chen, Y.; Liang, C.; Cai, W.; He, Y.; Wang, X.; Chen, H.; Li, X. Coupling local grid refinement with embedded discrete fracture model to predict the production capacity of fracturing renovation wells. Pet. Explor. Dev. 2020, 47, 341–348. [Google Scholar] [CrossRef]
  29. Zhang, D. Research on the method for determining the economic limit production of CO2 flooding. China Sci. Technol. Inf. 2016, 8, 122–123. [Google Scholar]
  30. Yuan, Z.; Yang, S.; Zhang, Z.; Wang, M.; Zhang, X. Adaptability evaluation and law simulation of CO2 injection huff and puff in ultra-low permeability reservoirs. Unconv. Oil Gas 2022, 9, 85–92. [Google Scholar]
  31. Ding, Z.; Dong, P.; Yang, X.; Ding, D.; Zuo, W.; Pan, H. Numerical simulation of CO2 miscible flooding in fractured reservoirs considering Molecular diffusion. Block Oil Gas Field 2015, 22, 245–250. [Google Scholar]
  32. Jiang, J.; Liu, Q.; Wang, J. Calculation method of effective action radius of carbon dioxide huff and puff in tight reservoir. Sci. Technol. Eng. 2020, 20, 2216–2222. [Google Scholar]
  33. Luo, Y.; Sun, L.; Wu, Z.; Zhao, X.; Xiao, H. A CO2 huff and puff productivity prediction model for horizontal wells in tight reservoirs based on diffusion coefficient changes. Sci. Technol. Eng. 2021, 21, 3588–3594. [Google Scholar]
  34. Li, D.; Hou, J.; Zhao, F.; Wang, S.; Yue, X. Study on molecular diffusion coefficient and solubility of carbon dioxide in crude oil. Oilfield Chem. 2009, 26, 405–408. [Google Scholar]
  35. Du, F.; Nojabaei, B. Estimating diffusion coefficients of shale oil, gas, and condensate with nano-confinement effect. J. Pet. Sci. Eng. 2020, 193, 107–362. [Google Scholar] [CrossRef]
  36. Han, W. Study on CO2 Huff and Puff Effect of Fractured Horizontal Wells in Tight Oil Reservoir. Master’s Thesis, China University of Petroleum, Beijing, China, 2018. [Google Scholar]
  37. Yang, X. Optimization of Numerical Simulation Parameters of Shale Oil CO2 Huff and Puff. Master’s Thesis, China University of Petroleum, Beijing, China, 2021. [Google Scholar]
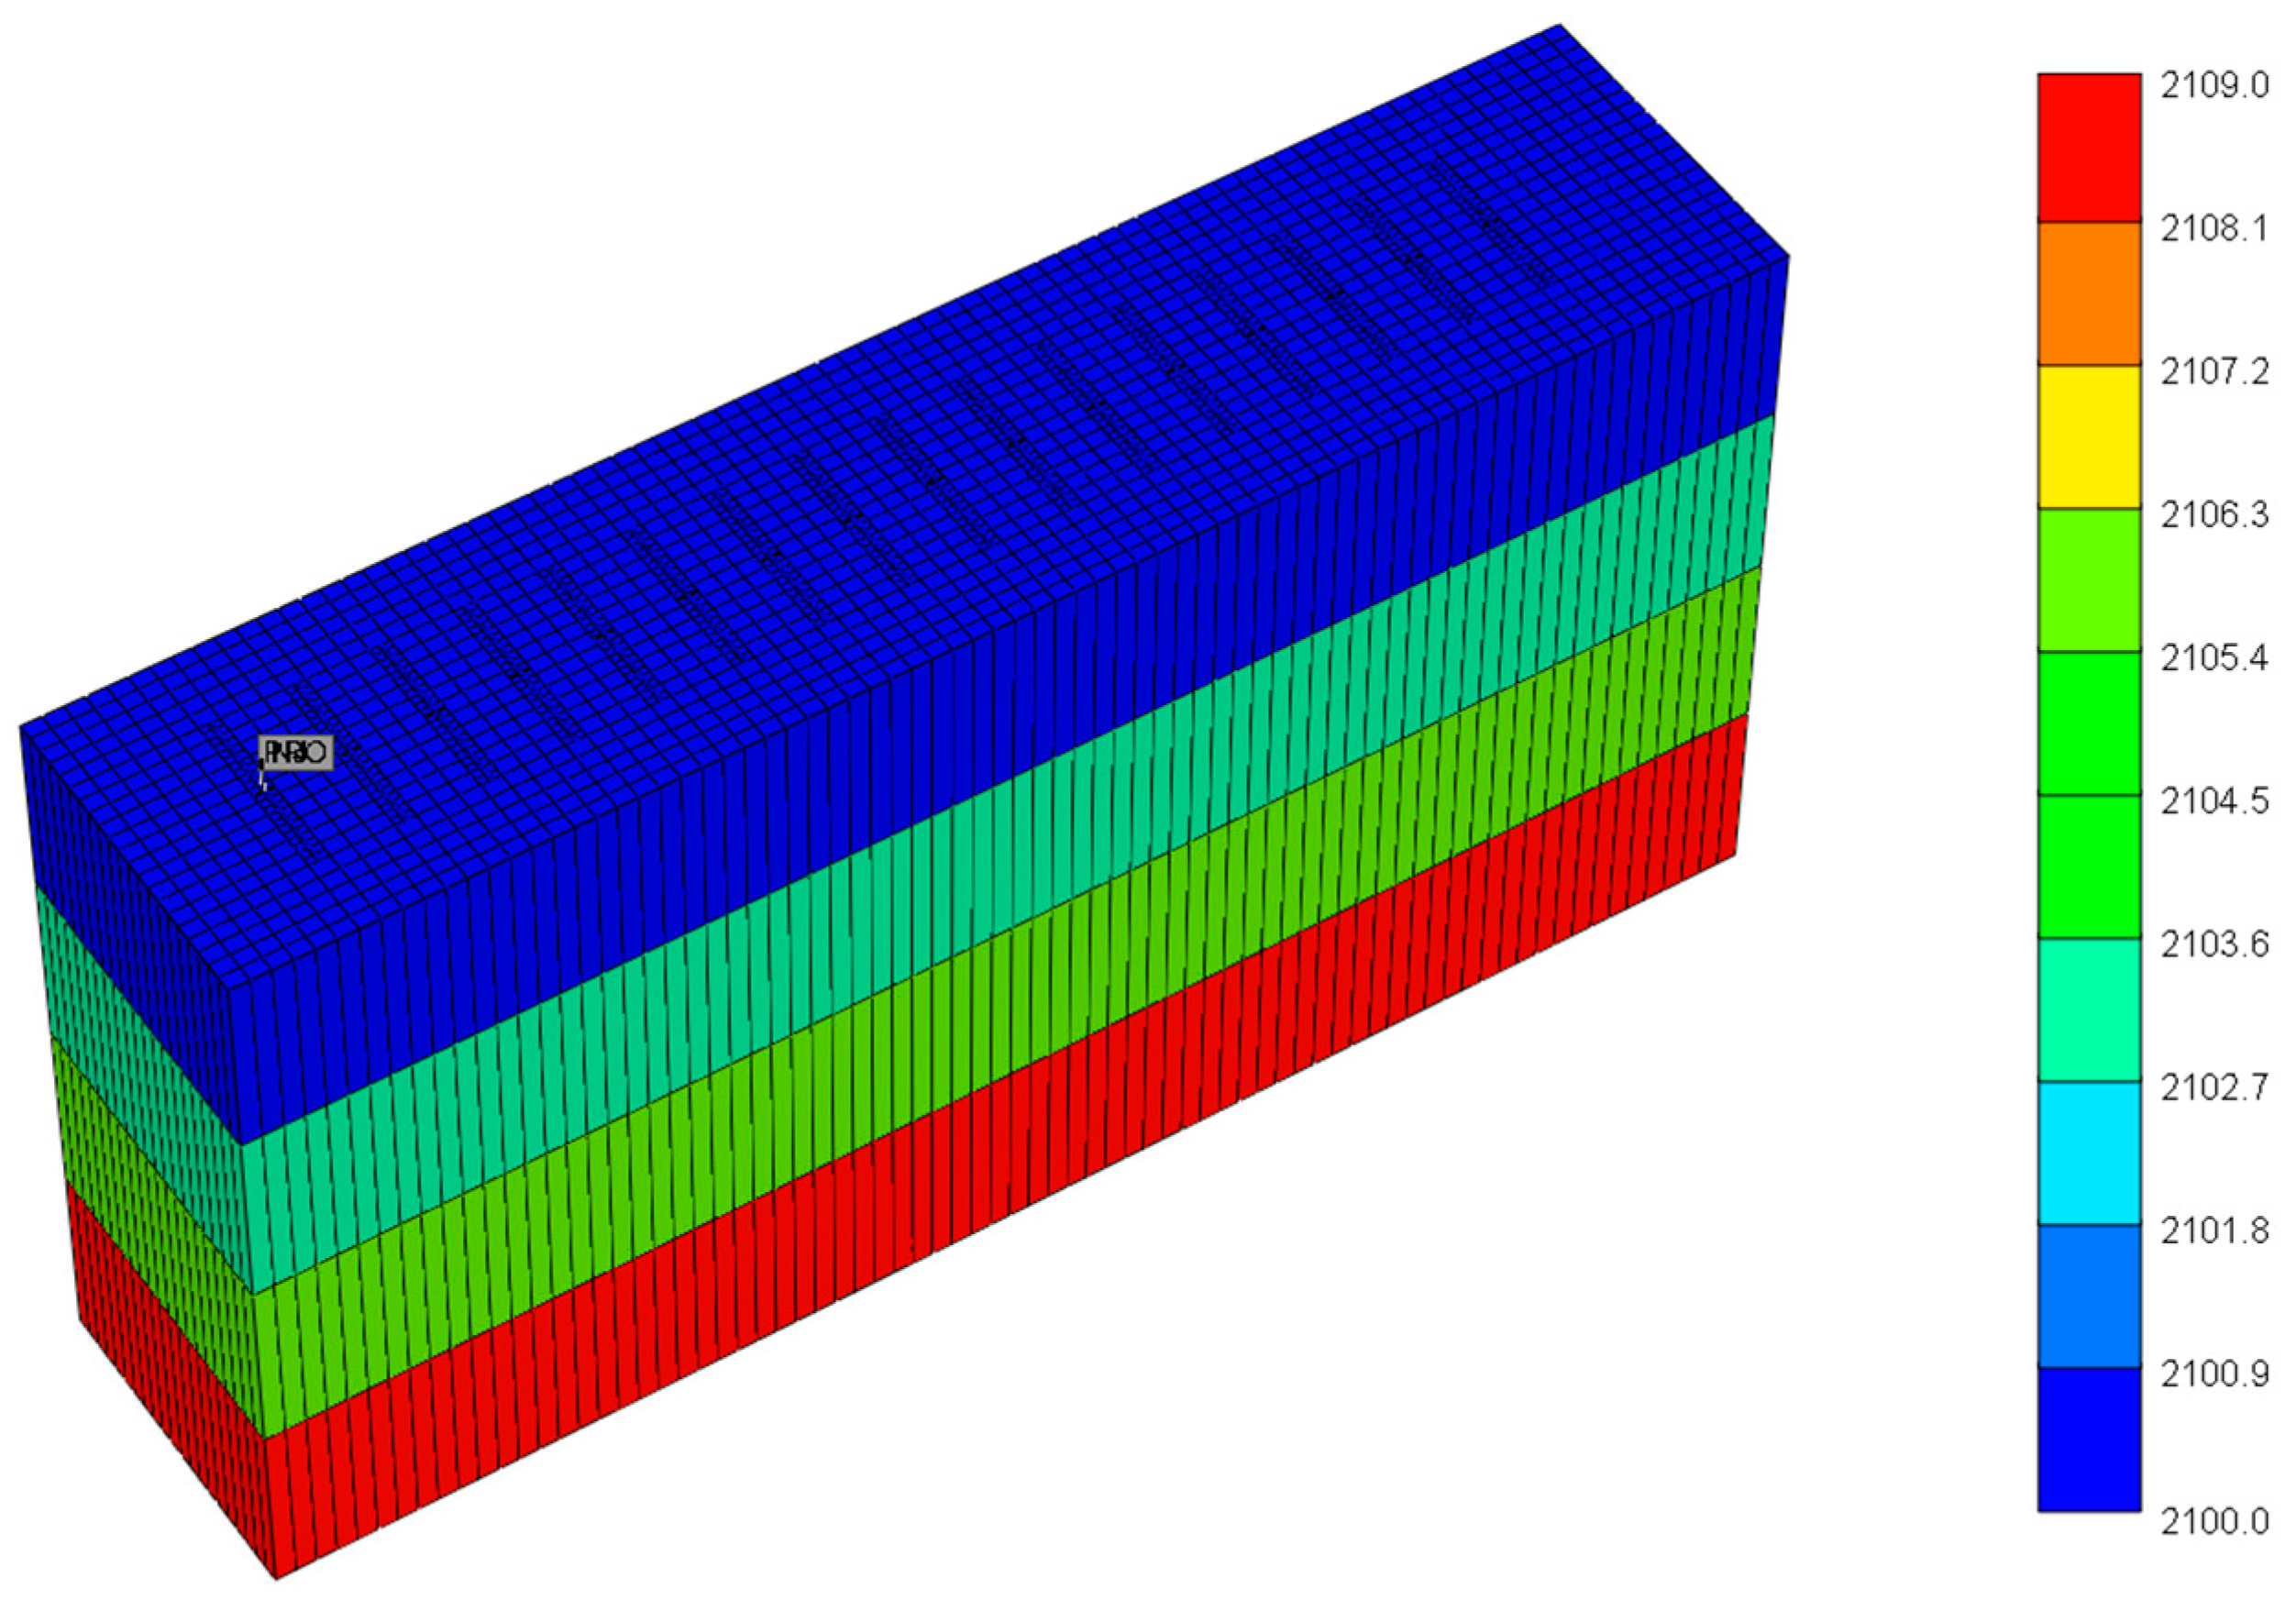
Figure 1. CO2 huff and puff model of shale oil.
Energies 17 00454 g001
Figure 2. CO2 mole fraction in oil phase aftersoaking: (a) 4 layers; and (b) 12 layers.
Energies 17 00454 g002
Figure 3. Relative permeability curve: (a) oil water relative permeability curve; and (b) oil gas relative permeability curve.
Energies 17 00454 g003
Figure 4. Relative volume fitting in constant component expansion experiment (CCE).
Energies 17 00454 g004
Figure 5. pT phase diagram of original critical parameters and modified critical parameters.
Energies 17 00454 g005
Figure 6. SRV area sewing mesh.
Energies 17 00454 g006
Figure 7. Schematic diagram of SRV mesh numerical simulation characterization.
Energies 17 00454 g007
Figure 8. Economic limit chart of CO2 flooding in different oil layers.
Energies 17 00454 g008
Figure 9. Oil increase under different SRV permeabilities.
Energies 17 00454 g009
Figure 10. Molar fraction field diagram of CO₂ in the oil phase after injection: (a) considering CO2 diffusion; and (b) not considering CO2 diffusion.
Energies 17 00454 g010
Figure 11. Molar fraction field diagram of CO2 in the oil phase after soaking time: (a) considering CO2 diffusion; and (b) not considering CO2 diffusion.
Energies 17 00454 g011
Figure 12. Degree of extraction not considering diffusion and considering diffusion.
Energies 17 00454 g012
Figure 13. Incremental recovery degree and oil change rate at different Kf/Km: (a) increment in extraction degree; and (b) oil exchange ratio.
Energies 17 00454 g013
Figure 14. Incremental recovery degree and oil change rate at different So: (a) increment in extraction degree; and (b) oil exchange ratio.
Energies 17 00454 g014
Figure 15. Kf/KmSo chart of CO2 soaking: (a) incremental mining degree chart; and (b) oil change rate chart.
Energies 17 00454 g015
Table 1. Basic parameter values of the model.
ParameterBasic Value
Matrix permeability/10−3 μm20.02
Oil saturation0.6
Kf/Km10
Horizontal well section length/m1200
Reservoir thickness/m12
Soaking time/d30
Artificial crack half-length/m100
Table 2. Classification of crude oil components.
Original ComponentMole Fraction/%Pseudo-ComponentMole Fraction/%
CO20.11CO20.11
N21.37N2~CH428.69
CH427.32
C2H68.66C2H6~nC632.10
C3H810.05
iC41.64
nC44.45
iC51.56
nC52.22
nC63.52
nC74.62nC7~nC1014.76
nC83.93
nC93.41
nC102.80
C11-C148.91C11~C2117.39
C15-C185.65
C19-C212.83
C22-C252.54C22~C304.46
C26-C301.91
C31+2.49C31+2.49
Table 3. Critical parameters of proposed components.
ComponentCO2N2~CH4C2H6~nC6nC7~nC10C11~C21C22~C30C31+
pcb/atm72.8044.8639.9025.0515.419.336.95
Tcb/K304.20187.38395.70576.47791.97915.441121.75
Table 4. Correction of critical parameters based on average throat radius.
ComponentCO2N2~CH4C2H6~nC6nC7~nC10C11~C21C22~C30C31+
pcb/atm72.6044.6639.6724.8615.259.216.84
Tcb/K302.88186.57393.41572.06784.07904.131105.41
Table 5. Diffusion coefficient of CO2 in crude oil under different conditions.
Pressure/MPaTemperature/°CPermeability/10−3 μm2Diffusion Coefficient/10−9 m2·s−1
Tight oil6.5~3070~150/0.0246~2.8274
15~3020~80/0.2~5.45
20600.08500
Table 6. Development effect under different Kf/Km.
Kf/KmIncrement of Extraction Degree/%Oil Exchange Ratio
102.20320.7919
1002.11030.6302
10002.01320.5153
Table 7. Development effect under different oil saturation.
Oil SaturationIncrement of Extraction Degree/%Oil Exchange Ratio
0.50.93110.4413
0.551.27320.6236
0.62.00240.7919
0.652.01650.8309
0.72.04130.8771
Disclaimer/Publisher’s Note: The statements, opinions and data contained in all publications are solely those of the individual author(s) and contributor(s) and not of MDPI and/or the editor(s). MDPI and/or the editor(s) disclaim responsibility for any injury to people or property resulting from any ideas, methods, instructions or products referred to in the content.