Article

Membrane CO2 Separation System Improvement for Coal-Fired Power Plant Integration

1
Energy Generation and Use Department, Faculty of Power Engineering, National University of Science and Technology Politehnica Bucharest, 313 Splaiul Independentei, 060042 Bucharest, Romania
2
Academy of Romanian Scientists, Ilfov 3, 050044 Bucharest, Romania
*
Author to whom correspondence should be addressed.
Energies 2024, 17(2), 464; https://doi.org/10.3390/en17020464
Submission received: 30 November 2023 / Revised: 8 January 2024 / Accepted: 16 January 2024 / Published: 18 January 2024
(This article belongs to the Section B: Energy and Environment)

Abstract

:
Even though there are numerous CO2 capture technologies (such as chemical and physical absorption), investigators are still trying to come up with novel methods that can minimize the energy requirements for their integration into thermal power plants, as well as the CAPEX and OPEX expenses. In this work, the technical and financial aspects of integrating two-stage polymeric membranes into a coal-fired power plant with a capacity of 330 MW were examined. The study researched the membrane post-combustion CO2 capture process utilizing CHEMCAD version 8.1 software with several parameters and an expander to decrease the total cost. The simulation showed promising results regarding reducing power consumption after using an expander for both a high capture rate (>90%) and a CO2 concentration of more than 95%. Thus, the CO2 captured cost decreased from 58.4 EUR/t (no expander) to 48.7 EUR/t (with expander).

1. Introduction

1.1. Background

Global warming and climate change have captured the interest of numerous countries and encouraged them to follow the Paris Agreement for a neutral-carbon environment [1]. The International Energy Agency (IEA), by 2050, warned that carbon recovery technology utilization could progressively rise to 9% of the overall utilization [2]. In the coming years, carbon capture systems (CCSs) are anticipated to be integrated with roughly all fossil-fuel power plants. Consequently, the claim for CCS study and its technical evaluation is expected to grow over the coming years [3].
The combustion of coal and natural gas power plants provides a flue gas that is evacuated at atmospheric pressure with low CO2 concentration, in contrast with other industries’ emissions. Normally, CO2 fraction flow represents almost 12–15 mole% of the total flue gas generated from coal-fired power plants (CFPP), whereas the natural gas combined-cycle total emissions have 3–4 mole% of carbon dioxide [4].
Generally, it is considered that the most adaptable and efficient technology for integrating with coal-fired power plants without requiring significant retrofitting is post-combustion CO2 capture. Several CO2 separation methods were recognized and implemented in different projects such as the chemical absorption process (CAP), cryogenic distillation, adsorption, and membrane [5,6,7]. The absorption, using alkanol amines for the carbon dioxide recovery process, is believed to be a convenient and mature method for post-combustion [8]. Nevertheless, chemical absorption-based carbon dioxide recovery has a major obstacle that is represented by the enormous heat energy consumption for solvent regeneration (30% of the overall power production), in addition to the requirements of large areas for process equipment [9,10]. Compared to other separation technologies, cryogenic distillation is a quite recent and underdeveloped technology that demands elevated pressure, low temperature, and a significant quantity of energy for compression and cooling. Furthermore, a multiple-stage compression technique is needed for the distillation method, which raises the total cost [11]. In terms of the adsorption process, one of the drawbacks of this process is that the system cannot easily handle large concentrations of CO2, whereas most power plants have larger concentrations of CO2 in flue gases, roughly 15% [12]. Another disadvantage is that obtainable sorbents are not selectively sufficient for CO2 separation from flue gases, where the sorbent’s ability depends on the pore size. Usually, molecules of gases smaller than CO2 can also penetrate the pores, in addition to N2, which fills up the pore space of sorbents. All these drawbacks make the system a less efficient process [13].
The membrane CO2 capture process, which is the subject of this article’s investigation, is thought to be a viable and promising technique for reducing CO2 that can rival traditional CO2 separation techniques in terms of cost and energy penalties. Furthermore, membrane technology is considered a potential method to remove CO2 in post-combustion due to its simple structure and environmental friendliness [14]. According to Yang et al.’s review of the development of membrane system for carbon dioxide removal, the membrane technology is space- and energy-efficient, simple to scale up, and has the potential to be a promising technique [15].
So far, several membranes have been enhanced that are characterized by high CO2 permeance in the capture process. In membrane gas separation systems, the driving force for carbon dioxide recovery and power consumption is extremely affected by the carbon dioxide partial pressure; therefore, it can be considered a key agent for nominating a CO2 removal method [16].

1.2. Research Progress

Several comprehensive studies of membrane technology for CO2 removal in the post-combustion process have been researched in the literature [17,18,19]. Many separation applications, including air separation, hydrogen generation, and CO2 capture techniques, have been investigated using the membrane gas separation process. Molecular sieves, fixed-site carriers, inorganic, and polymeric membranes are among the membrane materials that have been researched and improved to satisfy CO2 recovery demands for the membrane carbon dioxide capture technology [20,21]. Under any circumstances, the materials are required to be appropriate and built to be used for a specific CO2 capture method. Mechanical endurance, chemical strength, thermal stability, and resistance to pollutants like SO2, NOx, fly ash, etc., are the fundamental characteristics of every membrane material. As a result, these characteristics and operating conditions affect the final choice of materials for a certain carbon dioxide separation method [22,23].
To be compatible with the conventional CO2 capture methods, membranes need to have a high permeability of carbon dioxide and efficient selectivity for the CO2 separation method to occur. Permeability and selectivity are traded for the majority of polymeric membranes, in a process which is known as “the Robeson upper-bound” [24], see Figure 1. The modified upper bound has an enhanced bound, because of notable advances in the performance of membranes since the previous upper bound was set in the 1950s [25].
The key criteria for choosing membrane materials for CO2 recovery up to this point have been permeability and selectivity for various materials; as the References show, various papers have examined membrane materials with elevated permeability. Qiang et al. (2013) [27] studied the effects of various membrane materials with multiple layers under various operating conditions on the permeability and selectivity of the membrane used for removing carbon dioxide from various gas mixtures. The CO2 capture efficiency with higher concentration was found to be enhanced by the author through utilization of an improved membrane material with a greater carbon dioxide permeable layer. BT Low et al. (2013) [28] researched the influence of several membrane materials and operation modes of the system on membrane achievements in a process of post-combustion CO2 recovery. The authors revealed that the membrane surface can be reduced constantly by increasing the carbon dioxide permeability, while raising the CO2/N2 selectivity enhanced the gas captured purity with a reduction in total energy consumption. However, increasing the selectivity can be beneficial at elevated pressure differences across the membrane, but, on the other hand, the higher permeability is considered an advantage at larger feed-to-permeate pressure ratios.
Improving membrane permeability and selectivity are the primary issues to be researched to develop a carbon dioxide separation method that is more effective. Nonetheless, the most developed materials used to remove CO2 are polymeric polymers [29].
The mass transport mechanism of a CO2 separation method is the pressure differential across the membrane unit. When the gas mixture moves at the atmosphere’s pressure, the membrane process design can be performed to adjust for the low carbon dioxide content of the flue gas produced from a coal-fired power plant by increasing the pressure difference through the use of a compressor before the membrane module, a vacuum pump to remove the flue gas flow on the permeate side, or both [25]. In membrane CO2 capture systems, an expander turbine can be harnessed to recover the stream energy before discharging into the atmosphere [30]. Different membrane designs with various stages in post-combustion were examined to rival solvent regeneration process usage and lower the overall cost, which is mostly due to electrical energy requirements and membrane surface area.
Gilassi et al. (2019) [31] developed an optimized membrane system to detect the optimum amounts of operating indicators and the most influential design to reduce the capture cost. A hollow fiber polymer membrane module was used for separation purposes from the biogas that flowed at a rate of 12.4 mol/s and with CO2 concentration ranges from 10 to 40%. The authors suggested that for the same selectivity of CO2/CH4, the capture cost was decreased by boosting carbon dioxide permeability by two factors, and the overall membrane surface was reduced by that boost by around 40%. Ultimately, they concluded, according to the techno-economic assessment, that the gas separation-based membrane process has considerable potential to replace the classic carbon capture technologies or to be harnessed in a hybrid system.
Jiayou et al. (2019) [32] carried out a gas recovery analysis to discuss the influence of flue gas pressure and carbon dioxide content on membrane CO2 capture in post-combustion CFPP. A spiral-wound membrane was used and optimized to decrease the total membrane surface and power consumption required by the membrane auxiliaries. The membrane designs of one and two units were evaluated with a flue gas of 22 kmol/s and 2.97 kmol/s CO2 flow. The authors declared that the power consumption for the proposed integration can be reduced by moderating the first compressor pressure from 5.5 to 6.5 bar. They also stated a reduction scenario for the CO2 recovery price by harnessing high carbon dioxide permeability together with medium selectivity for the membrane first unit, and suggested that medium permeability with high selectivity should be utilized for the second unit.
Hongyu et al. (2021) [33] studied and constructed a flexible pilot range of two membrane units to recover 90% of carbon dioxide from several analyzed exhaust gases. Numerous compressor pressures with humidifier temperatures were investigated depending on the carbon dioxide concentrations in the flue gas (such as 14%, 25%, and 35%), whish were identical to the exemplar concentrations generated from different plants, i.e., CFPP, steel/cement, and other plants with high carbon dioxide contents. The authors stated that a higher recovery rate can be effectively obtained with membrane multi-stage configuration. Additionally, they represented a real design and plan for three-membrane units that were constructed in China (2021), which were predicted to reach a 90% removal efficiency with 95% purity of carbon dioxide.
Micari et al. (2021) [34] demonstrated a techno-economic estimation for polymeric nonporous single-layer graphene (NSLG) membranes for the post-combustion carbon removal process with a vast domain of carbon dioxide fractions (10–25%). A compression unit with a vacuum pump placed in the retentate path with different configurations was considered to examine the membrane performance for a capture and purity rate of 90%. The authors’ results showed that utilizing membranes of high permeability with a vacuum pump helped to reduce power consumption in comparison with compression unit utilization. However, they revealed that the recovery cost of the membrane system used can compete with the classical CAP and can be further improved in the future.
The primary factors that affect any membrane carbon dioxide separation system were all illustrated by the cited authors, and these factors should be tuned to produce the most effective results both technically and financially.

1.3. Target and Novelty of the Current Article

According to the literature review, the current work aims to analyze post-combustion CO2 removal from flue gas emitted by CFPP integrated into a two-stage membrane process with an energy recovery system (expander). The main purpose of using an expander is to recover the retentate stream energy before discharging it into the atmosphere.
The research purpose is to study different CO2 capture system parameters integrated into a conventional CFPP (using hard coal as a fuel) of 330 MW as a net output power to recover 90% of the carbon dioxide emissions; the recovery efficiency value (90%) was set as a standard CO2 capture efficiency by the U.S. DOE National Energy Technology Laboratory (NETL) [35], with a purity of 95% with the lowest LCOE. This purity is demanded for transportation and applications like enhanced oil recovery (EOR) [36]. Using process modeling, various scenarios were examined to determine how feed compression and membrane surface area affected the membrane system’s productivity and the total cost.
Furthermore, a systematic comparison is presented between the proposed membrane design with expander utilization and the same design without expander in terms of specific primary energy consumption for carbon dioxide avoided (SPECCA), CO2 capture cost, and CO2 avoided cost, to demonstrate the significance of the expander in the membrane gas separation process.

2. Methodology

This section discusses the membrane mathematical model, membrane CO2 recovery design, and techno-economic evaluation structure of the considered design.

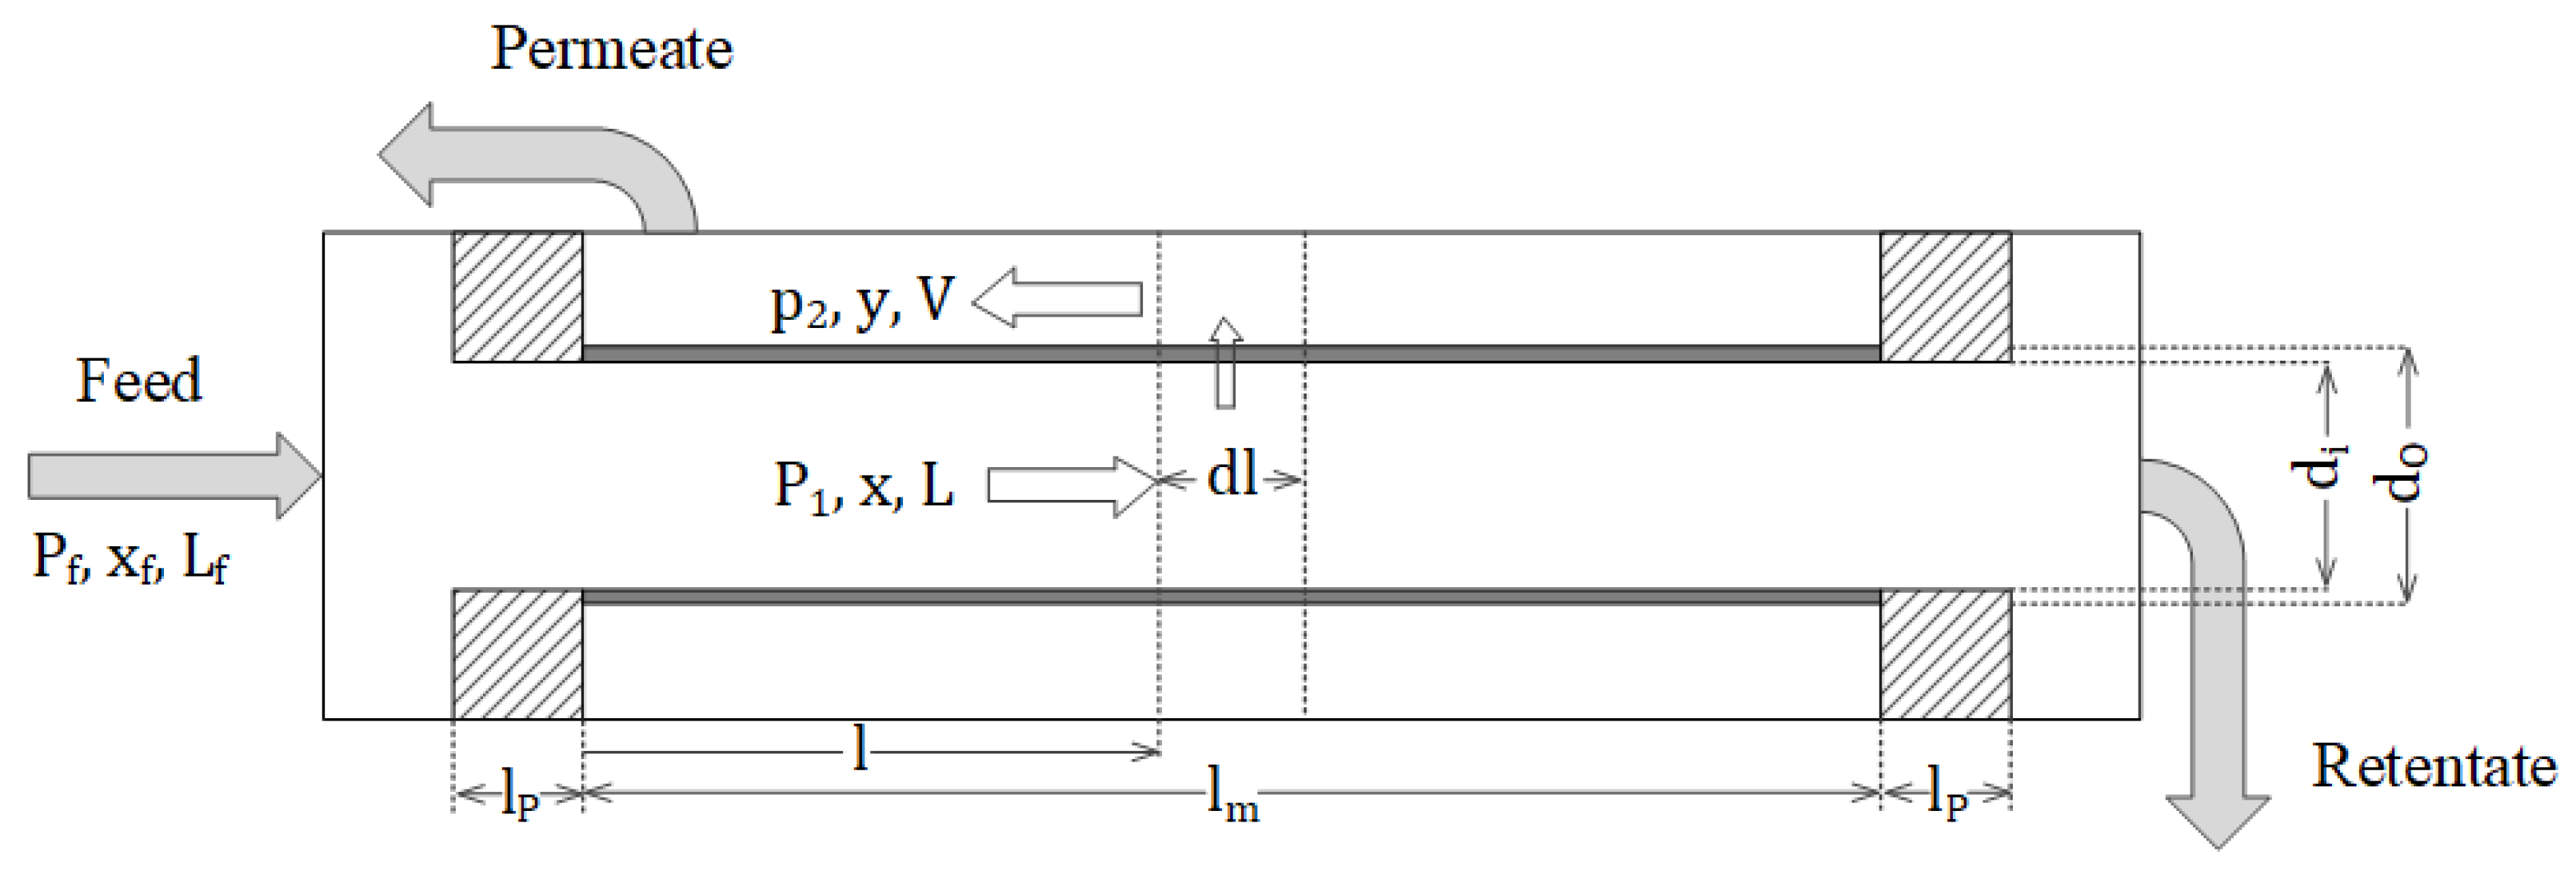
2.1. Membrane Mathematical Model

Solution-diffusion is believed to be a mature technique to characterize the method of multi-component gas mixture penetration via polymeric membranes. Nowadays, polymer membranes have become the most manufactured membrane material due to their affordable pricing and straightforward large-scale manufacturing [37,38]. The differential equations for the membrane system can be derived by harnessing CO2 and N2 mass transfer and total mass transfer [39,40,41]. Figure 2 presents the scheme of feed, permeate, and retentate streams in a module of counter-current flow.
The flow on the permeation side of CO2 and N2 is also considered. To make the equations easier to code into the computer software, they were designed and then reorganized to be dimensionless, as follows:
d y d l * = K 1 V * [ α γ 1 x γ 2 y x α γ 1 x γ 2 y + γ 1 1 x γ 2 1 y ]
d x d l * = K 1 L * [ α γ 1 x γ 2 y x α γ 1 x γ 2 y + γ 1 1 x γ 2 1 y ]
d V * d l * = K 1 [ α γ 1 x γ 2 y x α γ 1 x γ 2 y + γ 1 1 x γ 2 1 y ]
d L * d l * = K 1 [ α γ 1 x γ 2 y x α γ 1 x γ 2 y + γ 1 1 x γ 2 1 y ]
d γ 1 d l * = K 2 L * γ 1
where V * and L * are the normalized permeate and feed flow streams, respectively. l * is the normalized length from the inlet. The mole fraction of CO2 in the feed and permeate sides are demonstrated as x and y , respectively, where γ 1 and γ 2 represent normalized pressures of the feed and permeate streams.
Regarding the different indicators shown in the series of formulas presented above, they are determined as follows:
α = ( Q d ) C O 2 ( Q d ) N 2
γ 1 = P 1 P f
γ 2 = p 2 P f
l * = l l m
V * = V L f
L * = L L f
K 1 = π D L M ( l m L f ) ( Q d ) N 2 P f
K 2 = ( 128 μ f R T L f l m ) π P f 2 d i 4
where ( Q d ) C O 2 and ( Q d ) N 2 are the permeability of CO2 and N2 of the membrane material, respectively. P 1 and p 2 represent the pressures of feed and permeate sides, respectively. P f is the gas mixture pressure before introducing it into the membrane module. l and l m are the length from the membrane module entry and the overall length of the module, respectively. L f is the gas mixture flow at the membrane entry. D L M represents the log mean diameter of the membrane module.
It deserves to be emphasized that the aforementioned formulas are suitable, whether or not a sweep gas is used. Only the boundary conditions distinguish a sweep mode from a no-sweep mode. The bulk permeate content of the more permeable kind, y , at the reject end in the no-sweep mode, cannot be determined; instead, it is correlated with the closed-end permeate pressure ratio and the reject mole fraction based on the crossflow pattern present at this specific position [39].
The boundary conditions are defined by:
At l * = 0
P = P f , γ 1 = 1 ,   x = x f ,   L = L f ,   L * = 1
At l * = 1 , V = 0 , V * = 0
y = α 1 γ 2 + γ 1 x + γ 1 α 1 γ 2 + γ 1 x + γ 1 4 α γ 1 γ 2 x ( α 1 ) 2 γ 2 ( α 1 )
All the equations presented above are solved by the simulation program used in the current paper (ChemCad).
The founded model contains the following presumptions:
  • The membrane operational temperature is isothermal [42];
  • No pressure drops between the feed and retentate side [43];
  • No concentration polarization [44];
  • The gas attitude is typical [45].

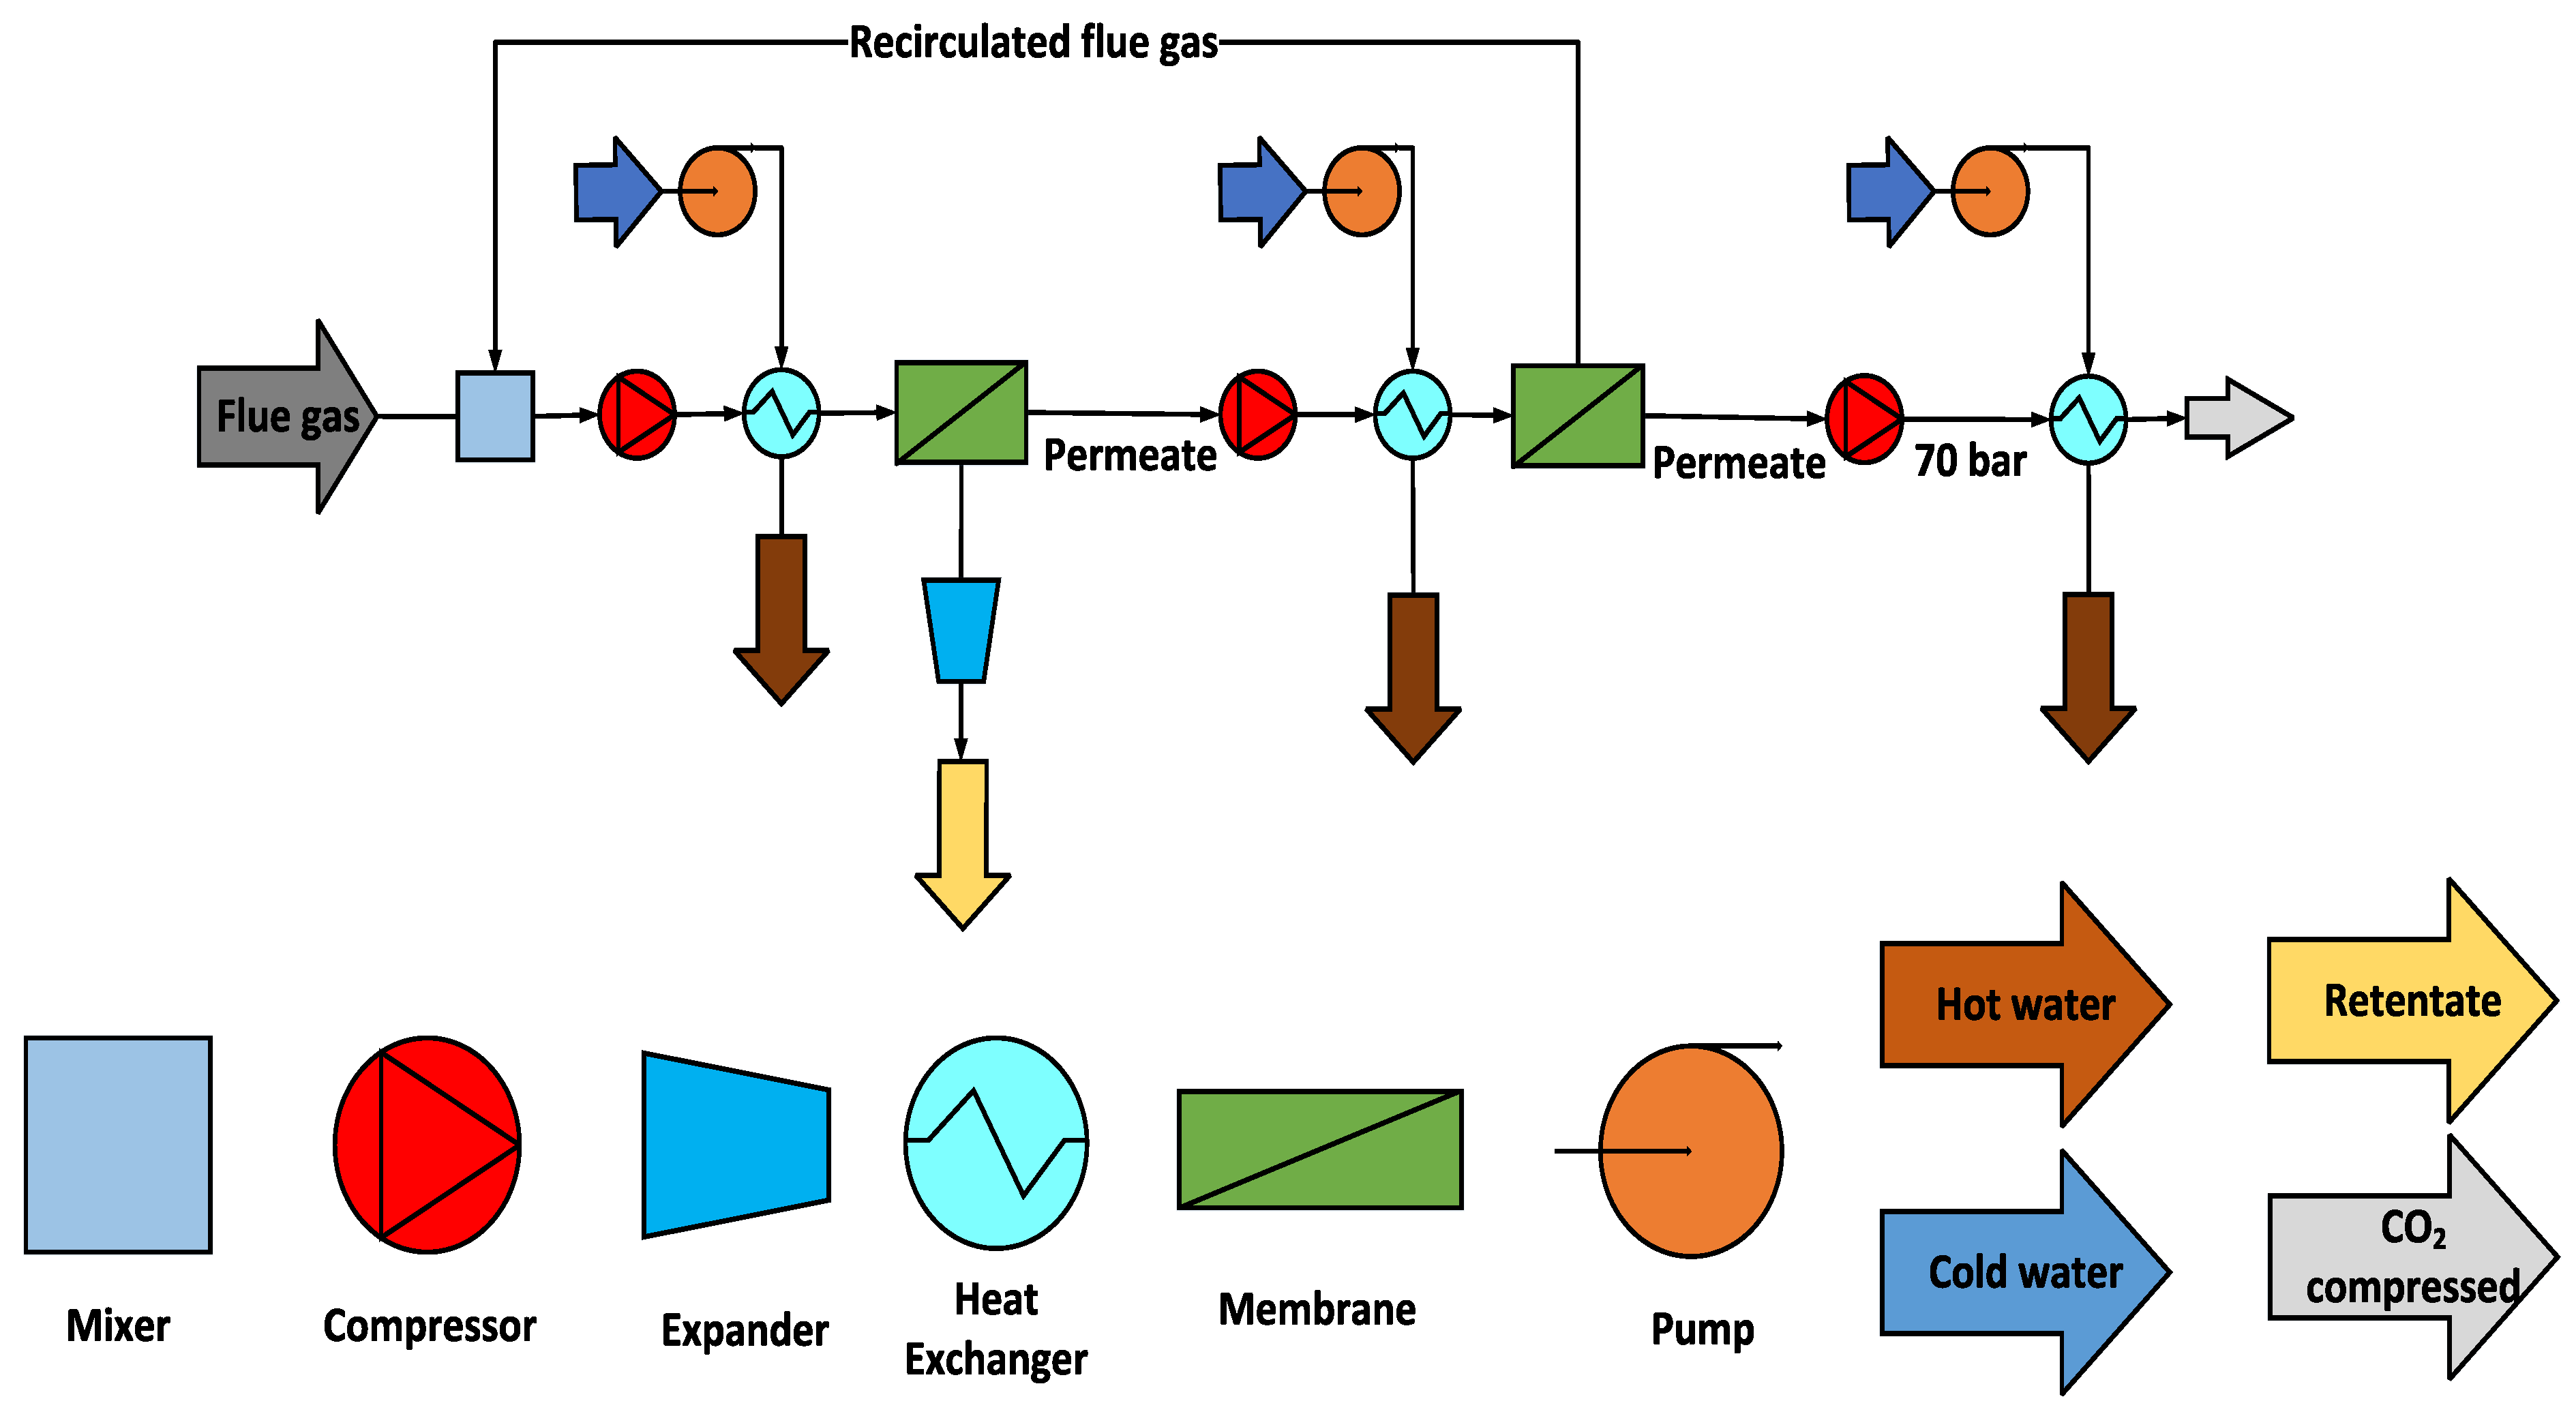
2.2. Membrane CO2 Recovery Design

The usage of a membrane single stage at any parameter showed poor CO2 captured concentration results [46]; therefore, a one-stage membrane is not recommended for our research. Currently, the studies of multi-unit membrane concentrate on two to four units. The study of Hao et al. [47] demonstrated that the integration of two stages of membrane is more economically efficient than three-units utilization. Ramírez et al. [42] improved a nonlinear programming sample of a membrane with four units. The authors declared that the membrane three-stage configuration showed a modest decrease in CO2 capture cost compared with the two-stage; at the same time, the three-stage scheme is more complicated than the two-stage one. The four-stage and the three-stage variation in the scheme are neglected. Datta et al. [48] declared that there is no evident variance regarding the optimal results of two- and three-membrane-stage configurations. Therefore, the integration of two-membrane stages can be an efficient configuration for the CO2 capture process. Accordingly, two stages can be considered for membrane technology integration, in the current paper.
It is commonly concurrent that membrane surface area and the energy required for compressors are the essential elements that define membrane technology cost [49]. Characteristics of the 330 MW CFPP, fuel used, and the flue gas generated are presented in Table 1. The scheme of the CFPP with a CCS in the present paper is illustrated in Figure 3 [50].
The flue gas should be treated before being introduced into the membrane stage to remove undesired components that may affect membrane material such as SOX, NOX, and ash. The moisture flue gas needs to be dried to avert issues caused by water drops. In the present paper, the flue gas was considered a dry gas and free of water due to the extra energy needed for the drying process [51,52].
Table 1. The CFPP and membrane CO2 capture-system essential details [53].
AgentUnitRate
Hard coal details 72.30% Carbon,
4.11% Hydrogen, 1.69% Nitrogen,
7.45% Oxygen,
0.56% Sulphur, 13.89% ash.
Lower heating valueMJ/kg25.17
CFPP main characteristics
Temperature of steam°C560
Pressure of steambar170
Steam turbine efficiency (high pressure)%84.9
Steam turbine efficiency (medium pressure)%91.6
Steam turbine efficiency (low pressure)%87.8
Pressure of condensingbar0.05
Condenser cooling water°C9.5
Steam generator combustion efficiency%91
Flux steamt/h914.5
CFPP net efficiency%45.87
Flue gas details before membrane technology
PressureMPa0.101
Temperature°C50
Fluxkmol/h40,320
Flue gas composition%mole
CO2 13.12
N2 80.82
O2 6.03
SO2 0.03
According to Koros et al. (1987), for the goals of high efficiency and purity in a multi-stage membrane carbon dioxide removal process, a steam cycle scheme is required for the scheme design [54]. Thus, for the process design, the residue stream from the second membrane is sent back before the first compressor designed to reduce the carbon dioxide emissions, therefore increasing the CO2 capture rate. Furthermore, two different compressor units before each membrane stage and an expander in the first membrane retentate stream were considered to evaluate the optimum result and the total CFPP performance, as presented in Figure 4 [55].
The flue gas details entering the membrane system are presented in Table 1. As it is recognized that a high-pressure ratio across the membrane unit strongly raises the recovery efficiency, two compression units have been utilized in the suggested configuration. Expanders are usually employed to recover electric power and decrease pressure, therefore reducing energy loss. In the current membrane CO2 capture systems, the expander is located in the high-pressure N2-rich retentate steam [29,56], see Figure 4. Numerous heat exchangers have been utilized in the current scheme to reduce the high temperature generated by compression systems. The carbon dioxide-removed stream has to be compressed at elevated pressure (assumed 70 bar) for the CO2 preparation process of transportation [57,58]. The membrane material suggested for the present research is polyacrylamide polymer (PSF 50 K) combined with CA enzyme; this material was developed in a CO2 hybrid project which was a research project at University POLITEHNICA of Bucharest in 2020 [53]. Polyacrylamide polymer (PSF 50 K) is characterized by high permeability, and high selectivity, and is easy to find on the market. Membrane material replacement has to be implemented after 5 years of employment due to the low achievement after that period, according to Lillepärg et al. (2014) and Yang Han et al. (2020) [38,59]. Table 2 below demonstrates the membrane process’s main indicators. All the simulated values were performed by CHEMCAD software version 8.1.

2.3. Techno-Economic Evaluation Structure

The economic assessment of the CO2 recovery systems was achieved by employing costing assumptions improved by Seokwon Y. et al. (2020), where the authors assessed operating and capital costs methodologically [60]. The main economic parameters and presumptions utilized for this paper were set by Seokwon Y. [55]. Table 3 represents the essential economic parameters.
The following mathematical formulas were harnessed to calculate the main economic indicators required for a high recovery rate and purity of carbon dioxide.
The overall power consumption required to remove carbon dioxide can be calculated as the equation:
M e m b r a n e   p o w e r   r e q u i r e d = W c W e x
where W c and W e x represent the total power of compressors and expanders, respectively (kW).
Levelized Cost of Electricity ( L C O E ) (EUR/kWh) is computed as follows [61]:
L C O E = C A P E X + O P E X E n e t
C A P E X is the annualized capital cost, O P E X is the operation and electricity cost (EUR), and E n e t demonstrates the total electricity generation (kWh).
S P E C C A (MJ/kg) can be defined according to the following calculation [61]:
S P E C C A = 3600 × ( E n e t , N O   c a p t u r e E f i n e , W i t h   C a p t u r e ) E n e t , N o   c a p t u r e × C N o   c a p t u r e ( E n e t , W i t h   c a p t u r e × C W i t h   c a p t u r e )
C N o   c a p t u r e and C W i t h   c a p t u r e illustrate the overall CO2 released from the power plant with and without capture systems (kg/kWh).
CO2 capture cost ( C O 2 , C C ) can be calculated by using Equation (19), and can be measured by EUR/t [62].
C O 2 , C C = L C O E w i t h   c a p t u r e L C O E N o   c a p t u r e C O 2 c a p t u r e d
On the other hand, CO2 avoided cost is also obtained according to the following formula [62]:
C O 2 , A C = L C O E w i t h   c a p t u r e L C O E N o   c a p t u r e C N o   c a p t u r e C w i t h   c a p t u r e
The following calculations were utilized to examine whether the project was productive or not [62].
Net present value (EUR)
N P V = i = 1 n f I N i C i A i 1 + r i i = 1 n r I i × 1 + r i
where I N i is considered as the actual income in a year i (EUR/year); C i is the replacement cost in a year (EUR/year); A i is the recompense loan (EUR/year); I i is actual investment (EUR/year); and r is the rate of discount (0.08).
Internal Rate of Return ( I R R ) can be computed as follows: N P V is 0, where I R R for any project is equal to the rate of discount.
N P V = i = 1 n I N i C i I i 1 + I R R i = 0
Discounted Payback Period ( D P P ) is the duration where the premier investment is won back, and is determined by Formula (23).
N P V = i = 1 D P P I N i C i I i 1 + r i ,
The Index of Profitability ( I P ), whether the project is determined as profitable or not, was computed by Formula (24).
P I = N P V + I A I A
where I A is the deduction in the investment.

3. Results and Discussion

The paper aims to achieve the lowest possible economic indicators while still achieving a 90% CO2 capture rate and 95% purity. Two membrane stages designed with compression units and an expander have been researched with different compressor values and several membrane areas, with that purpose.
Previous research has concentrated on examining the advancements in the membrane gas separation process from a technical point of view [18,63,64]. Nonetheless, the current study’s findings offer a comprehensive understanding of how various factors and expander use influence the techno-economic evaluation of the suggested design.
The subsequent figures illustrate the variations in the membrane’s function that resulted from the various simulated alterations. The findings revealed several relationships between CO2 capture rate and power consumption, which were further explored in depth. Technically and economically, the idea of using an expander was considered and a comparison with the identical system operating without an expander was carried out.
Brunetti et al. (2010) [65] declared that pressure differences across the membrane and first membrane area have the primary influence on the membrane CO2 capture system. Thus, different membrane surfaces and first compressor pressures were examined, in the current paper, to obtain at least 95% CO2 purity with 90% capture rate. The results showed that increasing the first compressor pressure provided a reduction in membrane surface area, and vice versa. An expander was integrated with the retentate stream of the first membrane module to recover electric power and decrease pressure, therefore reducing the energy loss. Furthermore, several second compressor pressures (2–10 bar) were researched, with increasing values directly affecting the CO2 captured concentrations. As the second membrane surface area requires a low value to provide high purity of carbon dioxide [66], in this article 40,000 m2 was optimized and considered for the MSA2.
The optimum outcomes, for purposes of this article, were obtained at 8 bar CP1, CP2 of 4 bar, and 600,000 m2 MSA1. Figure 5 presents the optimum results of the present paper design in terms of CO2 recovery efficiency, CO2 concentration, compressor power consumption, and energy recovery by the expander. The power consumption in this phase is around 189 MW, where 18% is recovered by the energy recovery system (expander); therefore, the total electrical energy consumed from the CFPP is 154.9 MW, which represents 46.9% of the overall plant capacity (330 MW).

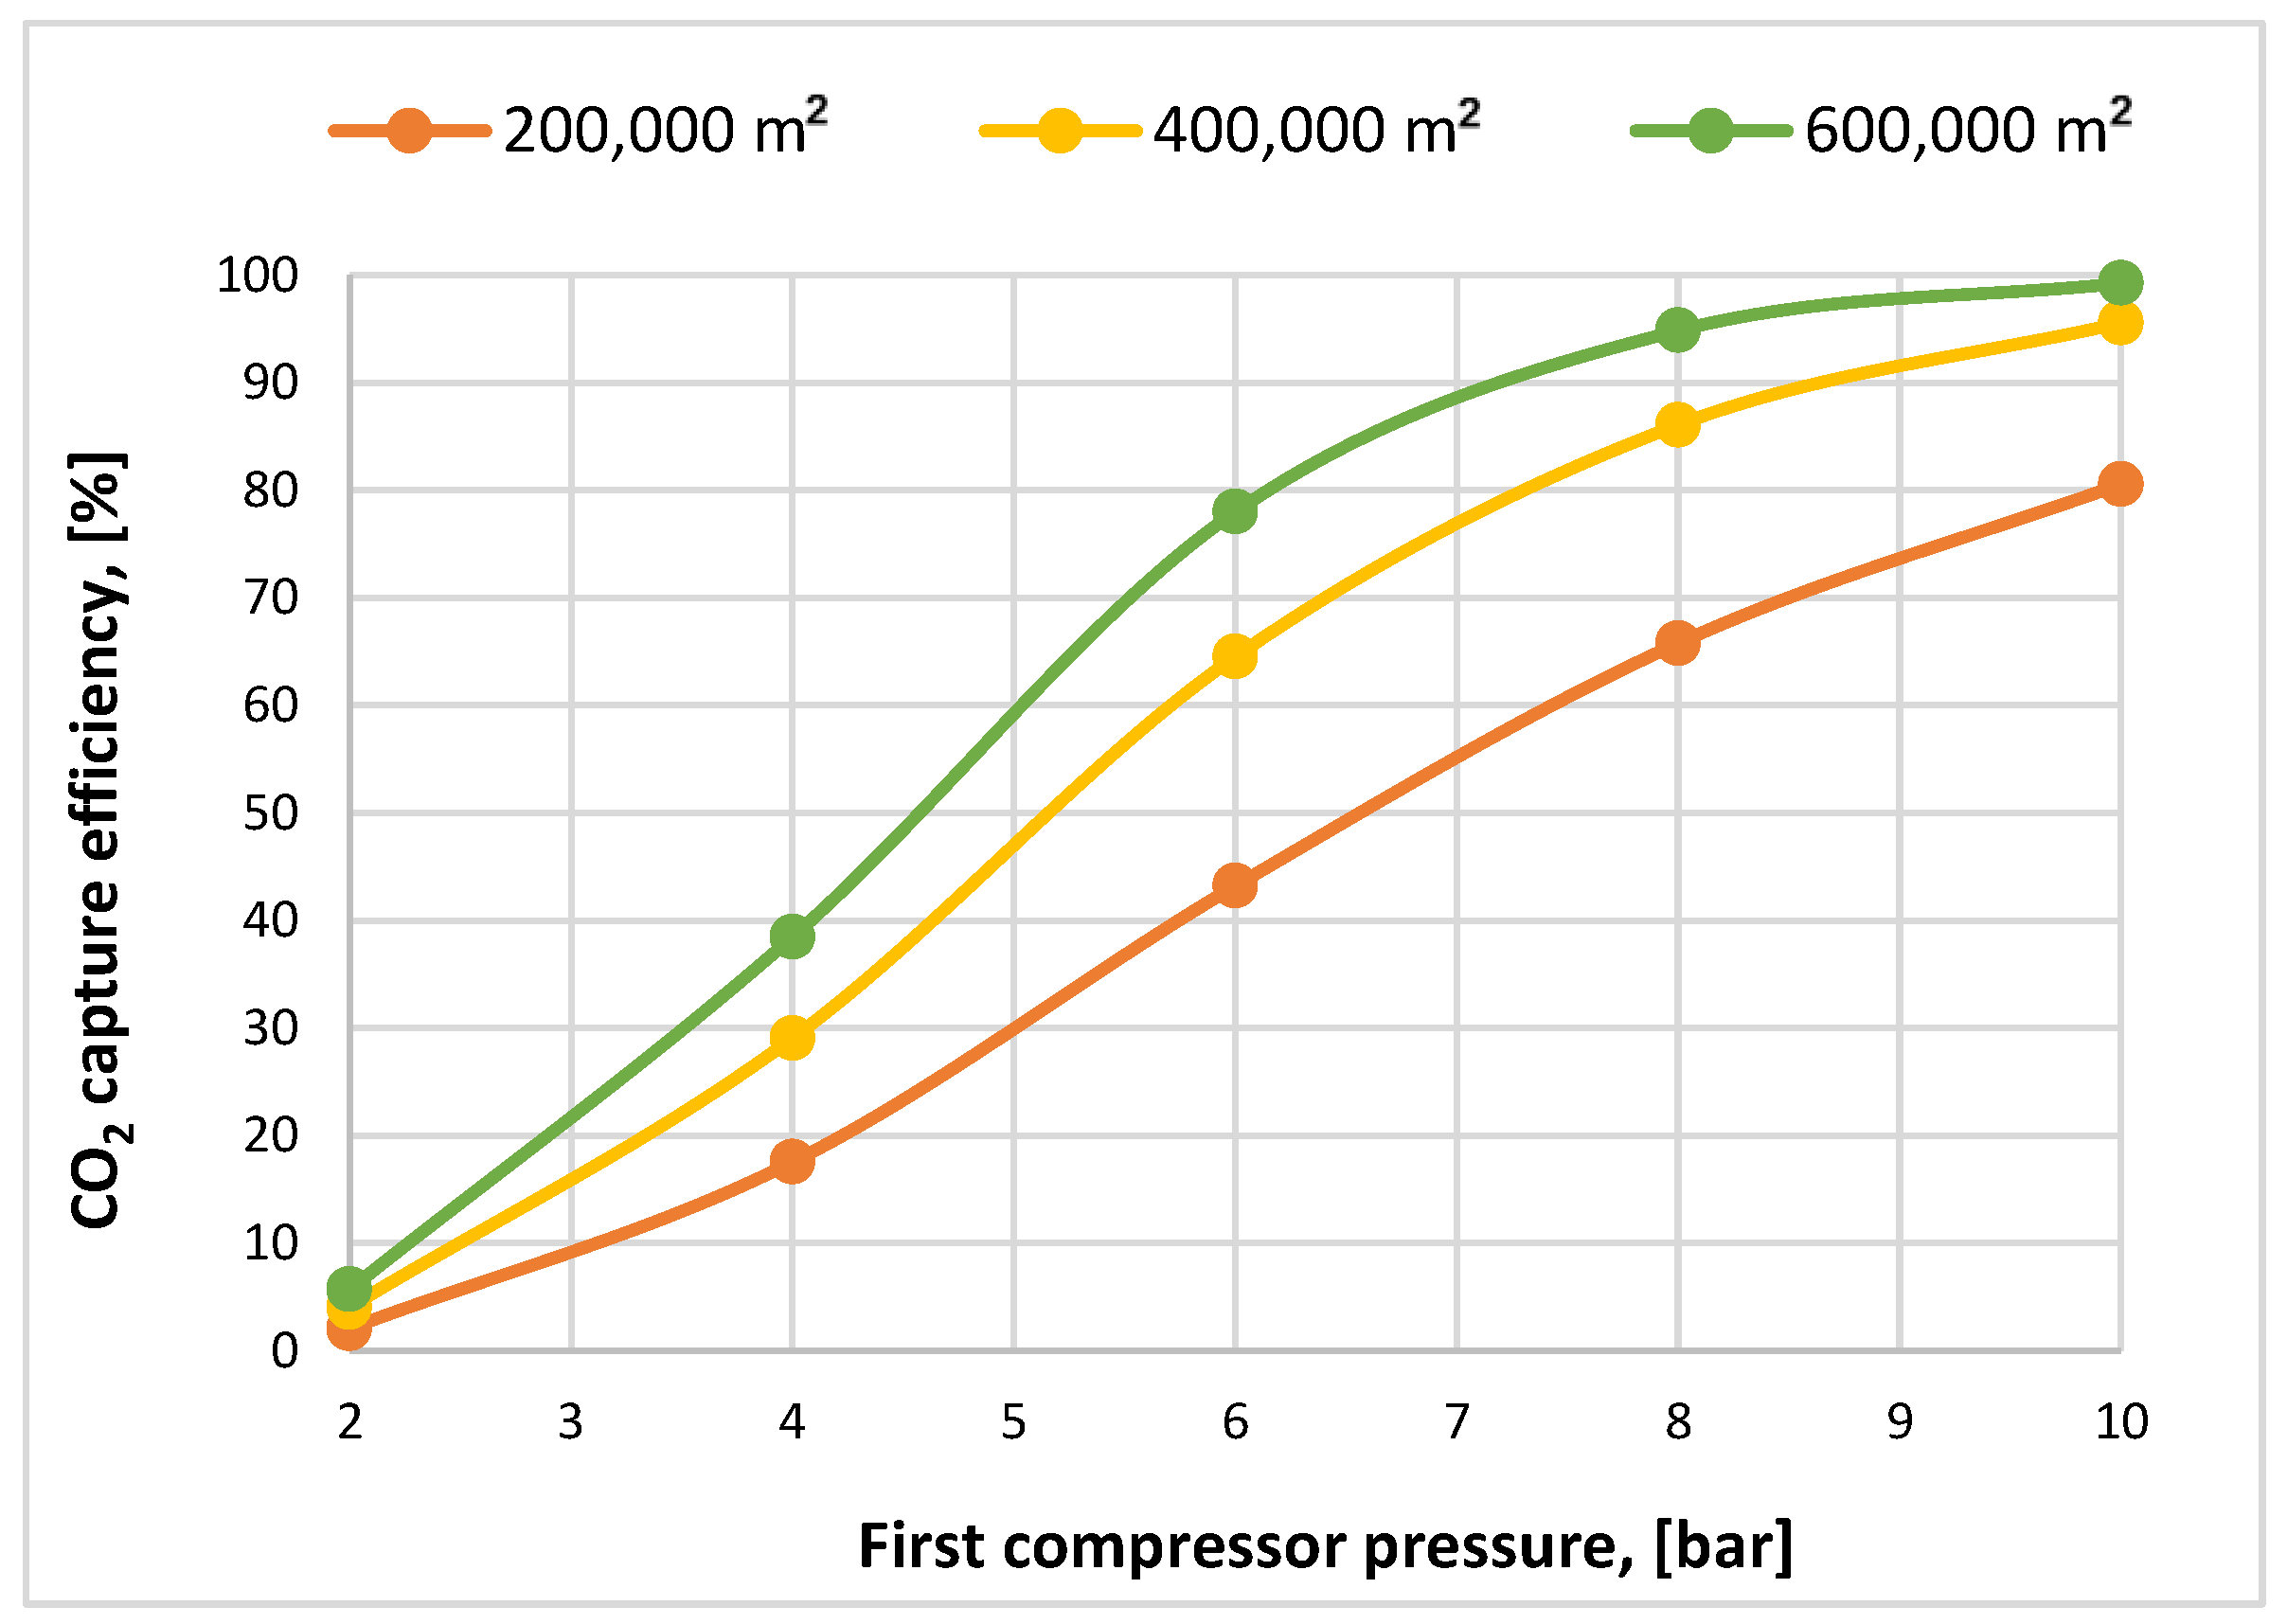
3.1. Effect of First Compressor Pressure and Membrane Area on CO2 Capture Efficiency

At a specific capture efficiency, increasing the membrane surface area led to the decrease in CP1, due to the high CO2 content passed through the membrane stage at a larger membrane area, see Figure 6. The figure presents the significance of the compression unit before the membrane stage in enhancing the CO2 removal rate, because of the large amounts of CO2 pushed and captured via the membrane. At 600,000 m2 MSA1 and 10 bar, all the CO2 concentration was captured through the permeate stream of the membrane, and thus there is no interest in examining a larger membrane area or higher compressor pressure values. Based on the figure, the article’s aim of 90% capture efficiency was achieved at 8 bar CP1 and 600,000 m2 MSA1.

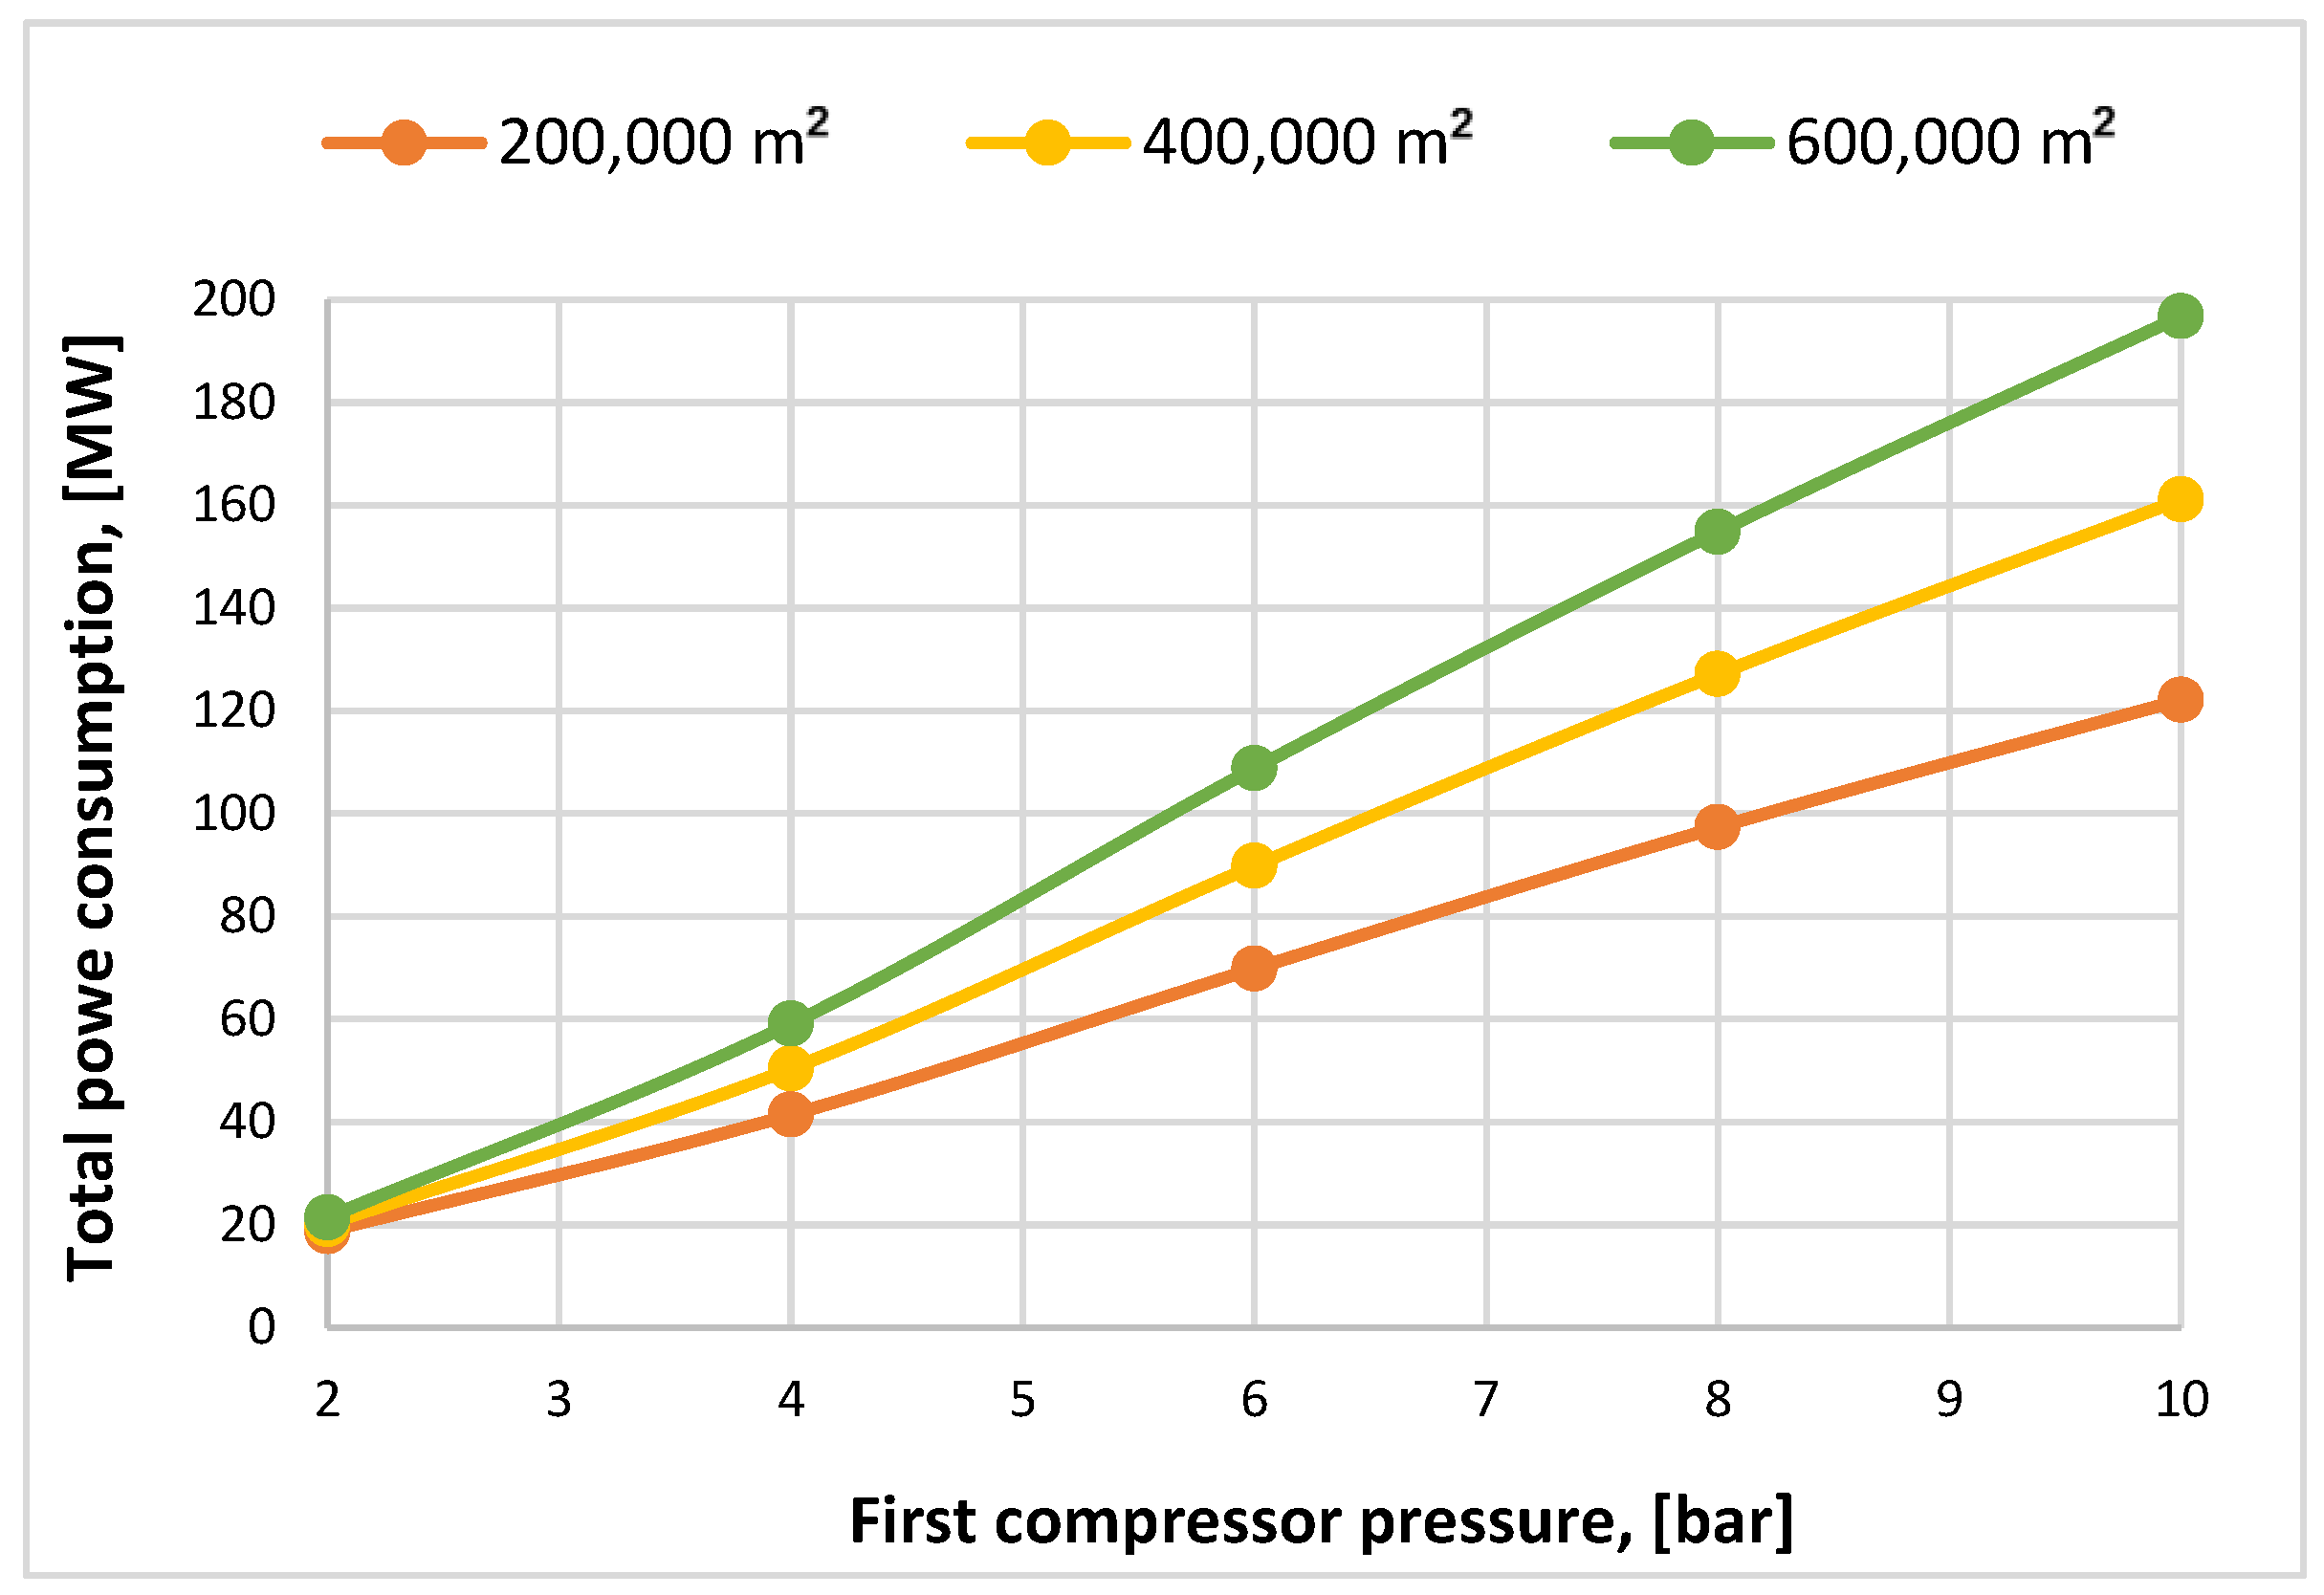
3.2. Effect of First Compressor Pressure and Membrane Area on Total Power Consumption

Figure 7 illustrates the impact of the first membrane surface area on total power consumption after expander use with a different CP1. Enlarging the membrane surface continuously increases the electrical energy demanded for the recovery system at any compression value due to the larger CO2 content passed through the membrane module, which requires more power to compress the flow at 70 bar for storage purposes. The highest power needed was around 200 MW at 600,000 m2 MSA1 and 10 bar, which can be explained by the elevated compressor pressure in addition to the large amount of carbon dioxide flow passed through the last compressor (70 bar), which raises the electricity demands.

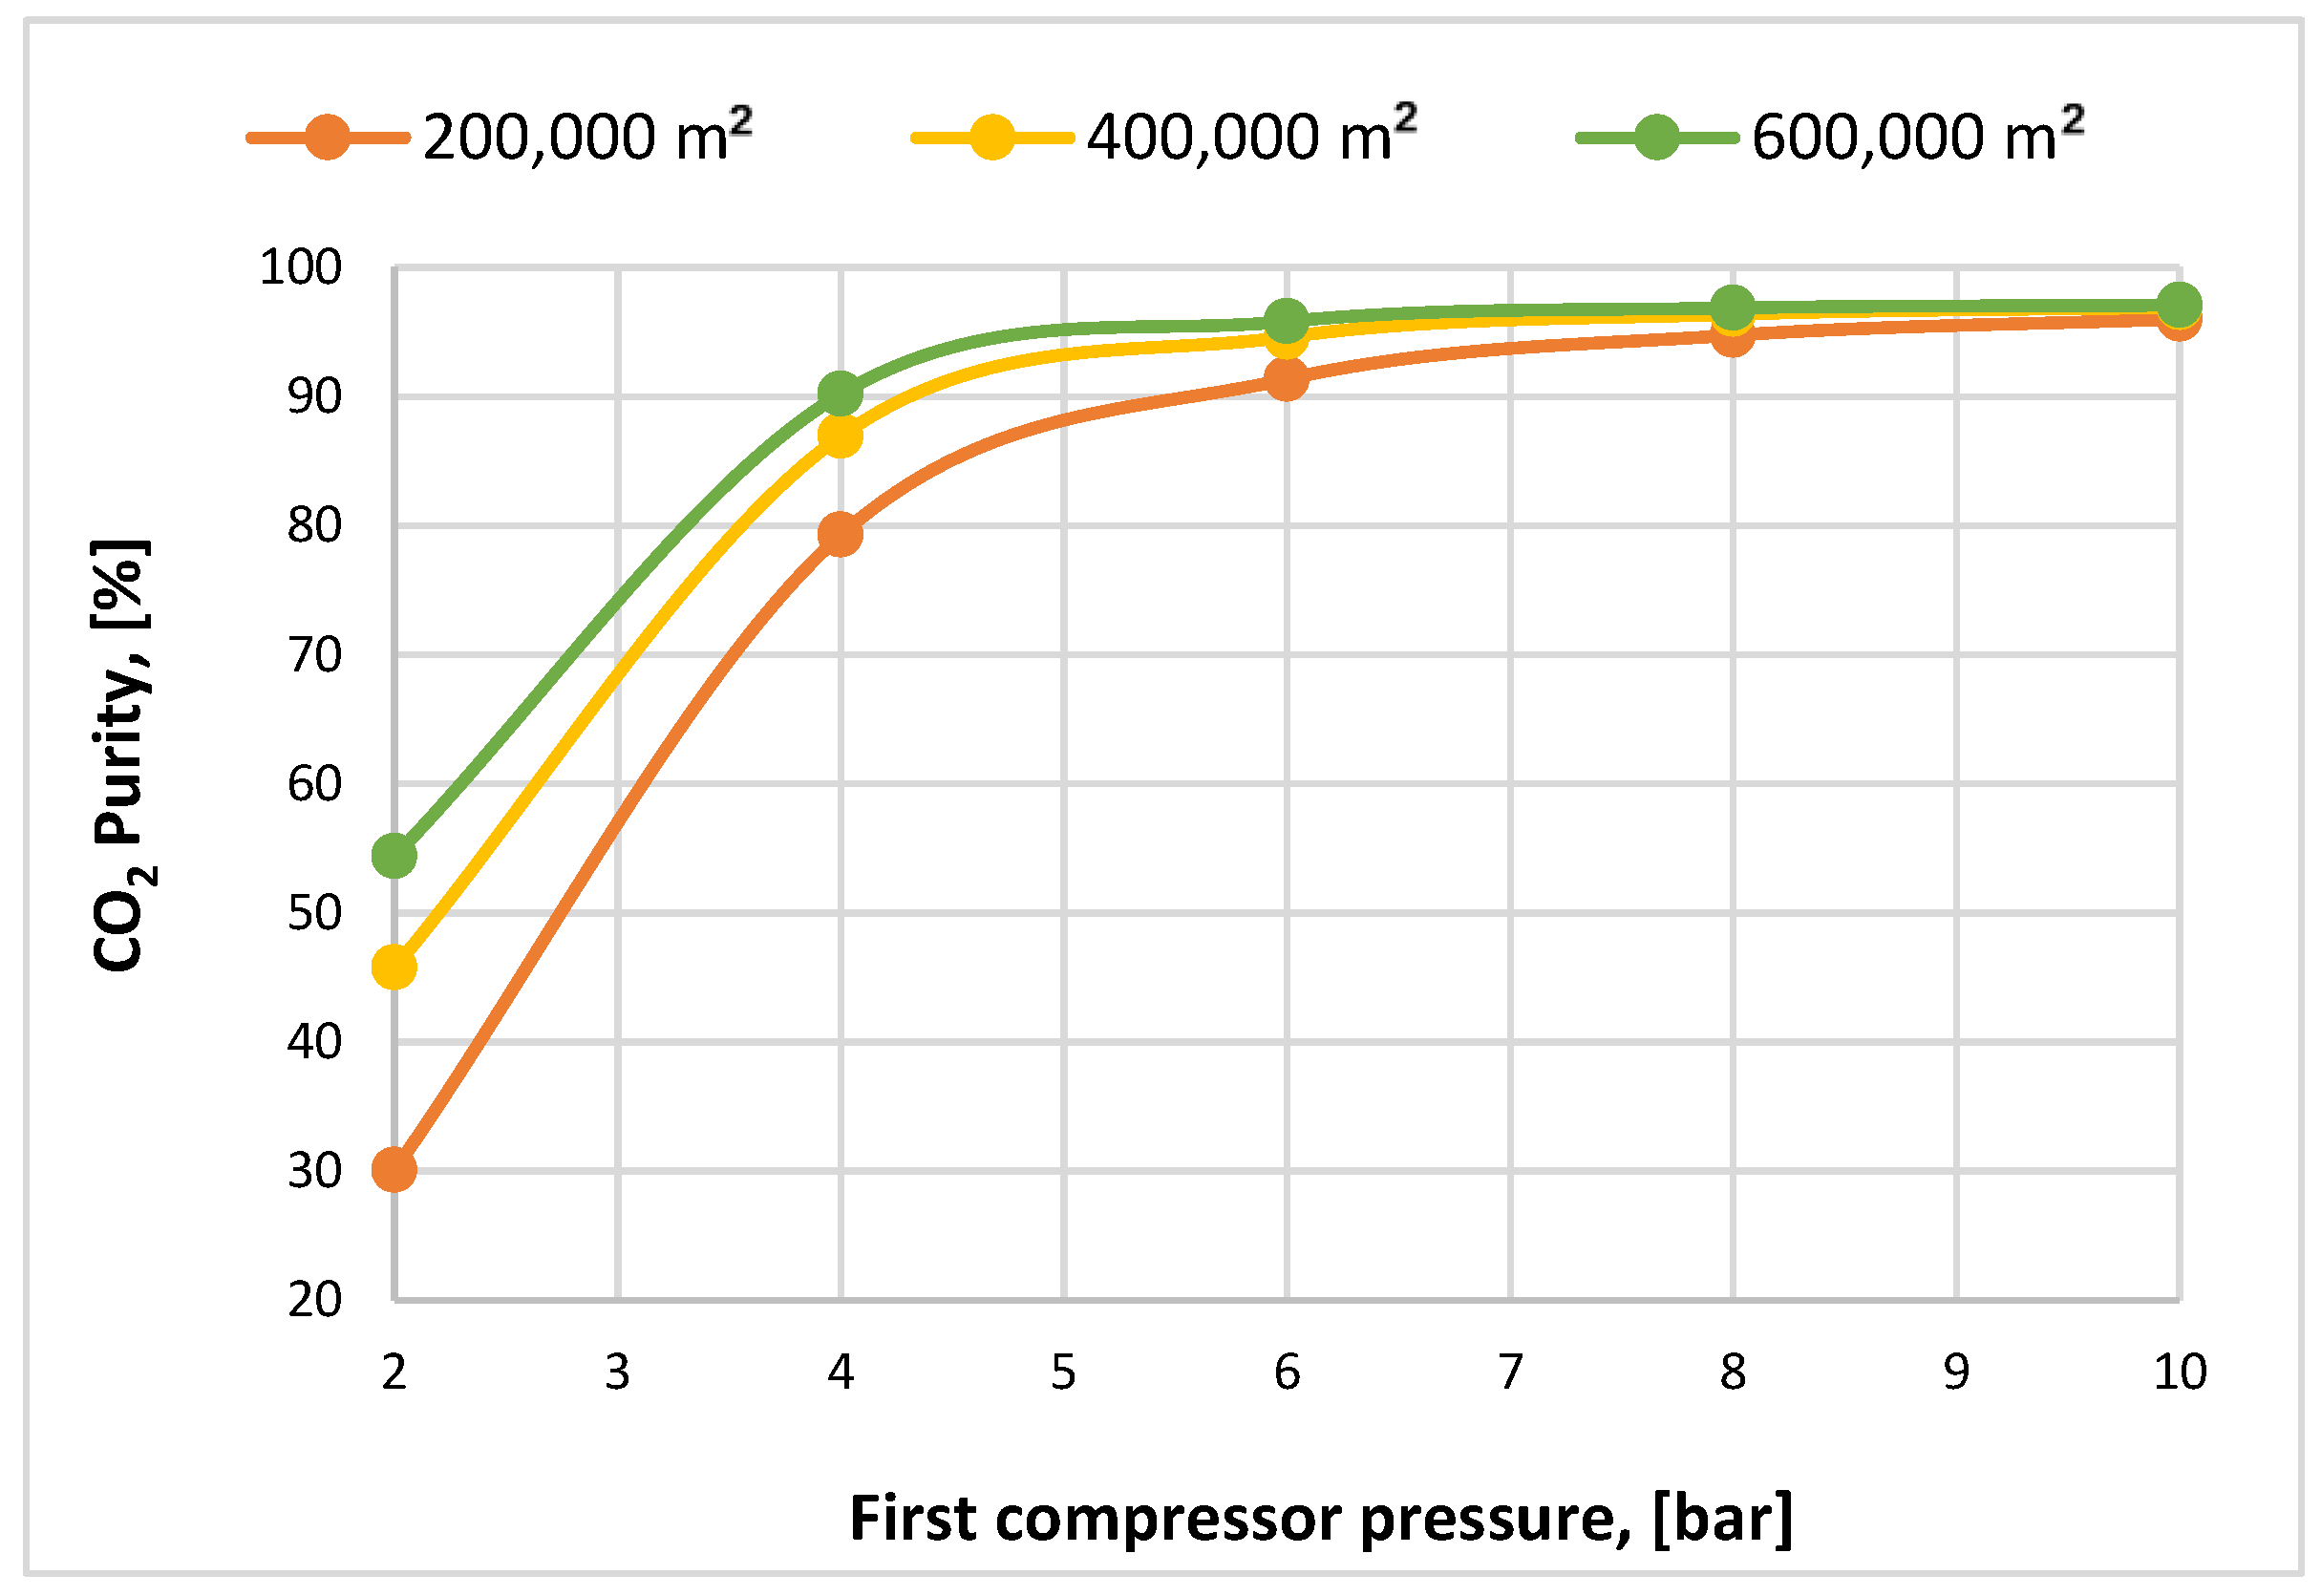
3.3. Effect of First Compressor Pressure and Membrane Area on CO2 Purity

Based on Figure 8, increasing the first compressor pressure provided a mitigation in the membrane surface for a particular CO2 purity, which presents the importance of integrating different values of membrane surface to optimize the optimum value. At 8 bar, almost more than 95% of CO2 concentrations passed through the membrane at all the surfaces examined, due to the high compression difference across the membrane that boosted the CO2 purity. On the other side, low values of compressor showed poor CO2 purity where there is insufficient driving force to raise that parameter.

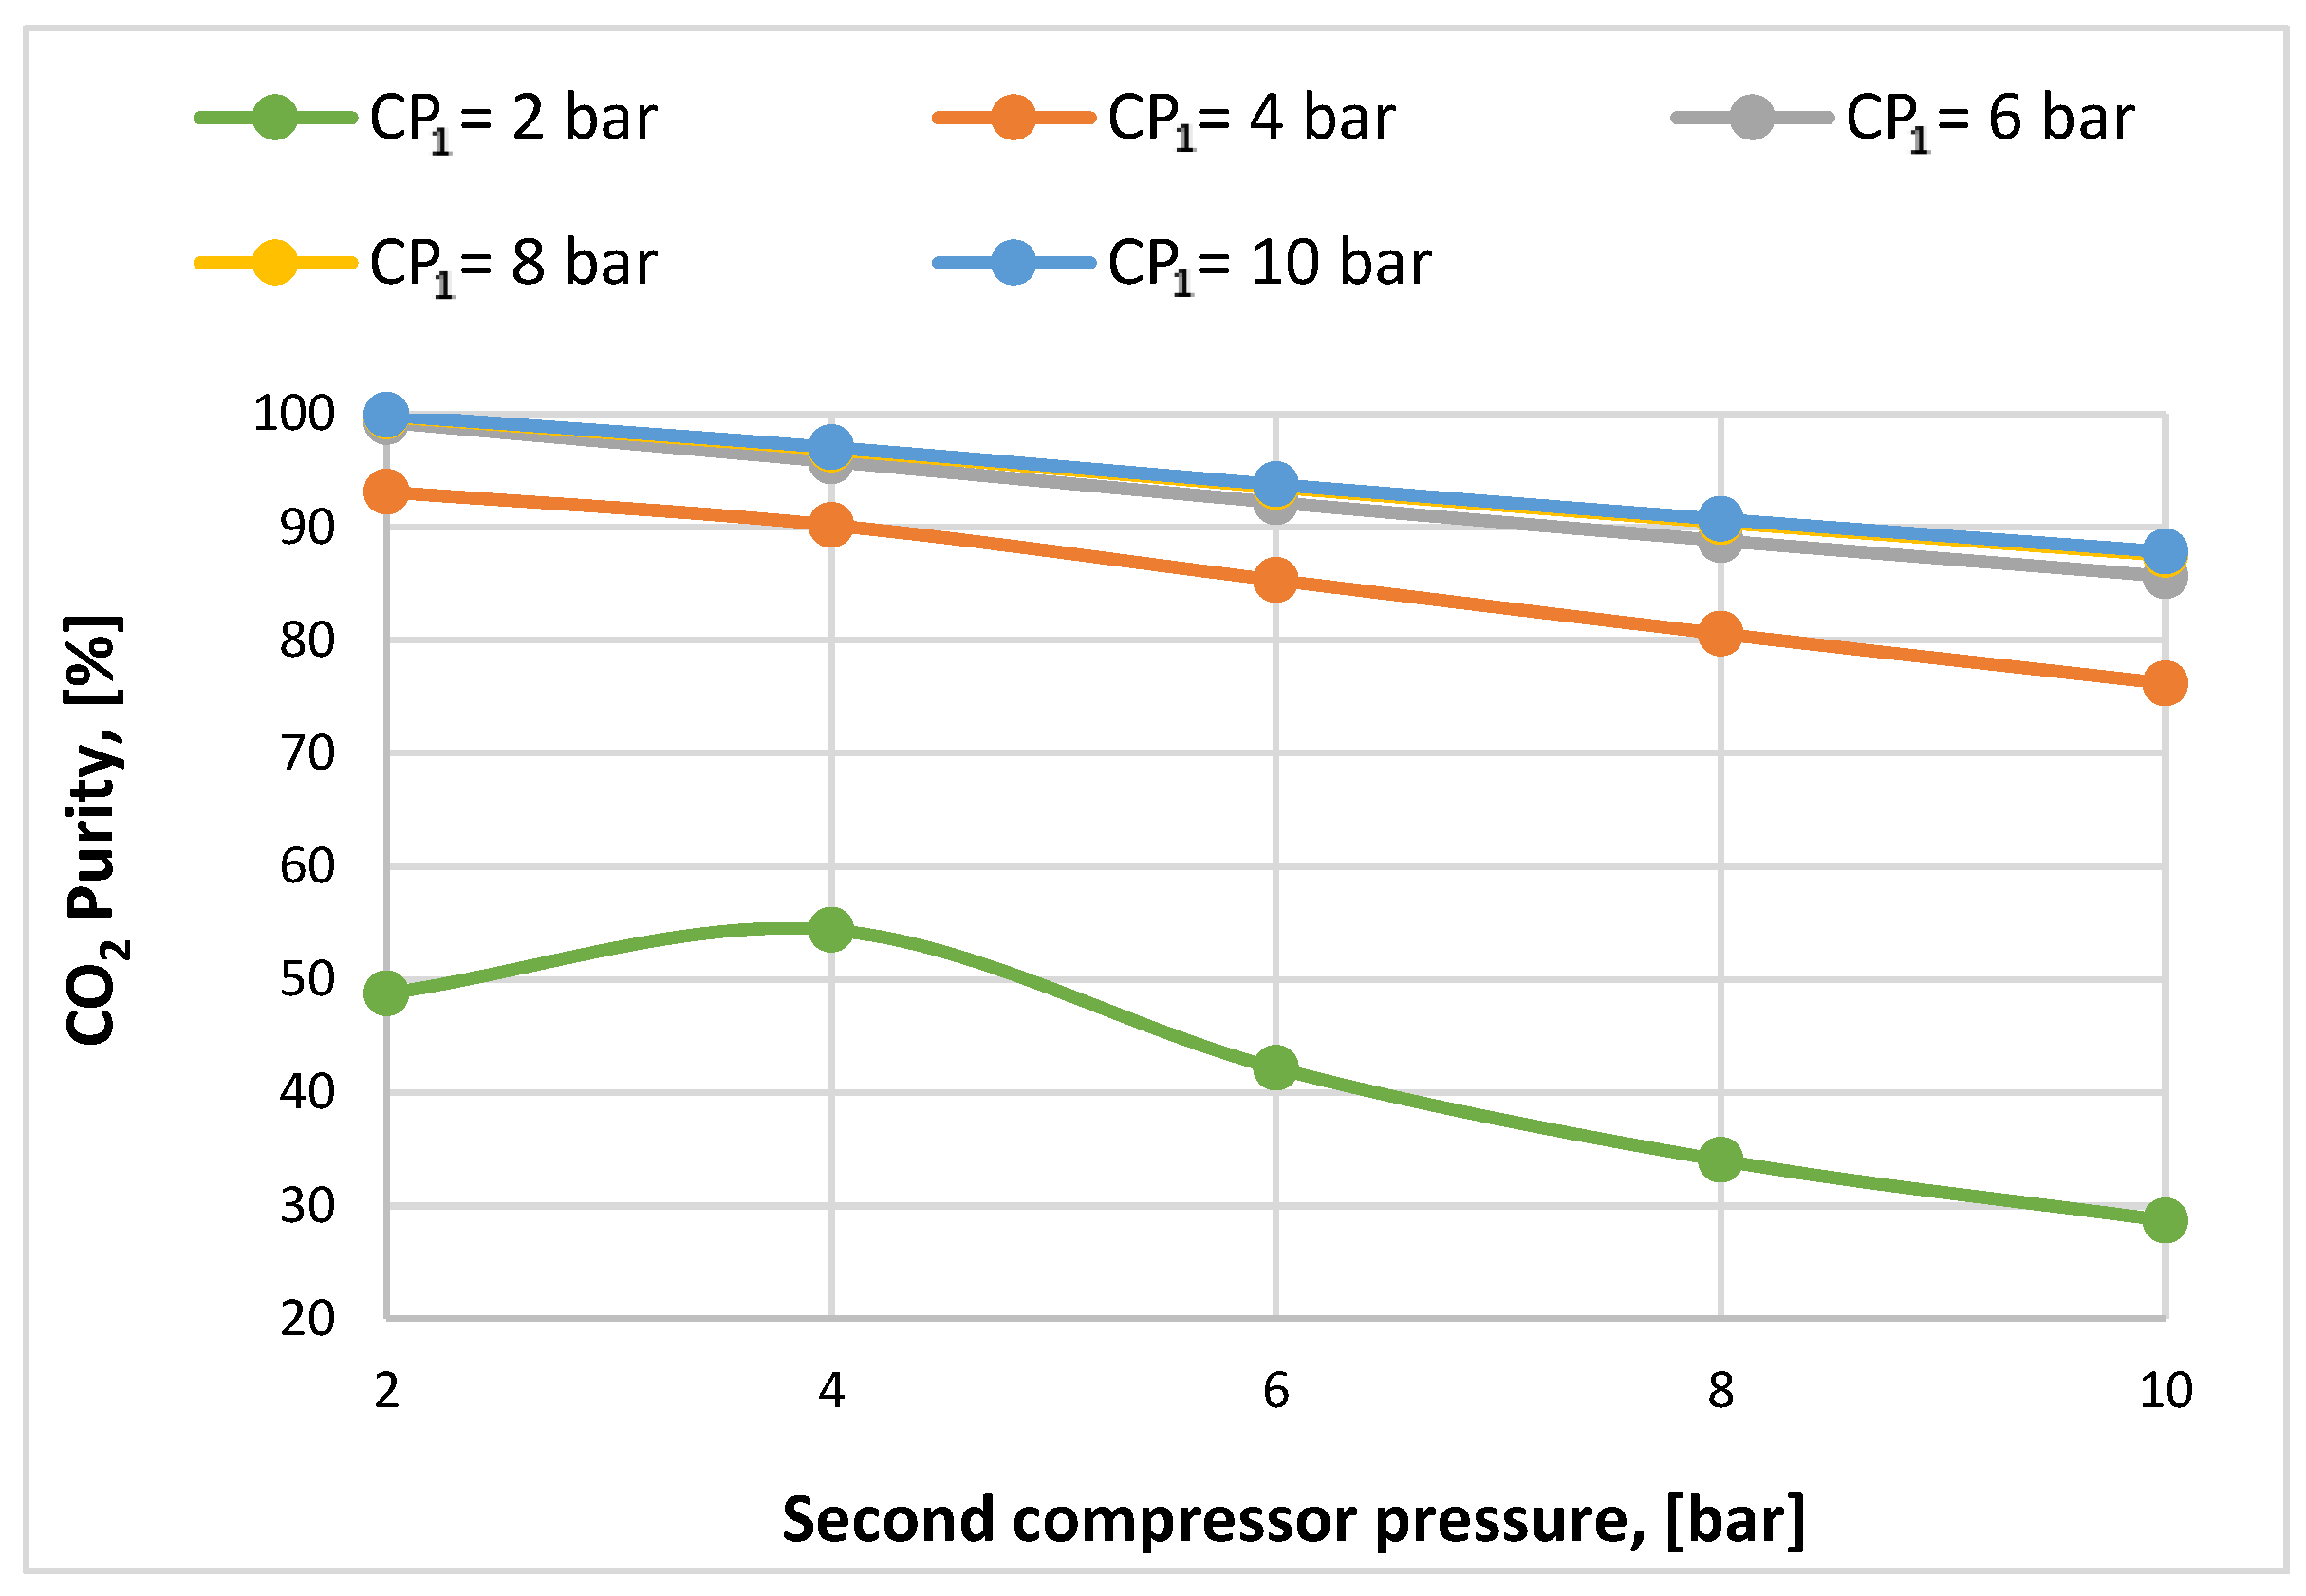
3.4. Effect of Second Compressor Pressure on CO2 Purity

Figure 9 shows the effect of the second compression unit on CO2 purity for a different CP1. Increasing the pressure values of CP2 from 4 to 10 bar constantly generated a reduction in CO2 purity, due to the N2 contents passing through the membrane module with carbon dioxide molecules, which led to a decrease in the CO2 purity in the flow captured. In the case of 2-bar CP1, there is a peak in 4-bar CP2, which can be explained by a low gas-mixture stream passing through the membrane (low capture efficiency) where N2 molecules retentate in poor quantities. Furthermore, a higher CP2 increase provided for more N2 passing together with CO2, and therefore lower CO2 purity.

3.5. Main Results of the Techno-Economic Assessment

As the first compressor pressures of 2 and 4 bar represent weak results in terms of CO2 capture efficiency and purity, Table 4 demonstrates the techno-economic assessment of the main outcomes regarding membrane two-stage design considered in the current paper. In the same membrane surface area, a different CP1 is estimated to demonstrate the effect of the compression unit on the economic indicators such as LCOE, CO2 capture and avoided cost. The table was estimated at 4 bar of the second-compressor pressure because, at this value, the capture efficiency of 90% and purity of 95% were achieved. As shown in the table below, integrating the membrane system into the power plant reduced the net power generated by around 31%, 45%, and 58%, respectively, based on CP1 at 600,000 m2 MSA1. That reduction is due to the power consumption that constantly rises at higher CP1, where that power is consumed from the CFPP power generation. In terms of LCOE, the membrane surface area has a major effect on it, where enlarging the membrane area provided a continual increase in LCOE due to the high CO2 concentration captured, and passed the module. By considering the influence of the first-compressor pressure on the CO2 captured cost, increasing the pressure from 6 to 10 bar at 200,000 m2 led to a reduction of around 57.4% of the cost value. The lowest CO2 avoided cost obtained was at 8 bar of 400,000 m2, which was 86.72 EUR/t, yet it does not count as the best case (technically) in which the capture efficiency was not successfully achieved (90% was this paper’s aim), see Figure 6. In Table 4 below, (n.a.) refers to an abbreviation of ‘not available’.
Table 5 shows the main parameters that indicate the economic evaluation of the CFPP with membrane integration for several CP1 and membrane areas. Considering the DPP, increasing CP1 from 6 to10 bar led to a reduction of around 24%. However, the case of 600,000 m2 and 8-bar CP1 was assumed as the optimum, based on the technical and financial outcomes achieved.

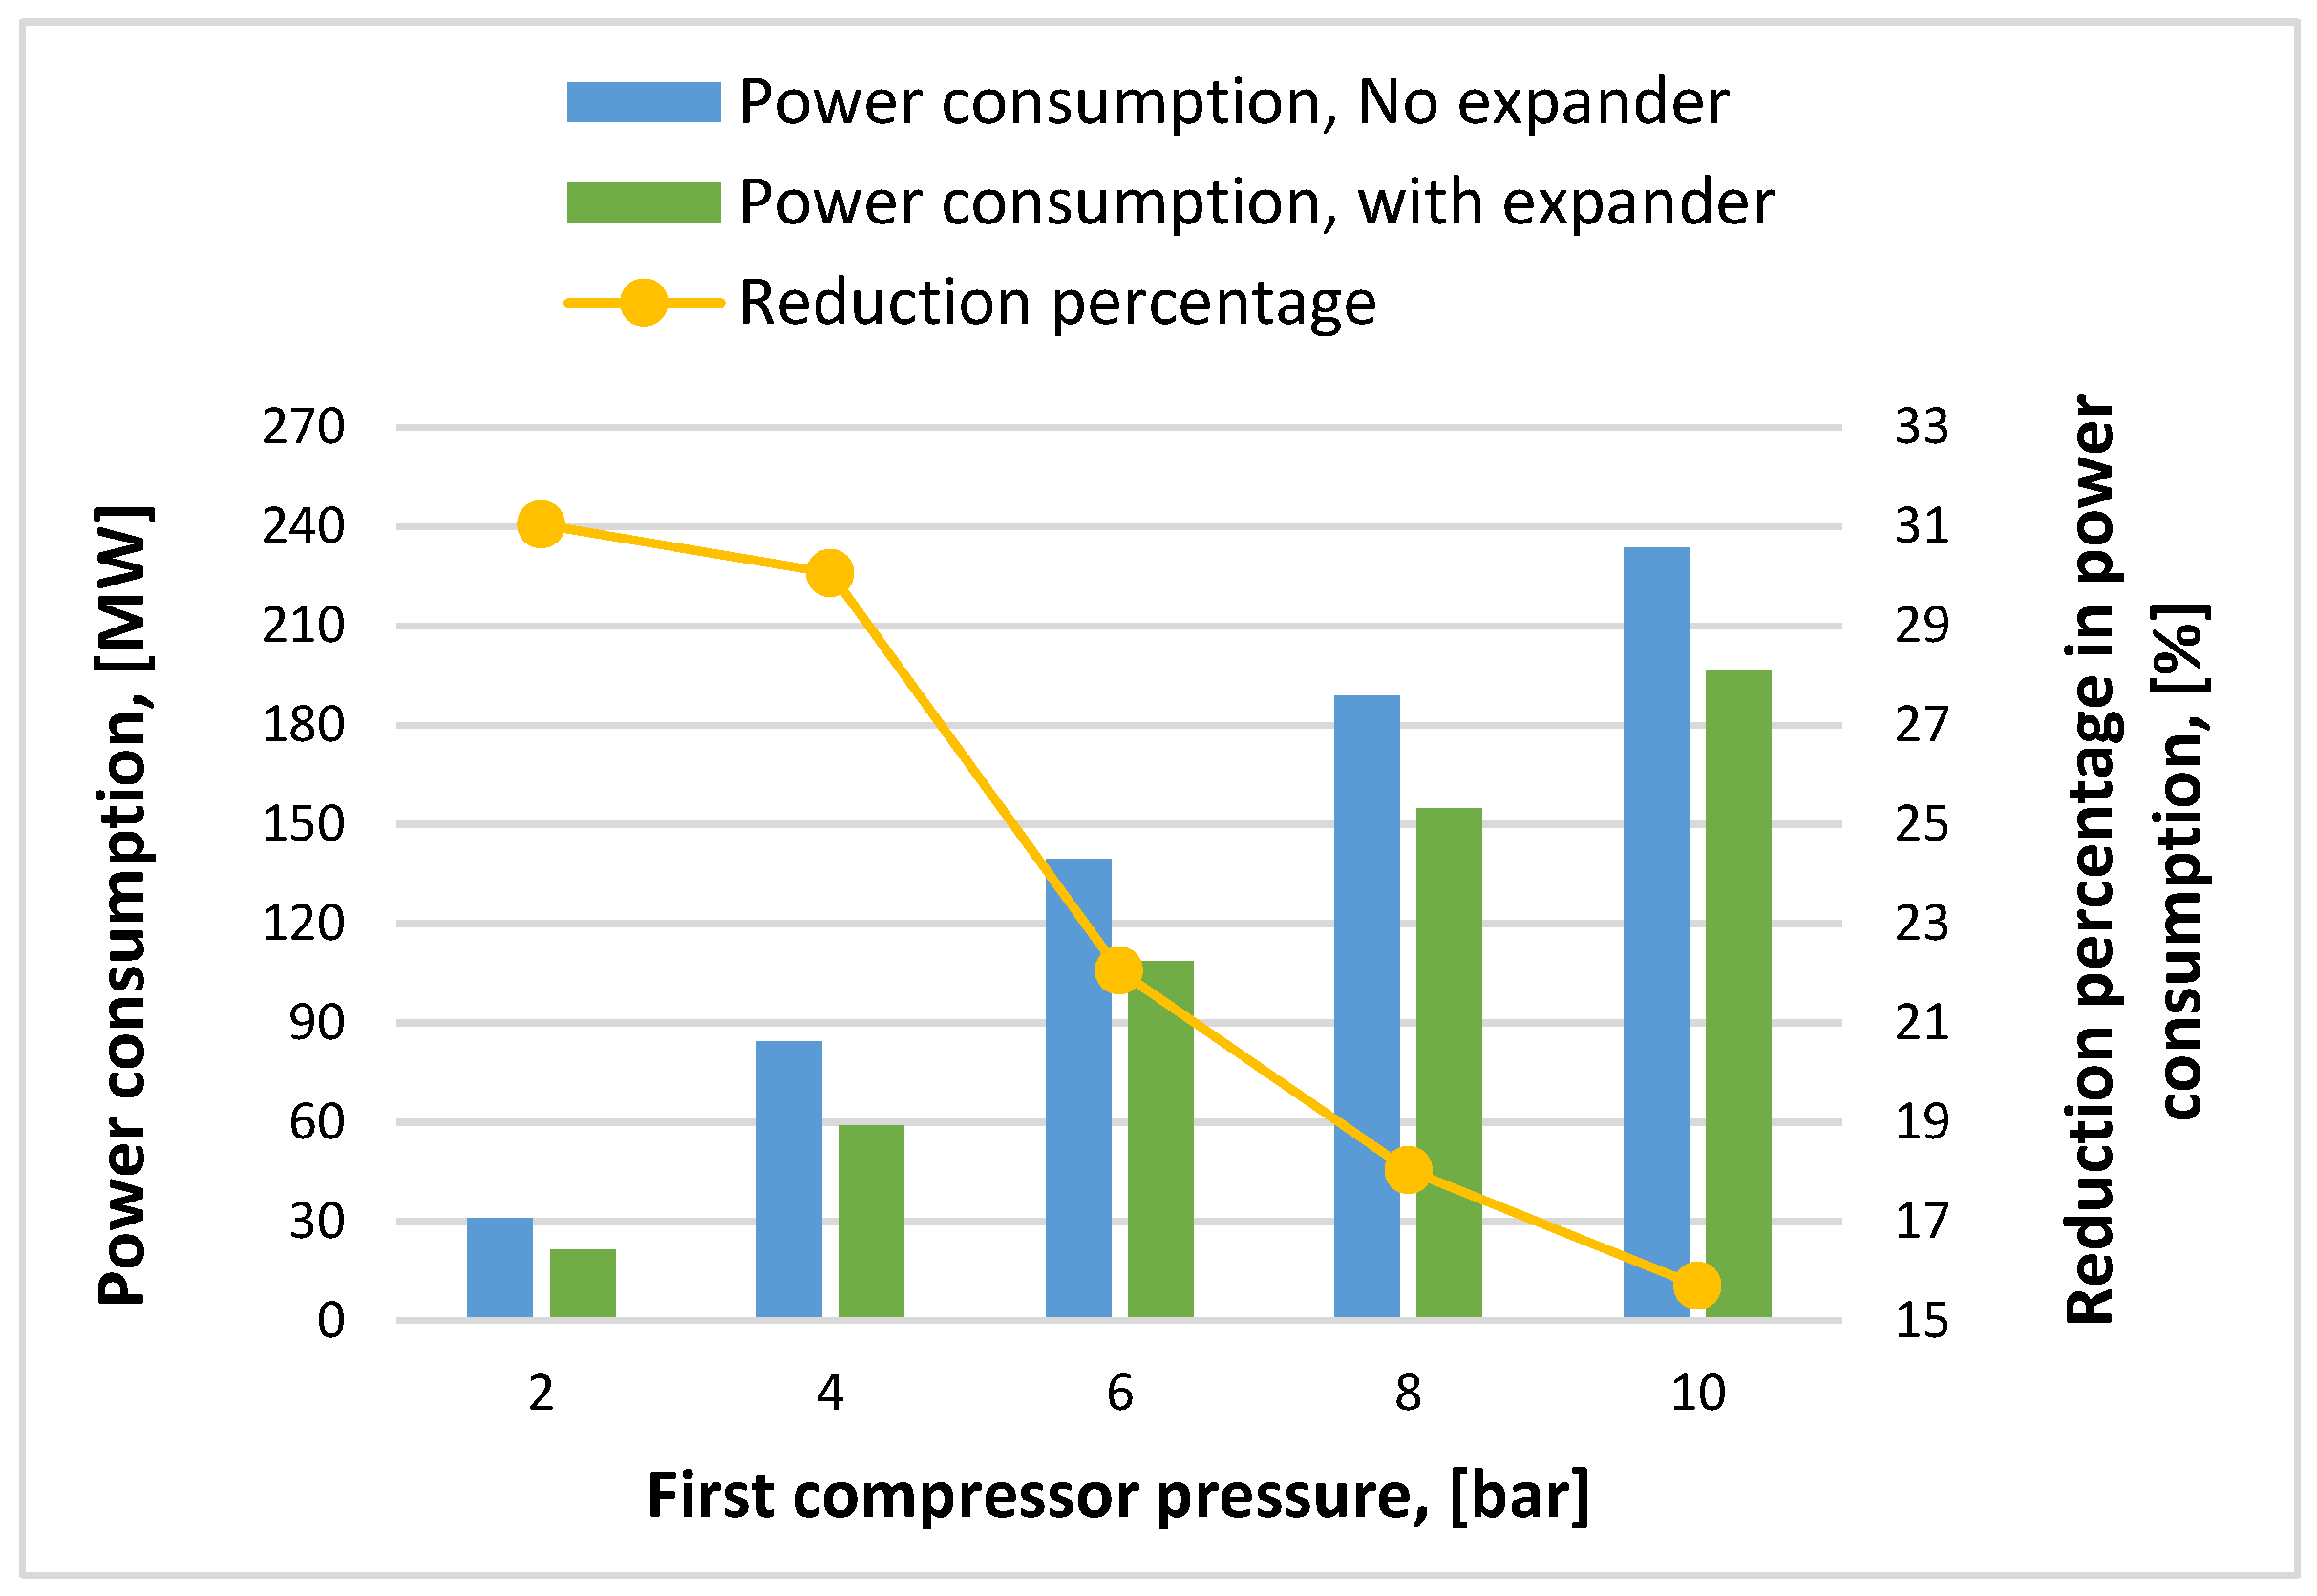
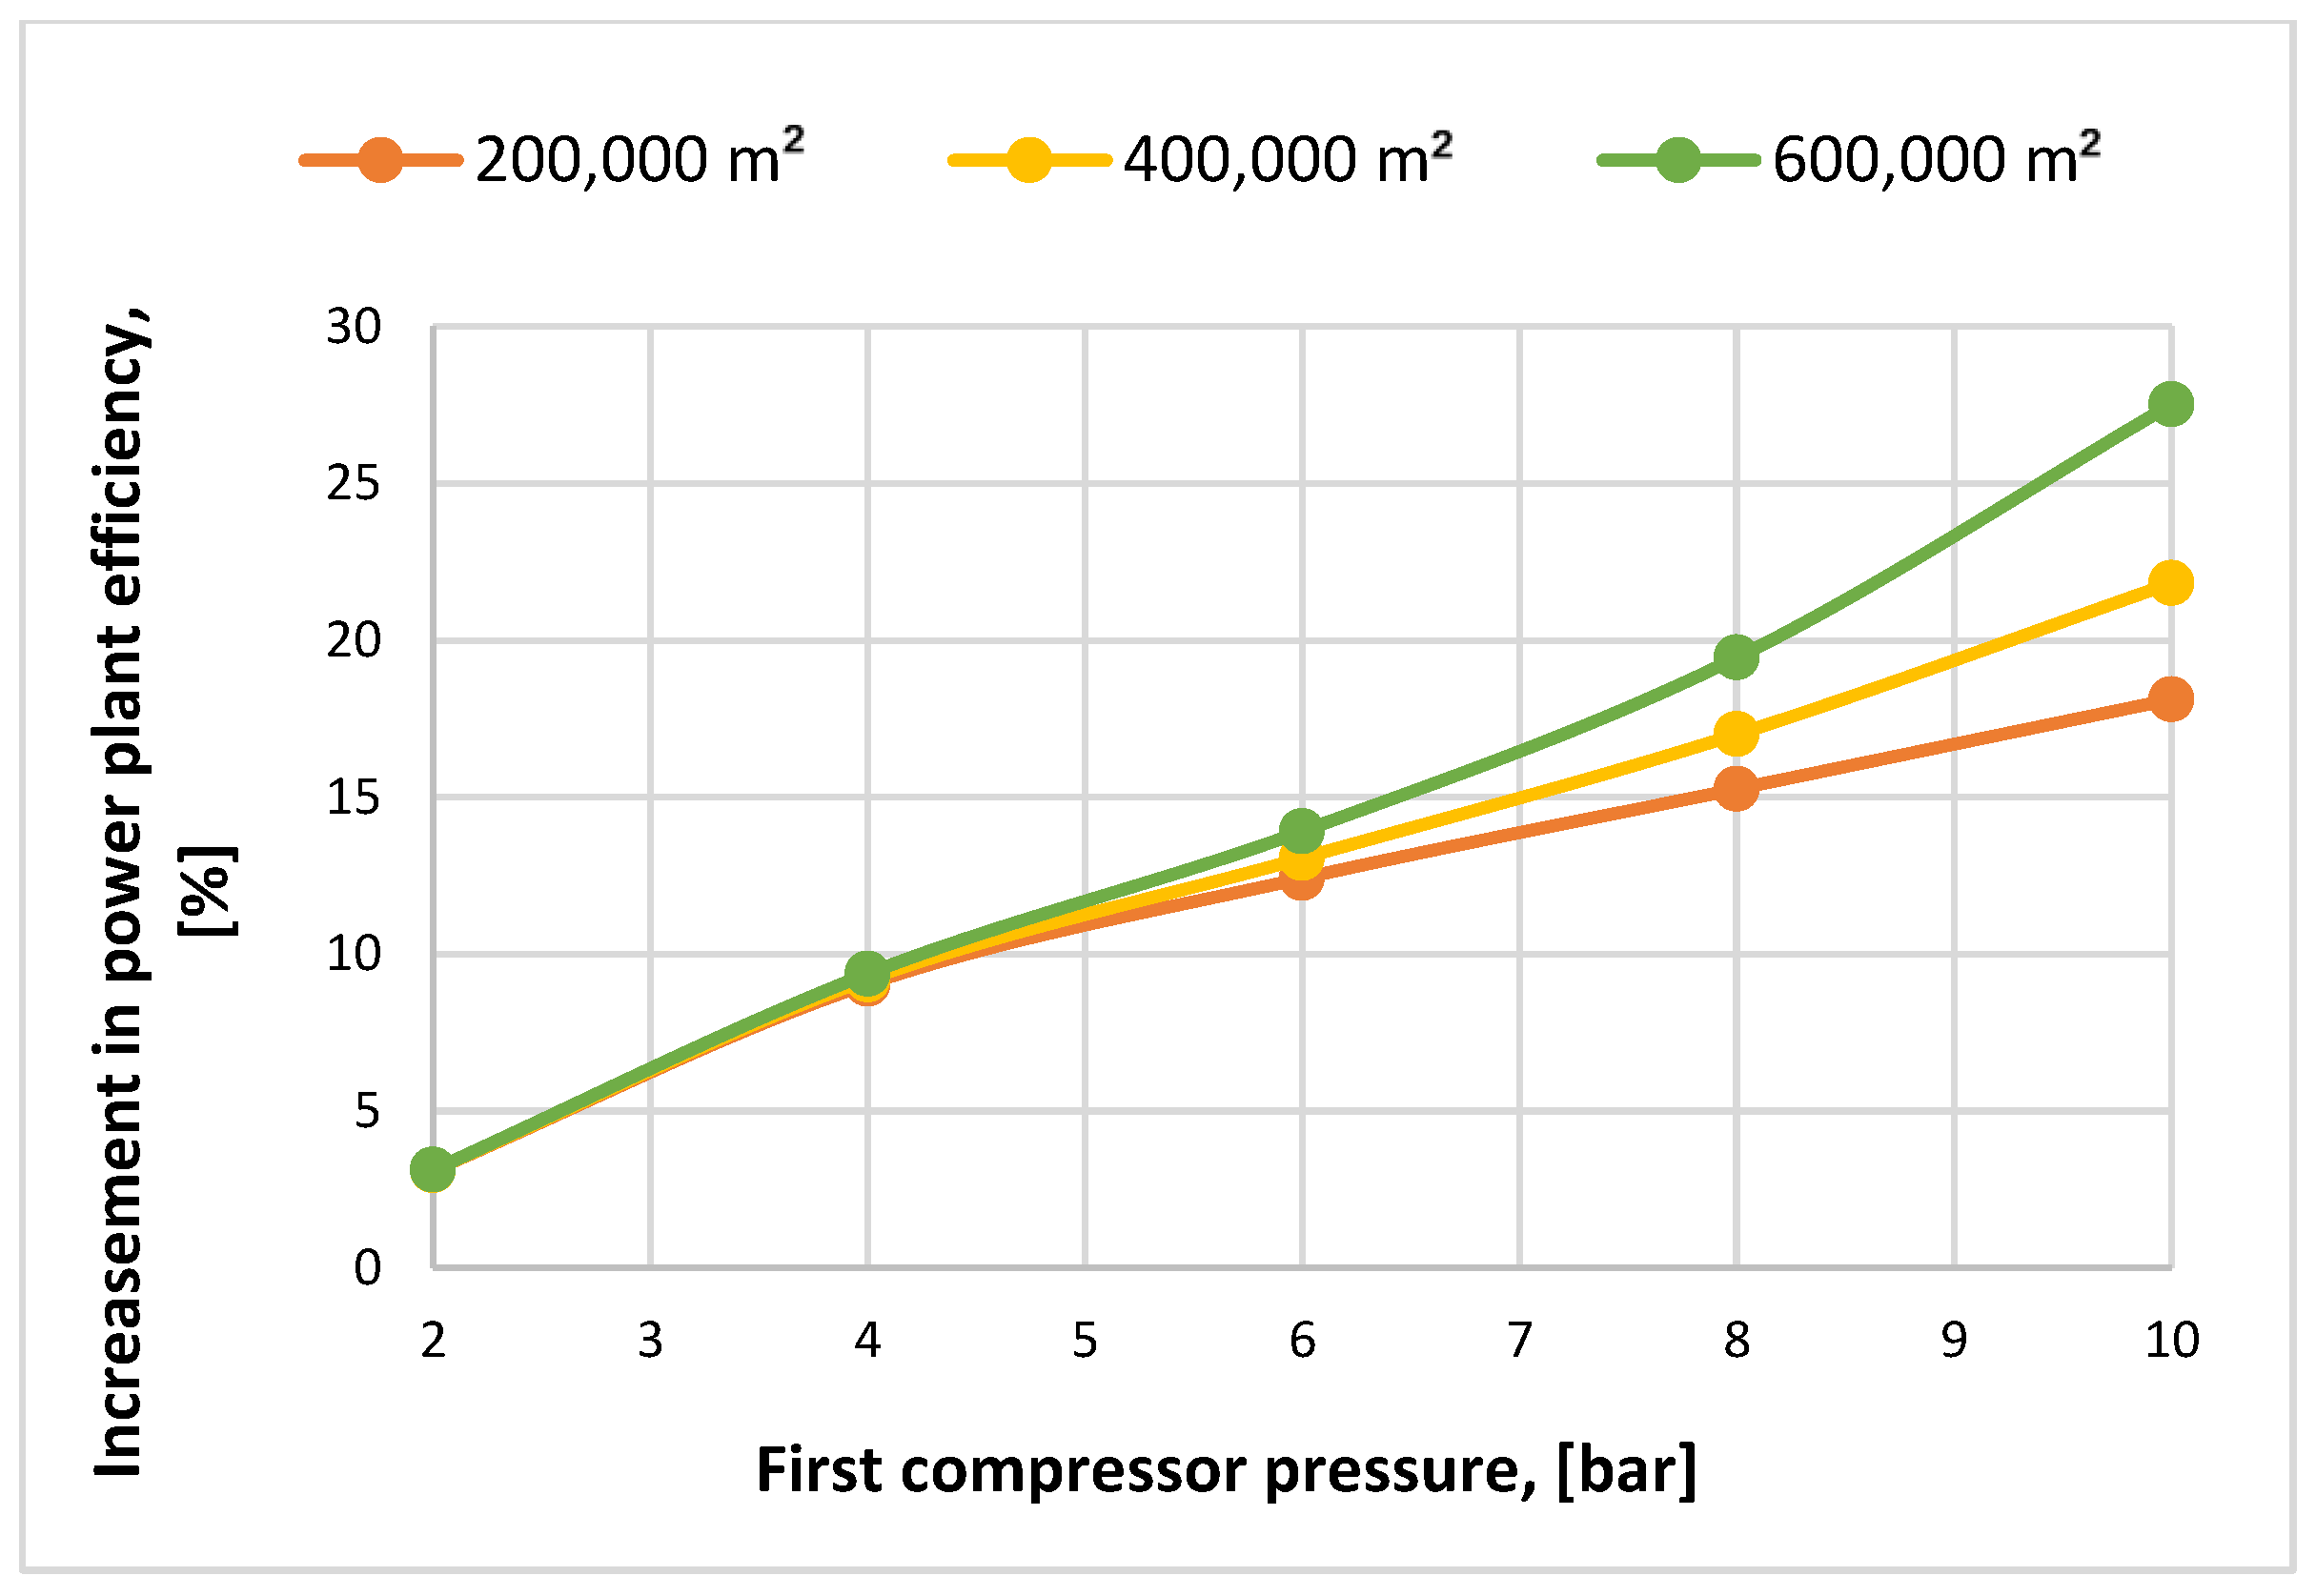
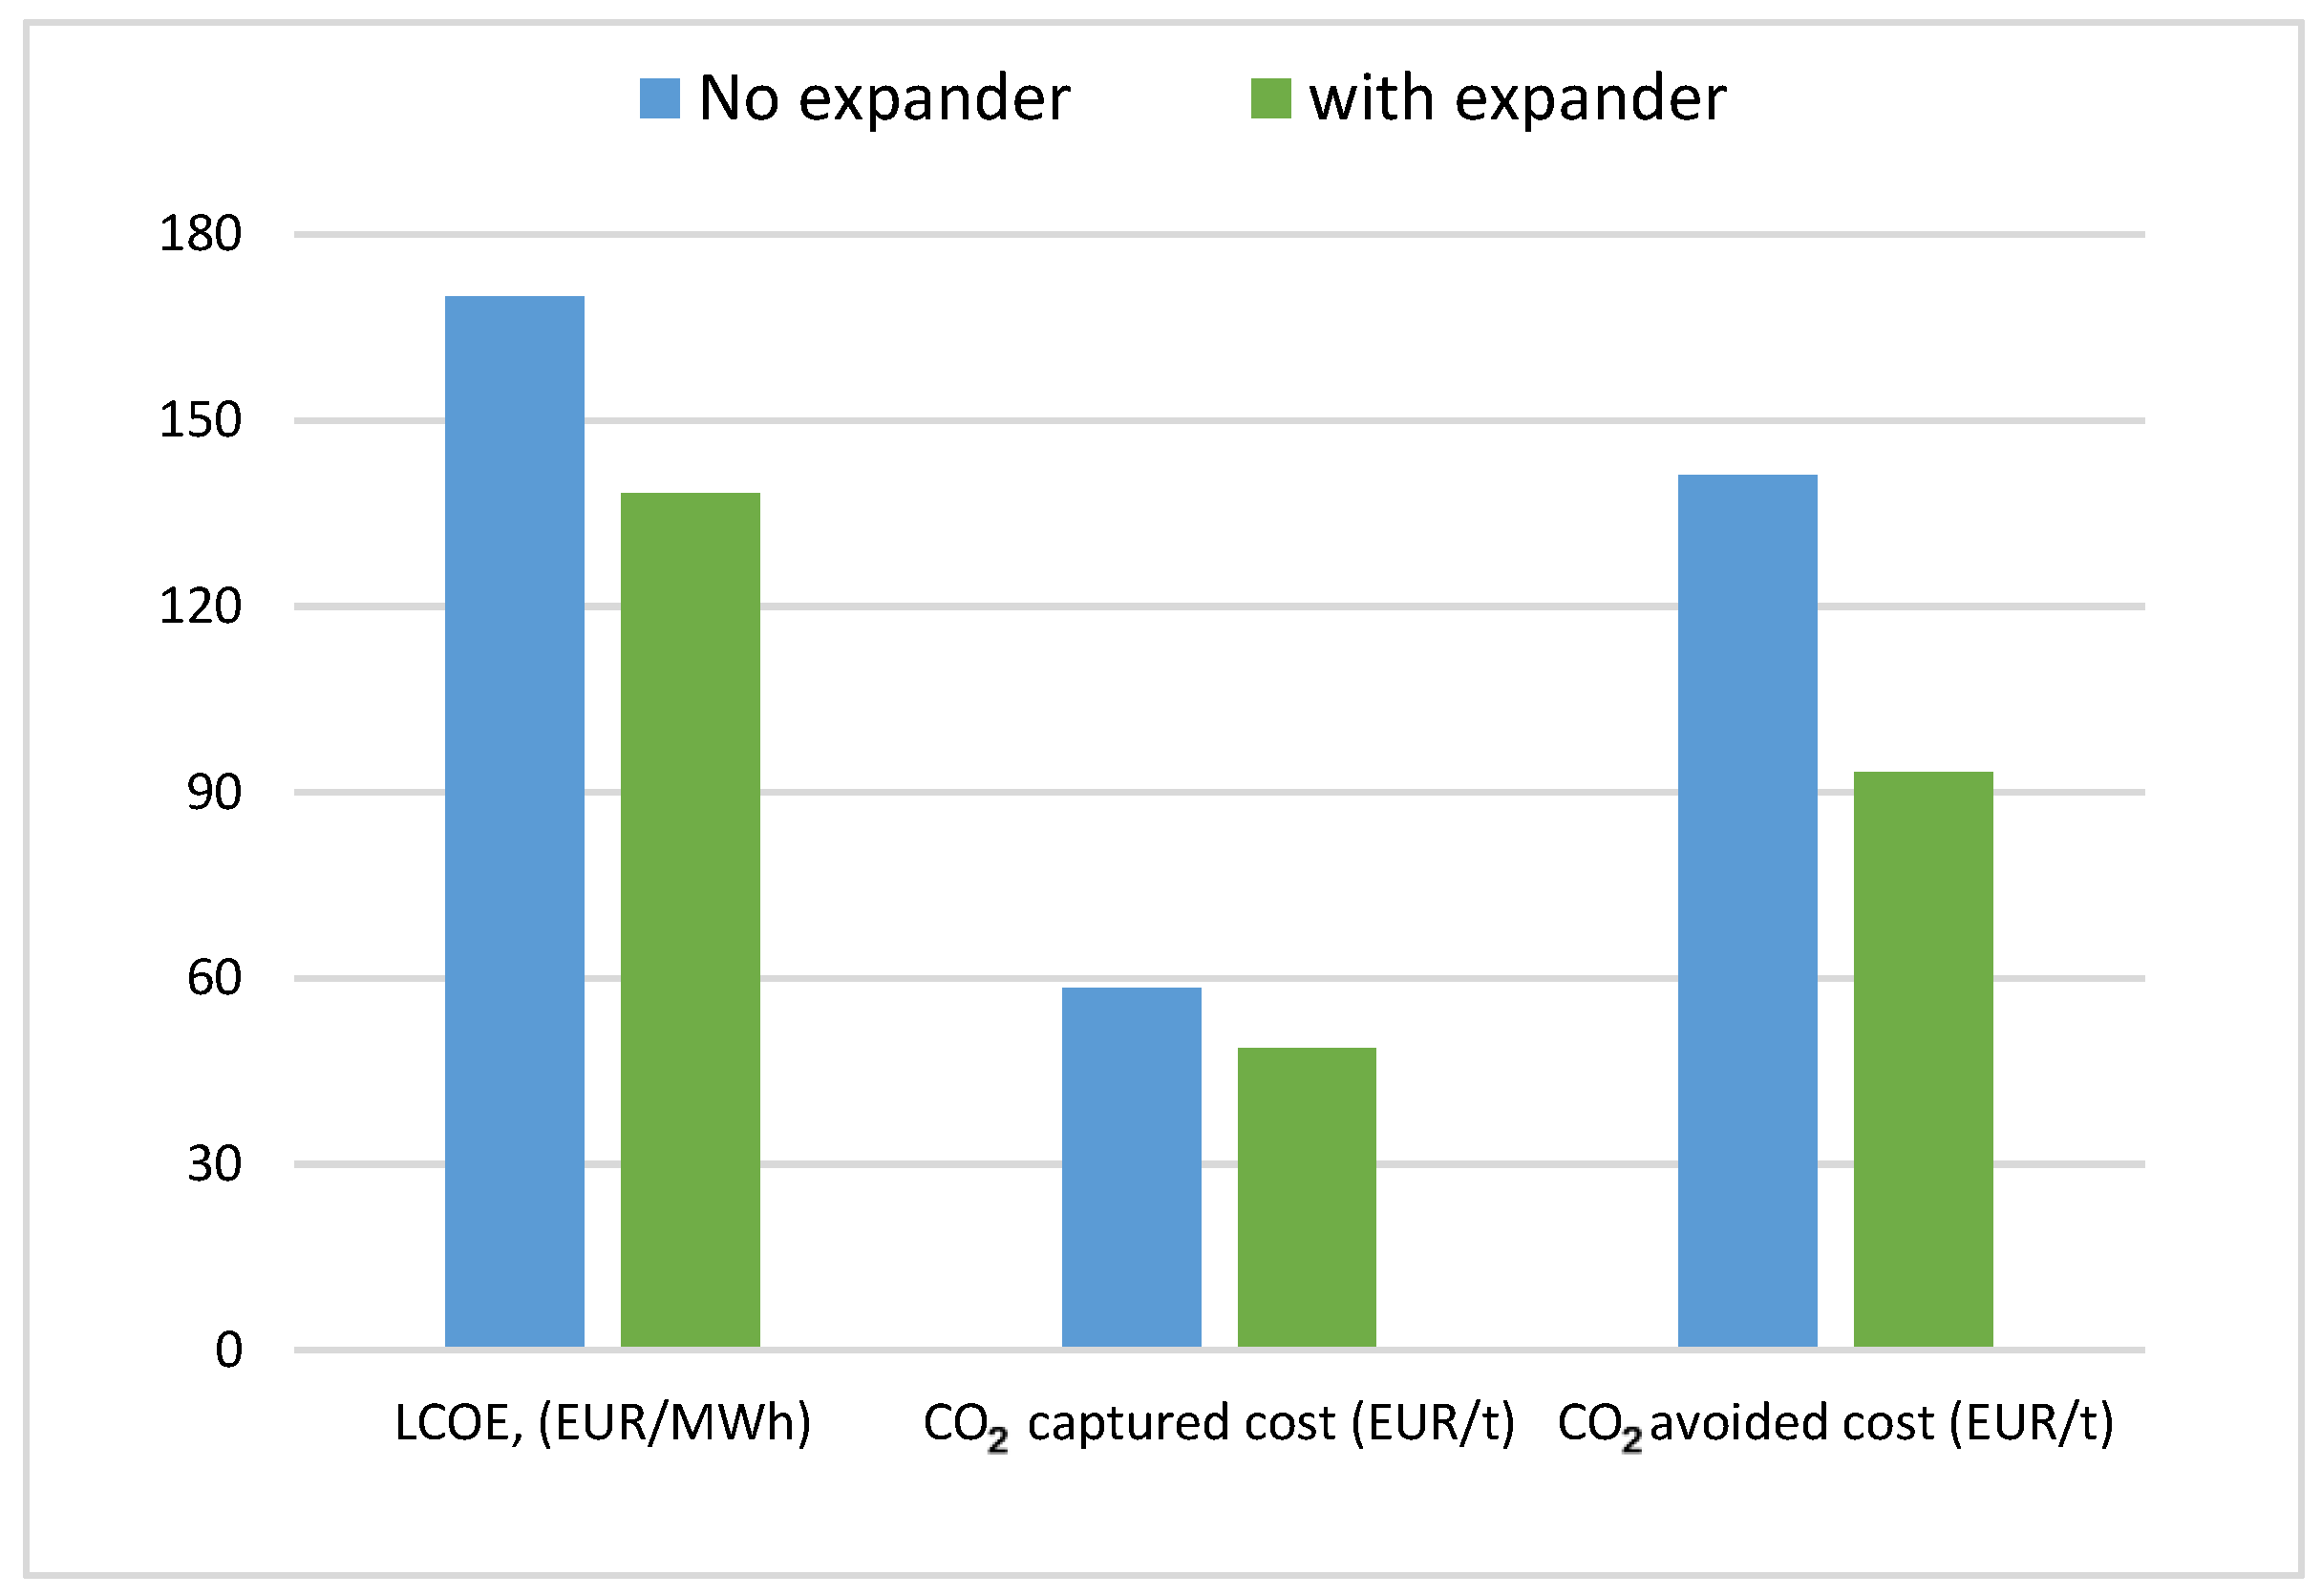
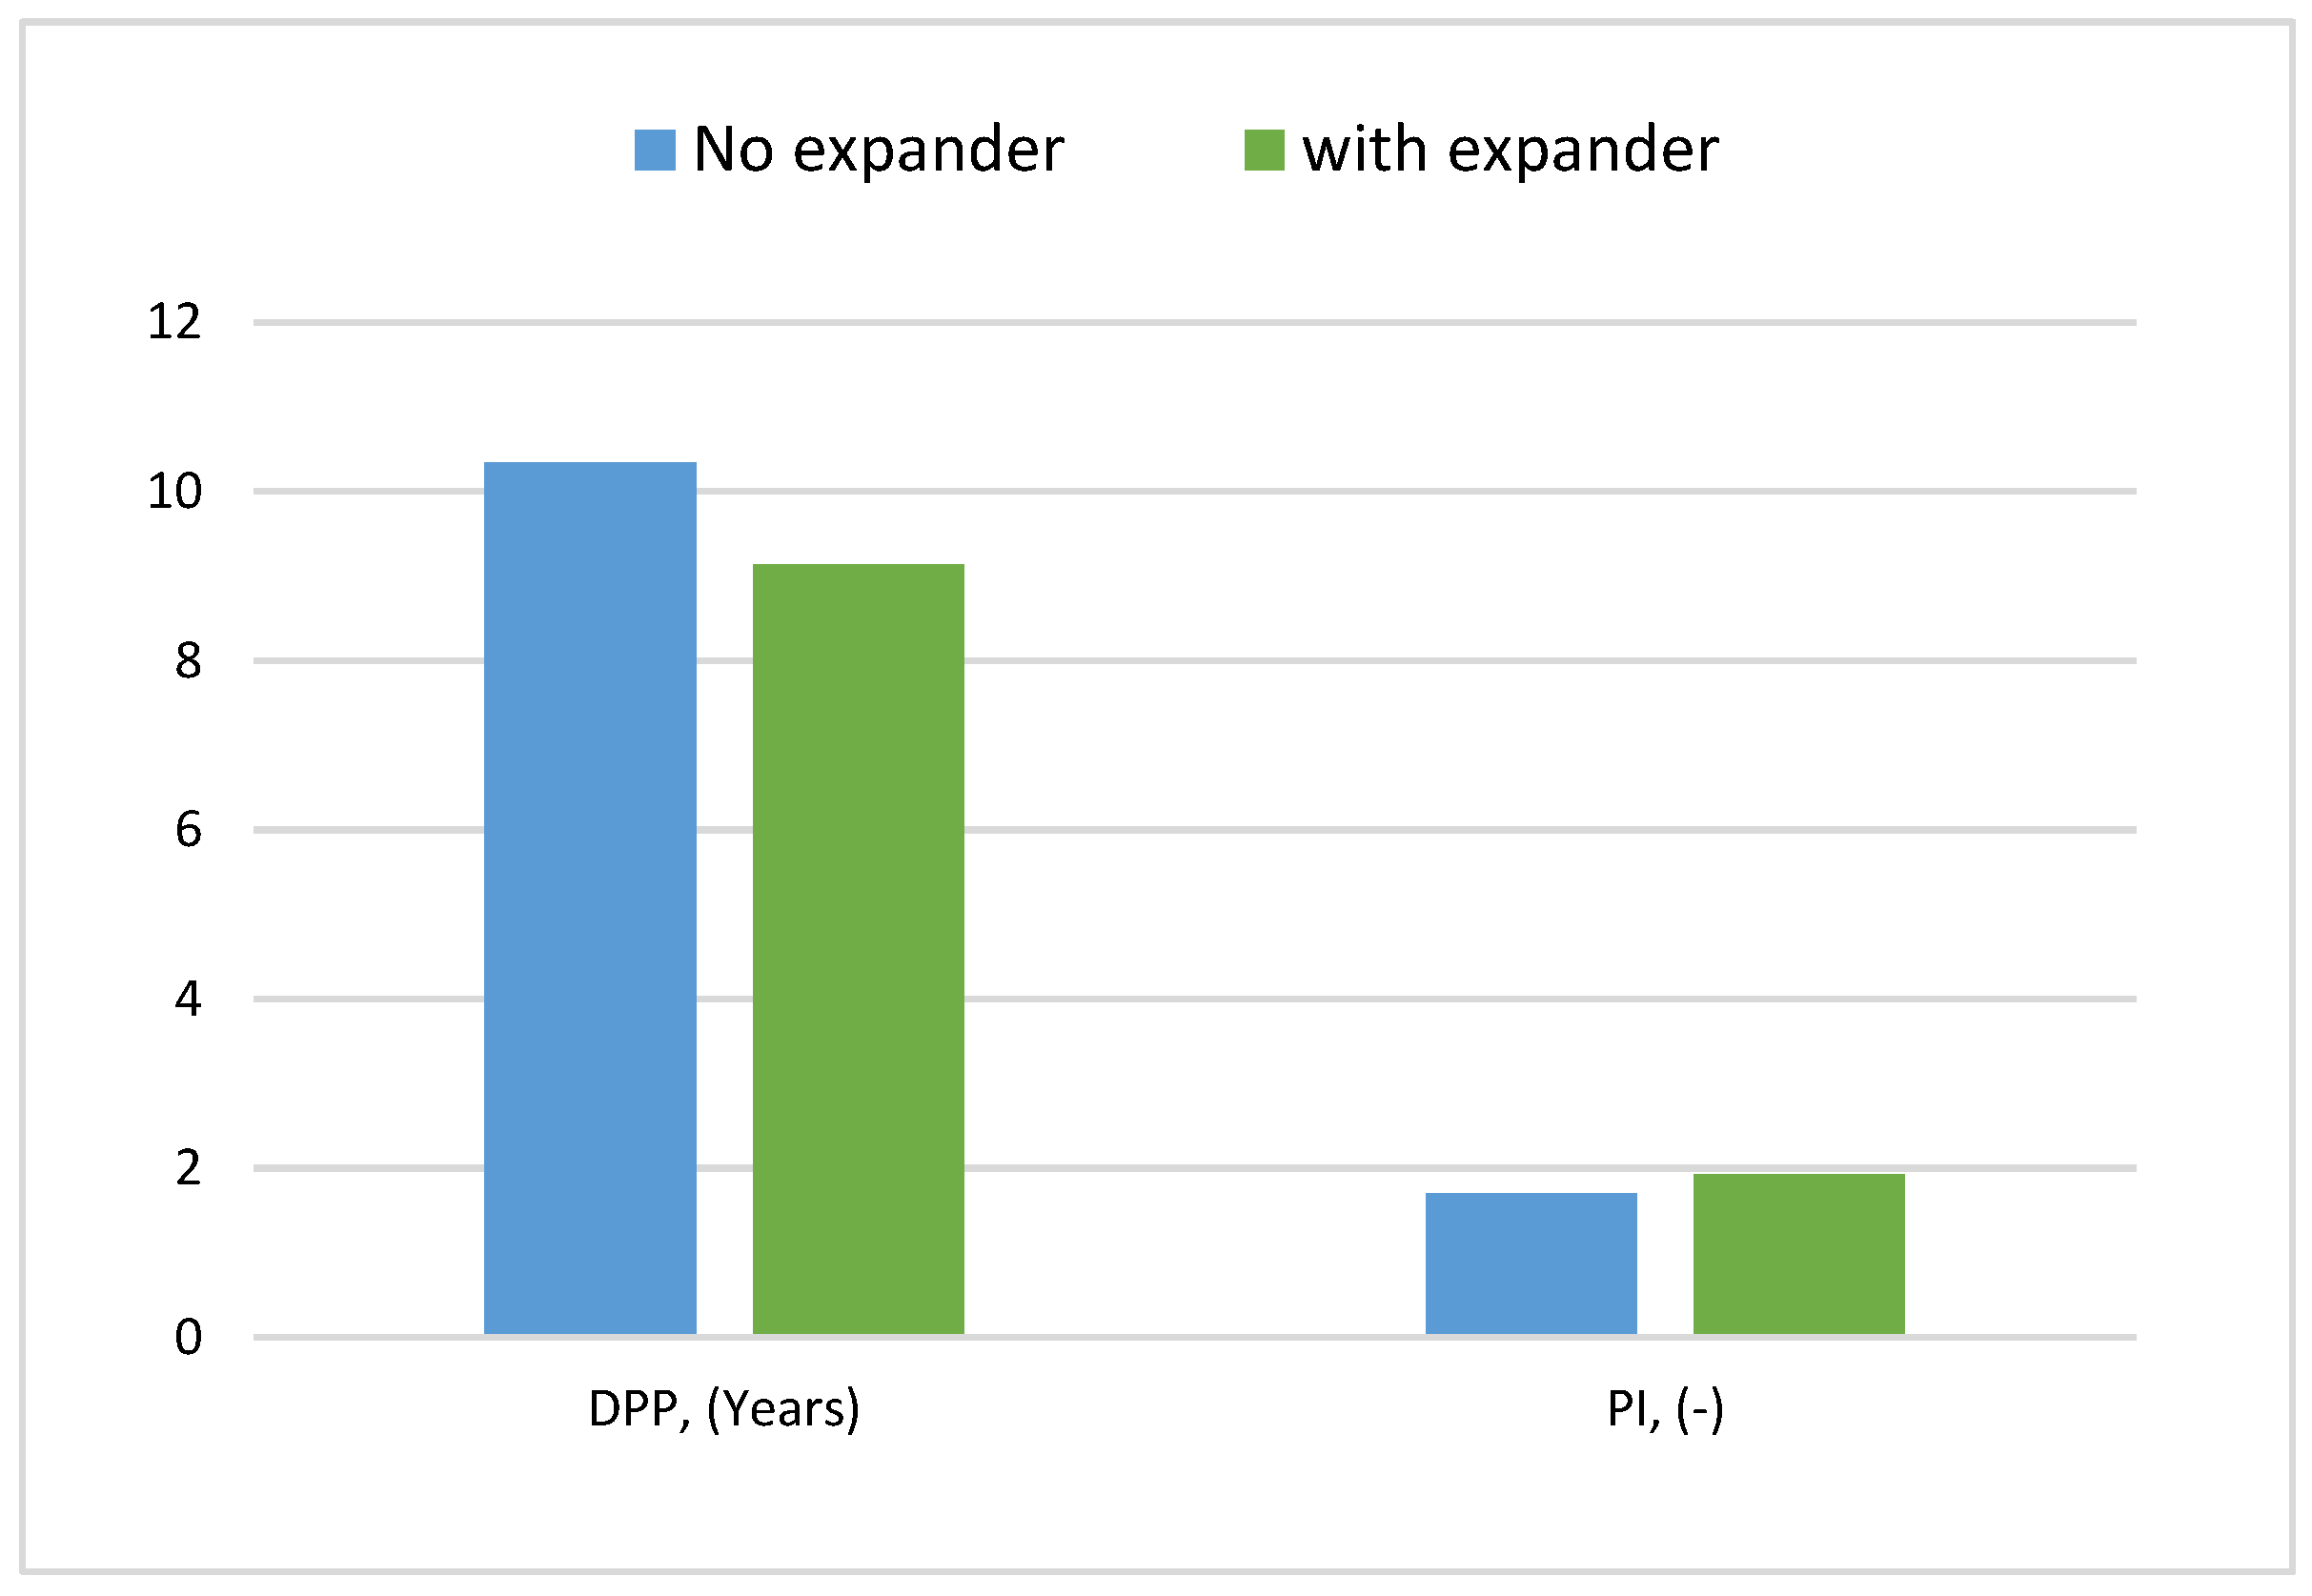
3.6. Benefits of Expander Use

To present the significance of expander utilization in membrane CO2 capture systems, the following figures are illustrated as a comparison between CFPP of 330 MW integrated into a membrane system with an expander and the same system without an expander, based on several parameters (e.g., total power consumption, CO2 captured cost, CO2 avoided cost, … etc.), where the main results of two membrane stages were researched and published in MDPI (Membranes journal) [53].
The influence of the harnessing expander unit located in the retentate stream of the first membrane module (at 600,000 m2) on total power consumption, together with the reduction percentage in power consumption, is demonstrated in Figure 10, below. Increasing the CP1 from 2 to 4 bar shows a low reduction percentage in power consumption due to the faint electricity required for the capture process. On the other hand, from 4 to 6 bar shows a large reduction (26%) from 30 to 22%, because of the elevated growth in power consumption (from 84 to 140 MW).
Figure 11 clarifies the CFPP efficiency increase, based on several CP1 and membrane areas. As presented in the figure, increasing the compressor pressure with a greater membrane area provided a continual rise in the plant efficiency because of the large energy recovered by the expander at the higher-compressor-pressure units. Increasing compressor pressure values of 2 and 4 bar showed no evident impact on the power plant increase rate at any membrane surface area, due to the low retentate stream pressure arriving at the expander unit.
The effect of expander utilization in membrane CO2 separation systems on different economic indicators is illustrated in Figure 12, below. The expander use has a considerable influence on the indicators of the total project finance, with a reduction of almost 19% in LCOE, 16.5% in CO2 captured cost, and 34% in CO2 avoided cost. That reduction can be explained by the decrease in total electric power required for the capture process after energy recovery by the expander unit.
Figure 13 represents the advantage of expander utilization in the plant net-power generation at a different CP1. It is visibly shown that power generation is more efficient when using an expander in membrane CO2 capture; where high power was generated at any compression value considered, the energy recovered by the expander helped to reduce the power consumption required for the capture process. The explanation for the power generation reduction is that a permanent increase in CP1 demanded that higher electricity was consumed from the plant capacity, which decreased the power generation.
In terms of economic estimation with respect to specific indicators, Figure 14 represents the expander’s financial benefit. The investment cost can be recovered by 12% less in the case of using an expander compared with the same project without expander use. As a profitability index, a more efficient project is obtained in the case of expander integration due to the high power generated by the CFPP.

3.7. Comparision between Our Optimum Outcomes and Others from the Literature

Table 6 presents a clear view of the optimum results obtained in the current paper after integrating the expander into the membrane CO2 capture process, with other results from the literature based on different technical and economical parameters. In Table 6, below, (n.a.) indicates an abbreviation for ‘not available’.
Validation of the current paper’s optimum results was implemented through comparing them with results obtained from different literature. The different gas fluxes, carbon dioxide fractions, and CO2 permeance in this study and other membrane CO2 capture method investigations are the causes of the variance in results. Since 80% CO2 purity requires lower power consumption, the authors in [30] were able to achieve a lower CO2 capture cost, of around 41% compared to our outcome. The authors in Reference [67] obtained a capture efficiency of 70% with 58% CO2 purity, instead of using a membrane material of high CO2 permeability (2200 GPU), which is why the power consumption is much lower than our system’ power requirements. Low capture efficiency (80.3%) and flow rate introduced into the membrane system in Reference [68] provided a more beneficial project for the membrane gas separation process due to the low CO2 captured cost obtained compared to our result. However, based on Table 6, the results acquired from our paper demonstrate an efficient techno-economic analysis for integrating the membrane CO2 capture system into a CFPP.

4. Conclusions

This research presented a methodology that provides optimal outcomes and standards for the assessment of the membrane-based gas separation process. To conduct a techno-economic evaluation of the CO2 capture from a CFPP (330 MW) through the use of an energy recovery system, a parametric analysis was essentially imposed for several parameters.
One single design of a membrane system was studied, to capture 90% at 95% CO2 purity with the lowest cost. The system design results were compared with the same membrane design without expander utilization, where a comprehensive understanding of the significance of integrating an expander into the retentate stream of a membrane module was presented.
Based on the results, the main parameter that affected the membrane gas separation process was the first membrane surface area, where increasing the membrane area from 400,000 to 600,000 m2 at a specific capture rate reduced the power consumption by 8%. At 600,000 m2, raising the first compressor pressure from 6 to 8 bar improved the capture efficiency by 18%, and at the same time decreased the CO2 captured cost by 14%, due to the high CO2 contents removed, which reduced the capture cost. The second compressor directly affected the CO2 purity where the purity was reduced by around 17% by increasing the CP2 from 2 to 10 bar at 4 bar of CP1, due to the N2 molecules that pass through the membrane module along with the CO2. In terms of LCOE, enlarging the membrane area from 200,000 to 400,000 m2 raised the cost by 10.5% in the 10 bar of the first compressor pressure. Increasing the first membrane area from 200,000 to 600,000 m2 reduced CO2 capture cost by around 32% due to the high CO2 that was captured with a larger membrane area. However, the outcomes of different parameters considered showed a reliable application of a two-stage membrane system integrated into a CFPP.
Utilizing an expander unit in the N2-rich stream improved the full capture system regarding the economic assessment. For example, the LCOE was reduced by 19% for the same purpose of high capture efficiency and purity in the case of 8-bar CP1 and 600,000 m2 MSA1, which can be explained by the energy recovered through the expander, which reduced the electrical consumption. Furthermore, the plant power generation showed a considerable raise in results after using the expander at any compressor pressure due to the power recovered by the expander. Expander integration into the membrane CO2 capture system illustrated a more profitable project by around 11% compared to the same project without the expander unit. Nevertheless, based on a techno-economic analysis, the studied capture system showed a reliable result for integration into the assumed power plant.

Author Contributions

Conceptualization, M.A. and C.D.; methodology, M.A. and C.D.; software, M.A. and C.D.; validation, M.A. and C.D.; formal analysis, M.A. and C.D.; investigation, M.A. and C.D.; resources, M.A. and C.D.; writing—original draft preparation, M.A. and C.D.; writing—review and editing, M.A. and C.D.; visualization, M.A. and C.D.; supervision, C.D.; project administration, C.D.; funding acquisition, C.D. All authors have read and agreed to the published version of the manuscript.

Funding

The research leading to these results received funding from the NO Grants 2014–2021, under Project Contract No. 13/2020.

Institutional Review Board Statement

Not applicable.

Informed Consent Statement

Not applicable.

Data Availability Statement

Data are contained within the article.

Conflicts of Interest

The authors declare no conflicts of interest.

Abbreviations

CFPPCoal-fired power plant
D L M Log mean diameter of membrane module, μm
d Effective thickness of membrane module, μm
d i Membrane module diameter (inside), μm
d o Membrane module diameter (outside), μm
L Feed flow rate, kmol/h
L f Feed flow rate in the membrane entry, kmol/h
L * Normalized feed flow rate
l m Total length of membrane module, m
l P Potted length of membrane module, m
P f Feed pressure in membrane entry, bar
P 1 Feed pressure, bar
P 2 Permeate pressure, bar
( Q d ) C O 2 CO2 permeability, GPU
( Q d ) N 2 N2 permeability, GPU
R Gas constant, mol K m−3 kPa−1
T Temperature, K
W c Total power consumed by compressors
W e x Total power recovered by expander
V Permeate flow rate, kmol/h
V f Permeate flow rate at membrane entry, kmol/h
V * Permeate flow rate (dimensionless)
x Feed CO2 mole fraction
x f Feed CO2 mole fraction at membrane entry
y Permeate CO2 mole fraction
y f Permeate CO2 mole fraction at membrane entry
αCO2/N2 selectivity
μ f CO2 viscosity, bars
L C O E Levelized cost of electricity
S P E C C A Specific primary energy consumption for carbon dioxide avoided
CCSCarbon capture system
CP1First compressor pressure
CP2Second compressor pressure
MSA1First membrane area
MSA2Second membrane area
C N o   c a p t u r e Carbon dioxide released without CCS
C W i t h   c a p t u r e Carbon dioxide released with CCS
C O 2 , C C CO2 captured cost
C O 2 , A C CO2 avoided cost
N P V Net present value
DPPDiscount payback period
IRRInternal rate of return
C i Replacement cost in a year
A i Recompense loan in a year
I i Actual investment in a year
r Rate of discount
P I Profitability index
I A Deduct from the investment

References

  1. Ge, M.; Lebling, K.; Levin, K.; Friedrich, J. Tracking Progress of the 2020 Climate Turning Point; World Resources Institute: Washington, DC, USA, 2019. [Google Scholar]
  2. Iea, I. World Energy Statistics and Balances; IEA: Paris, France, 2019. [Google Scholar]
  3. Risso, R.; Cardona, L.; Archetti, M.; Lossani, F.; Bosio, B.; Bove, D. A Review of On-Board Carbon Capture and Storage Techniques: Solutions to the 2030 IMO Regulations. Energies 2023, 16, 6748. [Google Scholar] [CrossRef]
  4. Songolzadeh, M.; Soleimani, M.; Ravanchi, M.T.; Songolzadeh, R. Carbon dioxide separation from flue gases: A technological review emphasizing reduction in greenhouse gas emissions. Sci. World J. 2014, 828131. [Google Scholar] [CrossRef]
  5. Thepsaskul, W.; Wongsapai, W.; Sirisrisakulchai, J.; Jaitiang, T.; Daroon, S.; Raksakulkan, V.; Muangjai, P.; Ritkrerkkrai, C.; Suttakul, P.; Wattakawigran, G. Potential Business Models of Carbon Capture and Storage (CCS) for the Oil Refining Industry in Thailand. Energies 2023, 16, 6955. [Google Scholar] [CrossRef]
  6. Rajulwar, V.V.; Shyrokykh, T.; Stirling, R.; Jarnerud, T.; Korobeinikov, Y.; Bose, S.; Bhattacharya, B.; Bhattacharjee, D.; Sridhar, S. Steel, Aluminum, and FRP-Composites: The Race to Zero Carbon Emissions. Energies 2023, 16, 6904. [Google Scholar] [CrossRef]
  7. Wilkes, M.D.; Brown, S. Flexible CO2 capture for open-cycle gas turbines via vacuum-pressure swing adsorption: A model-based assessment. Energy 2022, 250, 123805. [Google Scholar] [CrossRef]
  8. Pascu, A.; Stoica, L.; Dinca, C.; Badea, A. The package type influence on the performance of the CO2 capture process by chemical absorption. UPB Sci. Bull. Ser. C 2016, 78, 259–270. [Google Scholar]
  9. Alabid, M.; Slavu, N.; Sandru, M.; Dinca, C. Hybrid polymeric membrane–chemical absorption system for pre-combustion CO2 capture. In Computer Aided Chemical Engineering; Elsevier: Athens, Greece, 2023; pp. 3073–3078. [Google Scholar]
  10. Bravo, J.; Drapanauskaite, D.; Sarunac, N.; Romero, C.; Jesikiewicz, T.; Baltrusaitis, J. Optimization of energy requirements for CO2 post-combustion capture process through advanced thermal integration. Fuel 2021, 283, 118940. [Google Scholar] [CrossRef]
  11. Spitoni, M.; Pierantozzi, M.; Comodi, G.; Polonara, F.; Arteconi, A. Theoretical evaluation and optimization of a cryogenic technology for carbon dioxide separation and methane liquefaction from biogas. J. Nat. Gas Sci. Eng. 2019, 62, 132–143. [Google Scholar] [CrossRef]
  12. Darunte, L.A.; Walton, K.S.; Sholl, D.S.; Jones, C.W. CO2 capture via adsorption in amine-functionalized sorbents. Curr. Opin. Chem. Eng. 2016, 12, 82–90. [Google Scholar] [CrossRef]
  13. Liu, Y.; Yang, Y.; Sun, Q.; Wang, Z.; Huang, B.; Dai, Y.; Qin, X.; Zhang, X. Chemical adsorption enhanced CO2 capture and photoreduction over a copper porphyrin based metal organic framework. ACS Appl. Mater. Interfaces 2013, 5, 7654–7658. [Google Scholar] [CrossRef]
  14. Xu, J.; Wu, H.; Wang, Z.; Qiao, Z.; Zhao, S.; Wang, J. Recent advances on the membrane processes for CO2 separation. Chinese J. Chem. Eng. 2018, 26, 2280–2291. [Google Scholar] [CrossRef]
  15. Yang, H.; Xu, Z.; Fan, M.; Gupta, R.; Slimane, R.B.; Bland, A.E.; Wright, I. Progress in carbon dioxide separation and capture: A review. J. Environ. Sci. 2008, 20, 14–27. [Google Scholar] [CrossRef] [PubMed]
  16. Alabid, M.; Dinca, C. Parametrization Study for Optimal Pre-Combustion Integration of Membrane Processes in BIGCC. Sustainability 2022, 14, 16604. [Google Scholar] [CrossRef]
  17. Roussanaly, S.; Anantharaman, R.; Lindqvist, K.; Zhai, H.; Rubin, E. Membrane properties required for post-combustion CO2 capture at coal-fired power plants. J. Memb. Sci. 2016, 511, 250–264. [Google Scholar] [CrossRef]
  18. Hussain, A.; Farrukh, S.; Minhas, F.T. Two-stage membrane system for post-combustion CO2 capture application. Energy Fuels 2015, 29, 6664–6669. [Google Scholar] [CrossRef]
  19. Kárászová, M.; Zach, B.; Petrusová, Z.; Červenka, V.; Bobák, M.; Šyc, M.; Izák, P. Post-combustion carbon capture by membrane separation, Review. Sep. Purif. Technol. 2020, 238, 116448. [Google Scholar] [CrossRef]
  20. Pal, N.; Agarwal, M. Advances in materials process and separation mechanism of the membrane towards hydrogen separation. Int. J. Hydrogen Energy 2021, 46, 27062–27087. [Google Scholar] [CrossRef]
  21. Brunetti, A.; Drioli, E.; Lee, Y.M.; Barbieri, G. Engineering evaluation of CO2 separation by membrane gas separation systems. J. Memb. Sci. 2014, 454, 305–315. [Google Scholar] [CrossRef]
  22. White, L.S.; Wei, X.; Pande, S.; Wu, T.; Merkel, T.C. Extended flue gas trials with a membrane-based pilot plant at a one-ton-per-day carbon capture rate. J. Memb. Sci. 2015, 496, 48–57. [Google Scholar] [CrossRef]
  23. Lee, S.; Binns, M.; Lee, J.H.; Moon, J.-H.; Yeo, J.-G.; Yeo, Y.-K.; Lee, Y.M.; Kim, J.-K. Membrane separation process for CO2 capture from mixed gases using TR and XTR hollow fiber membranes: Process modeling and experiments. J. Memb. Sci. 2017, 541, 224–234. [Google Scholar] [CrossRef]
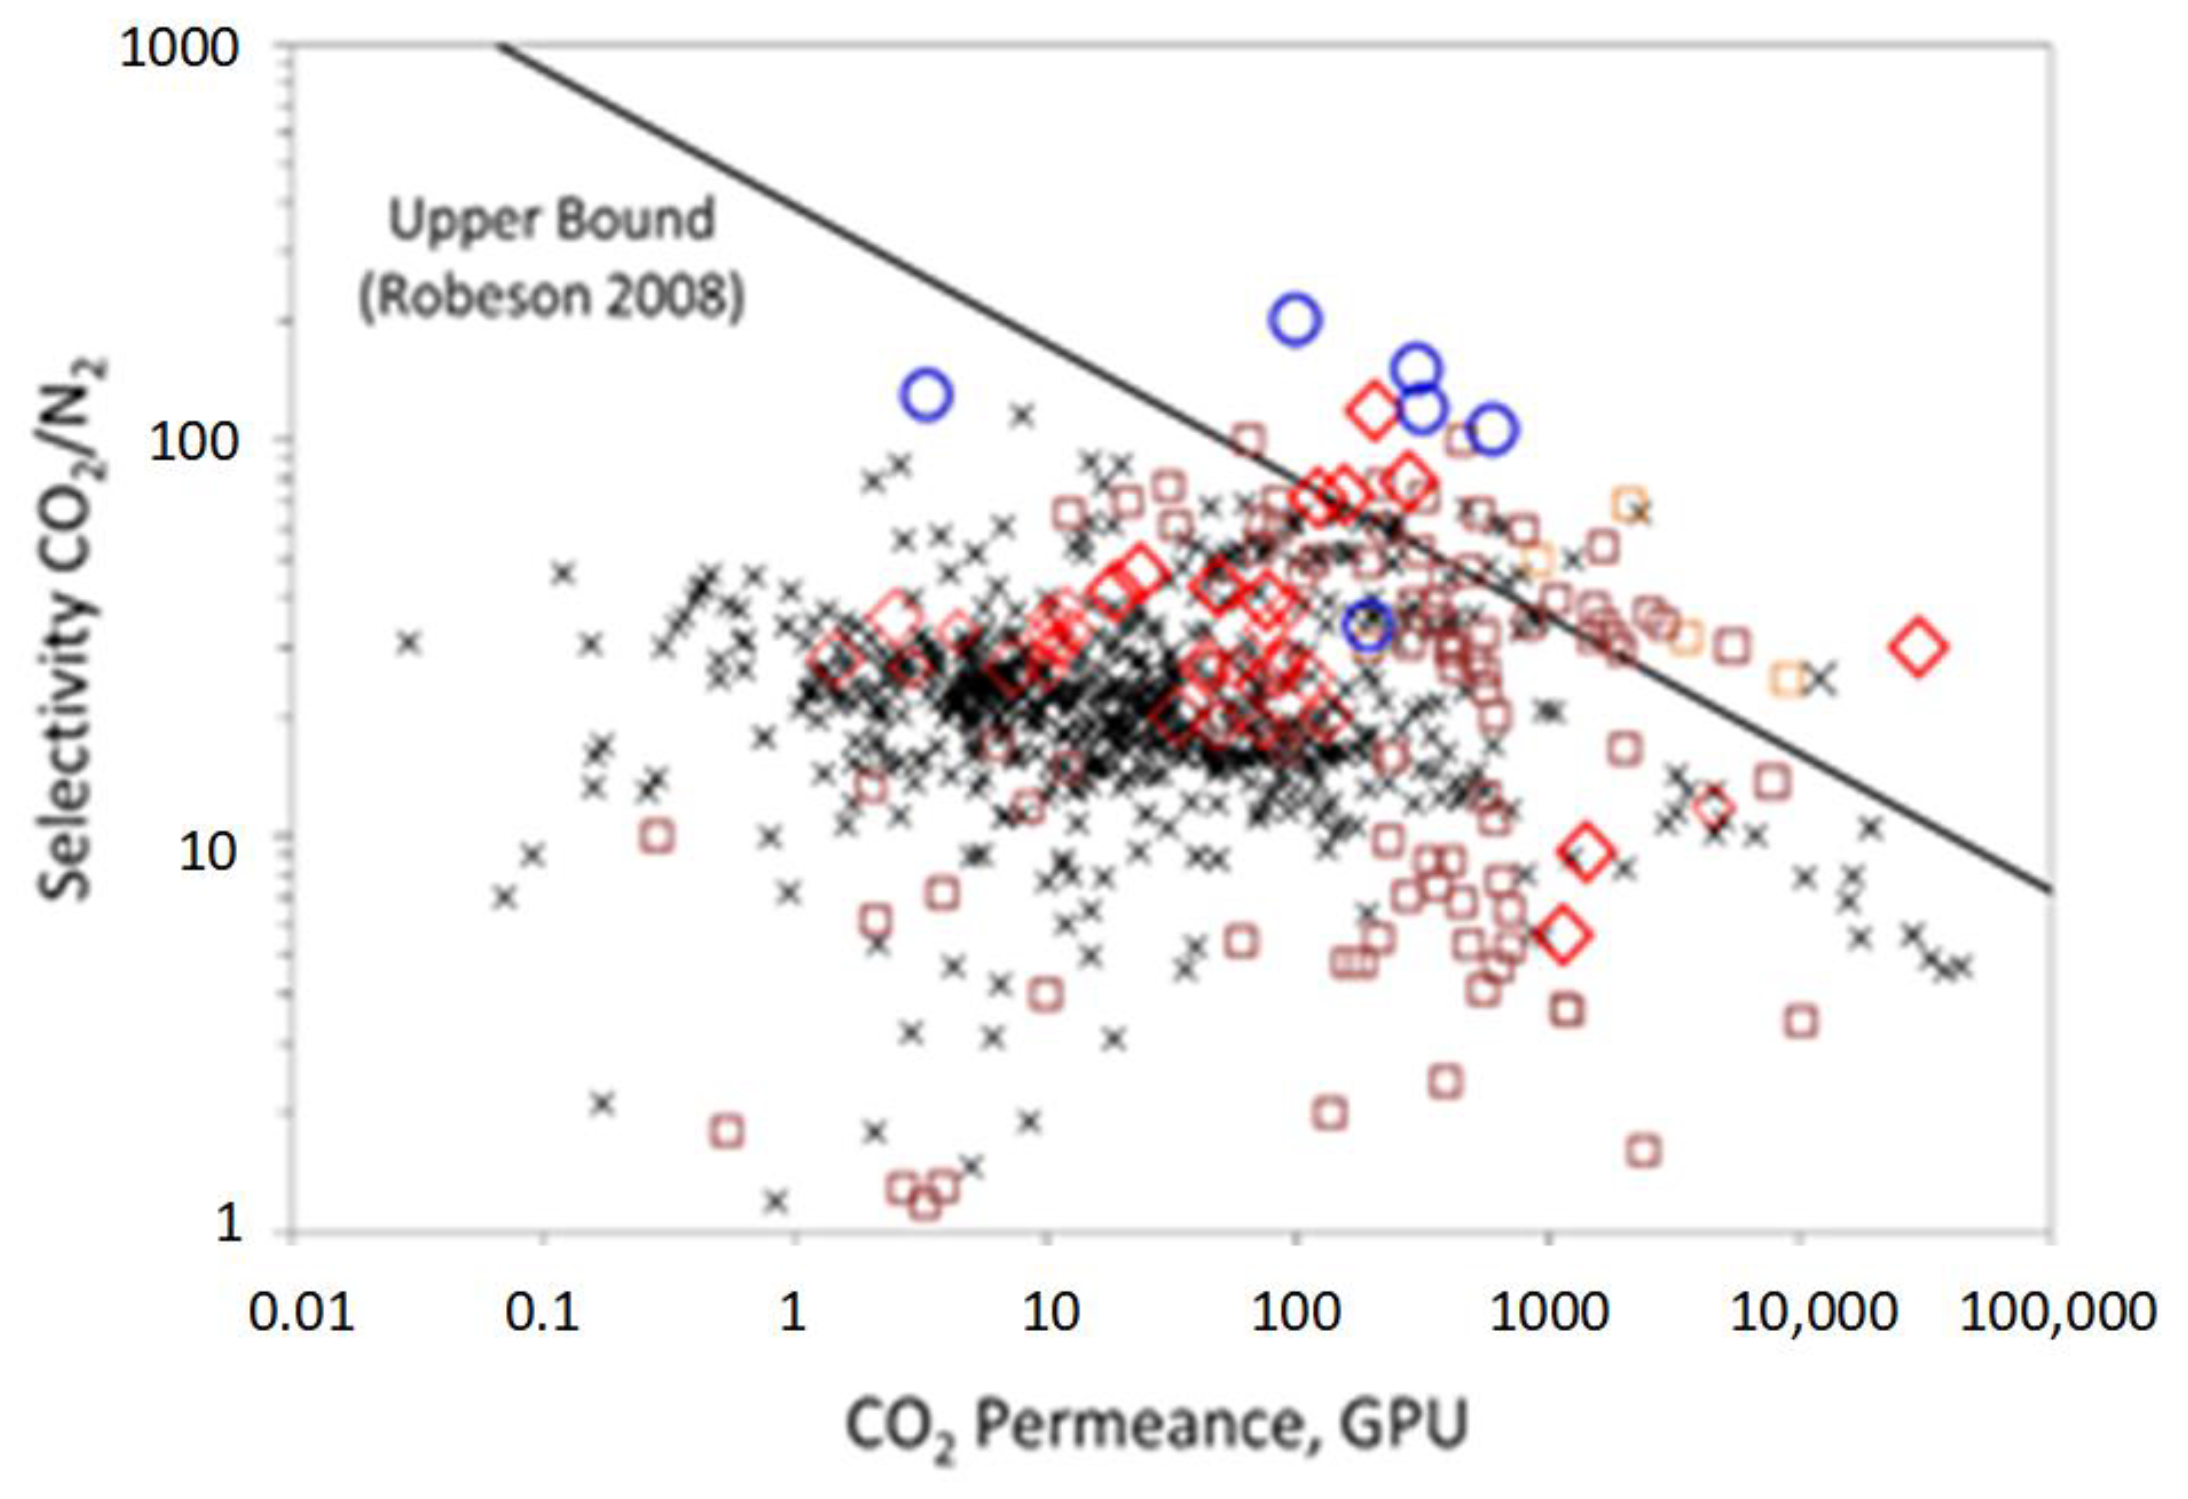
  24. Robeson, L.M. The upper bound revisited. J. Memb. Sci. 2008, 320, 390–400. [Google Scholar] [CrossRef]
  25. Da Conceicao, M.; Nemetz, L.; Rivero, J.; Hornbostel, K.; Lipscomb, G. Gas Separation Membrane Module Modeling: A Comprehensive Review. Membranes 2023, 13, 639. [Google Scholar] [CrossRef]
  26. Belaissaoui, B.; Lasseuguette, E.; Janakiram, S.; Deng, L.; Ferrari, M.-C. Analysis of CO2 facilitation transport effect through a hybrid poly (allyl amine) membrane: Pathways for further improvement. Membranes 2020, 10, 367. [Google Scholar] [CrossRef] [PubMed]
  27. Fu, Q.; Halim, A.; Kim, J.; Scofield, J.M.P.; Gurr, P.A.; Kentish, S.E.; Qiao, G.G. Highly permeable membrane materials for CO2 capture. J. Mater. Chem. A 2013, 1, 13769–13778. [Google Scholar] [CrossRef]
  28. Low, B.T.; Zhao, L.; Merkel, T.C.; Weber, M.; Stolten, D. A parametric study of the impact of membrane materials and process operating conditions on carbon capture from humidified flue gas. J. Memb. Sci. 2013, 431, 139–155. [Google Scholar] [CrossRef]
  29. Sandru, M.; Haukebø, S.H.; Hägg, M.-B. Composite hollow fiber membranes for CO2 capture. J. Memb. Sci. 2010, 346, 172–186. [Google Scholar] [CrossRef]
  30. Li, Q.; Wu, H.; Wang, Z.; Wang, J. Analysis and optimal design of membrane processes for flue gas CO2 capture. Sep. Purif. Technol. 2022, 298, 121584. [Google Scholar] [CrossRef]
  31. Gilassi, S.; Taghavi, S.M.; Rodrigue, D.; Kaliaguine, S. Optimizing membrane module for biogas separation. Int. J. Greenh. Gas Control 2019, 83, 195–207. [Google Scholar] [CrossRef]
  32. Xu, J.; Wang, Z.; Qiao, Z.; Wu, H.; Dong, S.; Zhao, S.; Wang, J. Post-combustion CO2 capture with membrane process: Practical membrane performance and appropriate pressure. J. Memb. Sci. 2019, 581, 195–213. [Google Scholar] [CrossRef]
  33. Wu, H.; Li, Q.; Sheng, M.; Wang, Z.; Zhao, S.; Wang, J.; Mao, S.; Wang, D.; Guo, B.; Ye, N.; et al. Membrane technology for CO2 capture: From pilot-scale investigation of two-stage plant to actual system design. J. Memb. Sci. 2021, 624, 119137. [Google Scholar] [CrossRef]
  34. Micari, M.; Dakhchoune, M.; Agrawal, K.V. Techno-economic assessment of postcombustion carbon capture using high-performance nanoporous single-layer graphene membranes. J. Memb. Sci. 2021, 624, 119103. [Google Scholar] [CrossRef]
  35. Ciferno, J.; Plasynski, S.I. Advanced Carbon Dioxide Capture R&D Program: Technology Update. Report DOE/NETL, 2010. Available online: https://www.mcilvainecompany.com/Decision_Tree/subscriber/CO2DescriptionTextLinks/DOENETL2010UpdateReport.pdf (accessed on 15 December 2023).
  36. Peletiri, S.P.; Rahmanian, N.; Mujtaba, I.M. CO2 Pipeline design: A review. Energies 2018, 11, 2184. [Google Scholar] [CrossRef]
  37. Sandru, M.; Kim, T.-J.; Capala, W.; Huijbers, M.; Hägg, M.-B. Pilot scale testing of polymeric membranes for CO2 capture from coal fired power plants. Energy Procedia 2013, 37, 6473–6480. [Google Scholar] [CrossRef]
  38. Lillepärg, J.; Georgopanos, P.; Shishatskiy, S. Stability of blended polymeric materials for CO2 separation. J. Memb. Sci. 2014, 467, 269–278. [Google Scholar] [CrossRef]
  39. Sidhoum, M.; Sengupta, A.; Sirkar, K.K. Asymmetric cellulose acetate hollow fibers: Studies in gas permeation. AIChE J. 1988, 34, 417–425. [Google Scholar] [CrossRef]
  40. Sengupta, A.; Sirkar, K.K. Ternary gas mixture separation in two-membrane permeators. AIChE J. 1987, 33, 529–539. [Google Scholar] [CrossRef]
  41. Boucif, N.; Sengupta, A.; Sirkar, K.K. Hollow fiber gas permeator with countercurrent or cocurrent flow: Series solutions. Ind. Eng. Chem. Fundam. 1986, 25, 217–228. [Google Scholar] [CrossRef]
  42. Ramírez-Santos, Á.A.; Bozorg, M.; Addis, B.; Piccialli, V.; Castel, C.; Favre, E. Optimization of multistage membrane gas separation processes. Example of application to CO2 capture from blast furnace gas. J. Memb. Sci. 2018, 566, 346–366. [Google Scholar] [CrossRef]
  43. Chiwaye, N.; Majozi, T.; Daramola, M.O. Optimisation of post-combustion carbon dioxide capture by use of a fixed site carrier membrane. Int. J. Greenh. Gas Control 2021, 104, 103182. [Google Scholar] [CrossRef]
  44. Taifan, G.S.P.; Maravelias, C.T. Generalized optimization-based synthesis of membrane systems for multicomponent gas mixture separation. Chem. Eng. Sci. 2022, 252, 117482. [Google Scholar] [CrossRef]
  45. Pan, C.Y. Gas separation by high-flux, asymmetric hollow-fiber membrane. AIChE J. 1986, 32, 2020–2027. [Google Scholar] [CrossRef]
  46. Alabid, M.; Dinca, C. Parametrical Assessment of Polyacrylamide Polymer Membrane Used for CO2 Post-Combustion Capture. Appl. Sci. 2023, 13, 11333. [Google Scholar] [CrossRef]
  47. Hao, J.; Rice, P.A.; Stern, S.A. Upgrading low-quality natural gas with H2S-and CO2-selective polymer membranes: Part II. Process design, economics, and sensitivity study of membrane stages with recycle streams. J. Memb. Sci. 2008, 320, 108–122. [Google Scholar] [CrossRef]
  48. Datta, A.K.; Sen, P.K. Optimization of membrane unit for removing carbon dioxide from natural gas. J. Memb. Sci. 2006, 283, 291–300. [Google Scholar] [CrossRef]
  49. Shao, P.; Dal-Cin, M.M.; Guiver, M.D.; Kumar, A. Simulation of membrane-based CO2 capture in a coal-fired power plant. J. Memb. Sci. 2013, 427, 451–459. [Google Scholar] [CrossRef]
  50. Brasington, R.D.; Haslback, J.L.; Kuehn, N.J.; Lewis, E.G.; Pinkerton, L.L.; Turner, M.J.; Varghese, E.; Woods, M. Cost and Performance Baseline for Fossil Energy Plants-Volume 2: Coal to Synthetic Natural Gas and Ammonia; National Energy Technology Laboratory (NETL): Pittsburgh, PA, USA; Morgantown, WV, USA, 2011. [Google Scholar]
  51. Freeman, B.; Hao, P.; Baker, R.; Kniep, J.; Chen, E.; Ding, J.; Zhang, Y.; Hybrid, G.T.R. Membrane-absorption CO2 capture process. Energy Procedia 2014, 63, 605–613. [Google Scholar] [CrossRef]
  52. Chowdhury, M.H.M. Simulation, Design and Optimization of Membrane Gas Separation, Chemical Absorption and Hybrid Processes for CO2 Capture. Ph.D. Thesis, University of Waterloo, Waterloo, ON, Canada, 2012. [Google Scholar]
  53. Alabid, M.; Cormos, C.C.; Dinca, C. Critical Assessment of Membrane Technology Integration in a Coal-Fired Power Plant. Membranes 2022, 12, 904. [Google Scholar] [CrossRef]
  54. Koros, W.J.; Chern, R.T. Separation of gaseous mixtures using polymer membranes. In Handbook of Separation Process Technology; Wiley: New York, NY, USA, 1987; pp. 862–953. [Google Scholar]
  55. Yun, S.; Jang, M.-G.; Kim, J.-K. Techno-economic assessment and comparison of absorption and membrane CO2 capture processes for iron and steel industry. Energy 2021, 229, 120778. [Google Scholar] [CrossRef]
  56. Ji, G.; Zhao, M. Membrane separation technology in carbon capture. In Recent Advances in Carbon Capture and Storage; IntechOpen: Rijeka, Croatia, 2017; pp. 59–90. [Google Scholar]
  57. Vega, F.; Baena-Moreno, F.M.; Fernández, L.M.G.; Portillo, E.; Navarrete, B.; Zhang, Z. Current status of CO2 chemical absorption research applied to CCS: Towards full deployment at industrial scale. Appl. Energy 2020, 260, 114313. [Google Scholar] [CrossRef]
  58. Chen, Y.; Wang, B.; Zhao, L.; Dutta, P.; Ho, W.S.W. New Pebax®/zeolite Y composite membranes for CO2 capture from flue gas. J. Memb. Sci. 2015, 495, 415–423. [Google Scholar] [CrossRef]
  59. Han, Y.; Yang, Y.; Ho, W.S.W. Recent progress in the engineering of polymeric membranes for CO2 capture from flue gas. Membranes 2020, 10, 365. [Google Scholar] [CrossRef] [PubMed]
  60. Yun, S.; Oh, S.-Y.; Kim, J.-K. Techno-economic assessment of absorption-based CO2 capture process based on novel solvent for coal-fired power plant. Appl. Energy 2020, 268, 114933. [Google Scholar] [CrossRef]
  61. Cormos, A.-M.; Dinca, C.; Cormos, C.-C. Energy efficiency improvements of post-combustion CO2 capture based on reactive gas–liquid absorption applied for super-critical circulating fluidized bed combustion (CFBC) power plants. Clean Technol. Environ. Policy 2018, 20, 1311–1321. [Google Scholar] [CrossRef]
  62. Cormos, C.-C.; Dinca, C. Techno-economic and environmental implications of decarbonization process applied for Romanian fossil-based power generation sector. Energy 2021, 220, 119734. [Google Scholar] [CrossRef]
  63. He, X.; Hägg, M.-B. Energy efficient process for CO2 capture from flue gas with novel fixed-site-carrier membranes. Energy Procedia 2014, 63, 174–185. [Google Scholar] [CrossRef]
  64. Chiwaye, N.; Majozi, T.; Daramola, M.O. On optimisation of N2 and CO2-selective hybrid membrane process systems for post-combustion CO2 capture from coal-fired power plants. J. Memb. Sci. 2021, 638, 119691. [Google Scholar] [CrossRef]
  65. Brunetti, A.; Scura, F.; Barbieri, G.; Drioli, E. Membrane technologies for CO2 separation. J. Memb. Sci. 2010, 359, 115–125. [Google Scholar] [CrossRef]
  66. Li, H.; Wang, F.; Li, S.; Yu, M. Two-stage membrane-based process utilizing highly CO2-selective membranes for cost and energy efficient carbon capture from coal flue gas: A process simulation study. J. Memb. Sci. 2023, 669, 121259. [Google Scholar] [CrossRef]
  67. He, X.; Chen, D.; Liang, Z.; Yang, F. Insight and comparison of energy-efficient membrane processes for CO2 capture from flue gases in power plant and energy-intensive industry. Carbon Capture Sci. Technol. 2022, 2, 100020. [Google Scholar] [CrossRef]
  68. He, X.; Fu, C.; Hägg, M.-B. Membrane system design and process feasibility analysis for CO2 capture from flue gas with a fixed-site-carrier membrane. Chem. Eng. J. 2015, 268, 1–9. [Google Scholar] [CrossRef]
Figure 1. Gas separation based on Robeson upper bound for different membrane materials. ✕: dense membranes, ☐: inorganic membranes, ◯: facilitated transport membranes, ◇: hybrid membranes [24,26].
Energies 17 00464 g001
Figure 2. Configuration of membrane in a counter-current flow.
Energies 17 00464 g002
Figure 3. Scheme of the supercritical CFPP.
Energies 17 00464 g003
Figure 4. Process scheme of the membrane two stages.
Energies 17 00464 g004
Figure 5. Membrane system optimum results integrated into 330 MW CFPP with expander use.
Energies 17 00464 g005
Figure 6. CO2 capture variation based on first membrane area and first compressor pressure at 4 bar CP2.
Energies 17 00464 g006
Figure 7. Impact of first membrane area on total power consumption at different first compressor pressures, 4 bar CP2.
Energies 17 00464 g007
Figure 8. Impact of first membrane area on CO2 purity at different first compressor pressure, 4 bar CP2.
Energies 17 00464 g008
Figure 9. Impact of second compressor pressure on CO2 purity with several CP1 at 600,000 m2 MSA1.
Energies 17 00464 g009
Figure 10. The impact of expander use on total power consumption, with the reduction percentage.
Energies 17 00464 g010
Figure 11. The increase in CFPP efficiency variations based on different membrane areas and first compressor pressure.
Energies 17 00464 g011
Figure 12. The comparison of the project’s different economic indicators, based on expander utilization.
Energies 17 00464 g012
Figure 13. The expander impact on plant net-power generation at different first compressor pressures.
Energies 17 00464 g013
Figure 14. Expander impact on specific financial indicators.
Energies 17 00464 g014
Table 2. Membrane process: main assumptions for simulation.
FactorUnitValue
Membrane type-Spiral wound
Flow pattern-Counter-current
CO2 permeabilityGPU1000
N2 permeabilityGPU20
CO2/N2 Selectivity-50
Compressor efficiency %90
Expander efficiency%85
Water pump efficiency %90
Water pump pressurebar3
Heat exchanger temperature out (All)°C50
Variance of the membrane variables simulated
First compressor pressure (CP1)bar2–10
First membrane surface area (MSA1)m2200,000–600,000
Second compressor pressure (CP2)bar2–6
Second membrane surface area (MSA2)m240,000
GPU = 10−6 cm3(STP)/cm2.s.cmHg, or 3.35 × 10⁻¹⁰ mol/m2.s.Pa.
Table 3. Economic evaluation: main assumption.
IndicatorsUnitsValues
Project working periodyears25
Availability factor%85
Price of electricityEUR/MWh160
Fee for CO2EUR/t82 [53]
Annual running hoursh/year7446 (85/100 × 8760)
Membrane module costEUR/m250
Price of compressorEUR/kW1350
Price of CO2 pumpEUR/kW1300
Cost of expanderEUR/kW500
Membrane repair costEUR/m210
Labor costEUR/h15
CO2 compression componentmillion EUR11.7
Separators and Compressor interstage coolersmillion EUR0.87
Table 4. The techno-economic assessment of two membrane stages integrated into 330 CFPP with expander use.
ParametersPower Plant (Base)Power Plant with Two-Membrane-Stage System
Membrane area (m2)n.a.200,000400,000600,000
CP1 (bar)n.a.681068106810
Net power generated (MW)330265.7238.1213.3245.7208.3174.4226.7180.6138.7
Net power plant efficiency (%)45.7840.4936.6733.2337.7132.5427.8235.0828.6922.87
Capital costs per net electrical capacity (EUR/kWh)2753.84213.647145272.34642.55488.96572.15125.46450.38419.7
CO2 emission factor (kg/MWh)741.15522.84351.46222.77353.25163.4162.28237.3769.7313.05
CO2 captured (kg/MWh)n.a.397.8675.6923.7642.41010.51340.4841.61284.31750.5
Power consumption of membrane plant (kWe)n.a.69,82397,348122,15789,831127,141161,123108,801154,850196,796
Membrane power consumption (kWh/tCO2)n.a.660.68605.07619.89569.25603.89689.37570.31667.50810.62
LCOE_tax (EUR/kWh)0.07560.12690.12430.12630.12240.12570.14100.12310.13820.1757
SPECCA (MJth/kg)n.a.2.582.893.222.623.173.792.853.654.50
SEPCCA (MJel/kg)n.a.1.491.561.701.411.672.011.501.932.45
CO2 avoided cost (EUR/t)n.a.234.94124.9597.75120.5886.7296.3494.2793.28137.52
CO2 captured cost (EUR/t)n.a.128.9372.0754.8672.8149.5848.7956.4348.7757.20
Table 5. The economic evaluation of membrane system with different variables considered and integrated into CFPP.
ParametersUnitValues
MSA1m2200,000400,000600,000
CP1bar681068106810
NPVMillion EUR589.7901.91048.6919.361123.41061.921066.61080.9827.5
IRR%0.140.160.180.170.180.180.180.180.16
DPPYear11.999.839.129.818.889.159.199.1410.46
PI-1.531.801.931.811.981.931.921.931.71
Table 6. The comparison between the current paper and other papers in the literature regarding optimum techno-economic results.
ParametersCurrent Paper: Optimum ResultsLiterature Papers
[30][67][68]
Flue gas flow (feed) (kmol/h)40,32067,17695,80018,260
CO2 flow (feed) (kmol/h)529010,27813,1632355.5
Membrane unit number2222
Total membrane area (×103 m2)6401040480679
CO2 permeance (GPU)100010002200740
CO2/N2 selectivity508050135
CO2 capture efficiency (%)94.9907080.3
CO2 flow captured (kmol/h)5020961992141884.4
Membrane power consumption (MW)154.9n.a.8023.7
CO2 purity (%)96.8805895.1
LCOE_tax (EUR/kWh)0.1382n.a.n.a.n.a.
SPECCA (MJth/kg)3.65n.a.n.a.n.a.
SEPCCA (MJel/kg)1.93n.a.n.a.n.a.
CO2 avoided cost (EUR/t)93.28n.a.n.a.n.a.
CO2 captured cost (EUR/t)48.7728.6n.a.47.87
Disclaimer/Publisher’s Note: The statements, opinions and data contained in all publications are solely those of the individual author(s) and contributor(s) and not of MDPI and/or the editor(s). MDPI and/or the editor(s) disclaim responsibility for any injury to people or property resulting from any ideas, methods, instructions or products referred to in the content.

