
Energy and Conventional Exergy Analysis of an Integrated Transcritical CO2 (R-744) Refrigeration System


Process and Power Research Group Trondheim, Department of Energy and Process Engineering, Norwegian University of Science and Technology, 7194 Trondheim, Norway
Energies 2024, 17(2), 479; https://doi.org/10.3390/en17020479
Submission received: 28 October 2023
/
Revised: 2 January 2024
/
Accepted: 16 January 2024
/
Published: 18 January 2024
(This article belongs to the Section J3: Exergy)
Abstract
:This study analyses the performance of an integrated transcritical CO2 (R-744) refrigeration system operating in winter conditions within a supermarket in Trento, north Italy. This system fulfils multiple functions, providing the heating (for domestic hot water and space heating), cooling, and freezing capabilities for the supermarket. Energy analysis reveals that the average value of the total coefficient of performance, total COP, over the entire study period is calculated at 2.47. Notably, the medium-temperature (MT) compressor rack exhibits the highest power consumption, especially in sub −5 °C conditions. The auxiliary (AUX) compressor rack and the gas cooler (GC) fan contribute significantly to the electrical power usage. The air conditioning (AC) heating load is consistently high, averaging 41.6 kW, while the domestic hot water (DHW) heating load remains stable at approximately 5 kW. The refrigeration demands include an average MT cooling load of 25.86 kW and a low-temperature (LT) freezing load of 10–15 kW, with an average of 13.76 kW. The current study also delves into exergy analysis, disclosing an overall system exergy efficiency of 22.4%. The AUX compressor rack is identified as the primary exergy destructor, followed by the GC, AC coils, MT compressor rack, and the ejector. The LT compressor rack has the highest exergy efficiency, followed by the MT and LT expansion valves.
Keywords:
energy; exergy; CO2/R-744; refrigeration; cooling; heating; air-conditioning (AC); field measurement1. Introduction
Rising concerns over climate change and strict requirements to mitigate it have put pressure on the heating, ventilation, air conditioning (HVAC), and refrigeration sector to eliminate the detrimental effects of the systems on the environment. Compressor-based vapor compression technology (VCT) is the dominant technology in HVAC and refrigeration systems. The damaging impact of the systems based on VCT is the use of fossil-based energy resources and harmful synthetic refrigerants (fluorinated gases, F-gases).
The harmful synthetic refrigerants can be eliminated by using alternative natural refrigerants. Carbon dioxide (R-744/CO2) is one of the most suitable environment-friendly alternatives for many applications, particularly for supermarkets, and its utilization is increasing yearly [1]. The increasing number of R-744 refrigeration systems has been triggered by the good thermodynamic and transport properties of R-744 [2], regulations to phase out synthetic refrigerants, and technological developments to increase the system efficiency and decrease the system costs due to research activities and scientific efforts [3]. The critical technological developments include parallel compression and multi-ejectors, which enable the transcritical R-744 refrigeration systems to be installed in hot climate regions. Transcritical R-744 systems with energy-efficient solutions still do not have as high of a coefficient of performance (COP) as conventional systems do at high outdoor temperatures [4,5,6]. However, they become more energy efficient over the year, due to achieving higher COP at low outdoor temperatures [5]. When integrated with HVAC systems to meet air conditioning (AC) needs, space heating/cooling requirements, and domestic hot water production (all-in-one R-744 transcritical systems), the system’s overall efficiency becomes much higher than the conventional systems. Tsimpoukis et al. [7] investigated the performance of the different R-744 systems, including the all-in-one R-744 transcritical system, for a supermarket in Athens. The performances of these systems were compared with the R-448A- or R-404A-based conventional units. The results showed that the all-in-one R-744 unit has the highest energy efficiency at all outdoor temperatures.
The need to enhance transcritical R-744 systems has forced many researchers to carry out not only energetic but also conventional and advanced exergetic analyses [8,9] of those systems in order to comprehend the room for improvement.
Fangtian and Yitai [10] conducted an energy and conventional exergy analysis for a transcritical R-744 refrigeration system with a vapor ejector and throttling valve. They investigated the effect of the ejector’s entrainment ratio, heat rejection pressure, gas cooler outlet temperature, and evaporating temperature on the system COP. They found that the system with the ejector has 25% less exergy loss and 30% higher COP than the system with the throttling valve. Bai et al. [11] proposed a dual-evaporator R-744 transcritical refrigeration cycle with a two-stage ejector. They analyzed the effect of similar parameters investigated by Fangtian and Yitai [10] based on thermodynamics analysis. They showed that the two-stage ejector has a higher efficiency than the system with a single ejector. At an optimal discharge pressure, with the proposed topology, the system exergy efficiency can be improved by up to 37.61% compared to the conventional dual-evaporator cycle. Bai et al. [12] conducted an advanced exergy analysis for an ejector-expansion transcritical R-744 refrigeration system. They stated that the compressor should have the highest priority for improvement and that it is possible to avoid approximately 44% of the total exergy destruction by improving the system components. Ehsan et al. [13] modeled a R-717/R-744 cascade refrigeration cycle. According to the results of their exergy analysis, the R-744 throttling valve and the compressor have the highest exergy destruction. They concluded that the system efficiency could be improved by 42.13% if the components were improved. Purohit et al. [14] analyzed the performance of an R-744 transcritical chiller with and without an internal heat exchanger (IHX) in a hot climate. They analyzed different evaporating and ambient temperatures and gas cooler pressure levels. They indicated that, depending on the evaporating temperature, it is possible to increase both the energetic and the exergetic efficiency by more than 4.5% by utilizing IHX. Dai et al. [15] evaluated the performance of a transcritical R-744 heat pump with direct dedicated mechanical subcooling. They developed a mathematical model and analyzed the system for different cities with different climatic conditions. The results showed that the system’s COP and exergy efficiency can be improved by dedicated mechanical subcooling at an optimum discharge pressure in severe cold regions. Dedicated mechanical subcooling can reduce the expansion losses of the R-744 system by almost 70%. Wang et al. [16] investigated the effect of refrigerant charge on the system performance through energy, exergy, economic, and environmental analysis. They determined an optimum refrigerant charge for the system, which improved the COP by just above 16%. They found that the maximum exergy efficiency was 34.17% and that the evaporator had the highest exergy destruction, with a share of approximately 50%. Cao et al. [17] performed an experimental investigation in order to understand the effect of IHX on the performance of a transcritical R-744 heat pump water heater. According to the results, IHX reduces the optimal discharge pressure and increases the system COP by up to 6.65%. Through an exergy analysis, Liu et al. [18] evaluated a transcritical R-744 ejector refrigeration system, including a thermoelectric sub-cooler. They noted that the exergy destruction could be reduced by 53.36% by increasing the components’ efficiency. The compressor has the highest destruction, followed by the thermoelectric sub-cooler, evaporator, ejector, and gas cooler. Liu et al. [18] developed a dual-ejector and dual-evaporator transcritical R-744 refrigeration cycle for supermarkets by introducing two ejectors and a flash tank to the conventional R-744 system. They concluded that the dual-ejector system reduces the compressor pressure ratio by 19.1%, while increasing the COP and exergy efficiency by up to 27.1% and 27.5%, respectively.
Some studies have analyzed the performance of ejectors and their influence on the overall system performance via a validated simulation model [19,20,21,22].
This research thoroughly investigates the energy and exergy aspects of the winter operation of a transcritical R-744 refrigeration system integrated into a supermarket located in Trento, northern Italy. This system was constructed as part of the MultiPACK Project [23] and stands out as one of the initial implementations featuring multi-ejectors. Additionally, it incorporates innovative features like parallel compression and heat recovery to enhance the overall energy efficiency. The primary goal is to present a comprehensive assessment of the performance of this versatile, real-world unit and to identify any components that may be underperforming. There is a scarcity of literature exploring the energetic and exergetic analyses of such intricate and practical applications. Sharing the performance data of such real systems will provide hints to end users, researchers/scientists, and manufacturers to comprehend to what extent CO2 refrigeration systems can be applicable. While the study outlines improvement measures in the conclusion section, these are not included in the current investigation.
2. Materials and Methods
This study performs an energy and exergy analysis of the unit based on the field data.
2.1. Installation
2.2. System Layout
The simplified layout of the R-744 system installed in the supermarket is shown in Figure 1. The system is transcritical and supported by parallel compression, internal heat exchangers, and ejectors. It has the following three pressure/temperature levels: low temperature (LT), medium temperature (MT), and AC. It can simultaneously meet the demand for cooling, freezing, AC (space heating and cooling), and domestic hot water (DHW) production at the supermarket. The AC is provided by 24 ceiling terminal indoor coils distributed within the supermarket. The R-744 directly flows into these coils [25].
The system has summer and winter modes. In winter mode, the gas cooler (GC) is bypassed, and the heat is rejected into the supermarket through indoor coils. In this study, the system’s performance is analyzed only in winter mode; therefore, more details about the unit’s operation in winter mode will be explained. In this mode, the MT compressors discharge a large part of the refrigerant from the LT and MT stages. The heat is first recovered with a domestic hot water heat exchanger (DHW-HX) to provide hot water of up to 65 °C. The indoor coils recover a significant amount of the excess heat of the refrigerant, and the rest is rejected outdoors through the GC. Afterwards, the refrigerant at the GC exit flows towards the ejectors (Ejs), where expansion work recovery is achieved. They also suck the refrigerant from Receiver 2. Before Receiver 1, all of the refrigerants are mixed. In Receiver 1, the refrigerant is separated into two phases. The gas flows towards IHX-1, then the suction line of auxiliary compressors. The liquid refrigerant exiting Receiver 1 is first further cooled down, then flows towards the LT and MT evaporators. The liquid refrigerants are expanded to the LT and MT evaporating pressures and, afterwards, sent to the evaporators, where they evaporate to create a cooling effect. An intercooler at the LT compressor rack exit cools down the LT discharge temperature when necessary. The LT and MT lines’ refrigerants are mixed and delivered to Receiver 2.
2.3. Field Measurement
The unit’s performance in winter conditions is analyzed in this study’s context.
The pressure, temperature, refrigerant mass flow, and electrical power consumption were measured to calculate the capacities (heating, cooling, and freezing) and total COP of the unit.
Six commercial-type piezoresistive pressure transmitters, with an accuracy ranging from ±1% FS to ±4% FS (FS = 60,105 Pa and 150,105 Pa on the high-pressure side), and 20 commercial-type NTC 10 kΩ ± 1% (at 25 °C Beta 3435) sensors were utilized for measuring the pressure and temperature, respectively. The power consumptions of each compressor rack were measured with three-phase electric power meters with ±0.5% FS accuracy (FS is 24 kW for the LT compressor rack and 120 kW for the MT and AUX). The first compressor in each rack was a variable speed type with inverter frequency control. There was also compressor capacity control logic to meet the increasing demand smoothly. In order to measure the mass flow of the refrigerant, three Coriolis meters (the accuracy is ±0.1%) were used, and their locations are shown in Figure 1 [24].
2.4. Energy Analysis
Approximately three months of field data with daily averages were considered for the energy analysis of the system from 1 November 2019 to 22 January 2020. The changes in electrical power consumption, thermal load, and total COP over time are presented. The electrical power consumption was measured. The thermal loads and total COP were calculated using Equations (1)–(5), as follows:
In these equations, are the heat supplied for the DHW and AC, the cooling load for the MT, and the freezing load for the LT, respectively. , are the electrical power consumptions for the AUX, MT, and LT compressor racks and GC fan, respectivley. (kg/s) is the mass flow rate, while h (kJ/kg) is the specific enthalpy. The enthalpies at given points were calculated considering the temperature and pressure values through REFPROP.
2.5. Conventional Exergy Analysis
Exergy analysis is a powerful tool used in thermodynamics and engineering to evaluate and optimize the efficiency of energy systems. Unlike traditional energy analysis, which focuses on the quantity of energy transfer, exergy analysis takes into account the quality of energy and its ability to do work. Exergy analysis helps us to identify the sources of irreversibilities and losses in a system. This means that, essentially, it can pinpoint each component’s performance in a system. By pinpointing areas of exergy destruction and detecting the main poor-performing components, engineers can focus on improving components or processes to increase overall efficiency. Exergy analysis is, therefore, implemented in this study.
There are four basic exergies ( when magnetic, electrical, nuclear, and surface-tension effects are present, as follows: physical, chemical, kinetic, and potential [26,27]. As was carried out in earlier works [28], only the physical exergy is considered in this study. Hence, the exergy ( equals only the physical exergy (), Equation (6), as follows:
It is also expressed as the specific physical exergy on a unit of mass, as shown in Equation (7), as follows [26]:
In the equations, the subscript j symbolizes the positions 1–22 in Figure 1 and Figure 2, 0 refers to the reference temperature, h is the specific enthalpy, T is the temperature, and s is entropy.
The specific physical exergy is split into two exergies (thermal, , and mechanical, ), which is shown in Equation (8).
In the exergy analysis of this study, when calculating the exergy destruction (, a system at steady state is assumed where the fuel ( is supplied and the product ( is generated (k refers to the k-th component). The exergy destruction is calculated according to Equation (9), as follows:
The exergetic efficiency, exergy destruction ratio (, percentage of exergy destruction ratio (), and the ratio of the total exergy destruction () are calculated as presented in Equations (10)–(12), as follows:
The is a useful parameter to understand the share of a component’s exergy destruction in total exergy destruction.
For the exergy analysis, roughly 20 min of data from the steady-state period were considered. The equations listed for each component in Table 2 were utilized to calculate the exergies of the fuel and product.
2.6. Calculations for the Vapor Ejector
The system has two ejectors: vapor (EJ-1) and liquid (EJ-2) ejectors. The liquid ejector is only activated when there is liquid in Receiver 2; therefore, its operation is neglected in this study. The vapor ejector (Figure 2) will only be taken into consideration.
In Equation (13), µ is the entrainment ratio; is secondary flow’s mass flow rate (the vapor sucked from Receiver 2); and is the primary flow’s mass flow rate (the flow comes from the GC).
In the ejector, the primary flow ( first enters the ejector’s nozzle section.
In the system cycle, Figure 2, state 6–21 presents the nozzle section of the EJ-1. Ƞn is the isentropic efficiency of the nozzle; hn,i (h6) is the specific enthalpy at the nozzle inlet and hn,o (h21) at the nozzle outlet; and hn,is,o is the ideal specific enthalpy at the nozzle exit.
In order to calculate the enthalpies in the diffuser section of the ejector, the R-744 velocities at the nozzle outlet ( and the mixing chamber , state 21–22, must be known (Equations (15)–(18)).
In Equations (15)–(18), is the secondary flow’s velocity and Ƞm is the mixing efficiency.
The enthalpies at the diffuser inlet, hd,i (h22), and outlet, hd,o (h7), are calculated by means of Equations (19)–(21). In the equations, hs,i is the enthalpy of the secondary flow (state 20); Ƞd is the diffuser isentropic efficiency; and hd,is,o is the ideal specific enthalpy at the diffuser outlet.
3. Results and Discussion
3.1. Energy Analysis
The electrical power consumptions, thermal loads, and total COP of the system are shown in Figure 3, Figure 4 and Figure 5, respectively.
According to Figure 3, it can be seen that the MT compressor rack has the highest power consumption (mainly ranging between 15 kW and 20 kW), particularly at lower outdoor temperatures of below 5 °C. The auxiliary (AC) compressor rack has the second highest consumption (roughly 12.5 kW), followed by the GC fan (10 kW). However, the auxiliary compressor rack has the highest power consumption, at around 15 kW, at relatively higher outdoor temperatures (the period between 1 November 2019 and 29 November 2019). The MT compressor rack is the second highest, with a power consumption of 7.5 kW, whereas the GC fan’s consumption is around 5 kW. The LT compressor rack has the lowest power consumption (2.21 kW) at all outdoor temperatures.
Figure 4 presents the system’s heating, cooling, and freezing loads. In the winter, there is naturally a high demand for space heating, due to the supermarket’s total 2200 m2 area; therefore, the AC heating load is high and, on average, 41.6 kW. The DHW heating load is almost stable during the analyzed period and roughly 5 kW. With regard to the refrigeration loads, the MT cooling load is, on average, 25.86 kW, and the LT freezing load ranges between 10 and 15 kW (on average, 13.76 kW). It can be said that the MT cooling and LT freezing loads are stable over the analyzed period because of the constant indoor temperature of the supermarket, where fridges and freezers are located.
The total COP of the system is shown in Figure 5. It can be seen that there is a decrease in total COP with decreasing temperature.
The reason for the lower total COP with the decreasing outdoor temperature is the increase in MT compressor rack power consumption (Figure 3), while the stable or insignificant change in thermal loads (Figure 4) occurs within the same period. One of the primary reasons for the increased MT compressor rack power consumption is an increase in discharge pressure (Pdischarge), as shown in Figure 6. Pdischarge is fixed to 85 bar when heat recovery is required in the winter mode, particularly at lower outdoor temperatures. In Figure 6, it can also be seen that the evaporating pressures and temperatures are almost stable.
The mean value of the total COP is 2.47 within the whole analyzed period and 2.18 at lower outdoor temperatures (1 December 2019–22 January 2020).
3.2. Exergy Analysis
Table 3 lists the measured mass flow, pressure, and temperature at each point, along with the calculated enthalpy, entropy, and specific exergy. For the exergy calculation at state 21, the pressure decrease at the nozzle outlet was assumed to be 0.2 bar less than the secondary flow’s pressure (the pressure at state 20).
Table 4 presents the exergy analysis results of the system based on the specific exergy calculations demonstrated in Table 3. The overall exergy efficiency of the system is 22.4%. The AUX compressor rack has the highest exergy destruction, with 12.56 kW, followed by the GC, AC coils, MT compressor rack, and EJ-1. The AUX compressor rack naturally has the highest exergy destruction ratio (ɸ), with 31.8%, and with 32.5% of the percentage of exergy destruction ratio (ɸ*). In terms of exergy efficiency, the LT compressor rack has the highest, with 95%. The LT compressors’ pressure ratio, 2.06 (discharge pressure/suction pressure), is lower compared to that of the MT (2.84) and AUX (2.33); therefore, they operate more efficiently. Other components with high exergetic efficiencies are the expansion valves (EVs), between 81 and 85%, and the LT evaporators, with 79%. The GC has the worst exergetic efficiency, at 5%, due to the fan’s high electrical power consumption. The EJ-1 has the second worst exergetic efficiency of 7%. The MT evaporator also has a low exergetic efficiency of 16.8% but has a very low exergy destruction value.
It can be asserted that the components exhibiting superior exergetic efficiency tend to possess lower exergy destruction ratios and percentages. It is essential to highlight that, to enhance overall system efficiency effectively, emphasis should be placed on optimizing the components with lower exergy efficiency, as they offer greater potential for improvement. For example, starting with the implementation of a more efficient gas compressor (GC) would be prudent. The efficiency of a GC is significantly influenced by the airside, and improvements can be achieved by employing highly efficient fans or smart control strategies for fan operation. Additionally, enhancing the performance of the ejector can be accomplished by increasing the entrainment ratio, which currently stands at 0.10 during the analyzed unit period.
Given that compressor racks exhibit higher exergy destructions, one potential solution could involve replacing all of the fixed-speed compressors with variable-speed drive units. However, it is important to note that such a solution might entail substantial costs. Another avenue for improvement could be optimizing the discharge pressure, although the unit already operates at an optimal discharge pressure of approximately 85 bar.
4. Conclusions
In this research, an examination of an integrated transcritical CO2 refrigeration system during winter conditions was conducted. The system was installed in a north Italian supermarket located in Trento and had the capacity to fulfil the heating (domestic hot water and space heating), cooling, and freezing requirements of the supermarket.
The energy analysis has revealed that the mean total COP was 2.47 over the entire analysis period. However, it dropped to 2.18 during the period of lower outdoor temperatures (from 1 December 2019 to 22 January 2020). These efficiency levels are promising and relevant for such a complex system, simultaneously meeting the different demands. Meeting various demands with a single system has the advantage of a reduced cost, simplicity, less space requirement, and less maintenance. Otherwise, different systems must be applied to supply cooling, heating, and AC demands.
The main energy consumer was the MT compressor rack, particularly when the outdoor temperature fell below 5 °C. The AUX compressor rack and the GC fan also exhibited significant electrical power consumption. Additionally, the AC heating load was consistently high, averaging 41.6 kW, while the domestic hot water heating load remained relatively stable throughout the analysis period, at approximately 5 kW. Concerning the refrigeration loads, the average MT cooling load was 25.86 kW, and the LT freezing load ranged between 10 and 15 kW, with an average of 13.76 kW.
In terms of exergy analysis, the system’s overall exergy efficiency was determined to be 22.4%. The auxiliary compressor rack was identified as the primary source of exergy destruction, responsible for 12.56 kW. It was followed by the GC, AC coils, MT compressor rack, and EJ-1. The auxiliary compressor rack also exhibited the highest exergy destruction ratio, at 31.8%, along with 32.5% of the percentage exergy destruction ratio. In contrast, the LT compressor rack displayed the highest exergetic efficiency, operating at 95%. This efficiency was attributed to its lower pressure ratio (2.06), as compared to the MT (2.84) and the AUX (2.33), allowing it to operate more effectively. Other components with notable exergetic efficiencies included the expansion valves, ranging from 81 to 85%, and the LT evaporators, operating at 79%. Conversely, the GC had the lowest exergetic efficiency, at 5%, mainly due to its high electrical power consumption. The EJ-1 was the second least efficient component, with an exergetic efficiency of 7%.
To further enhance the system performance, this study lays the groundwork for implementing improvement measures based on the insights gained from the exergy analysis. The components with lower exergy efficiency have been identified as priority areas for potential improvement. Two solutions would be implementing more efficient components and smarter control logic. A simulation model of the integrated transcritical CO2 (R-744) refrigeration system can be developed by utilizing one of the relevant simulation tools, for example, Dymola/Modelica, to analyze the improvement measures.
Funding
This project received funding from the European Union’s Horizon 2020 research and innovation program under grant agreement No 723137.
Data Availability Statement
The data supporting the reported results can be found here: https://doi.org/10.18710/Z33Q8X (accessed on 15 October 2023).
Conflicts of Interest
The authors declare no conflicts of interest.
Nomenclature
| Symbols | |
| AC | air conditioning |
| AUX | auxiliary |
| COP | coefficient of performance |
| DHW | domestic hot water |
| EJ | ejector |
| EV | expansion valve |
| exergy (kW) | |
| e | specific exergy (kJ/kg) |
| GC | gas cooler |
| h | specific enthalpy (kJ/kg) |
| HVAC | heating, ventilation, and air conditioning |
| HX | heat exchanger |
| ṁ | mass flow rate (kg/s) |
| IHX | internal heat exchanger |
| LT | low-temperature |
| MT | medium-temperature |
| P | pressure (bar) |
| heat load (kW) | |
| s | specific entropy (kJ/kgK) |
| T | temperature (°C) |
| VCT | vapor compression technology |
| work (kW) | |
| ɸ | Exergy destruction ratio |
| Greek symbols | |
| µ | entrainment ratio |
| ε | exergy efficiency |
| ƞ | efficiency |
| Superscripts | |
| PH | physical |
| PHA | physical air |
| PHW | physical water |
| M | mechanical |
| T | thermal |
| Subscripts | |
| A | air |
| amb | ambient |
| d | diffuser |
| D | destruction |
| evap | evaporator |
| F | fuel |
| i | inlet |
| is | isentropic |
| j | exergy carrier positions |
| k | the k-th component |
| m | mixing |
| mix | mixture |
| n | nozzle |
| o | outlet |
| P | product |
| p | primary |
| s | secondary |
| tot | total (overall) |
| 0 | reference condition |
| 1–22 | locations in the system and ejector |
References
- Koegelenberg, I.; Laumen, Z.; Garry, M.; Christiansen, T.S.; Yoshimoto, D.; Dusek, J.; Aleu, P. World Guide to Transcritical CO2 Refrigeration; Shecco: Brussels, Belgium, 2020. [Google Scholar]
- ASHRAE. 2018 ASHRAE Handbook-Refrigeration; ASHRAE: Atlanta, GA, USA, 2018. [Google Scholar]
- Skacanová, K.Z.; Battesti, M. Global market and policy trends for CO2 in refrigeration. Int. J. Refrig. 2019, 107, 98–104. [Google Scholar] [CrossRef]
- Purohit, N.; Sharma, V.; Sawalha, S.; Fricke, B.; Llopis, R.; Dasgupta, M.S. Integrated supermarket refrigeration for very high ambient temperature. Energy 2018, 165, 572–590. [Google Scholar] [CrossRef]
- Mitsopoulosa, G.; Syngounasa, E.; Tsimpoukisa, D.; Bellosa, E.; Tzivanidisa, C.; Anagnostatos, S. Annual performance of a supermarket refrigeration system using different configurations with CO2 refrigerant. Energy Convers. Manag. X 2019, 1, 100006. [Google Scholar] [CrossRef]
- Cui, Q.; Gao, E.; Zhang, Z.; Zhang, X. Preliminary study on the feasibility assessment of CO2 booster refrigeration systems for supermarket application in China: An energetic, economic, and environmental analysis. Energy Convers. Manag. 2020, 225, 113422. [Google Scholar] [CrossRef]
- Tsimpoukis, D.; Syngounas, E.; Petsanas, D.; Mitsopoulos, G.; Anagnostatos, S.; Bellos, E.; Tzivanidis, C.; Vrachopoulos, M.G. Energy and environmental investigation of R744 all-in-one configurations for refrigeration and heating/air conditioning needs of a supermarket. J. Clean. Prod. 2021, 279, 123234. [Google Scholar] [CrossRef]
- Morosuka, T.; Tsatsaronis, G. A new approach to the exergy analysis of absorption refrigeration machines. Energy 2008, 33, 890–907. [Google Scholar] [CrossRef]
- Morosuk, T.; Tsatsaronis, G. Advanced exergetic evaluation of refrigeration machines using different working fluids. Energy 2009, 34, 2248–2258. [Google Scholar] [CrossRef]
- Fangtian, S.; Yitai, M. Thermodynamic analysis of transcritical CO2 refrigeration cycle with an ejector. Appl. Therm. Eng. 2011, 31, 1184–1189. [Google Scholar] [CrossRef]
- Bai, T.; Yan, G.; Yu, J. Thermodynamics analysis of a modified dual-evaporator CO2 transcritical refrigeration cycle with two-stage ejector. Energy 2015, 84, 325–335. [Google Scholar] [CrossRef]
- Bai, T.; Yu, J.; Yan, G. Advanced exergy analyses of an ejector expansion transcritical CO2 refrigeration system. Energy Convers. Manag. 2016, 126, 850–861. [Google Scholar] [CrossRef]
- Gholamian, E.; Hanafizadeh, P.; Ahmadi, P. Advanced exergy analysis of a carbon dioxide ammonia cascade refrigeration system. Appl. Therm. Eng. 2018, 137, 689–699. [Google Scholar] [CrossRef]
- Purohit, N.; Gupta, D.K.; Dasgupta, M.S. Experimental investigation of a CO2 trans-critical cycle with IHX for chiller application and its energetic and exergetic evaluation in warm climate. Appl. Therm. Eng. 2018, 136, 617–632. [Google Scholar] [CrossRef]
- Dai, B.; Qi, H.; Liu, S.; Ma, M.; Zhong, Z.; Li, H.; Song, M.; Sun, Z. Evaluation of transcritical CO2 heat pump system integrated with mechanical subcooling by utilising energy, exergy and economic methodologies for residential heating. Energy Convers. Manag. 2019, 192, 202–220. [Google Scholar] [CrossRef]
- Wang, Y.; Ye, Z.; Song, Y.; Yin, X.; Cao, F. Energy, exergy, economic and environmental analysis of refrigerant charge in air source transcritical carbon dioxide heat pump water heater. Energy Convers. Manag. 2020, 223, 113209. [Google Scholar] [CrossRef]
- Cao, F.; Ye, Z.; Wang, Y. Experimental investigation on the influence of internal heat exchanger in a transcritical CO2 heat pump water heater. Appl. Therm. Eng. 2020, 168, 114855. [Google Scholar] [CrossRef]
- Liu, J.; Liu, Y.; Yu, J. Performance analysis of a modified dual-ejector and dual-evaporator transcritical CO2 refrigeration cycle for supermarket application. Int. J. Refrig. 2021, 131, 109–118. [Google Scholar] [CrossRef]
- Li, Y.; Deng, J.; Ma, L.; Zhang, Y. Visualisation of two-phase flow in primary nozzle of a transcritical CO2 ejector. Energy Convers. Manag. 2018, 171, 729–741. [Google Scholar] [CrossRef]
- Elbarghthi, A.F.; Hafner, A.; Banasiak, K.; Dvorak, V. An experimental study of an ejector-boosted transcritical R744 refrigeration system including an exergy analysis. Energy Convers. Manag. 2021, 238, 114102. [Google Scholar] [CrossRef]
- Zheng, L.; Hu, Y.; Mi, C.; Deng, J. Advanced exergy analysis of a CO2 two-phase ejector. Appl. Therm. Eng. 2022, 209, 118247. [Google Scholar] [CrossRef]
- Liu, X.; Yu, K.; Wan, X.; Zheng, M.; Li, X. Conventional and advanced exergy analyses of transcritical CO2 ejector refrigeration system equipped with thermoelectric subcooler. Energy Rep. 2021, 7, 1765–1779. [Google Scholar] [CrossRef]
- Project, T.M. The MultiPACK Project Website. Available online: https://spfarm.ntnu.no/sites/project/192/SitePages/Home.aspx (accessed on 15 October 2023).
- Artuso, P.; Minetto, S.; Rossetti, A.; Tosato, G.; Marinetti, S. Two years of data monitoring of all-CO2 retail stores within the MultiPACK project. In Proceedings of the 9th IIR Conference: Ammonia and CO2 Refrigeration Technologies, Ohrid, North Macedonia, 16–17 September 2021. [Google Scholar]
- Tosato, G.; Minetto, S.; Hafner, A.; Rossetti, A.; Marinetti, A.; Girotto, S. Field assessment of the performance of a state-of-the-art CO2 integrated system for supermarket with distributed HVAC terminals in the shopping area. In Proceedings of the 9th IIR Conference: Ammonia and CO2 Refrigeration Technologies, Nantes, France, 16–17 September 2021. [Google Scholar]
- Bejan, A.; Tsatsaronis, G.; Moran, J. Thermal Design and Optimisation; Wiley: New York, NY, USA, 1996. [Google Scholar]
- Tsatsaronis, G.; Cziesla, F. Thermoeconomics. In Encyclopedia of Physical Science and Technology; Academic Press: New York, NY, USA, 2001; pp. 659–680. [Google Scholar]
- Chen, J.; Havtun, H.; Palm, B. Conventional and advanced exergy analysis of an ejector refrigeration system. Appl. Energy 2015, 144, 139–151. [Google Scholar] [CrossRef]
- Zhou, M.; Wang, X.; Yu, J. Theoretical study on a novel dual-nozzle ejector. Energy Convers. Manag. 2013, 73, 278–284. [Google Scholar] [CrossRef]
- Dai, Y.; Wang, J.; Gao, L. Exergy analysis, parametric analysis and optimization for a novel combined power and ejector refrigeration cycle. Appl. Therm. Eng. 2009, 29, 1983–1990. [Google Scholar] [CrossRef]
- Liu, F.; Groll, E.A.; Li, D. Investigation on performance of variable geometry ejectors for CO2 refrigerarion cycles. Energy 2012, 45, 829–839. [Google Scholar] [CrossRef]
Figure 1.
Simplified layout of the system. The flow direction is clockwise. Labels 1–2a and 18–2b: compression at MT and auxiliary compressor racks; 2–3: hot water supply at DHW-HX; 3–4: AC supply (there are 24 parallel indoor coils); 4–5: heat rejection at GC; 5–6: subcooling at IHX-1; 6–7: throttling and mixing in the ejectors; 7–8: refrigerant phase separation; 8–9: further cooling of the liquid refrigerant exiting Receiver 1; 9–10: expansion to the LT evaporator by expansion valve; 10–11: evaporation at LT evaporator; 11–12: superheating of the vapor refrigerant exiting LT evaporator; 12–13: compression at LT compressor; 13–14: cooling at intercooler; 9–15: expansion to the MT evaporator by expansion valve; 15–16: evaporation at MT evaporator; 18–19: superheating of the AUX suction gas (the refrigerant exiting the Receiver 1); 17–1–20: refrigerant phase separation at Receiver 2. The high-pressure valve (HPV) is activated when the ejectors are out of operation.

Figure 2.
Schematic view of the EJ-1. Ejector. Labels 6–21: nozzle, 21–22: mixing, primary flow (state 6) mixes with the secondary flow from Receiver 2 (state 20), 22–7: diffuser.
Figure 2.
Schematic view of the EJ-1. Ejector. Labels 6–21: nozzle, 21–22: mixing, primary flow (state 6) mixes with the secondary flow from Receiver 2 (state 20), 22–7: diffuser.

Figure 3.
Change in the electrical power consumption of the system with time.

Figure 4.
Change in the thermal loads of the system with time.

Figure 5.
Change in the total COP of the system with time.
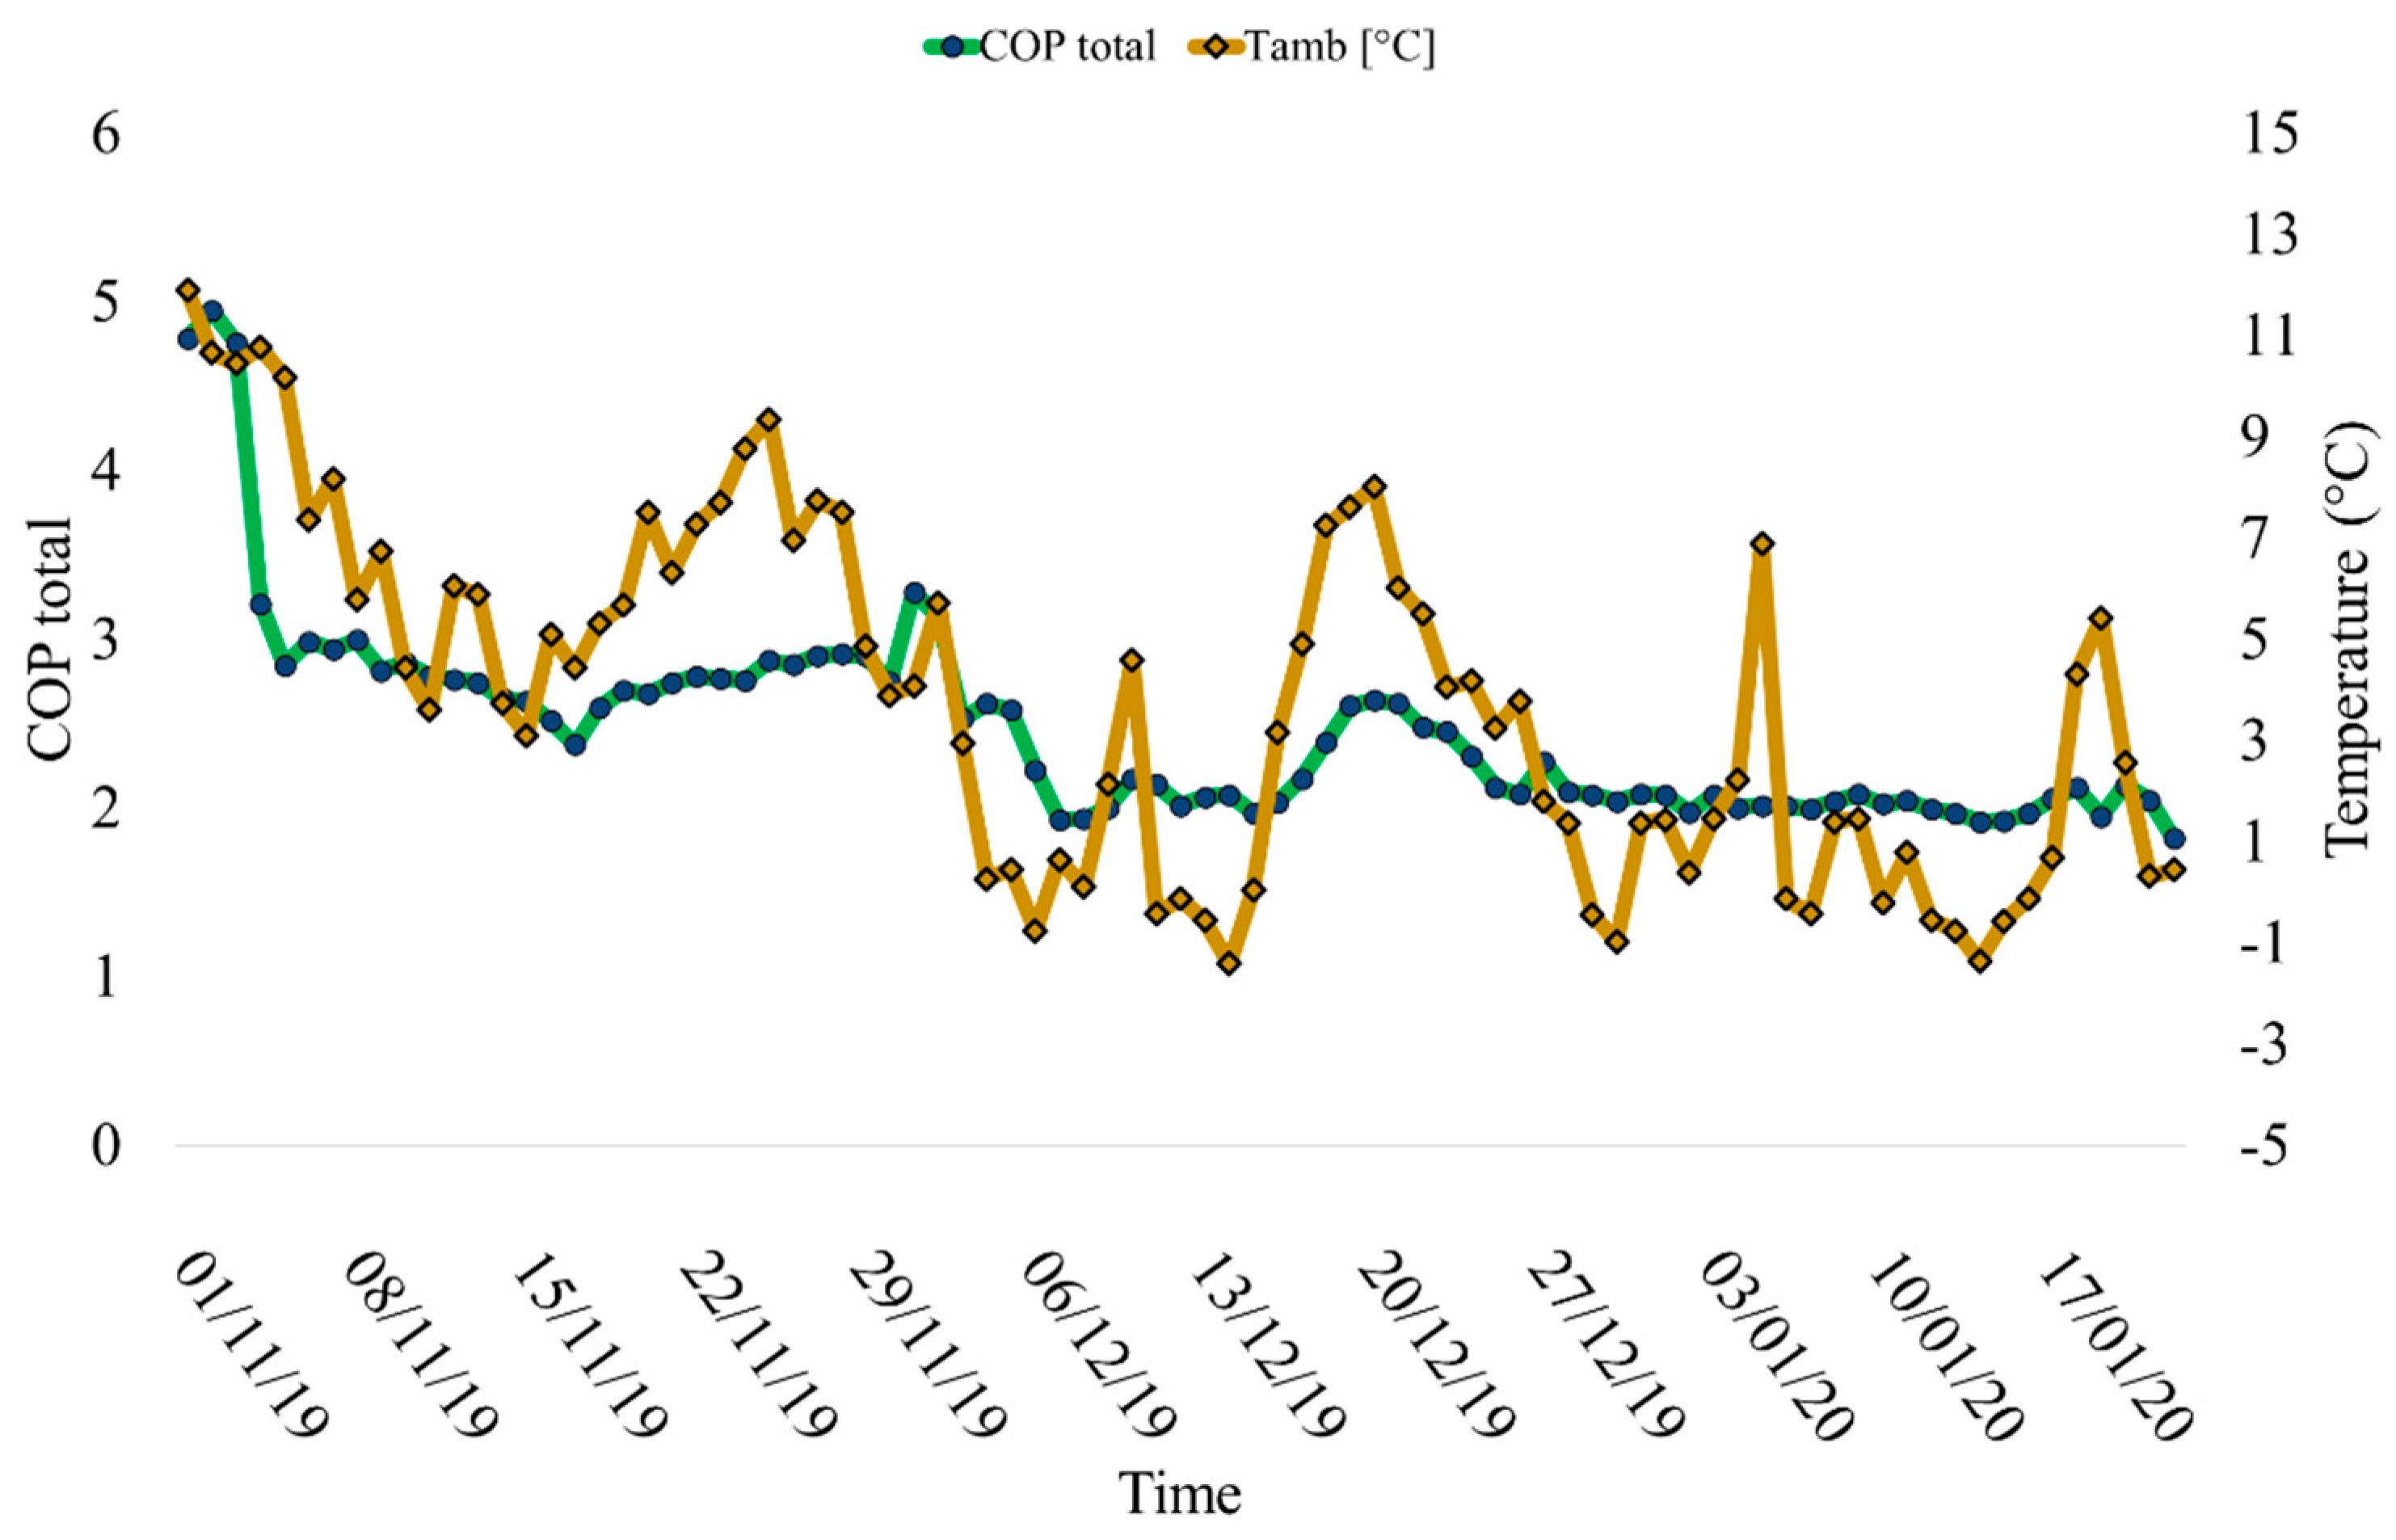
Figure 6.
Change in the pressure and temperature levels of the system over time.


Table 1.
The design specifications of the system.
| Demand | Design Temperature | Capacities |
|---|---|---|
| Medium-temperature stage (cooling) | −4 °C (evaporating) | 90 kW |
| Low-temperature stage (freezing) | −30 °C (evaporating) | 22 kW |
| Space heating | 10 °C (outdoor) | 200 kW |
| Space cooling | 30 °C (outdoor) | 280 kW |
Table 2.
Equations for exergy calculations of each component.
| Component | State | Fuel | Product |
|---|---|---|---|
| MT compressors | 1–2a | m1 (ePH2a − ePH1) | |
| AUX compressors | 19–2b | m19 (ePH2b − ePH19) | |
| DHW-HX | 2–3 | m3 (ePH2 − ePH3) | mW1 (ePHW2 − ePHW1) |
| AC coils (heating) | 3–4 | m3 (ePH3 − ePH4) | mA1 (ePHA2 − ePHA1) × 24 |
| GC | 4–5 | m4 (ePH4 − ePH5) + WGC-fan | mA3 (ePHA4 − ePHA3) |
| Ejector 1 | 6–7 | m6 (ePH6 − ePH21) | m20 (ePH7 −ePH20) |
| EVLT | 9–10 | m10 (e9m − e10m +e9T) | m10e10T |
| LT evaporator | 10–11 | m10 (ePH10 − ePH11) | mA7 (ePHA8 − ePHA7) |
| EVMT | 9–15 | m15 (e9m − e15m+ e9T) | m15e15T |
| MT evaporator | 15–16 | m15 (ePH15 − ePH16) | mA5 (ePHA6 − ePHA5) |
| LT compressors | 12–13 | m12 (ePH13 − ePH12) |
Table 3.
Field data of the system and specific exergy at each position. P0 = 1.01325 bar, T0 = 0 °C (it is slightly above 0 °C for water); (1) R-744: s0 = 2.66 kJ/kgK, h0= 505.84 kJ/kg; (2) Air: s0 = 6.77 kJ/kgK, h0 = 273.29 kJ/kg; (3) Water: s0 = 0.000007 kJ/kgK, h0 = 0.10 kJ/kg.
Table 3.
Field data of the system and specific exergy at each position. P0 = 1.01325 bar, T0 = 0 °C (it is slightly above 0 °C for water); (1) R-744: s0 = 2.66 kJ/kgK, h0= 505.84 kJ/kg; (2) Air: s0 = 6.77 kJ/kgK, h0 = 273.29 kJ/kg; (3) Water: s0 = 0.000007 kJ/kgK, h0 = 0.10 kJ/kg.
| State | Exergy Carrier | ṁ | Pj | Tj | hj | sj | hpj,T0 | spj,T0 | ejT | ejM | ePH |
|---|---|---|---|---|---|---|---|---|---|---|---|
| kg/s | bar | °C | kJ/kg | kJ/kgK | kJ/kg | kJ/kgK | kJ/kg | kJ/kg | kJ/kg | ||
| 1 | R-744 | 0.19 | 29.63 | 2.05 | 445.92 | 1.923 | 442.99 | 1.91 | 0.01 | 142.42 | 142.43 |
| 2a | R-744 | 0.19 | 84.22 | 100.07 | 516.76 | 1.989 | 196.26 | 0.97 | 41.38 | 153.72 | 195.10 |
| 2b | R-744 | 0.17 | 84.22 | 137.55 | 564.83 | 2.112 | 196.26 | 0.97 | 55.89 | 153.72 | 209.61 |
| 2 | R-744 | 0.36 | 84.22 | 99.48 | 515.94 | 1.987 | 196.26 | 0.97 | 41.16 | 153.72 | 194.88 |
| 3 | R-744 | 0.36 | 84.22 | 79.65 | 486.95 | 1.907 | 196.26 | 0.97 | 34.02 | 153.72 | 187.74 |
| 4 | R-744 | 0.36 | 84.22 | 33.38 | 298.07 | 1.316 | 196.26 | 0.97 | 6.58 | 153.72 | 160.30 |
| 5 | R-744 | 0.36 | 84.22 | 26.03 | 264.80 | 1.206 | 196.26 | 0.97 | 3.28 | 153.72 | 157.00 |
| 6 | R-744 | 0.36 | 84.22 | 24.33 | 259.06 | 1.187 | 196.26 | 0.97 | 2.79 | 153.72 | 156.51 |
| 21 | R-744 | 0.36 | 29.43 | −6.25 | 251.78 | 1.197 | 444.46 | 1.92 | 4.87 | 141.45 | 146.32 |
| 7 | R-744 | 0.40 | 36.21 | 2.45 | 277.49 | 1.282 | 199.85 | 1.00 | 0.40 | 148.65 | 149.05 |
| 8 | R-744 | 0.23 | 36.21 | 2.45 | 203.57 | 1.012 | 199.85 | 1.00 | 0.01 | 148.65 | 148.66 |
| 9 | R-744 | 0.23 | 36.21 | 1.25 | 203.14 | 1.011 | 199.85 | 1.00 | 0.01 | 148.65 | 148.66 |
| 10 | R-744 | 0.08 | 14.39 | −29.69 | 203.14 | 1.037 | 468.19 | 2.12 | 30.46 | 111.20 | 141.66 |
| 11 | R-744 | 0.08 | 14.39 | −8.21 | 459.92 | 2.088 | 468.19 | 2.12 | 0.13 | 111.20 | 111.33 |
| 12 | R-744 | 0.08 | 14.39 | −7.01 | 461.14 | 2.092 | 468.19 | 2.12 | 0.09 | 111.20 | 111.29 |
| 13 | R-744 | 0.08 | 29.63 | 63.56 | 517.17 | 2.157 | 442.99 | 1.91 | 7.15 | 142.42 | 149.57 |
| 15 | R-744 | 0.15 | 29.63 | −6.03 | 203.14 | 1.014 | 442.99 | 1.91 | 5.29 | 142.42 | 147.71 |
| 16 | R-744 | 0.15 | 29.63 | −1.48 | 440.82 | 1.904 | 442.99 | 1.91 | 0.01 | 142.42 | 142.43 |
| 18 | R-744 | 0.17 | 36.21 | 2.45 | 431.90 | 1.844 | 199.85 | 1.00 | 1.22 | 148.65 | 149.87 |
| 19 | R-744 | 0.17 | 36.21 | 2.55 | 432.09 | 1.845 | 199.85 | 1.00 | 1.22 | 148.65 | 149.88 |
| 20 | R-744 | 0.04 | 29.63 | 2.05 | 445.92 | 1.923 | 442.99 | 1.91 | 0.01 | 142.42 | 142.43 |
| A1 | Air | 0.50 | 1.01 | 20.00 | 293.41 | 6.843 | 273.29 | 6.77 | 0.70 | 0.01 | 0.71 |
| A2 | Air | 0.50 | 1.01 | 25.69 | 299.14 | 6.863 | 273.29 | 6.77 | 1.14 | 0.01 | 1.15 |
| A3 | Air | 1.51 | 1.01 | 0.00 | 273.29 | 6.772 | 273.29 | 6.77 | 0.00 | 0.01 | 0.01 |
| A4 | Air | 1.51 | 1.01 | 15.00 | 288.38 | 6.826 | 273.29 | 6.77 | 0.40 | 0.01 | 0.41 |
| A5 | Air | 4.50 | 1.01 | 3.00 | 276.31 | 6.783 | 273.29 | 6.77 | 0.02 | 0.01 | 0.03 |
| A6 | Air | 4.50 | 1.01 | −4.99 | 268.27 | 6.754 | 273.29 | 6.77 | 0.05 | 0.01 | 0.06 |
| A7 | Air | 3.00 | 1.01 | −20.00 | 253.17 | 6.696 | 273.29 | 6.77 | 0.77 | 0.01 | 0.78 |
| A8 | Air | 3.00 | 1.01 | −26.58 | 246.55 | 6.669 | 273.29 | 6.77 | 1.39 | 0.01 | 1.40 |
| W1 | R-718 | 0.07 | 1.01 | 30.00 | 125.82 | 0.44 | 0.10 | 0.00007 | 6.43 | 0.00 | 6.43 |
| W2 | R-718 | 0.07 | 1.01 | 66.01 | 276.40 | 0.91 | 0.10 | 0.00007 | 28.80 | 0.00 | 28.80 |
Table 4.
Exergy destruction and exergetic efficiencies of each component.
| Component | State | ɸ | ɸ* | ||||
|---|---|---|---|---|---|---|---|
| - | - | kW | kW | kW | (%) | (%) | (%) |
| MT compressor rack | 1–2a | 13.57 | 10.08 | 3.48 | 74.3 | 8.8 | 9.0 |
| AUX compressor rack | 19–2b | 22.85 | 10.28 | 12.56 | 45.0 | 31.8 | 32.5 |
| DHW-HX | 2–3 | 2.60 | 1.57 | 1.03 | 60.3% | 2.6% | 2.7 |
| AC coils (heating) | 3–4 | 9.98 | 5.30 | 4.68 | 53.1 | 11.8 | 12.1 |
| GC | 4–5 | 12.12 | 0.60 | 11.52 | 5.0 | 29.1 | 29.8 |
| Ejector 1 (EJ-1) | 6–7 | 3.63 | 0.25 | 3.37 | 7.0 | 8.5 | 8.7% |
| EVLT | 9–10 | 2.90 | 2.36 | 0.54 | 81.3 | 1.4 | 1.4% |
| LT evaporator | 10–11 | 2.35 | 1.85 | 0.49 | 79.0 | 1.2 | 1.3% |
| EVMT | 9–15 | 0.95 | 0.81 | 0.14 | 84.8 | 0.4 | 0.4% |
| MT evaporator | 15–16 | 0.80 | 0.14 | 0.67 | 16.8 | 1.7 | 1.7% |
| LT compressor rack | 12–13 | 3.12 | 2.96 | 0.16 | 95.0 | 0.4 | 0.4% |
| Overall | - | 39.53 | 8.85 | 38.65 | 22.4 | 97.8 | 100.0% |
Disclaimer/Publisher’s Note: The statements, opinions and data contained in all publications are solely those of the individual author(s) and contributor(s) and not of MDPI and/or the editor(s). MDPI and/or the editor(s) disclaim responsibility for any injury to people or property resulting from any ideas, methods, instructions or products referred to in the content. |
© 2024 by the author. Licensee MDPI, Basel, Switzerland. This article is an open access article distributed under the terms and conditions of the Creative Commons Attribution (CC BY) license (https://creativecommons.org/licenses/by/4.0/).
Share and Cite
MDPI and ACS Style
Söylemez, E. Energy and Conventional Exergy Analysis of an Integrated Transcritical CO2 (R-744) Refrigeration System. Energies 2024, 17, 479. https://doi.org/10.3390/en17020479
AMA Style
Söylemez E. Energy and Conventional Exergy Analysis of an Integrated Transcritical CO2 (R-744) Refrigeration System. Energies. 2024; 17(2):479. https://doi.org/10.3390/en17020479
Chicago/Turabian StyleSöylemez, Engin. 2024. "Energy and Conventional Exergy Analysis of an Integrated Transcritical CO2 (R-744) Refrigeration System" Energies 17, no. 2: 479. https://doi.org/10.3390/en17020479
Note that from the first issue of 2016, this journal uses article numbers instead of page numbers. See further details here.