Essay

The Kinetics of Semi-Coke CO2 Gasification Based on Pore Fractal Growth

1
College of Chemistry and Chemical Engineering, Xi’an University of Science and Technology, Xi’an 710054, China
2
Shaanxi Coal Industry New Energy Technology Co., Ltd., Xi’an 710054, China
3
Key Laboratory of Coal Resources Exploration and Comprehensive Utilization, Ministry of Natural, Xi’an 710021, China
*
Author to whom correspondence should be addressed.
Energies 2024, 17(2), 483; https://doi.org/10.3390/en17020483
Submission received: 1 December 2023 / Revised: 2 January 2024 / Accepted: 15 January 2024 / Published: 19 January 2024
(This article belongs to the Section D1: Advanced Energy Materials)

Abstract

:
The gasification kinetics of semi-coke are an important research topic in the gasification process of semi-coke. The evolution of the pore structure is one of the most important factors affecting the gasification rate of semi-coke. In this paper, the pore fractal growth model was established based on the principle of pore fractal growth and the Sierpinski sponge structure. Three kinds of semi-coke raw materials were used to prepare porous carbon with different degrees of gasification. Combined with the TG curves of raw materials, the gasification kinetics based on the fractal model were verified. The curves of the gasification reaction rate and the specific surface area as a function of carbon conversion were consistent with the random pore model and experimental data, which verified the feasibility of the model. The pore fractal dynamic model could predict the change in the pore structure with carbon conversion during semi-coke gasification, so as to reveal the kinetic law of carbon gasification.

1. Establishment of the Pore Fractal Growth Model during Carbon Gasification

It has always been an important topic to establish a kinetic model for the gasification of coal, biomass, semi-coke, etc. [1,2,3,4,5,6,7]. For a solid oxide direct carbon fuel cell (SO-DCFC), the kinetics of carbon gasification have a direct impact on the performance of carbon fuel cells. Many scholars believe that the Boudouard reaction is the main factor in the electrochemical performance of SO-DCFCs [8,9,10,11]. Therefore, improving the Boudouard reaction rate is an effective way to realize the efficient and stable operation of SO-DCFCs.
Factors affecting the reaction rate of the Boudouard reaction include the surface structure and the pore structure of carbon, active sites, alkali metal content and pyrolysis conditions (gasification temperature and CO2 partial pressure) [9]. The structural evolution of semi-coke during gasification has become the focus of research on gasification reactions. The gasification reaction of semi-coke is a gas-solid reaction with porous structure essentially, the pore structure of semi-coke particles plays an important role in the gasification process [10,11,12,13,14]. The gasification reaction occurs not only on the outer surface of the particle, but also on the inner surface of the particle [15]. During the reaction, the reaction gas diffuses through the pores into the particles and reacts with carbon atoms on the inner wall of the pores. Then, the product gas diffuses out of the interior [16,17,18,19]. The effect of pore structure on gasification behavior is mainly reflected in the effect of solid surface area change on the gasification reaction rate [20,21]. Kinetic models describing the Boudouard reaction rate on the basis of carbon conversion include the volume reaction model (VRM), the shrinkage core model (SCM), the grain model (GM), the random pore model (RPM) and the modified random pore model (MRPM) [22,23].
The random pore model (RPM) [24] provides the relationship between the specific surface area of the reaction and the change in carbon conversion and successfully explains the phenomenon that the reaction rate decreases with the carbon conversion rate or has a maximum value as seen in Dutta et al.’s experiments [25]. However, RPM theory is a semi-empirical model based on the hypothesis of cylindrical pore expansion and merging, which does not fully reveal the evolution process of pore size. Due to the complexity of semi-coke pores, Euclidean geometry has been unable to accurately and quantitatively describe the complex pore structure. The fractal model based on the concept of self-similarity provides an effective means to describe the complex pore structure. Based on the fractal theory, the “disordered” pores can be characterized as “ordered”. In many studies, fractal dimension is strongly correlated with pore size distribution, surface roughness, pore volume and specific surface area [26,27,28]. Many fractal theoretical models have been well applied to describe the surface properties of porous materials [29,30,31,32,33]. However, there is no fractal model that can accurately and quantitatively describe the pore evolution of semi-coke gasification. In this paper, a pore fractal growth model was established with the reaction degree and the reaction step length based on the Scherpinski-like sponge model.
The pore structure change of semi-coke determines the contact area between the semi-coke and the gasification agent, which directly affects the gasification rate of the semi-coke. Therefore, it is important to study the pore change of semi-coke during gasification. At present, pore changes in the semi-coke gasification process are mainly focused on the pore distribution analysis of the semi-coke porous structure and the semi-empirical model, and there is no clear pore evolution law at the micro-level during semi-coke gasification. This paper aims to explore the pore structure characteristics of semi-coke under different degrees of gasification based on the fractal growth theory of pores. The quantitative relationship between pore volume, specific surface area and fractal dimension in the evolution of semi-coke pores was studied, and the kinetic law of the CO2 gasification of semi-coke was established based on the quantitative relationship of the pore microstructure.

1.1. The Hypothesis of Fractal Growth

It is assumed that carbon particles are cubic structures with a side length of one unit. The CO2 molecules begin to react with carbon particles on the six sides of the cube. The hole side length of each reaction is 1/3 of the hole side length of the previous stage, extending inward to the carbon cube. That is, you can equally divide the cube into 27 small cubes with a 1/3 side length, then remove the six small cubes in the middle of the six faces, leaving a face with a 1/3 side length, and then extend it inward according to the cube with a (1/3)2 side length, and so on until infinity.
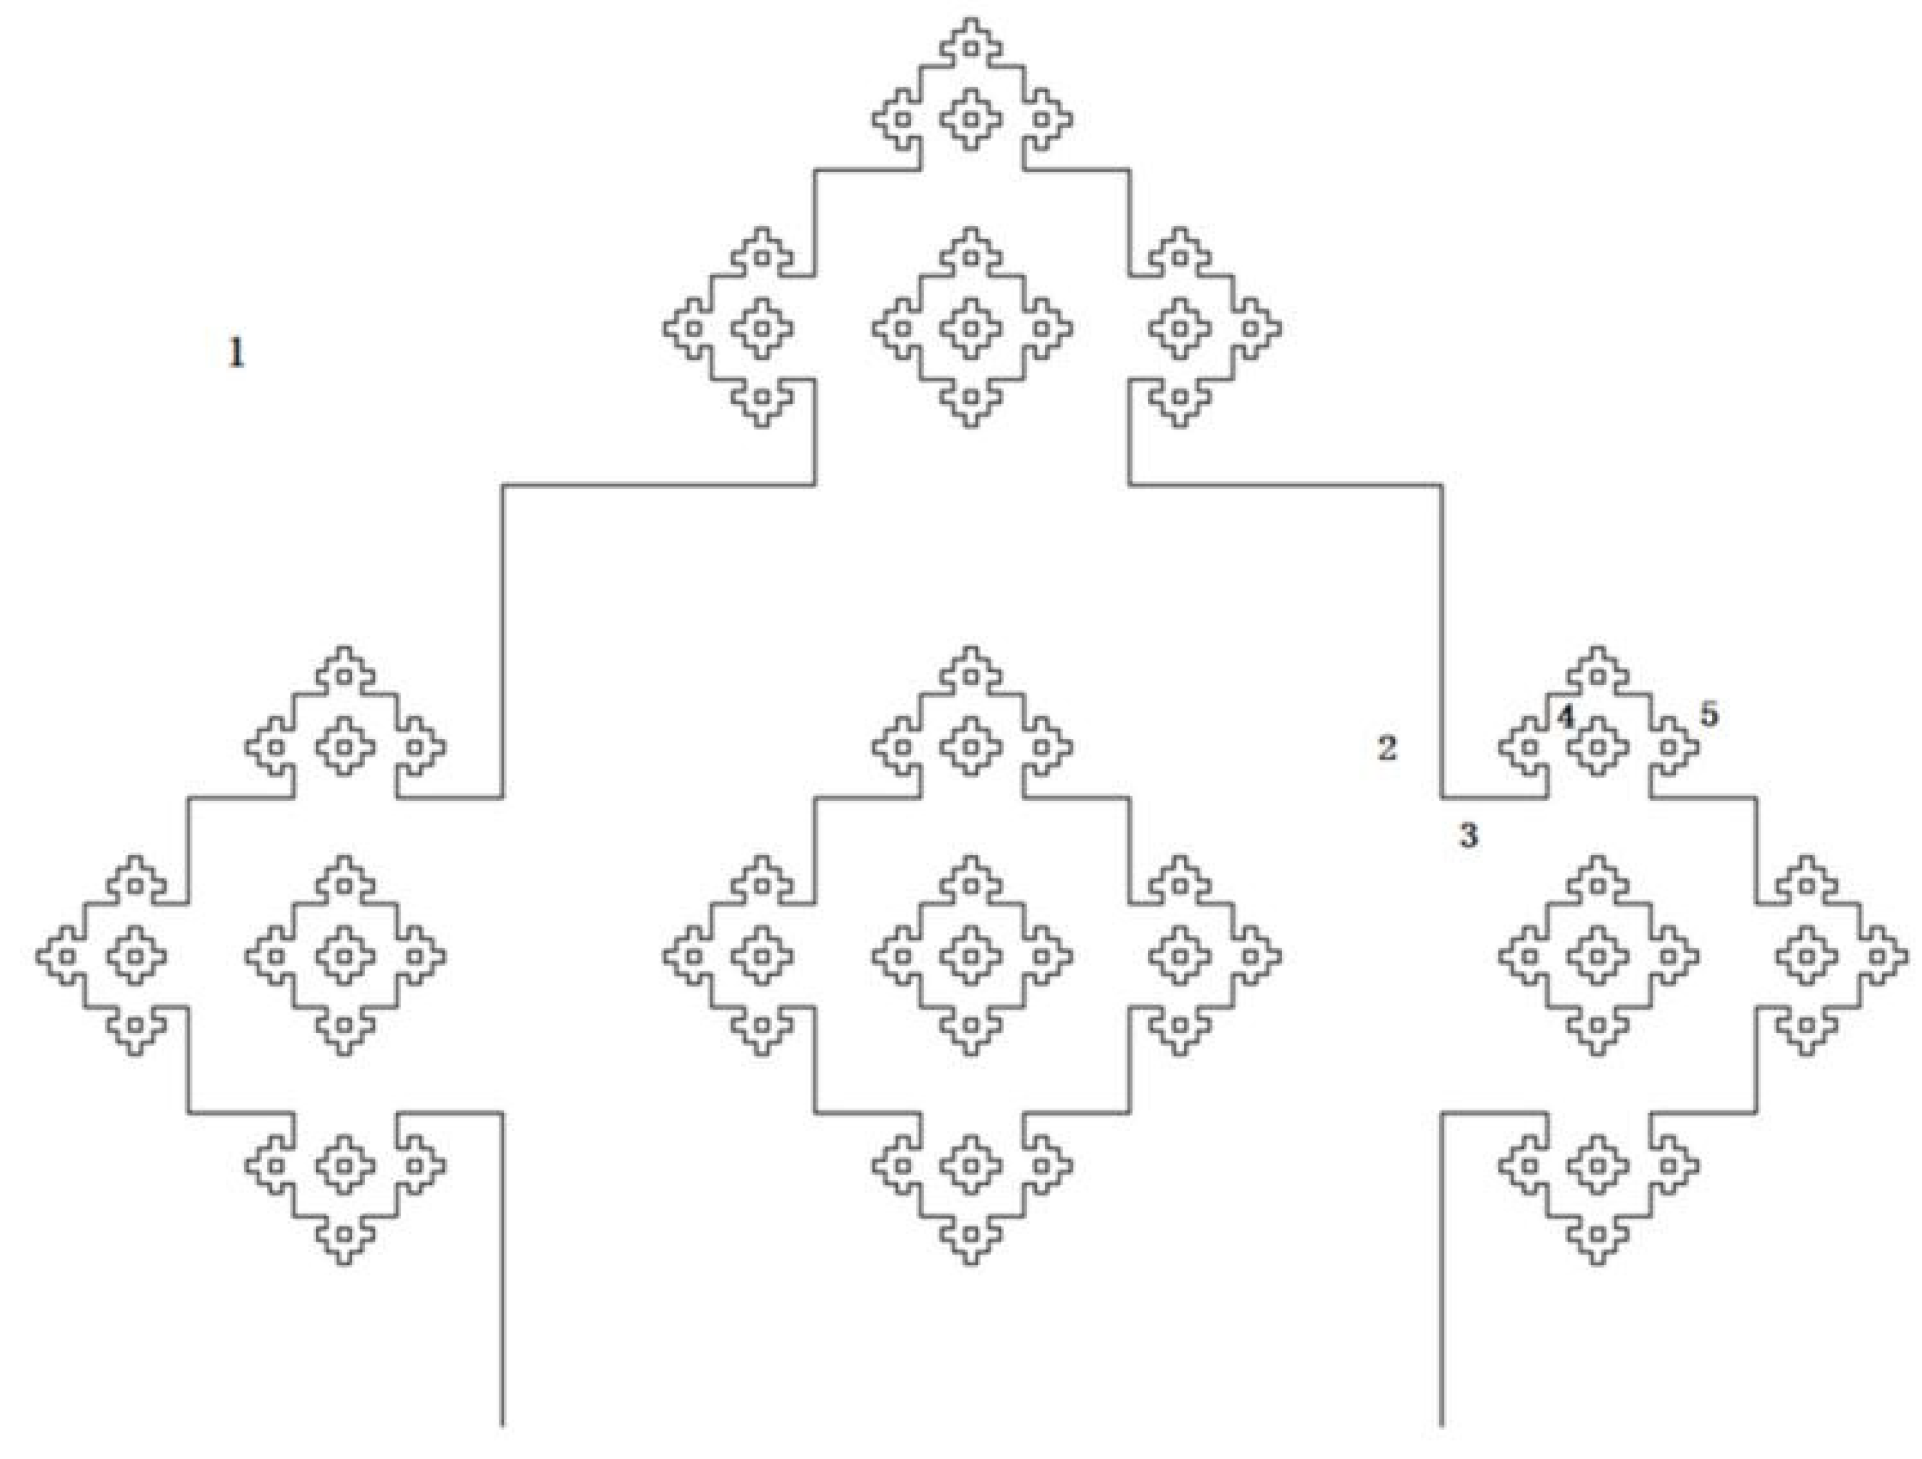
The pore fractal growth model is similar to the Sierpinski sponge (Figure 1), but its pore-forming mechanism is different from that of the Sierpinski sponge [34]. The Sierpinski sponge needs to remove the center cube inward each time so that the fractal dimension of the Sierpinski sponge at a certain step size is of constant value. For the pore fractal growth model, the following parameters are defined:
(1) Taking n as the reaction degree, it represents the degree of growth for holes in the carbon cube, as shown in Figure 2 (Figure 2 is the cross-section of the fractal structure of cube pores in the gasification process). Under the same reaction step size, the corresponding aperture is the same.
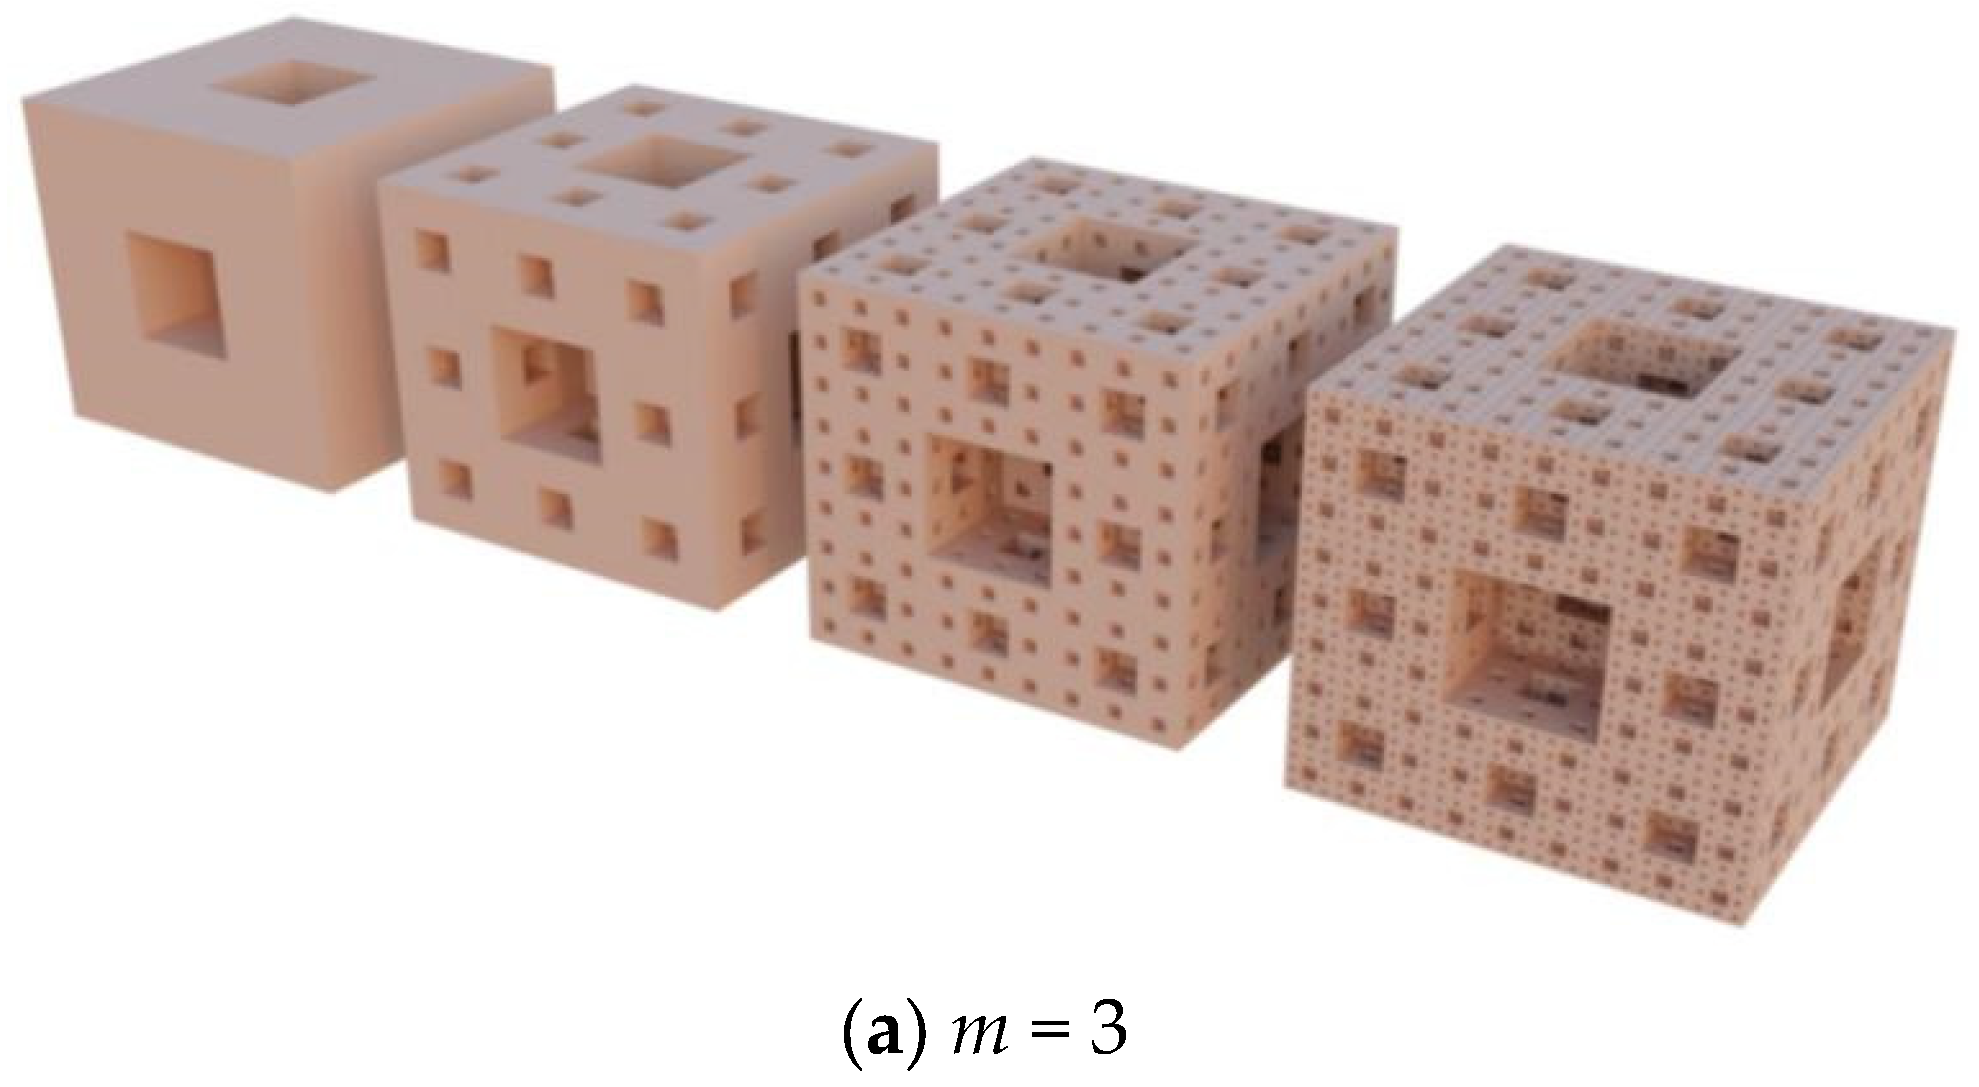
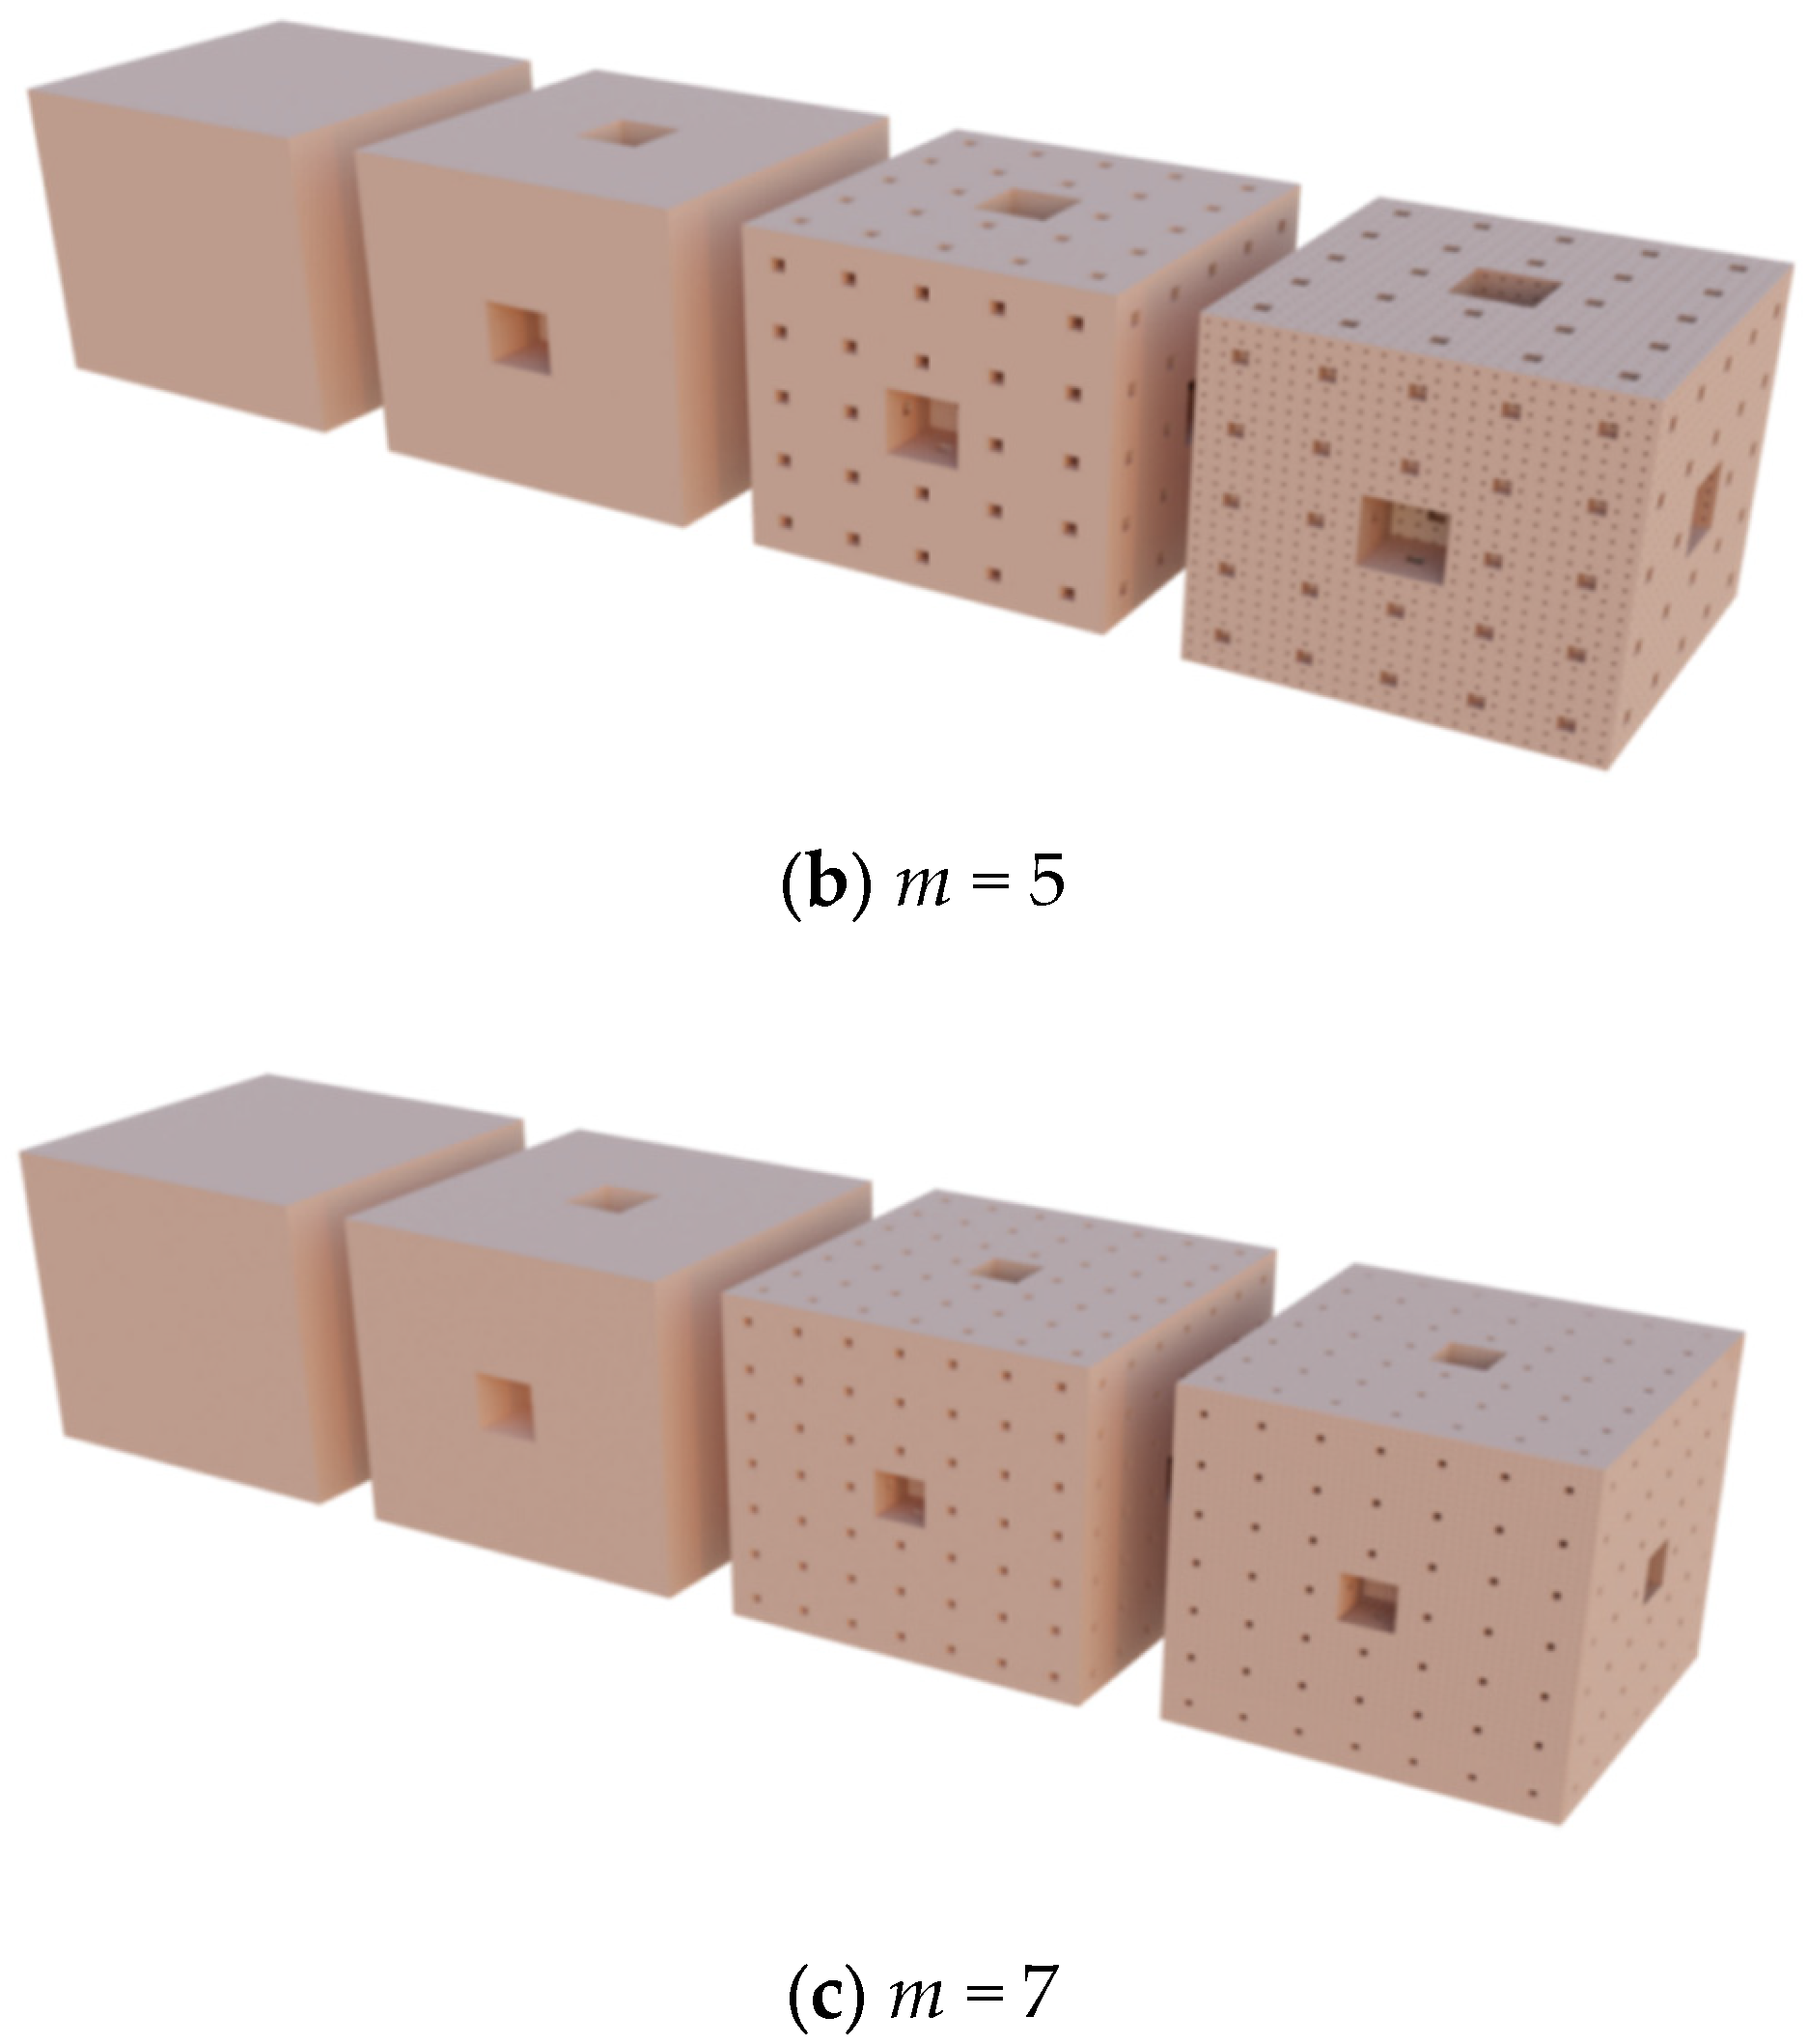
(2) The m is the reaction step length, that is, the ratio of the pore side length of adjacent steps. The side length of each cube is 1/m of the side length of the previous step, and the reaction step length indicates the degree of reaction for each aperture compared to the previous step.
The cubic pore structure formed in accordance with the above rules is shown in Figure 3, which is a schematic diagram of pore growth when the reaction step length m is 3, 5 and 7. The fractal growth model of porous carbon pores can be established based on the above assumptions.

1.2. Fractal Dimension, Surface Area and Pore Volume of Porous Carbon

According to pore fractal growth, in the gasification process of carbon, CO2 molecules react with carbon particles from the six sides of the cube. The side length of the carbon cube decreases according to (1/3)n, where n represents the reaction degree. With the increase in the reaction degree n, the pore size decreases gradually. The parameters of pore fractal growth can be seen in Table 1.
After the n-degree reaction, 13n−2 pores are created on each face. The number of pores N can be expressed in the following formula:
N = 6 × i = 2 n 13 i 2 × 3 3 × ( n i ) = 6 × [ 3 3 × ( n 2 ) + 13 × 3 3 × ( n 3 ) + 13 2 × 3 3 × ( n 4 ) + 13 n 2 × 3 0 ]
According to fractal theory [33], when the side length r is (1/3) n as the unit volume measure, according to the definition of fractal dimension, the fractal dimension D can be expressed as:
D = l n N l n ( 1 / r )
D = ln 6 × i = 2 n 13 i 2 × 3 3 × ( n i ) l n 3 n = ln 6 + ln [ 3 3 × ( n 2 ) + 13 × 3 3 × ( n 3 ) + 13 2 × 3 3 × ( n 4 ) + 13 n 2 × 3 0 ] ln 3 n = ln 6 + ln 27 ( n 2 ) × 27 14 [ 1 ( 13 27 ) n 2 ] ln 3 n
After the n-degree reaction, the new area ΔSn and the total area Sn generated by each degree of gasification are represented respectively as:
Δ S n 13 n 2 × 5 × 6 × ( 1 / 3 ) 2 × ( n 1 ) 13 n 3 × 5 × 6 × ( 1 / 3 ) 2 × ( n 1 ) S n = 5 × 6 × i = 2 n 13 i 1 × 1 / 3 2 i i = 2 n 13 i 2 × 1 / 3 2 i
84/81 + (13/9) × (13/3)n−3 − (39/81) × (13/3)n−4
The corresponding pore volume is:
V n = 6 × i = 2 n 13 i 2 × 3 3 × ( n i ) × ( 1 27 ) n - 1 = 6 14 × [ 1 ( 13 27 ) n 2 ]
In the general case where the reaction step length value is m, the following equation can be derived:
D = ln 6 + i = 2 n ( m 2 1 + 5 ) i 2 × m 3 × ( n i ) ln m n
S n = 30 m 2 + 30 m 3 m 2 + 4 m 2 + 4 m m 2 + 4 m n 3 1 30 m 4 30 m 2 + 4 m 5
V n = 6 m 3 m 2 4 × [ 1 ( m 2 + 4 m 3 ) n 2 ]
According to the theory of pore fractal growth, the process of carbon gasification can be regarded as a process of increasing reaction degree n, accompanied by an increase in pore-specific surface area and pore volume. In order to verify this law, apple charcoal, coconut shell charcoal and Tianhuili semi-coke were selected as raw materials to prepare porous carbon with different degrees of gasification under different CO2 gasification times, and the change law of reaction degree and the reaction step length with the gasification process was studied.

2. Experiment

2.1. Preparation of Porous Carbon with Different Degrees of Gasification

Tianhuili semi-coke from Xinjiang province, Shaanxi Dali apple charcoal and Hainan coconut shell charcoal were the raw materials used in this experiment, and the industrial analysis of raw materials is shown in Table 2. All three semi-cokes had low ash content. The three raw materials were crushed by a jaw crusher and then screened to obtain 200 mesh particle samples.
The Tianhuili semi-coke, coconut shell charcoal and apple charcoal particle samples were put into the porcelain boat (the loading capacity was 2 g) and then placed in a tubular heating furnace. The heating rate was set to 10 °C/min and the samples were charred at 600 °C for 60 min to eliminate the influence of the volatiles of carbon on the pores. The heating and carbonization process was protected by nitrogen. After carbonization was completed, the carbonization furnace continued to heat up to 850 °C, stabilized for 3 min and started to inject CO2 gas for the gasification reaction. The gasification time is shown in Table 3. Porous carbon with different degrees of gasification was prepared by different gasification times for each sample.

2.2. Thermogravimetric Experiment

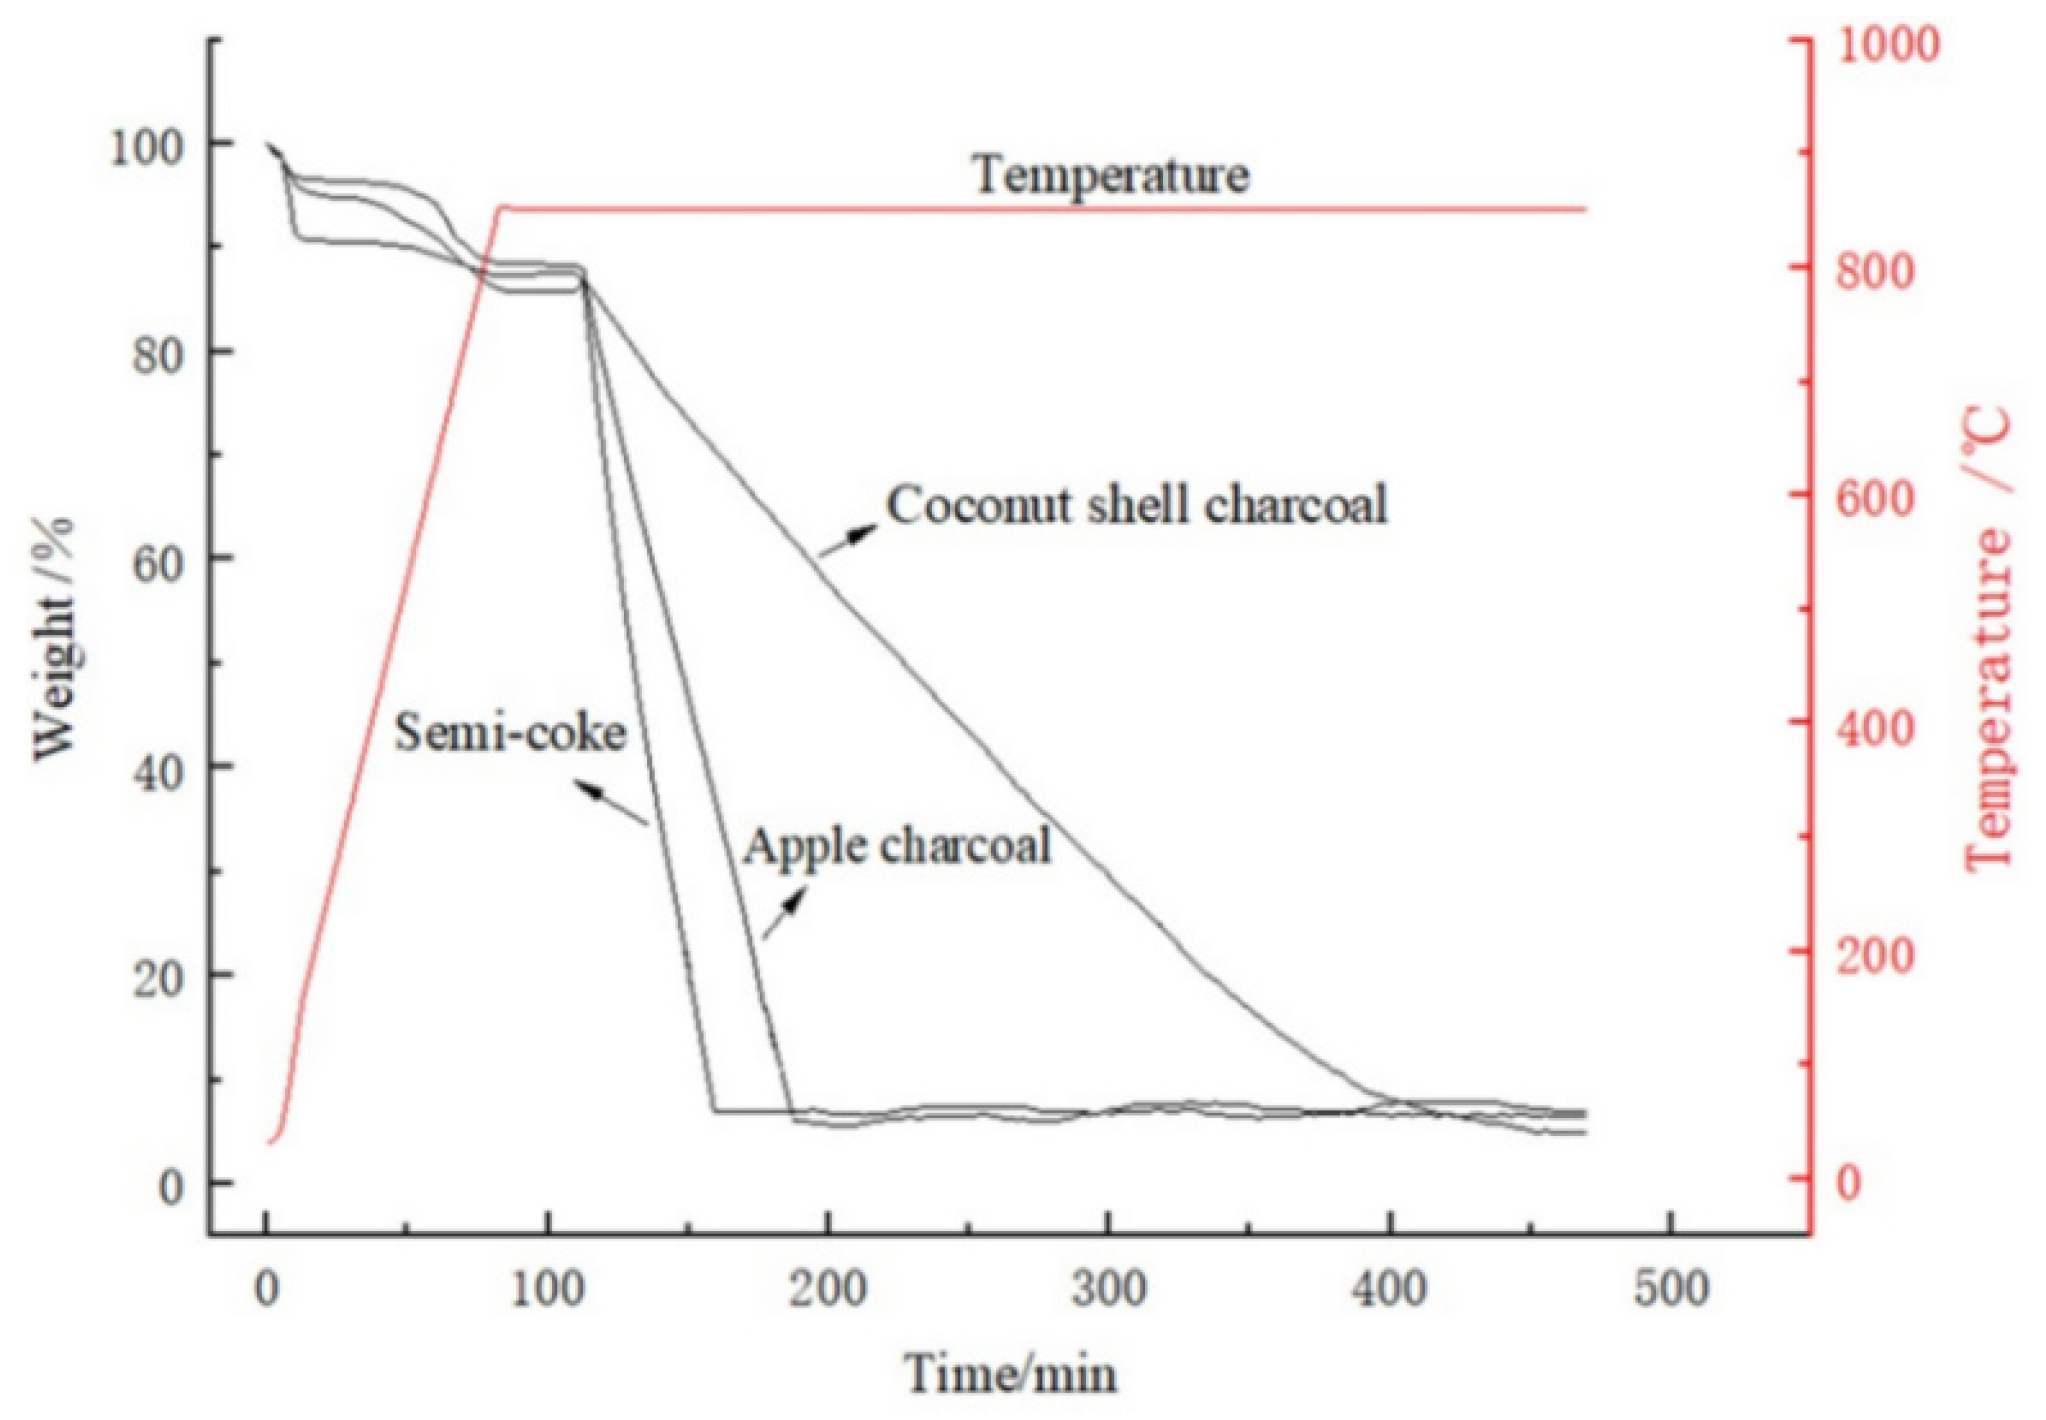
In order to further study the gasification kinetics of the pore fractal growth model, thermogravimetric tests were performed on the three samples. A NETZSCH STA 449 F3 German high-temperature micro-heat scale was employed in the experiment. The sample size was 15 mg ± 0.5 mg and the protective gas was high purity nitrogen. After the sample was heated to 850 °C at a rate of 10 °C/min, the protective gas was converted to CO2. The experiment was conducted in a high-purity CO2 atmosphere with a reaction gas flow rate of 40 mL/min until there was no noticeable change in sample weight. A computer automatically sampled and mapped the entire process. Figure 4 displays the weight loss trajectories of the three samples.
The weight loss procedure is divided into three stages: rising temperature, environmental stabilization and oxidation. Approximately 30 min after the DCFC temperature reaches 850 °C, the environment changes to CO2. The Boudouard reaction is indicated by the abrupt reduction in the weight curve. The greater the slope, the more active the carbon sample in the CO2 atmosphere.
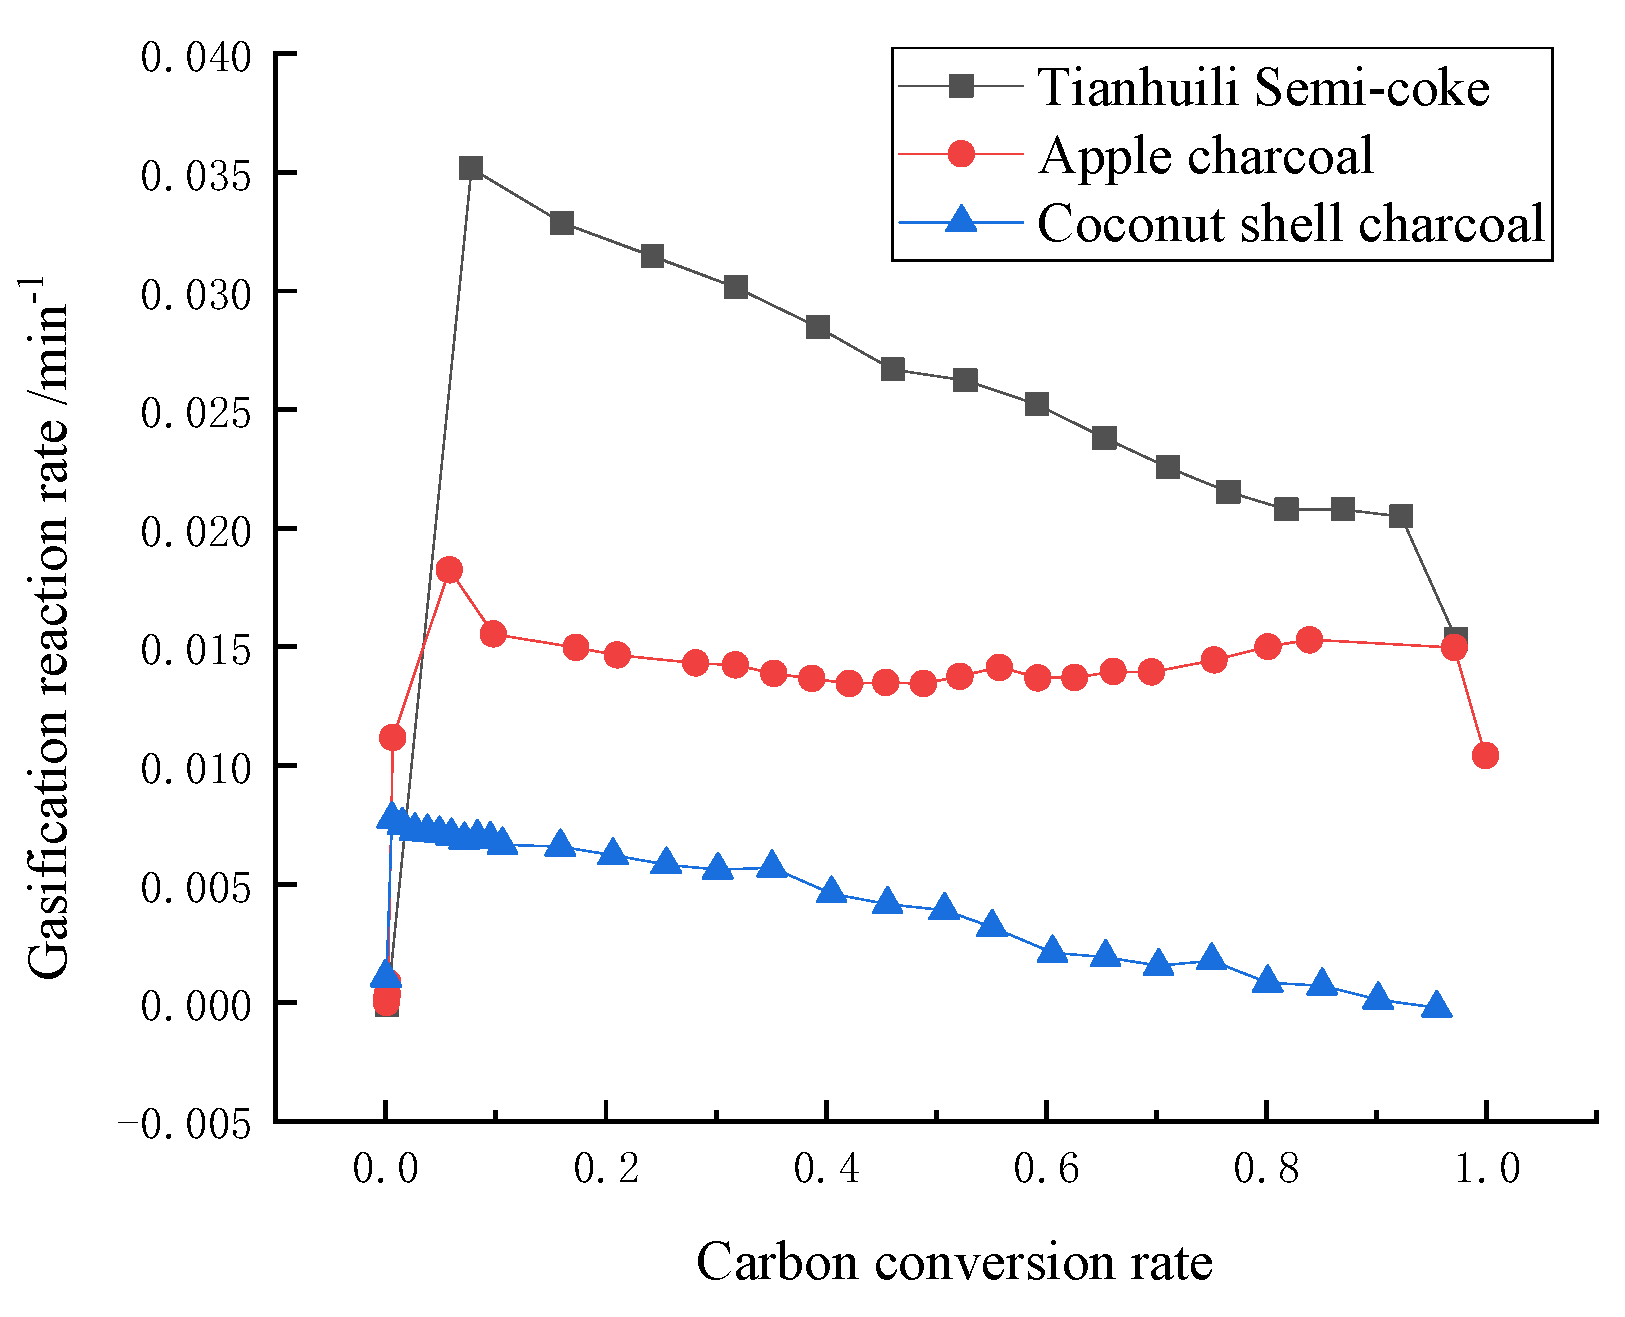
Formula (5) was used to compute the carbon conversion rate of the three carbon samples gasified with CO2 at 850 °C, and the differential curve of weight to time was obtained by using the TG curve (Figure 4), from which the carbon conversion rate and reaction rate curve can be drawn. As illustrated in Figure 5, as the CO2 gasification reaction of the semi-coke progresses, the micropores of carbon collapse, resulting in a decrease in the specific surface area of the sample and hence a gradual reduction in the gasification rate. It can be seen that in the reaction rates of the CO2 gasification of the three samples, semi-coke > apple charcoal > coconut shell charcoal. This can be represented as:
x = w 0 w / w 0 A × 100 %
where w0 is the initial value of the carbon sample, w is the sample mass at a particular time and A is the mass corresponding to the sample’s constant weight, namely the sample’s ash content.

3. Results and Discussion

The porous carbon samples were analyzed by the BSD-PM2 specific surface area and micropore analyzer. As shown in Figure 4, the specific surface area and pore volume of apple wood and coconut shell carbon increased with the increase in gasification time, indicating that the pores were growing continuously with the increase in the gasification time point. For Tianhuili semi-coke, both pore-specific surface area and pore volume reached the maximum value at 120 min, and both became smaller after 180 min of gasification, as shown in Figure 1. After 240 min, all the carbon had been vaporized and converted into ash.
The pore distribution data measured by the surface area analyzer showed that the maximum pore size was 195.6 nm. According to the self-similarity of the pore fractal, the specific surface area of porous carbon can be expressed as [35]:
S S S A = 0.714 2 / 3 × S n / 195.6 2 × 10 4
Semi-coke has a density of 1.4 g/cm3; the relation between conversion rate x and pore volume V is as follows:
x = V n = V × 1.4
Based on Equations (7)–(12), fractal dimension D, reaction degree n, reaction step length m and Sn can be obtained for porous carbon samples with different gasification degrees. As shown in Table 4, it can be seen that the fractal dimension gradually increases with the growth of pores, and the reaction degree n gradually increases with the growth of pores, which is consistent with the hypothesis. The fractal growth model of semi-coke during gasification was further verified.
In the gasification process of semi-coke, within the control range of the gasification kinetic rate, the gasification reaction rate of the semi-coke can be expressed as the change in carbon conversion rate x over time. The reaction rate model derived by Dutta et al. and based on the experimental results is as follows [25]:
d x d t = k C i n S 1 x = K S 1 x
x is the conversion rate of carbon; k is the proportional coefficient; C i n is the concentration of gas involved in gasification (since the concentration of CO2 gas remains constant in the experiment, C i n and k can be incorporated into the proportionality constant K) and S is defined as the pore surface area. Table 5 can be obtained from Equations (11) and Table 4.

4. Establishment of Pore Fractal Growth Kinetics

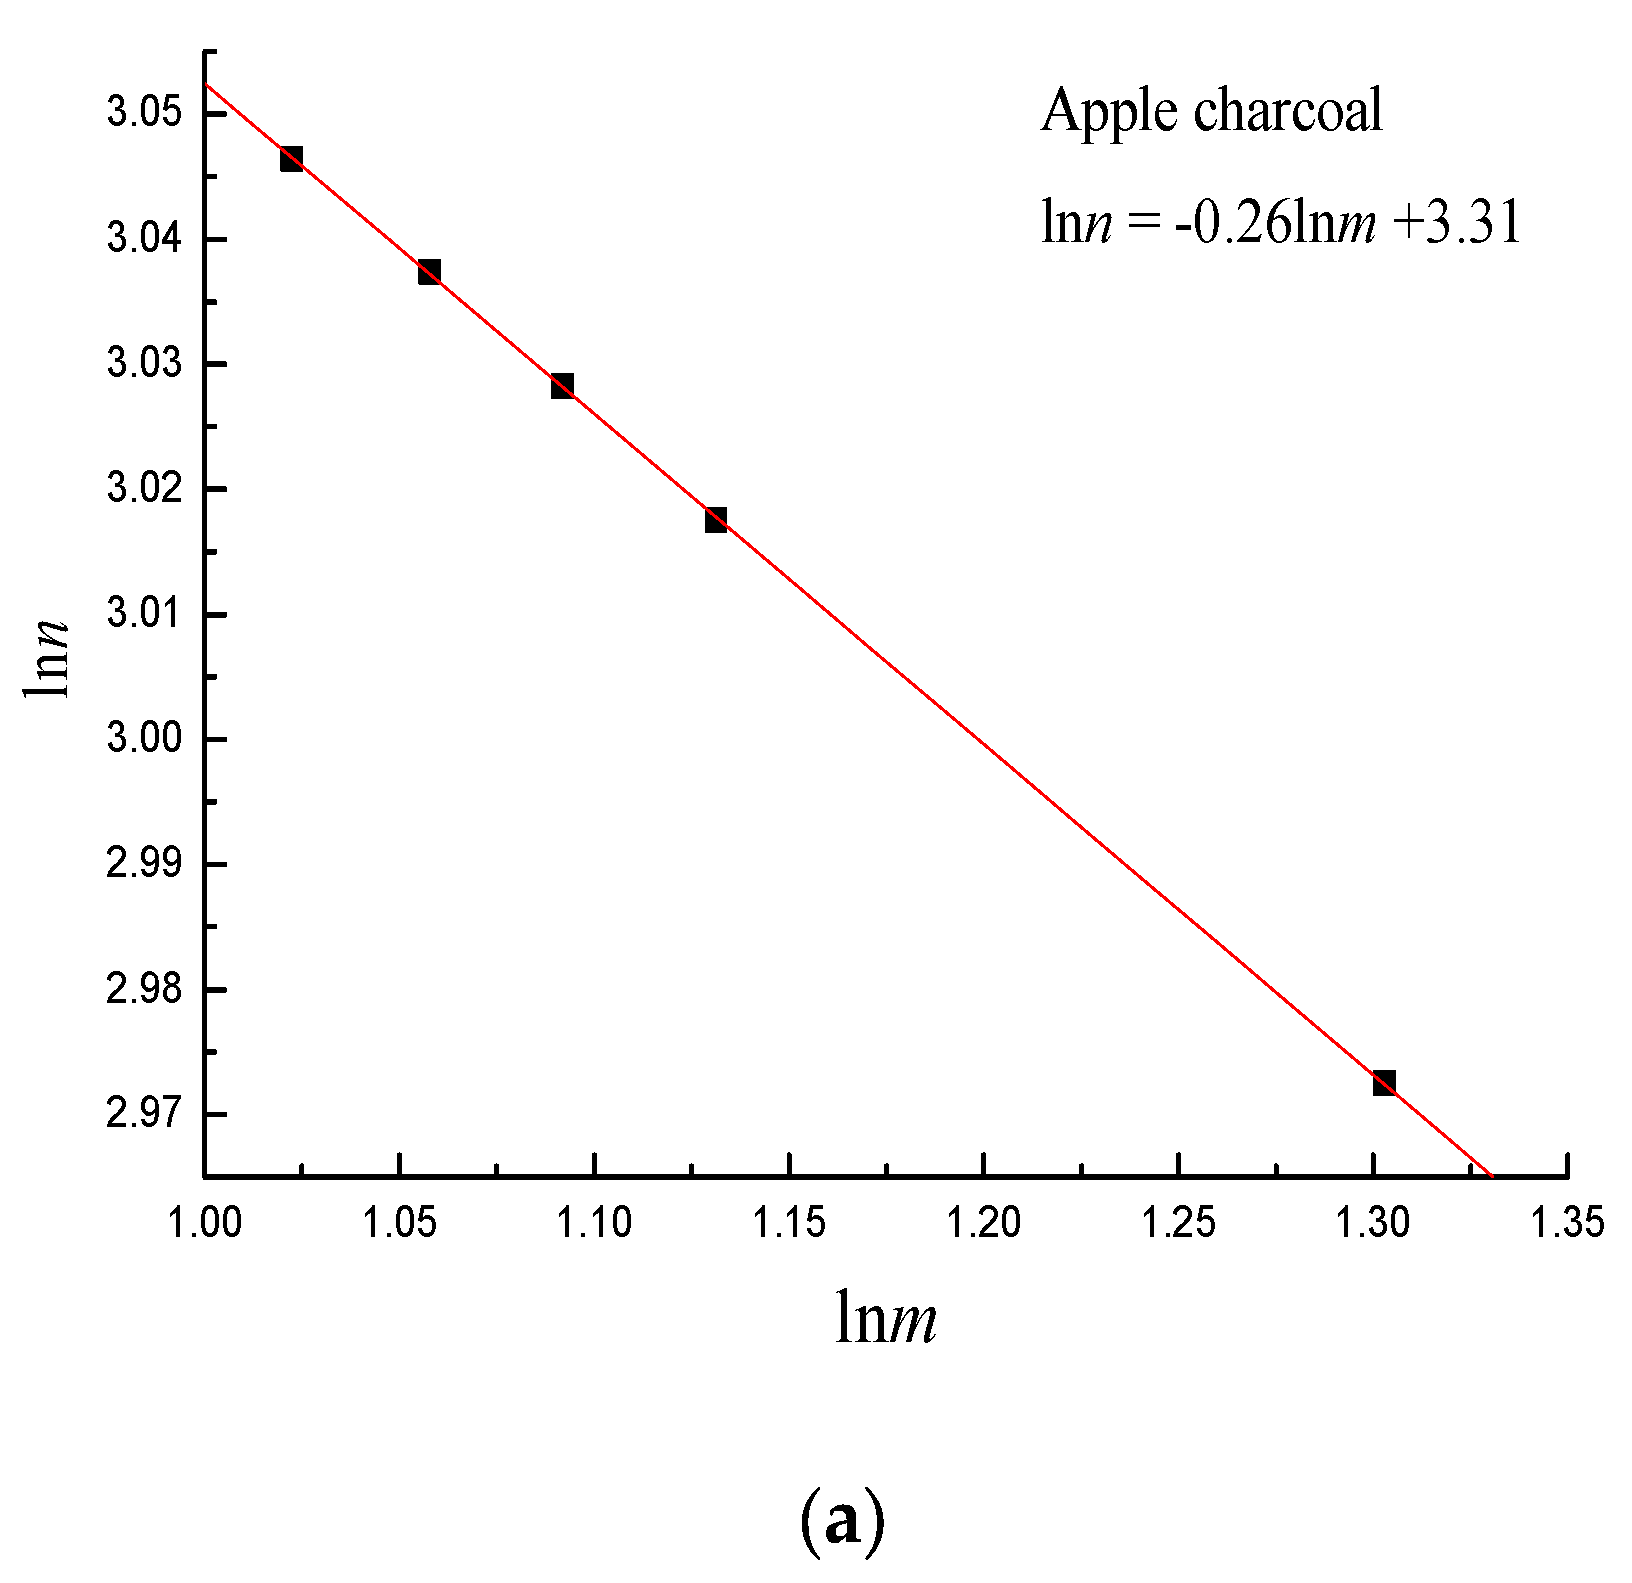
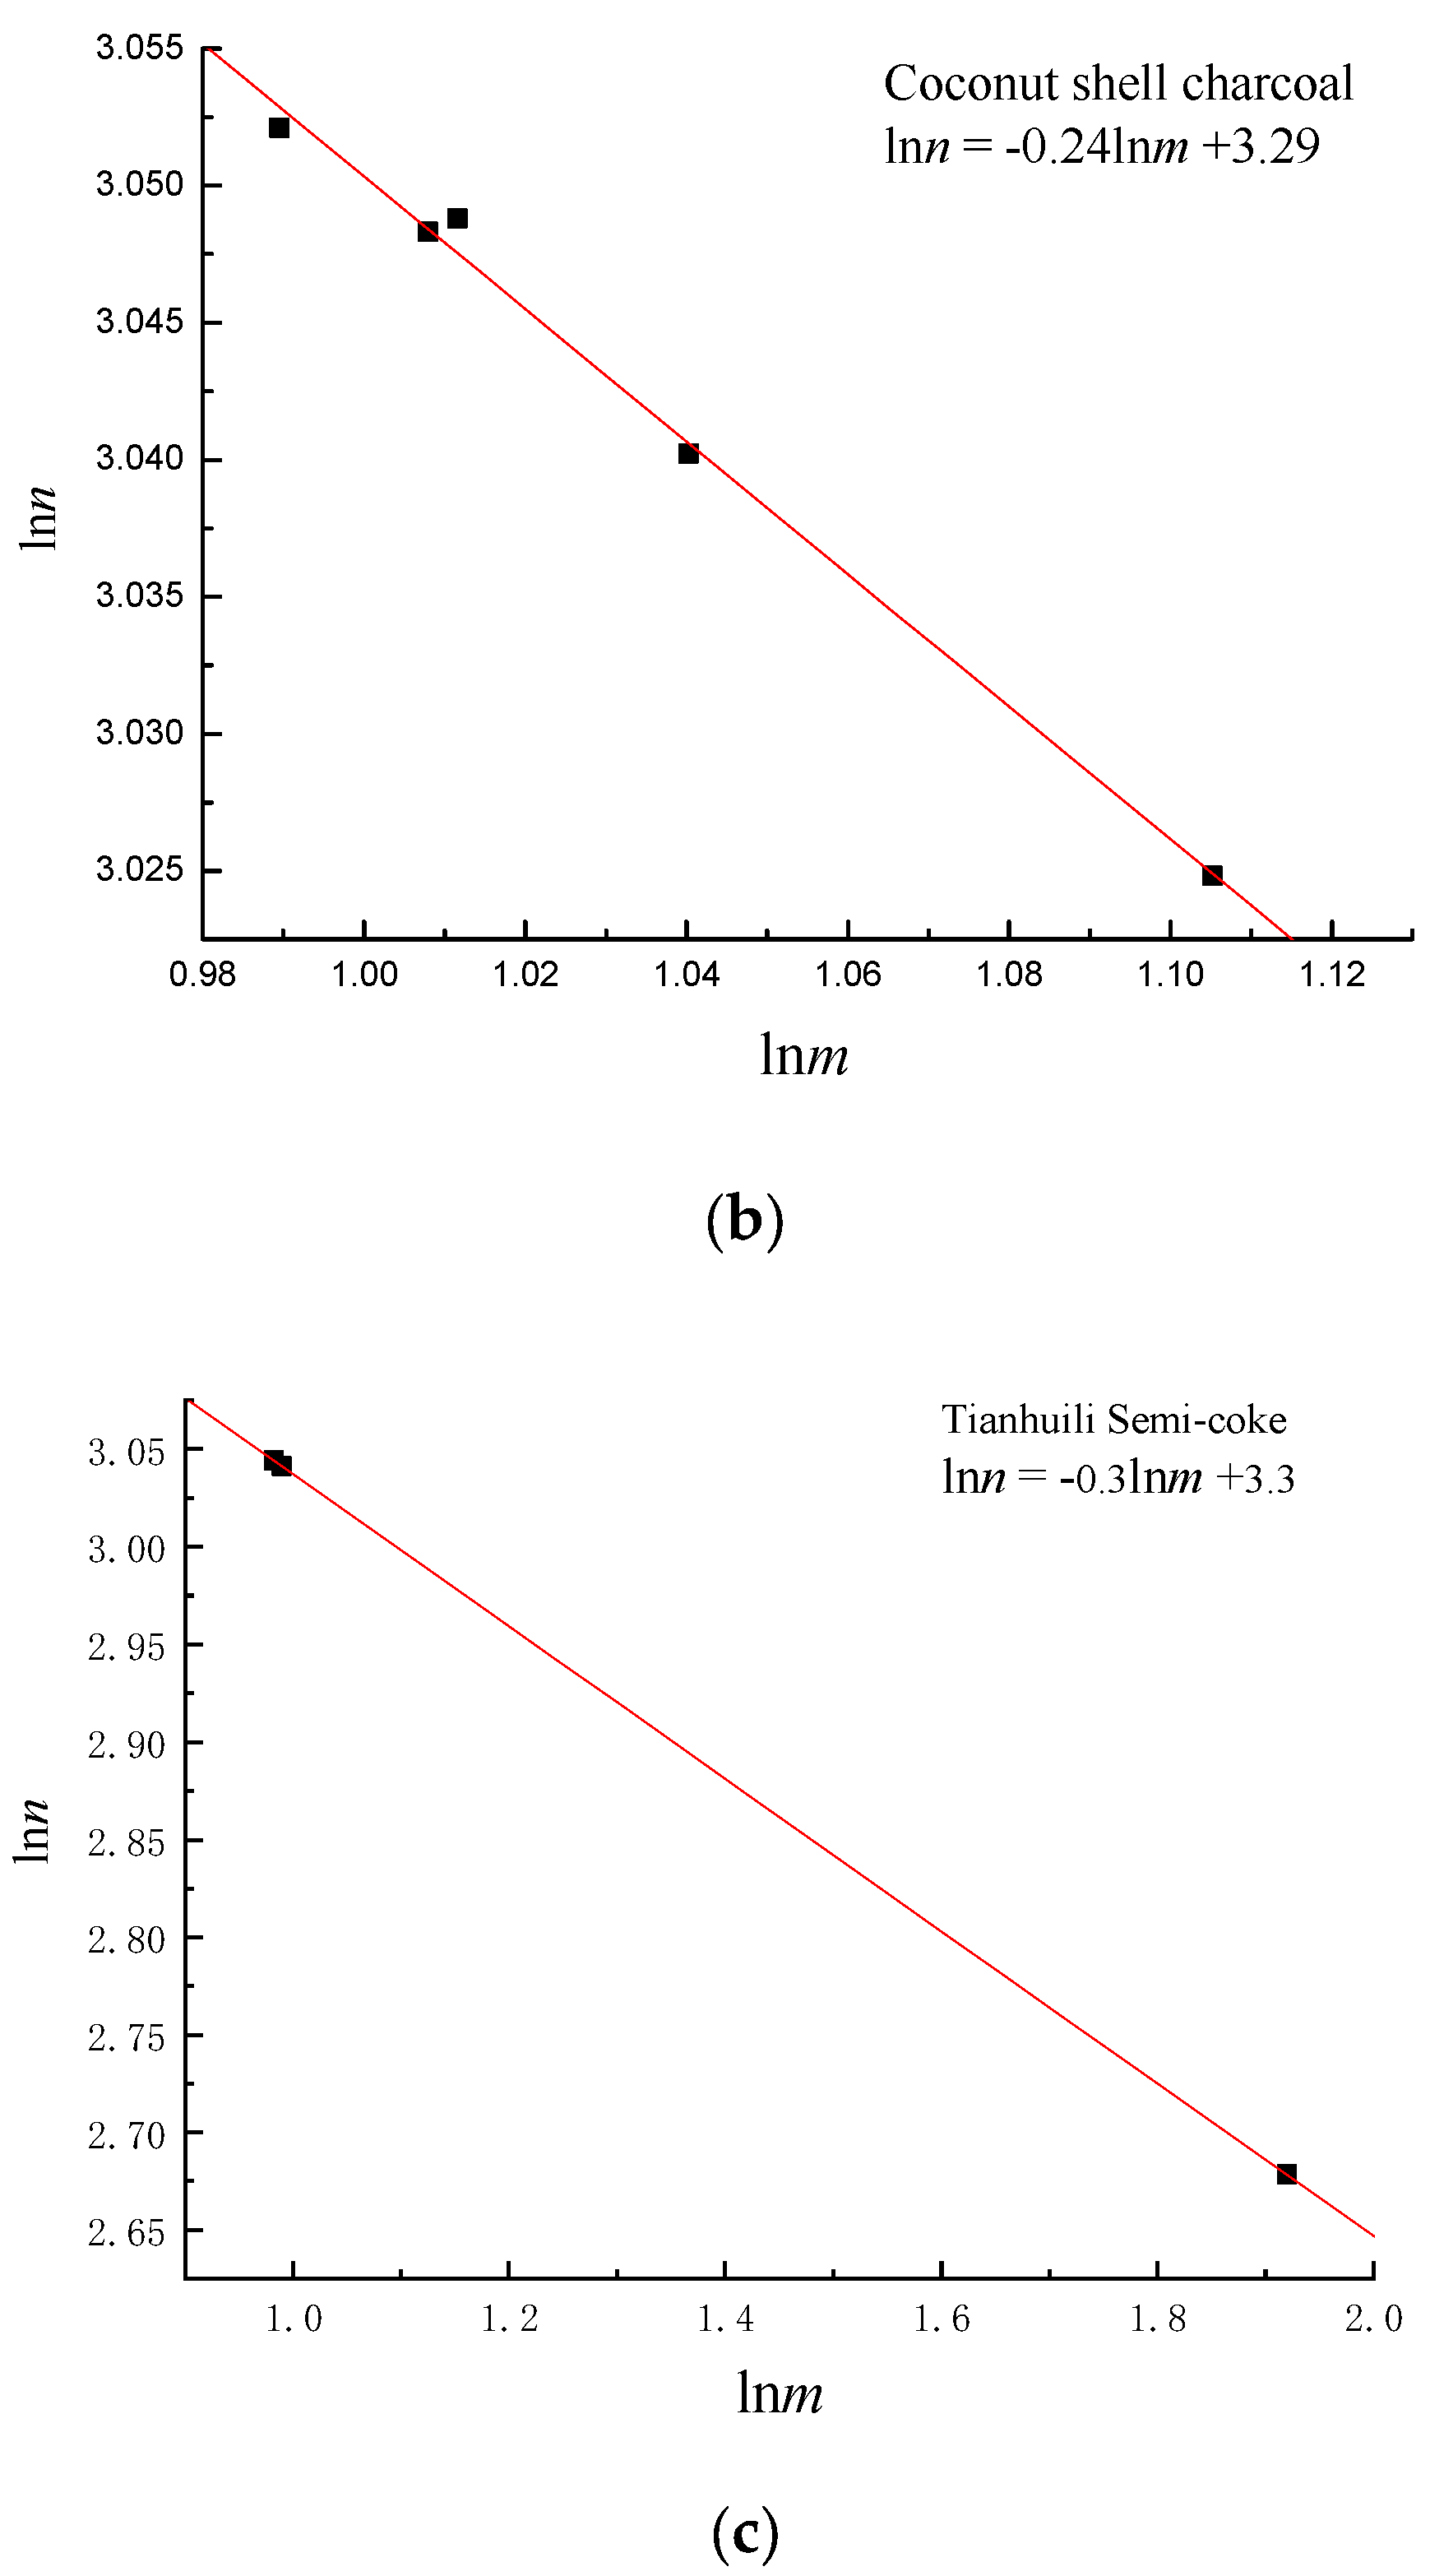
In order to explore the change rule of m and n, the logarithm of m and n was taken, and it was found that lnm and lnn are strongly linearly correlated, as shown in Figure 6.
For apple charcoal,
ln n = 0.26 ln m + 3.31
For coconut shell charcoal,
ln n = 0.24 ln m + 3.29
For Tianhuili semi-coke,
ln n = 0.31 ln m + 3.3
According to Equations (14)–(16), the order of absolute slope values of the equations is as follows: Tianhuili semi-coke > apple charcoal > coconut shell charcoal. The greater the absolute slope value, the greater the growth rate of reaction degree n relative to the reaction step length m, and the higher the gasification rate, which is consistent with the results of the three semi-coke gasification reaction rates.
Within the above three formulas and Equations (8), (9), (11) and (12), the complete curve of the dx/dt-x relationship of apple charcoal, coconut shell charcoal and Tianhuili semi-coke is obtained by taking the n value, which can be taken from small to large (in this experiment, the reaction degree n value is between 15 and 22). In Formula (12), the K values of apple charcoal, coconut shell charcoal and Tianhuili semi-coke were 4.88 × 10⁻⁵, 1.63 × 10⁻⁴ and 1.72 × 10⁻⁴, respectively.
The random pore model (RPM) takes into account the overlapping of pore structure and the reduction in the area available for the reaction, along with the progress of the reaction and the carbon burn-off [36]. Under chemical control, the reaction rate is expressed as:
r = d x d t = k RPM ( 1 x ) 1 ψ ln ( 1 x )
where kRPM is the reaction rate constant and ψ is the structure constant.
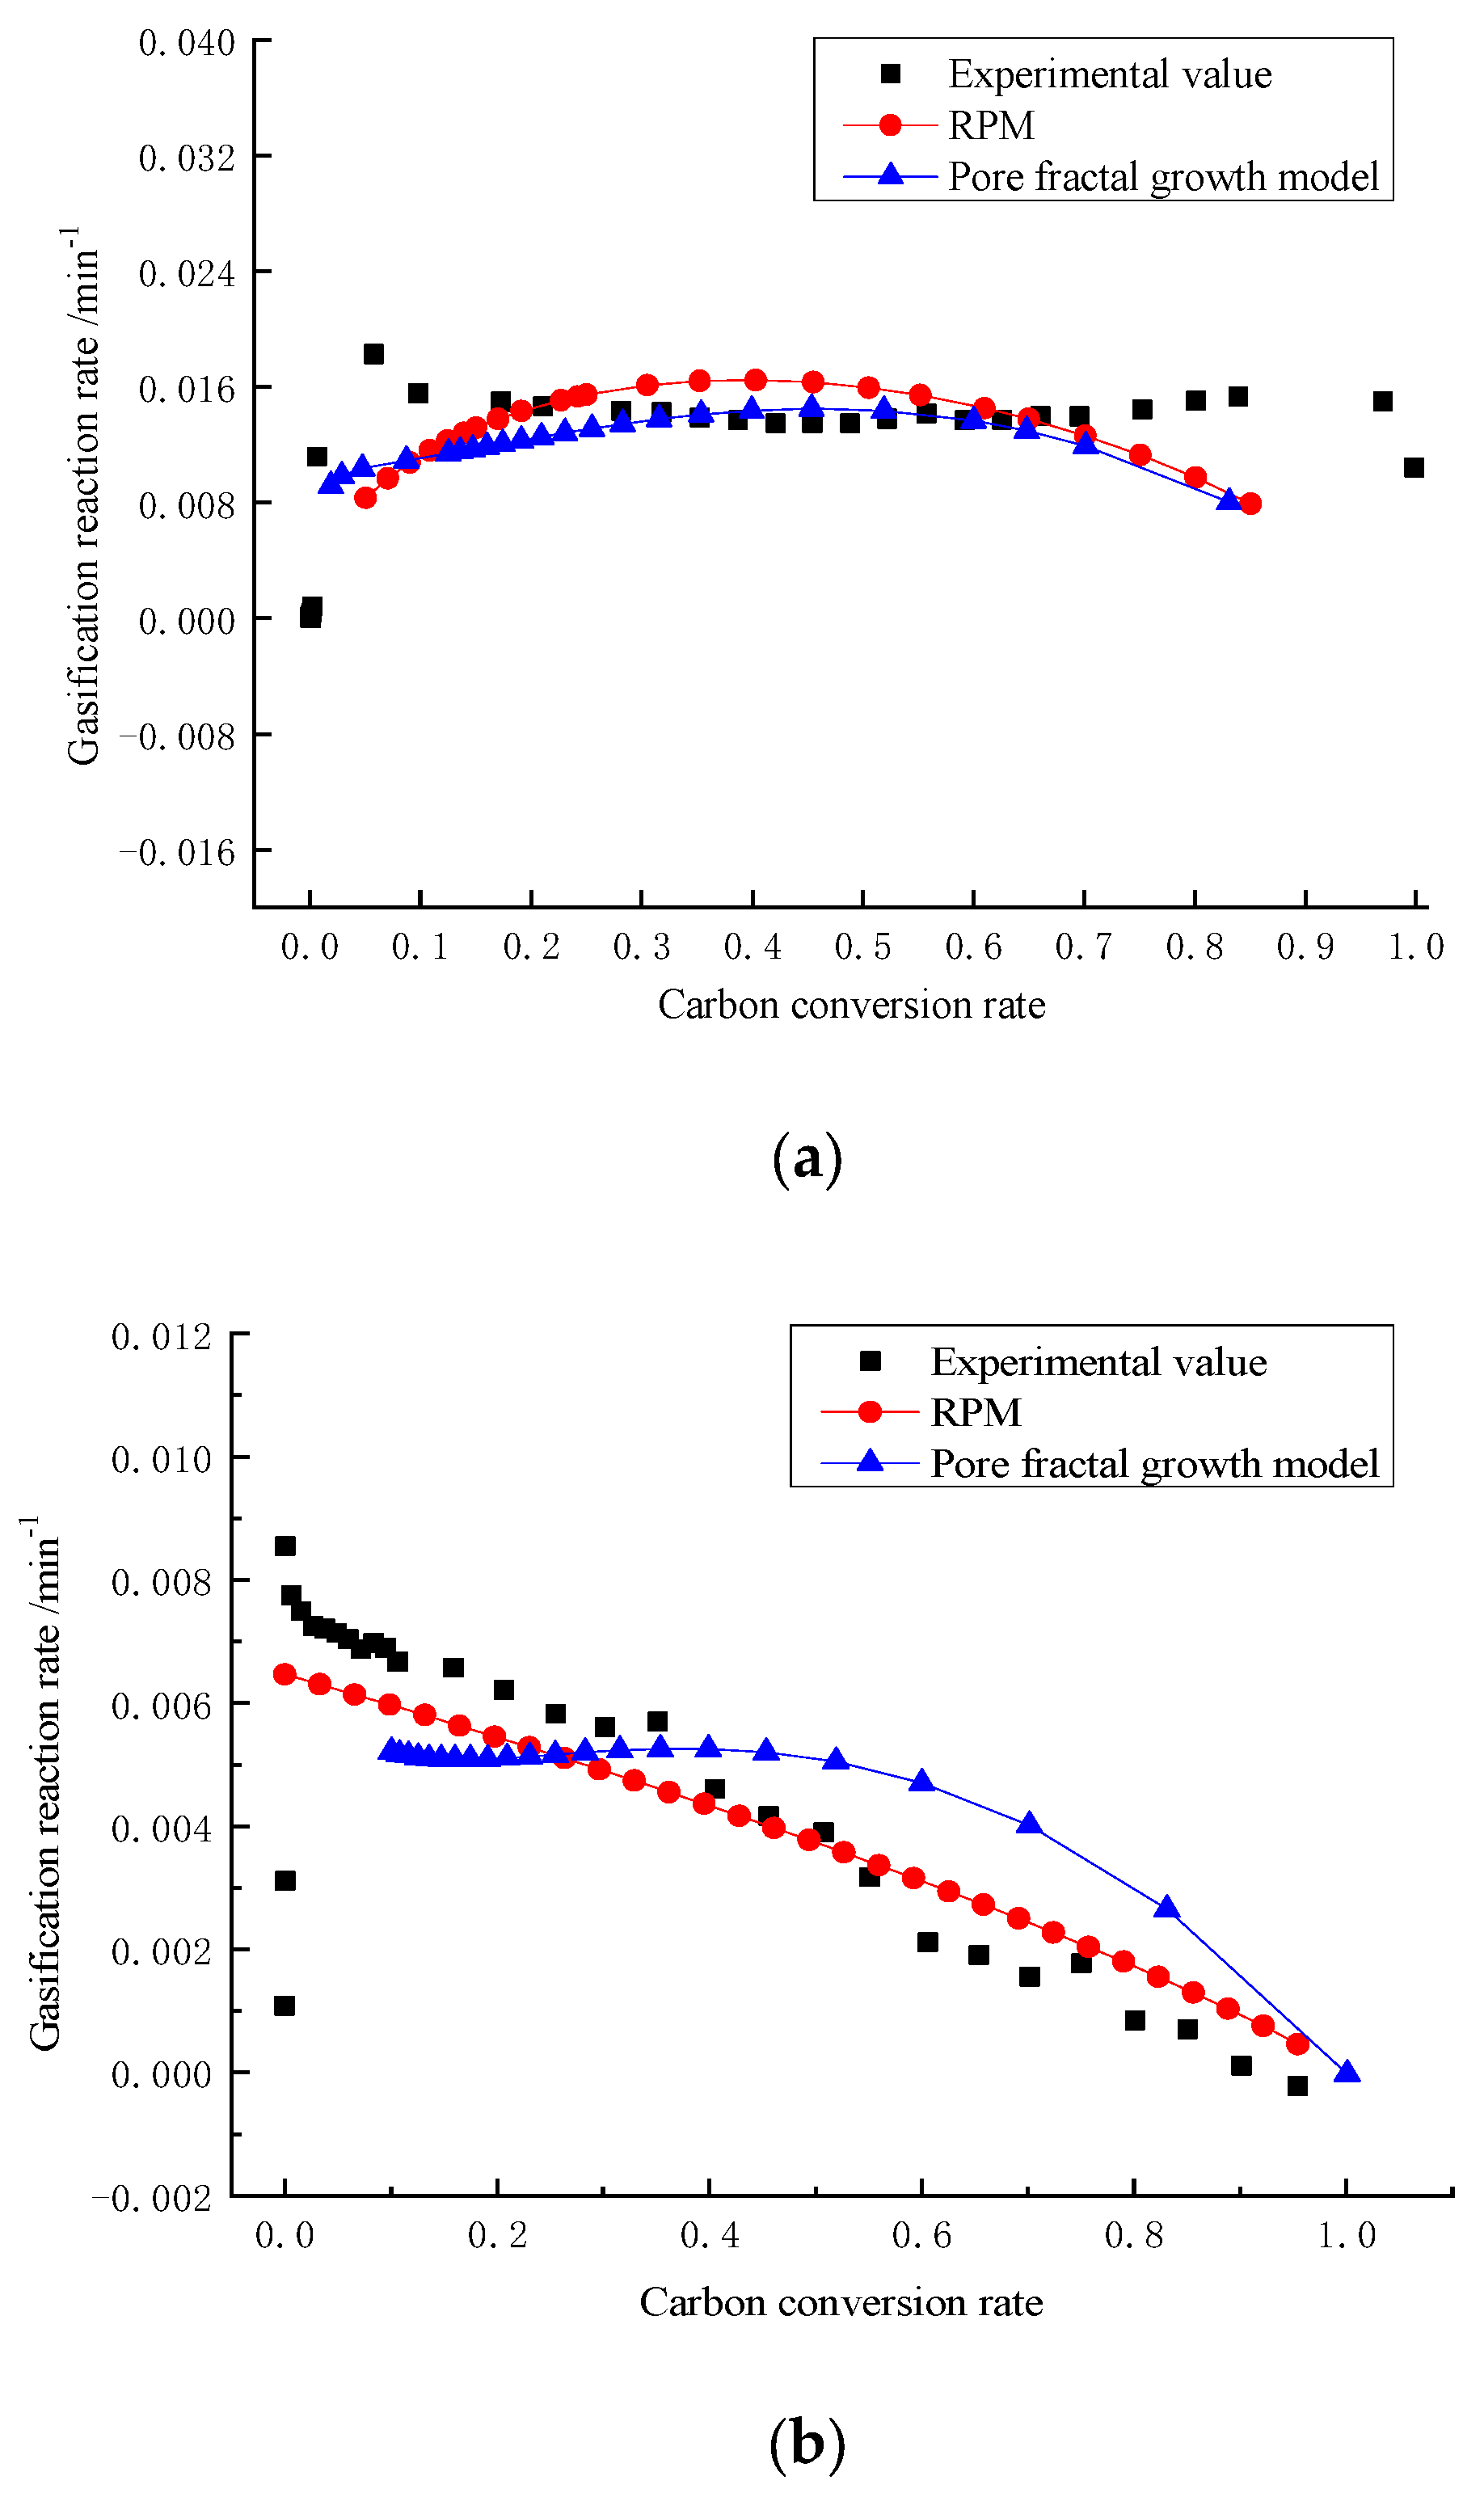
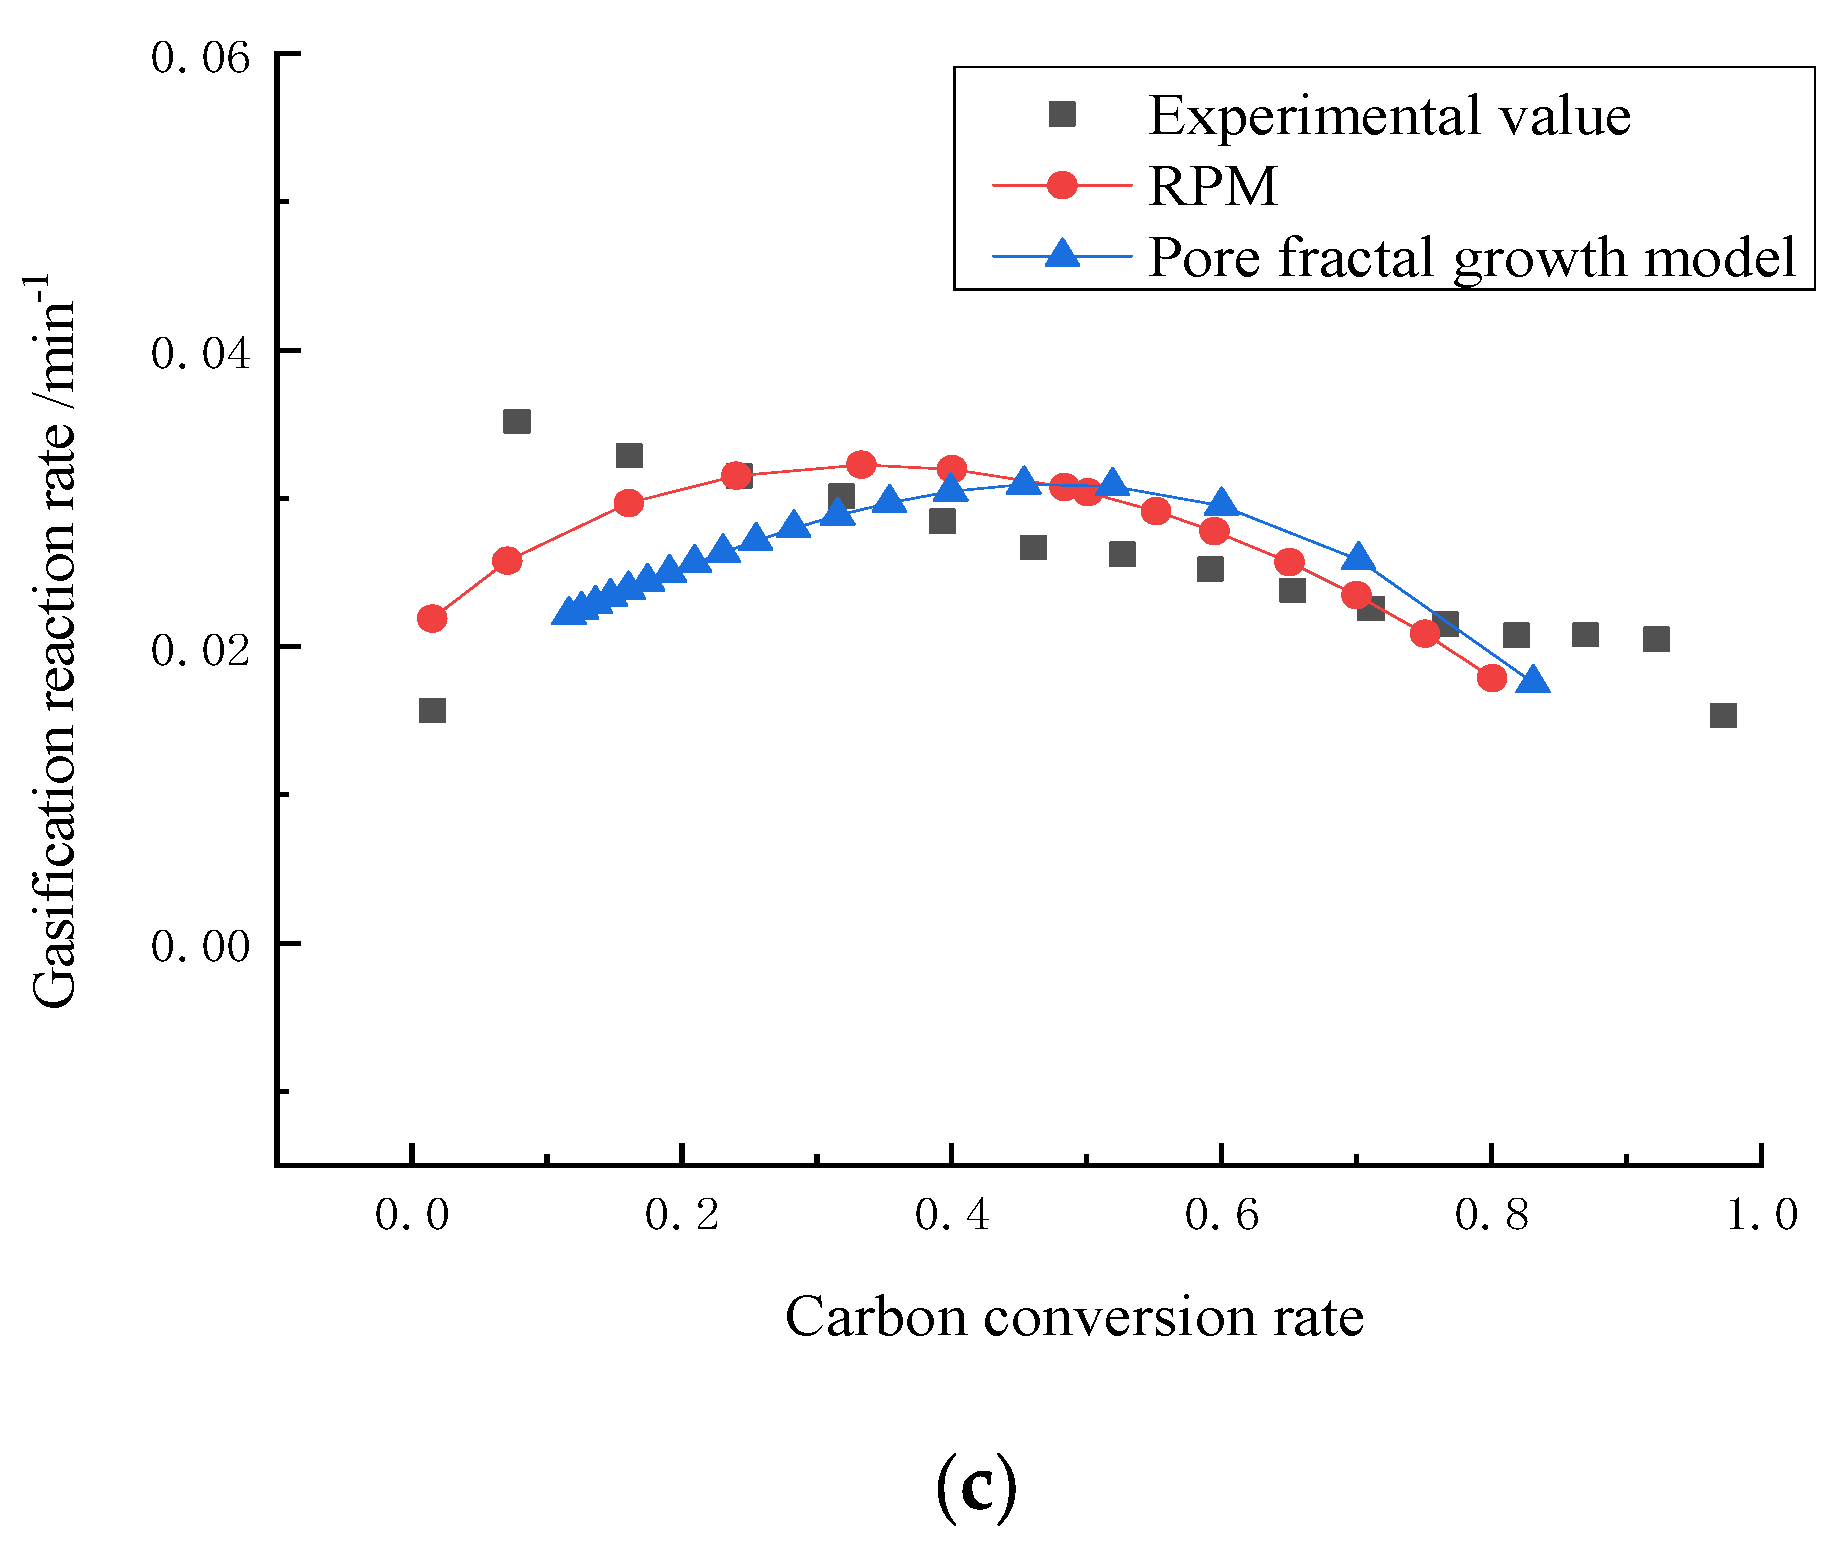
The maximum value that appears on the reactivity curve indicates a change in the structure of the carbon, which is thought to be caused by the counteraction of the two effects of pore development and the gradual destruction where they intersect [37,38,39]; the RPM does not consider the formation of any new pores during the gasification reaction [40]. According to Equation (15), the gasification rate curve (Figure 5) was nonlinear fitted to obtain the simulation results based on the random pore model. By comparing the pore fractal growth model with the random pore model, as shown in Figure 7, it can be seen that the pore fractal growth model also presents a trend of the gasification reaction rate increasing first and then decreasing, and it has a good agreement with the random pore model. This indicates the rationality of the pore fractal growth model in the carbon gasification process.
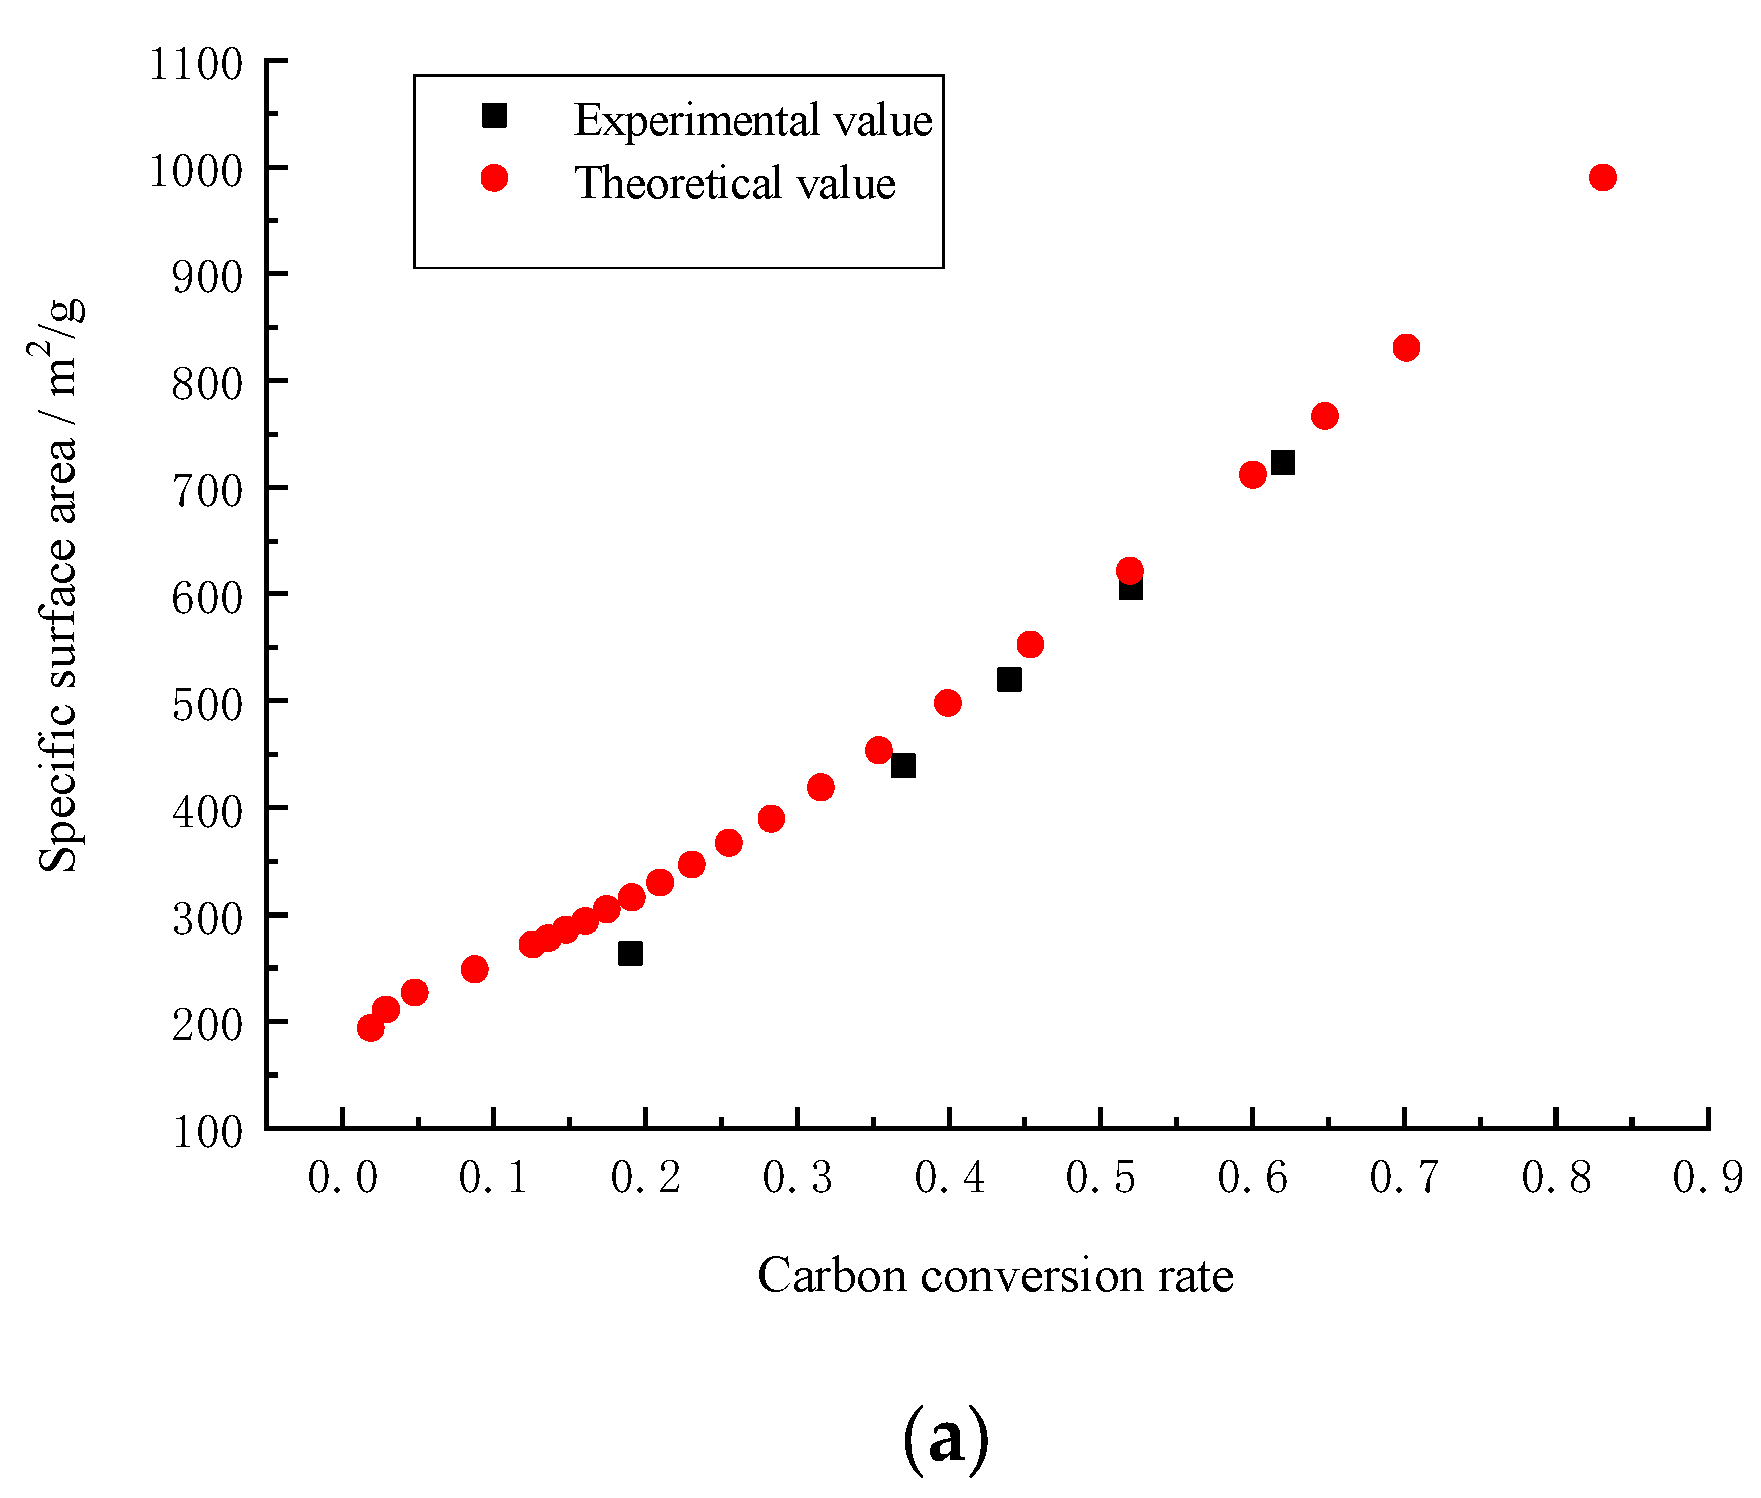
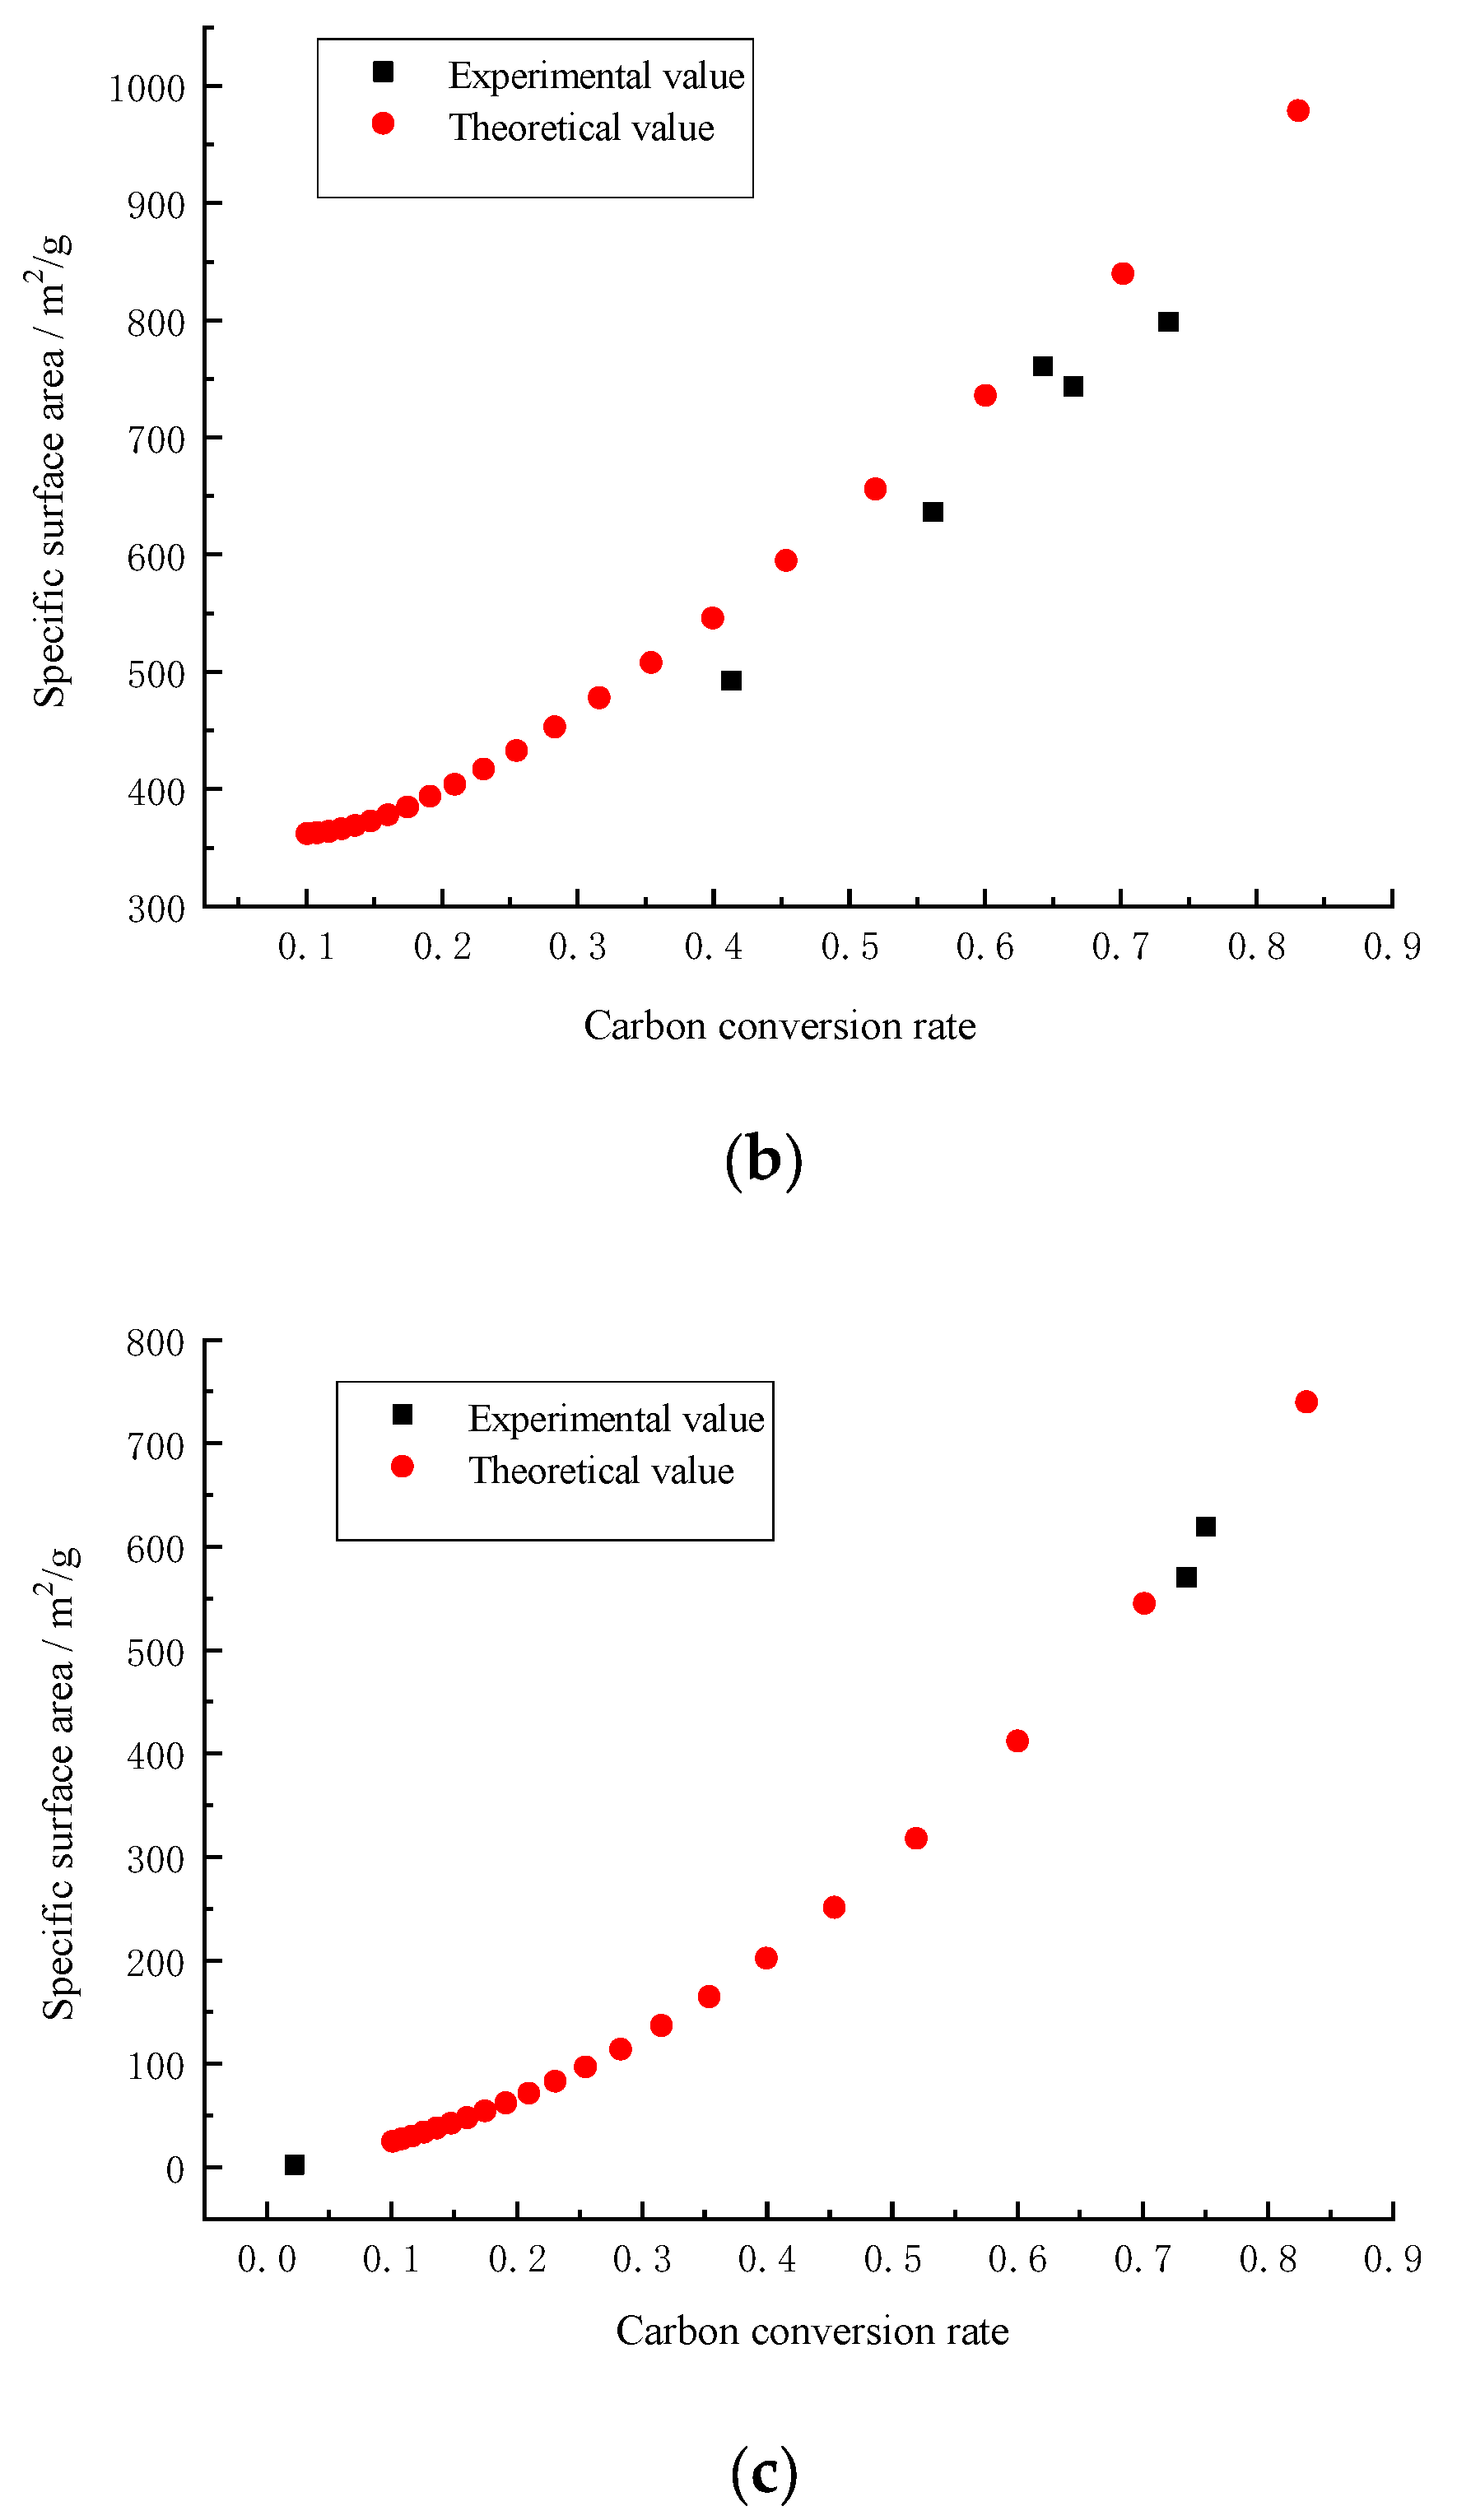
The theoretical relation curve between the carbon conversion rate x and the specific surface area SBET under the pore fractal model can be obtained by connecting Equations (8), (9) and (11). By comparing these equations with the experimental data in Table 4, the simulated SBET-x curve based on the fractal growth model and the experimental data can be determined, as shown in Figure 8. It can be seen that the simulated data are in good agreement with the experimental data, thus further verifying the pore fractal growth model.

5. Conclusions

In this paper, a pore fractal growth model was established based on the assumption of pore fractal growth; the model uses reaction degree n and reaction step length m to characterize pore-specific surface area, pore volume and fractal dimension.
Based on the pore fractal growth model and the change law of m and n, the pore fractal growth kinetics were established. The model reveals the change law of pores in the semi-coke gasification process and its influence on the semi-coke gasification reaction rate. The gasification kinetics of three kinds of semi-coke were established based on the pore fractal growth model. The change law of gasification reaction rate and the specific surface area with the carbon conversion of three semi-coke materials was predicted by using the pore fractal growth kinetics model, and the results were consistent with the experimental data, demonstrating the rationality and theoretical integrity of the pore fractal growth dynamics model.
The pore fractal model simplifies the characterization of complex pore structures. The pore structure can be described completely by using the reaction step length and reaction degree. The gasification kinetics based on the fractal model can predict the pore structure (pore-specific surface area and pore volume) change with the carbon conversion rate. Compared with existing dynamics models, the spatiotemporal evolution law and dynamic characteristics of semi-coke pores in the gasification process are more clearly revealed, so it has more definite physical significance. Furthermore, the change characteristics of reaction step length and reaction degree with different raw materials can be explored by studying the gasification kinetics of different raw materials, thus providing a new method for the study of the pore gasification of different raw materials. The pore fractal kinetics model can be used to study the Boudouard reaction of carbon fuel in SO-DCFCs, especially the quantitative calculation and description of the CO production rate of the Boudouard reaction, which is helpful in predicting the change in the electric performance of SO-DCFCs and even provides a basis for the process design and optimization of SO-DCFCs.

Author Contributions

Conceptualization, J.W. (Junzhe Wang); methodology, J.W. (Junzhe Wang); software, J.W. (Junzhe Wang); validation, J.W. (Junzhe Wang); formal Analysis, J.W. (Junzhe Wang); investigation, J.W. (Junzhe Wang); resources, A.Z.; data curation, J.W. (Junzhe Wang), Z.S. and G.L.; writing—original draft: J.W. (Junzhe Wang); writing—review and editing, J.W. (Junzhe Wang), A.Z., S.Q. and J.W. (Jing Wang); visualization, J.W. (Junzhe Wang); supervision, A.Z.; project administration, A.Z.; funding acquisition, J.W. (Junzhe Wang). All authors have read and agreed to the published version of the manuscript.

Funding

This work was carried out as part of the development of the direct carbon fuel cell composite production technology and equipment project (no. 2020SMHKJ-BK-J-26). It was founded by the Shaanxi Coal Industry Chemical Group Co., Ltd.

Data Availability Statement

Data are contained within the article.

Acknowledgments

We would like to thank the anonymous reviewers who have helped to improve the paper.

Conflicts of Interest

Authors Junzhe Wang, Sicheng Qin and Jing Wang were employed by the Shaanxi Coal Industry New Energy Technology Co., Ltd. The remaining authors declare that the research was conducted in the absence of any commercial or financial relationships that could be construed as a potential conflict of interest.

References

  1. Yi, W.; Wang, X.; Zeng, K.; Yang, H.; Shao, J.; Zhang, S.; Watkinson, A.P.; Chen, H. An improved gasification kinetic model for biochar with high alkali and alkaline earth metals content. Fuel 2023, 342, 127849. [Google Scholar] [CrossRef]
  2. Lampropoulos, A.; Varvoutis, G.; Montes-Morán, M.A.; Menéndez, J.A.; Konsolakis, M.; Marnellos, G.E. Detailed kinetic analysis and modelling of the dry gasification reaction of olive kernel and lignite coal chars. Int. J. Hydrogen Energy 2023, 48, 11970–11983. [Google Scholar]
  3. Xu, T.; Wu, Y.P.; Bhattacharya, S. Gasification kinetic modelling of Victorian brown coal chars and validity for entrained flow gasification in CO2. Int. J. Min. Sci. Technol. 2021, 31, 473–481. [Google Scholar] [CrossRef]
  4. Betancur, M.; Arenas, C.N.; Martínez, J.D.; Navarro, M.V.; Murillo, R. CO2 gasification of char derived from waste tire pyrolysis: Kinetic models comparison. Fuel 2020, 273, 117745. [Google Scholar]
  5. Guo, Y.; Zhao, Y.; Gao, D.; Liu, P.; Meng, S.; Sun, S. Kinetics of steam gasification of in-situ chars in a micro fluidized bed. Int. J. Hydrogen Energy 2016, 41, 15187–15198. [Google Scholar] [CrossRef]
  6. Tanner, J.; Bhattacharya, S. Kinetics of CO2 and steam gasification of Victorian brown coal chars. Chem. Eng. J. 2016, 285, 331–340. [Google Scholar] [CrossRef]
  7. Alvarez, J.; Lopez, G.; Amutio, M.; Bilbao, J.; Olazar, M. Evolution of biomass char features and their role in the reactivity during steam gasification in a conical spouted bed reactor. Energy Convers. Manag. 2019, 181, 214–222. [Google Scholar]
  8. Cai, W.; Liu, P.; Chen, B.; Xu, H.; Liu, Z.; Zhou, Q. Plastic waste fuelled solid oxide fuel cell system for power and carbon nanotube CO generation. Int. J. Hydrogen Energy 2019, 44, 1867–1876. [Google Scholar] [CrossRef]
  9. Lahijani, P.; Zainal, Z.A.; Mohammadi, M.; Mohamed, A.R. Conversion of the greenhouse gas CO2 to the fuel gas CO via the boudouard reaction: A review. Renew. Sustain. Energy Rev. 2015, 41, 615–632. [Google Scholar]
  10. Kim, Y.T.; Seo, D.K.; Hwang, J. Study of the effect of coal type and particle size on char-CO2 gasification via gas analysis. Energy Fuels 2011, 25, 5044–5054. [Google Scholar] [CrossRef]
  11. Shurtz, R.C.; Fletcher, T.H. Coal char-CO2 gasification measurements and modeling in a pressurized flat-flame burner. Energy Fuels 2013, 27, 3022–3038. [Google Scholar]
  12. Xu, K.; Hu, S.; Su, S.; Xu, C.; Sun, L.; Shuai, C.; Jiang, L.; Xiang, J. Study on char surface active sites and their relationship to gasification reactivity. Energy Fuels 2012, 27, 118–125. [Google Scholar]
  13. Duman, G.; Uddin, M.A.; Yanik, J. The effect of char properties on gasification reactivity. Fuel Process. Technol. 2014, 118, 75–81. [Google Scholar] [CrossRef]
  14. Alvarez, J.; Lopez, G.; Amutio, M.; Bilbao, J.; Olazar, M. Kinetic Study of Carbon Dioxide Gasification of Rice Husk Fast Pyrolysis Char. Energy Fuels 2015, 29, 3198–3207. [Google Scholar] [CrossRef]
  15. Hurt, R.H.; Sarofim, A.F.; Longwell, J.P. The role of microporous surface area in the gasification of chars from a sub-bituminous coal. Fuel 1991, 70, 1079–1082. [Google Scholar] [CrossRef]
  16. Keown, D.M.; Hayashi, J.I.; Li, C.Z. Drastic changes in biomass char structure and reactivity upon contact with steam. Fuel 2008, 87, 1127–1132. [Google Scholar] [CrossRef]
  17. Rafsanjani, H.H.; Jamshidi, E.; Rostam-Abadi, M. A new mathematical solution for predicting char activation reactions. Carbon 2002, 40, 1167–1171. [Google Scholar] [CrossRef]
  18. Feng, B.; Bhatia, S.K. Variation of the Pore Structure of Coal Chars During Gasification. Carbon 2003, 41, 507–523. [Google Scholar] [CrossRef]
  19. Liu, G.; Benyon, P.; Benfell, K.E.; Bryant, G.W.; Tate, A.G.; Boyd, R.K. The Porous Structure of Bituminous Coal Chars and its Influence on Combustion and Gasification Under Chemically Controlled Conditions. Fuel 2000, 79, 617–626. [Google Scholar] [CrossRef]
  20. Karouki, E.; Sfakiotakis, S. Gasification of waste biomass chars by carbon dioxide via thermogravimetry. Part I: Effect of mineral matter. Fuel 2011, 90, 1120–1127. [Google Scholar]
  21. Wu, S.; Gu, J.; Li, L.; Wu, Y.; Gao, J. The reactivity and kinetics of Yanzhou coal chars from elevated pyrolysis temperatures during gasification in steam at 900–1200 °C. Process Saf. Environ. Prot. 2006, 84, 420–428. [Google Scholar]
  22. Wang, G.; Zhang, J.; Shao, J.; Liu, Z.; Wang, H.; Li, X.; Zhang, P.; Geng, W.; Zhang, G. Experimental and modeling studies on CO2 gasification of biomass chars. Energy 2016, 114, 143–154. [Google Scholar] [CrossRef]
  23. Cortazar, M.; Lopez, G.; Alvarez, J.; Arregi, A.; Amutio, M.; Bilbao, J.; Olazar, M. Experimental study and modeling of biomass char gasification kinetics in a novel thermogravimetric flow reactor. Chem. Eng. J. 2020, 369, 125200. [Google Scholar] [CrossRef]
  24. Bhatia, S.K.; Perlmutter, D.D. A random pore model for fluid-solid reactions: I.isothermal, kinetic control. AIChE J. 1980, 26, 379–386. [Google Scholar]
  25. Dutta, S.; Wen, C.Y.; Belt, R.J. Reactivity of coal and char 1: In carbon dioxide atmosphere. Ind. Eng. Chem. Process Des. Dev. 1977, 161, 20–30. [Google Scholar] [CrossRef]
  26. Zhu, J.L.; Tang, H.P.; Xi, Z.P.; Dix, B. Fractal analysis of pore structure and its application for prediction of permeability and porosity. Rare Met. Mater. Eng. 2009, 38, 2106–2110. [Google Scholar]
  27. Yang, D.K.; Wang, K.; Wang, J.F. Correlation analysis of surface fractal dimension and pore properties of zeolite molecular sieve. Ind. Catal. 2014, 22, 443–446. [Google Scholar]
  28. Chen, X.D.; Zhou, J.K.; Ding, N. Fractal characterization of pore system evolution in cementitious materials. KSCE J. Civ. Eng. 2015, 19, 719–724. [Google Scholar] [CrossRef]
  29. Li, H.; Li, J.; Li, K.; Zhou, L. Fractal surface and fractal adsorption model of sediment. J. Hydraul. Eng. 2003, 3, 14–18. [Google Scholar]
  30. Zhao, Z.G. Surface fractal analysis of mesoporous adsorbent. Acta Chim. Sin. 2004, 62, 219–223. [Google Scholar]
  31. Ren, A.L.; Wang, Q.S.; Guo, B. Structure characterization and surface fractal analysis of sludge activated carbon. Acta Chim. Sin. 2006, 64, 1068–1072. [Google Scholar]
  32. Zhuang, Q.; Li, T.H.; Chen, Q.X.; Li, F.J.; Cheng, Y.L. Fractal theory and its application in the study of activated carbon. Carbon Tech. 2009, 28, 36–40. [Google Scholar]
  33. Passe-Coutrin, N.; Altenor, S.; Cossement, D.; Jean-Marius, C.; Gaspard, S. Comparison of parameters calculated from the BET and Freundlich isotherms obtained by nitrogen adsorption on activated carbons: A new method for calculating the specific surface area. Microporous Mesoporous Mater. 2008, 111, 517–522. [Google Scholar] [CrossRef]
  34. Zhang, J.Z. Fractal[M]; Tsinghua University Press: Beijing, China, 2011; pp. 369–376. [Google Scholar]
  35. Wang, J.Z.; Zhou, A.N.; Liu, G.Y.; Song, Z.X.; Ma, C.; Wang, D. Study on fractal model of activated carbon for pore formation. Carbon Lett. 2022, 32, 863–873. [Google Scholar] [CrossRef]
  36. Liu, H.; Luo, C.H.; Kaneko, M.; Kato, S.; Kojima, T. Unification of gasification kinetics of char in CO2 at elevated temperatures with a modified random pore model. Energy Fuels 2003, 17, 961–970. [Google Scholar] [CrossRef]
  37. Ahmed, I.I.; Gupta, A.K. Kinetics of woodchips char gasification with steam and carbon dioxide. Appl. Energy 2011, 88, 1613–1619. [Google Scholar]
  38. Seo, D.K.; Lee, S.K.; Kang, M.W.; Hwang, J.; Yu, T.U. Gasification reactivity of biomass chars with CO2. Biomass Bioenergy 2010, 34, 1946–1953. [Google Scholar] [CrossRef]
  39. Struis RP, W.J.; Scala, C.V.; Stucki, S.; Prins, R. Gasification reactivity of charcoal with CO2. Part I: Conversion and structural phenomena. Chem. Eng. Sci. 2002, 57, 3581–3592. [Google Scholar]
  40. Morimoto, T.; Ochiai, T.; Wasaka, S.; Oda, H. Modeling on pore variation of coal chars during CO2 gasification associated with their submicropores and closed pores. Energy Fuels 2006, 20, 353–358. [Google Scholar]
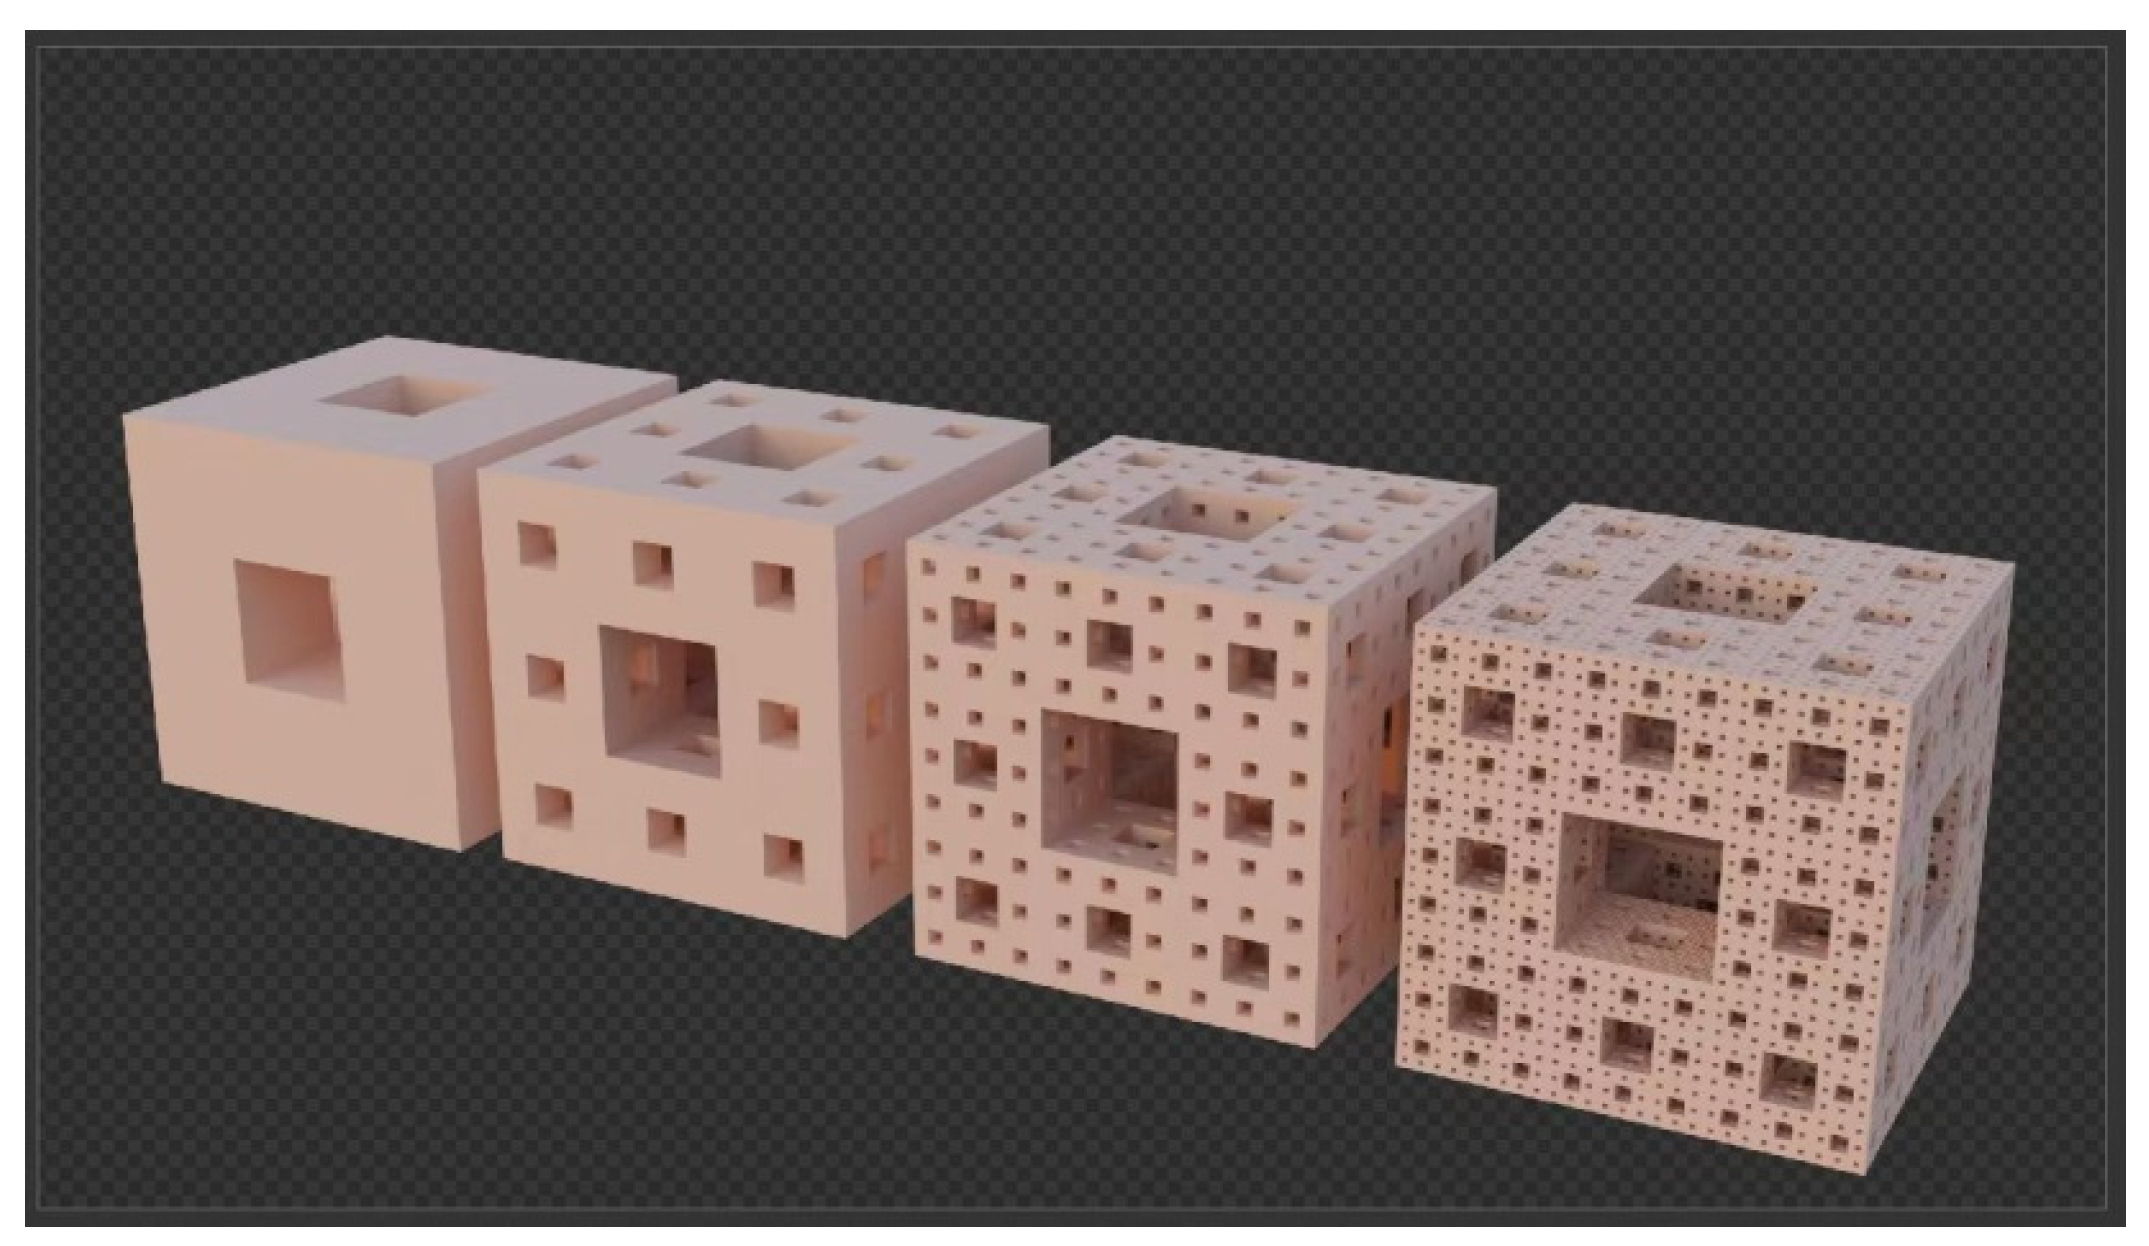
Figure 1. Sierpinski sponge.
Energies 17 00483 g001
Figure 2. Cross-section of the pore fractal structure during gasification [35].
Energies 17 00483 g002
Figure 3. Schematic diagram of pore growth when the reaction step m is 3, 5 and 7.
Energies 17 00483 g003aEnergies 17 00483 g003b
Figure 4. Weight loss curves in carbon dioxide atmosphere for the three samples.
Energies 17 00483 g004
Figure 5. The curve of the carbon dioxide gasification reaction rate and the carbon conversion rate.
Energies 17 00483 g005
Figure 6. Linear fitting curves of lnm–lnn for three raw materials: (a) apple charcoal; (b) coconut shell charcoal; (c) Tianhuili semi-coke.
Energies 17 00483 g006aEnergies 17 00483 g006b
Figure 7. The dx/dt-x curve fitted by two models: (a) apple charcoal; (b) coconut shell charcoal; (c) Tianhuili semi-coke.
Energies 17 00483 g007aEnergies 17 00483 g007b
Figure 8. The SSA-x curve for three kinds of coke in the gasification process: (a) apple charcoal; (b) coconut shell charcoal; (c) Tianhuili semi-coke.
Energies 17 00483 g008aEnergies 17 00483 g008b
Table 1. Pore parameters in the process of pore fractal growth.
Degree1234n
Side length 11/3(1/3)2(1/3)3(1/3)n−1
Single area0(1/3)2(1/3)2×2(1/3)2×3(1/3)2×(n−1)
Number of new pores0613 × 6132 × 613n−2 × 6
Number of new surfaces05 × 613 × 5 × 6132 × 5 × 6(1/3)n−2 × 5 × 6
New area05 × 6 × (1/3)213 × 5 × 6 × (1/3)2×2 − 5 × 6 × (1/3)2×2132 × 5 × 6 × (1/3)2×3 − 13 × 5 × 6 × (1/3)2×3……
Total number of pores066 × 33 + 13 × 66 × 33×2 + 13 × 6 × 33 + 132 × 6……
Total pore volume06 × (1/3)3(6 × 33 + 13 × 6) × (1/3)3 × 2(6 × 33×2 + 13 × 6 × 33 + 132 × 6) × (1/3)3×3……
Table 2. Industrial analysis of Tianhuili semi-coke, apple charcoal and coconut shell charcoal.
SampleVolatile Matter
(wt.%)
Fixed Carbon
(wt.%)
Ash
(wt.%)
Tianhuili semi-coke12.5469.265.71
Apple charcoal9.4878.655.11
Coconut shell charcoal4.8976.276.42
Table 3. Gasification conditions of the three carbon-based raw materials.
Raw MaterialHeating RateCarbonization TemperatureCarbonization TimeGasification TemperatureGasification Time/min
Tianhuili semi-coke10 °C/min600 °C60 min850 °C(0, 60, 120, 180, 240)
Coconut shell charcoal10 °C/min600 °C60 min850 °C(0, 60, 90, 120, 180)
Apple charcoal10 °C/min600 °C60 min850 °C(0, 30, 60, 90, 120)
Purge gasBefore reaching the gasification temperature of 850 °C, nitrogen was injected as a protective gas; after reaching 850 °C, the reactant gas CO2 was injected. After the gasification process, the gas was switched to N2 at room temperature for protection.
Table 4. Pore structure parameters of porous carbon under different degrees of gasification.
Raw MaterialSpecific Surface Area/
SSSA/m2/g
Pore Volume
V/mL/g
Carbon Conversion Rate
x
Fractal Dimension/DReaction Step Length/mReaction Degree/nS n
Apple charcoal-0263.890.1330.192.78043.6819.541.25 × 1011
Apple charcoal-30439.550.2620.372.81033.1020.442.11 × 1011
Apple charcoal-60520.490.3150.442.81862.9820.662.50 × 1011
Apple charcoal-90606.190.3700.522.82622.8820.852.90 × 1011
Apple charcoal-120723.370.4400.622.83482.7821.043.48 × 1011
Coconut shell charcoal-0492.620.2950.412.81583.0220.592.35 × 1011
Coconut shell charcoal-60636.490.4010.562.83012.8320.913.02 × 1011
Coconut shell charcoal-80760.810.4590.642.83752.7521.093.66 × 1011
Coconut shell charcoal-120743.280.4750.672.83832.7421.083.58 × 1011
Coconut shell charcoal-180798.840.5250.742.84312.6921.163.81 × 1011
Tianhuili Semi-coke-02.580.0160.022.65826.8214.561.23× 109
Tianhuili Semi-coke-60570.500.5250.742.84142.6920.932.73 × 1011
Tianhuili Semi-coke-120619.260.5360.752.84372.6720.992.95 × 1011
Tianhuili Semi-coke-180602.410.5100.712.84072.7020.962.89 × 106
Tianhuili Semi-coke-240Complete gasification
Table 5. Parameters of porous carbon with different degrees of gasification.
Raw Material—Gasification TimePore Volume
mL/g
Carbon Conversion Rate
x
dx/dtS*(1 − x)K
Apple charcoal-00.1330.190.015214.926.98 × 10−5
Apple charcoal-300.2620.370.0136278.444.88 × 10−5
Apple charcoal-600.3150.440.0136290.934.67 × 10−5
Apple charcoal-900.370.520.0134291.724.59 × 10−5
Apple charcoal-1200.440.620.0136277.64.90 × 10−5
Coconut shell charcoal-00.2950.410.0047289.091.63 × 10−5
Coconut shell charcoal-600.4010.560.0025278.938.96 × 10−6
Coconut shell charcoal-800.4590.640.00184271.726.77 × 10−6
Coconut shell charcoal-1200.4750.670.00167248.86.71 × 10−6
Coconut shell charcoal-1800.5250.740.00149211.467.05 × 10−6
Tianhuili Semi-coke-00.0160.020.0092.523.57 × 10−3
Tianhuili Semi-coke-600.5250.740.026151.011.72 × 10−4
Tianhuili Semi-coke-1200.5360.750.0215154.381.39 × 10−4
Tianhuili Semi-coke-1800.510.710.0136172.127.90 × 10−5
Tianhuili Semi-coke-240Complete gasification
Disclaimer/Publisher’s Note: The statements, opinions and data contained in all publications are solely those of the individual author(s) and contributor(s) and not of MDPI and/or the editor(s). MDPI and/or the editor(s) disclaim responsibility for any injury to people or property resulting from any ideas, methods, instructions or products referred to in the content.