Article

Numerical Study of H2 Production and Thermal Stress for Solid Oxide Electrolysis Cells with Various Ribs/Channels

1
Faculty of Maritime and Transportation, Ningbo University, Ningbo 315211, China
2
Hydrogen Energy Research Center, China Southern Power Grid Co., Ltd., Guangzhou 510335, China
*
Author to whom correspondence should be addressed.
Energies 2024, 17(2), 510; https://doi.org/10.3390/en17020510
Submission received: 12 December 2023 / Revised: 13 January 2024 / Accepted: 17 January 2024 / Published: 20 January 2024
(This article belongs to the Section A5: Hydrogen Energy)

Abstract

:
A fully coupled electro-thermo-mechanical CFD model is developed and applied to illuminate the crucial factors influencing the overall performance of a solid oxide electrolysis cell (SOEC), particularly the configuration and geometry parameters of its inter-connector (IC), comprising ribs and channels. Expanding on a selected width ratio of 4:3, the gradient ribs/channels are further investigated to assess electrochemical and thermo-mechanical performance. It is elucidated that, while maintaining constant maximum temperature and thermal stress levels, employing a non-regular geometry IC with gradient channels may yield a 30% enhancement in hydrogen production. These nuanced explorations illuminate the complex interplay between IC configuration, thermal stresses, and electrolysis efficiency within SOECs.

1. Introduction

In recent years, there has been a notable shift towards prioritizing renewable and environmentally friendly energy sources. This shift is driven by increasing global energy demand and growing concerns over environmental issues [1]. Moreover, the intermittent nature of renewable energies, such as solar and wind power in conjunction with the surplus electricity in the power grid, creates a favorable opportunity for the development of energy conversion and storage methods [2]. One such method that has attracted significant interest is the solid oxide electrolysis cell (SOEC), which operates in a reverse mode of the solid oxide fuel cell (SOFC), known for its high efficiency and minimal emissions [3,4]. Consequently, SOEC is emerging as one of the most promising technologies for producing hydrogen from renewable sources.
Unlike a proton exchange membrane electrolysis cell (PEMEC) and an alkaline electrolysis cell (AEC), which both function at lower temperatures, an SOEC operates at higher temperatures, typically ranging from 873 to 1073 K, and exhibits a reduced electrical energy demand [5]. However, the structural design and materials employed in SOECs must possess the capability to endure demanding operating conditions, including substantial temperature gradients and hot-spots during high-temperature operation. Consequently, this necessitates stringent requirements for process control and the holistic cell design of SOECs [6,7].
Furthermore, small-scale laboratory stacks may demonstrate enhanced cell performance, while notable reductions in current density are commonly observed in the scaled-up unit cells of SOECs [8]. The reduced cell performance observed in the large-scale SOEC stacks can be attributed to the additional losses resulting from the suboptimal design of ribs and channels within inter-connectors (ICs) [8,9]. Figure 1a illustrates the traditional rib and channel structures, in which rectangular solid ribs separates straight parallel channels located at both sides. The channels in the IC commonly feature small grooves to enhance gas flow, while the ribs directly interact with the electrodes for electron transfer.
When designing the traditional ribs/channels, a compromise must be made on the width as well as on the ratio between the ribs and the channels. By increased the contact area between the electrode and the IC, wider ribs can effectively reduce interface resistance, improve electrical conductivity, and minimize ohmic losses; however, diffusion of chemical gas species to the electrodes is severely hindered. Therefore, it is necessary to have balanced rib/channel configurations and a ratio that covers a suitable portion of the electrode area to ensure a more even distribution of the reactive gases and current flow to the electrolyte layer. The trade-off between the rib size and channel width can have a significant impact on the cell performance.
Multiple theoretical and modeling studies have explored the influence of rib size and rib/channel width ratio on the ohmic resistance and performance of SOECs [10] and SOFCs [11]. Lin et al. [12] proposed a phenomenological model and provided analytical equations to evaluate the impact of the ribs on the concentration and ohmic polarizations in anode-supported SOFC stacks. Jeon et al. [13] introduced a microstructural model and examined how the cell performance is affected by the width of the ribs and channels, along with the area-specific resistance (ASRcontact) of the electrode–interconnector-contacting region. Liu et al. [14] conducted a thorough research of the cell performance in relation to various influencing factors and devised a simple formula to calculate the optimal rib width irrespective of the electrode’s porosity, thickness, and conductivity. This formula, based on ASRcontact as well as the width ratio of the channels and ribs, was proved to be user-friendly. Liu et al. [15] built a 3D model to optimize the rib widths in SOFCs, considering the impact of the interconnect–electrode contacting resistance, and their findings suggested that the optimal rib/channel width ratio fell within the range of 0.4–0.6 when ASRcontact was 0.05 Ω cm2. In addition, it was observed that the ASRcontact increases as the rib/channel width ratio increases.
Using a 2D multi-physics model, Kong et al. [16,17] performed optimization of the rib width for both anode- and cathode-supported SOFCs; they obtained an analytical expression for the optimal rib width, which can be helpful in the engineering design of SOFCs. Ni et al. [18] developed an 3D model of methane-fed SOFCs considering both the direct internal reforming (DIR) of methane and the water–gas shift reaction (WGSR) occurring in the anode. Their findings revealed that, for the stacks with different inlet ratios of methane to steam, the optimal rib/channel width ratio was 0.3. Meanwhile, for SOFCs operating on H2, the optimal rib/channel width ratio was 0.2.
Gao et al. [19] performed optimization of the cylindrical ribs in both anode- and cathode-supported SOFCs under the assumption of an isothermal condition. Kong et al. [20] introduced an X-type IC design that led to a 14.25% increase in power density compared to the traditional design. Fu et al. [21] introduced a novel IC design known as the groove and rib-finned IC, which greatly decreased the activation and concentration overpotentials, leading to enhanced electrical performance of the SOFCs. Bhattacharya et al. [22] provided a detailed comparative study of the performance characteristics of straight and serpentine channels of SOFCs using both numerical simulations and experimental methods, and it was found that, compared to the straight channel geometry, the serpentine geometry provided a more uniform distribution of the current density and significantly improved the power output and fuel utilization efficiency.
Jiao et al. [23] developed a three-dimensional model for an SOEC, taking into account the co-electrolysis of water and carbon dioxide, as well as internal reforming reactions and multi-component diffusion. They proposed a novel porous material flow-field design, which was compared with the three traditional multi-channel flow-field configurations (i.e., parallel, serpentine, and parallel–serpentine). Their predicted results indicated that the novel design utilizing porous material instead of the conventional rib–channel configuration can reduce the voltage loss during the electrolysis operation. Ni et al. [24] introduced and numerically examined several discretely distributed ribs using 3D multi-physics modeling techniques. In comparison to the traditional straight-through IC design, the discretely distributed ribs achieved a more even distribution of O2 in the SOFC cathode, which resulted in an increase in the peak power density for up to 27.86%. Costamagna et al. established an SOFC model based on experimental data and predicted the temperature distribution and electrochemical performance along the stack radius under low fuel utilization. After confirming the reliability of the model under low hydrogen utilization, the mechanical stress of the SOFC ceramic materials under high hydrogen utilization was determined by the temperature gradients [25]. Xu et al. conducted a numerical comparative study on planar SOECs with co-flow, counter-flow, and cross-flow configurations to analyze the effects of flow patterns on gas distribution, current density distribution, and temperature distribution [26].
In summary, the design and optimization of the ribs/channels has significant impacts on the operating performance and stability of SOECs. However, it is noted that the aforementioned studies were mainly focusing on SOFCs, which are different from SOECs in various aspects [27]. For instance, SOFCs are typically operated in an exothermic mode, while SOECs may be operated in endothermic, exothermic, or even thermoneutral modes resulting from complex electrochemical reactions related to heat generation/consumption. As a result, the conclusions drawn from SOFC modeling cannot directly be applied to predict the performance of SOECs. Therefore, there is a noticeable need for research to be specifically focused on the rib/channel design of SOECs, and it is is imperative to prioritize the design and optimization of the channels/ribs for the SOEC IC.
To address the issues mentioned above, an electro-thermo-mechanical coupled CFD model is developed to investigate the electrical and mechanical characteristics of SOECs in this work. The developed model couples the intricate processes among the ionic conduction, electronic conduction, gas/heat transport, and electrochemical reactions. The effects of different rib/channel width ratios on the electrochemical and mechanical properties are comprehensively investigated. In addition, new gradient channel designs are further proposed to better balance the overall performance, in which the thermal stress and the electrical performance of SOECs are evaluated and analyzed simultaneously by a comprehensive and user-friendly guidance for designing the layouts of the ribs and channels.

2. Model Development

This section describes the development method and procedures of a coupled multi-physics field model under steady-state conditions, and it includes the geometric model, the governing equations for the coupled multi-physics phenomena appearing in the SOEC, and the boundary conditions, followed by a validation. The model geometry and employed numerical grid arrangement are the basis for applying the governing equations and boundary conditions in the simulation procedures. At the same time, the assumptions in this study are adopted for the modeled unit cell, as follows:
(1)
All gases are ideal and incompressible in laminar flow.
(2)
The porous electrode is homogeneous.
(3)
The anode, electrolyte layer and cathode are isotropic and linear elastic, which conform to the isotropic Hooke’s law.
(4)
The thermophysical properties (e.g., elastic modulus, coefficient of thermal expansion, and Poisson ratio) of all SOEC components do not change with the local temperature (i.e., evaluated at a constant temperature of 800 °C).
(5)
The interface between the anode, cathode, and electrolyte layer is continuous, allowing for free deformation without any fractures.

2.1. Full-Scale Stack Geometric Parameters and Modeling Methods

A repeating unit cell of SOECs is selected and modeled, as shown schematically in Figure 1a, and it consists of (i) anode inter-connector with the air channels, (ii) positive electrode–electrolyte–negative electrode assembly, or PEN for short, (iii) cathode interconnector with the H2O channels. The co-flow pattern that is normally used is also employed. In this study, five rib/channel width ratios are investigated for understanding the impact of the rib/channel size on both the electrochemical and thermal performance of the SOEC, as displayed in Figure 1b. The SOEC geometric parameters for the base-case (i.e., rib/channel width ratio = 1) are displayed in Table 1, while four types of gradient channel are also proposed for the cell configurations to investigate the impact on both the electrochemical and thermal performance of the SOEC, as presented in the latter sections.

2.2. Governing Equations

2.2.1. Electrochemical Reactions

The electrochemical reactions in the SOEC consist of the reduction reaction of H2O at the cathode and the oxidation reaction at the anode. These reactions can be expressed as follows:
H 2 O 1 2 O 2 + 2 H + + 2 e
2 H + + 2 e H 2
The electrical current flow in the SOEC occurs through movement of the electrons in the electrodes and the ions in the electrolyte layer. The equations that govern the ion and electron transport are implemented as follows,
σ i e Φ i = ± J
σ e e Φ e = ± J
where Φ i and Φ e are the ionic and electronic potentials and σ i e and σ e e are the effective ionic and electronic conductivities, respectively. The term J represents the current density, which accounts for the effect of the electrode reaction kinetics on charge balance. The electrode reaction kinetics can be determined by applying the generalized Butler–Volmer equation to describe the charge transfer reactions based on expressions of the anodic and cathodic current density. For the cathode, the electrochemical reduction Butler–Volmer equation of H2O can be expressed as:
J = J 0 , H 2 exp 1 + β a F η act , c R T exp β c F η act , c R T
For the anode, the Butler–Volmer equation can be expressed as
J = J 0 , O 2 exp β a F η act , a R T exp β c F η act , a R T
where J 0 represents the exchange current density and β represents asymmetric charge transfer coefficient. The exchange current density ( J 0 , H 2 and J 0 , O 2 ) can be expressed as
J 0 , H 2 = γ H 2 exp E act , c   R T p H 2 p std   p H 2 O p std
J 0 , O 2 = γ O 2 exp E act , a R T p O 2 p std 1 / 4
where γ represents the pre-exponential factor, E act   represents the activation energy, and p std represents the reference pressure. Table 2 summarizes the values used for the involved parameters.
The electrochemical reaction rate at a specific electrolysis operating voltage corresponds to the current density. During the cell operation, the required electrolysis operating voltage applied to the SOEC can be written as
V = E + η act + η c o n c + η ohm
E = Δ G 2 F + R T 2 F ln p H 2 p O 2 1 / 2 p H 2 O
in which ∆G represents the Gibbs free energy; F represents the Faraday’s constant (9.6485 × 10⁴ C mol−1); R represents the ideal gas constant (8.3145 J∙mol−1∙K−1); T represents the thermodynamic temperature (K); and p H 2 , p H 2 O , and p O 2 represent the partial pressures of H2, H2O, and O2, respectively, at the electrode–electrolyte interface. Meanwhile, η o h m , η act , and η c o n c are ohmic, activation, and concentration loss, respectively. The ohmic loss is induced by the electrical resistance of solid components calculated by the ohm’s law,
η o h m = J × A S R o h m
where A S R o h m is the total area-specific resistance (Ω·cm2).
The activation polarization represents the electrode activity, which can be calculated by
η act = Φ e Φ i E
The concentration polarization accounts for the difference between the actual gas partial pressures at the reaction sites and the ones in the electrode. It should be noted that, in this CFD modeling methodology, the gas partial pressure is directly predicted and is iteratively used to calculate the Gibbs free energy and other parameters for directly evaluating the concentration polarizations [28].

2.2.2. Gas Flow and Momentum Equations

The continuity equation is applied for conservation of the mass flowing process in various regions of the SOEC, as presented below. In the gas flow channels, based on the fact of the laminar gas flow assumed, the continuity equation is as follows,
( ρ u ) = Q mass
where ρ represents the density of the mixed gases and u is the velocity vector.
To represent conservation of the momentum in the porous electrodes, the Navier–Stokes equation, which is widely used in open domains, is adjusted by incorporating a Darcy factor that considers the porosity of the electrodes.
ρ u u = p + μ u + ( u ) T 2 3 μ u I ε μ u k
where k is the permeability, μ is the dynamic viscosity of the mixed gases, and I represents the identify matrix.
Due to the multi-component mixed gases transported in the gas flow channels and the porous electrodes, the density and dynamic viscosity of the mixed gases can be obtained by the following,
ρ = p x i M i R T
μ = x i μ i
where x i is the mole fraction of the gas component i , M i represents the molar mass of the substance, μ i is the dynamic viscosity of the gas component, i , and the mass source term Q mass encompasses both consumption and production of the gas components by the electrochemical reactions in the porous electrodes, as formulated in the following manner:
Q mass   c a = J c M H 2 M H 2 O 2 F
Q mass   a n = J a M O 2 4 F

2.2.3. Gas Transport Equations

The electrochemical reactions in SOECs take place at the interface region of the porous electrode/electrolyte layer, known as the triple-phase boundary (TPB). In order to reach this region, the gas needs to diffuse through the porous electrodes, where Knudsen diffusion plays a significant role. The conservation equation for each gas species can be formulated as,
j i + ρ ( v ) ω i = Q mass  
where j i is the mass flow rate calculated by
j i = ρ D i m k ω i
where D i m k is the effective diffusion coefficient of the gas species, i , which is calculated from the Fick diffusion coefficient ( D m ) and the Knudsen diffusion coefficient ( D k ).

2.2.4. Heat Transfer Equation

Heat transfer inside SOECs comprises convective heat transfer and heat conduction, with the heat radiation ignored in this study. The energy conservation equation of SOECs can be expressed as
ρ C p u T = λ e f f T + Q
where Q is the heat source (W m−3), including the entropy change of the electrochemical reactions, the activation, and the ohmic loss-related heat.

2.2.5. Thermal Stress–Strain Equation

The total strain can be expressed as
ε t = ε 0 + ε el + ε th + ε cr + ε p l
where ε 0 represents the initial strain, which is ignored in this study, ε el denotes the elastic strain, ε th represents the thermal strain, ε cr indicates the creep strain, which is one type of irreversible plastic strain accumulated with time, and ε p l represents the time-independent plastic strain (not considered in this study). The thermal strain is calculated as
ε th = a   T T ref
where a is the coefficient of thermal expansion (CTE), T   is the local temperature obtained from the current CFD simulation, and T ref   is the stress-free temperature.
The stress–strain relationship for an isotropic, linear, and elastic solid material is formulated as [29]
σ xx σ yy σ zz σ yz σ xz σ xy = E ( 1 + v ) ( 1 2 v ) 1 v v v 0 0 0 v 1 v v 0 0 0 v v 1 v 0 0 0 0 0 0 ( 1 2 v ) 2 0 0 0 0 0 0 ( 1 2 v ) 2 0 0 0 0 0 0 ( 1 2 v ) 2 ε xx ε yy ε zz ε yz ε xz ε xy 1 1 α Δ T 1 1 0 0 0
where E is Young’s modulus and v is the Poisson’s ratio of the modeled material.
The equivalent von Mises stress is predicted as described below.
σ v M = 1 2 σ x x σ y y 2 + σ y y σ z z 2 + σ z z σ x x 2 + 3 σ x y 2 + σ y z 2 + σ z x 2

2.3. Boundary Conditions and Parameters

In this study, the investigated unit cell is located in the middle region, rather than on the top or bottom part of the stack. The materials of various components in the SOEC are applied as follows: the cathode is composed of Ni/YSZ material, the electrolyte layer is YSZ, while the anode utilizes LSM, and the inter-connector is made of stainless steel. The physical parameters of SOEC components in this study are shown in Table 3.
The inlet reactants consist of 90% water vapor and 10% hydrogen gas, because a certain amount of hydrogen gas must be added to ensure a mildly reducing atmosphere at the fuel electrodes during the electrolysis. The inlet flow rate of the fuel gases is 0.217 L/min, while that of air is set at 0.33 L/min. The pressure is 3 bar. The SOEC operates at a temperature of 800 °C and the inlet gas temperature is also maintained at 800 °C, which is the same as Tref in this work. The upper and lower surfaces of the cell are fixed by constraints and the side surfaces of the cell are in the freely expanded state, as presented in Table 4.

2.4. Model Validation

The above-mentioned multi-physics CFD model is validated by comparing the predicted values with the experimental data. In order to guarantee the comparability of the experimental and simulation results, the identical structural and operational parameters have been adopted from [26].
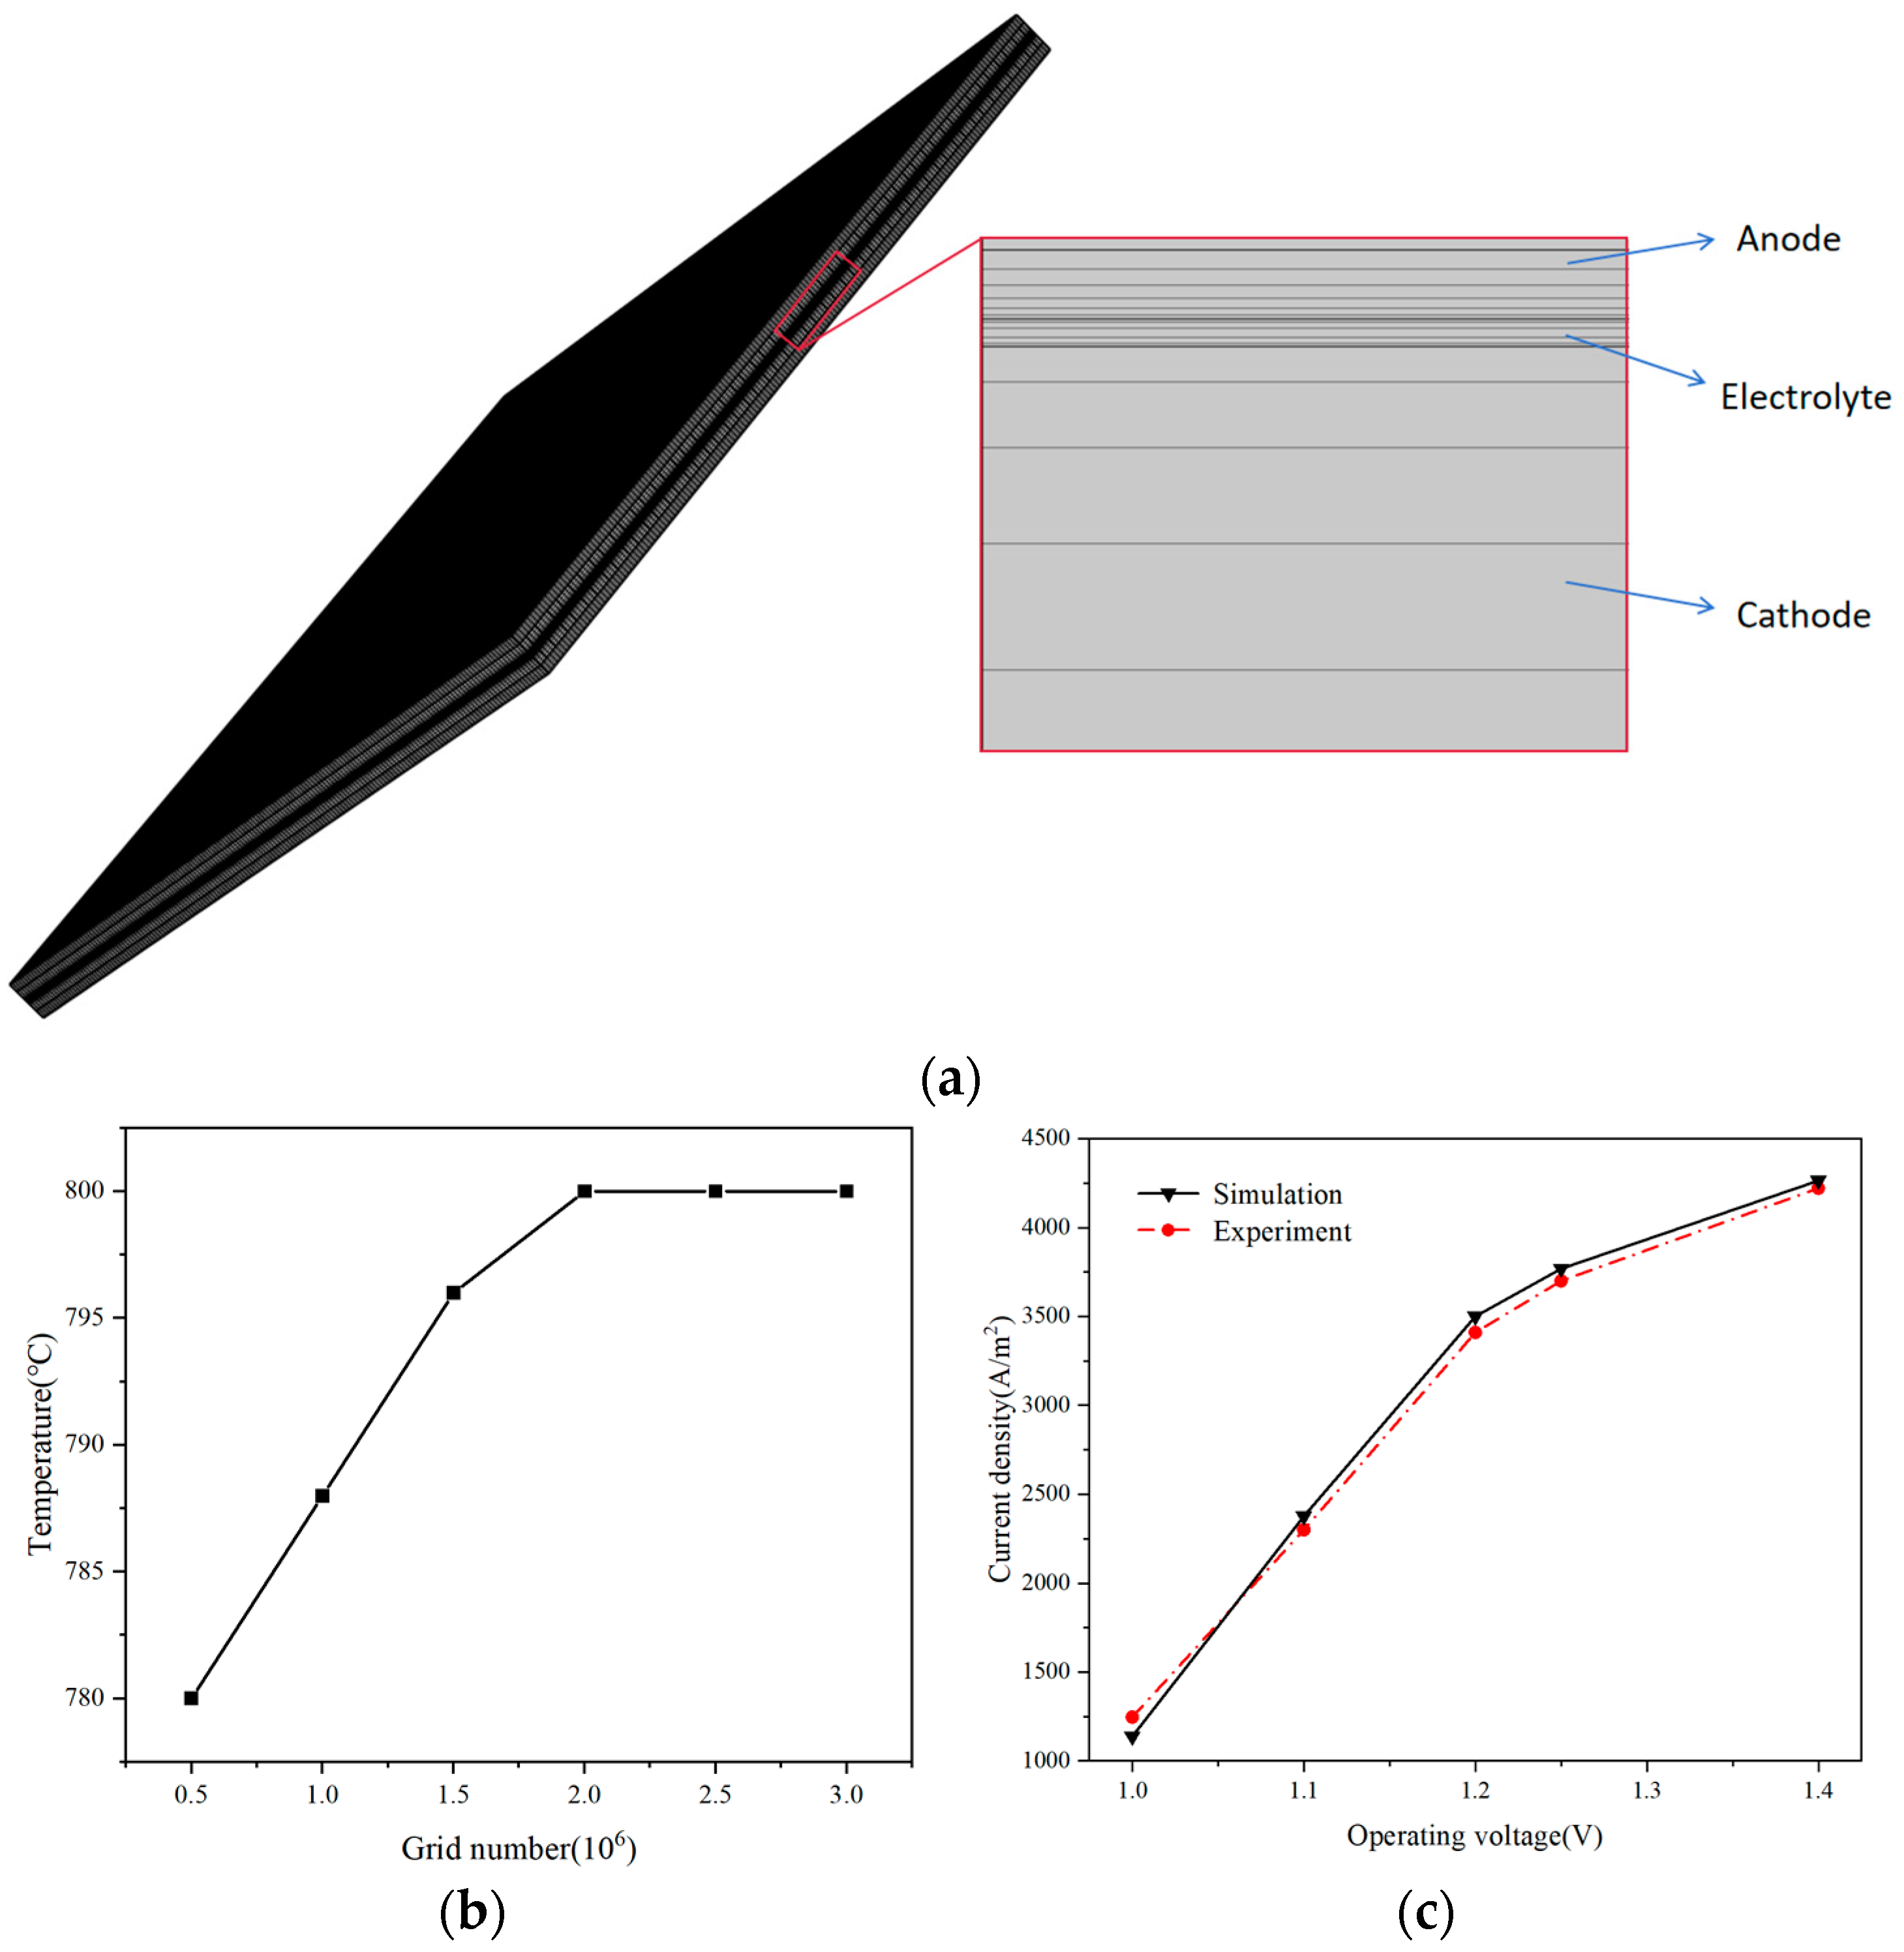
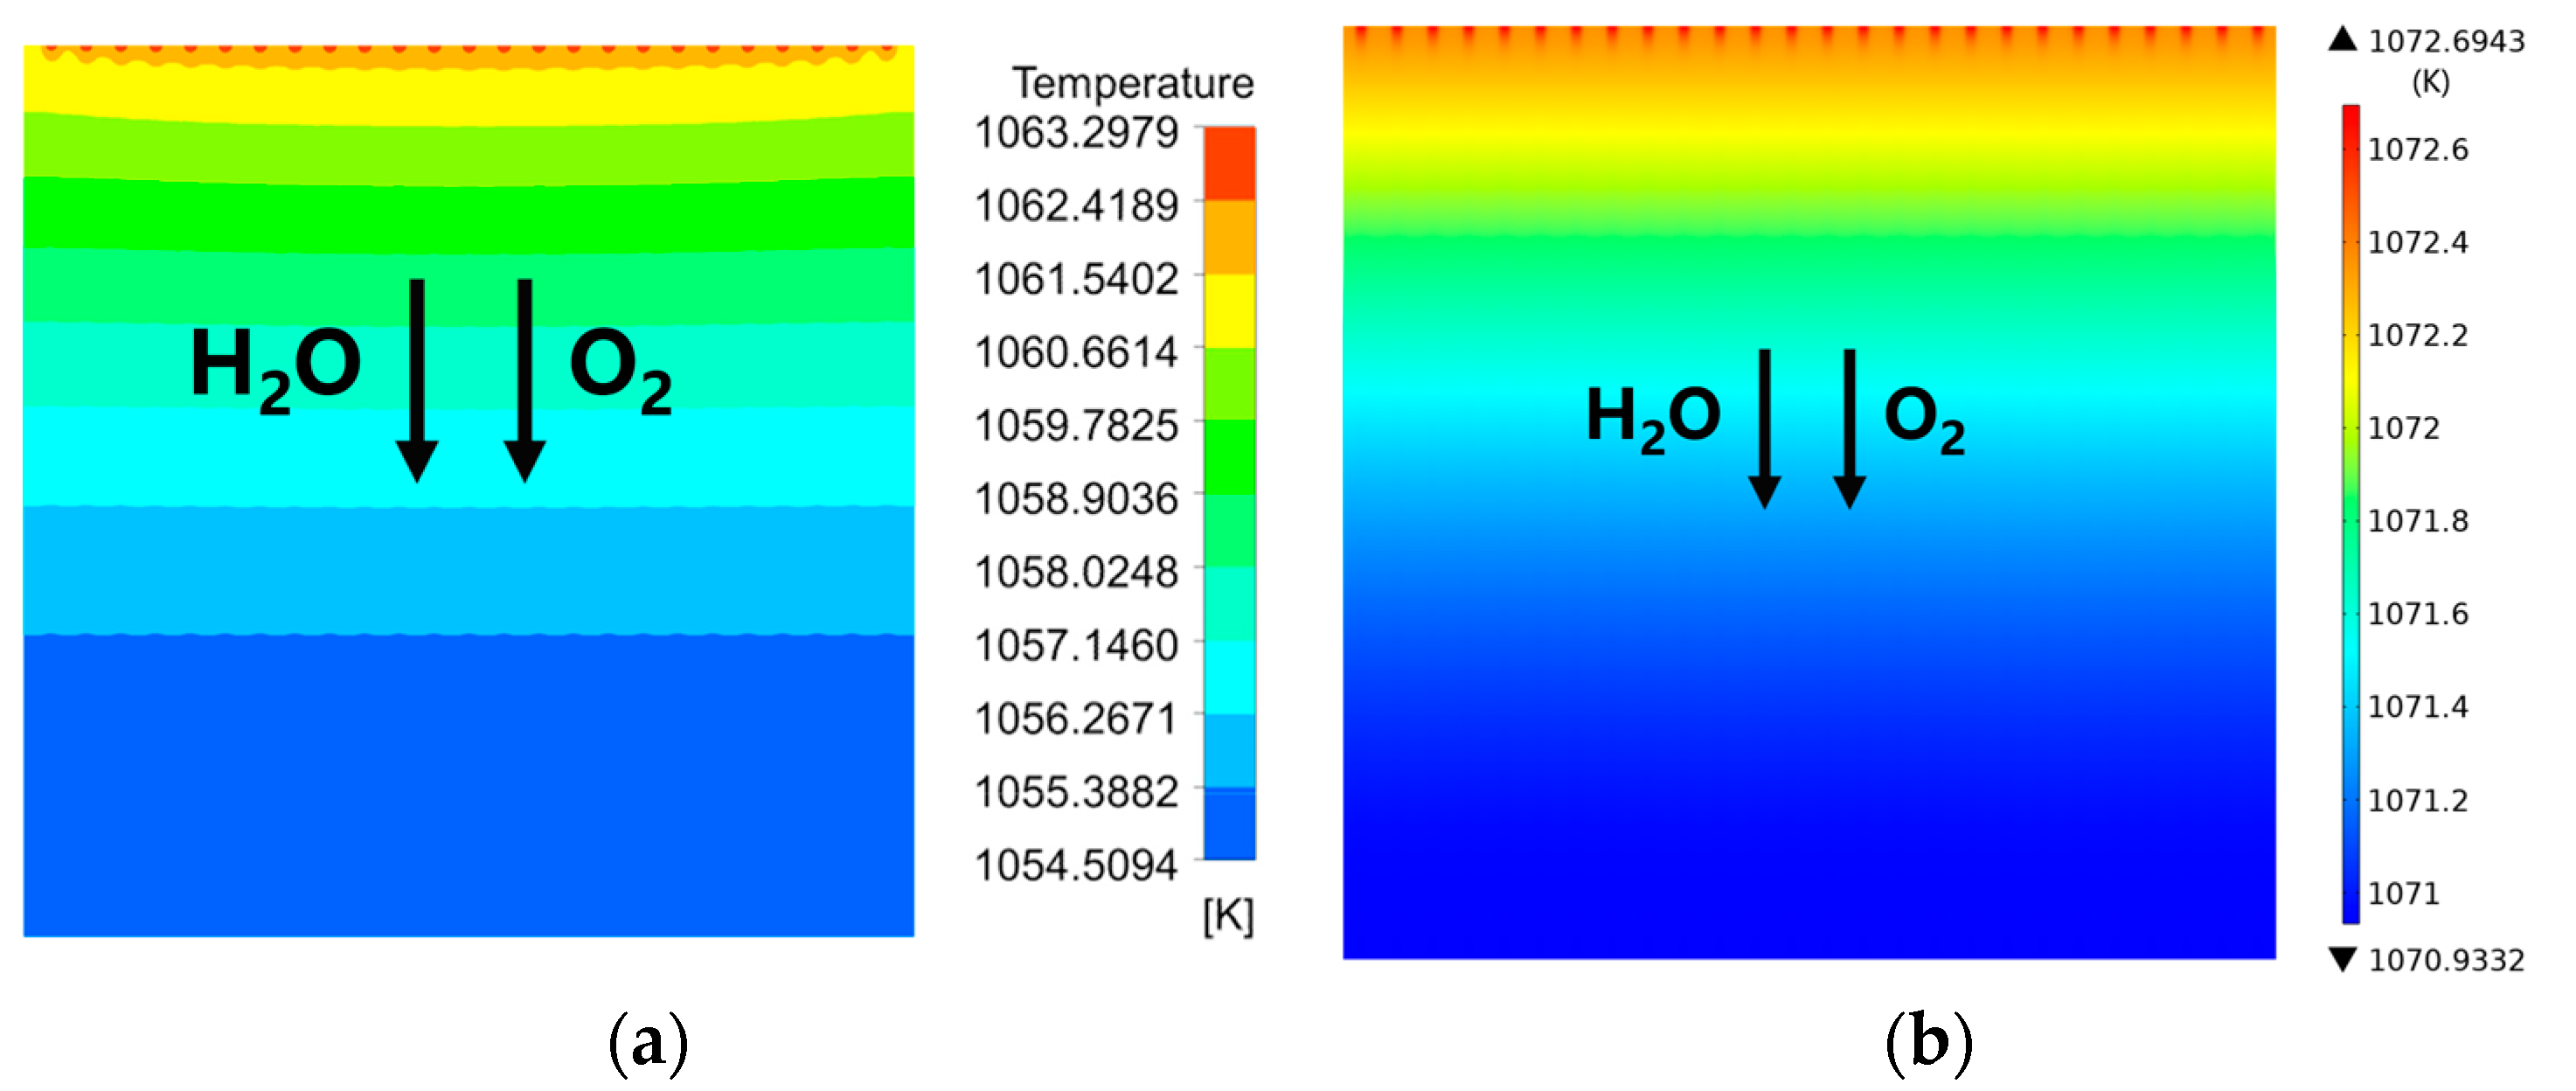
The electrolyte surface averaged temperature at the operating voltage of 1.3 V (i.e., the thermal neutral voltage) is used as the parameter for mesh testing, as shown in Figure 2b. It is observed that, when the total mesh number reaches 2 × 10⁶, the prediction temperature becomes stable at 800 °C, as shown in Figure 2a. In other words, the simulation result is independent of the number of the meshes and the meshing arrangement when the mesh number is beyond 2 × 10⁶. It can be seen from Figure 2c that the simulation results agree well with the experimental data, with the relative error being less than 1.0%, which proves the validity of the current CFD modeling and prediction. To validate the accuracy of the model, a predicted temperature profile is also compared with that presented in [26] operated at 1073 K. It is clear that the current modeling prediction in Figure 3a exhibits a very similar temperature distribution trend as in [26], while it is much closer to the expected temperature of 1073 K operated at the thermal neutral condition compared with that presented in Figure 3a.

3. Results and Discussion

In this section, the main results and findings of the numerical simulations are presented and discussed. The electrolysis performance and thermo-mechanical behavior of the SOEC are presented in terms of the current density, temperature profiles, and von Mises stress for various rib/channel sizes and shapes, as well as for the proposed configurations with gradient channels along the main flow direction and thickness direction.

3.1. Predicted Performance for the Base-Case (i.e., Rib/Channel Width Ratio = 1)

The electrolysis performance and thermo-mechanical behavior are predicted and presented for the base-case configuration (i.e., rib/channel width ratio = 1, in which the rib width is 1.75 mm and the channel width is also 1.75 mm) at various operating voltages, including 1.2 V (i.e., below the thermoneutral voltage), 1.3 V (at the thermoneutral voltage), and 1.4 V (above the thermoneutral voltage).
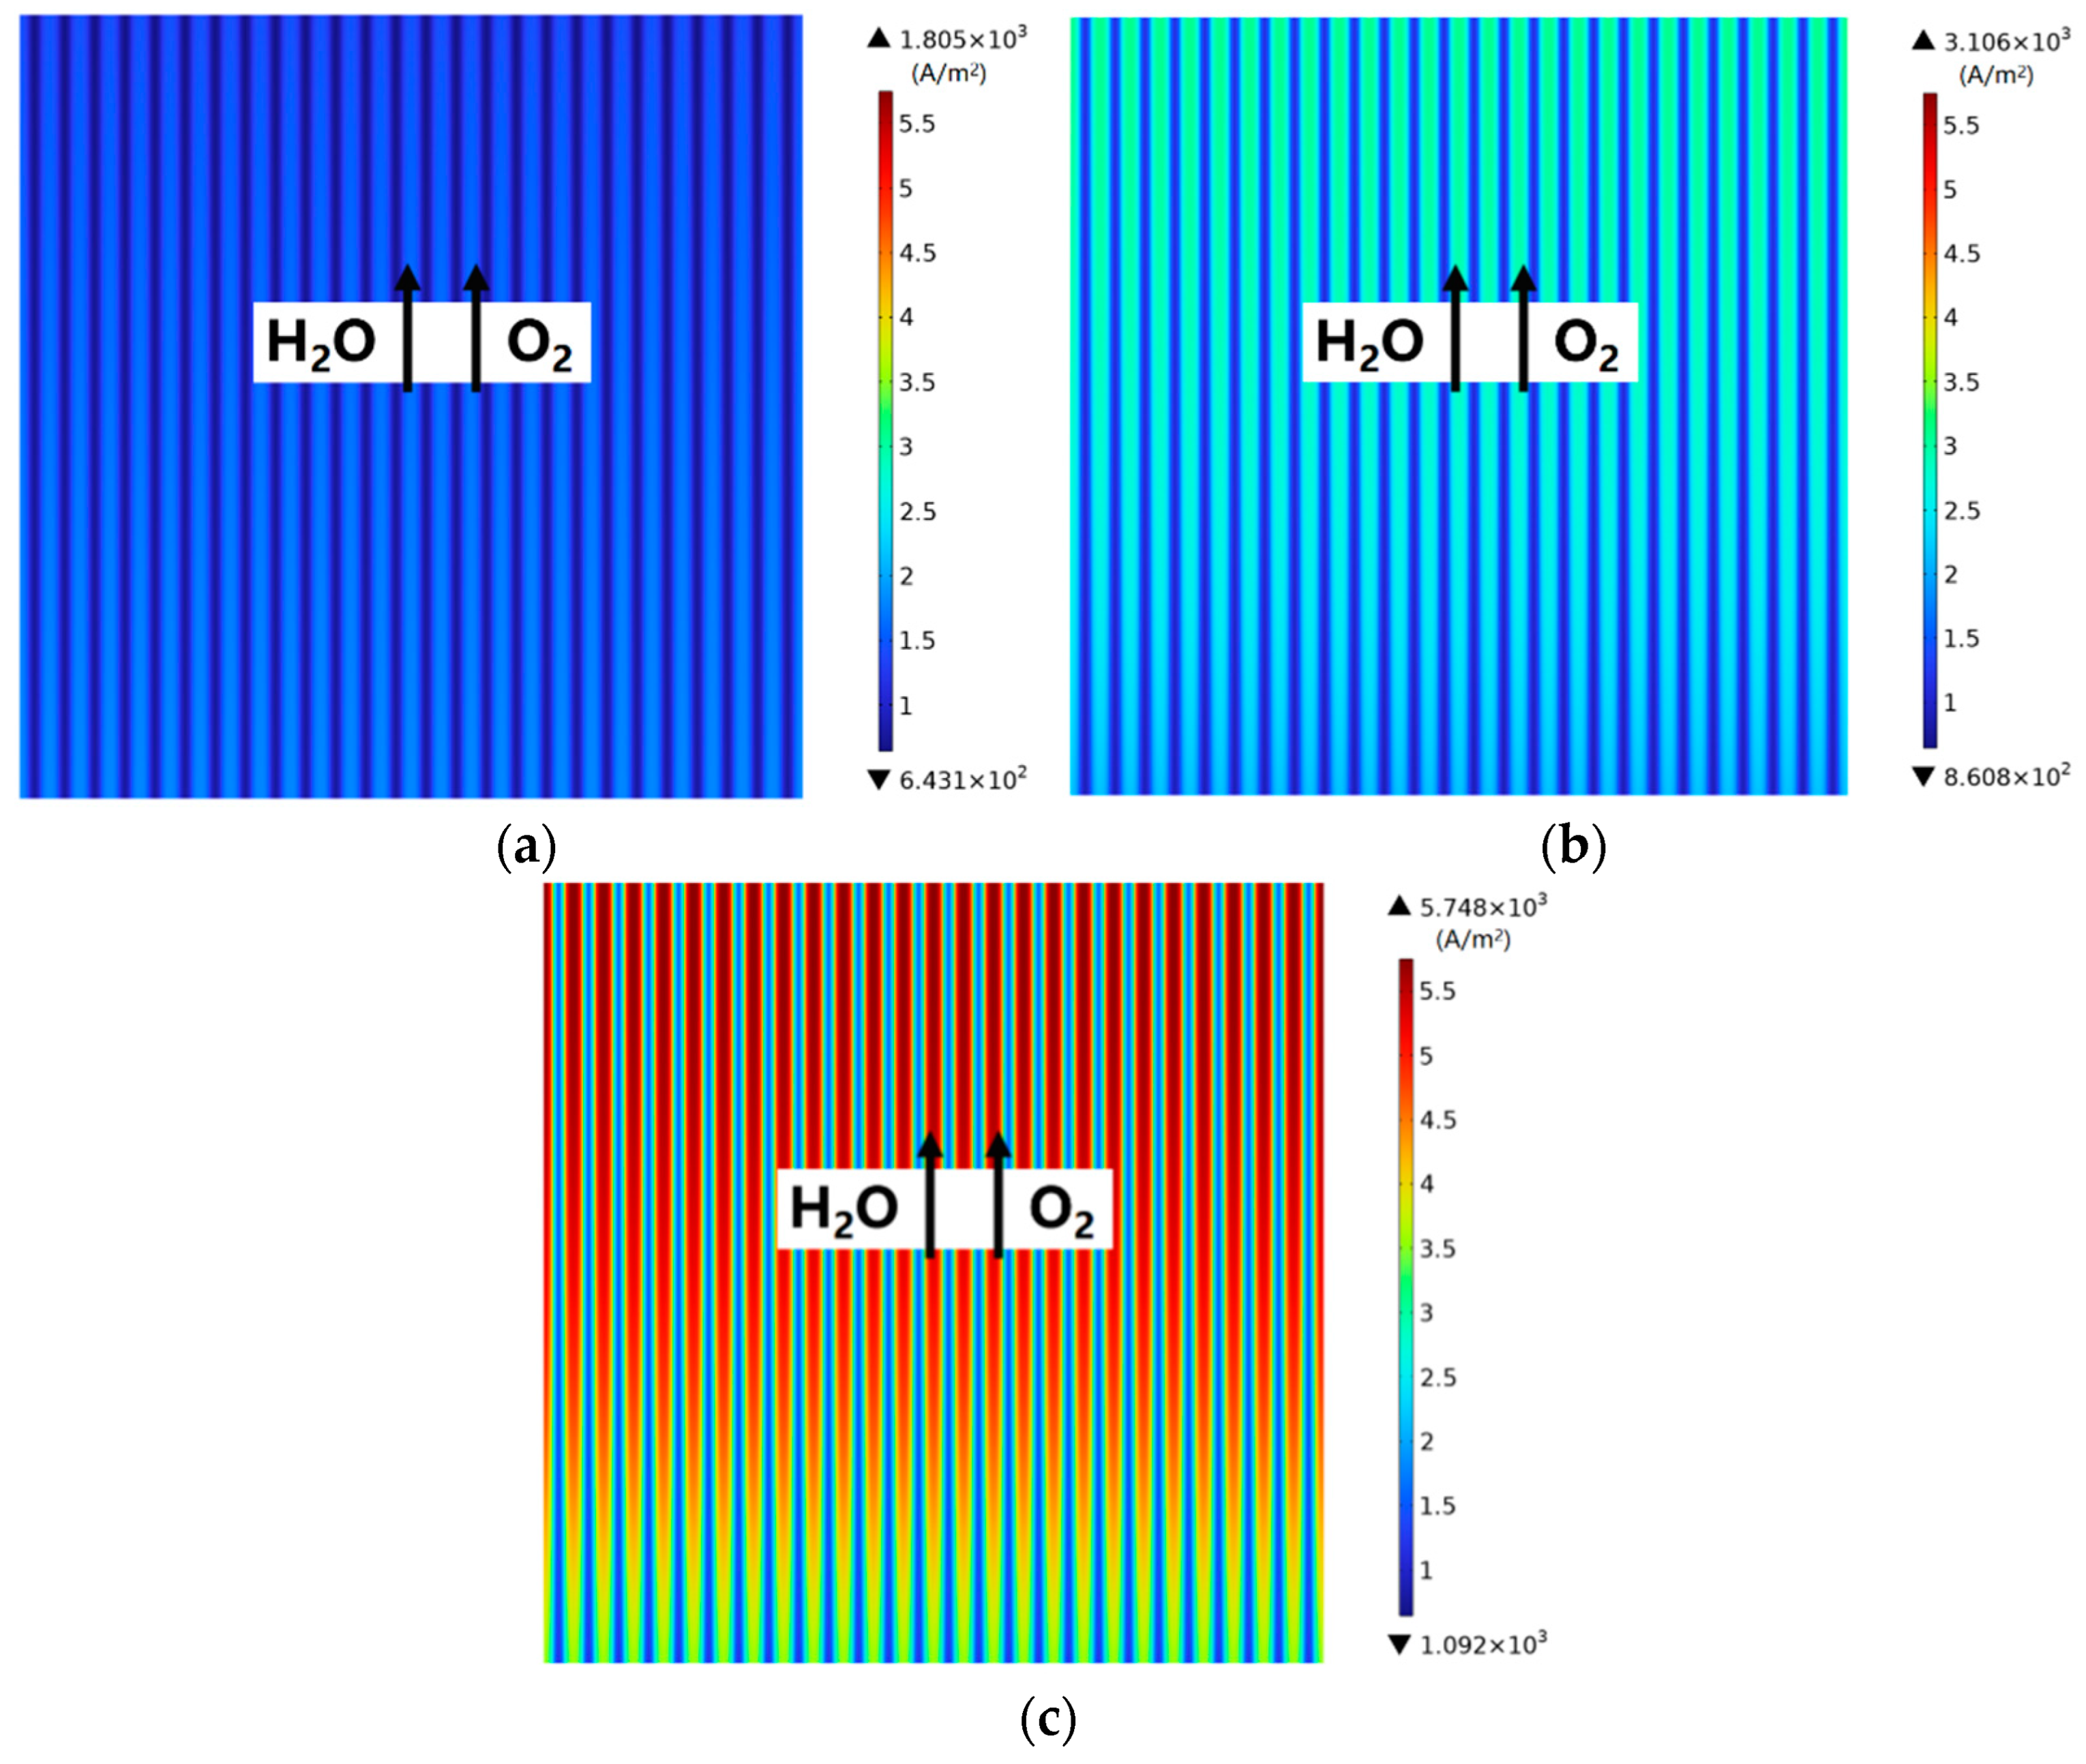
Figure 4 demonstrates the predicted electrolysis current density. It is found that the lowest current density appears in the entrance region, which increases along the main flow direction, and the highest value is reached in the outlet region. Meanwhile, the current density predicted under the ribs is higher than that under the channels. The current density increases as the operating voltage increases, as observed in Figure 4b,c compared with Figure 4a.
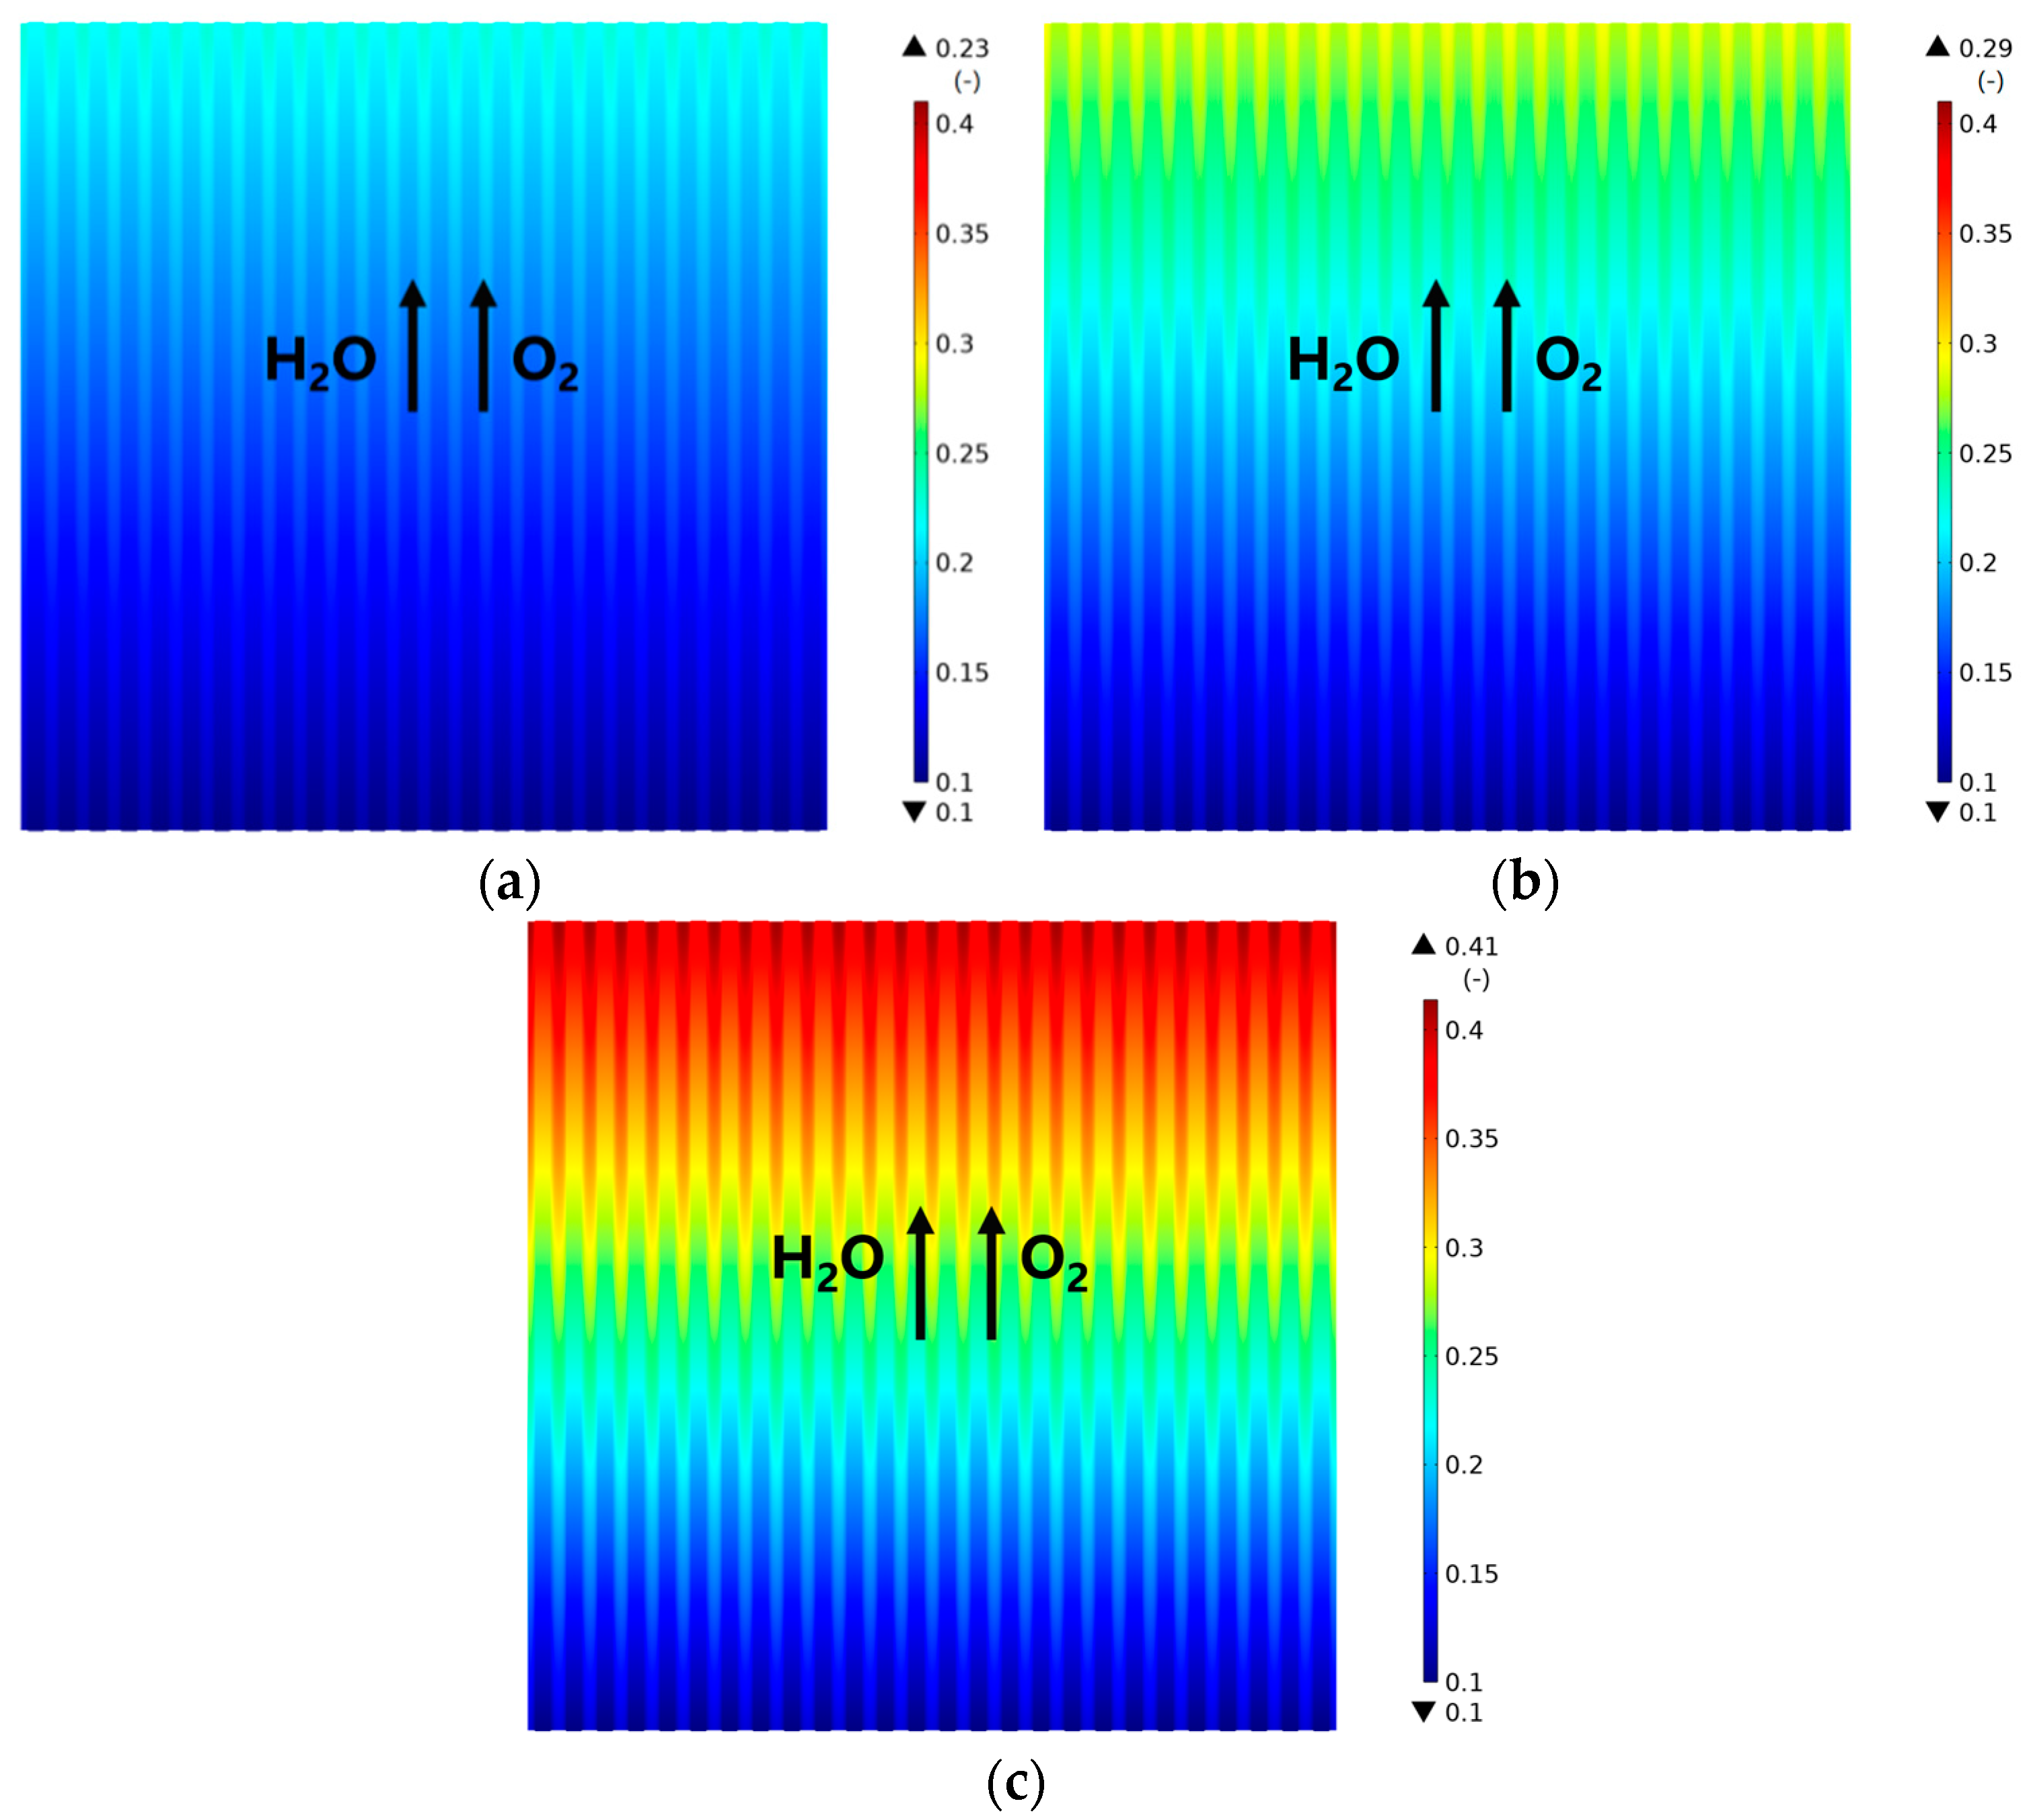
The distribution of the H2 mole fraction predicted along the cathode–electrolyte interface with rib/channel width ratio 1/1 is similar for the investigated three operating voltages, as shown in Figure 5. It is noted that the H2 mole fraction is the lowest in the entrance region, because there is a weak electrochemical reaction occurred in this region. Along the gas main flow direction, as the electrochemical reactions proceed the hydrogen mole fraction gradually increases, with a slightly higher hydrogen mole fraction under the ribs compared to that under the channels. The hydrogen mole fraction is highest in the outlet region for all operating voltages, as identified In Figure 5, while the higher operating voltage is conducive to the hydrogen production attributed to the increased current density (as shown in Figure 4).
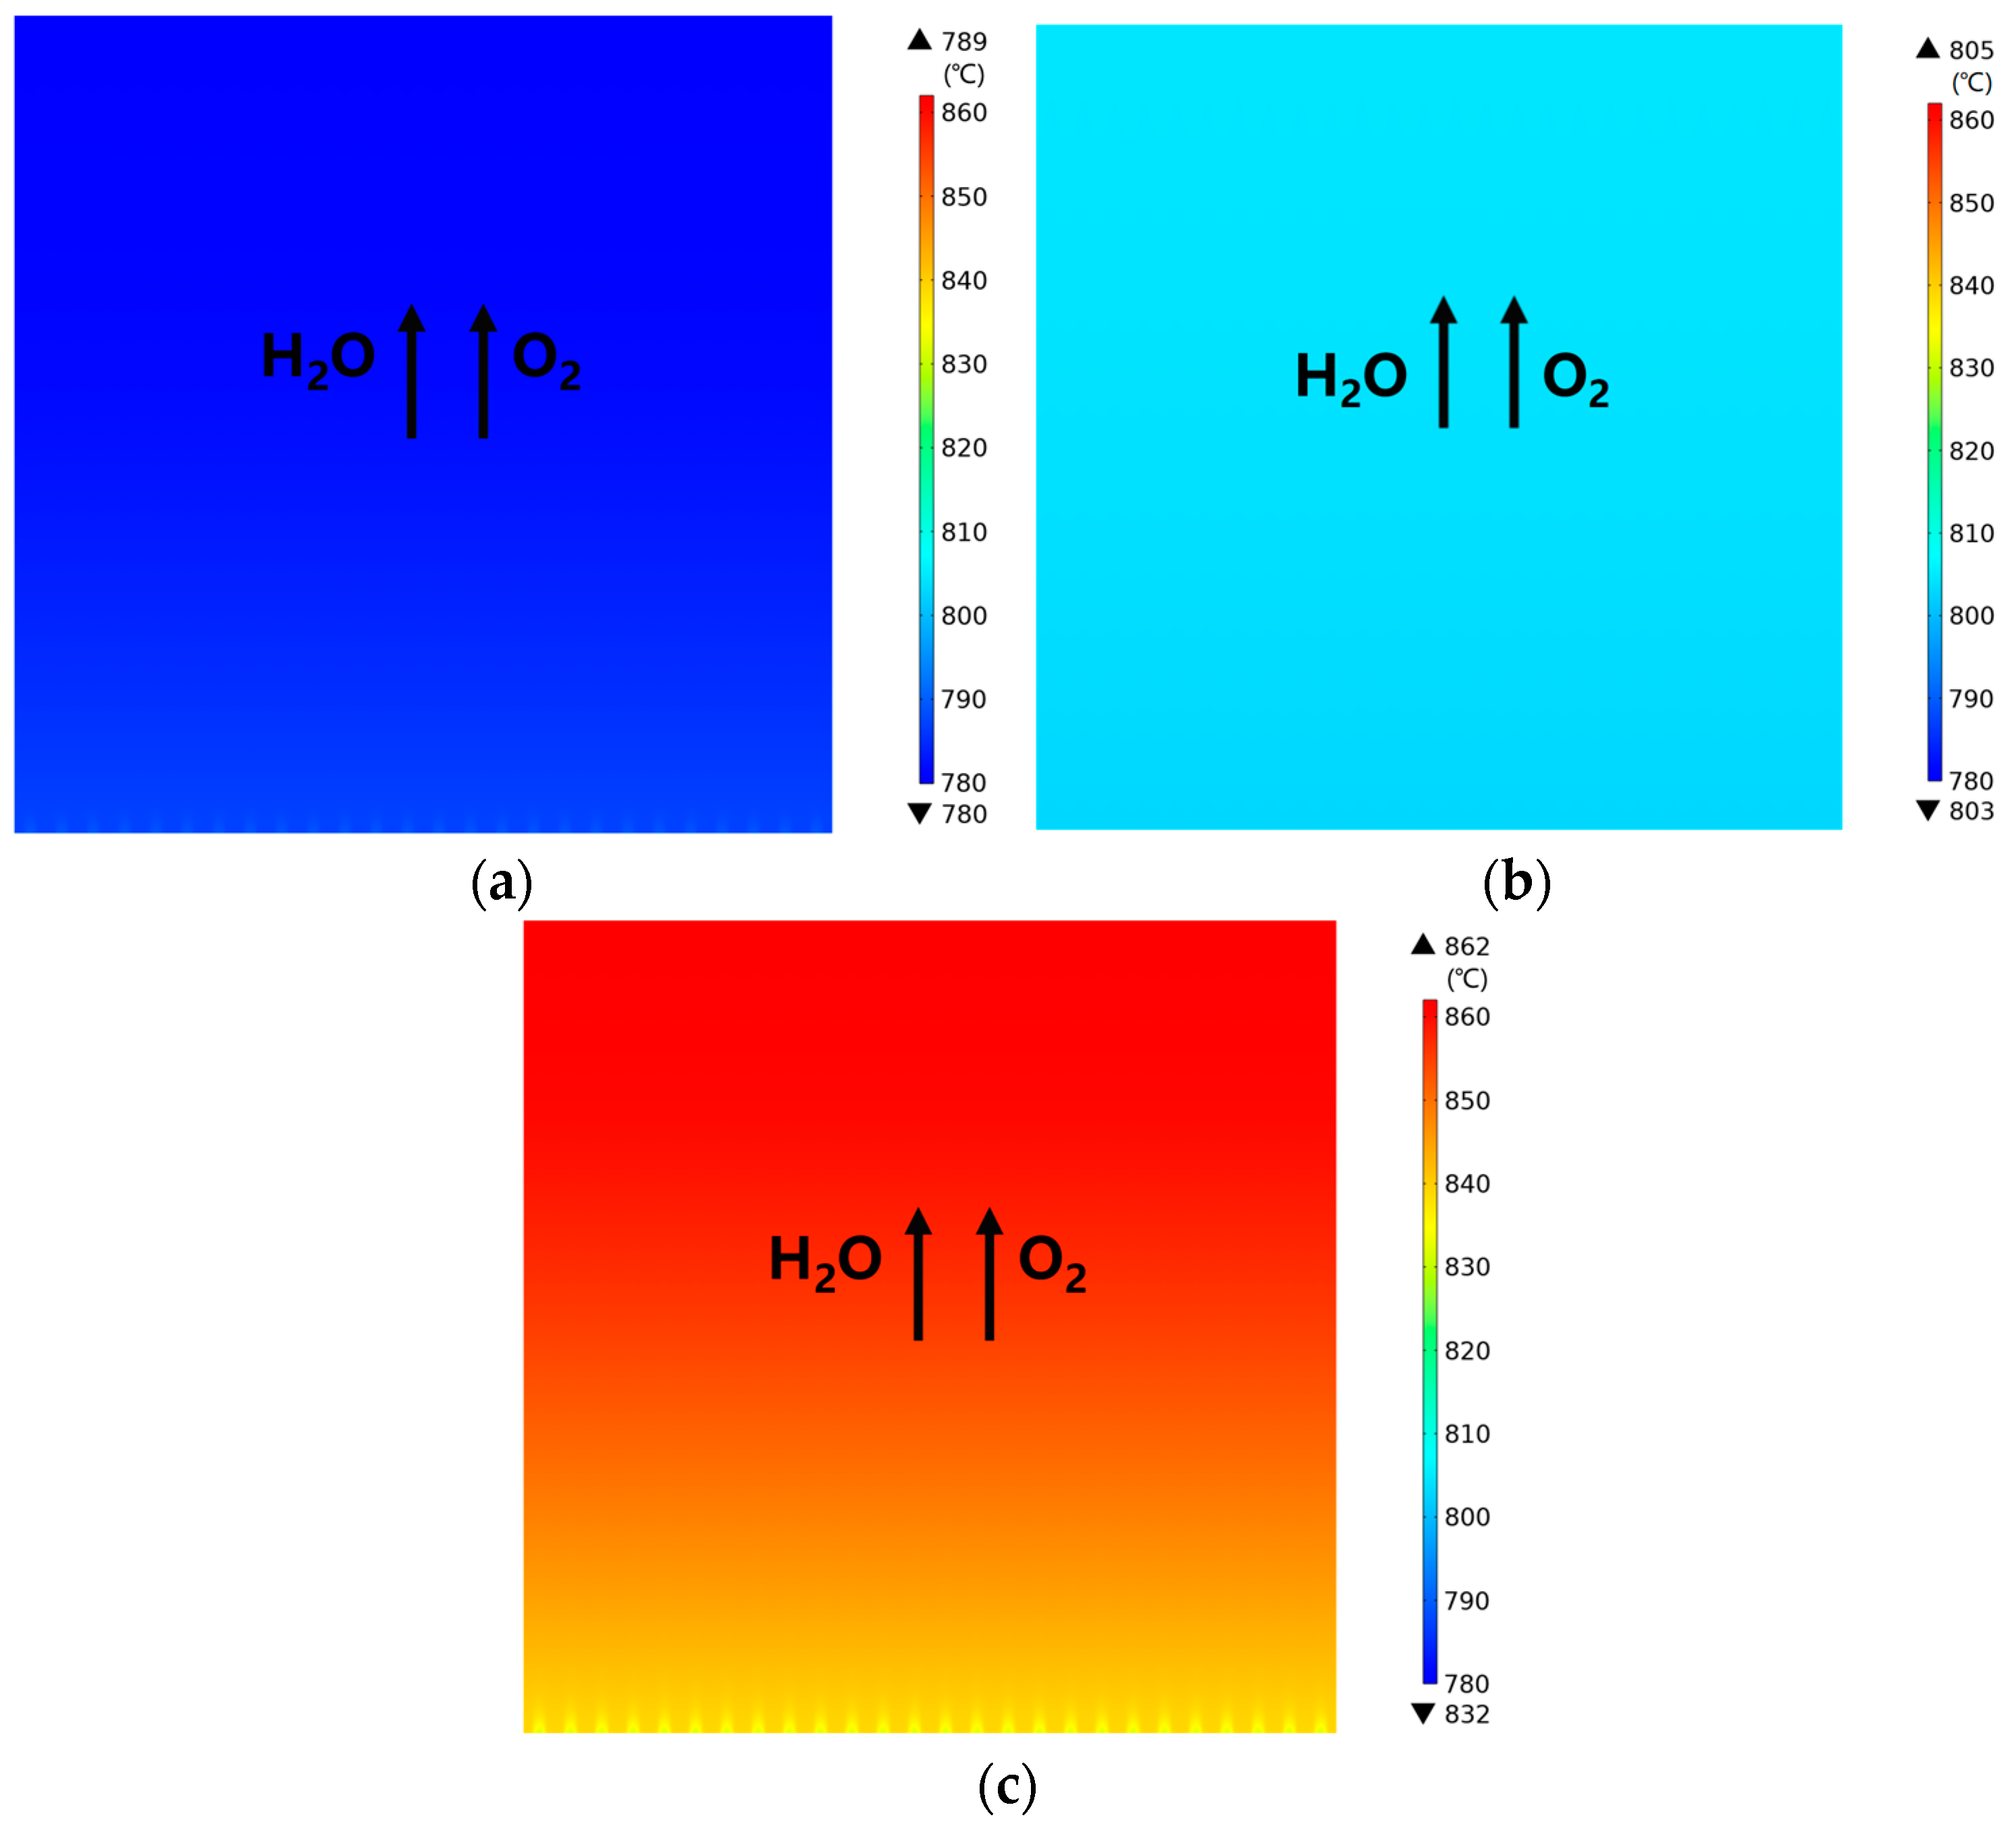
Figure 6 presents the predicted temperature distribution for various operating voltages. It is noted that there is a small temperature difference between the ribs and the channels, particularly in the entrance region at the three operating voltages. It is also seen, in Figure 6a, that the temperature decreases along the main flow direction from the inlet, which is mainly due to heat consumption by the electrochemical reactions. Meanwhile, in Figure 6b the predicted temperature remains relatively constant, with only 2 °C of the temperature variation along the main flow direction when the operating voltage is at 1.3 V, which is evidence that the cell is operated at the thermoneutral voltage (i.e., the balanced heat generation and consumption under this thermally neutral operating voltage). It is also believed that this 2 °C temperature variation results from the heat generated by resistance to the electron flow. On the other hand, the predicted temperature increases along the main flow direction, with the minimum value being even higher than the inlet temperature of 800 °C, as shown in Figure 6c for the operating voltage being 1.4 V (above the thermoneutral voltage). Meanwhile, its maximum value is approximately 30 °C higher than its lowest one, because the heat generation due to various aspects is stronger under the operating condition above the thermoneutral voltage.
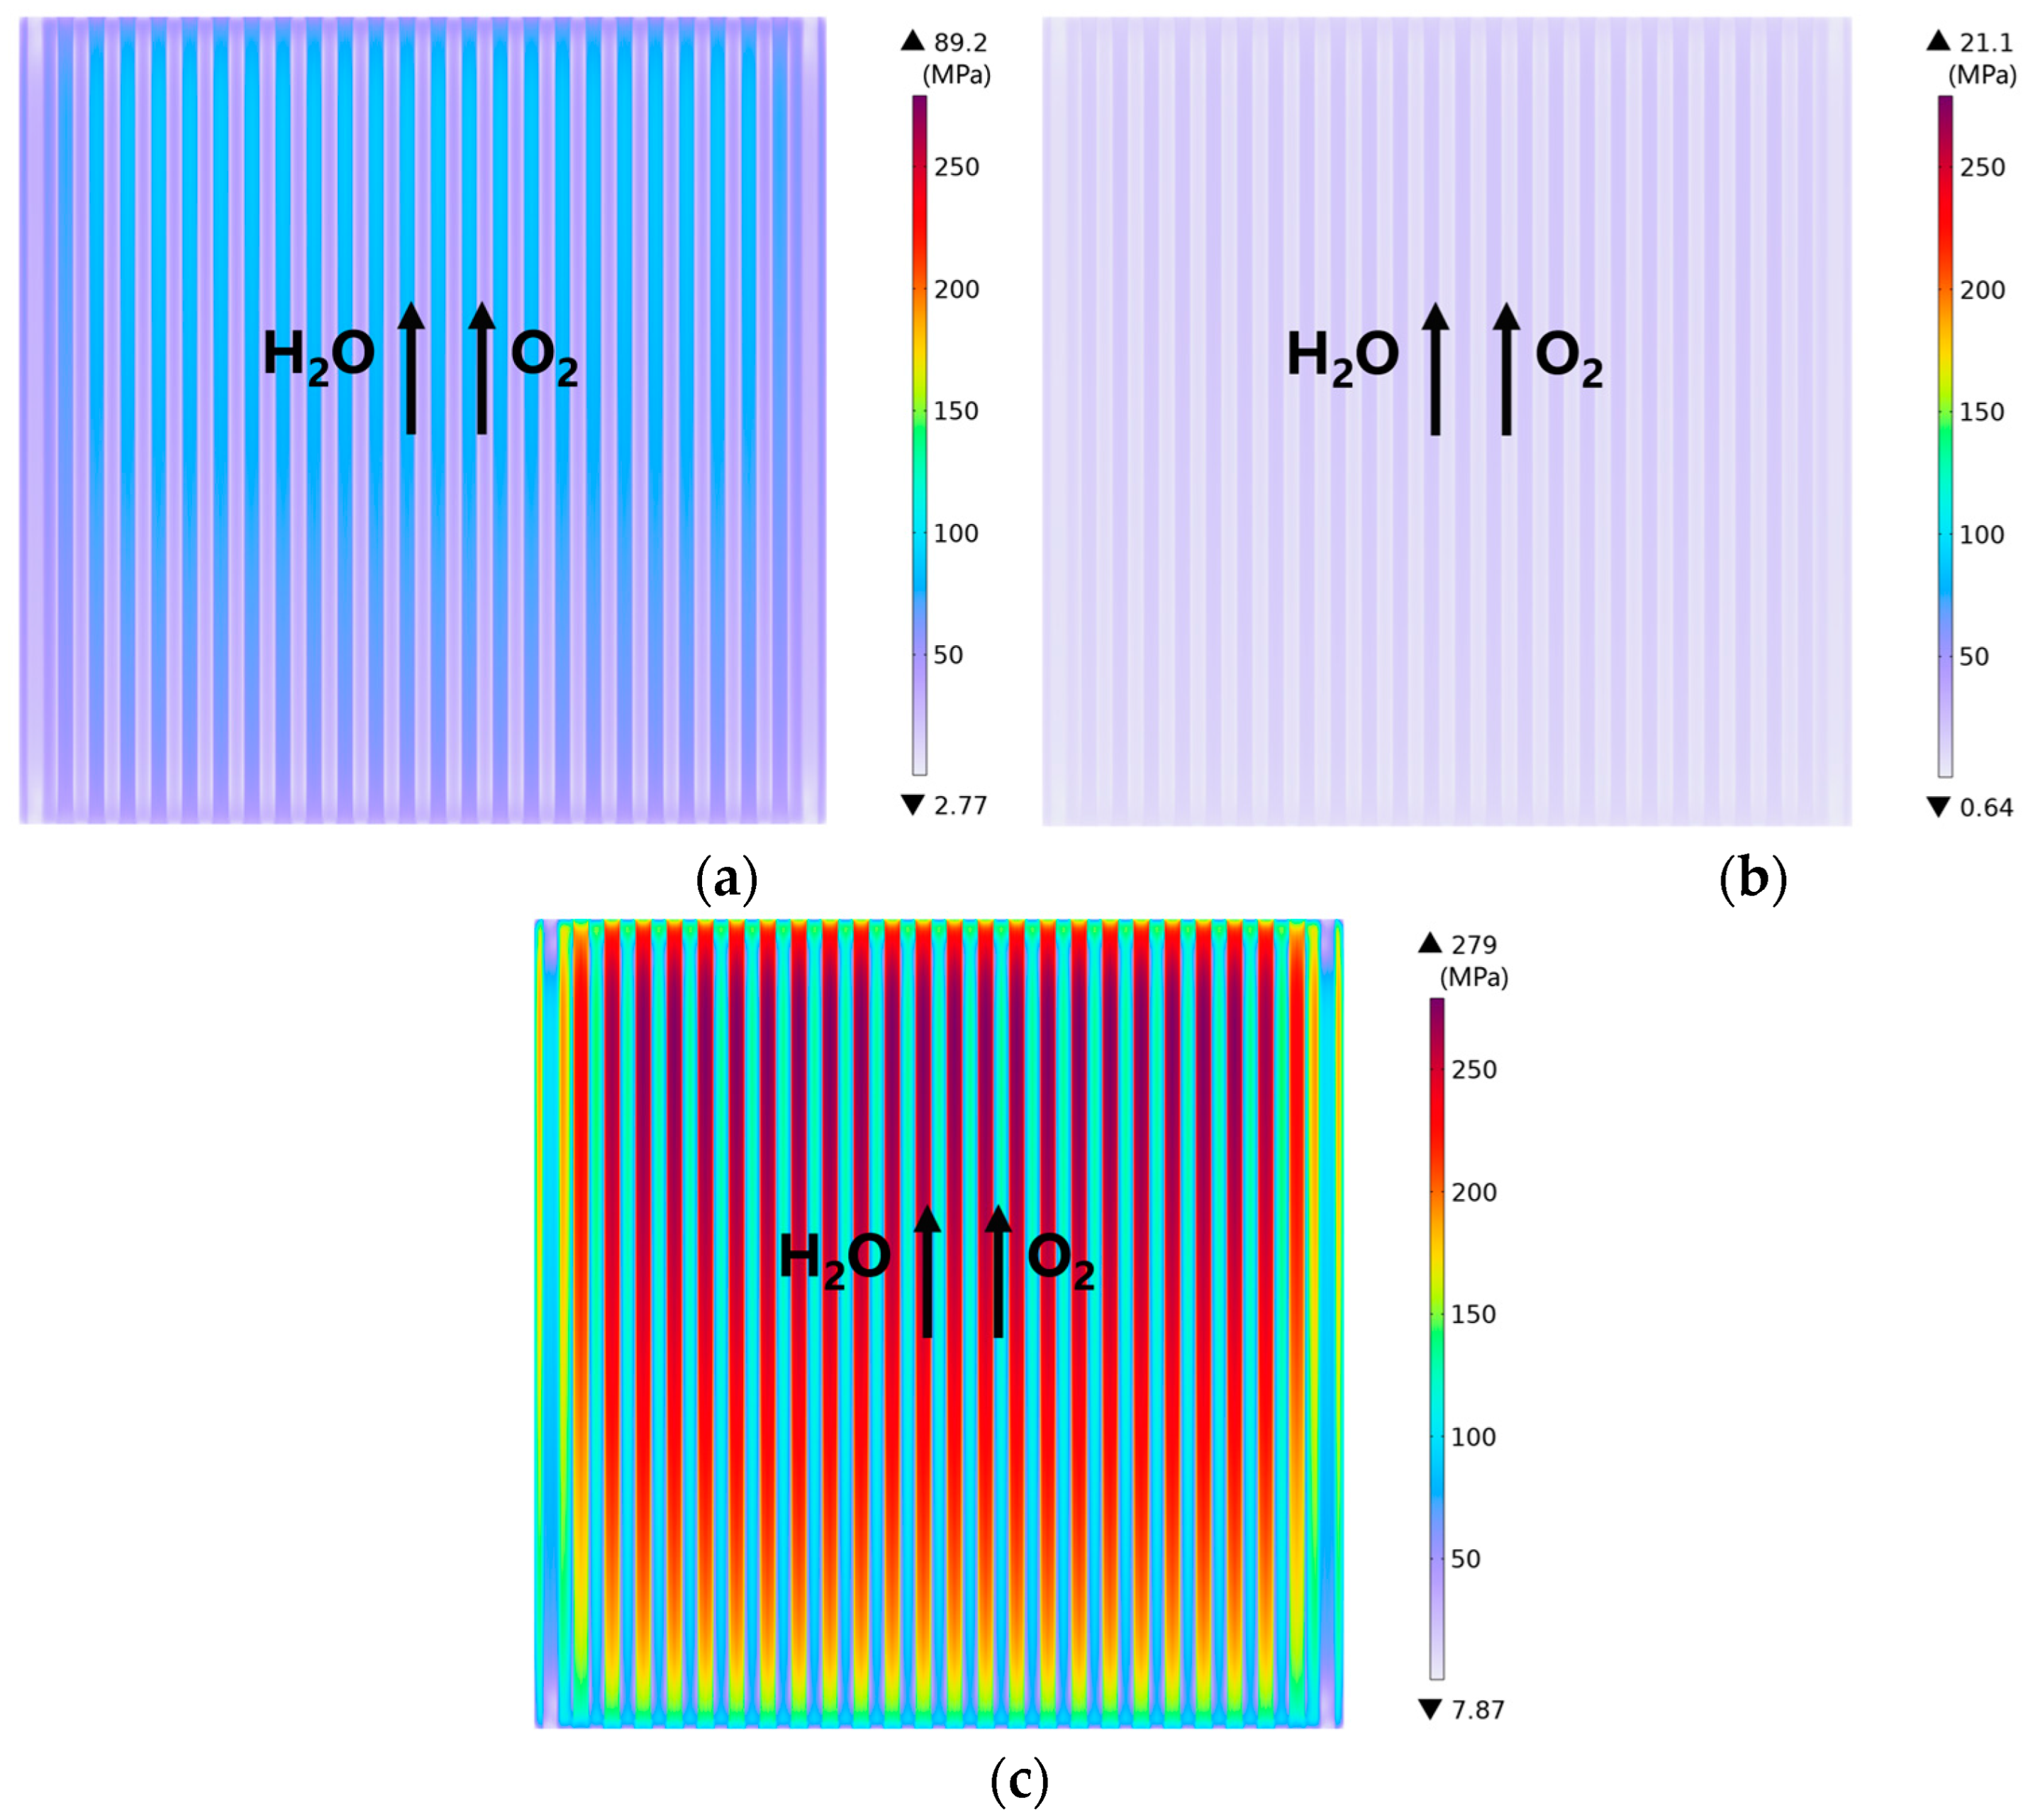
The predicted distribution of von Mises stress at the electrolyte surface is presented in Figure 7. It is found that the thermal stress of SOEC is axial-symmetrically distributed along the cell width direction. It is a fact that the stress increases first and then decreases until a lower value is reached in the outlet area for all the operating conditions, as shown in Figure 7. The lower stresses appear under most side ribs, while the higher ones are under the central ribs. This is so because the upper and lower surfaces of the cell are fixed with the constraints, while the side is assumed with a free expanded condition. The maximum thermal stress predicted for 1.4 V operating voltage is approximately 280 MPa, which is approximately 13 and 3 times higher than that for the operating voltage of 1.3 V and 1.2 V, respectively, because the temperature difference at 1.4 V is the highest, while it is the lowest for the case with the 1.3 V operating voltage, as shown in Figure 6.

3.2. Effect of Rib/Channel Width Ratio

Different rib/channel width ratios are investigated to predict and analyze the effects on the SOEC performance and thermal stress, aiming to identify the cell configuration, which may reduce the higher maximum thermal stress obtained at the operating voltage of 1.4 V. The investigated rib/channel width ratios are outlined in Table 5 and Figure 1b. It should be noted that the sum of the rib and channel width is kept constant (i.e., 3.5 mm) when the width ratio changes.
It is noted that the predicted trend of the current density under the ribs is higher than that under the channels for both investigated operating voltages, as shown in Figure 8a,b. It is also found that the current density increases along the main flow direction for both the investigated width ratios, which is the same as found previously for the base-case width ratio (i.e., 1). It is clear that the maximum current densities obtained in Figure 8a,b are similar, while the minimum value for the width ratio of 5/2 in Figure 8b is approximately four times higher than that presented in Figure 8a for the width ratio of 2/5. This is so because the contacting area for the electron transfer between the ribs and electrolyte layer is 2.5 times different in these two width ratios.
The current density is also further predicted for identifying the width ratio effects. As shown in Figure 8c for the operating voltages of 1.2 V and 1.4 V, the averaged current densities decrease if the width ratio decreases, which is the same as observed for the base-case in Figure 8a,b. It is also a fact that the change of the rib/channel width ratio has a greater effect on the predicted current density at the operating voltage of 1.4 V.
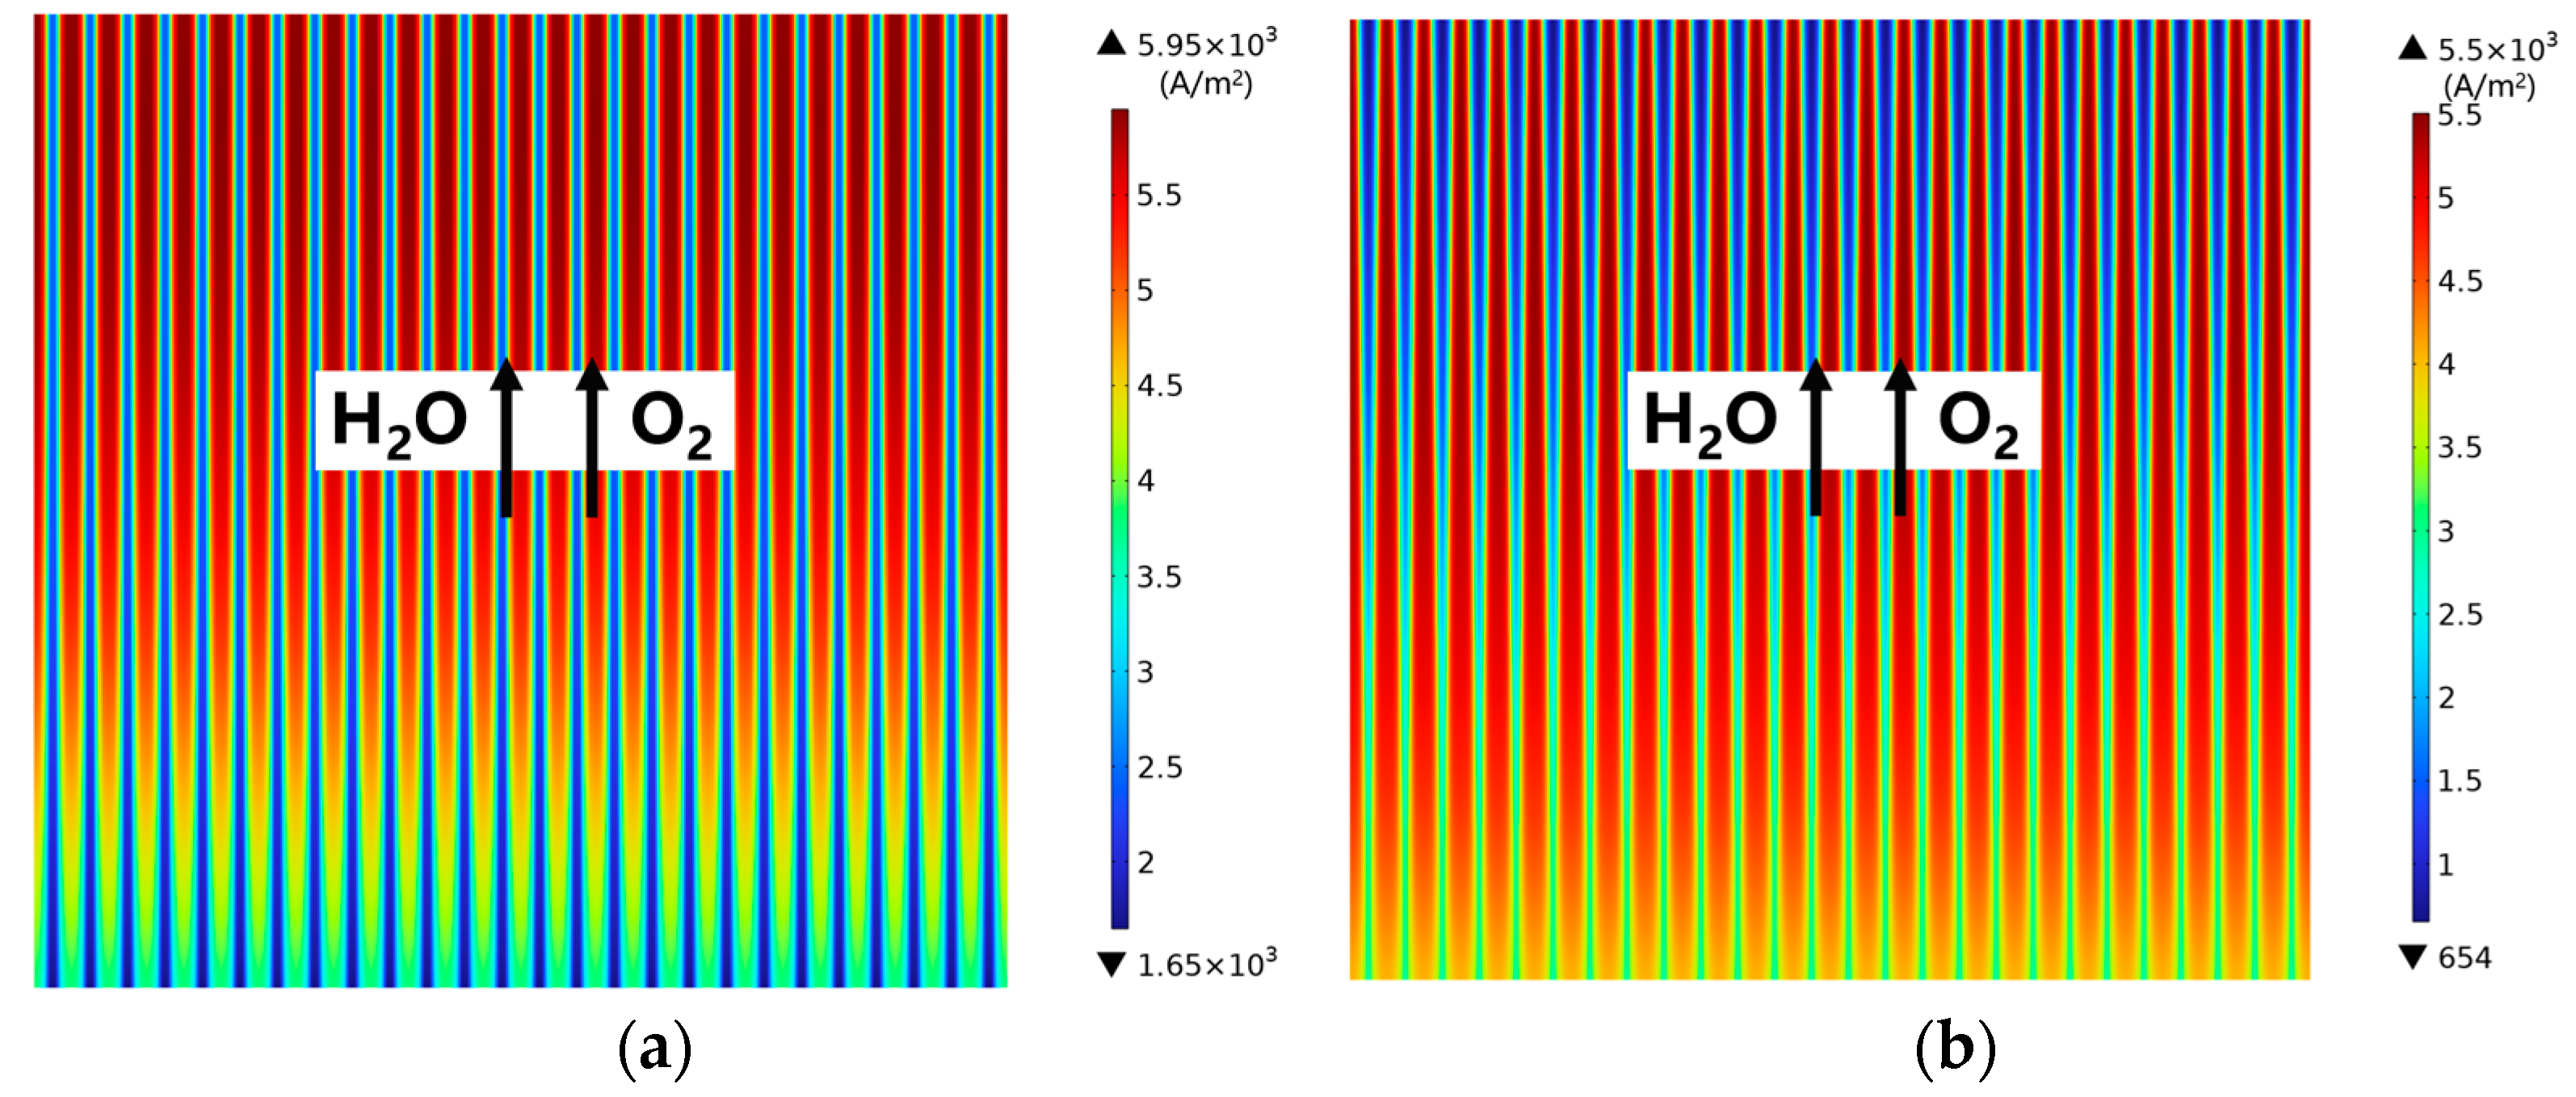
The effects of the rib/channel ratio on the electrolysis performance have been investigated. It is demonstrated in Figure 9a,b that the distribution of the generated H2 mole fraction is also similar, as found previously in Figure 5, i.e., the H2 mole fraction increases along the main flow direction from the inlet for both ratios studied. Figure 9c shows the predicted hydrogen production affected by different width ratios under two working voltages. With decreases in the rib/channel width ratio, the net H2 yield γ (defined as ratio of moles of H2 produced per mole of input H2O) is observably decreased, particularly for the operating voltage at 1.4 V. For instance, only half (i.e., 50%) of the net H2 yield is obtained for the width ratio of 2/5 compared with that for the width ratio of 5/2 at the operating voltage of 1.4 V, while it is reduced to approximately 63.8% at the operating voltage of 1.2 V. Similar to that predicted for the average current density shown in Figure 8c, the electrolysis performance is improved by 40.8% when the rib/channel width ratio is increased to 5:2 from 1:1. This is so because the improved electrical conductivity and enlarged contacting area between the ribs and electrodes caused by the wider ribs can provide higher current density to drive the electrochemical reactions.
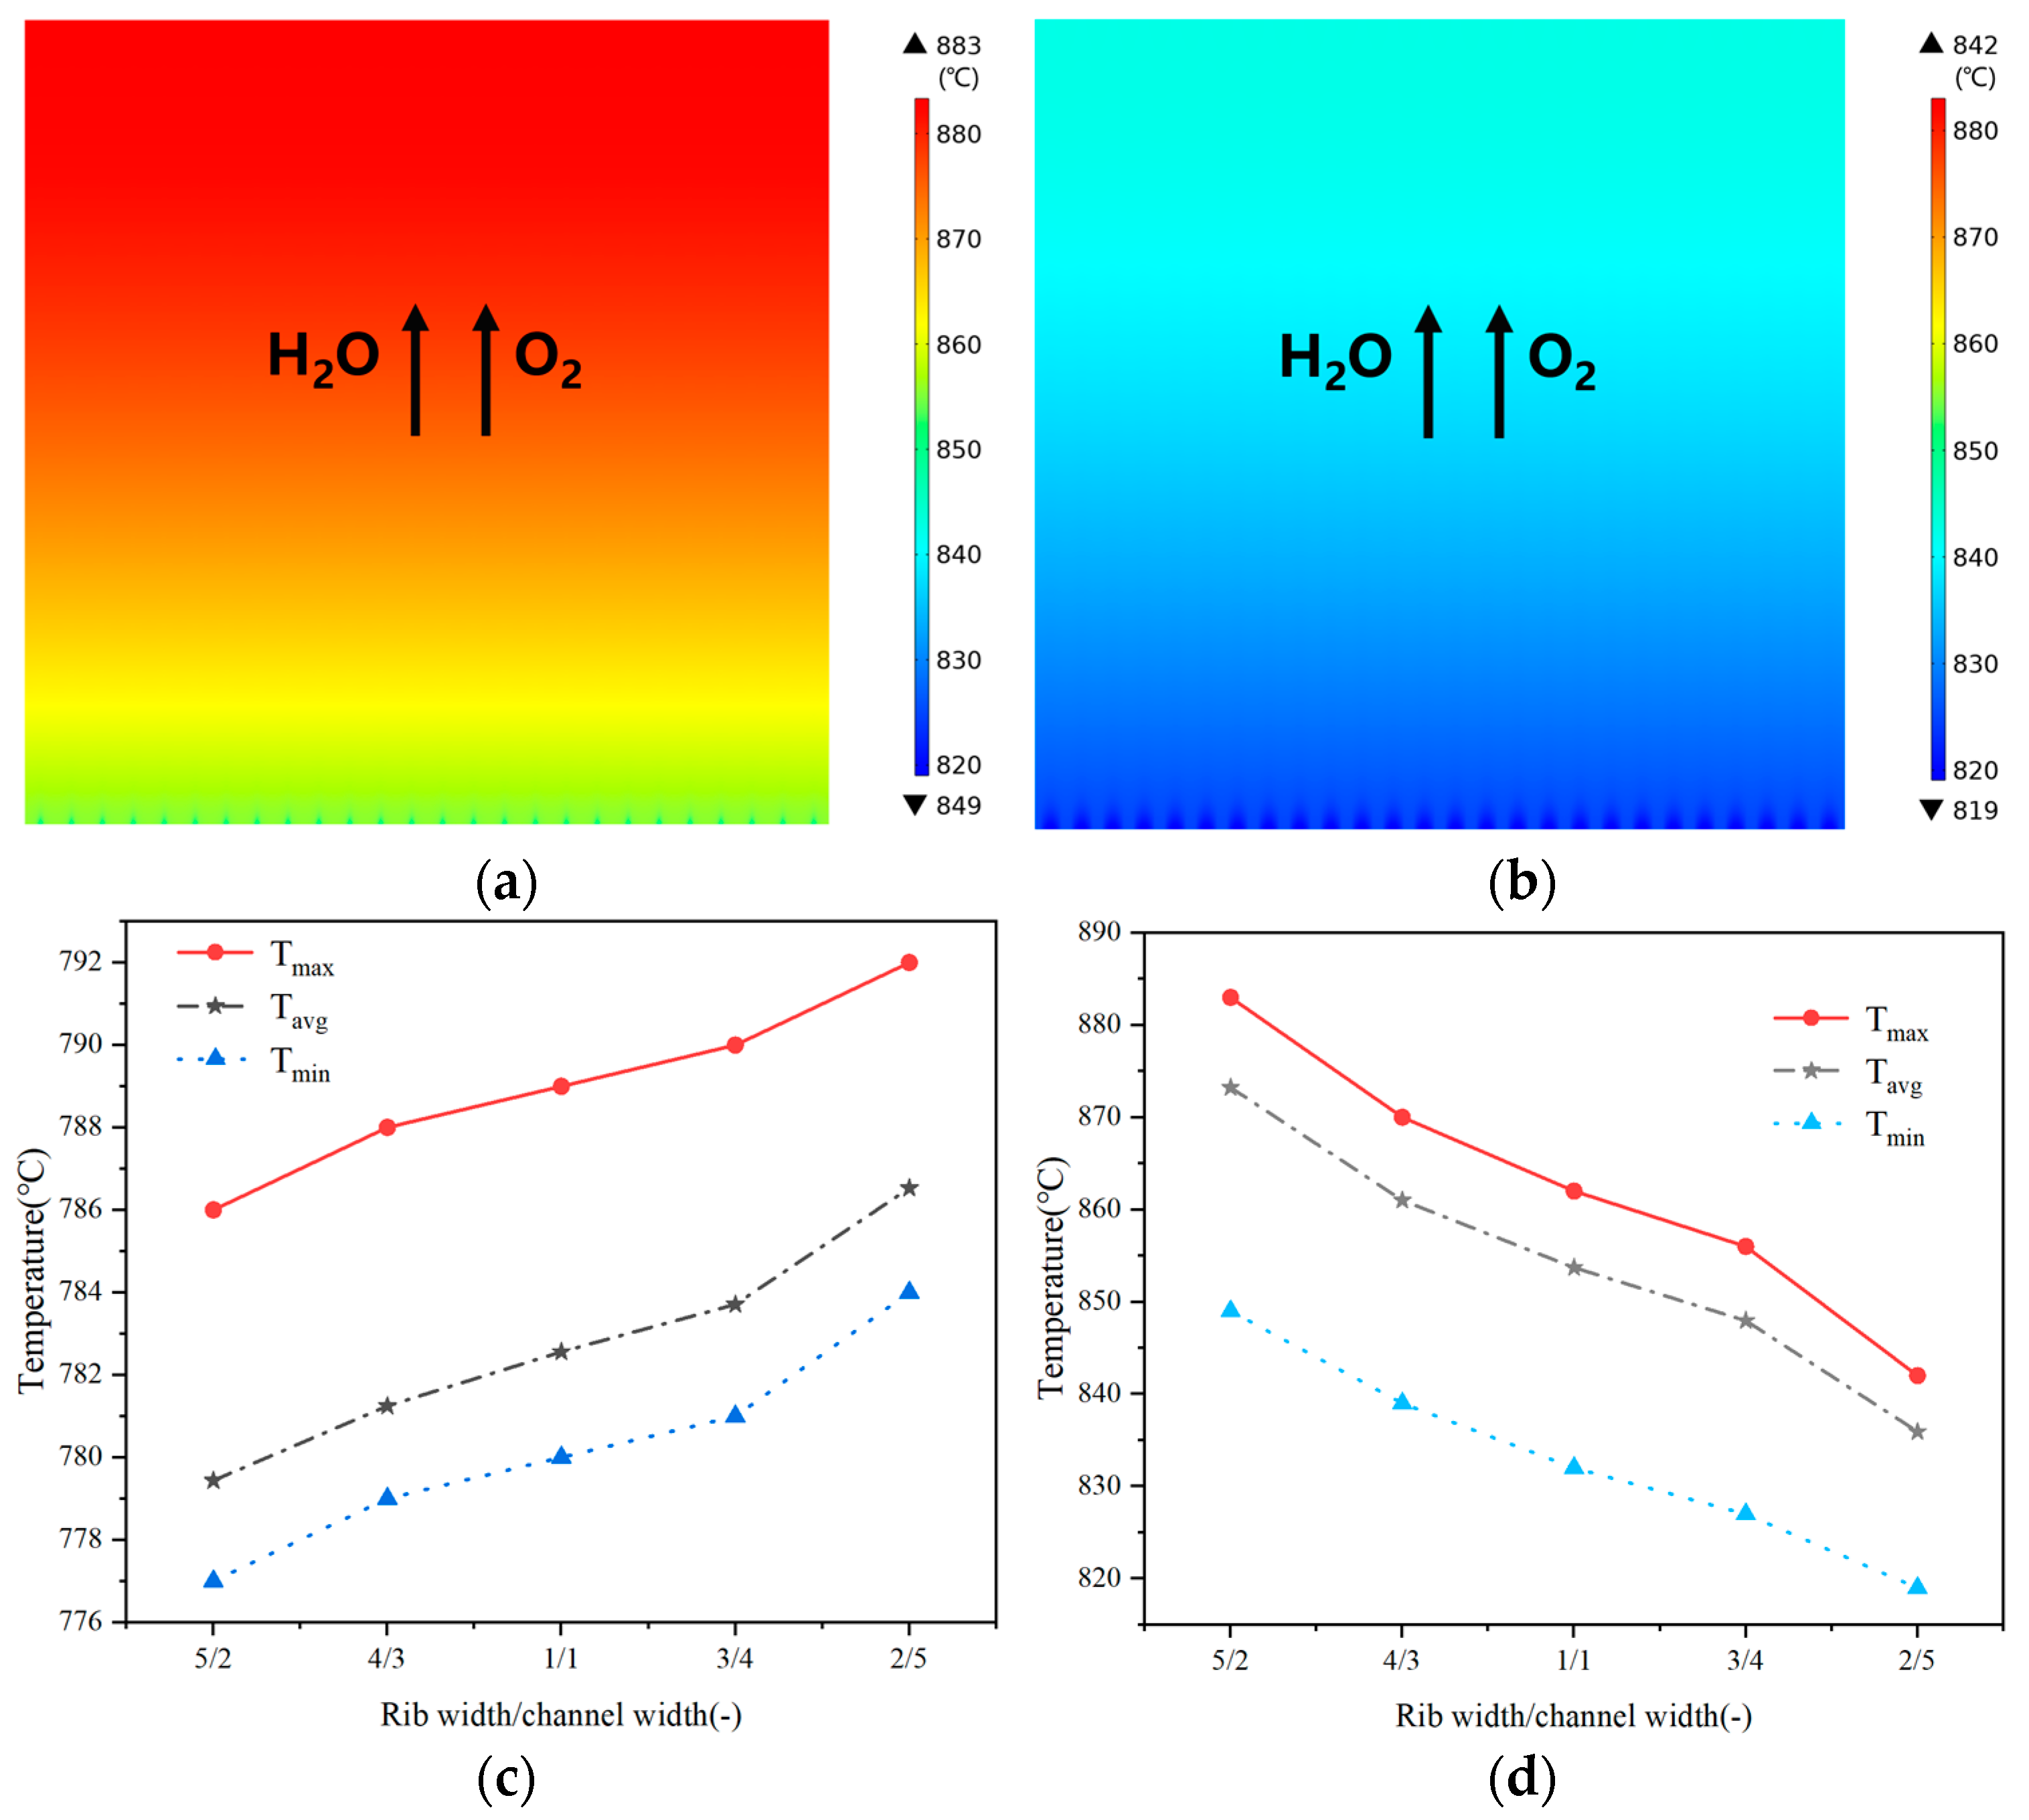
It is demonstrated in Figure 10a,b that the distribution of the predicted temperature along the electrolyte surface is similar to the one at the operating voltage of 1.4 V for both width ratios investigated, as found previously in Figure 6, i.e., the temperature increases along the main flow direction. For instance, the lowest temperature is approximately 850 °C in the inlet, while the highest one is approximately 883 °C, observed in the outlet, i.e., the temperature is increased by approximately 35 °C from the cell inlet to the outlet for the width ratio of 5/2. Meanwhile, this temperature difference (between 842 °C in the outlet and 819 °C in the inlet) is approximately 23 ℃ for the width ratio of 2/5 under the same operating conditions. In other words, the inter-connector configuration (such as the rib/channel ratio) strongly impacts the highest and the lowest temperatures, as well as the difference between them.
It is also found in Figure 10c that the highest temperature, the lowest temperature, and the averaged temperature are all increased when the rib/channel width ratio decreases under the operating voltage of 1.2 V, because the reduction in the rib width may increase the resistance to the electron flow and weaken the electrochemical reaction, leading to a reduction of the current density and the required heat. It is also a fact that all predicted temperatures are below the gas inlet temperature (i.e., 800 °C), as found in Figure 10c. As seen from Figure 10d, the highest temperature, lowest temperature, and averaged temperature are above the gas inlet temperature (i.e., 800 °C) and decrease as the rib/channel width ratio decreases under the operating voltage of 1.4 V. In other words, the temperature approaches 800 °C as the rib/channel width ratio increases. The average temperature lies between the highest and lowest temperatures but is closer to the lowest one at 1.2 V, as shown in Figure 10c, which indicates that the proportion of the lower temperature area is larger. However, the averaged temperature is closer to the highest temperature at 1.4 V, as shown in Figure 10d, which shows that the proportion of the higher temperature area is larger. It is interesting to note in Figure 10c that the temperature difference between the highest in the inlet and the lowest in the outlet is less than 10 °C throughout all width ratios; however, in Figure 10b it can be seen that this value between the highest temperature in the outlet and the lowest one in the inlet is enlarged to more than 30 °C for all the investigated width ratios if the operating voltage increases to 1.4 V. In other words, the temperature difference in the electrolysis cell is mainly affected by its operating voltage, rather than the inter-connector configuration (such as the rib/channel width ratio).
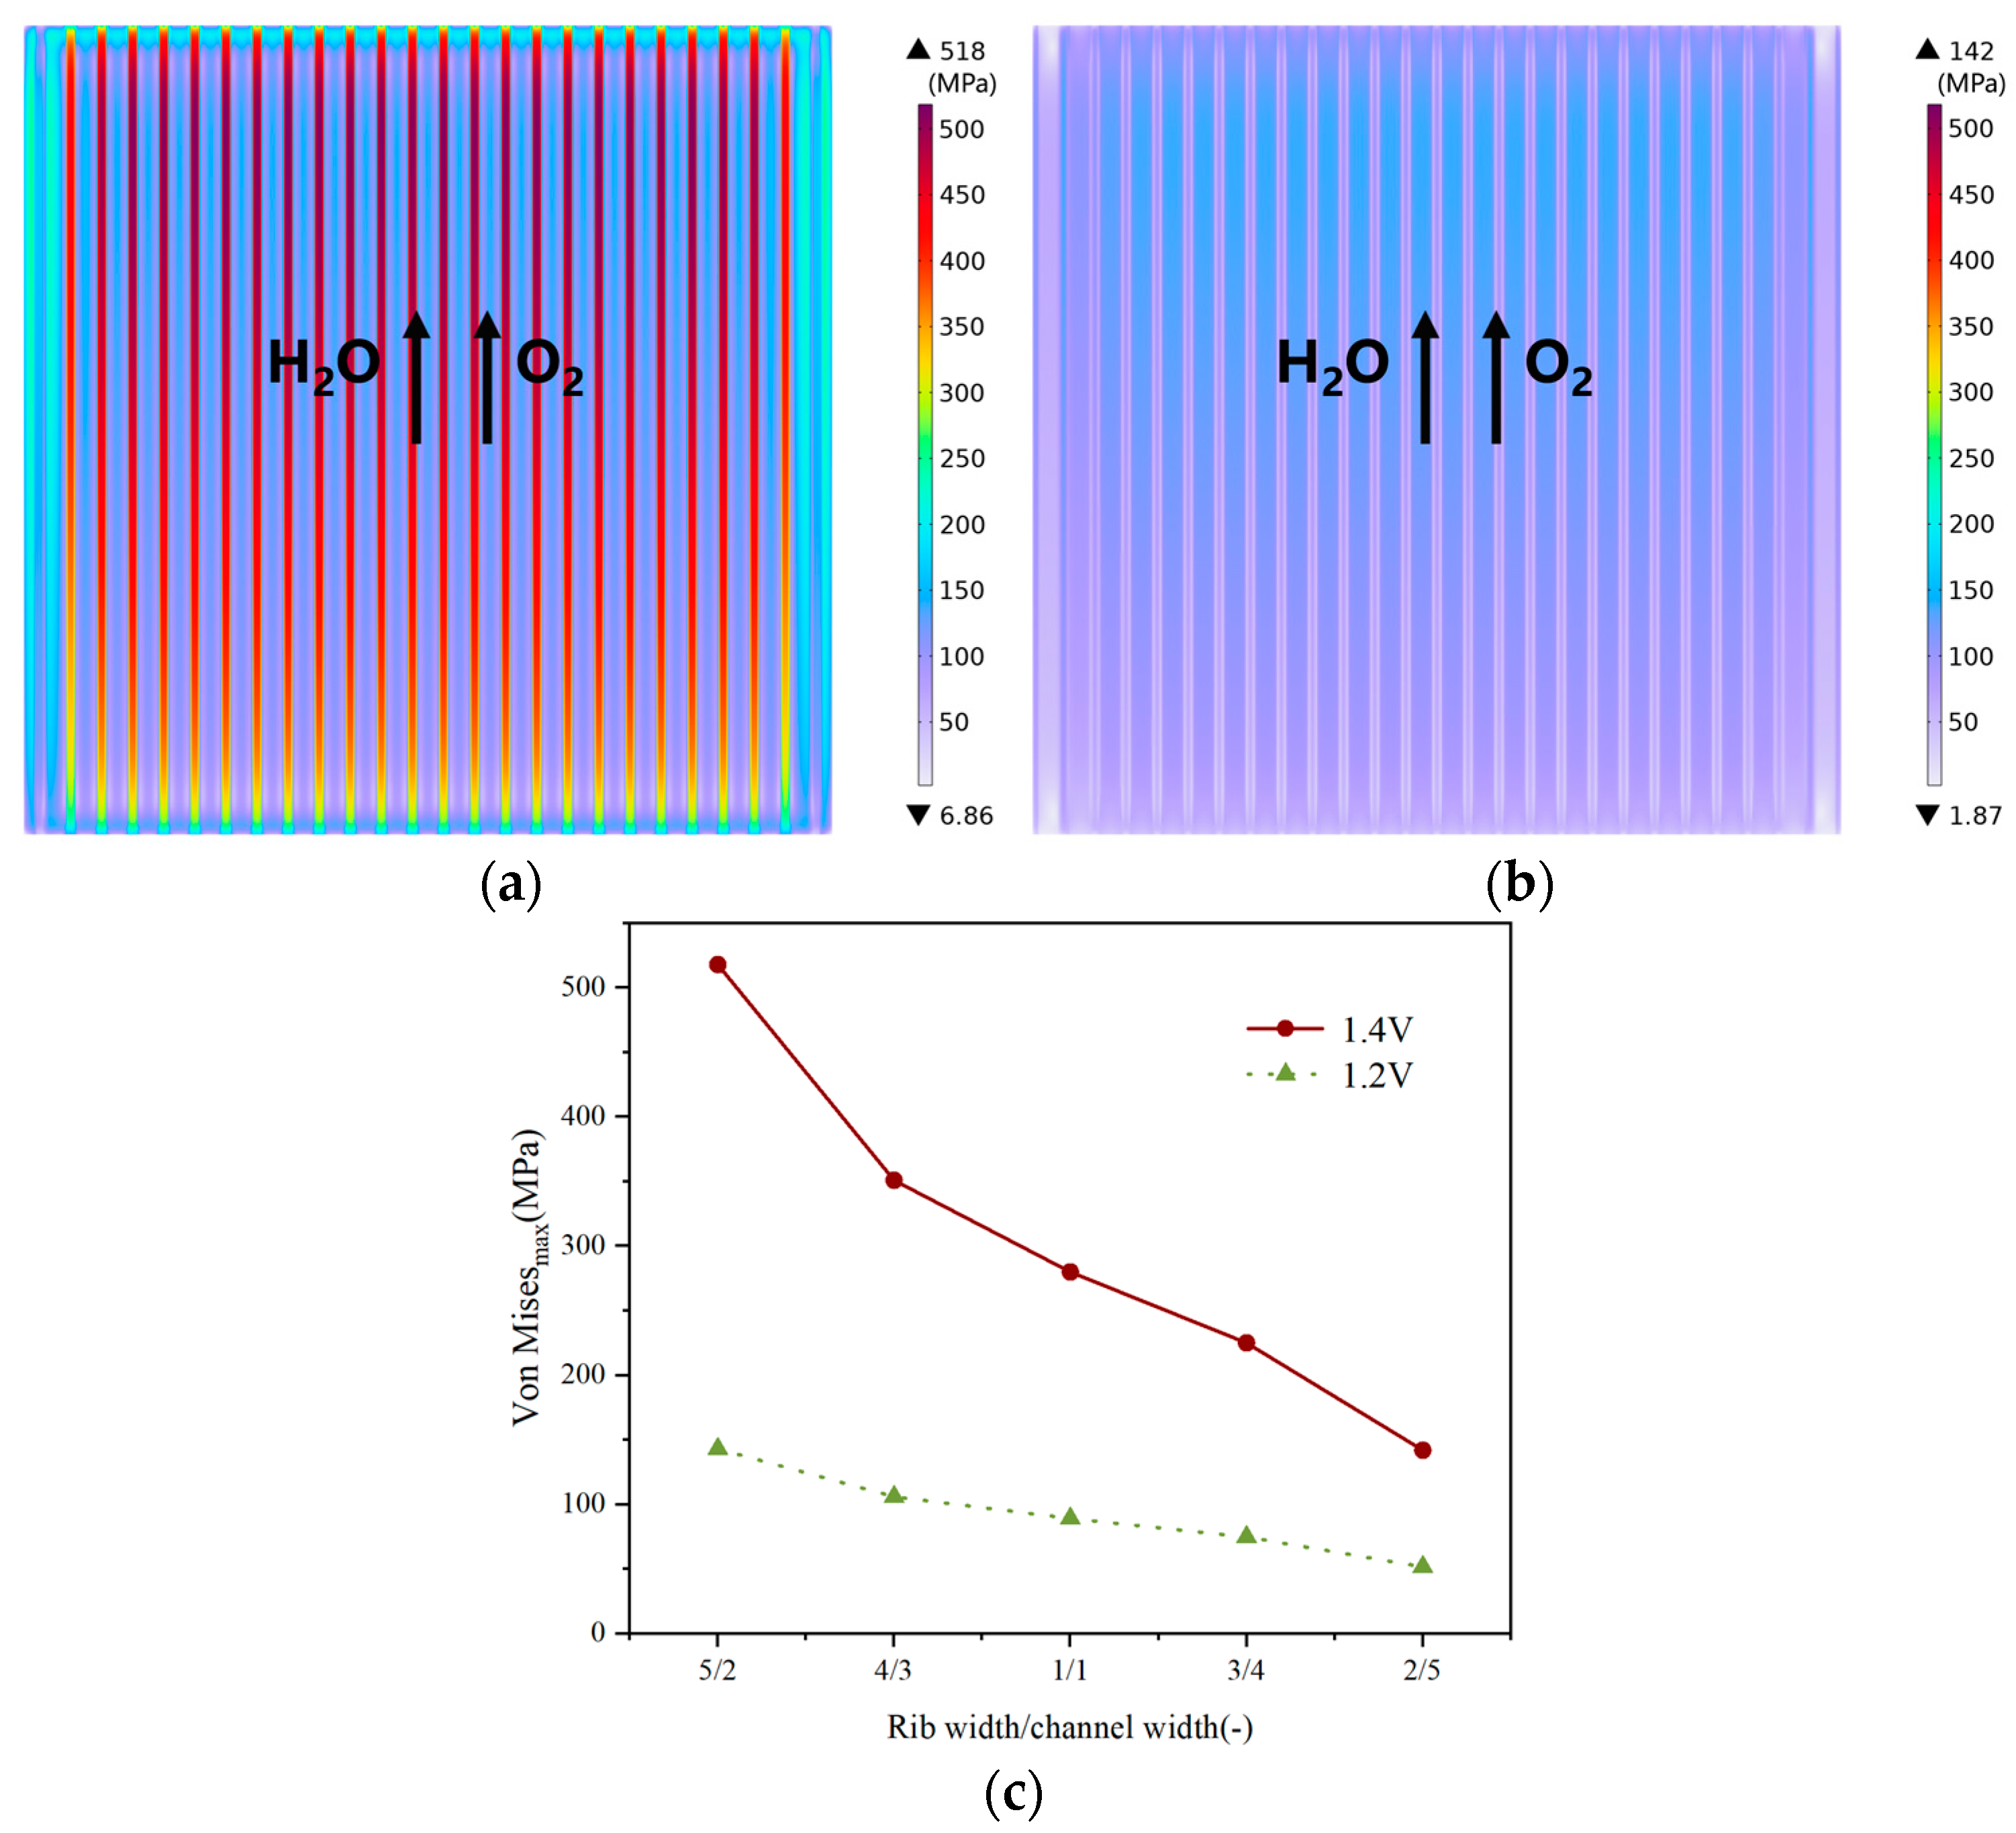
The von Mises stresses have been evaluated in Figure 11 to investigate the effects of the rib/channel ratio on the cell thermo-mechanical behavior. The area of higher thermal stress under the channels becomes larger when the rib/channel width ratio is decreased from the ratio of 5:2 in Figure 11a to 2:5 in Figure 11b. Whether the operating voltage is 1.2 V or 1.4 V, the maximum thermal stress on the electrolyte surface decreases with the rib/channel width ratio decreasing, as shown in Figure 11c. This is so because the temperature approaches 800 °C (i.e., the stress-free temperature) and there is a decrease in the contacting confinement area on the electrolyte caused by the reduced rib width with the rib/channel width ratio increasing. In other words, the narrower the ribs, the smaller the maximum thermal stress. When the operating voltage is 1.4 V, the maximum thermal stress on the electrolyte surface is more obviously affected by the rib/channel width ratio. It is revealed that the maximum thermal stress is reduced to approximately 49.0% if the rib/channel width ratio decreases to 2:5 from 1:1 at 1.4 V, while the maximum thermal stress is increased by 85.0% if the rib/channel ratio is increased to 5:2.
To sum up, the larger rib/channel width ratio is beneficial to the hydrogen production performance. However, from a thermo-mechanical behavior perspective, a larger rib/channel ratio with wider ribs may cause significant thermal stress, which should be avoided during the electrolysis cell operation. When the rib/channel width ratio is 4:3 and 5:2, the hydrogen production performance is significantly improved, as shown in Figure 8. However, when the rib/channel width ratio is 5:2, the maximum stress has a significant upward trend, increasing by 60.3% at 1.2V and 85.0% at 1.4V, while for the case with the rib width ratio of 4:3 the maximum stress only increases by 18.8% at 1.2 V and 25.4% at 1.4 V, as shown in Figure 10. Taking into account both the electrolysis and thermo-mechanical performance, the rib/channel width ratio of 4:3 is selected as the optimized configuration to balance both aspects.

3.3. Effect of Gradient Configuration and Geometry Parameters

As mentioned above, a reasonable balance is carefully evaluated to select a suitable rib/channel width ratio of 4:3 for further study of the gradient inter-connector configuration and parameters, which is defined as case-0 in the following section. Subsequently, four gradient channels are devised with the aim of identifying potential enhancements on the overall cell performance. All the cases studied are shown in Figure 12 and Table 6. It is noted that, for the cases studied, the total volume of each channel and the contacting area between the ribs and the electrolyte layer are kept constant.
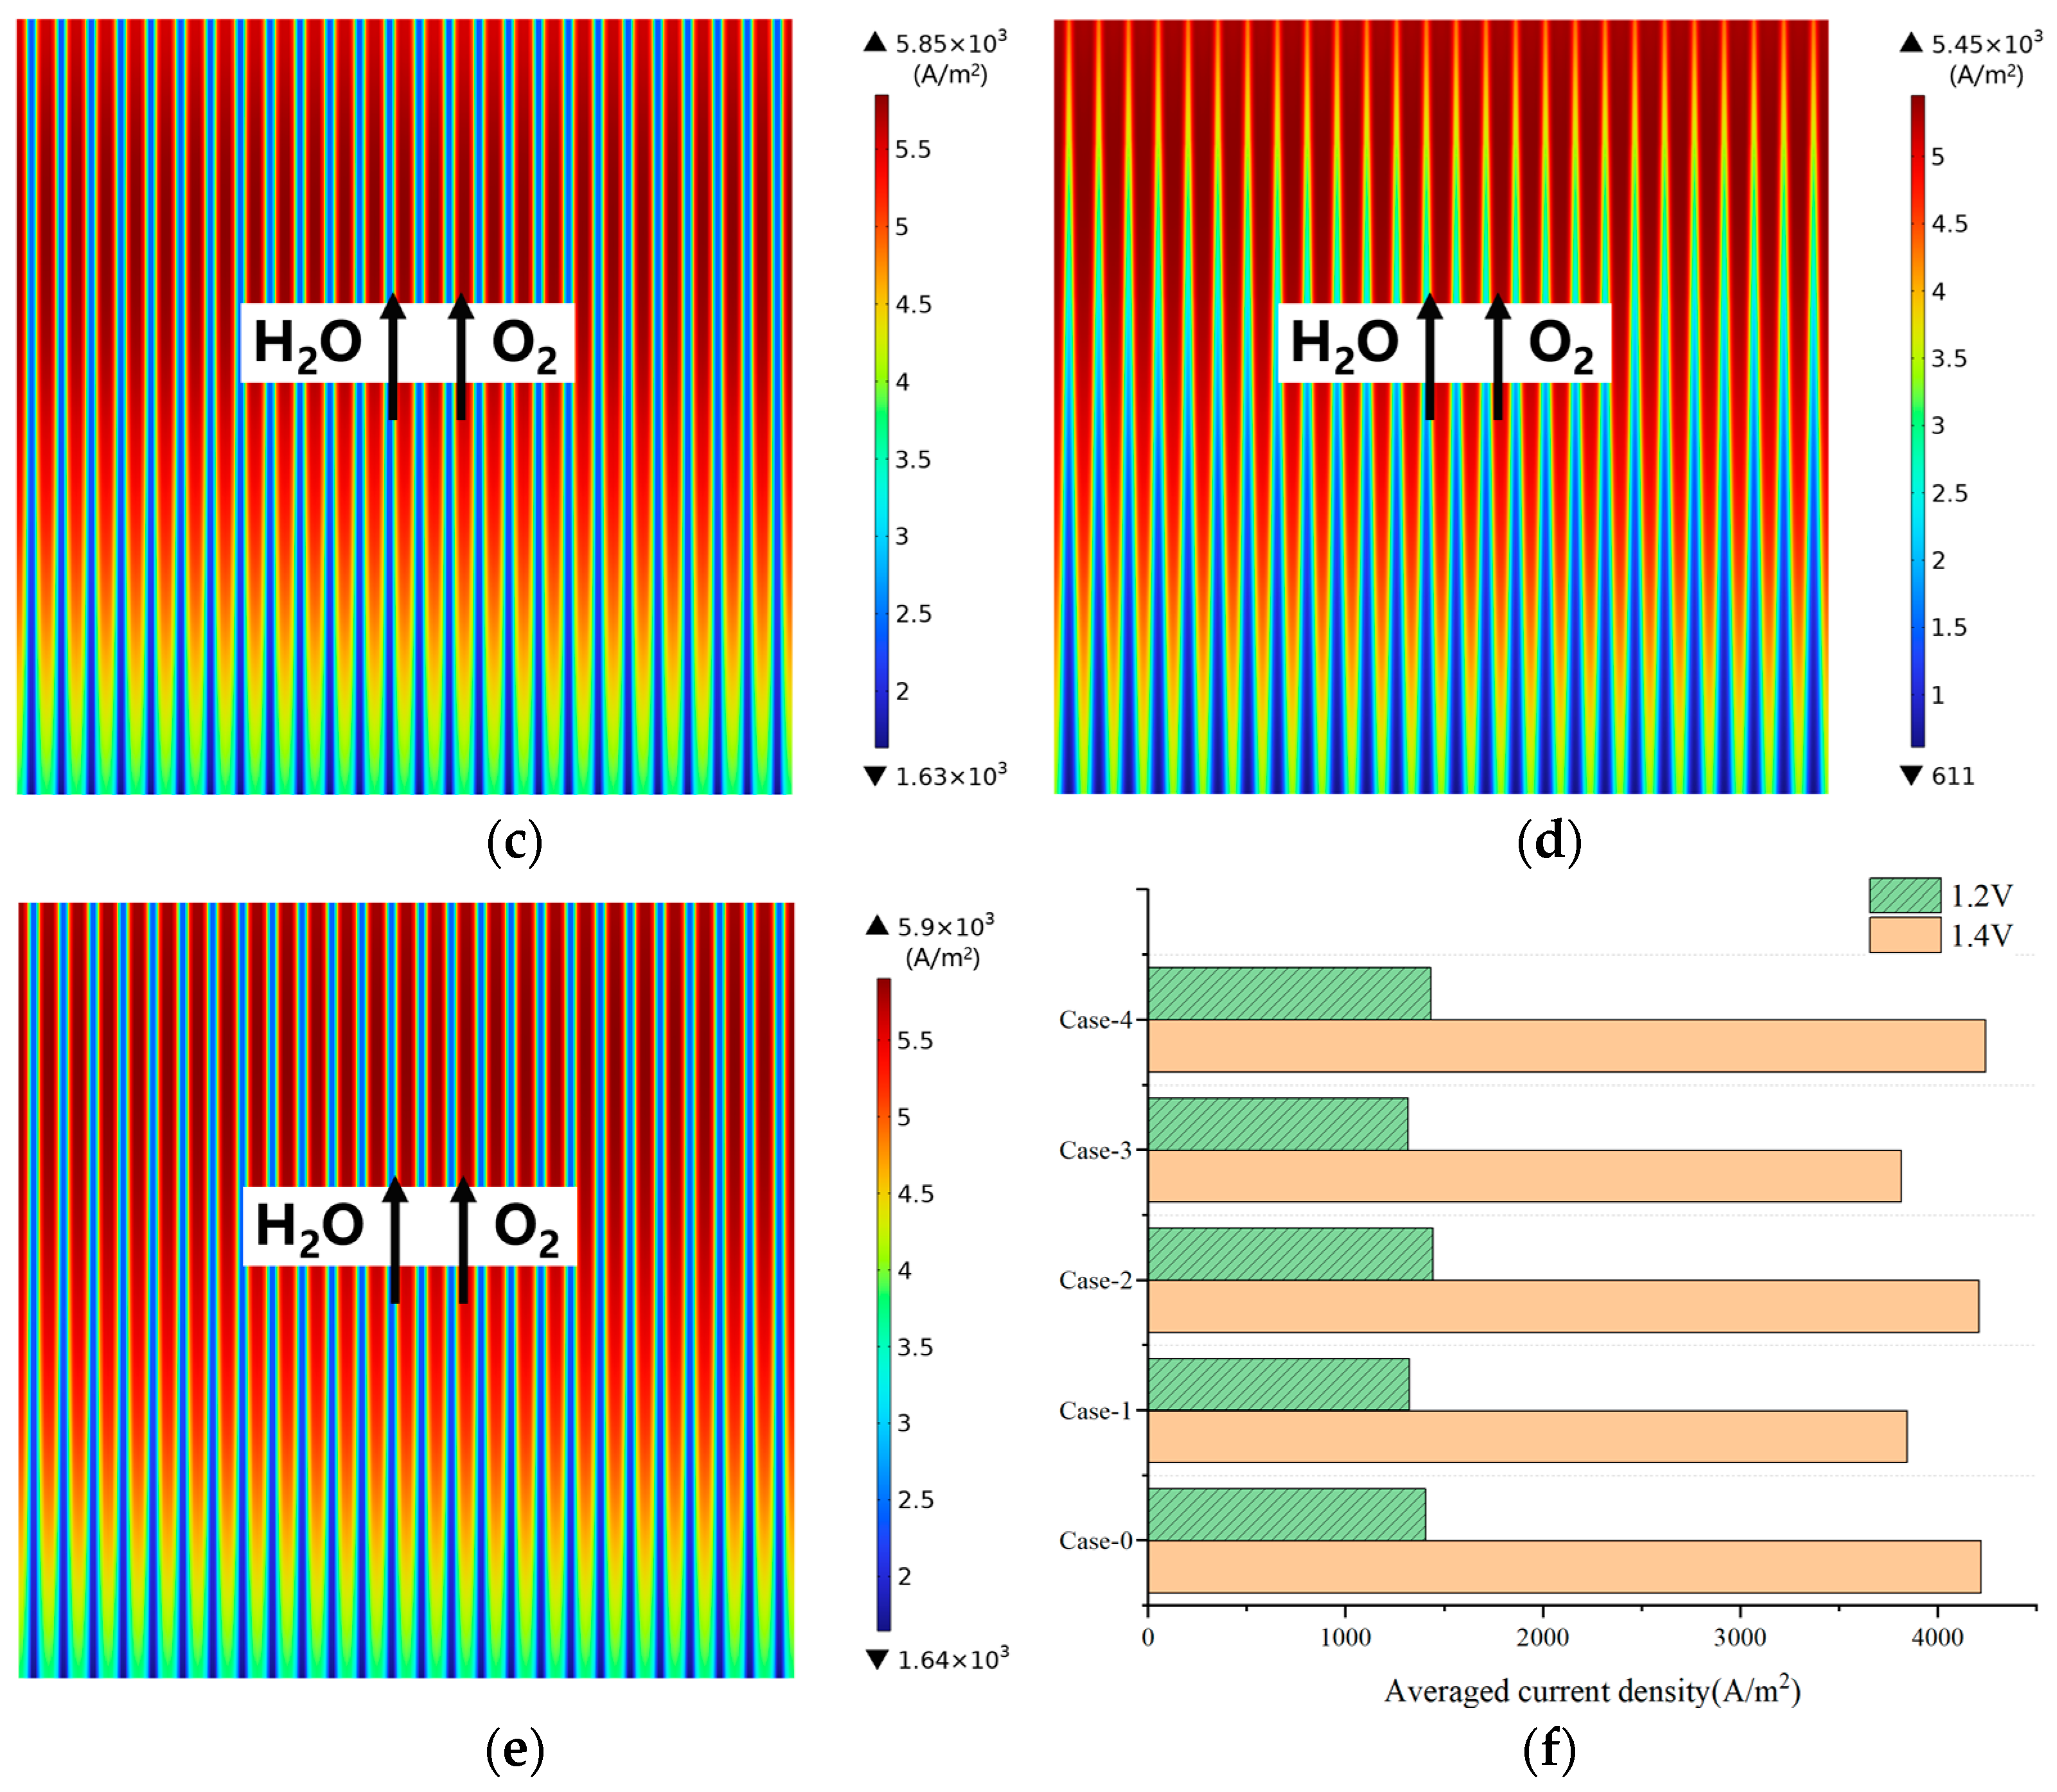
The distribution of the electrolysis current density shows similar trends (i.e., the current density predicted under the ribs is higher than that under the channels) when the gradient configuration is applied, as shown in Figure 13a–e. Compared with Figure 13a for case-0, it can be observed that there is a reduction in the current density throughout the cell active area, as shown in Figure 13b for the current density distribution in case-1, i.e., channel expanding in the width direction. Meanwhile, the current density under the channels in case-1 is higher than that in case-0, especially in the entrance region, which leads to a more even current density distribution in this region. This is due to the enlarged contacting area between the electrolyte and the ribs, which reduces the resistance to the electron flow in the entrance region. However, the value for the maximum and minimum current density are decreased, particularly in the entrance region. It is found that the minimum value is only about one third of that obtained in case-0 with the traditional channels.
Figure 13c illustrates the current density distribution for case-2, i.e., the channel expanding in the thickness direction. It is noted that the maximum and minimum current densities are almost the same as that for case-0, because the contacting area between the ribs and the electrolyte is not changed in case-2.
Figure 13d shows the current density distribution for case-3, i.e., channel shrinking in the width direction. It is a fact that the high current density is mainly observed in the outlet region, which is almost the same compared with that for case-1 in Figure 13b, while the lower current density appears in the entrance region compared with that for case-1. It is also clear that the current density distribution becomes more even in the outlet region but much worse in the inlet region, compared with that for the other cases shown in Figure 13a–c.
The current density distribution obtained in case-4 (Figure 13e), with the channel shrinking in the thickness direction, is almost the same as that for case-2, as shown in Figure 13c. Figure 13f shows the averaged current density predicted for various cases, and it can be seen that the overall difference is rather small, especially at the operating voltage of 1.2 V, which is mainly due to the small change in the total contacting area between the ribs and the electrode in the specific cases investigated.
In summary, the overall change on the averaged electrolysis current density is rather small for the various gradient rib geometry parameters, while case-1, with the channel expanding in the width direction, may achieve a more-even current density with a reduction in the minimum current density in the entrance region.
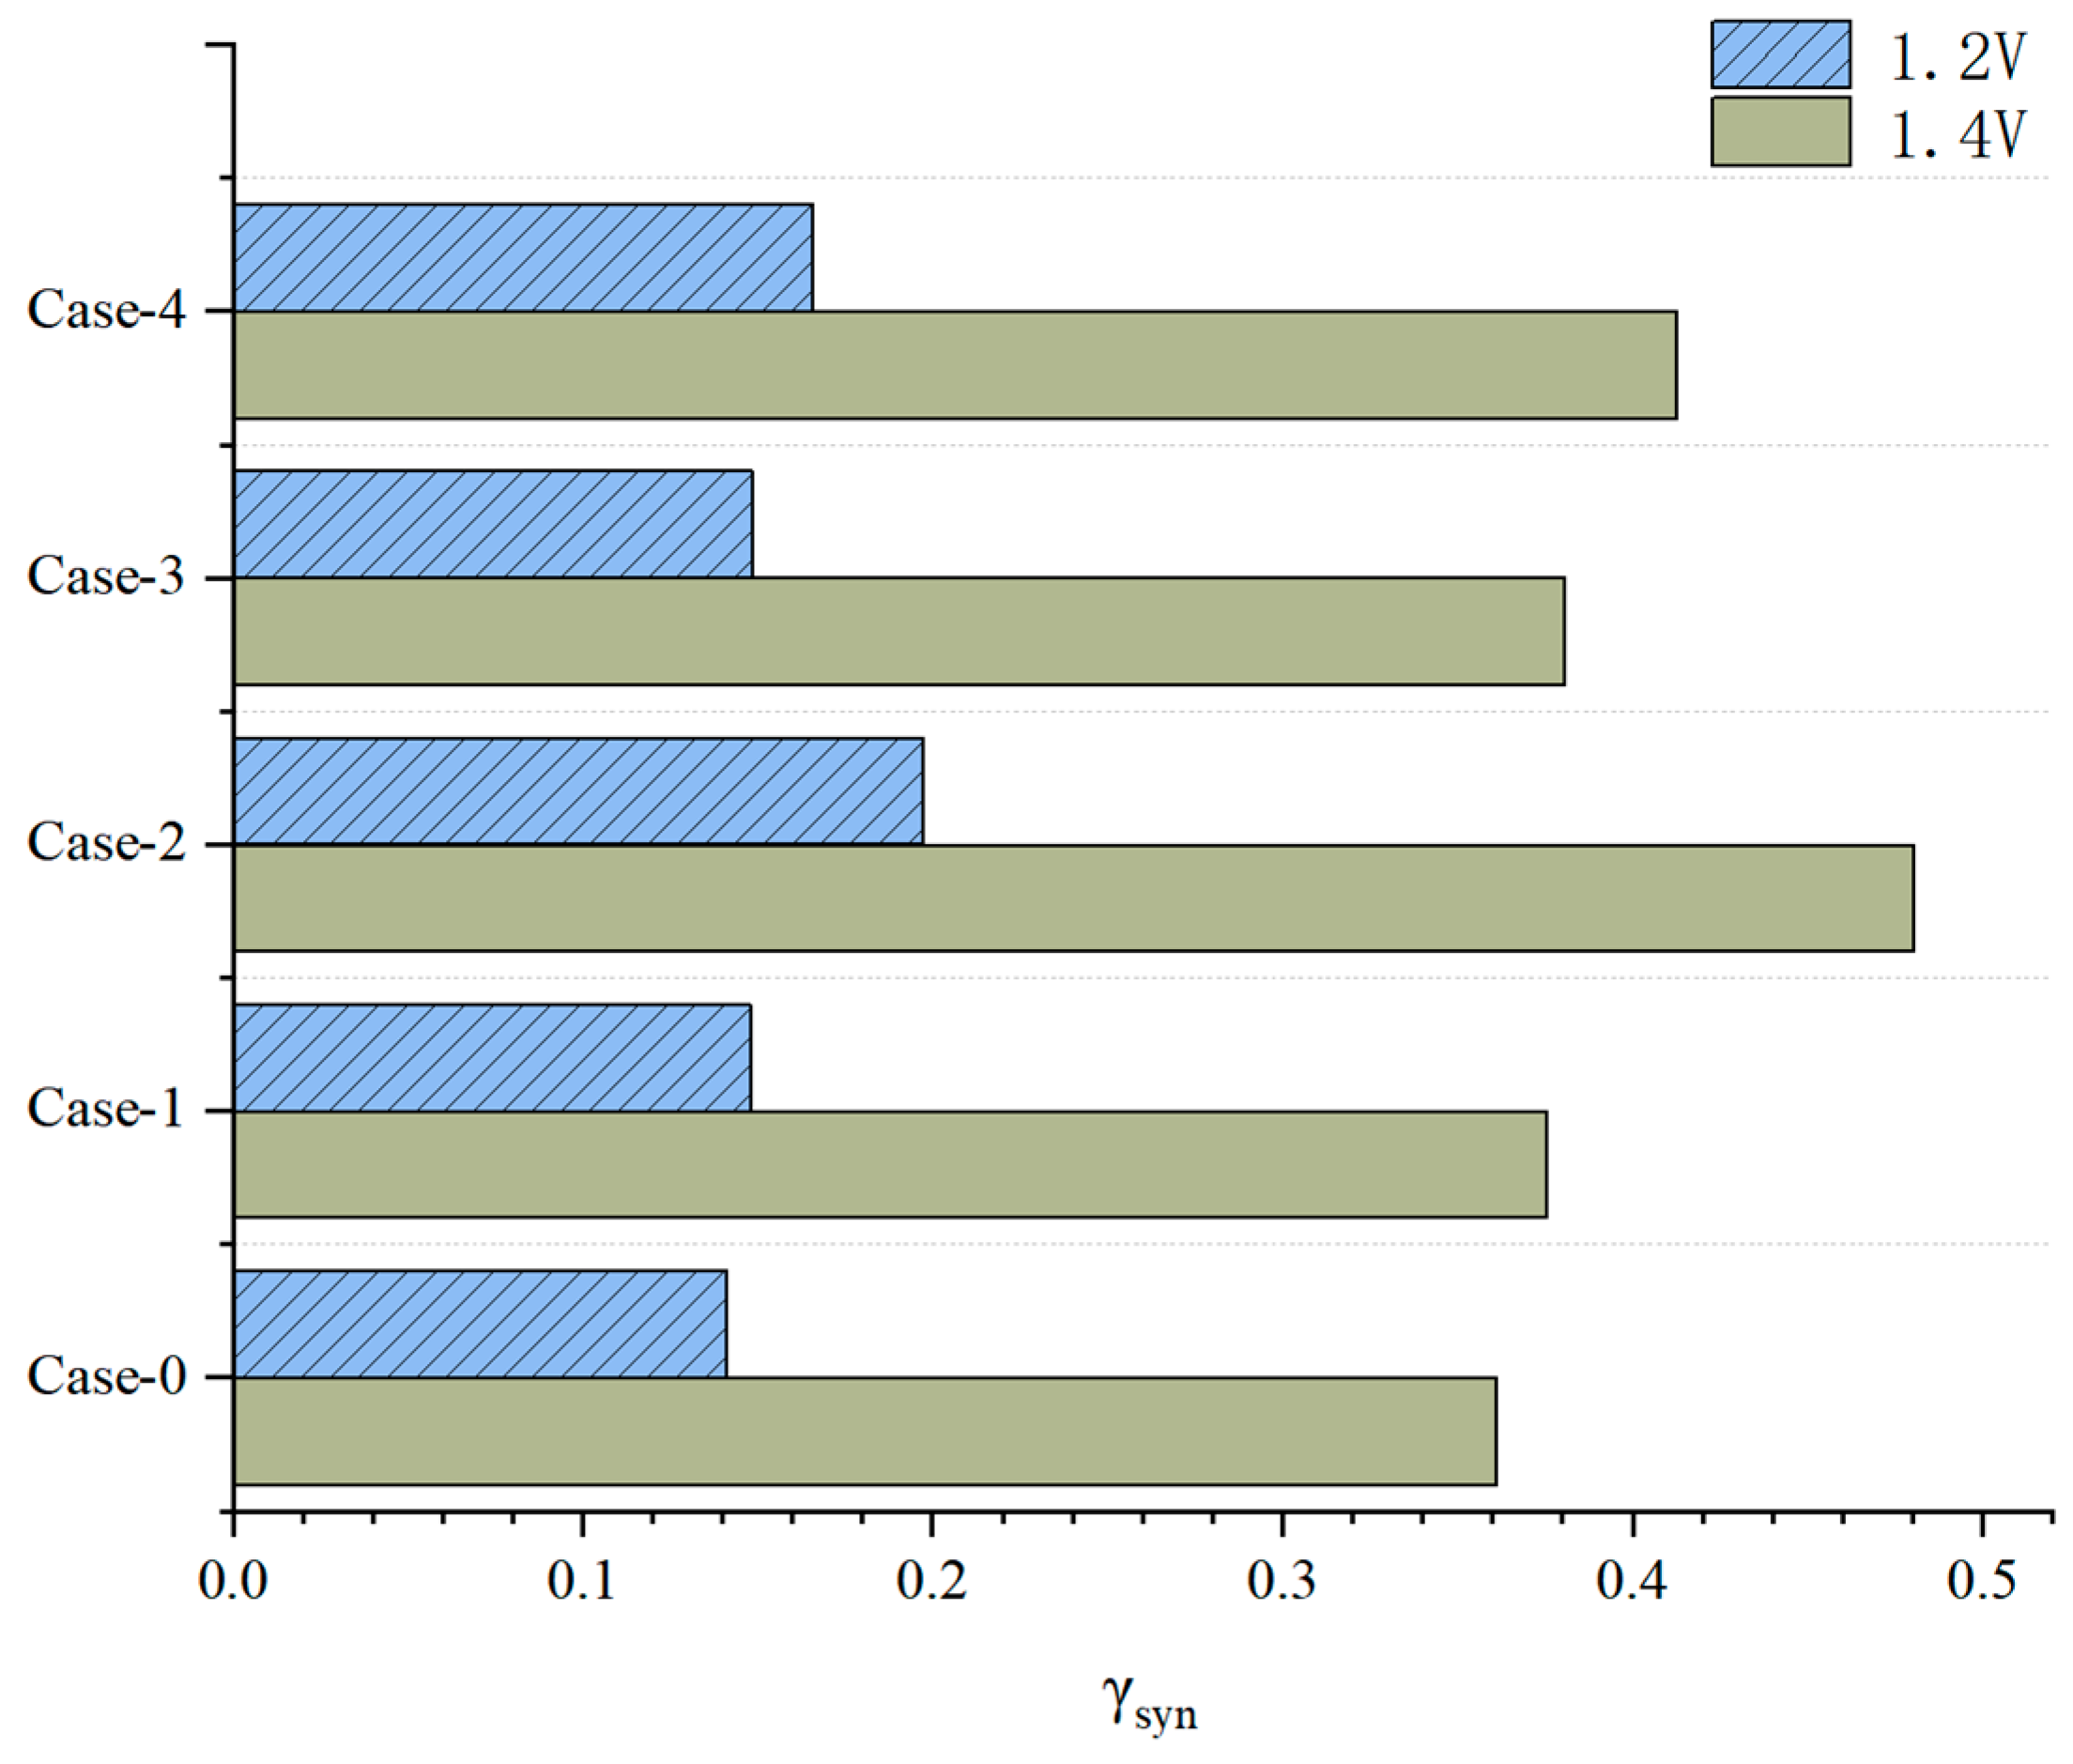
The effect of the gradient channel configuration and geometry parameters on the electrolysis performance is investigated and presented by the net H2 yield γ (defined as ratio of moles of H2 produced per mole of input H2O), as shown in Figure 14. It can be seen that the hydrogen production is improved to a certain degree when the new channel configuration is adopted. Overall, the influence of the channel geometry parameters changing in the thickness direction (i.e., case-2 and case-4) on the hydrogen production performance is more obvious than that in case-1 and case-3, with the channel gradient in the thickness direction. For instance, for case-2, the hydrogen production performance is significantly improved by 30% at 1.4 V, which is the best case in terms of the electrolysis performance, and the hydrogen production performance is only improved by 4.0% and 5.4% for case-1 and case-3, respectively.
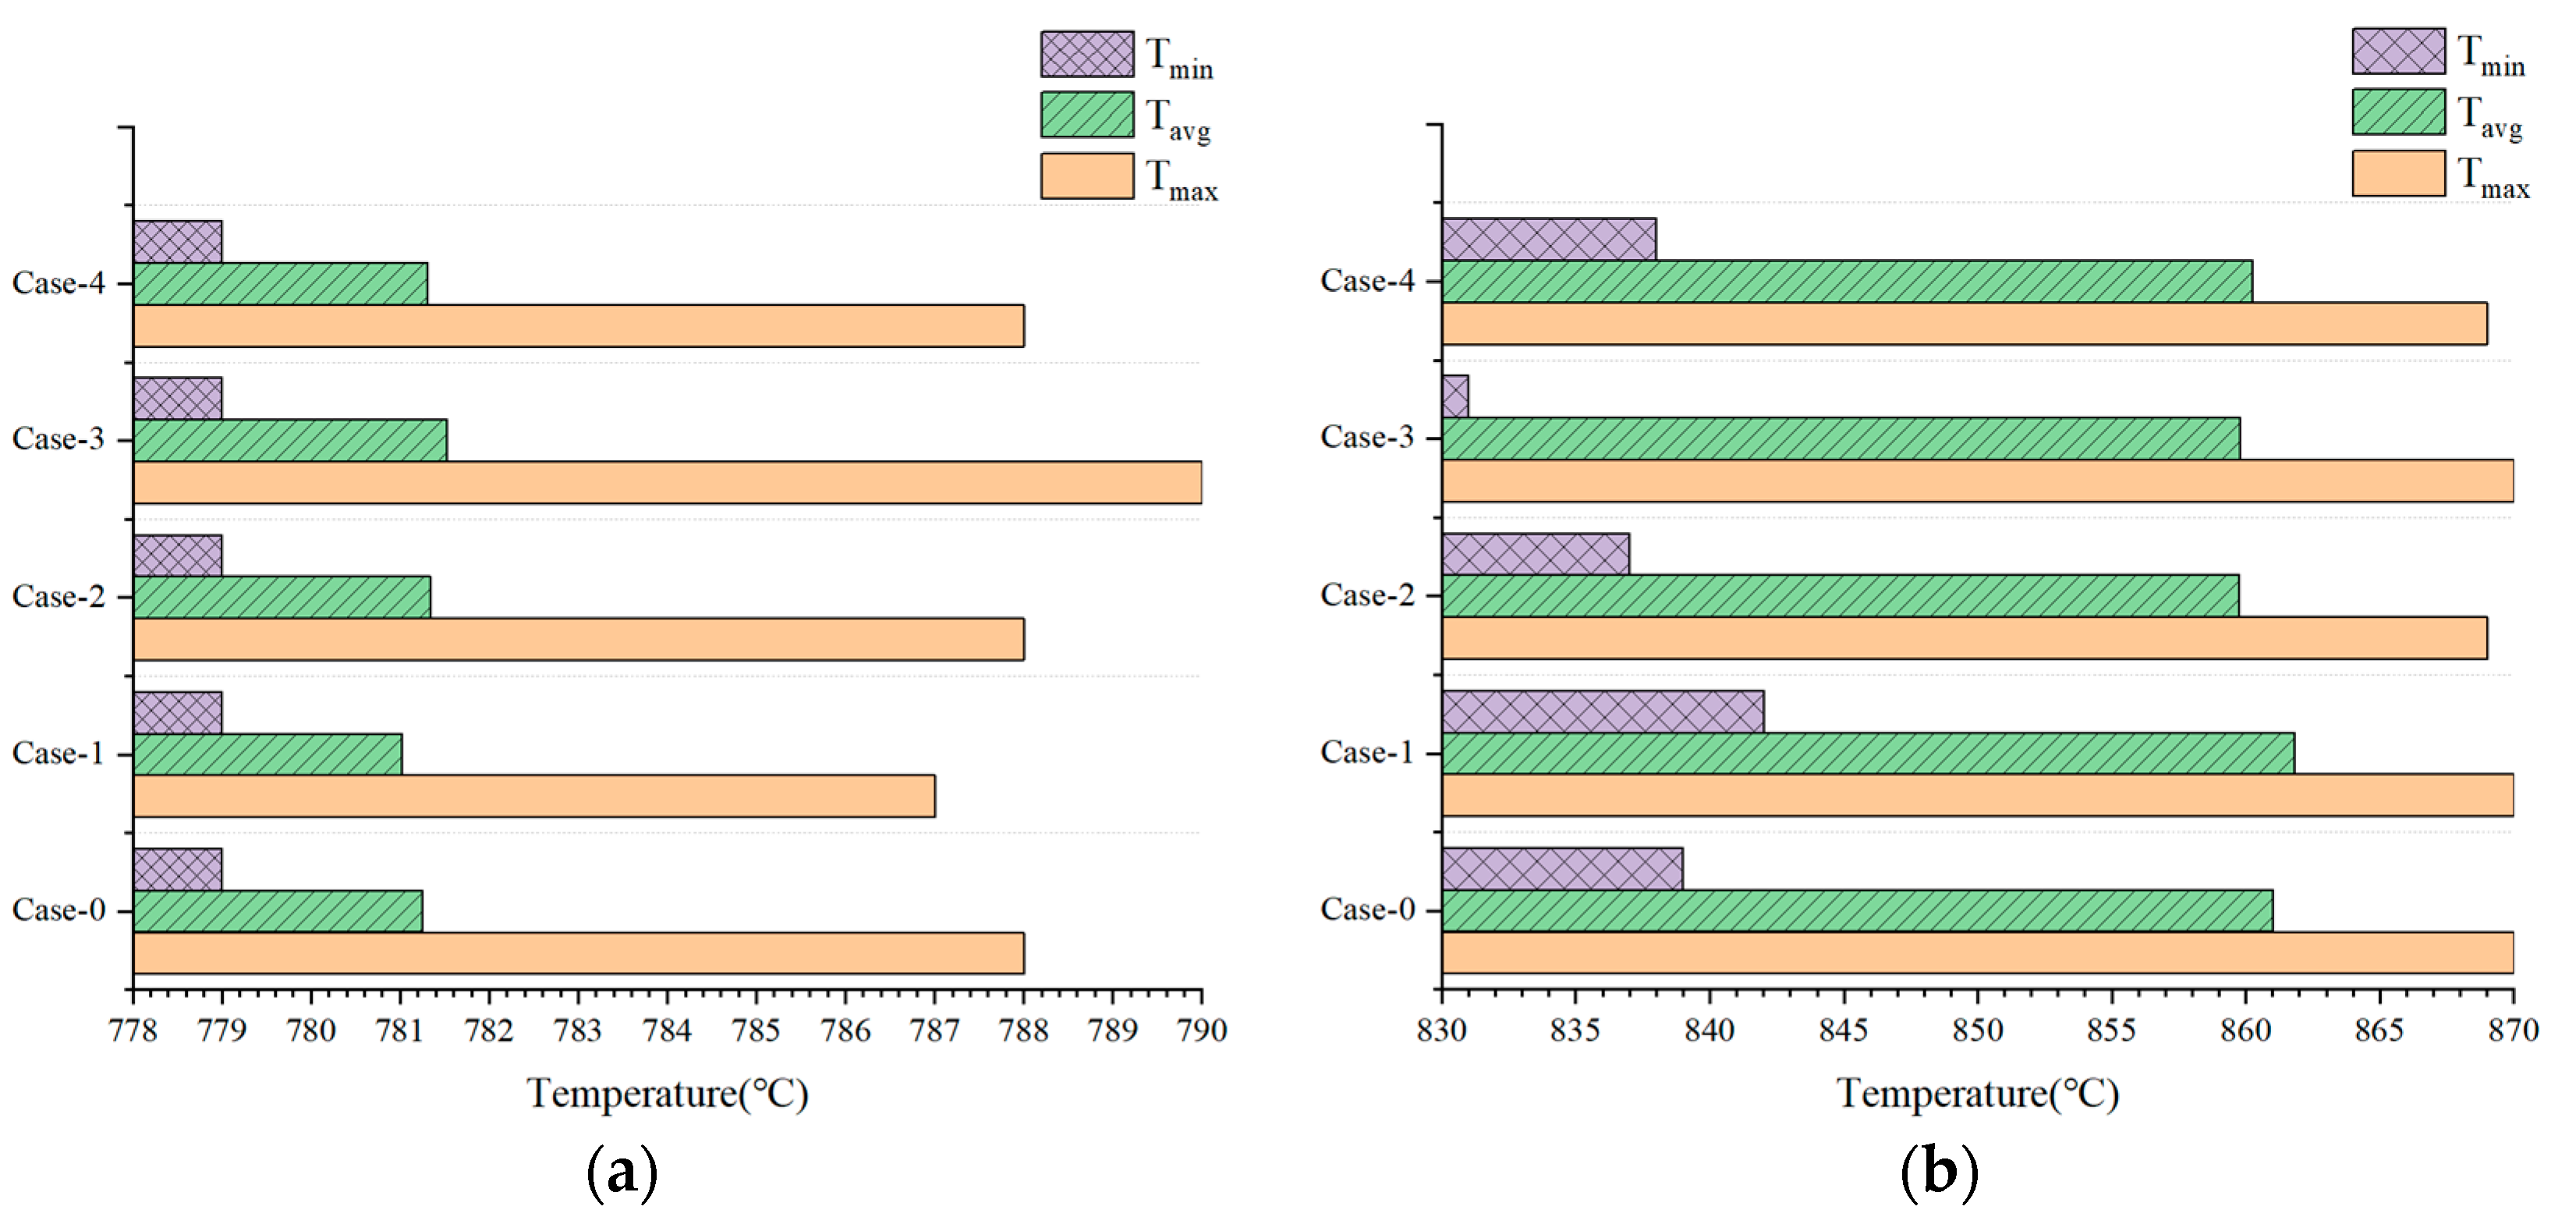
As shown in Figure 15a, there is no obvious change in the highest, lowest, or averaged temperatures at the electrolysis operating voltage of 1.2 V when the gradient channel configuration is adopted, with the maximum difference being approximately 3 °C. Meanwhile, the difference becomes slightly larger if the cell is operated at 1.4 V, as shown in Figure 15b. For instance, the lowest temperature obtained in case-3 is approximately 10 °C lower than that in case-1 (see Figure 15b), which is affected by the reduced but evenly distributed current density shown in Figure 13b. It is also noted that the largest difference in the highest and the lowest temperatures is approximately 40 °C, identified for case-3 in Figure 15b, while it is only approximately 10 °C in Figure 15a for the same channel configuration, if the operating voltage increases from 1.2 V to 1.4 V. In other words, the cell temperature difference between the highest and the lowest values becomes four times larger if the operating voltage is shifted from below to above the thermoneutral state for the extreme cell configuration in case-3.
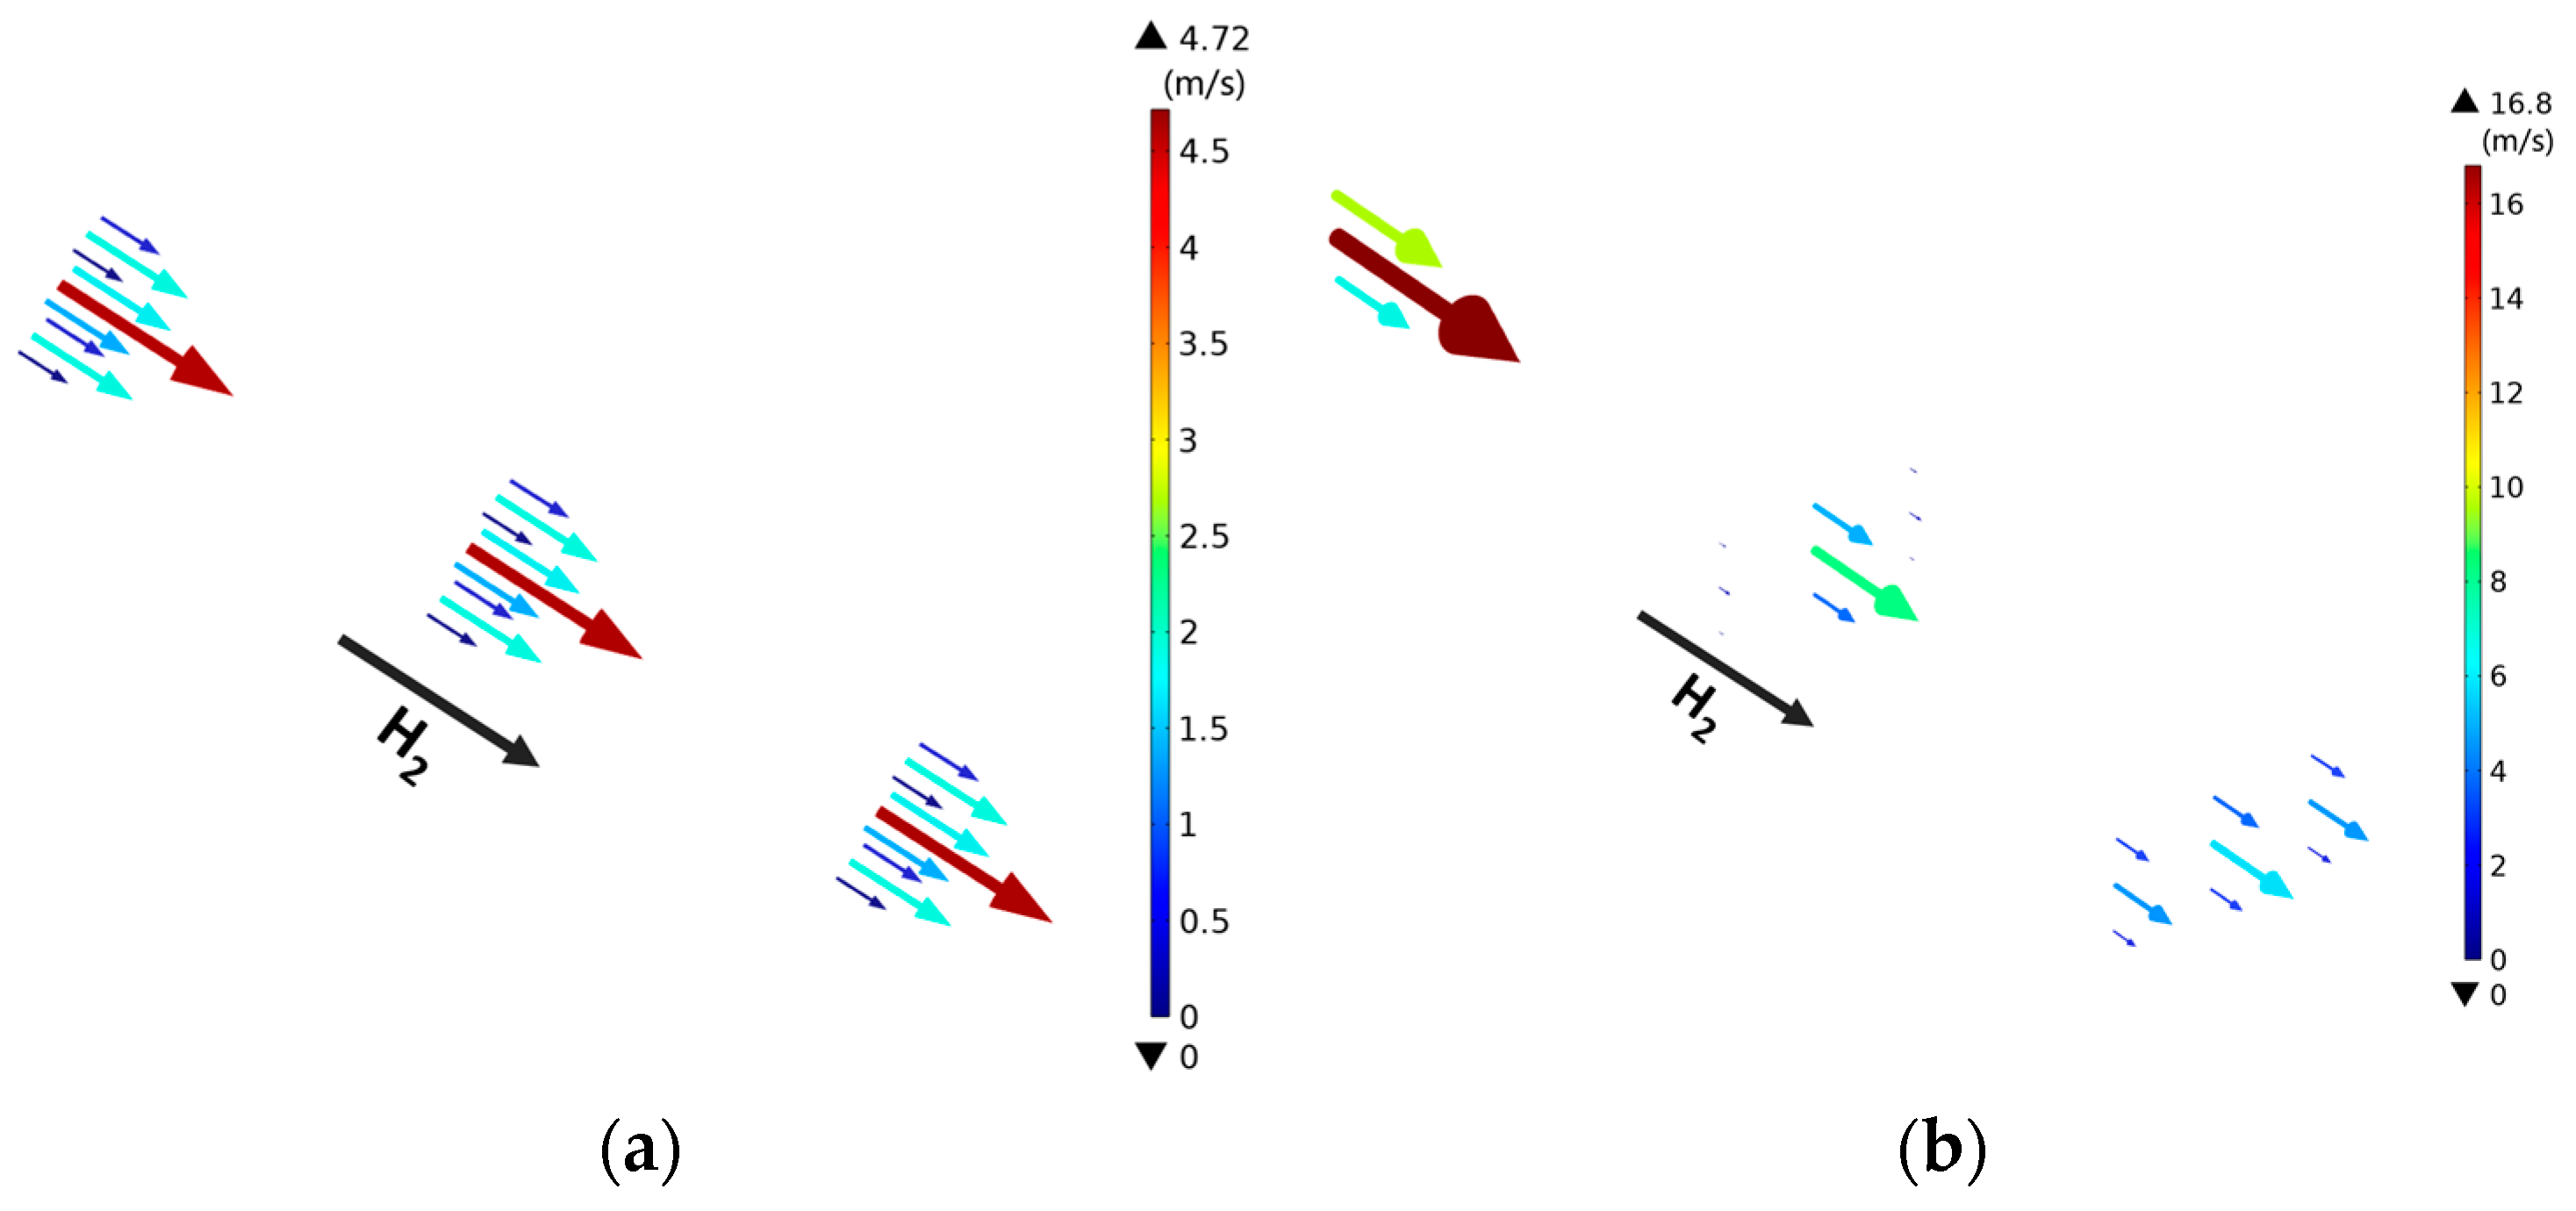
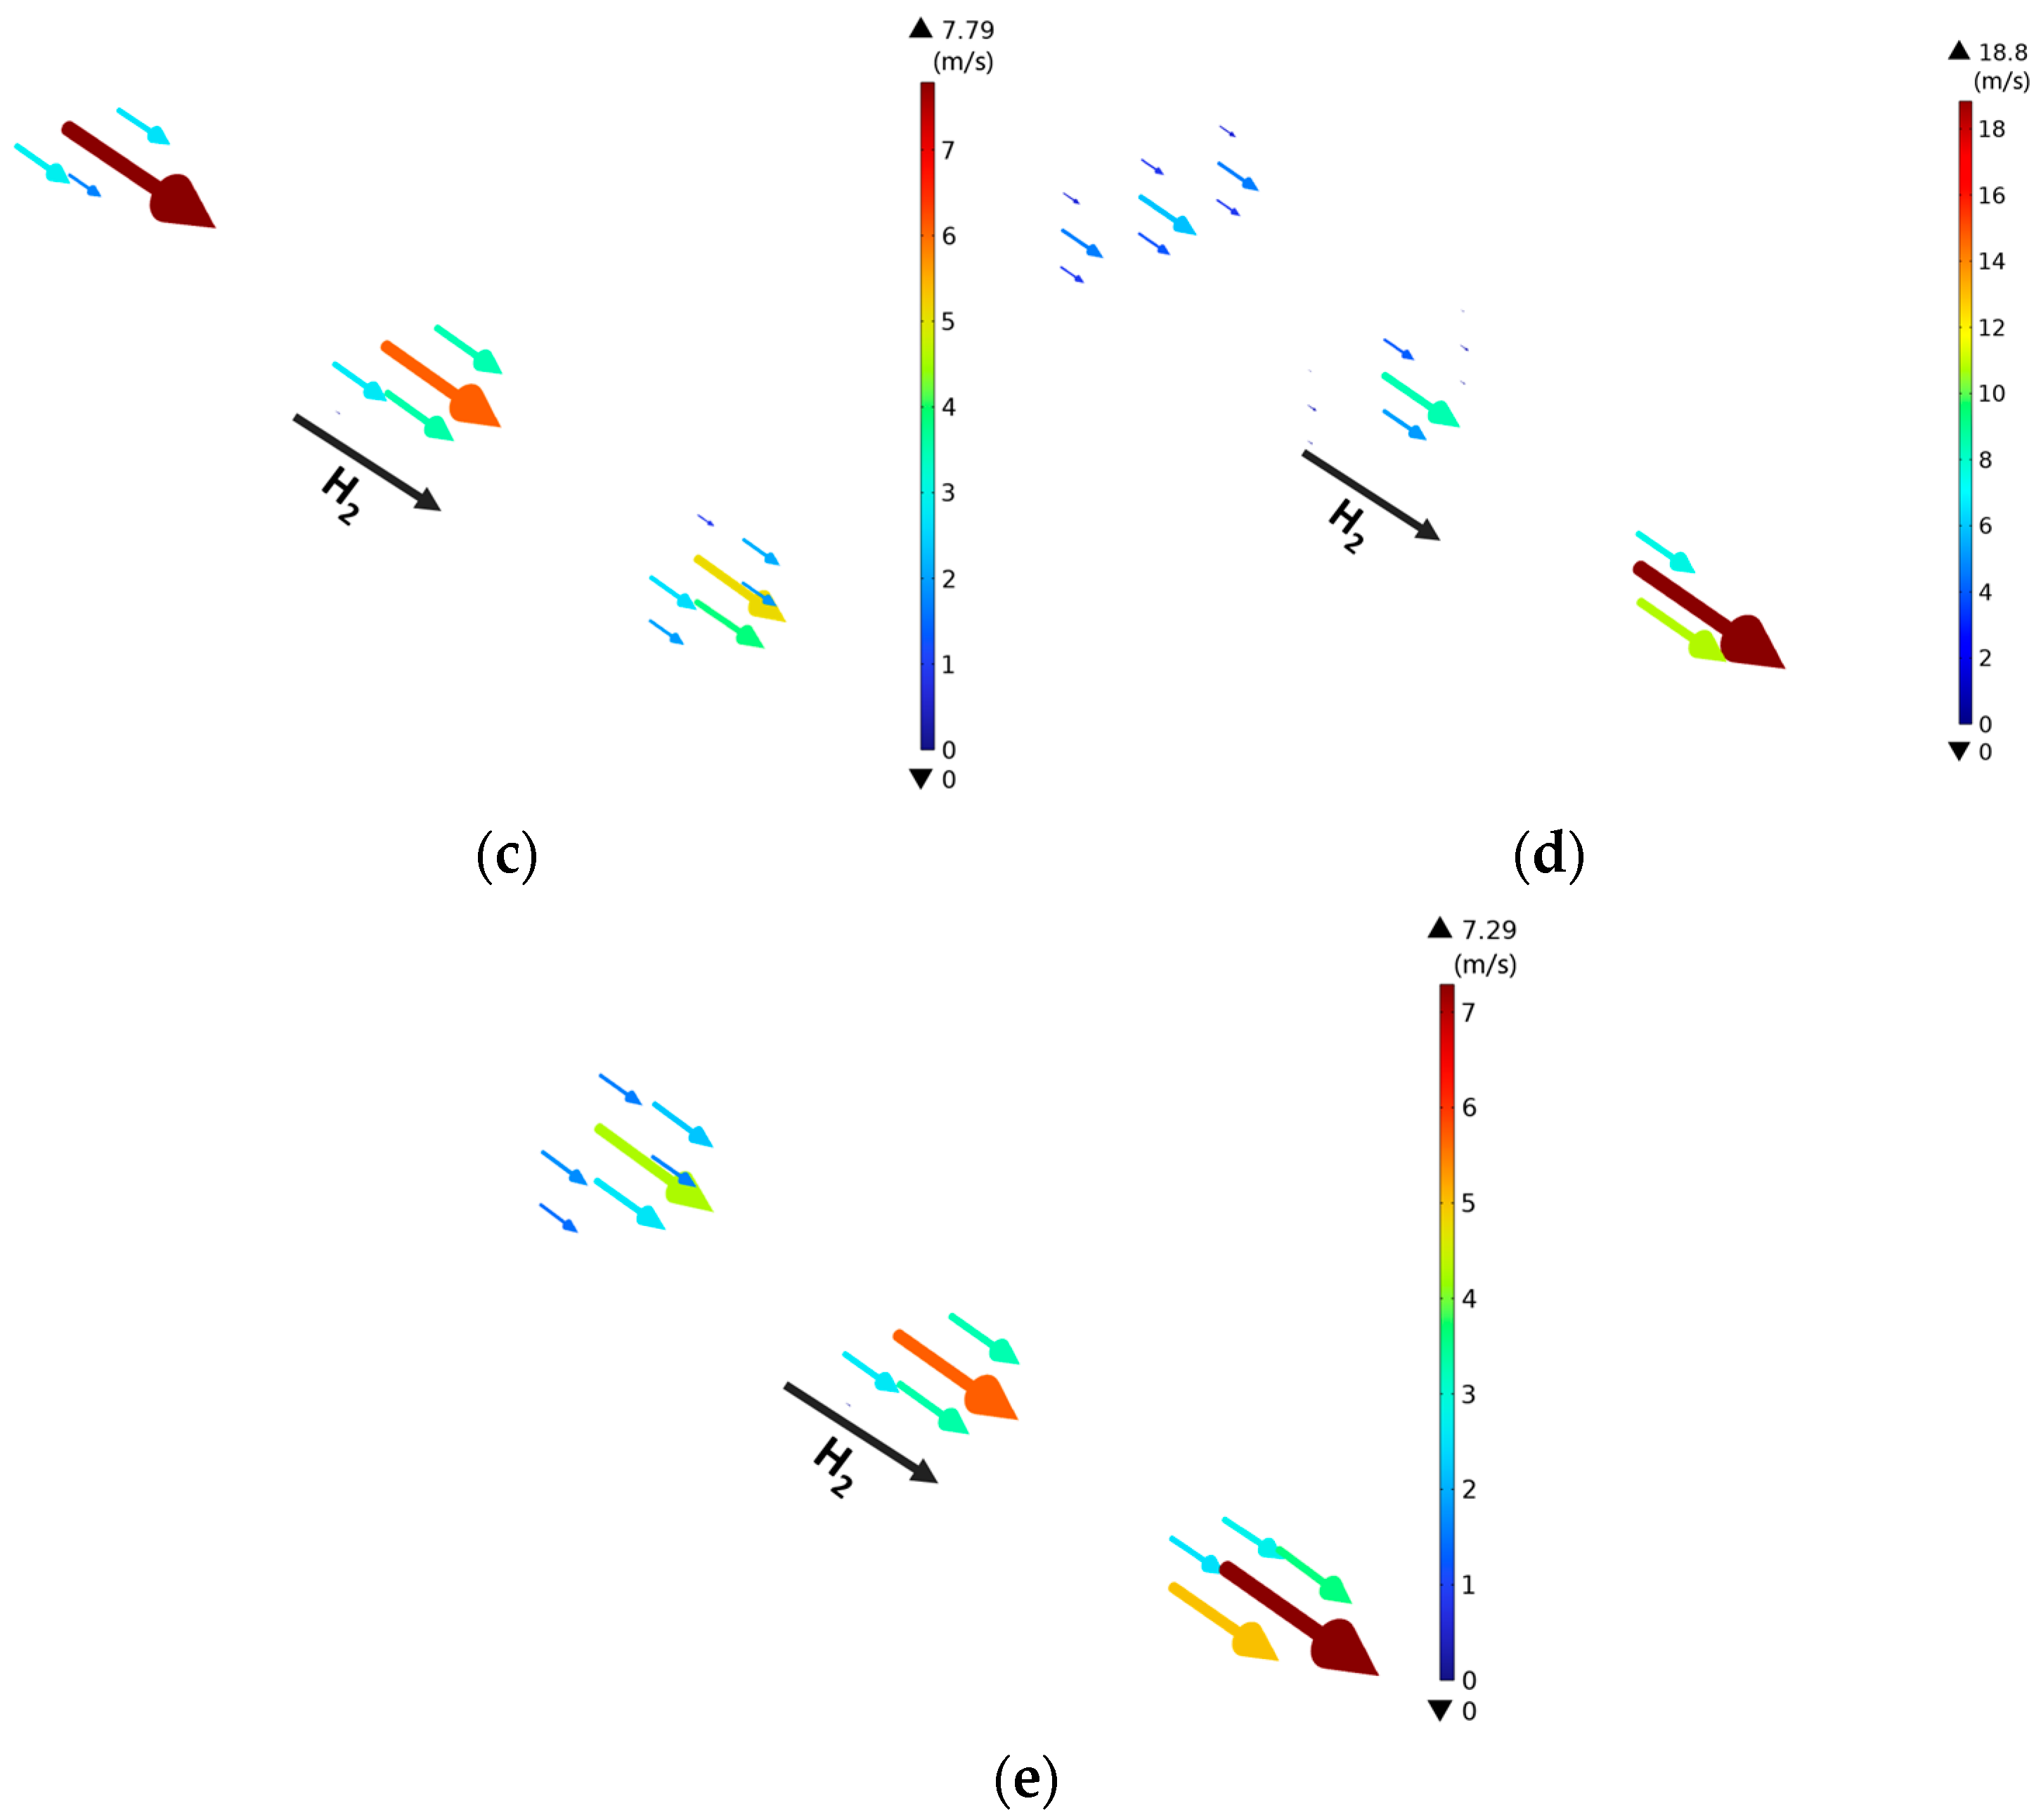
The streamlines of hydrogen flow are presented in Figure 16 for the single channel operated at an operating voltage 1.4 V for various channel designs, aiming to better understand the impact of channel structure changes on the velocity distribution. Figure 16a illustrates the streamlines predicted for the traditional channel, where higher velocities are predominantly concentrated in the channel central part, and the velocity remains constant along the main flow direction for which the streamline in the inlet and outlet regions is consistent. The streamlines for case-1 and case-2 (i.e., the channel expanded in the width or thickness direction) are depicted in Figure 16b,c. In both cases, the high velocities are predominantly observed in the inlet region and gradually decrease along the main flow direction until a minimum one is observed in the outlet region, which can be attributed to the fact that the channels in the inlet region are narrower compared to those in the outlet region. Figure 16d,e illustrates the streamlines of case-3 and case-4 (i.e., the channel shrinking in the width or thickness direction), and it is clear that completely opposite results are observed compared to those for case-1 and case-2. This discrepancy is attributed to the entirely opposite structural configurations.
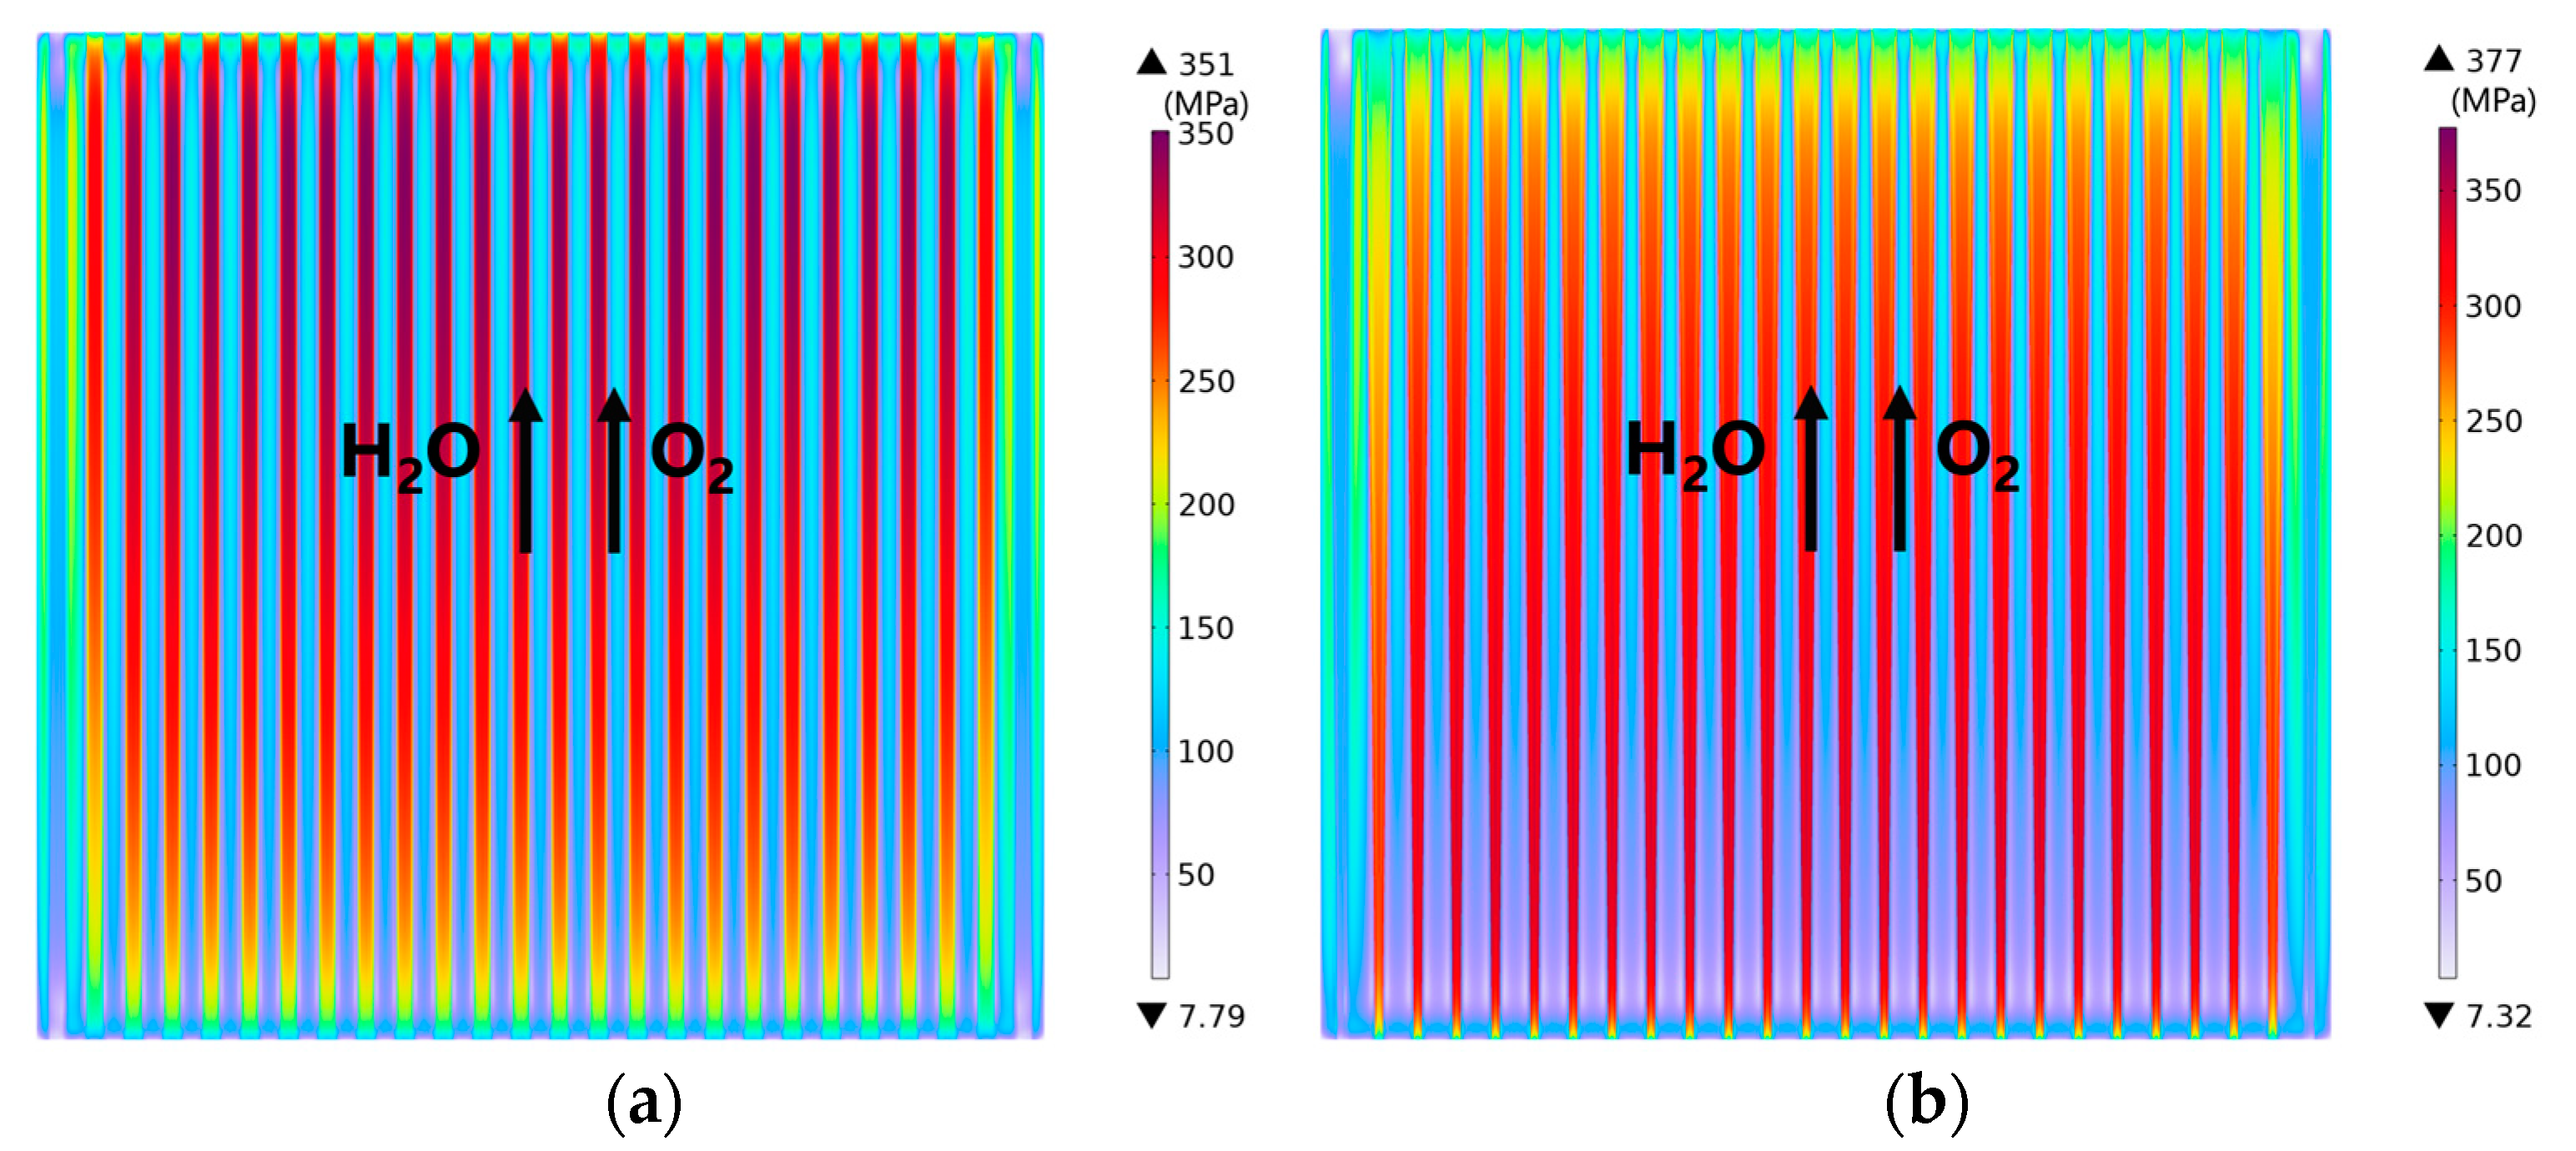
The effect on the von Mises stress is investigated and analyzed for the channel configuration with the gradient ribs/channels. As shown in Figure 17, the minimum stress occurs in the corner regions of the cell, which is approximately 5 MPa varied among the cases studied. The maximum von Mises stress is 512 MPa in case-3, while its value is approximately 343 MPa in case-2, which results in an approximately 170 MPa difference (or about 1.5 times higher) in the maximum thermal stress generated in case-3.
Unlike the ones found for case-0 with the traditional channels, as shown in Figure 17a, the higher maximum thermal stress in Figure 17b is concentrated in the entrance region under the narrow channels, while the low thermal stress is concentrated in the outlet region under the wide channels for case-1 with the channels expanding in the width direction. For case-3, Figure 17d shows the distribution of the von Mises stress, and it is found that the higher maximum thermal stress is mainly concentrated in the outlet region for the channels shrinking in the width direction, which is in contrast to that found for case-1 with the channels expanding in the width direction. Figure 17c,e shows predictions for the cases with the channels changing in the thickness direction, which are similar to that found in case-0 with the traditional channels.
As shown in Figure 18, the maximum thermal stresses predicted for all the cases (except case-3) are similar to one another. If the electrolysis working voltage is 1.4 V, the configuration of the gradient channels has more influence on the maximum von Mises stress than that under the operating voltage of 1.2 V. It is also true that the maximum von Mises stress in case-3 is the highest, and increases by approximately 45.9% compared with that in case-0. This finding is the same observed for the temperature difference between the highest and lowest values identified in Figure 15.
Based on the discussion above, it is clear that the hydrogen production may be improved when new channels expanding or shrinking in the thickness direction are applied, e.g., the channels expanding in the thickness direction (i.e., case-2) can increase the net hydrogen production ratio by 30% at the operating voltage of 1.4 V, while the electrolysis current density and the maximum thermal stress do not change compared with case-0. A great impact is also found on the thermal stress distribution, even if the influence on the temperature distribution is minimal. The higher thermal stress of the cell is mainly concentrated under the narrower ribs in the channel, expanding or shrinking in the width direction. The maximum von Mises stress increases significantly if the channel shrinking in the width direction (i.e., case-3) is applied, which should be avoided in the real design and implementation of the new cell configurations.

4. Conclusions

A three-dimensional (3D) electro-thermo-mechanical coupled model of an SOEC is developed to investigate rib/channel width ratio effect on both the electrolysis and the mechanical behavior of SOECs, which is further extended for the proposed rib/channel grinded configurations, with the aim of identifying the optimized geometry parameters. Compared with the base-case (the rib/channel width ratio is 1:1), the wider ribs may improve the hydrogen production performance of SOECs by 41% when the rib/channel ratio is 5:2 at the operating voltage of 1.4 V, while the maximum von Mises stress increases by 85.0%. For another extreme case with the rib/channel width ratio being 2:5, the maximum von Mises stress decreases by 45.9%, while its hydrogen production performance reduced by 32.8%. To achieve the balanced performance, the rib/channel width ratio of 4:3 is selected for optimization of the cell configuration. Four gradient ribs/channels are further compared and analyzed. The hydrogen production performance is significantly improved by 30%, while the maximum von Mises stress decreases by approximately 10 MPa for case-2 (i.e., the channel expanding in the thickness direction). Several other gradient channels may provide a slight improvement in the hydrogen production performance, but the maximum von Mises stress increases more obviously as well.

Author Contributions

Conceptualization, Y.L., H.W. and J.Y.; methodology, Y.L., L.X., D.O. and J.Y.; validation, Y.L. and H.W.; data curation, Y.L. and L.X.; writing—original draft preparation, Y.L.; funding acquisition, J.Y. All authors have read and agreed to the published version of the manuscript.

Funding

This work is supported by the National Key Research and Development Project of China (2018YFB1502204) and the Ningbo major special projects of the Plan “Science and Technology Innovation 2025” (2018B10048).

Data Availability Statement

Data are contained within the article.

Conflicts of Interest

Author Dingrong Ou was employed by the China Southern Power Grid Co., Ltd. The remaining authors declare that the research was conducted in the absence of any commercial or financial relationships that could be construed as a potential conflict of interest.

References

  1. Guo, S.; Liu, Q.; Sun, J.; Jin, H. A review on the utilization of hybrid renewable energy. Renew. Sustain. Energy Rev. 2018, 91, 1121–1147. [Google Scholar] [CrossRef]
  2. Yang, Y.; Bremner, S.; Menictas, C.; Kay, M. Battery energy storage system size determination in renewable energy systems: A review. Renew. Sustain. Energy Rev. 2018, 91, 109–125. [Google Scholar] [CrossRef]
  3. Luo, Y.; Wu, X.; Shi, Y.; Ghoniem, A.F.; Cai, N. Exergy analysis of an integrated solid oxide electrolysis cell-methanation reactor for renewable energy storage. Appl. Energy 2018, 215, 371–383. [Google Scholar] [CrossRef]
  4. Jensen, S.H.; Graves, C.; Mogensen, M.; Wendel, C.; Braun, R.; Hughes, G. Large-scale electricity storage utilizing reversible solid oxide cells combined with underground storage of CO2 and CH4. Energy Environ. Sci. 2015, 8, 2471–2479. [Google Scholar] [CrossRef]
  5. Zhang, X.; Song, Y.; Wang, G.; Bao, X. Co-electrolysis of CO2 and H2O in high-temperature solid oxide electrolysis cells: Recent advance in cathodes. J. Energy Chem. 2017, 26, 839–853. [Google Scholar] [CrossRef]
  6. Udagawa, J.; Aguiar, P.; Brandon, N. Hydrogen production through steam electrolysis: Control strategies for a cathode-supported intermediate temperature solid oxide electrolysis cell. J. Power Sources 2008, 180, 354–364. [Google Scholar] [CrossRef]
  7. Cai, Q.; Adjiman, C.S.; Brandon, N.P. Optimal control strategies for hydrogen production when coupling solid oxide electrolysers with intermittent renewable energies. J. Power Sources 2014, 268, 212–224. [Google Scholar] [CrossRef]
  8. Kornely, M.; Leonide, A.; Weber, A.; Ivers-Tiffée, E. Performance limiting factors in anode-supported cells originating from metallic interconnector design. J. Power Sources 2011, 196, 7209–7216. [Google Scholar] [CrossRef]
  9. Jiang, S.; Love, J.; Apateanu, L. Effect of contact between electrode and current collector on the performance of solid oxide fuel cells. Solid. State Ionics 2003, 160, 15–26. [Google Scholar] [CrossRef]
  10. Ferguson, J.R.; Fiard, J.M.; Herbin, R. Three-dimensional numerical simulation for various geometries of solid oxide fuel cells. J. Power Sources 1996, 58, 109–122. [Google Scholar] [CrossRef]
  11. Tanner, C.W.; Virkar, A.V. A simple model for interconnect design of planar solid oxide fuel cells. J. Power Sources 2003, 113, 44–56. [Google Scholar] [CrossRef]
  12. Lin, Z.; Stevenson, J.; Khaleel, M. The effect of interconnect rib size on the fuel cell concentration polarization in planar SOFCs. J. Power Sources 2003, 117, 92–97. [Google Scholar] [CrossRef]
  13. Jeon, D.H.; Nam, J.H.; Kim, C.-J. Microstructural optimization of anode-supported solid oxide fuel cells by a comprehensive microscale model. J. Electrochem. Soc. 2006, 153, A406. [Google Scholar] [CrossRef]
  14. Liu, S.; Song, C.; Lin, Z. The effects of the interconnect rib contact resistance on the performance of planar solid oxide fuel cell stack and the rib design optimization. J. Power Sources 2008, 183, 214–225. [Google Scholar] [CrossRef]
  15. Liu, S.; Kong, W.; Lin, Z. Three-dimensional modeling of planar solid oxide fuel cells and the rib design optimization. J. Power Sources 2009, 194, 854–863. [Google Scholar] [CrossRef]
  16. Kong, W.; Li, J.; Liu, S.; Lin, Z. The influence of interconnect ribs on the performance of planar solid oxide fuel cell and formulae for optimal rib sizes. J. Power Sources 2012, 204, 106–115. [Google Scholar] [CrossRef]
  17. Kong, W.; Gao, X.; Liu, S.; Su, S.; Chen, D. Optimization of the interconnect ribs for a cathode-supported solid oxide fuel cell. Energies 2014, 7, 295–313. [Google Scholar] [CrossRef]
  18. Sun, Q.; Ni, M. Three-dimensional Modeling of internal reforming SOFC with a focus on the interconnect size effect. ECS Trans. 2015, 68, 2317–2338. [Google Scholar] [CrossRef]
  19. Gao, X.; Zhang, Q.; Zhang, W.; Chen, D. Optimization of distributed cylindrical interconnect ribs for anode-and cathode-supported solid oxide fuel cell. Int. J. Electrochem. Soc. 2015, 10, 7521–7534. [Google Scholar] [CrossRef]
  20. Kong, W.; Han, Z.; Lu, S.; Gao, X.; Wang, X. A novel interconnector design of SOFC. Int. J. Hydrogen Energy 2020, 45, 20329–20338. [Google Scholar] [CrossRef]
  21. Fu, Q.; Li, Z.; Wei, W.; Liu, F.; Xu, X.; Liu, Z. Performance enhancement of a beam and slot interconnector for anode-supported SOFC stack. Energy Convers. Manag. 2021, 241, 114277. [Google Scholar] [CrossRef]
  22. Bhattacharya, D.; Mukhopadhyay, J.; Biswas, N.; Basu, R.N.; Das, P.K. Performance evaluation of different bipolar plate designs of 3D planar anode-supported SOFCs. Int. J. Heat Mass. Trans. 2018, 123, 382–396. [Google Scholar] [CrossRef]
  23. Wang, Y.; Du, Y.; Ni, M.; Zhan, R.; Du, Q.; Jiao, K. Three-dimensional modeling of flow field optimization for co-electrolysis solid oxide electrolysis cell. Appl. Therm. Eng. 2020, 172, 114959. [Google Scholar] [CrossRef]
  24. Guo, M.; He, Q.; Cheng, C.; Zhao, D.; Ni, M. New interconnector designs for electrical performance enhancement of solid oxide fuel cells: A 3D modelling study. J. Power Sources 2022, 533, 231373. [Google Scholar] [CrossRef]
  25. Costamagna, P.; Honegger, K. Modeling of solid oxide heat exchanger integrated stacks and simulation at high fuel utilization. J. Electrochem. Soc. 1998, 145, 3995. [Google Scholar] [CrossRef]
  26. Xu, Z.; Zhang, X.; Li, G. Comparative performance investigation of different gas flow configurations for a planar solid oxide electrolyzer cell. Int. J. Hydrogen Energy 2017, 42, 10785–10801. [Google Scholar] [CrossRef]
  27. Luo, Y.; Shi, Y.; Li, W.; Cai, N. Dynamic electro-thermal modeling of co-electrolysis of steam and carbon dioxide in a tubular solid oxide electrolysis cell. Energy 2015, 89, 637–647. [Google Scholar] [CrossRef]
  28. Zeng, Y.; Fan, P.; Zhang, X.; Fu, C.; Li, J.; Li, G. Sensitivity analysis for a planar SOFC: Size effects of the porous gas diffusion layer underneath the channel rib. Fuel Cells 2014, 14, 123–134. [Google Scholar] [CrossRef]
  29. Zheng, J.; Xiao, L.; Wu, M.; Lang, S.; Zhang, Z.; Yuan, J. Numerical analysis of thermal stress for a stack of planar solid oxide fuel cells. Energies 2022, 15, 343. [Google Scholar] [CrossRef]
  30. Cui, D.; Cheng, M. Thermal stress modeling of anode supported micro-tubular solid oxide fuel cell. J. Power Sources 2009, 192, 400–407. [Google Scholar] [CrossRef]
  31. Pianko-Oprych, P.; Zinko, T.; Jaworski, Z. A numerical investigation of the thermal stresses of a planar solid oxide fuel cell. Materials 2016, 9, 814. [Google Scholar] [CrossRef] [PubMed]
  32. Gross-Barsnick, S.-M.; Babelot, C.; Federmann, D.; Pabst, U. Optimization of tensile strength measurements on glass-ceramic sealant used for SOFC stacks. ECS Trans. 2015, 68, 2573. [Google Scholar] [CrossRef]
  33. Qu, Z.; Aravind, P.; Boksteen, S.; Dekker, N.; Janssen, A.; Woudstra, N. Three-dimensional computational fluid dynamics modeling of anode-supported planar SOFC. Int. J. Hydrogen Energy 2011, 36, 10209–10220. [Google Scholar] [CrossRef]
  34. Guo, M.; Zhao, D.; Xu, Q.; Li, Z.; Xu, H.; Ni, M. New interconnector design optimization to balance electrical and mechanical performance of solid oxide fuel cell stack. Int. J. Hydrogen Energy 2023, 48, 3107–3121. [Google Scholar] [CrossRef]
Figure 1. Schematic of (a) a unit cell, and (b) its cross section of a planar-design SOEC.
Energies 17 00510 g001
Figure 2. (a) Generated meshes; (b) grid independence testing performance; and (c) predicted I–V curves compared with the experimental data.
Energies 17 00510 g002
Figure 3. Temperature predicted from (a) [26]; (b) this study at 1.2867 V.
Energies 17 00510 g003
Figure 4. Predicted current density along cathode–electrolyte interface for base-case condition at operating voltage of (a) 1.2 V; (b) 1.3 V; (c) 1.4 V.
Energies 17 00510 g004
Figure 5. Predicted H2 mole fraction along cathode–electrolyte interface for base-case condition at (a) 1.2 V; (b) 1.3 V; (c) 1.4 V.
Energies 17 00510 g005
Figure 6. Temperature predicted for base-case at (a) 1.2 V; (b) 1.3 V; (c)1.4 V.
Energies 17 00510 g006
Figure 7. Distribution of von Mises stress predicted at electrolyte surface for (a) 1.2 V; (b) 1.3 V; (c) 1.4 V.
Energies 17 00510 g007
Figure 8. Predicted current density along cathode–electrolyte interface with rib/channel width ratio of (a) 5/2; (b) 2/5 at operating voltage of 1.4 V; (c) the effect of rib/channel width ratio on averaged current density for operating voltage of 1.2 V and 1.4 V.
Energies 17 00510 g008
Figure 9. Predicted H2 mole fraction with rib/channel width ratio of (a) 5:2, (b) 2:5 at operating voltage of 1.4 V; and (c) the effect of rib/channel width ratio on net H2 yield γ (here, net H2 yield is defined as the ratio of moles of H2 produced per mole of input H2O).
Energies 17 00510 g009
Figure 10. Distribution of temperature predicted along the electrolyte surface at operating voltage of 1.4 V with rib/channel width ratio of (a) 5:2, (b) 2:5; the effect of rib/channel width ratio on temperatures at operating voltage of (c) 1.2 V and (d) 1.4 V. (Where the average temperature is weighted by the local temperature and the contacting area).
Energies 17 00510 g010
Figure 11. The distribution of von Mises stress at 1.4 V with rib/channel width ratios of (a) 5:2, (b) 2:5; and (c) the effect of rib/channel width ratio along the electrolyte surface.
Energies 17 00510 g011
Figure 12. Gradient inter-connector configuration with channels: (a) expanding in width direction, (b) expanding in thickness direction, (c) shrinking in width direction, and (d) shrinking in thickness direction.
Energies 17 00510 g012
Figure 13. Distribution of current density on electrolyte surface at 1.4 V for (a) case-0 with the traditional rib/channel; (b) case-1 with channel expanding in width direction; (c) case-2 with channels expanding in thickness direction; (d) case-3 with channel shrinking in width direction; (e) case-4 with channel shrinking in thickness direction; (f) comparison of the averaged current density with various cases.
Energies 17 00510 g013aEnergies 17 00510 g013b
Figure 14. The effect of channel configuration on net H2 yield γ (here, net H2 yield is defined as ratio of moles of H2 produced per mole of input H2O).
Energies 17 00510 g014
Figure 15. The effect of channel configuration on electrolyte surface temperature operated at electrolysis voltage of (a) 1.2 V and (b) 1.4 V.
Energies 17 00510 g015
Figure 16. The streamline of hydrogen flow in a single channel at the operating voltage of 1.4 V for (a) case-0 with traditional rib/channel; (b) case-1 with channel expanding in width direction; (c) case-2 with channel expanding in thickness direction; (d) case-3 with channel shrinking in width direction; (e) case-4 with channel shrinking in thickness direction.
Energies 17 00510 g016aEnergies 17 00510 g016b
Figure 17. Von Mises stress predicted on the electrolyte surface at operating voltage 1.4 V for (a) case-0 with traditional rib/channel; (b) case-1 with channel expanding in width direction; (c) case-2 with channel expanding in thickness direction; (d) case-3 with channel shrinking in width direction; (e) case-4 with channel shrinking in thickness direction.
Energies 17 00510 g017aEnergies 17 00510 g017b
Figure 18. The effect of gradient channel configuration on the maximum Von Mises stress.
Energies 17 00510 g018
Table 1. Geometric parameters for base-case SOEC unit cells.
ParameterValue
Cell width91 mm
Cell length91 mm
Channel height1 mm
Channel width1.75 mm
Rib width1.75 mm
Number of channels26
Cathode thickness410 μm
Electrolyte layer thickness10 μm
Anode thickness25 μm
Table 2. Parameters applied in the current study [7,25].
γ/A∙m−2Eact/J∙mol−1
Cathode1.34 × 10101.0 × 105
Anode2.05 × 1081.2 × 105
Table 3. Physical parameters of SOEC components [30,31,32,33,34].
ParameterCathodeElectrolyteAnodeInter-Connector
MaterialNi-YSZYSZLSMstainless steel
Density, kg/m37740600053007700
Specific heat capacity
(W·kg−1·K−1)
595400607600
Thermal conductivity
(W−1·m·K−1)
6.232.71044.5
Electronic/ionic
conductivity
(1/Ω·m)
9.7 × 10 4 T exp 2100 T 3.34 × 10 4 exp 10300   T 9.7 × 10 4 T exp 2100 T 769,000
CTE, (1/K)12.210.311.715.5
Young modulus (GPa) 5718535214
Poisson’s ratio0.280.320.250.3
Table 4. The boundary conditions of the SOEC model.
Boundary Conditions
MomentumThermalSpeciesElectric Potential
Top IC wallStationary wall with no slip for velocitySymmetryZero diffusive fluxΦtop = Vcell
Bottom IC wallStationary wall with no slip for velocitySymmetryZero diffusive fluxΦbottem = 0
Air inlet0.33 L/min800 °C21% O2 + 79% N2Insulation
Air outletPressure conditionConvectionConvectionInsulation
Fuel inlet0.217 L/min800 °C90% H2O + 10% H2Insulation
Fuel outletPressure conditionConvectionConvectionInsulation
Side wallsStationary wall with no slip for velocityInsulationZero diffusive fluxInsulation
Table 5. Rib/channel width ratio investigated.
Rib/Channel Width RatioRib WidthChannel Width
5:22.5 mm1 mm
4:32 mm1.5 mm
1:1 (base-case)1.75 mm1.75 mm
3:41.5 mm2 mm
2:51 mm2.5 mm
Table 6. Gradient inter-connector configurations.
CasesRibsCross-Section Parameters of Channel InletCross-Section Parameters of Channel Outlet
Case-0Traditionally straight and parallel channelEnergies 17 00510 i001Energies 17 00510 i002
Case-1Gradient channel expanding in width directionEnergies 17 00510 i003Energies 17 00510 i004
Case-2Gradient channel expanding in thickness directionEnergies 17 00510 i005Energies 17 00510 i006
Case-3Gradient channel shrinking in width directionEnergies 17 00510 i007Energies 17 00510 i008
Case-4Gradient channel shrinking in thickness directionEnergies 17 00510 i009Energies 17 00510 i010
Disclaimer/Publisher’s Note: The statements, opinions and data contained in all publications are solely those of the individual author(s) and contributor(s) and not of MDPI and/or the editor(s). MDPI and/or the editor(s) disclaim responsibility for any injury to people or property resulting from any ideas, methods, instructions or products referred to in the content.