Article

Study on the Properties of Compound Surfactants with PO Groups

1
Key Laboratory of Enhance Oil and Gas Recovery of Education Ministry, Northeast Petroleum University, Daqing 163318, China
2
The Tenth Oil Production Plant of Daqing Oilfield Co., Ltd., Daqing 166400, China
3
Research Institute of Drilling and Production Technology, Petro China Qinghai Oilfield Company, Dunhuang 736202, China
4
Daqing Qingxin Oilfield Development Co., Ltd., Daqing 151413, China
*
Author to whom correspondence should be addressed.
These authors contributed equally to this work.
Energies 2024, 17(2), 513; https://doi.org/10.3390/en17020513
Submission received: 15 November 2023 / Revised: 10 January 2024 / Accepted: 19 January 2024 / Published: 20 January 2024
(This article belongs to the Section H: Geo-Energy)

Abstract

:
The compound surfactant system has considerable development prospects for improving oil recovery. A synergistic effect can be achieved through the orderly arrangement of the two surfactants on the interface, which can make up for the performance defects of a single surfactant. In this paper, the effects of the number of propylene oxides (PO) in composite surfactants on interfacial tension and emulsion stability were systematically studied. The results showed that the solubility of composite surfactants was significantly improved under high-salinity conditions by adding anionic–nonionic surfactants to a single anionic surfactant. The interfacial tension of composite surfactants shows a V-shaped change of first decreasing and then increasing with the increase in PO groups. As the number of PO groups increases, the emulsion first increases and then decreases. Among the series of composite surfactants, LBAS/C12PO10S has the lowest interfacial tension, reaching the order of 10−3 mN/m, and the emulsion formed by it exhibits superior stability. This indicates that the synergistic effect of the two surfactants can be improved by adjusting the number of PO groups. Furthermore, the LBAS/C12PO10S composite system can be mixed with crude oil to form Winsor III microemulsion, which has great potential for application in enhanced oil recovery via chemical flooding.

1. Introduction

With the rapid development of the industry, the demand for crude oil is increasing. The exploitation of ordinary reservoirs can no longer meet society’s present demand for oil, and the exploration and development of oil are gradually turning to complex reservoirs with low permeability and high salinity. Chemical flooding is the main method used to deal with complex reservoirs, in which surfactants play a key role [1,2,3,4]. By using a suitable surfactant system, the interfacial tension (IFT) between oil and aqueous solution can be significantly reduced. On the one hand, the orderly arrangement of the oil–water interface can reduce the oil–water interfacial tension and increase the number of capillaries, thus improving the oil-displacing efficiency. On the other hand, it can form emulsions, improve the emulsion-trapping capacity, enhance the emulsion-carrying capacity, and move residual oil from complex pores, thus significantly improving oil recovery.
Surfactant-based nanoemulsions (NEs) are a specific class of emulsion. The properties of NEs, such as kinetic stability and rheology, have attracted substantial consideration in the oil and gas industry. Braccalenti et al. [5] synthesized and tested the efficiency of four glucagon-based NE formulations for EOR. These NEs consisted of four different surfactants, with xylene as the dispersed phase. The findings stated that the salinity and composition of the brine have a significant effect on the HLB value of surfactants, and, in turn, the distribution of the NE droplet size. The reported core-flood data indicated a possible disruption of NE droplets during the NEs’ injection. Although they successfully altered the surface wettability, none of these four formulations achieved an ultra-low IFT region. Also, a broad range of equipment and facilities are involved in upstream applications of NEs. Synthesizing a large amount of NEs requires dedicated chemical plants or on-site manufacturing facilities and may sufficiently add to the cost [6]. Surfactants, on the other hand, are inexpensive and widely utilized in reservoir development.
The most widely used surfactants are anionic surfactants and nonionic surfactants. Anionic surfactants, such as petroleum sulfonates and alkyl benzene sulfonates [7], have the advantages of a simple production process, high interfacial activity, and good temperature resistance, but have poor adsorption resistance and a high Krafft point, which will precipitate in highly mineralized water. Nonionic surfactants have better salt resistance, but poor stability during their formation, high adsorption, poor solubility, and a high price. In order to better utilize the roles of the two surfactants in oil repelling and make up for their respective deficiencies, the researchers adopted the synergistic use of the two in compounding. Kesarwani et al. [8] used a mixture of Nonionic and anionic surfactants to study their effect on oil displacement. The results show that the interfacial tension is very low, at 0.0097 mN/m, and the recovery of chemical slug composed of polymer and polymer can reach more than 76%. Pal et al. [9] studied the application of ionic/nonionic (CTAB + Tween 60) mixed-surfactant systems in improving oil recovery. It is found that, after the conventional secondary oil recovery process, nearly 20% of the original oil can be recovered through the injection of mixed surfactants and polymer chemical fluids. Liu et al. [10] reported the successful construction of the anionic/nonionic surfactant mixture LMEA-DPS and its interfacial properties with crude oil. The results show that LMEA-DPS has a better effect on reducing interfacial tension, wettability and emulsifying viscosity. Souayeh et al. [11] carried out oil recovery experiments using a polyethylene oxy nonionic surfactant (C13EO12) and two anionic surfactants: sulfonate (IOS 20-24) and carboxylate (AEC 938). The experimental results show that when sulfonate anionic surfactant is added to the nonionic surfactant, the oil recovery is 49% of OIIP. When the carboxylate anionic surfactant is added to the nonionic surfactant, the oil recovery can be increased to 74% of OIIP.
The compounding of the anionic surfactant and nonionic surfactant can obtain a temperature-resistant and salt-resistant performance and good water solubility, enhance its applicability in high-mineralization reservoirs, and effectively regulate its hydrophilic-oleophilic equilibrium value. At the same time, it can reduce the economic cost of effectively using the synergistic effect of the two surfactants, achieving a better performance than a single surfactant, and has good application prospects [11,12]. The surfactant molecules in the complex system will show good interfacial properties when there is an appropriate number of PO groups in the molecule, and the extension and curling of PO groups are beneficial in reducing the IFT [13,14,15]. The number of carbon atoms in the hydrophobic tail chain will also have an impact on its surface activity [16]. Therefore, in this paper, the effect of the number of PO groups on the interfacial activity of the complex surfactant system is investigated, the conformational relationship between the two surfactants is described, and their performance in the formation of Winsor III microemulsions is evaluated.

2. Experimental

2.1. Instruments and Materials

Interfacial tensiometer. A rotating drop interfacial tensiometer (TX500C, Dataphysics Co., Stuttgart, Germany) was used to determine the interfacial tension of the surfactants. Digital dispersion homogenizer. A high-speed homogenizer (T25 Digital, IKA Co., Staufen, Germany) was used to emulsify the mixed surfactant solution with simulated oil by stirring. Emulsion stability. A stability analyzer (Turbiscan, Formulation Co., Toulouse, France) was used to test the emulsion stability of the surfactants in the compounded system.
The selected surfactants were long-chain alkylbenzene sulfonate (LBAS) and aminopropyl trimethoxysilane (APS); their chemical structure is shown in Figure 1. Series APS surfactants were provided by Sasol Chemical Co., Ltd. (Nanjing, China) with a purity of more than 90%. The reagents that were used are NaCl, CaCl2, MgCl2, KCl, Na2SO4, Na2CO3, and NaHCO3, which were provided by Aladdin Reagent Co., Ltd. (Shanghai, China), and were all analytically pure. The experimental oil was the simulated oil formed by the mixture of dehydrated, degassed crude oil produced in the second block of the D oilfield and kerosene. The density of the oil at 45 °C was 0.85 g/cm3 and the viscosity was 10 mPa·s. The experimental water was the simulated water produced in the second block of the D oilfield area. The specific composition is shown in Table 1. The pH value of the surfactant system prepared in the experiment was about 7.5.

2.2. Methods

2.2.1. Salt Solubility Resistance

Three kinds of surfactant solutions were prepared—LBAS, APS, and LBAS/APS—with a concentration of 0.3% and a ratio of 1:1. These were sealed after adding different amounts of salinity solution. The solutions were shaken with a digital rotary laboratory shaker (Trayster, Seamer Faisel Technology Co., Ltd., Shanghai, China) provided at 80 rpm. They were shaken evenly and rested in a thermostat at 45 °C for 24 h, and the dissolved state was observed to see if a new phase was formed. The salinity range of the solution was 0–20,000 mg/L, and the interval gradient was 2000 mg/L; the specific concentration of Na+ is shown in Table 2.

2.2.2. Determination of Compound Proportion

From the data obtained from the test experiments before the formal experiment, we can see that when the proportion of APS is greater than LBAS, the effect of IFT is better; therefore, LBAS:APS was prepared at 1:1, 2:3, 1:2, and 1:3, respectively. The changing trend of IFT with the compounding ratio at the formation temperature was measured using simulated oil and simulated water. After determining the compounding ratio, the stability experiment with IFT and emulsion was carried out.

2.2.3. Determination of Interfacial Tension

The IFT of the compound surfactant was measured by a TX500C rotary drop interface tensiometer. The surfactant solution with a mass concentration of 0.3% was prepared with pre-prepared simulated water, and the glass sample tube was cleaned with the surfactant solution before testing 2–3 times. Then, the surfactant solution to be tested was injected into the glass sample tube, and about 0.5 μL of simulated oil was injected into the middle of the glass sample tube using a microsyringe to cover the tube (note: no bubbles can appear in the tube during the whole sampling process) and installed on the interface tensiometer. The length and width of the elongated oil droplets were recorded every 5 min, and the interfacial tension after 1 h was selected as the final equilibrium interfacial tension between the surfactant and the simulated oil. During the experiment, the rotational speed was maintained at 5000 r/min and the temperature was set at 45 °C. The formula for calculating the interfacial tension is:
I F T = ρ ω 2 D 3 4
Formula:
IFT—Interfacial tension between oil phase and water phase, N/m;
Δρ—Density difference between oil phase and water phase, kg/m3;
ω—Angular velocity, rad/s;
D—Oil droplet diameter, m.

2.2.4. Determination of Emulsion Stability

According to the volume ratio of 1:1, the surfactant solution with a mass concentration of 0.3% in 20 mL was mixed with the simulated oil. Then, the solution was preheated for 10 min in a water bath at 45 °C. After preheating, the T25 digital high-speed homogenizer was used to stir and emulsify; the rotational speed was set to 2000 r/min, and the time was set to 5 min. The evenly stirred emulsion was placed into the glass sample bottle to be tested, and the Turbiscan Lab stability analyzer was placed there. The bottle body was scanned once per minute, and the final emulsion stability kinetic index (TSI) was obtained after scanning for 2 h. The formula for calculating the dynamic index of stability is:
T S I = i h s c a n i h s c a n i 1 h H
Formula:
TSI—Stability dynamics index;
i—Measuring times;
scan—Intensity of backscattered or transmitted light;
h—Instrument scanning height, mm;
H—Measure maximum height, mm.

2.2.5. Experimental Test of Phase Behavior

A complex surfactant solution containing varying concentrations of sodium chloride and simulated oil was injected into a 5 mL pipette, which was sealed at the bottom and glued at the top. The pipette was then placed into a rotary mixing device. After the solution was fully mixed with the simulated oil at a rotating speed of 2 rpm for 24 h at 45 °C, the pipette was kept upright until the oil/water phase was stable. In order to determine the best salt content for the formation of medium-phase microemulsion, the NaCl concentration of the system was scanned, and the salinity varied from 0.2 to 2.4%.

3. Results and Discussion

3.1. Determination of Salt Solubility and Compound System

Salt dissolution experiments were conducted to verify the surfactants’ ability to resist metal ions under conditions of gradually increasing salinity, where the salt concentration range was 0–20,000 mg/L and the interval gradient was 2000 mg/L. The solubility of surfactants in water can be reduced by the addition of NaCl. With the increase in NaCl content, surfactants will precipitate from the aqueous solution and form a new phase, based on which the salt tolerance of surfactants can be judged. The salt solubility of LBAS is shown in Figure 2.
It can be seen from Figure 2 that the solution is clear without NaCl, while the solution becomes turbid and yellowish when the concentration of NaCl is 2000–4000 mg/L. The surfactant components are partially precipitated under the concentration of NaCl of 6000 mg/L. When the concentration of NaCl is higher than that of 8000 mg/L, LBAS completely precipitates, resulting in phase separation. The experimental results of salt-tolerance solubility show that the salt tolerance of LBAS is poor when placing an order at the set temperature.
The salt-tolerant solubility of APS is shown in Figure 3. It can be seen from Figure 3 that, with the continuous increase in NaCl concentration, the solubility of a single APS is not affected, the solution is always clear, and there is no turbidity. The APS still shows good solubility under high salinity. The results show that it has excellent salt tolerance [17].
The salt solubility of the compound system is shown in Figure 4, and the ratio of compound LBAS and APS is 1:1. It can be seen from Figure 4 that when the concentration of NaCl is 0–10,000 mg/L, there is no precipitation in the solution, indicating that the solubility is good. When the concentration of NaCl is 12,000–14,000 mg/L, the solution is turbid and partly precipitated. When the concentration of NaCl is higher than 14,000 mg/L, the surfactant completely precipitates to form a new phase. The results of the salt-tolerance tests of three kinds of surfactants are shown in Table 3.
It can be seen from Table 3 that the mixed-surfactant solution increases the precipitation phenomenon of high salinity from 6000 mg/L to a NaCl concentration of 14,000 mg/L, indicating that there is good compatibility between the two surfactants. The experimental phenomena presented above can be explained as follows: after the inorganic salt is added to the system, the hydration membrane around the hydrophilic group of the anionic surfactant is destroyed, which increases the hydrophobicity of the molecules and reduces the solubility of LBAS in water. At this time, the surfactant molecules are forced to move to the interface, so that the surfactant molecules adsorbed as the interface increases and LBAS precipitates from the solution to form a new phase. On the other hand, with the increasing concentration of NaCl in the solution, the ionized Na+ will neutralize the anion head charge, compress the thickness of the diffusion double layer of the surfactant, reduce the charge density, weaken the electrostatic repulsion between the groups, and cause them to arrange more closely at the interface, which further increases the adsorption of surfactant molecules on the interface and further accelerates the formation of a new phase [18]. However, the addition of anionic surfactant improves the poor solubility of a simple anionic surfactant at high salinity to a certain extent. It has two hydrophilic groups. There is a certain hydrogen bond between the hydrophilic head group and the water molecule, which increases the solubility of the molecule in a solution with high salinity and counteracts the aggregation of micelles in a certain range. The increase in Na+ concentration has little effect on the hydrogen bond. Therefore, the compound system has excellent salt tolerance and is insensitive to changes in salt content, which delays the emergence of the salting-out effect of the solution to a certain extent [19].
The dynamic interfacial tension of different surfactant solution concentrations is different. The concentration of surfactant solution directly affects the number of surfactant molecules on the interface, thus affecting the interfacial tension. With the increase in surfactant concentration, the adsorption of surfactant molecules at the interface increases, which will lead to a significant decrease in interfacial tension. However, with the further increase in surfactant concentration, the surfactant molecules form micelles, leading to the decrease in single surfactant molecules in the native solution. This is unfavorable for the adsorption of surfactant at the interface, and the value of interfacial tension remains basically unchanged. When the mass concentration of surfactant is 0.3% [20], the decrease in interfacial tension tends to be smooth. Combined with the economic benefits, practical application, and other factors, the mass concentration of the surfactant is 0.3%, which allows for follow-up experiments to be conducted. The effect of different compounding ratios on interfacial tension is shown in Figure 5.
As can be seen from Figure 5, the reduction interfacial tension caused by a single LBAS solution or APS solution is not significant enough. The final IFT can only reach a level of 10−1 or 10−2 mN/m, which does not meet the actual requirements for surfactants to reduce interfacial tension in the field. Therefore, the synergistic effect of different proportions of an anionic surfactant and anionic–nonionic surfactant was studied.
It can also be seen from Figure 5 that the reduction in interfacial tension differs with different compounding ratios in the composite system, and there is a suitable compounding ratio (1:2). The reduction effect of interfacial tension is obviously better than that of single surfactants. Oil–water interfacial tension is ultra-low. The LBAS/APS composite system can significantly reduce the interfacial tension, and there is a strong synergistic effect on reductions in the interfacial tension. One possible explanation for this is that when APS is mixed with LBAS, the weak positive charge weakens the electrostatic repulsion between molecules, which is beneficial to the further adsorption of surfactants on the oil–water interface and makes the IFT lower.

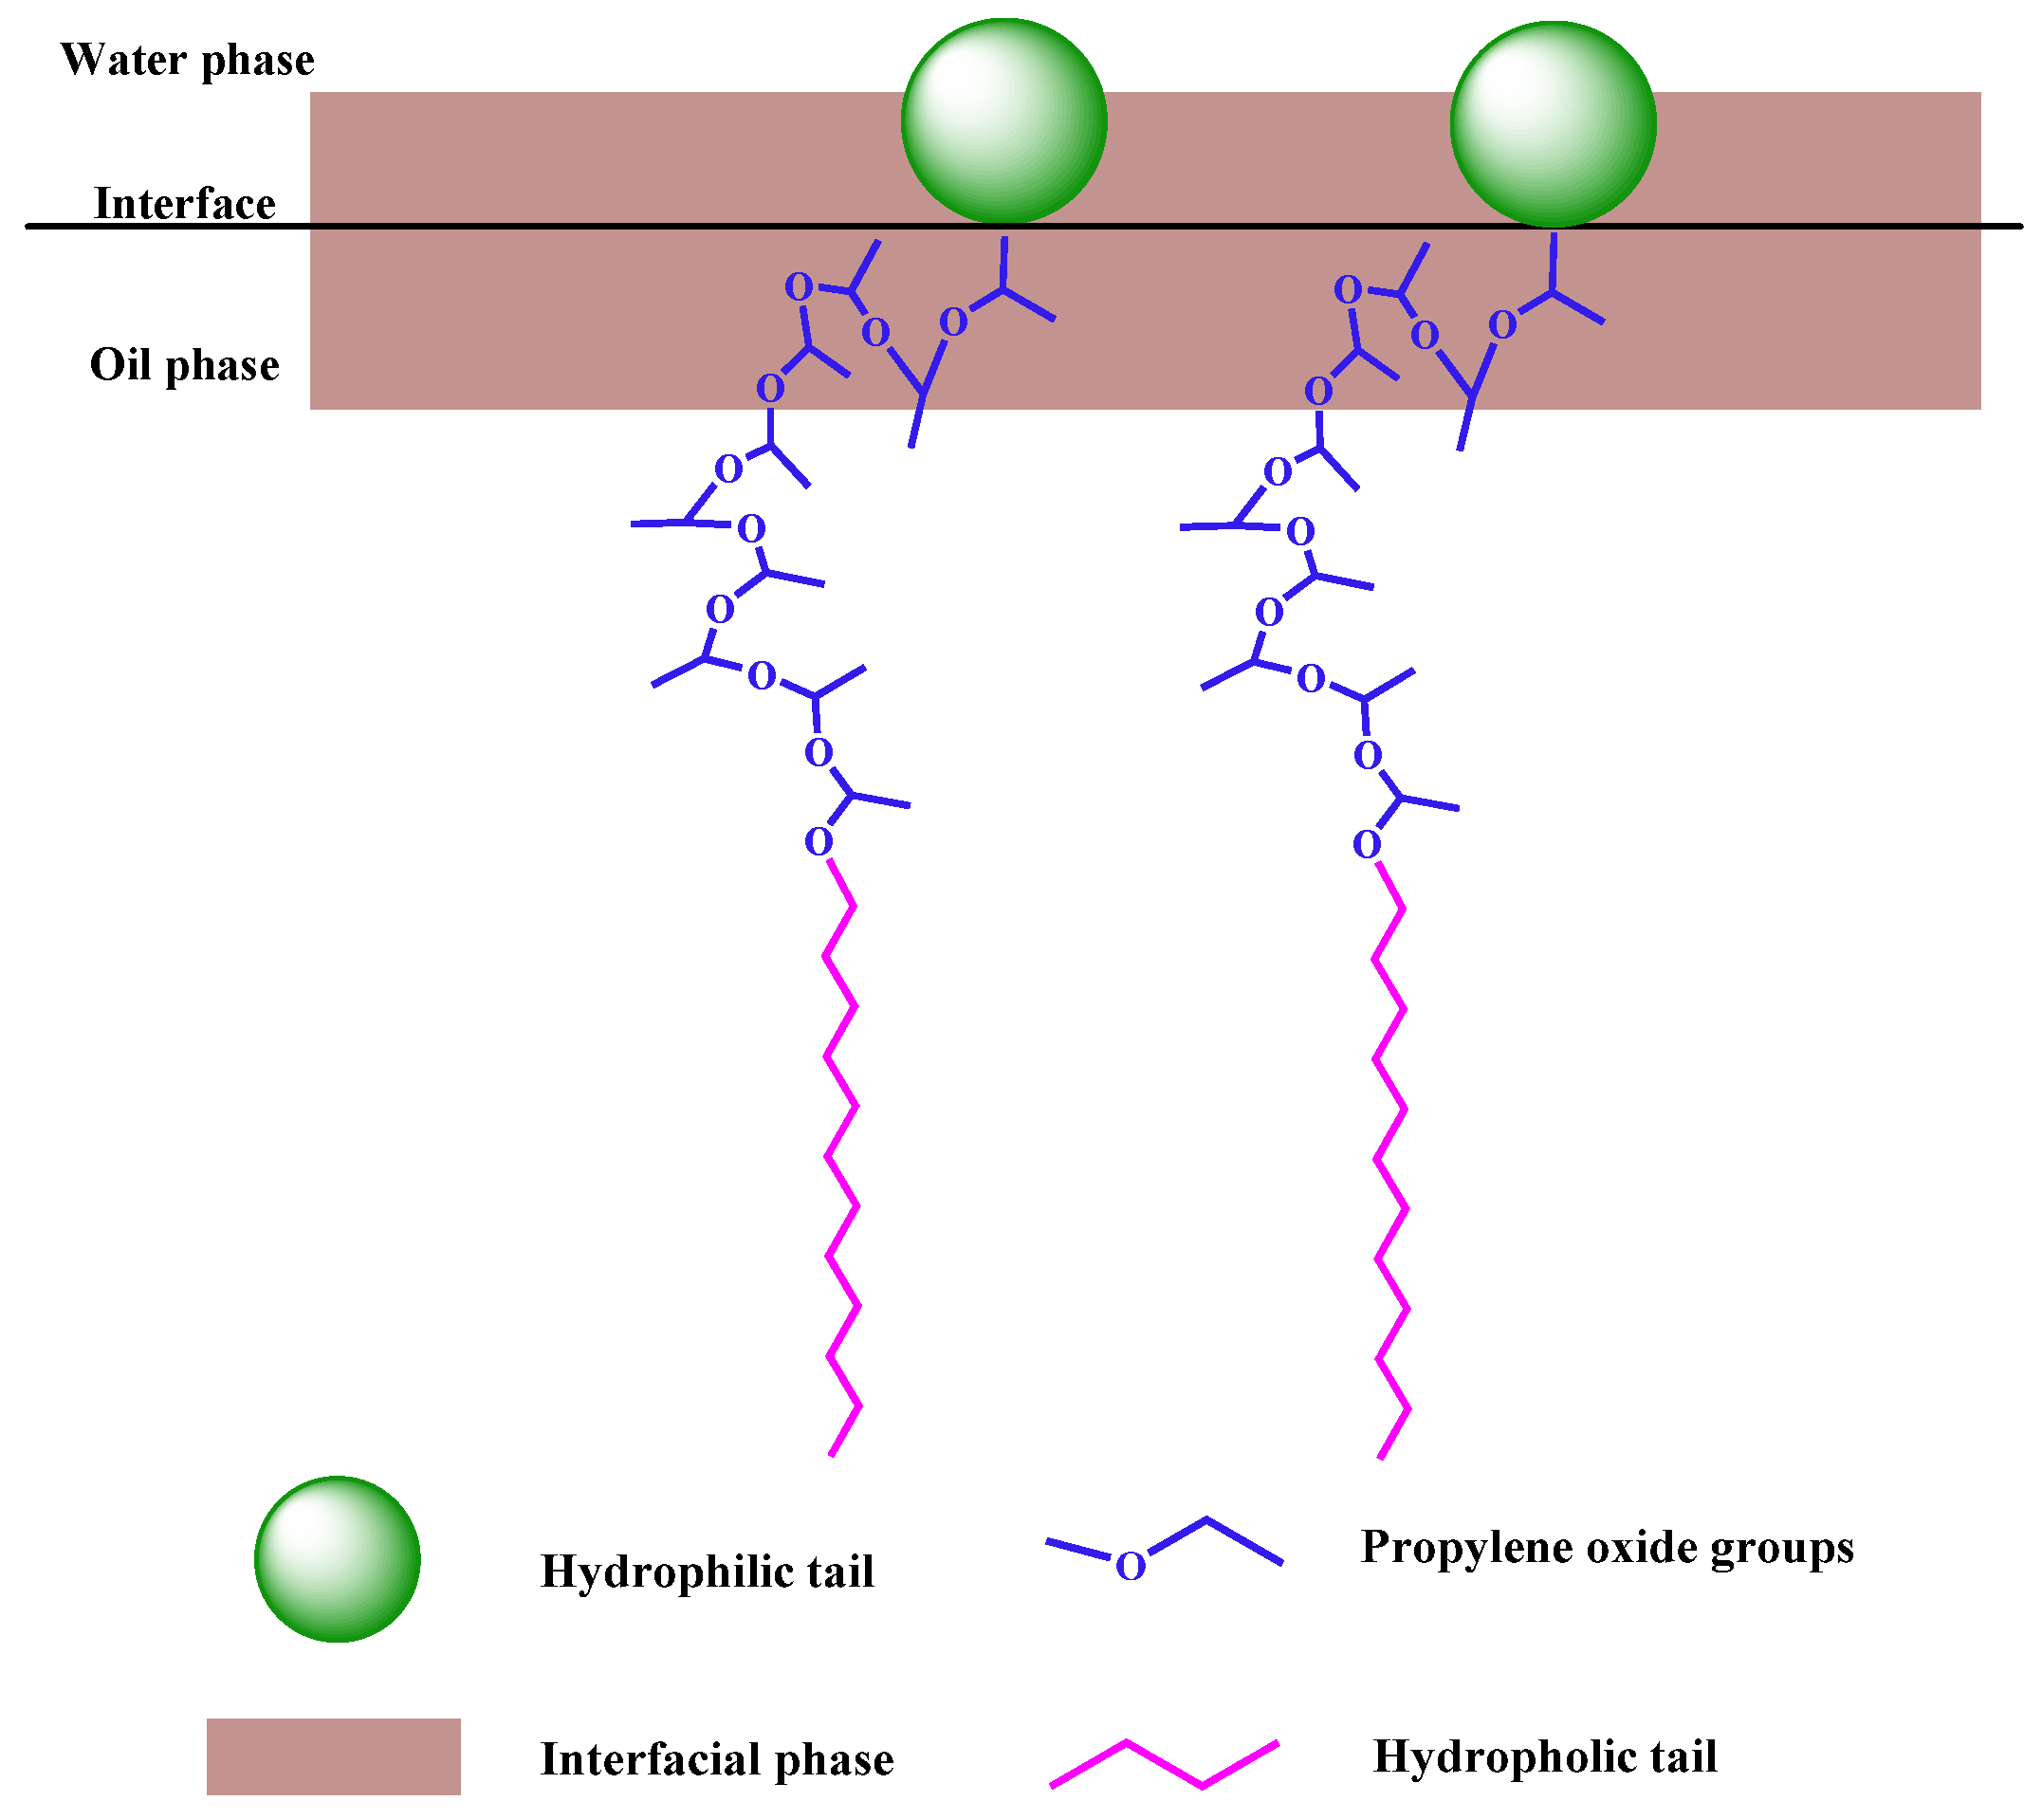
3.2. Effect of the Number of PO Groups on the Interfacial Tension of the Composite System

The change in IFT is related to the structure of surfactants, which determines the arrangement, adsorption rate, and interaction force at the oil–water interface. APS in the compound surfactant system can change the alkane chain length by introducing different numbers of PO groups, thus controlling its hydrophilic and lipophilic balance, and then regulating the IFT of the compound surfactant solution [21]. This is supported by the use of FTIR analysis to show changes in chemical bonds. An FTIR analysis of the functional groups of Series LBAS Surfactant C12PmS was carried out using an infrared spectrometer (Tensor 27, Bruker Co., Karlsruhe, Germany) with KBr compression, and the spectra are measured in the range of 4000~500 cm−1. The infrared spectrum of LBAS surfactant is shown in Figure 6. The numerical curves representing the dynamic and equilibrium interfacial tension of the series APS/LBAS composite system are shown in Figure 7.
The analysis shows that all the infrared spectra are similar, because LBAS has the same functional group, so the absorption peaks are also similar. In addition, due to the different numbers of POs, each absorption summit has a slight deviation. The six products have stretching vibrations of C-H at 3400 cm−1 and 2900 cm−1, bending vibrations of C-H at 1450 cm−1, and stretching vibrations of C-O-S at 1255 cm−1. There is an antisymmetric stretching vibration of C-O-C at 1108 cm−1 and an antisymmetric stretching vibration of S=O at 1025 cm−1 and 780 cm−1.
It can be seen from Figure 7a that the IFT of C12PO8–10S decreases with the increase in the number of PO groups, while the IFT of C12PO10–13S gradually increases with the increase in the number of PO groups. Among them, the equilibrium IFT of C12PO10S is the lowest, due to the extension of the length of the molecule after the proper number of PO groups are inserted into the molecule, which enhances the interaction between the hydrophobic chain and the oil phase. This is beneficial to the reduction in IFT and the PO group has certain hydrophobicity. From Figure 7b, it can be more intuitively observed that the equilibrium interfacial tension shows a “V” shape variation with the increase in the number of PO groups [22]. When the LBAS and C12PO10S are mixed, the interfacial tension reaches its lowest, reaching the order of 10−3 mN/m, which suggests ultra-low interfacial tension. Professor Salager’s research team [23,24] believes that the first 2–3 PO groups in the surfactant structure are likely to hydrate and aggregate near the oil–water interface, which will shorten the effective chain length. Chen et al. [12] pointed out that with the increase in PO numbers, the crimped PO chains occupy more space at the interface, which can be attributed to the disordered conformation of PO groups. When the two surfactants are closely arranged at the oil–water interface and the hydrophilic chain head groups and hydrophobic chain ends occupy almost the same volume, it is favorable to replace the solvent molecules at the interface and reduce the interfacial tension [25]. When the PO number is 10, the size of the PO chain matches the size of the anion head, which can achieve an ultra-low IFT.
The hydrophobicity of surfactants depends on the length of the alkyl chains, and the longer the length of the alkyl chains, the stronger the hydrophobicity of the surfactants [26]. It is reported that the PO group is part of the hydrophobic partial alkyl chain, which can bend to a certain extent to adapt to the oil–water interface. With the increase in PO, the hydrophobic area of APS surfactant molecules increases, and the hydrophobicity increases accordingly. However, the introduction of PO groups enhances the connection of the hydrophobic portion, due to the size mismatch between the hydrophobic and hydrophilic groups. The PO groups are either too long or too short to be matched exactly [27]. Even after twisting or extending the length of the alkyl chain, water molecules still have a chance to approach the interface from the water side. Therefore, excessively increasing the number of PO groups cannot continuously reduce the interfacial tension, and the space effect of the two surfactants and the control of the hydrophilic and lipophilic balance should be considered at the same time. In the experiment, the IFT value of C12PO10S can reach an ultra-low value in some cases, the bending degree of the PO chain has changed, and the hydrophobic and hydrophilic parts near the oil–water interface match well [17]. As shown in Figure 8, it is in this case that C12PO10S shows excellent ultra-low IFT capabilities [28].

3.3. Effect of Emulsification Stability

Emulsification is the function of making two kinds of immiscible liquids form a stable liquid–liquid dispersion system under certain conditions, which is called an emulsion. The emulsion is a thermodynamically unstable system and, with time, the water phase will slowly precipitate from the lower layer. The Turbiscan Lab dispersion stability analyzer is a special instrument for studying the stability of liquid dispersion systems by using a near-infrared pulse light source with strong penetration. After vertical scanning, two synchronous optical detectors detect the transmitted light passing through the sample and the reflected light reflected by the sample, respectively [29,30,31].
In the process of crude oil emulsification, surfactant plays an important role [32], and the change in its type will also lead to a change in emulsifying performance. The effect of the same series of compound surfactants on the emulsion instability process was studied. After a preliminary screening, it was determined that the oil–water ratio was 1:2 and that the scanning patterns of different compound systems were roughly the same, all of which were oil-in-water emulsions. Figure 9 presents a graph of the backscattered light intensity of the emulsion, which varies over time.
As shown in Figure 9, the intensity of the backscattered light from the upper part of the bottle gradually decreases over time, indicating that flocculation or agglomeration of the upper emulsion occurs and that the upper part gradually appears in the pure oil phase. Over time, the intensity of transmitted light in the lower part of the bottle gradually increases, which indicates that the lower part of the bottle begins to gradually clarify and appears in the pure water phase. The peak intensity of backscattered light occurs when the emulsion begins to flocculate and coalesce. The peak value of backscattered light gradually shifted to the middle of the bottle, indicating that as the volume of the pure water phase increased, the volume of the emulsion decreased, and transferred to the middle of the sample bottle. The distance between the backscattered light intensity variation curves represents the pace at which water precipitates from the emulsion. The larger the distance between the curves, the faster the water precipitates from the emulsion.
The stability scanning spectrum was analyzed by Turbiscan Easy Soft software 2.1.0.52, and the overall stability of the system was directly characterized by the stability kinetic index (TSI). The smaller the TSI, the smaller the changes in the light intensity of reflected and transmitted light over time, and the better the stability. We compared the TSI of emulsions with six kinds of surfactants, and the curve of changes over time is shown in Figure 10.
As can be seen from Figure 10, with the increase in the number of PO groups in the complex system, the TSI index first decreased and then increased, indicating that the stability of the emulsion first increased and then decreased. The TSI index of C12PO8–10S decreases with the increase in PO group number, indicating that the stability of the emulsion increases with the increase in PO group number. The TSI index of C12PO10–13S increased with the increase in the number of PO groups, indicating that the stability of the emulsion decreased with the increase in the number of PO groups. At this time, C12PO10S had the smallest TSI index and the best stability of the emulsion. This is because the inclusion of the proper number of PO groups in the molecule extends the length of the molecule, thus enhancing the interaction between the molecular hydrophobic chain and oil, and the spatial matching degree of C12PO10S is the highest, resulting in the interfacial film having the maximum strength. Therefore, the emulsion has the best stability and shows the same change rule as the interfacial tension [33]. The more tightly the surfactant molecules are packed into the oil–water interface, the more force there is between the surfactant, water, and oil molecules. As a result, the oil–water interface layer is thicker, the interface film is stronger, and the emulsion is more stable.

3.4. Study on the Phase Ability in the Formation of C12PO10S/APS Complex System

Winsor reported, for the first time, that the lipophilic and hydrophilic properties of surfactants in the aqueous phase will change under the action of alkali or salt, thus affecting the distribution of surfactant molecules in the oil phase and aqueous phase. The different types of microemulsion systems provided by Winsor Ⅰ (lower-phase microemulsion), Winsor Ⅲ (middle-phase microemulsion), and Winsor Ⅱ (upper-phase microemulsion) can be formed under certain conditions [34].

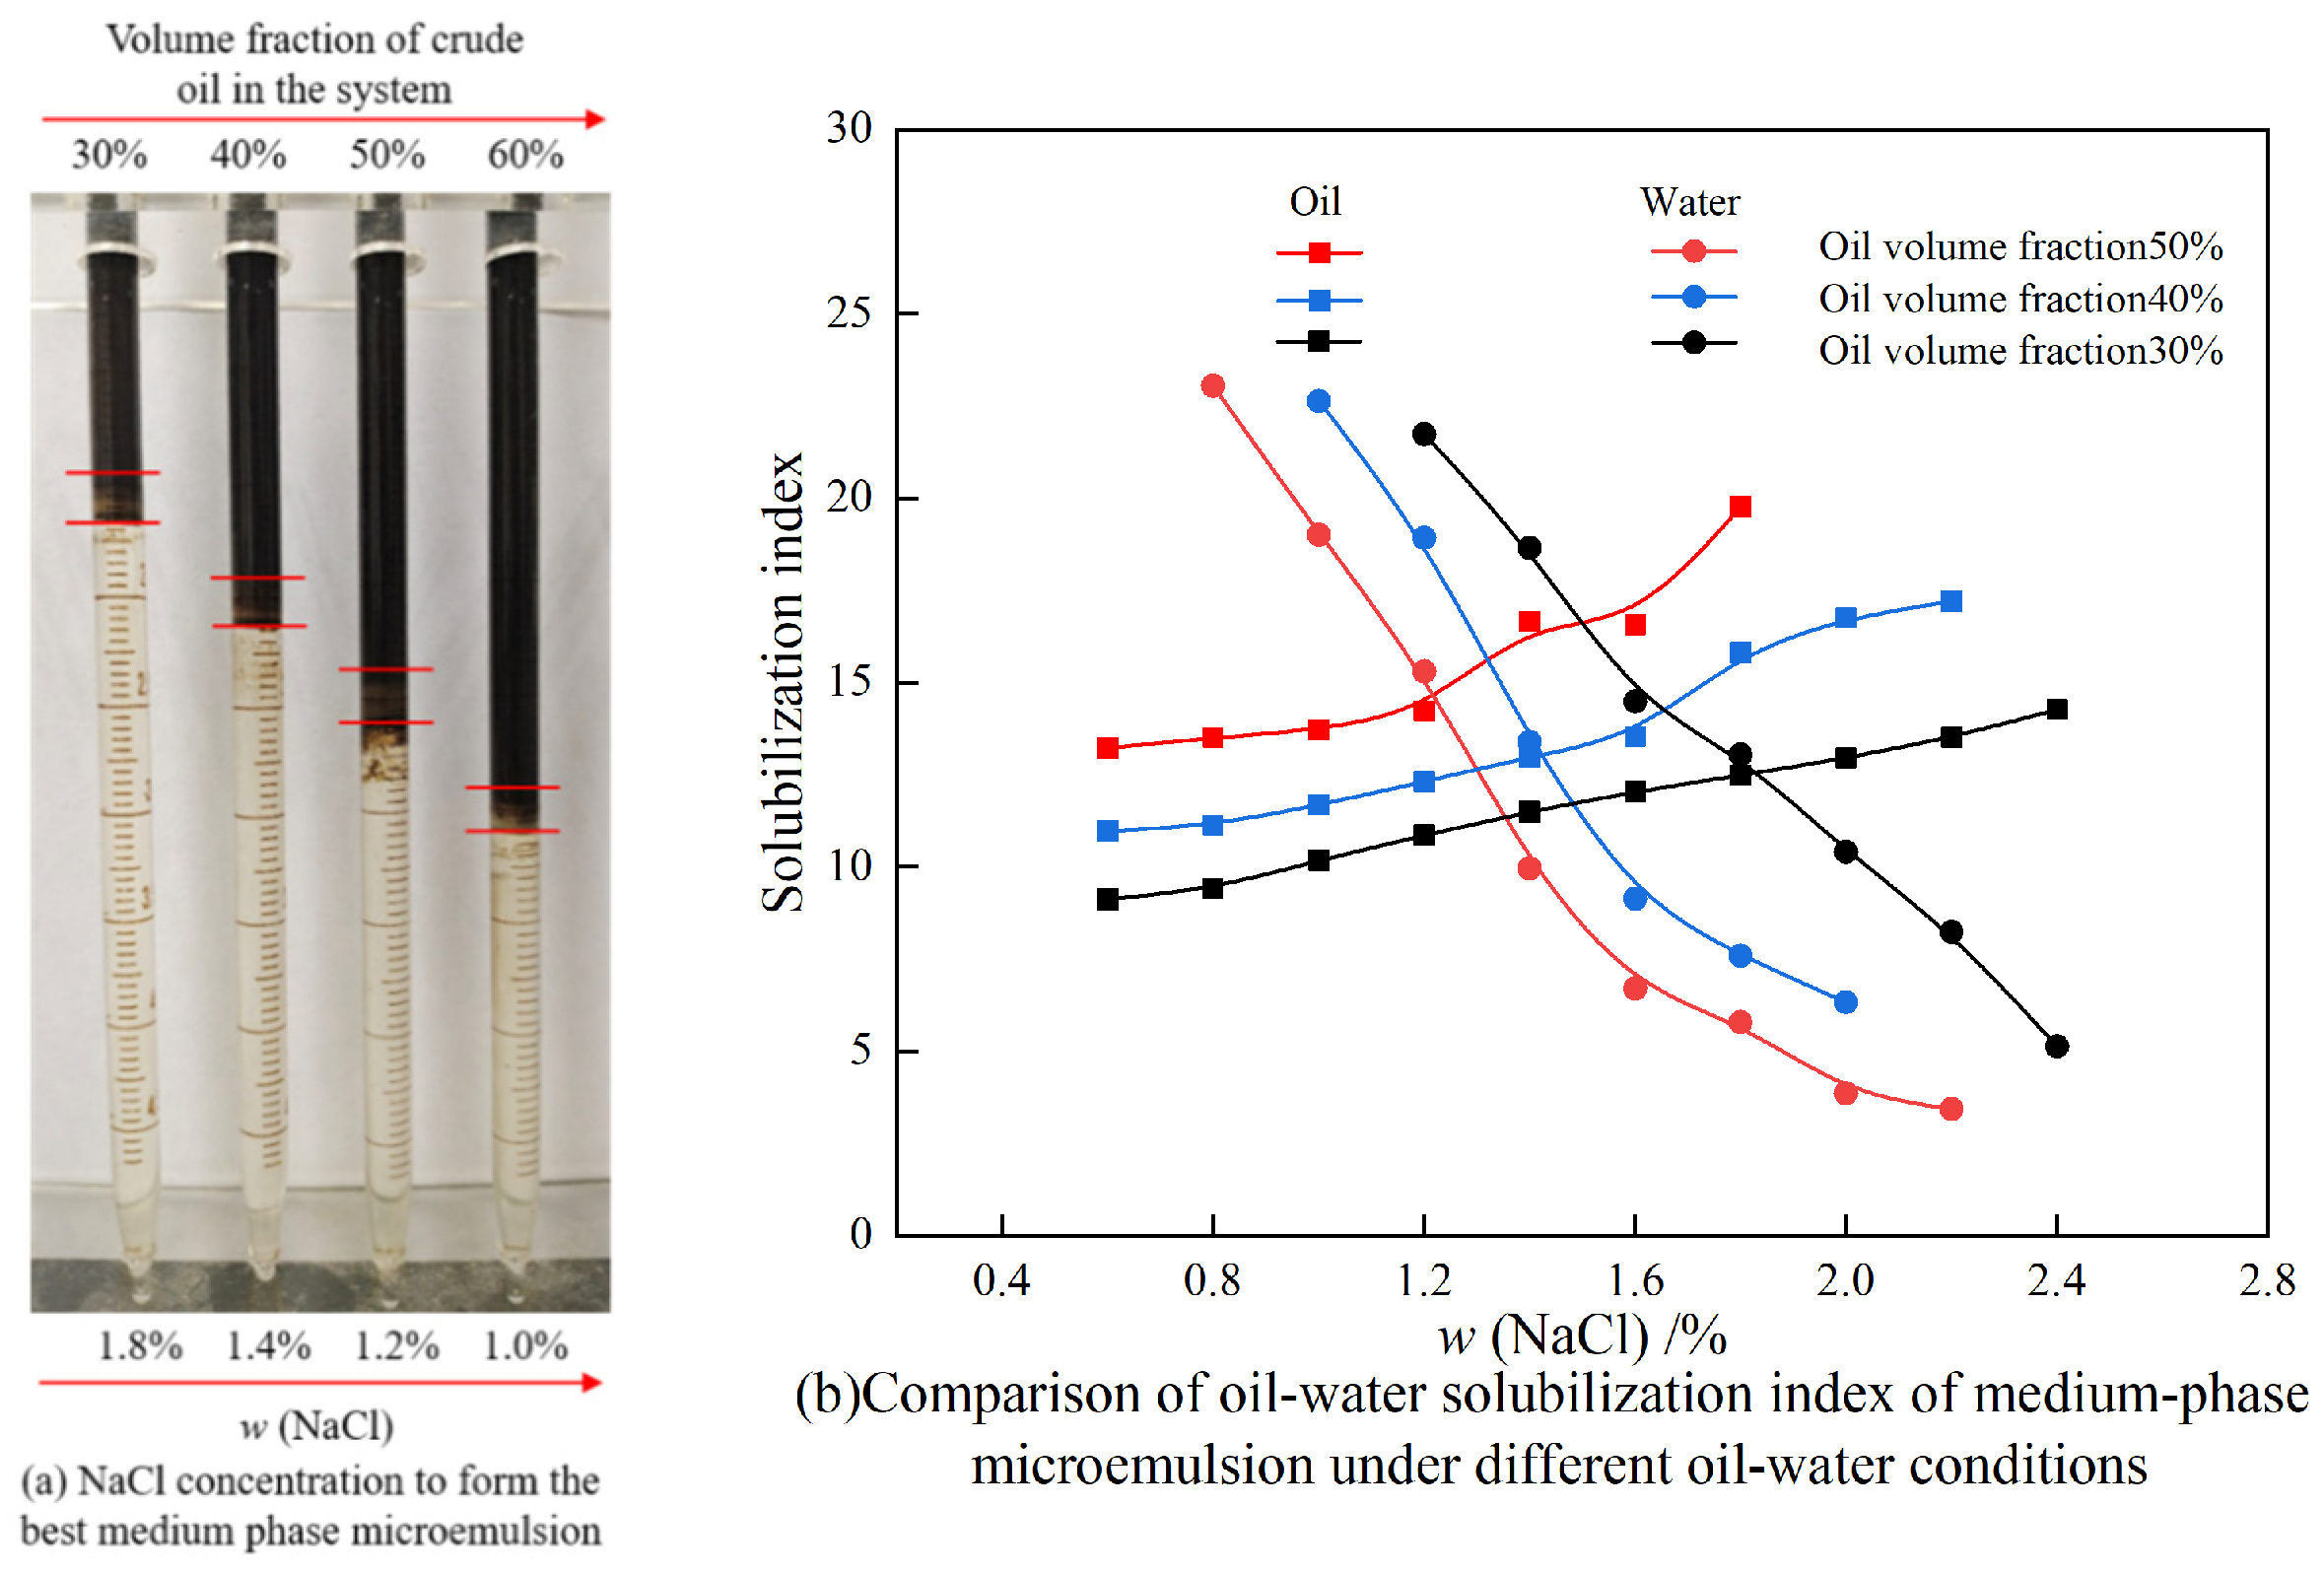
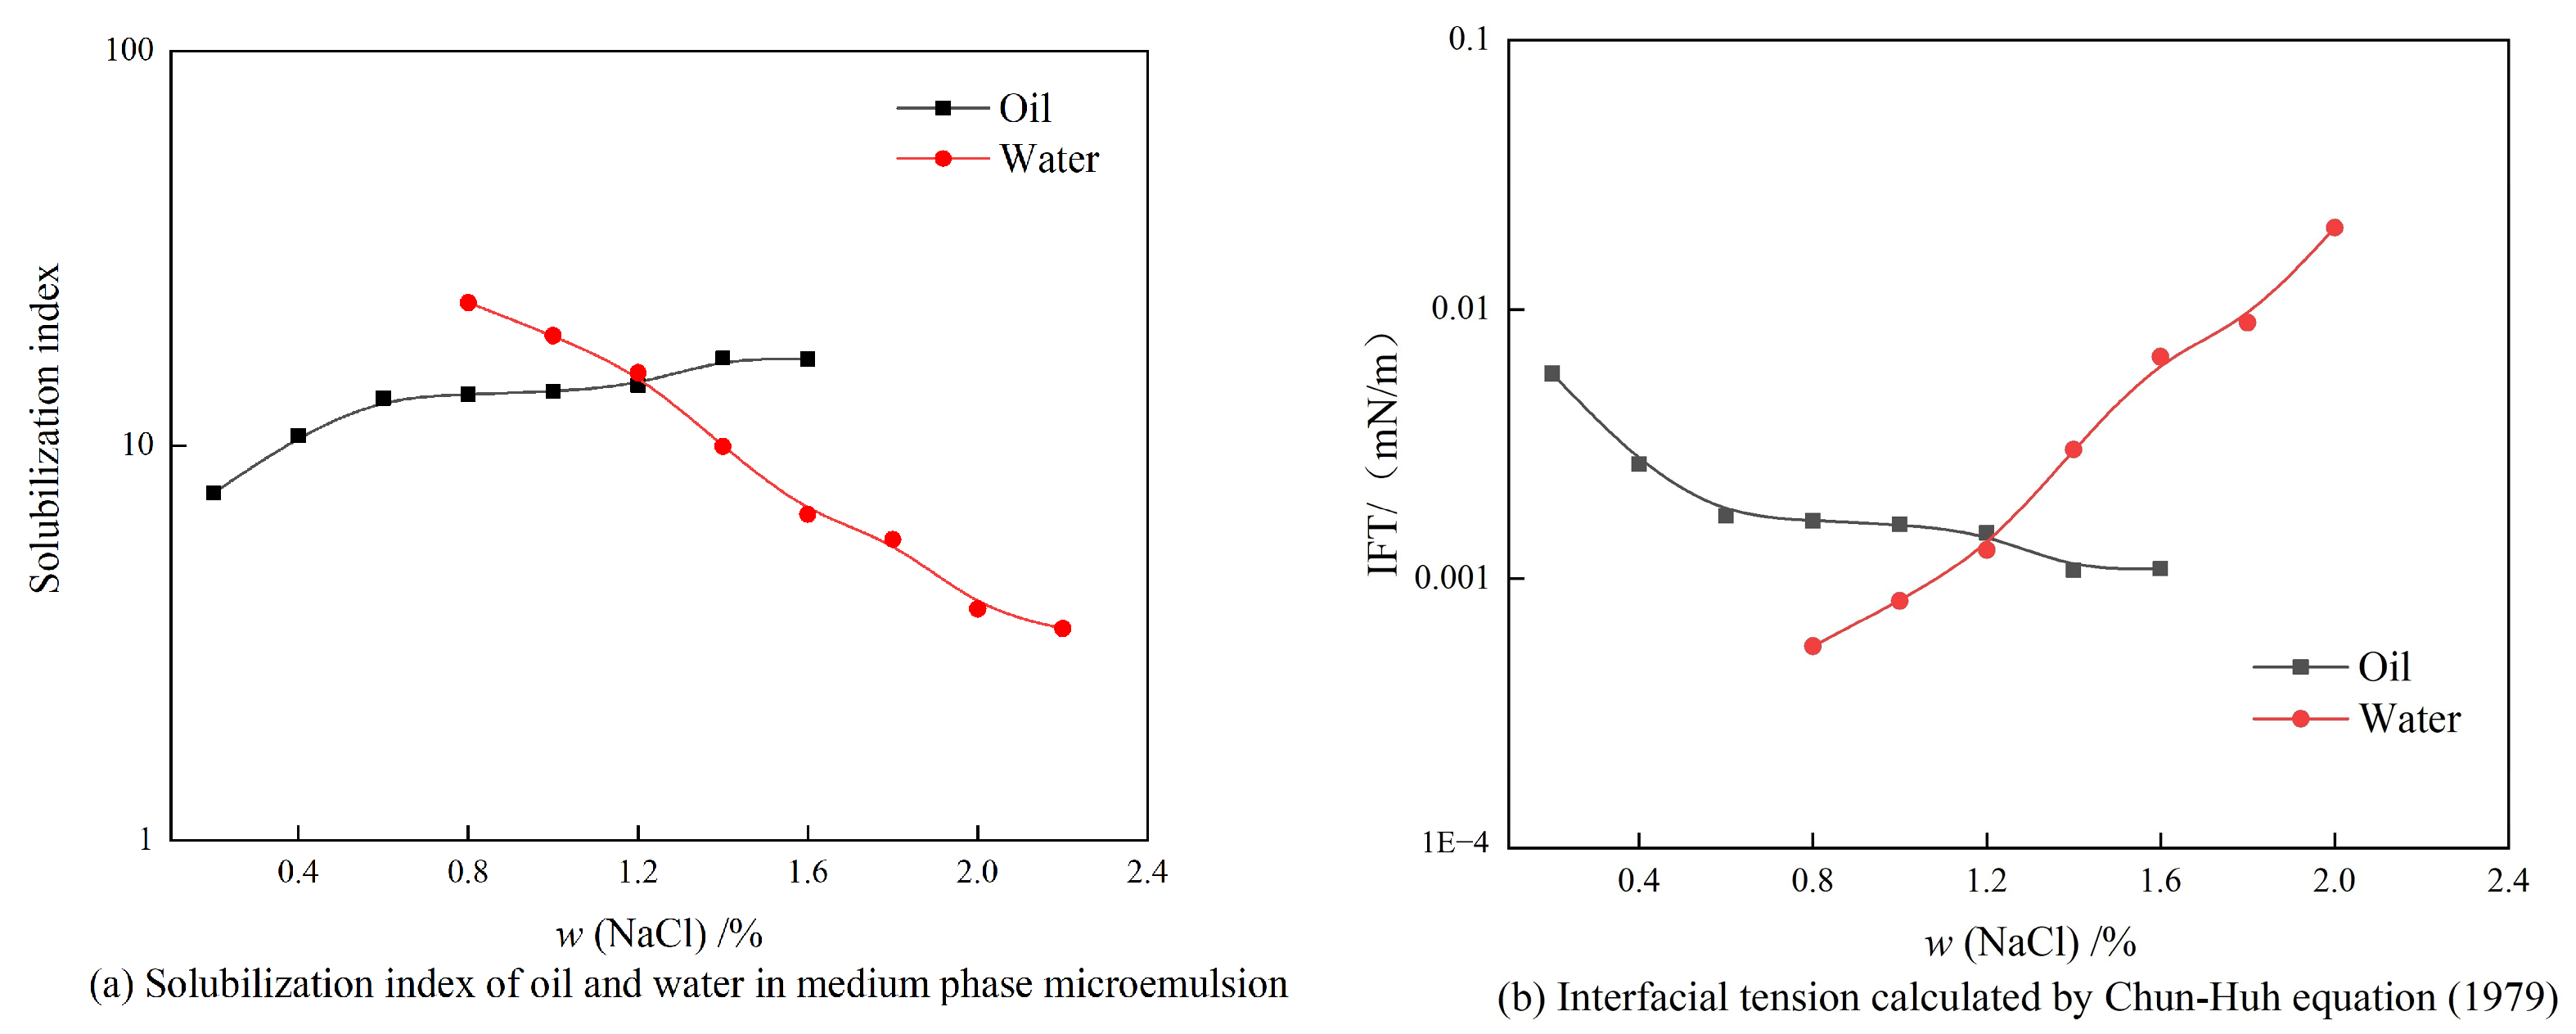
3.4.1. Effects of Different Oil–Water Ratios and NaCl Concentrations on Winsor Ⅲ Microemulsion

Figure 11 shows the experimental results of the phase behavior of the compound surfactant system under different oil–water ratios. In the experiment, the concentration of the surfactant was 0.3%. The concentration range of NaCl was 0.2%, and the oil–water ratio was 3:7, 5:5, and 6:4, respectively. The NaCl system has different optimum salt contents under different oil–water ratios; see Figure 11a. A comparison of the oil–water solubilization index of middle-phase microemulsion under different oil–water conditions is shown in Figure 11b.
As shown in Figure 11, the sodium chloride concentration corresponding to the intersection of the oil–water solubilization index curves represents the optimum salt content of the system. As the crude oil content in the system increases, the optimum salt content decreases. From the above research results, it can be seen that the compound surfactant system can form a Winsor Ⅲ microemulsion with crude oil.
According to the phase experimental results, the system has the characteristics of Winsor Ⅲ emulsion, but the volume of the mesophase is relatively small, as was confirmed. At the upper, middle, and lower positions of the system with 1.2% NaCl concentration, a certain amount of liquid was extracted, and the particle size and type of liquid were observed under a microscope. From the results in Figure 12, it can be seen that the liquid at the middle position is characterized by an obvious bicontinuous phase with both W/O-type and O/W-type structures. This indicates that the addition of the composite surfactant caused unidirectional bending at the oil–water interface, resulting in the formation of a stable bicontinuous phase.
On this basis, the phase experiment with an oil–water ratio of 5:5 was further analyzed. The solubilization indices of the oil and water phases in the microemulsions were calculated using Equations (1) and (2) based on the volumes of the excess oil and water phases and the amount of surfactant that was added. The interfacial tension of the intermediate-phase microemulsion with the oil and water phases was calculated using the Chun-Huh equation [35]. The calculation formula is as follows:
Solubilization   index   of   oil :   I o = V o / V s
Solubilization   index   of   water :   I w = V w / V s
Interfacial   tension   of   oil   phase :   γ m o = 0.3 / ( V o / V s )
Interfacial   tension   of   aqueous   phase :   γ m w = 0.3 / ( V w / V s )
where I o represents the solubilization index of the oil phase, I w represents the solubilization index of the water phase, V o represents the volume of oil in the liquid phase of the microemulsion, V s represents the volume of surfactant in the liquid phase of the microemulsion, and V w represents the volume of water in the liquid phase of the microemulsion. γ m o represents the interfacial tension between the middle-phase microemulsion and the oil phase, and γ m w represents the interfacial tension between the middle-phase microemulsion and the water phase.
Figure 13 shows the experimental results of phase behavior under an oil–water ratio of 5:5. It can be seen from Figure 13a that the oil–water solubilization index is higher than 10 in the salt concentration range of the middle-phase microemulsion, and the optimum salt content of the middle-phase microemulsion is 1.2%. The oil–water interfacial tension, calculated according to Formulas (3) and (4), reaches the ultra-low order of 10−3 mN/m, as shown in Figure 13b.

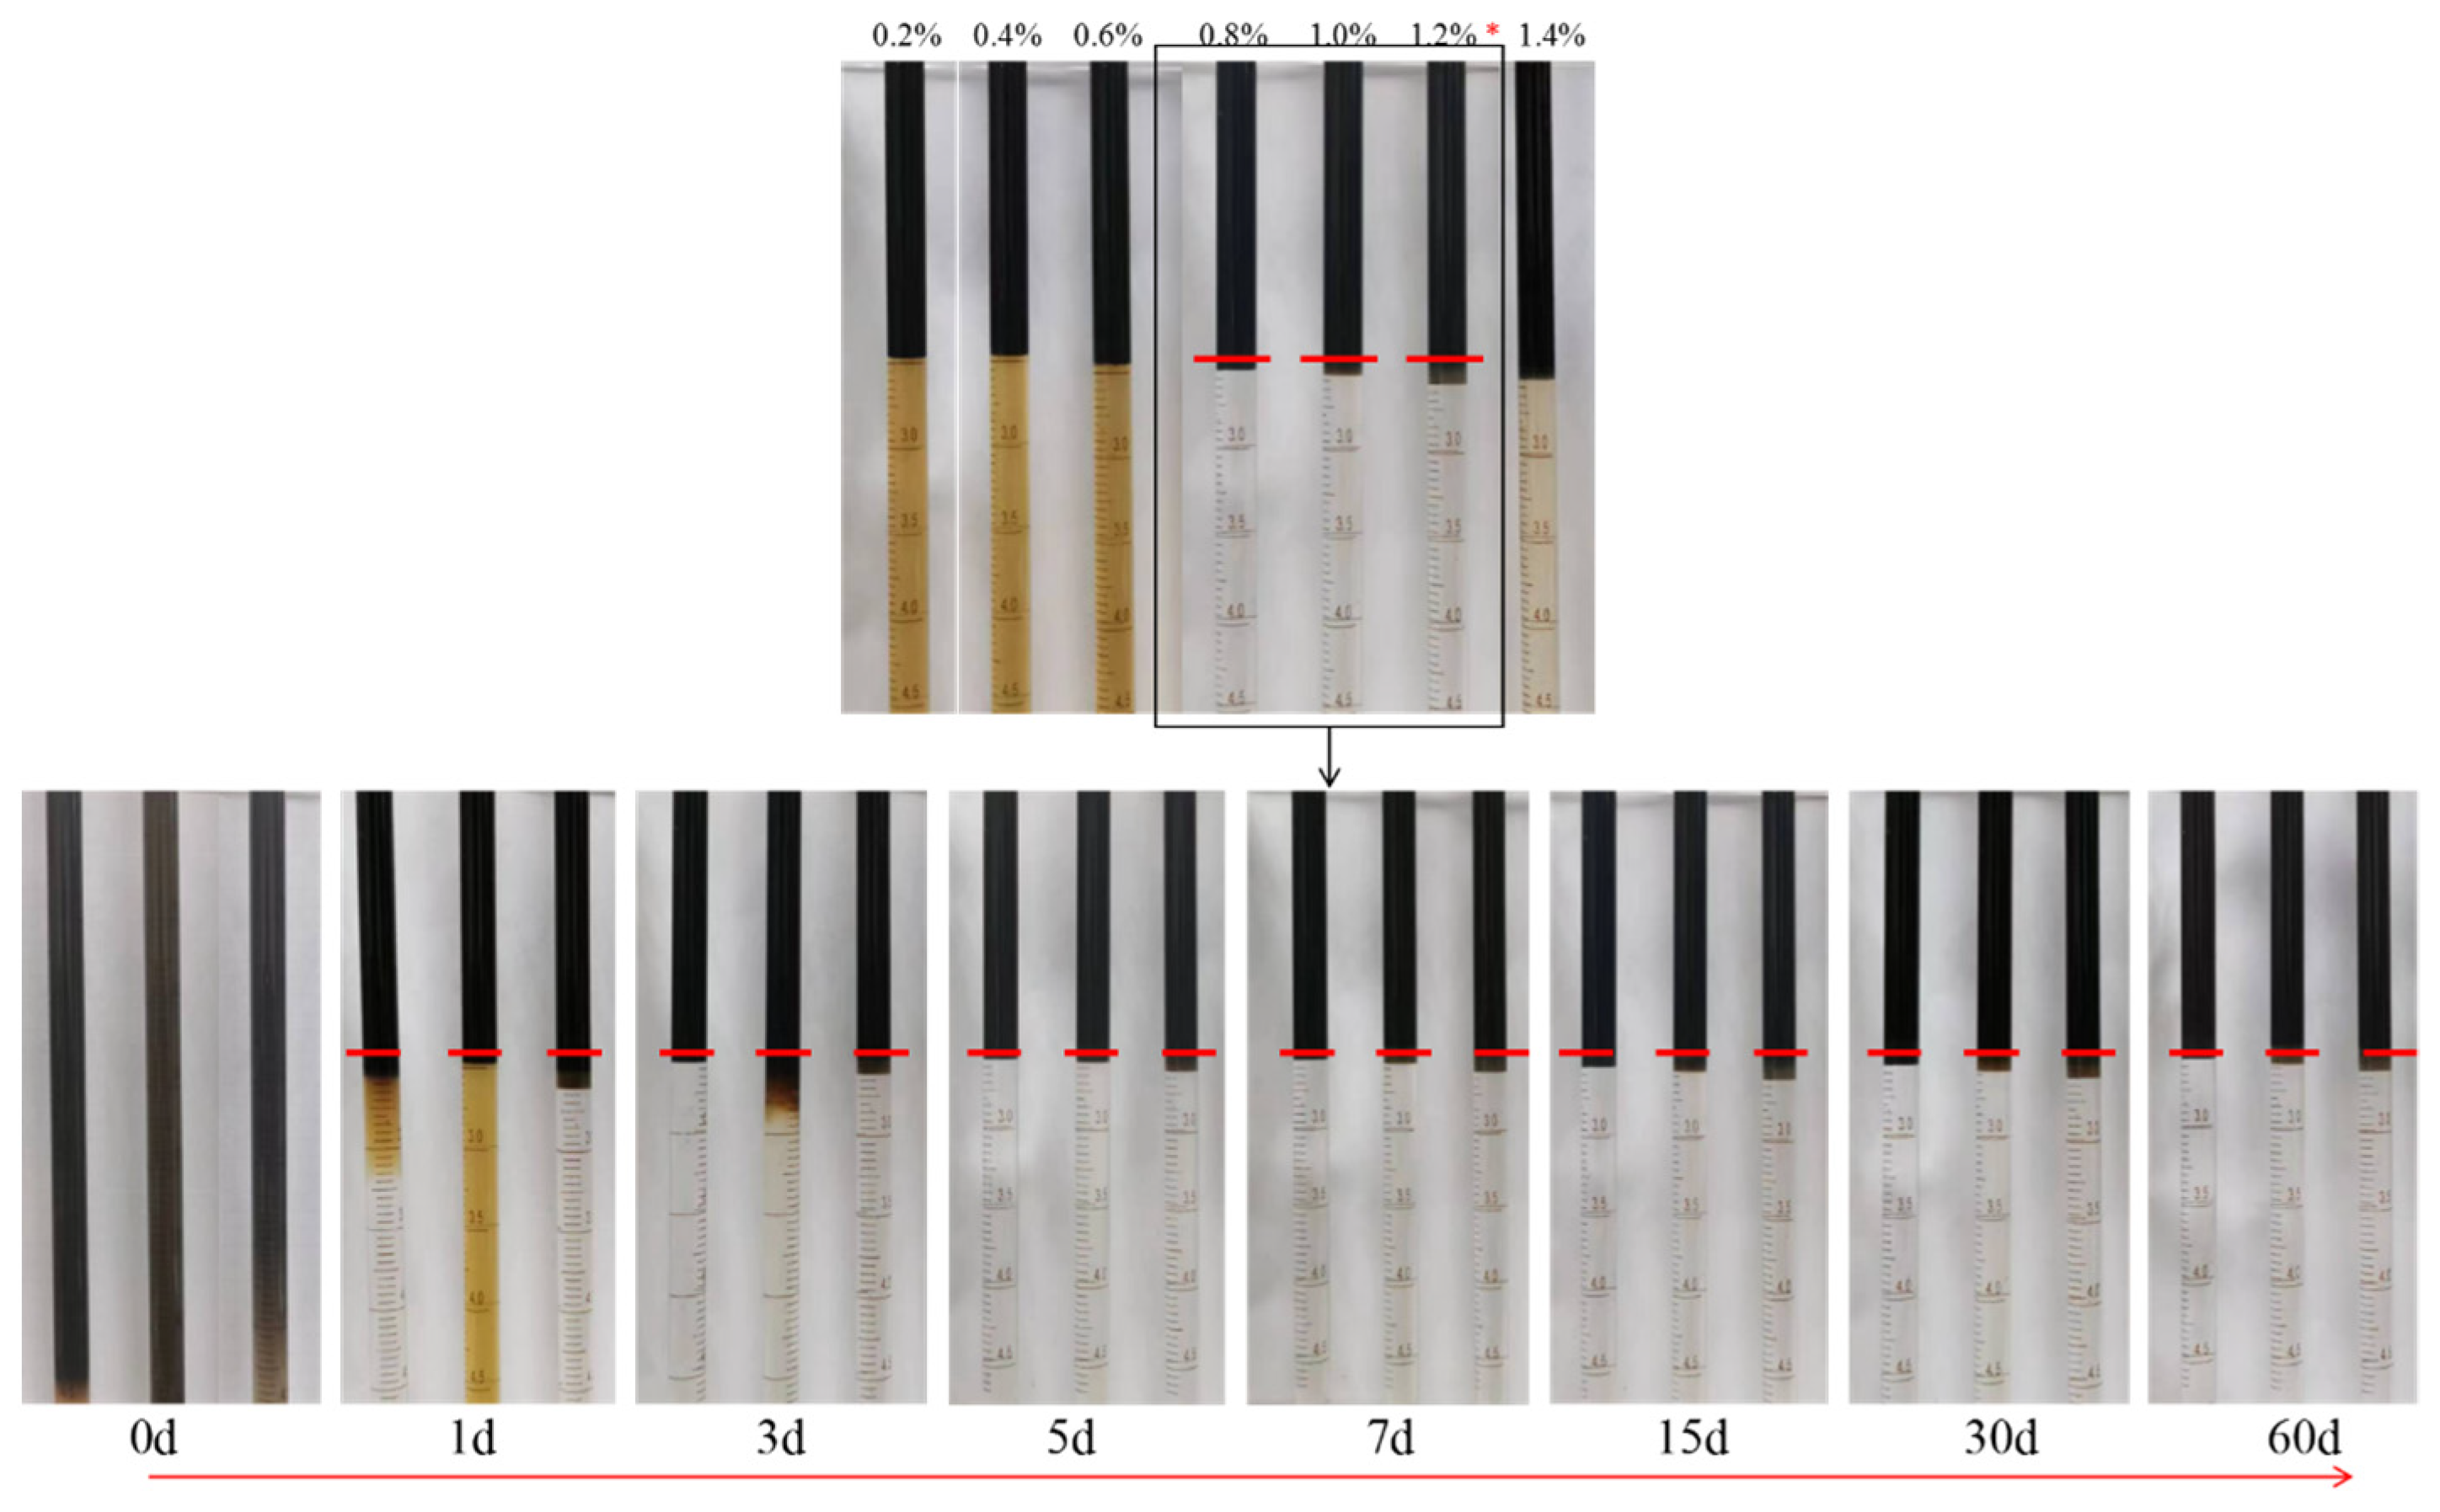
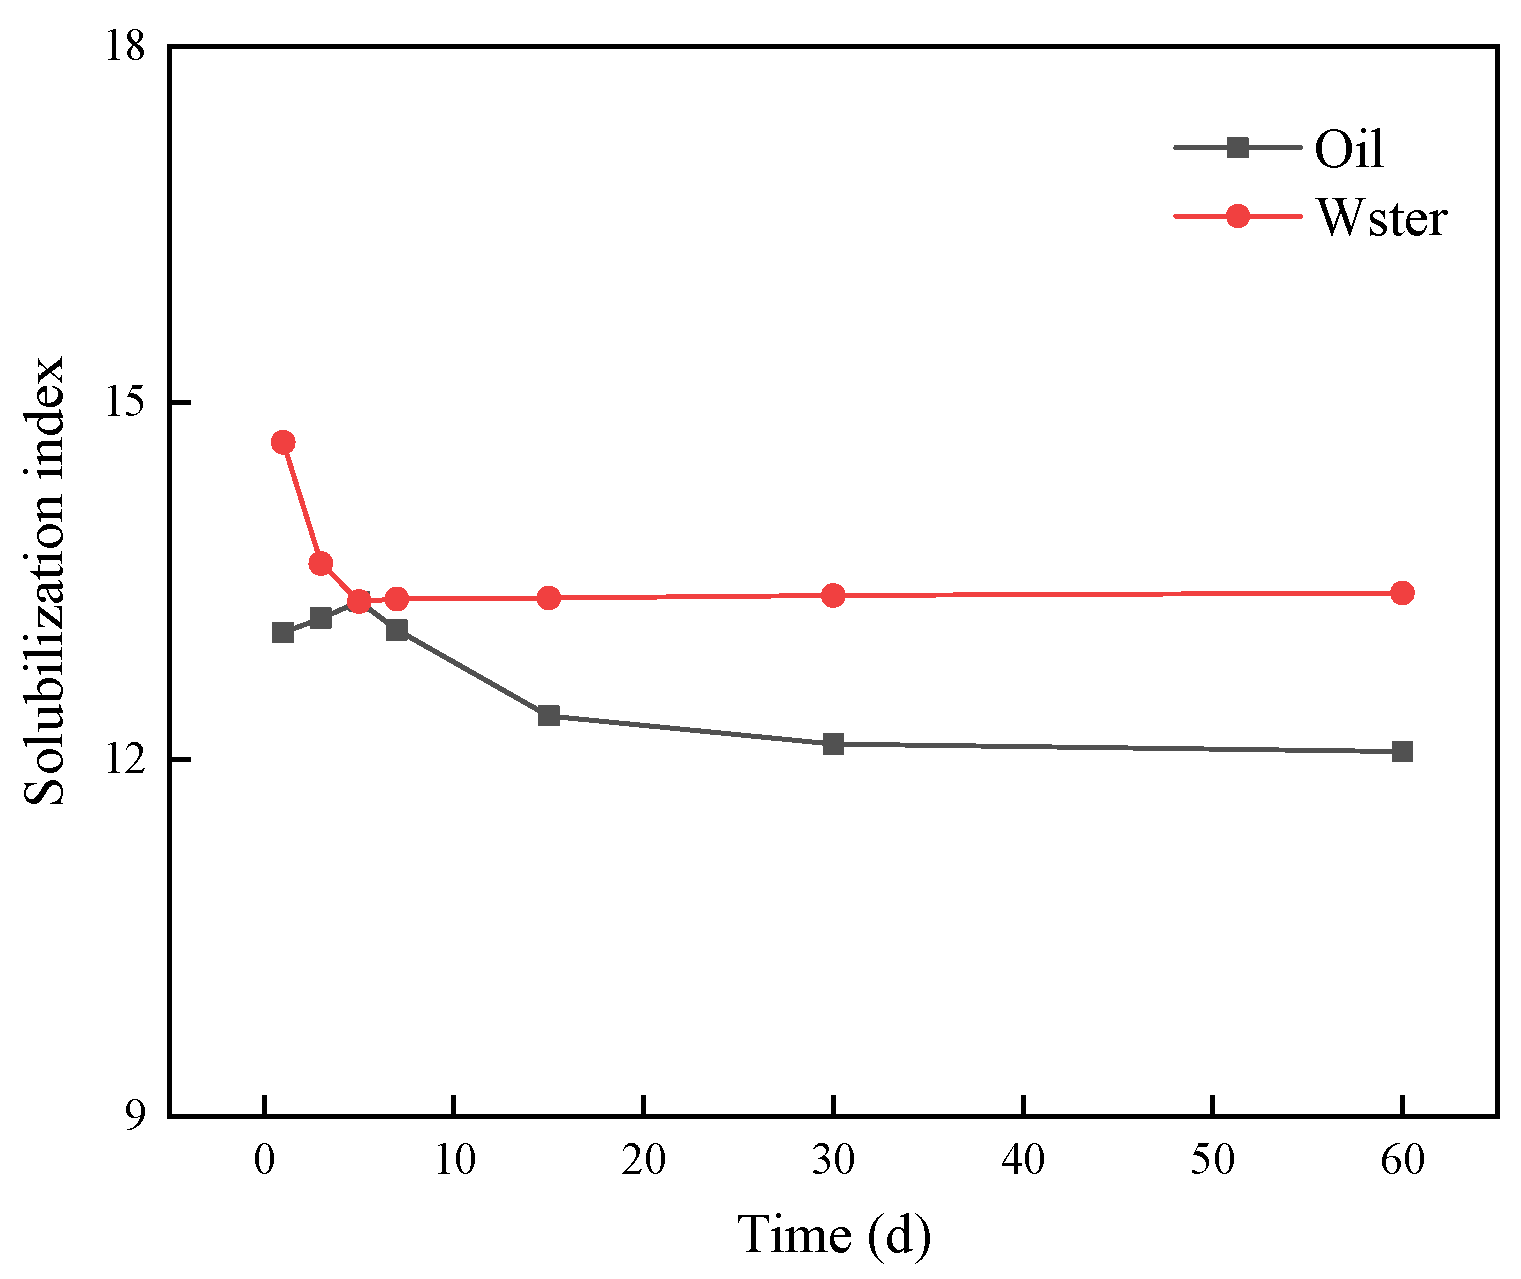
3.4.2. Evaluation of the Stability of the Winsor Ⅲ Microemulsion

Based on the research results of the effects of different oil–water ratios and NaCl concentrations on the Winsor Ⅲ microemulsion, the stability of the Winsor Ⅲ microemulsion was further evaluated, as shown in Figure 14.
It can be seen from Figure 14 that with the increase in NaCl concentration in the compound surfactant solution, the type of microemulsion changes from Winsor Ⅰ to Winsor Ⅲ, and then from Winsor Ⅲ to Winsor Ⅱ. When the NaCl concentration is less than 0.8%, with the increase in the salt concentration, part of the NaCl will neutralize the charge in the interface film, compress the electric double layer of the microemulsion droplets, reduce the critical micelle concentration of the surfactant, increase the micelle aggregation number, increase the solubilization of the oil, and form the Winsor I microemulsion. When the NaCl concentration is 0.8–1.2%, the lipophilicity and hydrophilicity of the surfactant reach equilibrium, forming a bicontinuous Winsor III microemulsion that exists when the continuous oil phase and continuous water are the same. When the NaCl concentration continues to increase above 1.2%, the lipophilicity of the surfactant increases, the bicontinuous structure is broken, and a Winsor II microemulsion is formed [36,37].
At the beginning of the preparation of the system (day 0), oil and water were fully mixed to form an emulsion. Due to the instability of the emulsion, the oil phase and water phase gradually precipitated with over time at the end of the first day, and finally, three coexisting oil–microemulsion–water phases appeared. Further observation of the volume of the microemulsion in the pipette showed that the volume of the Windsor III microemulsion changed very little. This indicates that the Windsor III microemulsion, made by mixing the complex surfactant with oil at a salt concentration of 1.2%, has good stability. The stability of the middle-phase microemulsion was further observed using the curve of the relationship between the solubilization index of oil and water and time (days) (Figure 15).
It can be seen from Figure 15 that with the increase in stabilization time, the solubilization index of the oil phase and water phase corresponding to the Winsor Ⅲ microemulsion changes slowly, which shows that the Winsor Ⅲ microemulsion formed by the compound surfactant solution and oil has good stability under 1.2% salinity.

4. Conclusions

Through the tests of salt-tolerant solubility, interfacial tension, and stability, and by evaluating the properties of the compound system of C12PO8–13S and an APS surfactant, the following conclusions are drawn.
1. The mixed system of LBAS and APS increased the NaCl concentration of the precipitation phenomenon of surfactants from 6000 mg/L to 14,000 mg/L under high salinity, and there was good compatibility between the two surfactants, indicating that the addition of anionic–nonionic surfactants improved the salt-solubility of anionic surfactants.
2. In anionic–nonionic surfactants, with the increase in PO groups, the interfacial tension of the composite system decreases at first and then increases, and the interfacial tension changes in the shape of a “V” at equilibrium. The interfacial tension of the composite of APS and C12PO10S can reach the order of 10−3 mN/m.
3. With the increase in the number of PO groups in anionic and nonionic surfactants, the emulsion stability of the system increased at first and then decreased. When APS is mixed with C12PO10S, the strength of the interfacial film is the highest, and the stability of the emulsion is the best.
4. The C12PO10S/APS composite system can form a Winsor Ⅲ microemulsion with crude oil. When the ratio of oil to water is 1:1, the optimum salt content of the NaCl system is 1.2%, and the Winsor Ⅲ microemulsion that is formed has good stability.
In future studies, the compounding system and polymer will be considered in order to configure the binary oil-repellent system, conduct core oil-repellent experiments, and realize the system formulation without alkali, which can avoid the negative impact of alkali and has potential application in the field of oil extraction.

Author Contributions

Conceptualization, B.W.; methodology, B.W. and X.W. (Xue Wang); writing—original draft preparation, X.W. (Xue Wang) and Z.Y.; writing—review and editing, F.H., X.Z. and K.W.; investigation, X.W. (Xiangyu Wang); analyze and interpret data, X.W. (Xiangyu Wang) and G.L.; supervision, G.L. and K.W. All authors have read and agreed to the published version of the manuscript.

Funding

This work was supported by the National Natural Science Foundation of China (No. 52304027), and it was also supported by the Natural Science Foundation of Heilongjiang Province of China (No. LH2020D012).

Data Availability Statement

The raw/processed data required to reproduce these findings cannot be shared at this time, as the data also forms part of an ongoing study.

Conflicts of Interest

Author Biao Wang was employed by the company The Tenth Oil Production Plant of Daqing Oilfield Co., Ltd., Authors Futang Hu and Xiuyu Zhu were employed by the com-pany Petro China Qinghai Oilfield Company, Author Xiangyu Wang was employed by the company Daqing Qingxin Oilfield Development Co., Ltd. The remaining authors declare that the research was conducted in the absence of any commercial or financial relationships that could be construed as a potential conflict of interest.

References

  1. Pu, W.F.; Du, D.J.; Tang, Y.L.; Wang, S. Synthesis of an Alkyl Polyoxyethylene Ether Sulfonate Surfactant and Its Application in Surfactant Flooding. J. Surfactants Deterg. 2018, 21, 687–697. [Google Scholar] [CrossRef]
  2. Riswati, S.S.; Bae, W.; Park, C.; Permadi, A.K.; Novriansyah, A. Nonionic Surfactant to Enhance the Performances of Alkaline-Surfactant-Polymer Flooding with a Low Salinity Constraint. Appl. Sci. 2020, 10, 3752. [Google Scholar] [CrossRef]
  3. Muhammad, S.K.; Ibnelwaleed, A.H.; Abdullah, S.S. Review on Surfactant Flooding: Phase Behavior, Retention, IFT, and Field Applications. Energy Fuels 2017, 31, 7701–7720. [Google Scholar]
  4. Nilanjan, P.; Neha, S.; Divya, L.K.V.; Ajay, M. Interfacial behaviour, wettability alteration and emulsification characteristics of a novel surfactant: Implications for enhanced oil recovery. Chem. Eng. Sci. 2018, 187, 200–212. [Google Scholar]
  5. Braccalenti, E.; Del Gaudio, L.; Belloni, A.; Albonico, P.; Radaelli, E.; Bartosek, M. Enhancing Oil Recovery with Nanoemulsion Flooding. In Proceedings of the Offshore Mediterranean Conference and Exhibition, Ravenna, Italy, 29–31 March 2017. [Google Scholar]
  6. Aljabri, N.M.; Shi, N.; Cavazos, A. Nanoemulsion: An emerging technology for oilfield applications between limitations and potentials. J. Pet. Sci. Eng. 2022, 208, 109306. [Google Scholar] [CrossRef]
  7. Zhao, X.Z.G.; Ling, Y.G.; Guang, Z.L.; Huo, X.C.; Quan, S.L.; Dong, F.; Yu, J. Micellar solubilization of petroleum fractions by heavy alkylbenzene sulfonate surfactant. J. Mol. Liq. 2021, 329, 115519. [Google Scholar] [CrossRef]
  8. Kesarwani, H.; Saxena, A.; Mandal, A.; Sharma, S. Anionic/nonionic surfactant mixture for enhanced oil recovery through the investigation of adsorption, interfacial, rheological, and rock wetting characteristics. Energy Fuels 2021, 35, 3065–3078. [Google Scholar] [CrossRef]
  9. Pal, N.; Vajpayee, M.; Mandal, A. Cationic/nonionic mixed surfactants as enhanced oil recovery fluids: Influence of mixed micellization and polymer association on interfacial, rheological, and rock-wetting characteristics. Energy Fuels 2019, 33, 6048–6059. [Google Scholar] [CrossRef]
  10. Liu, R.; Liu, R.F.; Shi, J.P.; Chu, Y.J.; Du, D.J. Interfacial Properties and Efficient Imbibition Mechanism of Anionic–Nonionic Surfactants in Shale Porous Media. Energy Fuels 2023, 37, 11955–11968. [Google Scholar] [CrossRef]
  11. Souayeh, M.; Al-Maamari, R.S.; Karimi, M.; Aoudia, M. Wettability alteration and oil recovery by surfactant assisted low salinity water in carbonate rock: The impact of nonionic/anionic surfactants. J. Pet. Sci. Eng. 2021, 197, 108108. [Google Scholar] [CrossRef]
  12. Chen, J.; Hu, X.; Fang, Y. Cooperative effects of polypropylene oxide spacers and alkyl chains on dynamic amphipathicity of extended surfactants. J. Mol. Liq. 2020, 311, 113276. [Google Scholar] [CrossRef]
  13. Liu, X.C.; Zhao, Y.X.; Li, Q.X.; Niu, J.P. Surface tension, interfacial tension and emulsification of sodium dodecyl sulfate extended surfactant. Colloid. Surf. A 2016, 494, 201–208. [Google Scholar] [CrossRef]
  14. Wang, Z.S.; Zhou, Z.H.; Han, L.; Chen, X.; He, H.J.; Zhang, Q.; Xu, Z.C.; Gong, Q.T.; Ma, G.Y.; Zhang, L. The mechanism for lowering interfacial tension by extended surfactant containing ethylene oxide and propylene oxide groups. J. Mol. Liq. 2022, 359, 119364. [Google Scholar] [CrossRef]
  15. He, H.J.; Xiao, H.; Cao, X.L.; Yuan, F.Q.; Jiang, X.D.; Zhang, L. A helical shape of polyoxypropylene chain for extended surfactant molecule at the water/oil interface: Theoretical and experimental study. Fuel 2022, 312, 122835. [Google Scholar] [CrossRef]
  16. Feng, J.J.; Yan, Z.H.; Song, J.M.; He, J.C.; Zhao, G.; Fan, H.M. Study on the structure-activity relationship between the molecular structure of sulfate gemini surfactant and surface activity, thermodynamic properties and foam properties. Chem. Eng. Sci. 2021, 245, 116857. [Google Scholar] [CrossRef]
  17. Long, G.; Yan, L.; Song, S.H. Dynamic interfacial tensions of alkyl alcohol polyoxypropylene-oxyehtylene ether sulfonate solutions. J. Petrol. Sci. Eng. 2016, 141, 9–15. [Google Scholar]
  18. Zhang, M.J.; He, Z.Q.; Mao, C.Y.; Fang, Y. Structure-activity relationship of Nonylphenol Polyether Sulfate/φ-sulfonate Surfactants. J. Jiangnan Univ. 2012, 11, 216–220. [Google Scholar]
  19. Luan, H.; Zhou, Z.; Xu, C. Study on the Synergistic Effects between Petroleum Sulfonate and a Nonionic-Anionic Surfactant for Enhanced Oil Recovery. Energies 2022, 15, 1177. [Google Scholar] [CrossRef]
  20. Wang, K.L.; Zhang, W.; Zhuang, Y.T.; Li, G.; Su, Y. Effect of Alkali and Surfactant dosage on Emulsion Stability of weak Alkali Ternary system. J. Northeast Pet. Univ. 2020, 44, 48–55. [Google Scholar]
  21. Hammond, C.E.; Acosta, E.J. On the characteristic curvature of alkyl-polypropylene oxide sulfate extended surfactants. J. Surfactants Deterg. 2012, 15, 157–165. [Google Scholar] [CrossRef]
  22. Liu, Z.Y.; Zhang, L.; Cao, X.L.; Song, X.W.; Jin, Z.Q.; Zhang, L.; Zhao, S. Effect of electrolytes on interfacial tensions of alkyl ether carboxylate solutions. Energy Fuels 2013, 27, 3122–3129. [Google Scholar] [CrossRef]
  23. Velasquez, J.; Scorzza, C.; Vejar, F. Effect of temperature and other variables on the optimum formulation of anionic extended surfactant-alkane-brine systems. J. Surfactants Deterg. 2010, 13, 69–73. [Google Scholar] [CrossRef]
  24. Forgiarini, M.A.; Scorzza, C.; Velasquez, J. Influence of the mixed propoxy/ethoxy spacer arrangement order and of the ionic head group nature on the adsorption and aggregation of extended surfactants. J. Surfactants Deterg. 2010, 13, 451–458. [Google Scholar] [CrossRef]
  25. Zhang, X.J.; Zhou, Z.H.; Han, L. Mechanism responsible for the reduction of interfacial tension by extended surfactants. Colloid. Surf. A 2022, 634, 128013. [Google Scholar] [CrossRef]
  26. Wang, M.; Chen, S.; Liu, H.E.; Ning, T.F.; Yu, Y.F.; Liu, Y.R. Effect of cosurfactant and oil-water ratio on phase behavior of microemulsion. Fine Chem. Ind. 2020, 37, 1645–1652. [Google Scholar]
  27. Zhao, S.; Zhou, Z.H.; Shang, G.Y.N. Effect of bivalent cations on the interfacial tensions of extended anionic surfactant solutions. J. Mol. Liq. 2022, 349, 118162. [Google Scholar] [CrossRef]
  28. Meng, D.L.; Cong, L.; Jian, Y. Effect of number of oxypropylene on dynamic interfacial tensions of extended surfactants. Colloid. Surf. A 2019, 570, 429–437. [Google Scholar]
  29. Mengual, O.; Meunier, G.; Cayre, I. TURBISCAN MA 2000: Multiple scattering measurement for concentrated emulsion and suspension instability analysis. Talanta 1999, 50, 445–456. [Google Scholar] [CrossRef]
  30. Yan, S.; Deac, A.; Geoff, G.Z.Z. Assessing Physical Stability of Colloidal Dispersions Using a Turbiscan Optical Analyzer. Mol. Pharmaceut. 2019, 16, 877–885. [Google Scholar]
  31. Kang, W.; Xu, B.; Wang, Y.; Yuan, L.; Shan, X.; An, F.; Liu, J. Stability mechanism of W/O crude oil emulsion stabilized by polymer and surfactant. Colloid. Surf. A 2011, 384, 555–560. [Google Scholar] [CrossRef]
  32. Chen, J.; Hu, X.Y.; Fang, Y.; Liu, H.H.; Xia, Y.M. Comparative study of conventional/ethoxylated/exte-nded n-alkylsulfate surfactants. Langmuir 2019, 35, 3116–3125. [Google Scholar] [CrossRef]
  33. Jin, Y.; Liu, D.; Hu, J. Effect of Surfactant Molecular Structure on Emulsion Stability Investigated by Interfacial Dilatational Rheology. Polymers 2021, 13, 1127. [Google Scholar] [CrossRef]
  34. Winsor, P.A. Solvent Properties of Amphiphilic Compounds; Butterworths Scientific Publications: London, UK, 1954. [Google Scholar]
  35. Huh, C. Interfacial tensions and solubilizing ability of a microemulsion phase that coexists with oil and brine. J. Colloid. Interf. Sci. 1979, 71, 408–426. [Google Scholar] [CrossRef]
  36. Ting, L.Q.; Cong, W.W.; Qing, Q.Y. Performance evaluation of microemulsion of naphthenic petroleum sulfonate complex system. Oil Gas Surf. Eng. 2023, 42, 12–17. [Google Scholar]
  37. Zhi, W.Z.; Wei, D.; Zhong, L. Properties of microemulsion formed by alkylaryl sulfonates with different chain lengths. Chem. J. Chin. Univ. 2012, 33, 395–399. [Google Scholar]
Figure 1. Structures of surfactants.
Energies 17 00513 g001
Figure 2. Salt-tolerant solubility of LBAS.
Energies 17 00513 g002
Figure 3. Results of salt-tolerance solubility of APS.
Energies 17 00513 g003
Figure 4. Results of salt tolerance and solubility of compound system.
Energies 17 00513 g004
Figure 5. Influence curve of different compound ratios on interfacial tension. (a) Dynamic interfacial tension. (b) Equilibrium interfacial tension.
Energies 17 00513 g005
Figure 6. FTIR spectrum of C12PmS.
Energies 17 00513 g006
Figure 7. Variation curve of the interfacial tension of different composite systems with time. (a) Dynamic interfacial tension. (b) Equilibrium interfacial tension.
Energies 17 00513 g007
Figure 8. Schematic illustration of surfactant close to the interface.
Energies 17 00513 g008
Figure 9. Scanning pattern of backscattered light intensity of emulsion.
Energies 17 00513 g009
Figure 10. Variation curve of emulsion stability kinetic index over time in different surfactant mixtures.
Energies 17 00513 g010
Figure 11. Phase experimental results of compound surfactant systems with different oil–water ratios.
Energies 17 00513 g011
Figure 12. A microscopic observation diagram of the fluid.
Energies 17 00513 g012
Figure 13. Experimental results of phase behavior under an oil–water ratio of 5:5.
Energies 17 00513 g013
Figure 14. Stability of the Winsor Ⅲ microemulsion formed by a mixed-surfactant system. Note: * represents the best salt concentration.
Energies 17 00513 g014
Figure 15. Solubilization index curve with time.
Energies 17 00513 g015
Table 1. Composition of simulated water in the second area of the D oil field.
Ionic SpeciesK++Na+Ca2+Mg2+ClSO42−HCO3CO32−Total
Salinity/(mg/L)1826.3915.0310.341007.0314.412297.4421.825592.53
Table 2. Total salinity of solution and concentration of Na+.
Total Mineralization Value
(mg/L)
Na+ Concentration
(mg/L)
2000787.13
40001574.26
60002361.4
80003148.53
10,0003935.66
12,0004722.79
14,0005509.92
16,0006297.06
18,0007084.19
20,0007871.32
Table 3. Salt tolerance of surfactants.
NaCl/(mg/L)LBASAPSCompound System of LBAS and APS
0CCC
2000TCC
4000TCC
6000PCC
8000YCC
10,000YCC
12,000YCP
14,000YCP
16,000YCY
18,000YCY
20,000YCY
Note: C indicates solution clarification, T indicates solution turbidity, P indicates partial precipitation of new phase formation, and Y indicates complete precipitation of new phase.
Disclaimer/Publisher’s Note: The statements, opinions and data contained in all publications are solely those of the individual author(s) and contributor(s) and not of MDPI and/or the editor(s). MDPI and/or the editor(s) disclaim responsibility for any injury to people or property resulting from any ideas, methods, instructions or products referred to in the content.

