Article

Research on Regulation Method of Variable-Air-Volume Air Conditioning System with “Personal Space”

1
School of Thermal Engineering, Shandong Jianzhu University, Jinan 250101, China
2
Gas Heating Station, Jinan Municipal Engineering Design Group, Jinan 250031, China
*
Author to whom correspondence should be addressed.
Energies 2024, 17(20), 5041; https://doi.org/10.3390/en17205041
Submission received: 29 August 2024 / Revised: 2 October 2024 / Accepted: 7 October 2024 / Published: 10 October 2024
(This article belongs to the Section G: Energy and Buildings)

Abstract

:
In large public facilities, such as airport terminals or open-plan office spaces, the HVAC system typically consumes substantial amounts of energy. However, individuals often gather at specific areas while other zones are occupied by transient or occasional users. To minimize operational energy usage, this paper aims to reduce thermal comfort demands in non-targeted areas. This paper introduces a method for regulating the thermal environment around occupants exclusively in the variable-air-volume (VAV) air conditioning running mode. The investigation utilizes Airpak modeling and experimental verification techniques. Additionally, an analysis of temperature field and velocity field distributions within the room under the “personal space” operation mode is presented. The results suggest that adjusting the numbers of air vents, openings, airflow velocities, and air supply orientations can establish a comfortable thermal environment for inhabitants and reduce the overall ADPI value. The combined air supply mode leads to a 16.7% reduction in power usage compared to traditional full-space operation.

1. Introduction

The well-being of occupants in an indoor environment is influenced by factors such as the room temperature and control availability. The adjustment goal of an air conditioning system is to keep the indoor environment within a predetermined temperature range. Arens et al. [1] conducted an experiment to investigate the effects of a personalized desk supply air velocity and temperature on local thermal comfort and the results showed that when the supply air velocity on the upper body reached 1.00 m/s and the background temperature was around 30 °C, the surrounding environment in the workstation area could still maintain a comfortable state. Habchi et al. [2] combined the personalized ceiling supply ventilation system (PCSV) with a seat fan (SF) and applied it in the office space to study the ventilation effect when office workers moved. Katherine [3] proposed an innovative personalized ventilation pattern and conducted a study on its performance. The results indicated that, in comparison to traditional ventilation methods, the Air Clothing Personalized Ventilation (ACPV) method demonstrated the highest ventilation effectiveness while meeting the requirements for human comfort and breathable air quality.
In addition to the personalized air distribution control provided by the air distribution machine, optimizing airflow organization in the ventilation system can also contribute to achieving the desired thermal comfort environment. Katharina [4] introduced a newly developed building controller that utilizes PhySCo, a dynamic physiological, sensory, and comfort model, to adjust the set-point temperature of the central HVAC system and regulate the use of PECS based on virtual individuals’ thermal sensation and comfort values. The findings demonstrated that during winter conditions, there was a 12.5% reduction in final energy usage; for summer conditions, implementing an adaptive controller along with cooling office chairs and fan adjustments allowed for maintaining a comfortable environment while raising the maximum set-point temperature to 30 °C and reducing final energy usage by 15.3%; similarly, these modifications resulted in a 9.3% decrease in final energy usage during springtime. Zhu et al. [5] proposed a multi-objective air terminal based on center projection principles for optimizing airflow organization within home air conditioning systems. The results indicate that this multi-objective air terminal effectively reduces heating sensations while ensuring uniform target area temperature field distribution and meeting people’s thermal comfort requirements. Fong et al. [6] conducted experimental studies on thermal sensation in indoor environments, comparing mixed ventilation, displacement ventilation, and sub-floor ventilation conditions. The findings demonstrated that sub-floor ventilation effectively maintains a satisfactory room temperature of up to 27 °C for optimal thermal comfort. In comparison to mixed ventilation, it exhibits a reduction of approximately 12% in the ventilation load and about 9% in energy consumption when compared with displacement ventilation. Li et al. [7] suggested that the implementation of a dynamic temperature control strategy is a viable approach to improving building energy flexibility and reducing energy consumption. Their study, which involved 30 participants and monitored changes in subjective perception and physiological responses over time, indicated that current standards limiting temperature change underestimate an individual’s heat tolerance level. These findings imply that controlling temperature fluctuations can expand the thermal comfort zone while consuming less energy, thereby eliminating the need for additional cooling equipment. Wu et al. [8] investigated skin temperature, thermal sensation, and thermal comfort under moderate temperature gradient conditions by controlling the initial temperature, temperature change rate, and gradient direction. The experimental results demonstrate that when external factors influence uncontrollable variables such as the initial temperature or gradient direction, controlling the rate of temperature change is crucial for maintaining thermal comfort. Pazhoohesh et al. [9] proposed a methodology that leverages individual participation in surveys and harnesses the benefits of comfort models to estimate temperature boundaries for HVAC set-point values based on occupants’ personal thermal preference profiles, employing fuzzy methods. The objective was to effectively regulate the HVAC system and ensure that most occupants remained within an acceptable range of thermal comfort. Zhang [10] utilized the multi-criteria decision-making technique known as OPSIS (order preference by similarity to ideal solution) to optimize ground-layer ventilation and heating operations. By establishing a ventilation performance response surface model using CFD simulations validated by experiments, the computational efficiency of TOPSIS optimization was enhanced. The study revealed that changes in outdoor weather primarily influence the optimal supply air temperature, followed by variations in the optimal supply air blade angle and volume. Li [11] conducted a study on the influence of the air supply temperature, velocity, height, and incidence angle on airflow in air conditioning design parameters such as ventilation. Numerical calculations have illustrated that connecting the waiting hall and entrance hall while supplying air separately significantly impacts airflow organization and thermal comfort in the occupied area of the waiting hall but has a lesser effect on those aspects in the entrance hall when maintaining an unchanged cooling supply scheme. When adopting a side supply approach, better uniformity is achieved in terms of velocity and temperature distribution within the occupied area of the waiting hall. Feng [12] proposed a prediction model based on a backpropagation neural network for estimating valve opening degrees. The results indicated that compared to traditional feedback regulation methods, this neural network model possesses superior approximation capabilities by directly outputting variable-air-volume terminal demand valve positions, thereby reducing the convergence time and stabilization time while enhancing energy saving effectiveness and indoor environmental comfort.
In the control strategy of VAV systems, there are still numerous aspects worthy of further study, such as sub-zone control and temperature control lag. Zhao et al. [13] proposed a thermal-sensation-and-occupancy-based cooperative control (TSOCC) method. The results showed that the TSOCC method could provide an indoor thermal environment more in line with the thermal comfort needs of the personnel and save 6–14% of daily system energy consumption compared with the temperature-set-point-based control strategy. Lei et al. [14] set up an experimental platform for a multi-zone VAV air conditioning system in the three rooms on the first floor of a building and implemented the predictive control model based on the RBF neural network. The experimental results showed that the predictive control model based on the RBF neural network was able to meet room temperature requirements. Zhang et al. [15] proposed a spatio-temporal data-driven methodology for the optimal control of central air conditioning systems. The cloud-based online test demonstrated that the proposed model-based control strategy improved the percentage of time spent achieving Grade I thermal comfort from 36.5% (i.e., existing control strategy) to 81.3%.
In brief, the objective of optimizing the operation of central air conditioning systems in such spaces should be to enable occupants to interact with their immediate thermal environments and achieve a state of comfort. To achieve this goal, it is indispensable to regulate the environmental parameters within each occupant’s adjacent ‘personal space’ rather than merely concentrating on the overall room conditions. Consequently, this paper endeavors to explore how simulation and experimental verification methods can be exploited for adjusting factors such as the angle and velocity of air supply to fulfill the thermal comfort requirements of occupants in large spaces in relation to the numbers of occupants.

2. Theoretical Framework

2.1. Simplified Assumptions of Mathematical Model

The simulation of airflow distribution in a room is appropriately simplified and the following assumptions are made:
(1)
Based on molecular kinetics theory, gas molecules’ free movement is compared with the characteristic dimensions of the room, resulting in a negligible higher-order quantity value. Consequently, it is assumed that air in the room behaves as a continuous medium.
(2)
After a certain period of time, a supply outlet airflow enters the room and fully mixes with ambient air for heat exchange. Subsequently, this achieves a steady state within the entire flow field justified, assuming constant flow characteristics.
(3)
Temperature and pressure changes in the supply air within the room are deemed insignificant; hence, air is treated as an incompressible fluid while disregarding fluid density’s influence on calculation results, satisfying the Boussinesq assumption.
(4)
Outer wall boundary conditions are classified as third boundary conditions while adiabatic boundary conditions are assigned to the remaining parts of the inner walls. Due to other objects present in the room, the slip condition for heat transfer is neglected; furthermore, complete sealing without water seepage or air leakage is assumed.

2.2. Governing Equation and Model

In the process of numerical simulation, the flow control equations serve as the fundamental framework for model solution. These equations encompass mass conservation, momentum conservation, and energy conservation [16].
(1)
Mass Conservation Equation
The continuity equation, also referred to as the mass conservation equation, is expressed as follows:
ρ t + x i ( ρ u i ) = 0 ,
Assuming an incompressible fluid with constant density, the simplified mass conservation equation for steady flow can be expressed as follows, where ρ represents gas density in kg/m3, t denotes the time in seconds, u signifies the gas flow rate in m/s, and xi represents the spatial coordinate with i ranging from 1 to 3 m.
u i x i = 0 ,
(2)
The momentum conservation equation
Commonly known as the Navier–Stokes equation, this represents a fundamental derivation of Newton’s second law in the field of fluid dynamics.
t ρ u i + x j ρ u i u j = p x i + τ i j x j + ρ g i + F i ,
The equation is defined as follows: p represents the static pressure, measured in Pascals (Pa); τij denotes the stress tensor; ρgi accounts for the volume force caused by gravity; and Fi refers to the other source term.
τ i j = μ u i x j + u j x i 2 3 μ u i x i δ i j ,
The coefficient μ in this equation represents the dynamic viscosity.
(3)
The equation of energy conservation
The specific equation representing the principle of energy conservation is as follows:
t ( ρ h ) + x i ( ρ u i h ) = x i ( k + k t ) T x i + S h ,
The equation presented herein defines the thermal conductivity, denoted as k, which arises from molecular motion and is quantified in units of W/(m·K). Temperature, represented by T and measured in degrees Celsius, plays a crucial role. Additionally, Sh denotes the source term encompassing any volume heat source. Furthermore, kt signifies the thermal conductivity attributed to turbulence (kt = cpμt/Prt), also expressed in units of W/(m·K). Lastly, h represents enthalpy (h = 298.15 T c p d T ).
(4)
Selection of turbulence model
The Airpark 3.0.16 software offers five turbulence models based on Fluent: the zero-equation model, the indoor-zero-equation model, the standard k–ε model, the RNG k–ε model, and the Spalart–Allmaras model. For this paper, we have chosen to adopt the widely used standard k–ε model as our turbulence model due to its excellent simulation and practical performance in addressing airflow and heat transfer issues within air-conditioned indoor environments. Our approach involves augmenting the zero-equation model with two additional equations for turbulent kinetic energy (k) and the turbulent kinetic dissipation rate (ε).
The relevant formula is presented below:
G k = μ t ( ν i x j + ν j x i ) ν i x j ,         G b = β g i μ t σ T T x i ,
c μ = 0.09 , σ k = 1.0 , σ ϵ = 1.3 , σ 1 = 1.44 , σ 2 = 1.92
The transport equation is associated with the dissipation rate of flow. Let k and ε be defined. Consequently, the standard k–ε model can be represented by the three fundamental equations in addition to the following two equations.
Turbulent kinetic energy k equation:
t ( ρ k ) + x j ( ρ k v j ) = x j ( μ + μ t σ k ) k x j + G k + G b ρ ε ,
Turbulent dissipation rate ε equation:
t ( ρ ε ) + x j ( ρ ε v j ) = x j ( μ + μ t σ ε ) ε x j + ε k c 1 ( G k + G b ) c 2 ρ ε ,
(5)
Selection of radiation model
In Airpark, two kinds of models are provided to model radiation: the S2S (surface to surface) model and DO (discrete ordinates) models, among which the S2S model is widely used in various scenarios due to the small amount of calculation required. When using the S2S model, Airpark can specify any object to exchange radiant energy with other objects in the model or with objects with remote temperatures. Radiant heat transfer is defined as follows:
q = σ e F ( T s u r f a c e 4 T r e m o t e 4 )
Here, Tsurface is the surface temperature of the object in °C, Tremote is the temperature of the surface with which the radiation heat is exchanged in °C, σ is the Stefan Boltzmann constant, F is the Angle coefficient, and e is the emissivity of the surface of the object, which is a part of the material properties of the surface.

2.3. Boundary Conditions

Airpak 3.0.16 is an internationally popular commercial CFD software [17], specially applied in the HVAC field, that can accurately simulate the phenomena of gas flow and heat transfer inside a study object. It has the characteristics of fast simulation speed, less design risk, and low operating cost and has been widely used in the design of air conditioning and ventilation systems in various public and civil buildings. After selecting the appropriate turbulence model and establishing the physical model, it is essential to define the boundary conditions. In Airpak’s numerical simulation, these boundary conditions primarily encompass four types: velocity boundaries, free boundaries, solid wall boundaries, and fixed heat flux boundary conditions.
(1)
A velocity inlet boundary is employed at the supply air outlet, with u1 = 1.90 m/s, u2 = 1.60 m/s, and u3 = 1.80 m/s as the respective supply air velocities for u1, u2, and u3.
(2)
The return air outlet is considered a free boundary condition. To simplify calculations, the supply air outlet in this simulation is transformed into a simplified opening based on its actual size while defining the supply air temperature, velocity, and direction. The supply air volume is calculated accordingly while assuming that the flow at any time at the exit of the calculation domain is fully developed for ease of computation.
(3)
The walls, floors, and ceilings are all solid boundaries that remain fixed throughout. In Airpak simulations, solid wall heat boundary conditions primarily include fixed heat fluxes, fixed-temperature convective heat transfer coefficients, and external radiation heat transfer effects. For this particular simulation, the envelope structure’s boundary conditions are determined as type three boundaries employing no-slip solid wall conditions where fluid velocity defaults to zero at the wall surface while maintaining equal temperatures between the wall surface (Tw) and surrounding fluid (T), i.e., u = 0 and Tw = T.
(4)
The laptop computer, incandescent lamp, and occupants are treated as constant heat flux boundary conditions with respective heat flux values of q1 = 100 W, q2 = 34 W, and q3 = 75 W.

2.4. Thermal Environment Evaluation Index

The thermal environment in air-conditioned rooms has a direct impact on individuals’ well-being, productivity, and overall health; therefore, it is imperative to conduct a comprehensive evaluation of indoor thermal conditions. Various physical factors influence the indoor thermal environment, leading to different emphases in evaluation standards. In addition to temperature and air velocity requirements specified in work area codes, this section will assess the indoor thermal environment considering airflow organization and human thermal comfort perspectives.

2.4.1. Nonuniform Coefficient

The coefficient of unevenness serves as an indicator that quantifies the non-uniformity in air heat exchange or the presence of variations in indoor heat sources, resulting in an imbalanced distribution of airflow within air-conditioned spaces. This encompasses coefficients for temperature unevenness and velocity irregularities [18].
σ v = ( v p v ) 2 n 1       σ t = ( t p t ) 2 n 1
In this formula, n represents the number of measurement points; v and t denote the temperature and velocity, respectively, at any point within the working area; vp and vt represent the average values of temperature and velocity for the n measurement points; and σt and σv indicate the root mean square deviations of temperature and velocity, respectively. As the uniformity coefficient approaches 0, it signifies a more homogeneous distribution of temperature and velocity fields in the room, indicating a more rational organization of airflow.

2.4.2. Air Diffusion Performance Index ADPI

The temperature and airflow velocity in an air-conditioned environment can lead to discomfort when they are excessively high or low. To evaluate human comfort, the American Society of Heating, Refrigerating and Air-Conditioning Engineers (ASHRAE) [19] employs the concept of the effective temperature difference, which is precisely defined thus:
θ = ( t r t x ) 7.66 ( v x 0.15 ) ,
In the equation, tr represents the ambient room temperature in degrees Celsius, tx denotes the temperature at any given point within the room in degrees Celsius, and vx signifies the air velocity at any given point within the room in meters per second. When −1.7 °C < θ < 1.1 °C and vx < 0.35 m/s, the situation indicates satisfactory overall air conditioning performance with minimal discomfort experienced by most individuals. Values exceeding or falling below this range suggest a noticeable sensation of airflow. The Air Distribution Performance Index (ADPI) compares the number of effective temperature differences within this specified range to the total number of measurement points to assess how air temperature and air velocity affect human comfort in an air-conditioned environment.
A D P I = ( 0.7 < θ < 1.1 )   n u m b e r   o f   p o i n t s T o t a l   n u m b e r   o f   m e a s u r i n g   p o i n t s × 100 %
The Air Distribution Performance Index (ADPI) provides a comprehensive evaluation of the airflow organization in an air-conditioned room, ensuring optimal comfort for all occupants. A value of 100% indicates excellent airflow distribution while values above 80% generally signify satisfactory overall airflow organization. This index primarily considers the combined impact of air temperature and air velocity on human comfort, making it a widely used metric to assess localized airflow organization during air conditioning operation.

3. Simulation Research and Result Analysis

3.1. Setting of Research Objects and Simulated Working Conditions

The modeled room has geometric dimensions of 18 m × 11 m × 3.9 m, with the north wall being an exterior wall featuring four windows measuring 2 m × 2 m that connect to the outdoor area and the south wall being connected to a corridor. There are two doors on either side of the south wall measuring 2.05 m × 0.95 m each. The east and west walls are adjacent to an air-conditioned room while both the floor and ceiling also share this adjacency feature with the air-conditioned space. Both sides of the room have assumed equal temperatures and insulation properties; meanwhile, its southern section serves as an office area while its central portion functions as a meeting area complete with six supply air outlets (each having an area of 0.12 m × 0.28 m) along with three return air outlets located above the windows on the roof (each having an area of 0.35 m × 0.15 m). A three-dimensional coordinate system has been established in the Airpak 3.0.16 software using the east wall, south wall, and floor as origin points wherein the positive direction for the X-axis is westward, the Y-axis upwardly oriented, and the Z-axis points towards the northward direction. Office furniture alongside common office equipment has been provided within this space wherein people remain seated statically at a height of approximately 1.4 m, as shown in Figure 1.
The north outer wall is made of a 300 mm thick B04-grade autoclaved light sand aerated concrete block and the heat transfer coefficient K1 is 0.55 W/(m2·K). The interior wall is made of 200 thick aerated concrete blocks and the heat transfer coefficient K2 is 1.05 W/(m2·K). The outer window is made of PA heat-breaking aluminum-alloy hollow transparent glass and the heat transfer coefficient K3 is 2.6 W/(m2·K). The rooms are located on four floors above the ground and the floor is made of the same material as the interior walls.
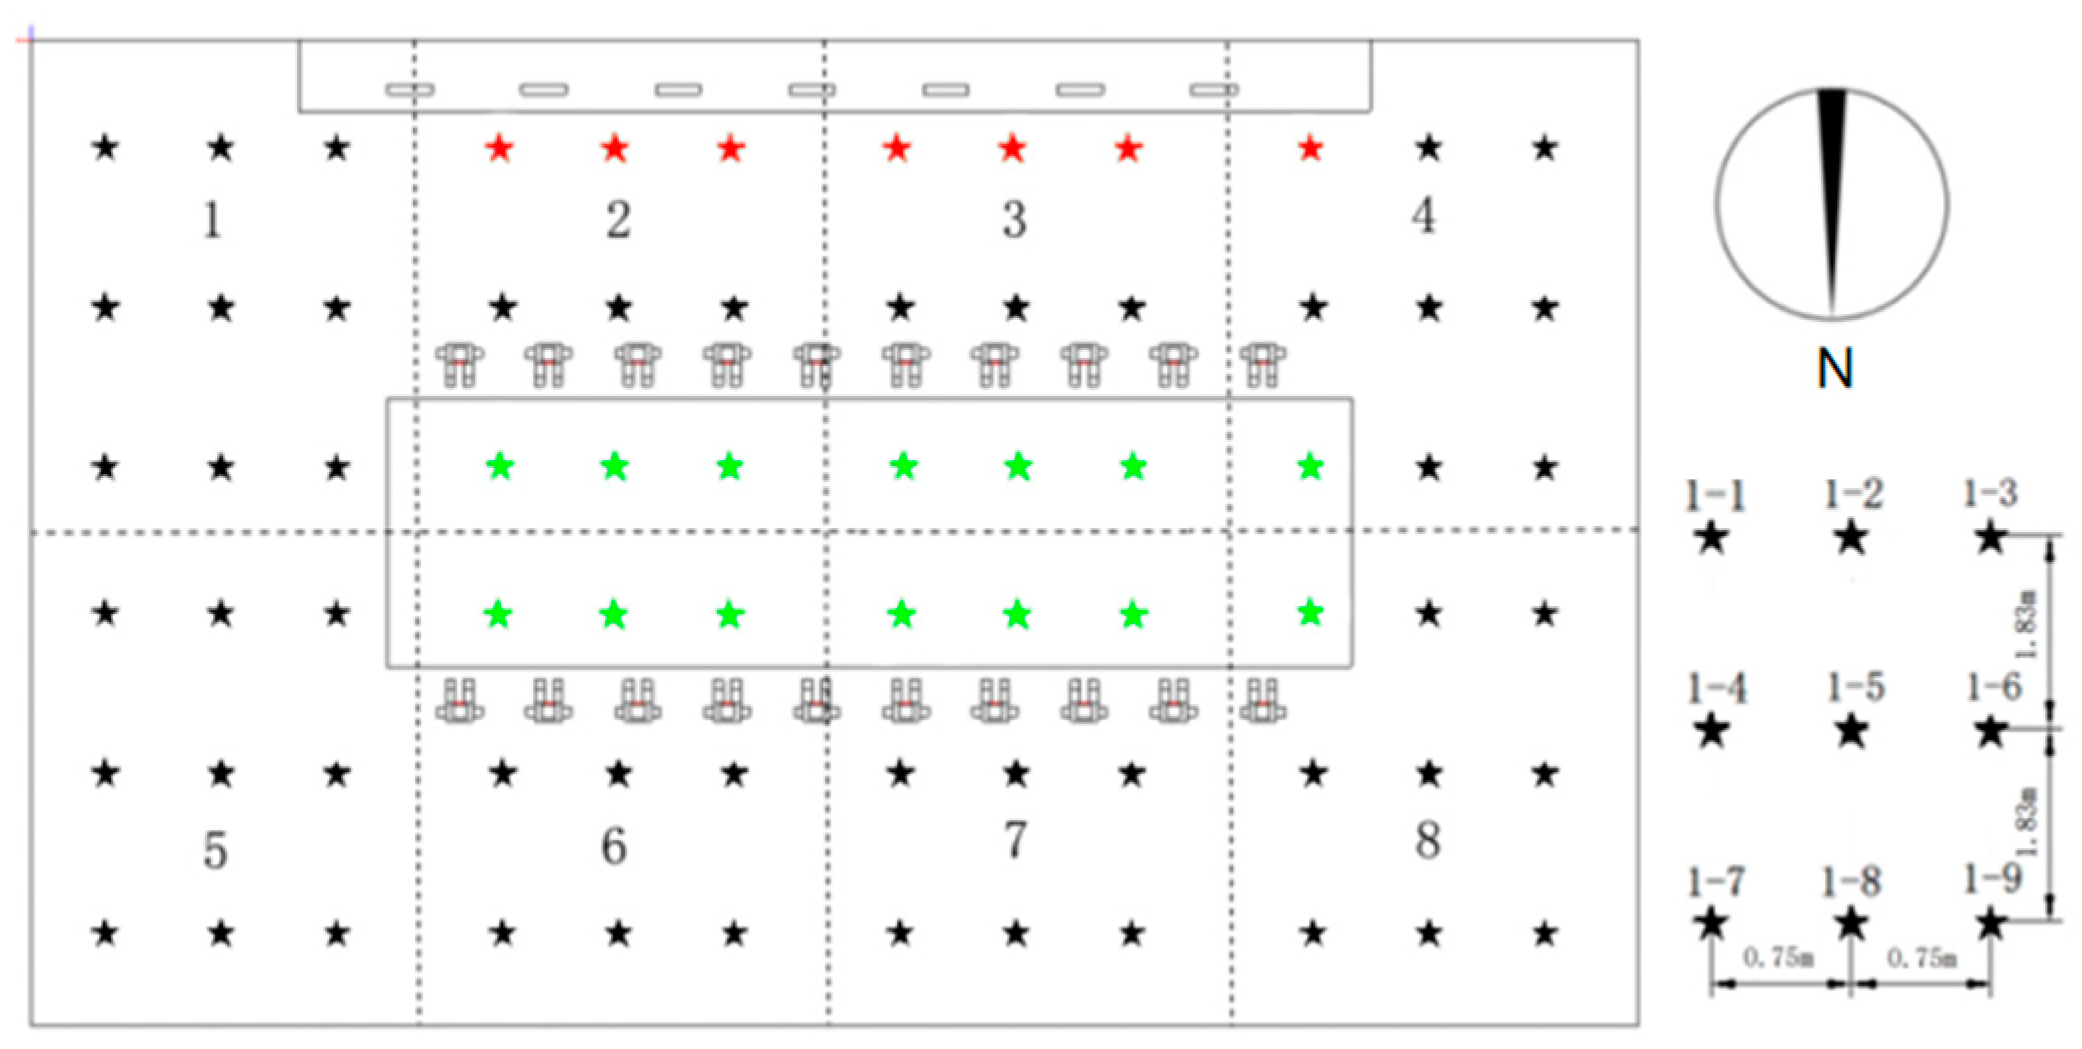
As illustrated in Figure 1, the room is expansive, with the office area positioned close to the south wall functioning as a commonly shared space accommodating 8–9 individuals. The seating configuration in this region is relatively condensed, thereby mandating the air conditioner to solely concentrate on sustaining an environment conducive for occupant comfort in terms of temperature and humidity. On the contrary, the central portion of the room incorporates a large conference table designed for extensive meetings with a capacity exceeding 20 people. In the diagram, the six red air vents signify the air supply ports of the air conditioning system while the three green air vents indicate the return air ports. Therefore, it becomes imperative for the air conditioner to regulate both thermal conditions and humidity levels within the conference room. To compare these approaches against traditional full-space operation mode, two distinct operational modes are established: one focusing on conditioning solely within the conference area and another targeting only workspace. Consequently, simulation analysis is conducted to investigate the temperature field distribution, velocity field distribution, and other pertinent characteristics of the room under different operational modes. Subsequently, evaluation indicators are employed to analyze and assess simulation results in order to provide valuable insights for subsequent experimental studies.
The outdoor design temperature of the air conditioning system is set to −7.7 °C. According to the design code for the heating, ventilation, and air conditioning of civil buildings, when the interior design temperature is 20 °C and the air velocity is lower than 0.30 m/s, the thermal comfort level of personnel staying in the room for a long time can be guaranteed [20].
The air conditioning system adopts the traditional air supply mode in the whole-space operation condition to ensure a uniform indoor environment. The air volume is calculated according to the cold and heat load and the airflow speed is 1.50 m/s. During meetings and work events, individuals only need local environmental control, adjusting the diffusion angle of the air supply to 45° away from people in the meeting area. In addition, considering that the occupancy rate of these areas is reduced compared to what is found in the full-space operation mode, the air volume is appropriately reduced accordingly. Similarly, when operating alone in the work area, the direction of the supply air and the closure of three adjacent openings near the north wall are modified while maintaining a constant room temperature through a balanced airflow. This setup is shown in Table 1.
To facilitate the investigation of environmental conditions in different areas of the room, the room is divided into eight zones, as depicted in Figure 2. Red stars represent work only areas, green stars represent meeting only areas, and black stars represent all air areas. Numbers 1–8 divide the room into 8 areas. The figure illustrates the spatial distribution and quantity of measurement points, with green markers representing measurement points within the conference area and red markers indicating measurement points within the work area. Each zone consists of a uniform distribution of nine measurement points.

3.2. Simulation Result

3.2.1. Full-Space Air Conditioner Operating Mode

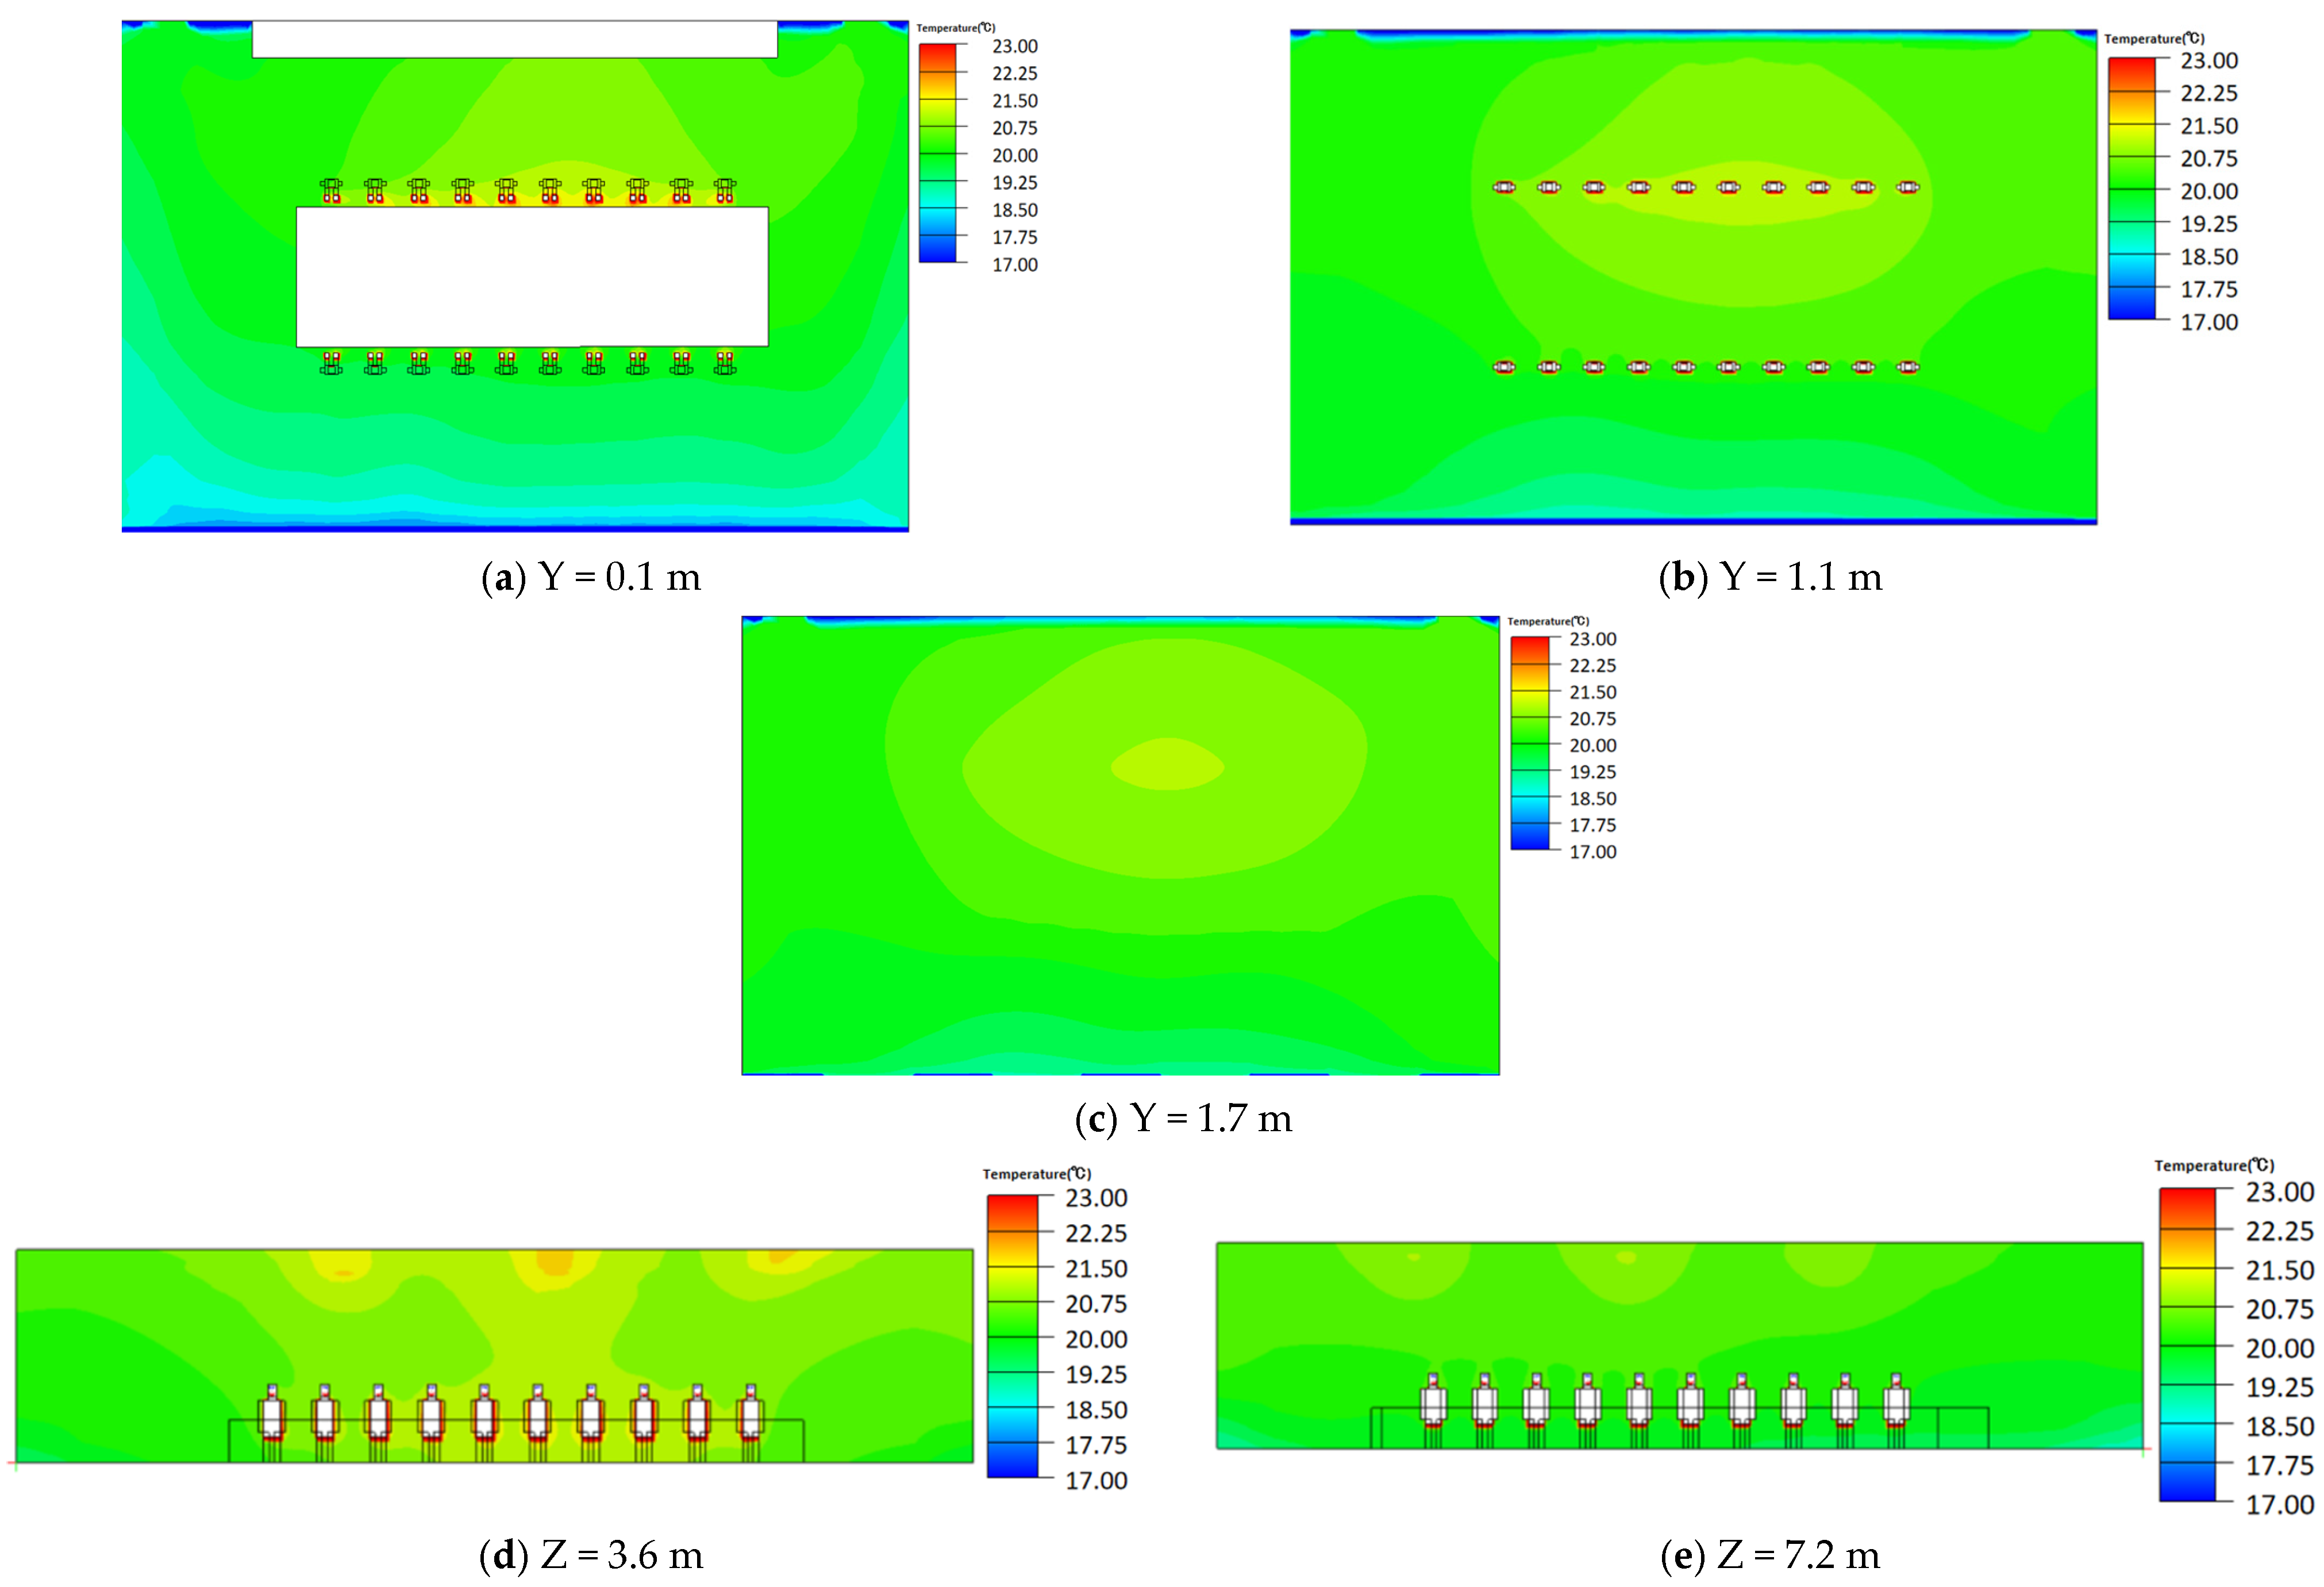
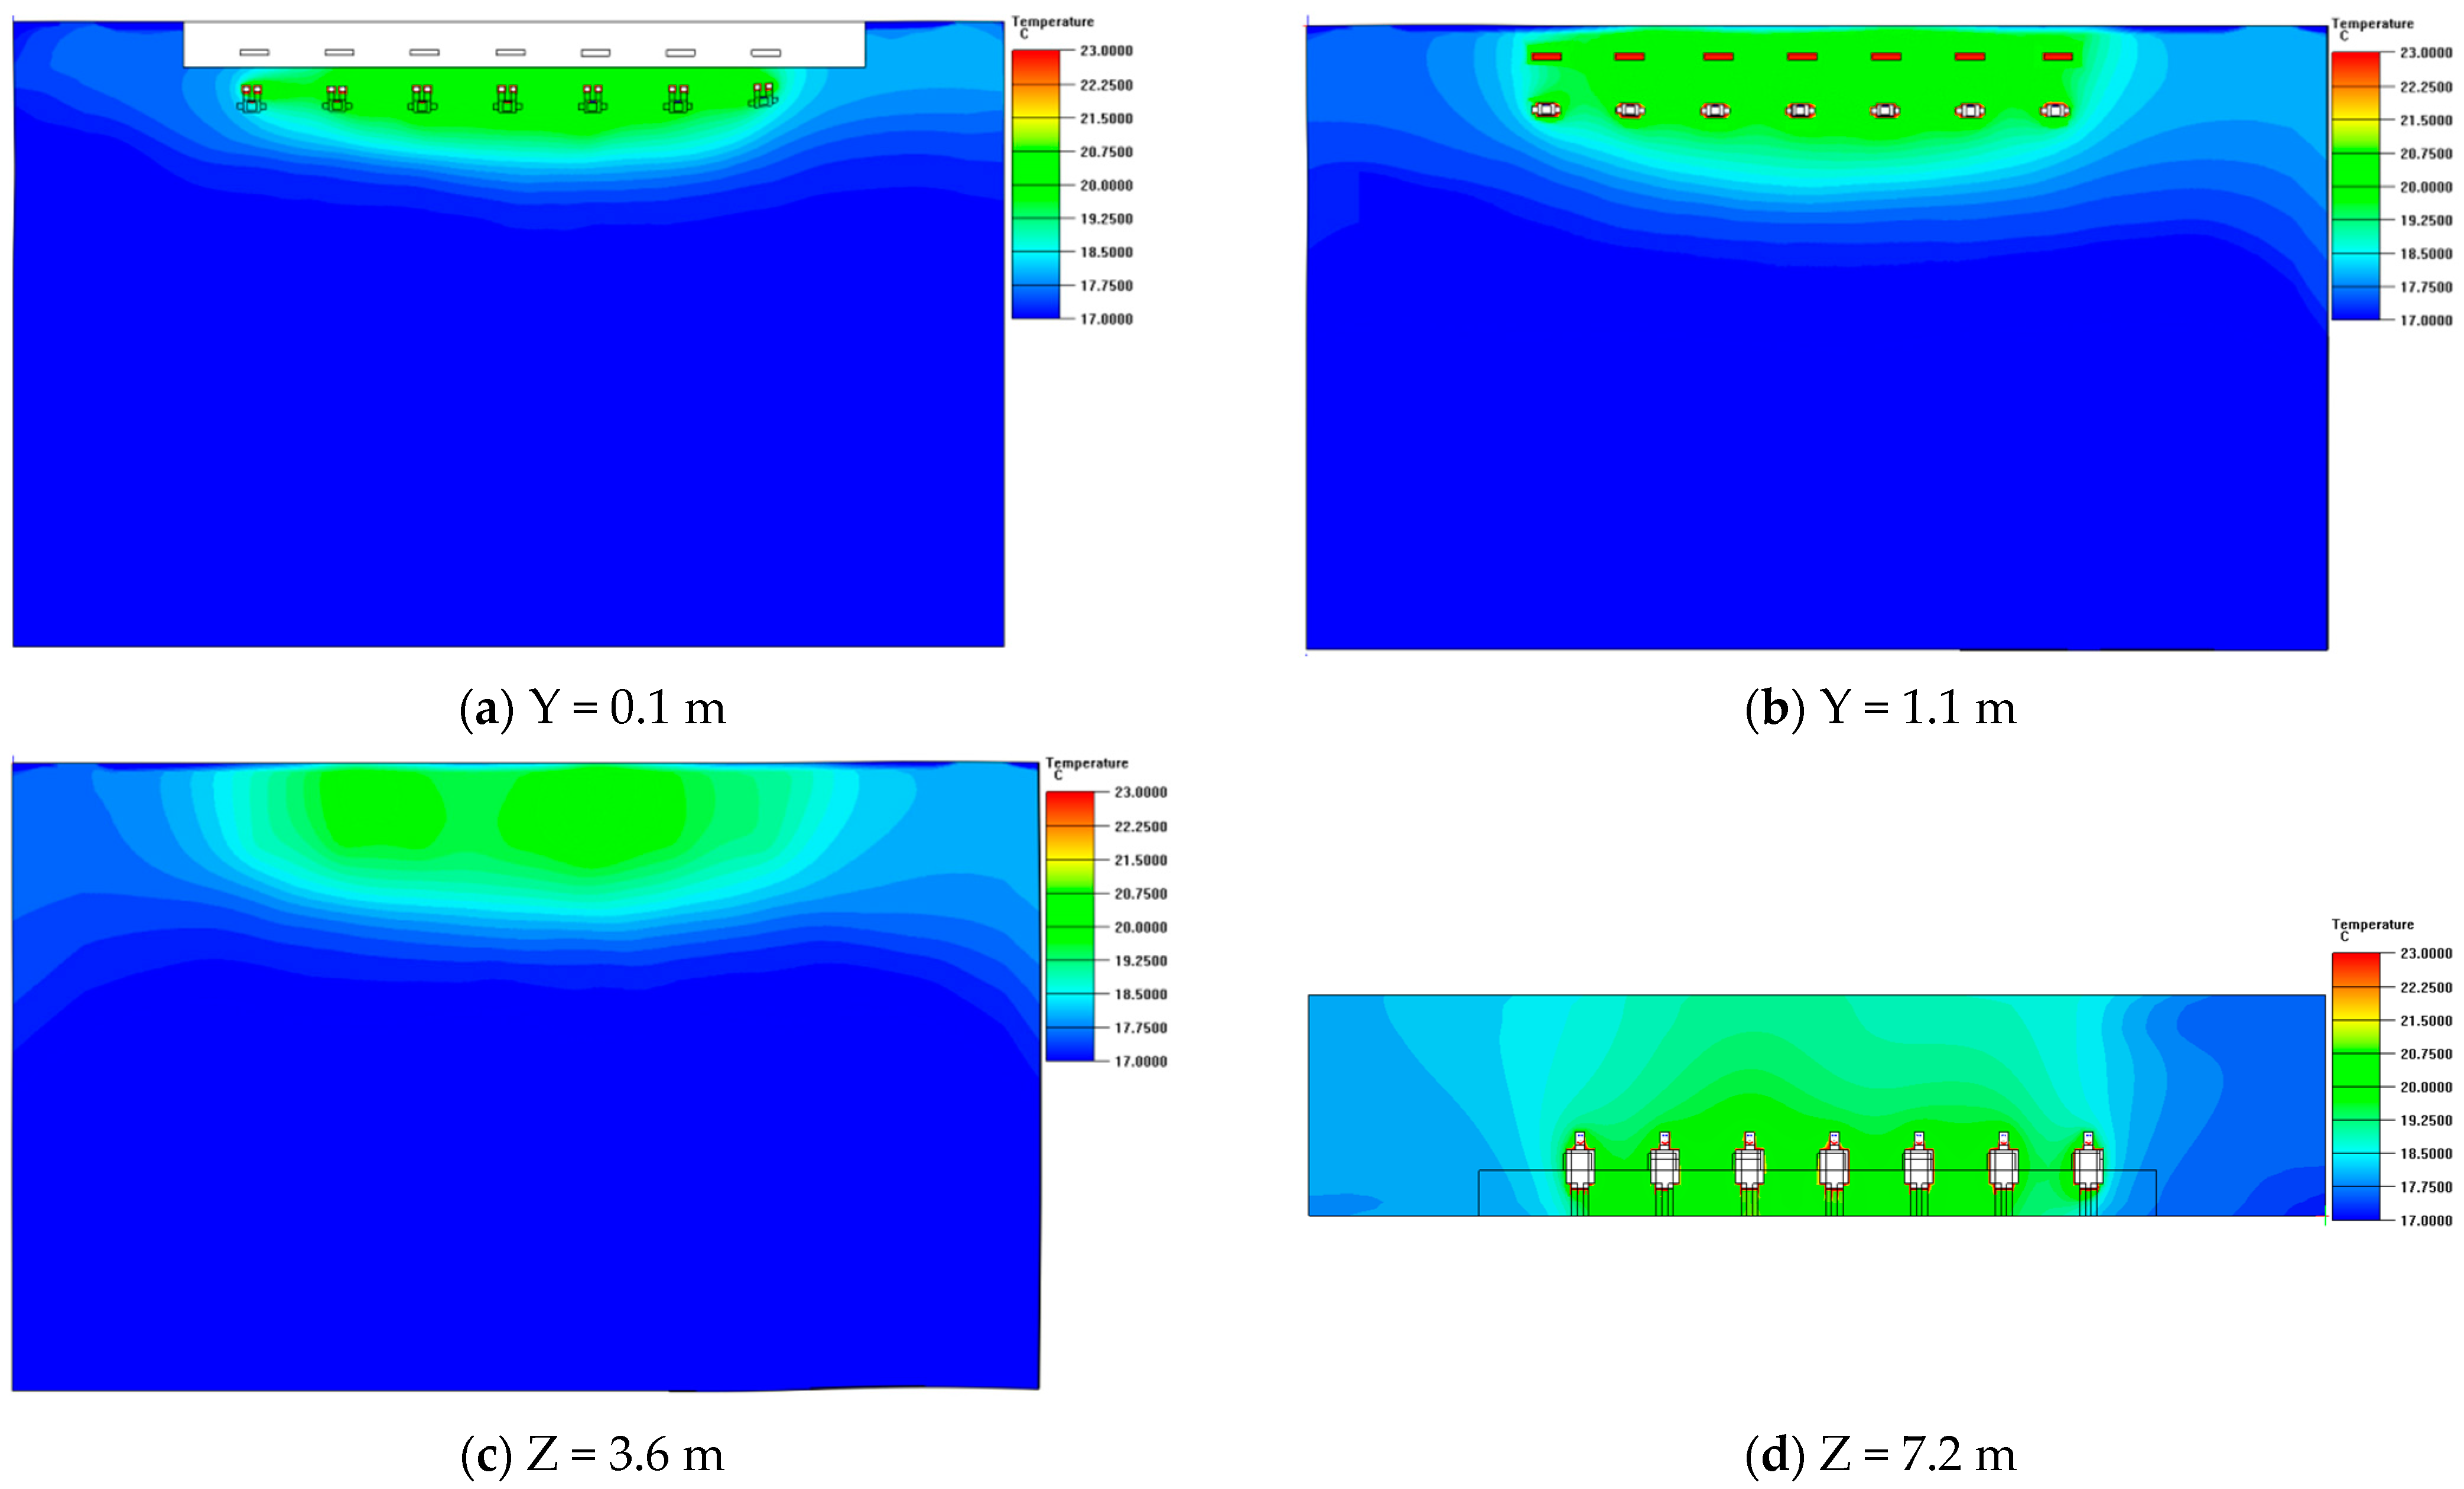
Considering the dimensions of the room, a room model is established to facilitate the division of a structured hexahedral grid. The grid partitioning takes into account the presence of smooth interior walls and regular objects within the room and avoids any surface curvature that may compromise the accuracy of grid allocation. Therefore, this paper employs a structured hexahedral grid that is widely utilized in similar scenarios. After ensuring grid independence, a total of 1.7 million grid points are selected for simulation purposes. The boundary conditions determined in the previous section are inputted into the Airpak software to obtain simulation results. To analyze the temperature distribution within the air-conditioned room during winter under traditional full-space operating conditions, simulations have been conducted as illustrated in Figure 3.
In the figure, Y = 0.1 m, 1.1 m, and 1.7 m represent the vertical distribution of room temperature at corresponding heights above ground level. Similarly, Z = 3.6 m and 7.2 m indicate the temperature distribution at heights where the six air outlets are positioned, as shown in Figure 3a. Within a proximity of 0.1 m from the ground level, most areas exhibit temperatures reaching the design value of 20 °C with a range between approximately 19 °C and 21 °C. The peripheral wall region tends to display comparatively lower temperatures compared to other regions. As shown in Figure 3c, the temperature at a height of 1.7 m ranges from approximately 19.5 °C to 21 °C under room temperature conditions, with a reduced horizontal temperature gradient. The vertical distribution of temperatures indicates that the southern side experiences higher temperatures due to increased human concentration and heat accumulation away from the enclosure structure, resulting in localized overheating. However, overall thermal comfort for occupants is maintained. Figure 3d,e demonstrate that the air conditioning outlet area and ceiling exhibit temperatures approximately 1 °C higher than those observed in occupied areas, reaching or exceeding 21 °C primarily due to elevated supply air temperatures surpassing room temperature and influenced by vertical buoyancy forces leading to significant vertical temperature variations.
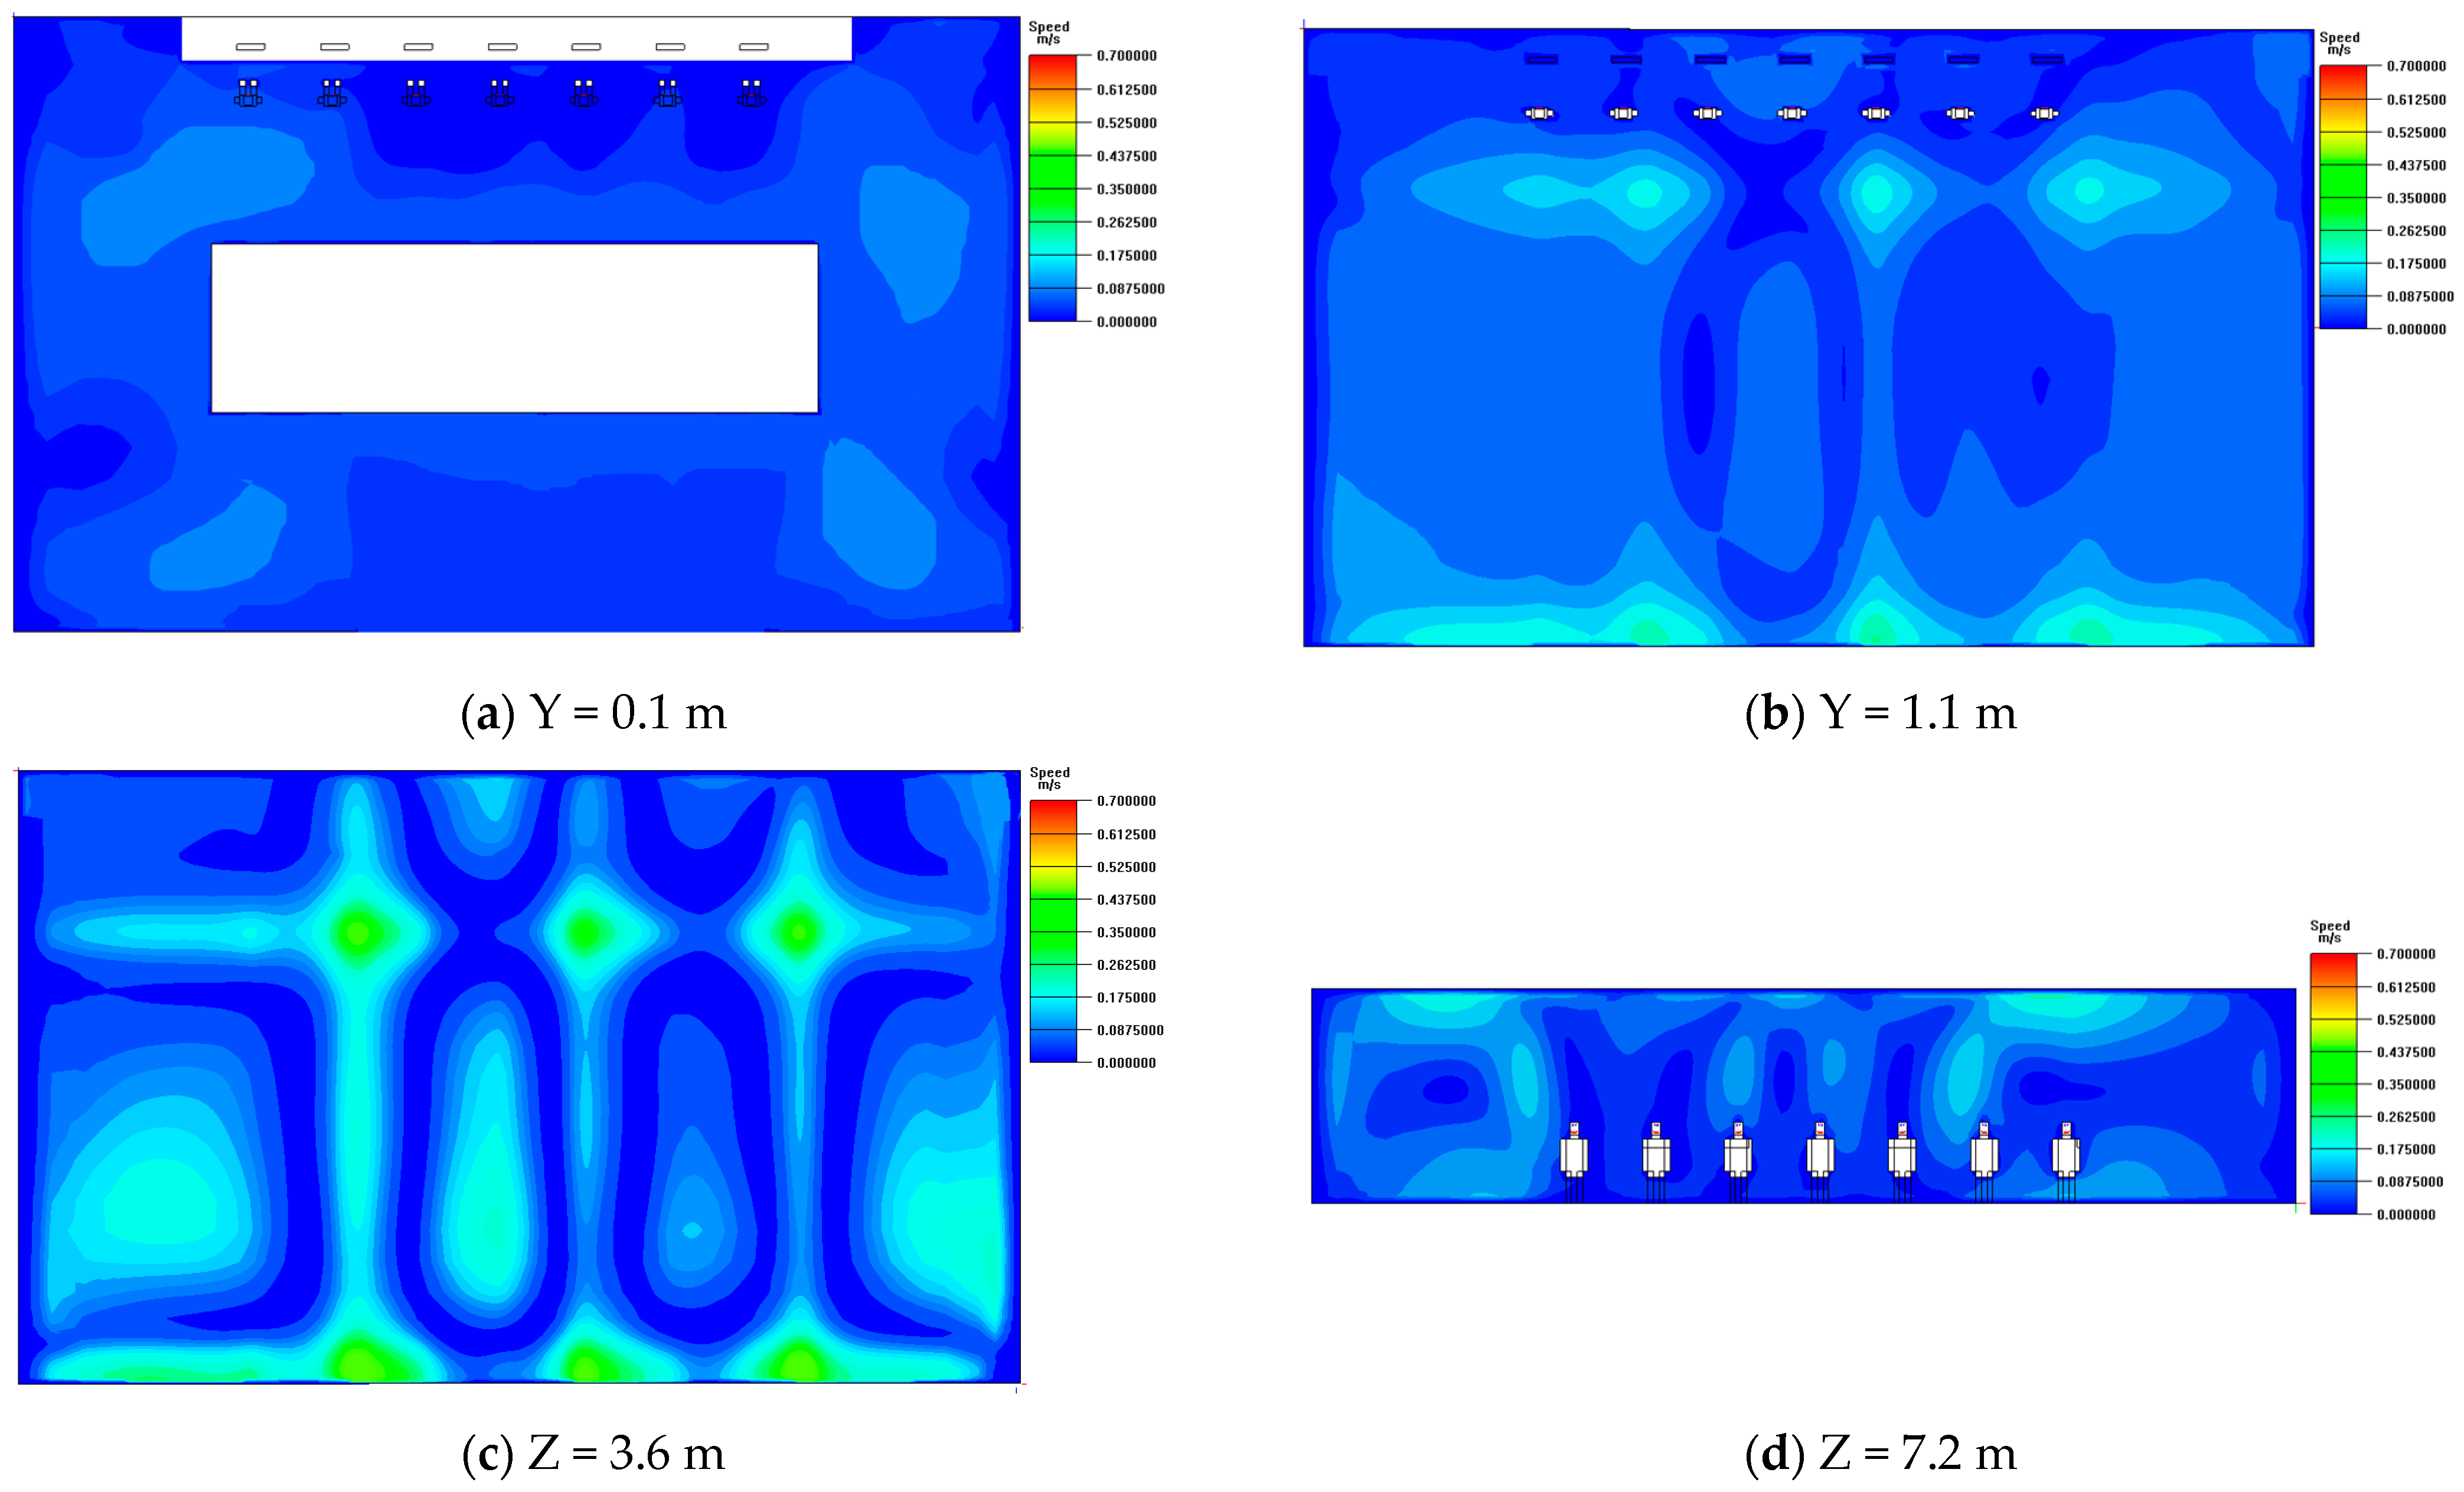
In order to provide a more precise depiction of the fluid flow characteristics in the room, including vortices, separation flows, and the transition from laminar to turbulent flow, an analysis has been conducted on the velocity field during the full-space operation of the air conditioning system as shown in Figure 4.
Similarly, the data demonstrate the spatial distribution of air velocity at different heights above ground level (Y = 0.1 m, 1.1 m, and 1.7 m), as well as at specific locations (Z = 3.6 m and 7.2 m) where the six air outlets are positioned within the room. As depicted in Figure 4a,b, when the supply air velocity is set to 1.50 m/s, there is a sequential increase in air velocity observed at heights of 0.1 m and 1.1 m within the room, while Figure 4c illustrates relatively higher velocities ranging from 0.08 m/s to 0.45 m/s at a height of 1.7 m along with a noticeable velocity gradient near the outer wall surface and floor level, overall indicating a relatively uniform airflow distribution throughout the entire space. Additionally, Figure 4d,e reveal that some individuals experience air velocity reaching approximately 0.17 m/s with a slight perceptible airflow sensation while all workstations remain within an acceptable range of reasonable air velocity.
The temperature and velocity values have been specifically calculated at a height of 1.1 m above ground level, with the results being presented in Table 2 and Table 3.
Based on the data analysis from the table, it is evident that the airflow organization evaluation indicators in all areas of the room have achieved a high standard. The temperature and velocity distribution exhibit relative uniformity, thereby minimizing strong wind sensations and stagnant air perception among individuals. Furthermore, the ADPI value predominantly reaches its maximum of 100%, signifying that airflow organization within any area of the room adequately satisfies the occupants.

3.2.2. The Air Conditioner Works in the Conference Area Only

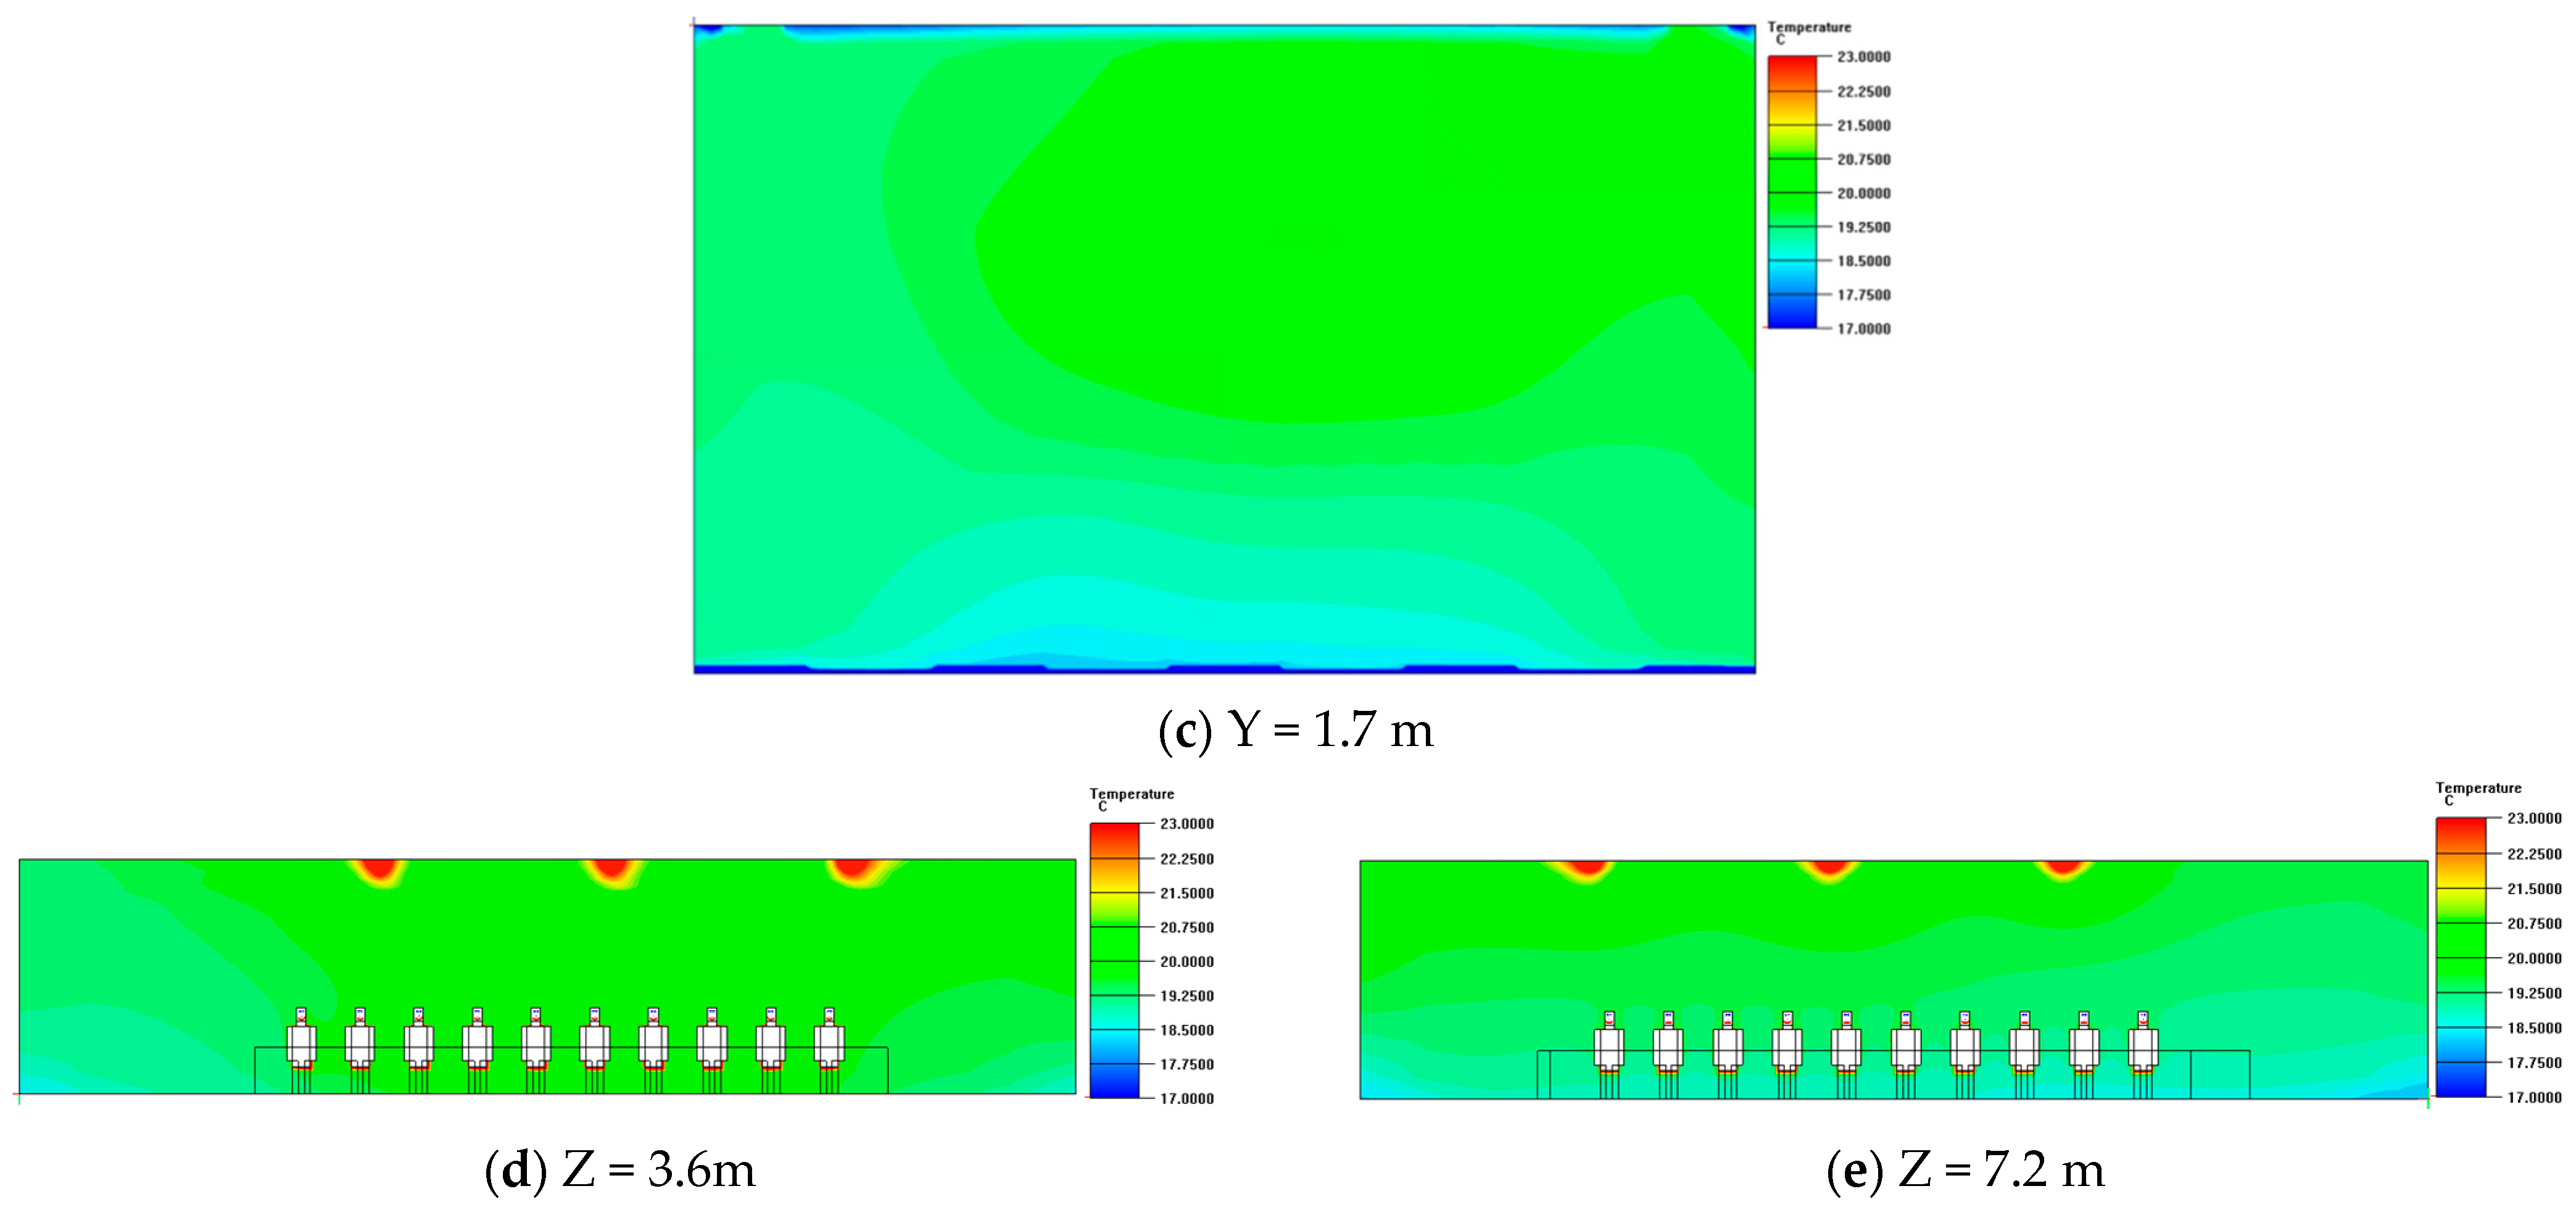
The temperature distribution in the conference area under the winter operating condition of the air conditioner alone is illustrated in Figure 5.
In contrast to the initial condition, as shown in Figure 5a–c, a temperature deviation is noticed towards the northern side of the outer wall at heights of 0.1 m, 1.1 m, and 1.7 m near the ground level, with temperatures ranging approximately from 18 °C to 20 °C. The temperature gradient at a height of 1.1 m decreases while the maximum temperature within the room appears in the centrally located conference area. This indicates that adjusting the air supply angle enables consistent temperatures in occupied regions, conforming to energy conservation requirements. By reducing the air supply volume and directing it towards the conference area, a horizontal temperature gradient emerges along with a distinct uneven distribution between the north and south zones.
Furthermore, as depicted in Figure 5d,e, modifying the dispersion angles results in reduced vertical temperature differences compared to the full-space operation mode of air conditioning systems, thereby achieving more uniform temperatures throughout the interior of the room. Specifically near the ground level and inner walls, lower temperatures around 19 °C are recorded; however, the overall thermal comfort requirements are met within the occupied areas where temperatures reach approximately 20 °C.
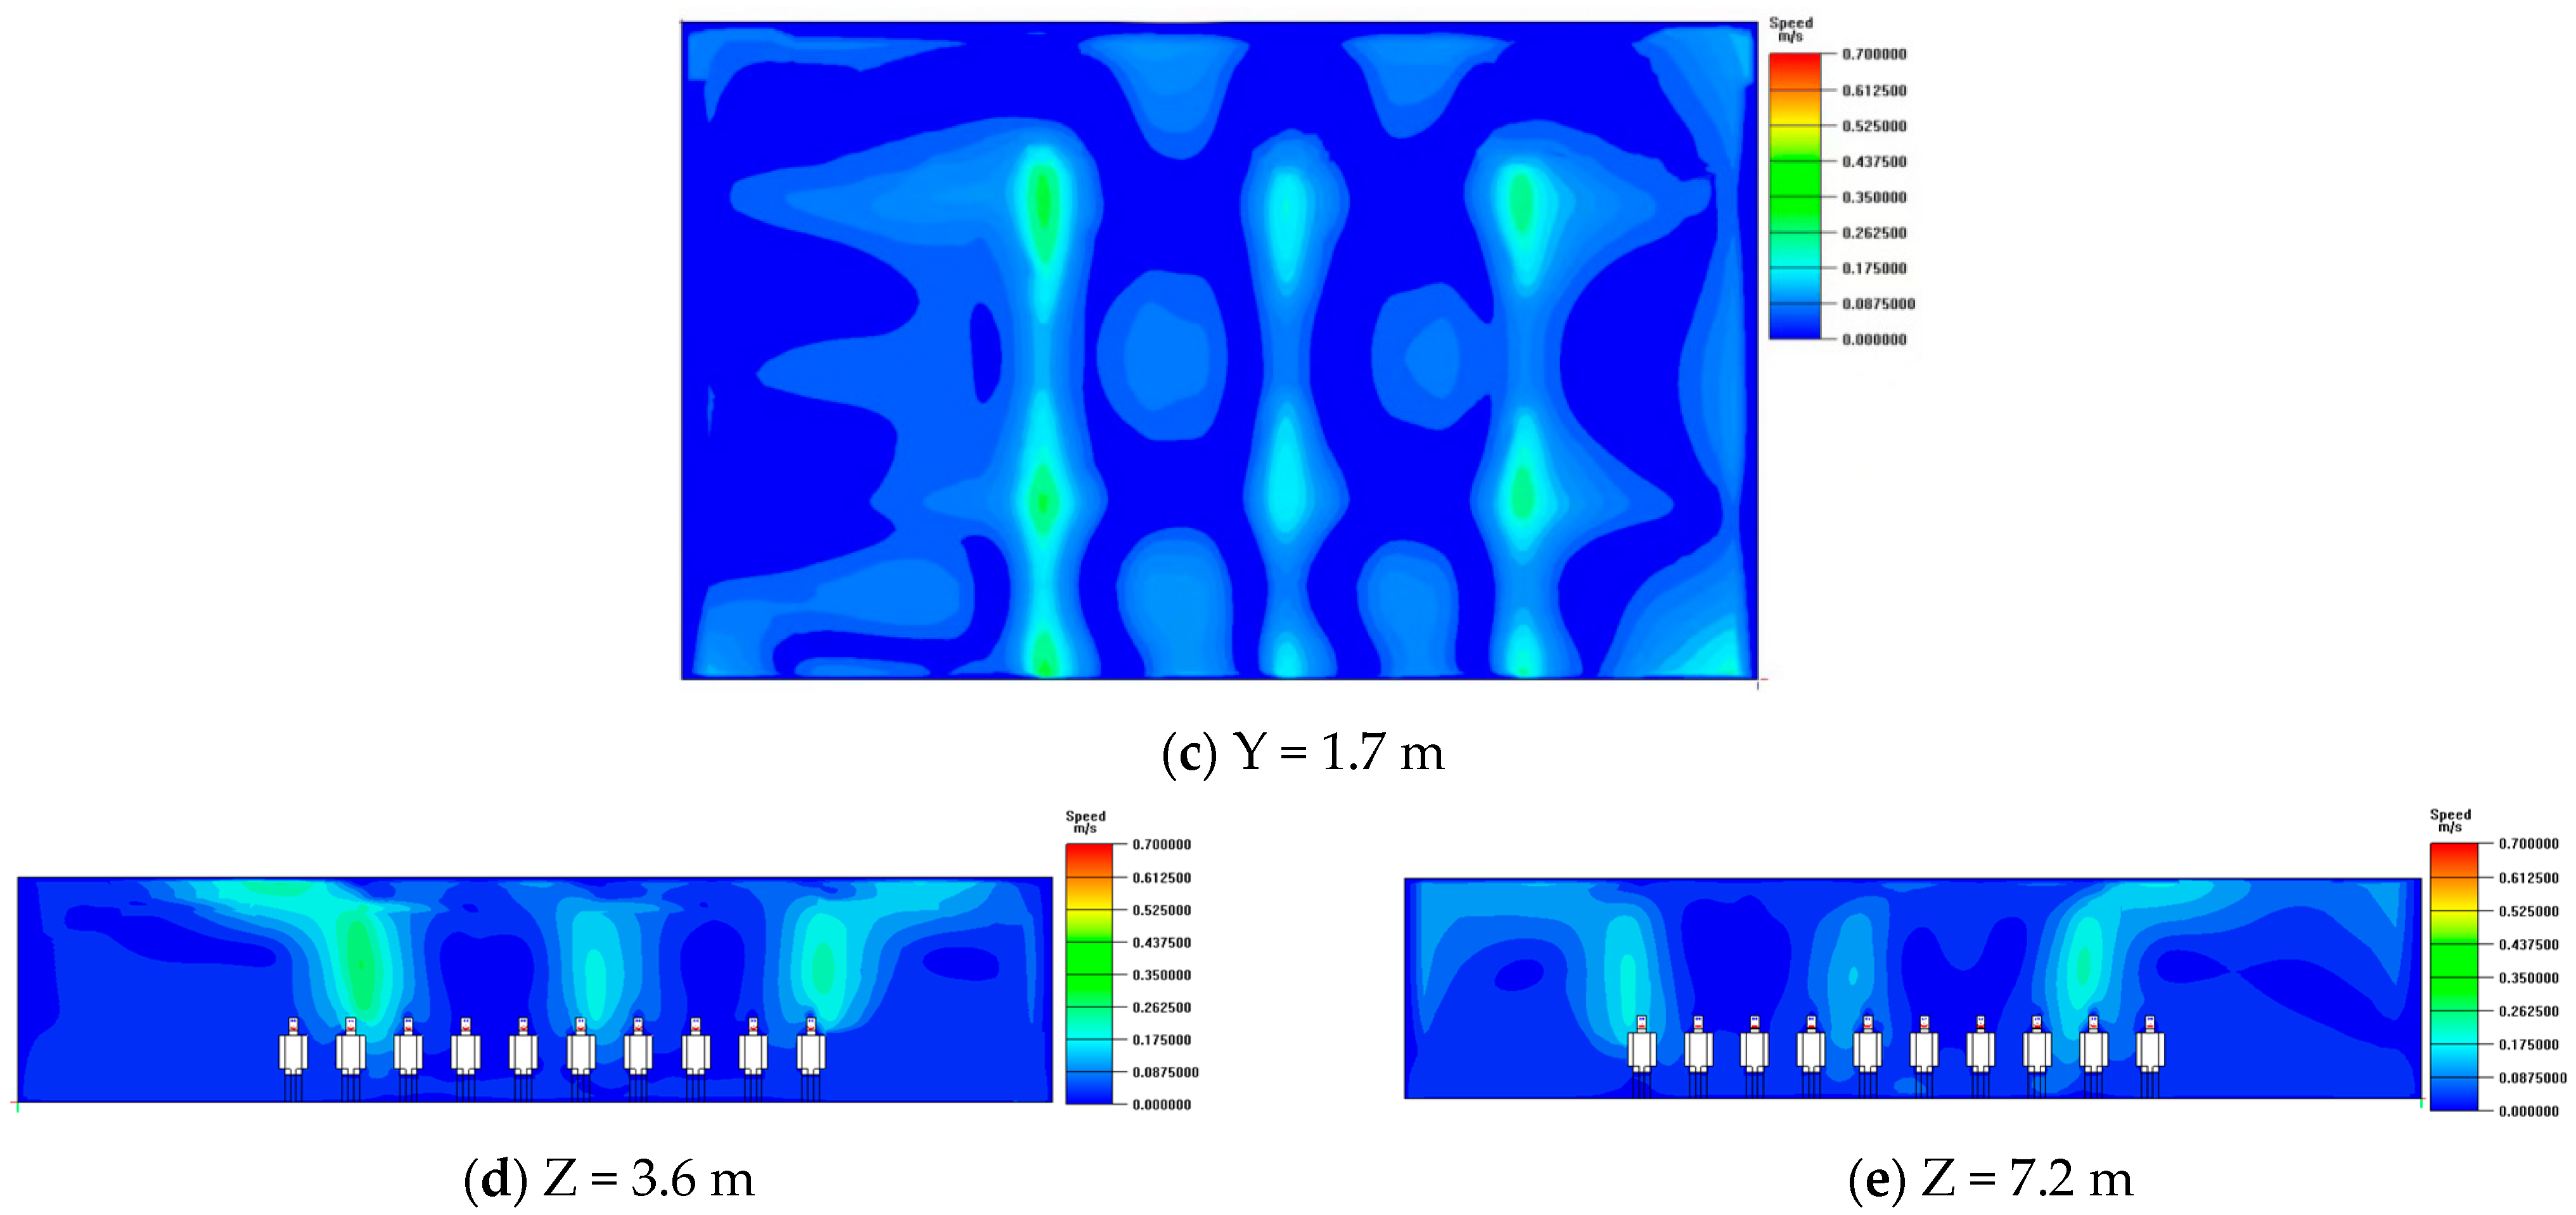
During winter conditions, specifically for the conference areas running independently with their own air conditioning systems, details are demonstrated in Figure 6.
The air velocity at a height of 0.1 m within the room is comparable to that in the previous condition, as depicted in Figure 6a–c. Nevertheless, due to the modification of the supply air angle, there is a decrease in air velocity at a height of 1.1 m above the ground level in contrast to what is noted in the air conditioning full-space operation mode. The maximum recorded air velocity is approximately 0.25 m/s, presenting an obvious uneven distribution of airflow. The airflow tends to concentrate between the north and south wind outlets, causing the localized perception of airflow by some individuals. In most areas, the air velocity ranges from 0.10 m/s to 0.20 m/s; however, it remains below 0.08 m/s for the majority of regions within these areas.
At a height of 1.7 m within the room, the airflow velocity varies between 0.04 m/s and 0.30 m/s due to the reduced air volume and altered dispersion angles, which reduce its impact on the personnel area; nonetheless, some individuals can still sense its existence, as illustrated in Figure 6d,e. Moreover, similar effects are witnessed at Z = 3.6 m and Z = 7.2 m, where the decreased air volume and changed dispersion angles result in reduced air velocity reaching the personnel areas while still being perceivable by some individuals within the working zones (air velocity ranging from 0.04 m/s to 0.02 m/s).
In the absence of individuals across all areas, only ADPI values corresponding to areas with human occupancy are considered, and the results are presented in Table 4.
By analyzing the air velocity in different areas, it can be observed that, except for a few individuals who perceive direct airflow under the ventilation outlet, most areas exhibit favorable airflow organization. During this period, ADPI values of 100% are achieved in areas 2 and 3 while localized low temperatures and uneven temperature distribution result in ADPI values of only 33% in areas 6 and 7. Notably, the conference area attains an ADPI value of 100%.

3.2.3. Air Conditioner Works Only in Workspace Mode

In the operational mode wherein only the working area is active, the three supply air outlets on the northern side of the room are closed, and only the supply air outlet in use for air conditioning provision is located within the working area. The temperature field distribution is depicted in Figure 7.
The observation discloses that the southern side of the room manifests a considerably higher temperature, attaining the desired room temperature of 20 °C in close proximity to the occupants. Furthermore, there is a distinct reduction in temperature as one moves away from the air outlet area. Figure 7a,b indicates that at a height of 1.1 m, the temperature gradient is smaller in comparison to that at a height of 0.1 m, and the average ambient temperature shows a positive correlation with elevation, as depicted in Figure 7c. Additionally, Figure 7d reveals lower temperatures near the inner wall at Z = 1.5 m: specifically, approximately 17.5 °C for the east inner wall and around 18 °C for the west inner wall. Consequently, this mode of air conditioning operation results in substantial horizontal variations in room temperature.
The velocity field within the operational zone of the air conditioner during winter conditions is illustrated in Figure 8.
The air velocity at a height of 0.1 m in the room is similar to those in the previous two cases as depicted in Figure 8a. In Figure 8b, it can be observed that the air velocity under the outlet is higher near its vicinity, reaching a maximum of 0.20 m/s, resulting in an uneven distribution of airflow. This non-uniformity arises due to variations in the supply air angle, leading to denser airflow distribution near the south inner wall and north outer wall. Figure 8c illustrates that apart from the area under the outlet, at a height of 1.7 m, there are regions with increased air velocity ranging from 0.08 m/s to 0.50 m/s along the middle region and outer wall of the room. This turbulence formation occurs due to obstruction caused by the north wall impeding supply airflow. Additionally, Figure 8d demonstrates that a recirculation zone forms near the inner wall at a height of 1.5 m with the air velocity ranging from 0.04 m/s to 0.17 m/s within the working area; however, these velocities remain below significant blowing sensation thresholds (below or equal to <0.10 m/s). Conversely, above heights of approximately >2 m, individuals experience greater influence from supply air.
The ADPI values are presented in the subsequent Table 5.
As shown in Table 4, under the given conditions, regions 1–4 exhibit favorable air velocity at a height of 1.1 m while regions 5–8 experience almost stagnant air with moderate environmental comfort. The ADPI values for occupied areas, specifically region 2 and region 3, are recorded as depicting optimal overall airflow organization at 44.4% and 55.6%, respectively. However, the work area demonstrates an ADPI value of up to 100%. Therefore, this air supply mode ensures relatively uniform temperature and velocity distribution within the work area without inducing strong drafts or fluctuations from the set value.

3.3. Result Analysis

Through temperature field analysis, it has been observed that in the full-space air conditioning mode during winter, the room temperature can reach 20.3 °C. By adjusting the air supply angle to deviate from the design value by 45° from the personnel area in the conference room, it is possible to maintain desired temperatures at specific locations while other areas experience deviations. During this period, an average room temperature of 18.7 °C is measured in winter conditions. When adopting a working-area air supply mode with closed outdoor wall air outlets, adjustments in both the air supply angle and temperature allow for maintaining desired temperatures within the working area, resulting in an average room temperature of 15.5 °C during winter conditions.
Figure 9 presents simulation results illustrating the average air temperatures at different heights within various rooms under different air supply modes during both the summer and winter seasons.
In winter conditions, the room temperature increases with the vertical height. Conversely, changes in the supply air strategy lead to a decrease in the room temperature. Under the full-space air conditioning mode, most rooms maintain temperatures above the design value of 20 °C, ranging between 19.7 °C and 20.7 °C, highlighting the significant phenomenon of hot air rising. However, when only supplying air to the conference area, there is an average decrease in room temperature ranging from 18.5 °C to 19 °C, resulting in reduced temperature stratification within the room. Furthermore, by solely supplying air to the working area, there is an additional decrease with average room temperatures ranging from 15.5 °C to 16 °C. Combining temperatures on each plane allows for obtaining an average evaluation of room temperature under three different working conditions during winter as presented in Table 6.
When analyzing the temperature uniformity coefficient under different air distribution modes, it is observed that the working-area operation condition yields a higher coefficient compared to both the conference area operation condition and full-space operation condition; however, there is an inverse relationship with the ADPI value. The full-space air distribution mode results in lower indoor temperature and velocity uniformity coefficients while approaching an ADPI value of 100%, indicating overall satisfaction with airflow organization. Conversely, when operating in the conference area mode, the ADPI value decreases to 83.3% for the entire room. Furthermore, when operating in the working-area mode, this value drops even further to 19.4%. Nevertheless, both local air supply modes ensure a maximum ADPI value of 100% for personnel areas, ensuring thermal comfort. Therefore, adopting these air supply modes not only guarantees thermal comfort but also achieves energy consumption reduction goals.

4. Experimental Verification

4.1. Laboratory Workbench Construction

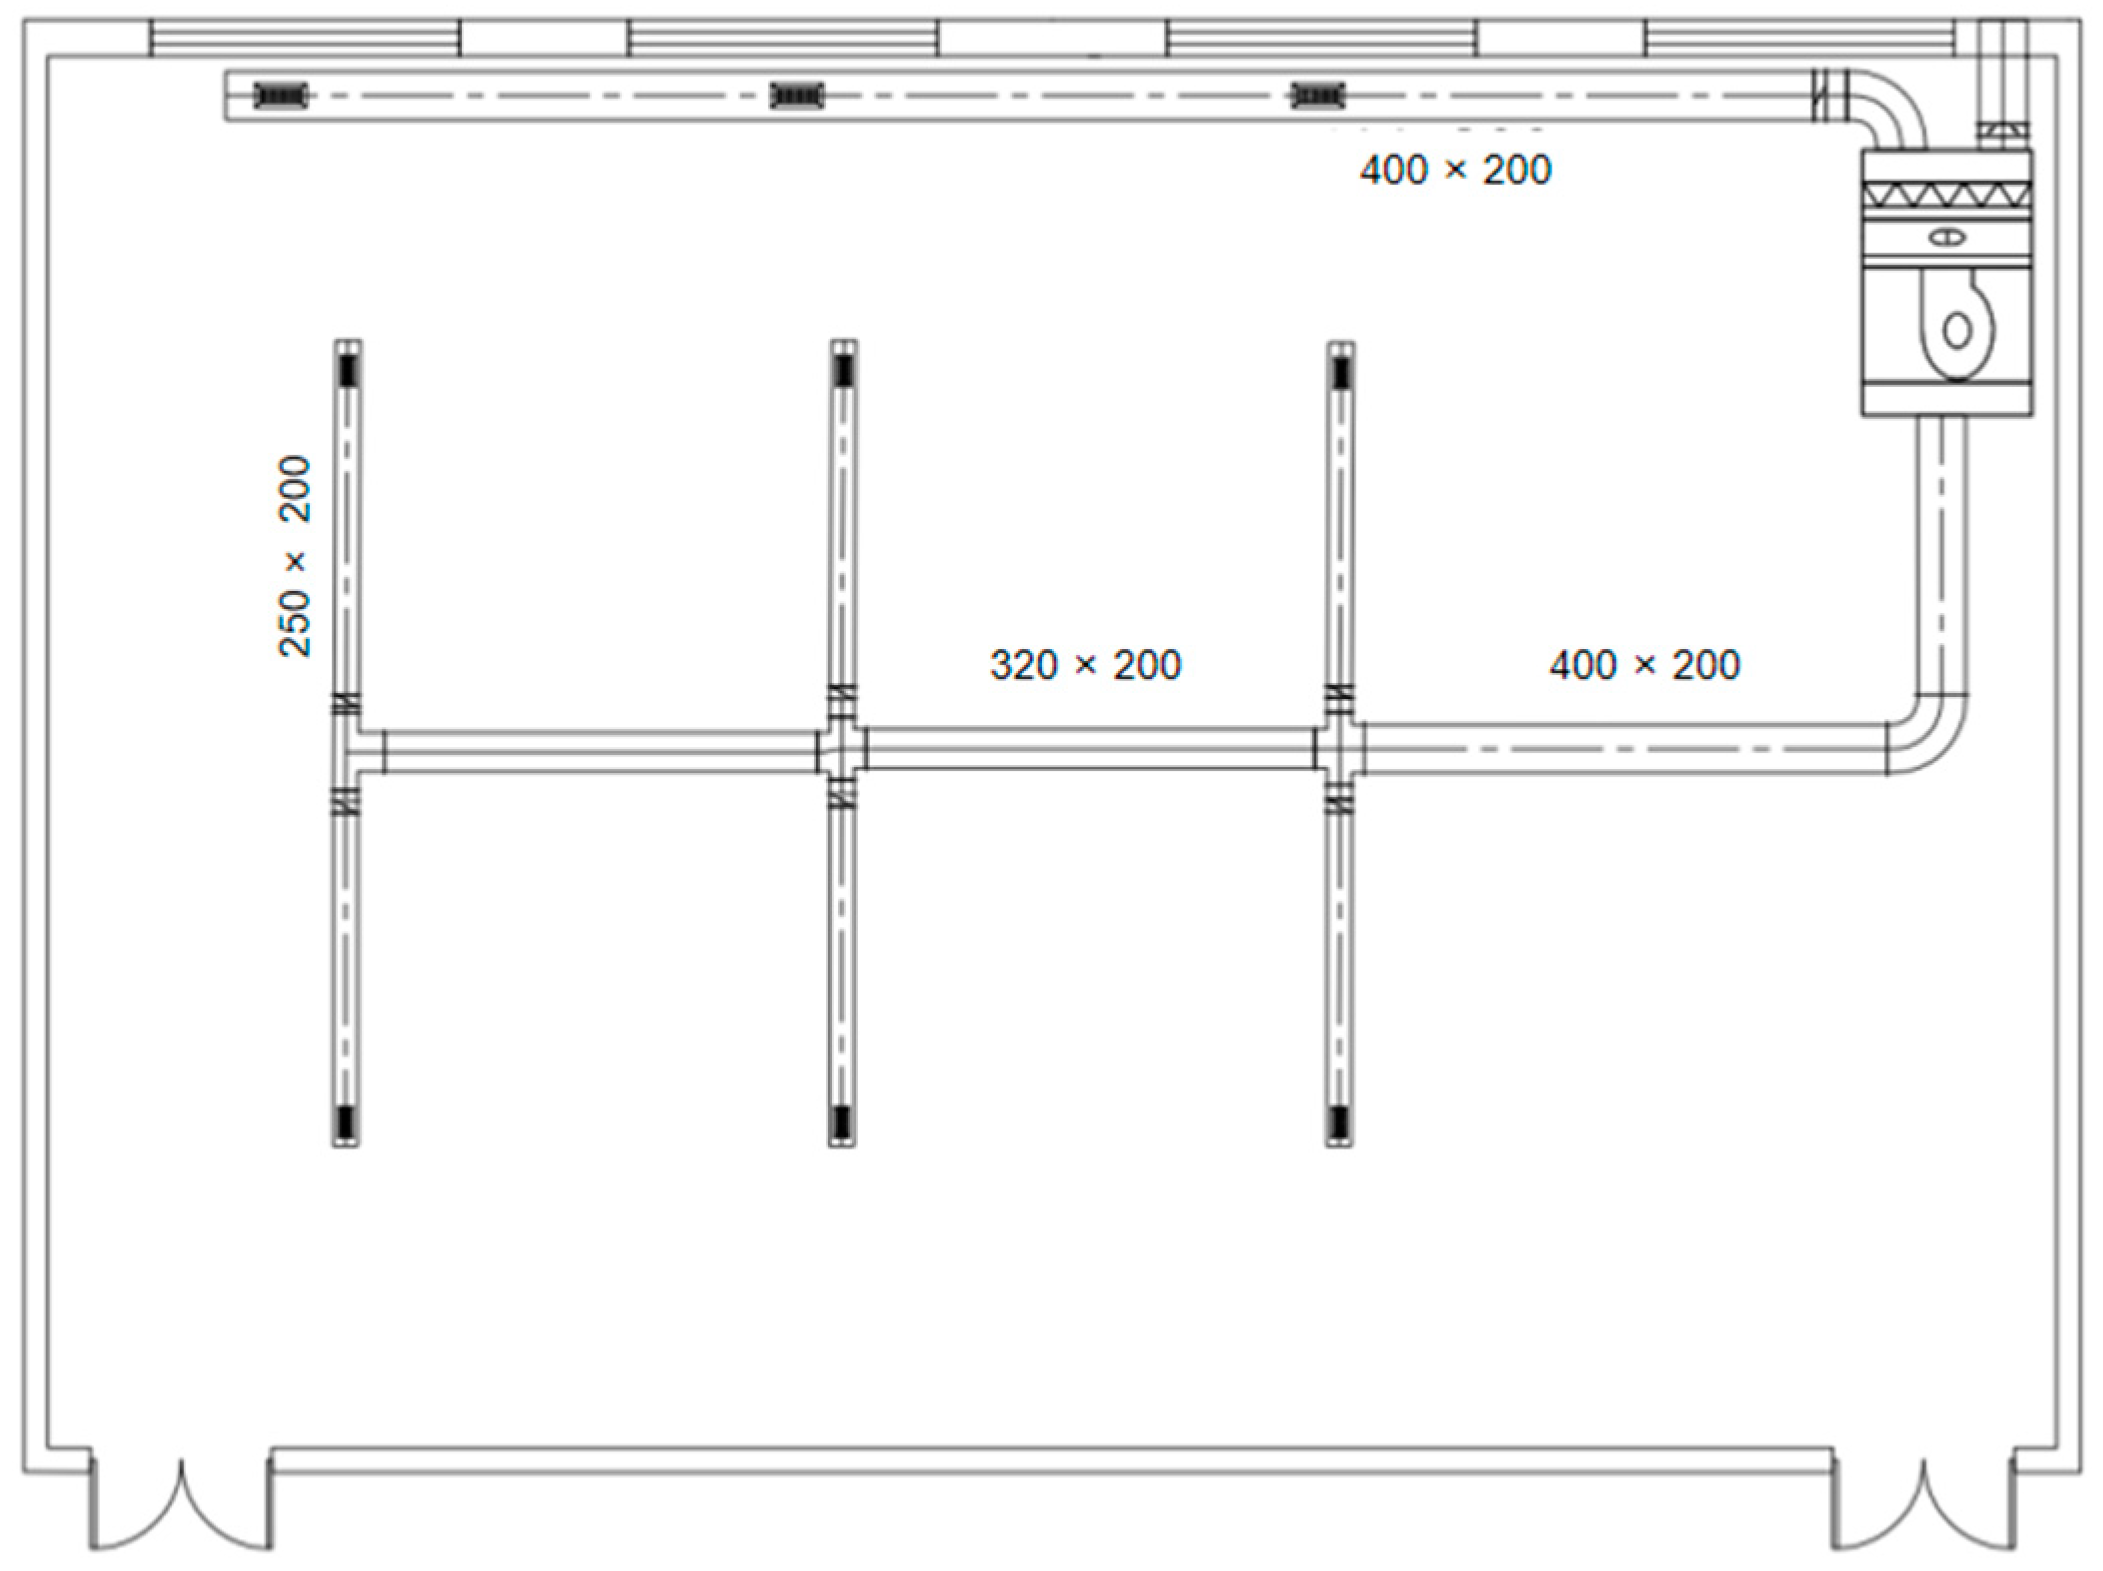
The experimental table was located on the 4th floor of Building B within the experimental complex, featuring a floor height of 4.0 m and occupying a total area of 198 square m (18 m by 11 m). It had been designed with a cooling load capacity of 9.9 kW, utilizing a water-cooled chiller unit for air conditioning purposes. The room was equipped with a comprehensive air system featuring six air supply outlets and three return air outlets. As depicted in the illustration, the return air outlet was located near the north outer wall while the supply air outlets were evenly distributed across the middle of the room. The dimensions and arrangement of the air ducts are visually depicted in Figure 10.
The experiment utilized a combined air handling unit integrated with a single variable-air-volume (VAV) air conditioning system for efficient air distribution. The experimental setup consisted of a CGHR12BNAR-model air-cooled chilled water heat pump unit, a ZK02-model air conditioning unit, water pumps, distribution pipes, and supply and return ventilation outlets. Notably, the heat pump unit had a cooling capacity of 14.0 kW and an input power of 4.7 kW while the air conditioning unit possessed a cooling capacity of 12.0 kW with an input power of 0.45 kW, along with an airflow rate of 2000 m3/h. The measurement tools used were TH11R hygrograph (Huahanwei Technology Co., Ltd., Shenzhen, China) and KA23 anemometer (kAnomax, Osaka, Japan), with resolutions of 0.1 °C and 0.01 m/s, respectively.

4.2. Experimental Settings

4.2.1. Setting of Experimental Conditions

The experiment was conducted from 6 February–8 February, spanning a duration of three consecutive days. Throughout the course of the experiment, the average outdoor temperature was 2 °C. By consolidating the aforementioned scenarios, Table 7 presents the primary data for each individual scenario.
In the full-space operation mode of the air conditioner, when the air conditioner operated in the traditional mode, the room temperature in the air conditioner zone was maintained at the set value of 20 °C by monitoring the temperature and air volume of each zone and adjusting the opening degree of the end valve for air regulation. In the experiment involving running the air conditioner only in the conference area, the operating conditions were adjusted on site, mainly by adjusting two parts: the first part involved adjusting the air supply angle, adjusting the air outlet end angle to a 45° angle with the horizontal plane where the person was located, and observing the real-time temperature value of the temperature and humidity sensor to judge whether the temperature at each measurement point in the conference area had reached 20 °C; thus, the air volume and air velocity were monitored. The air volume and air velocity could be monitored. Only the air conditioner was run in the work area when the experiment was conducted, and only the 3 air intake openings closest to the work area were opened. At this time, the real-time room temperature monitored by the temperature and humidity sensor on the south wall represented the temperature of the work area, and the air conditioning system was adjusted accordingly.

4.2.2. Layout of Measuring Points

The measurement points in this experiment were obtained from the waist position of the human body while standing or from the head position while sitting or standing at a height of 1.1 m above the ground level.
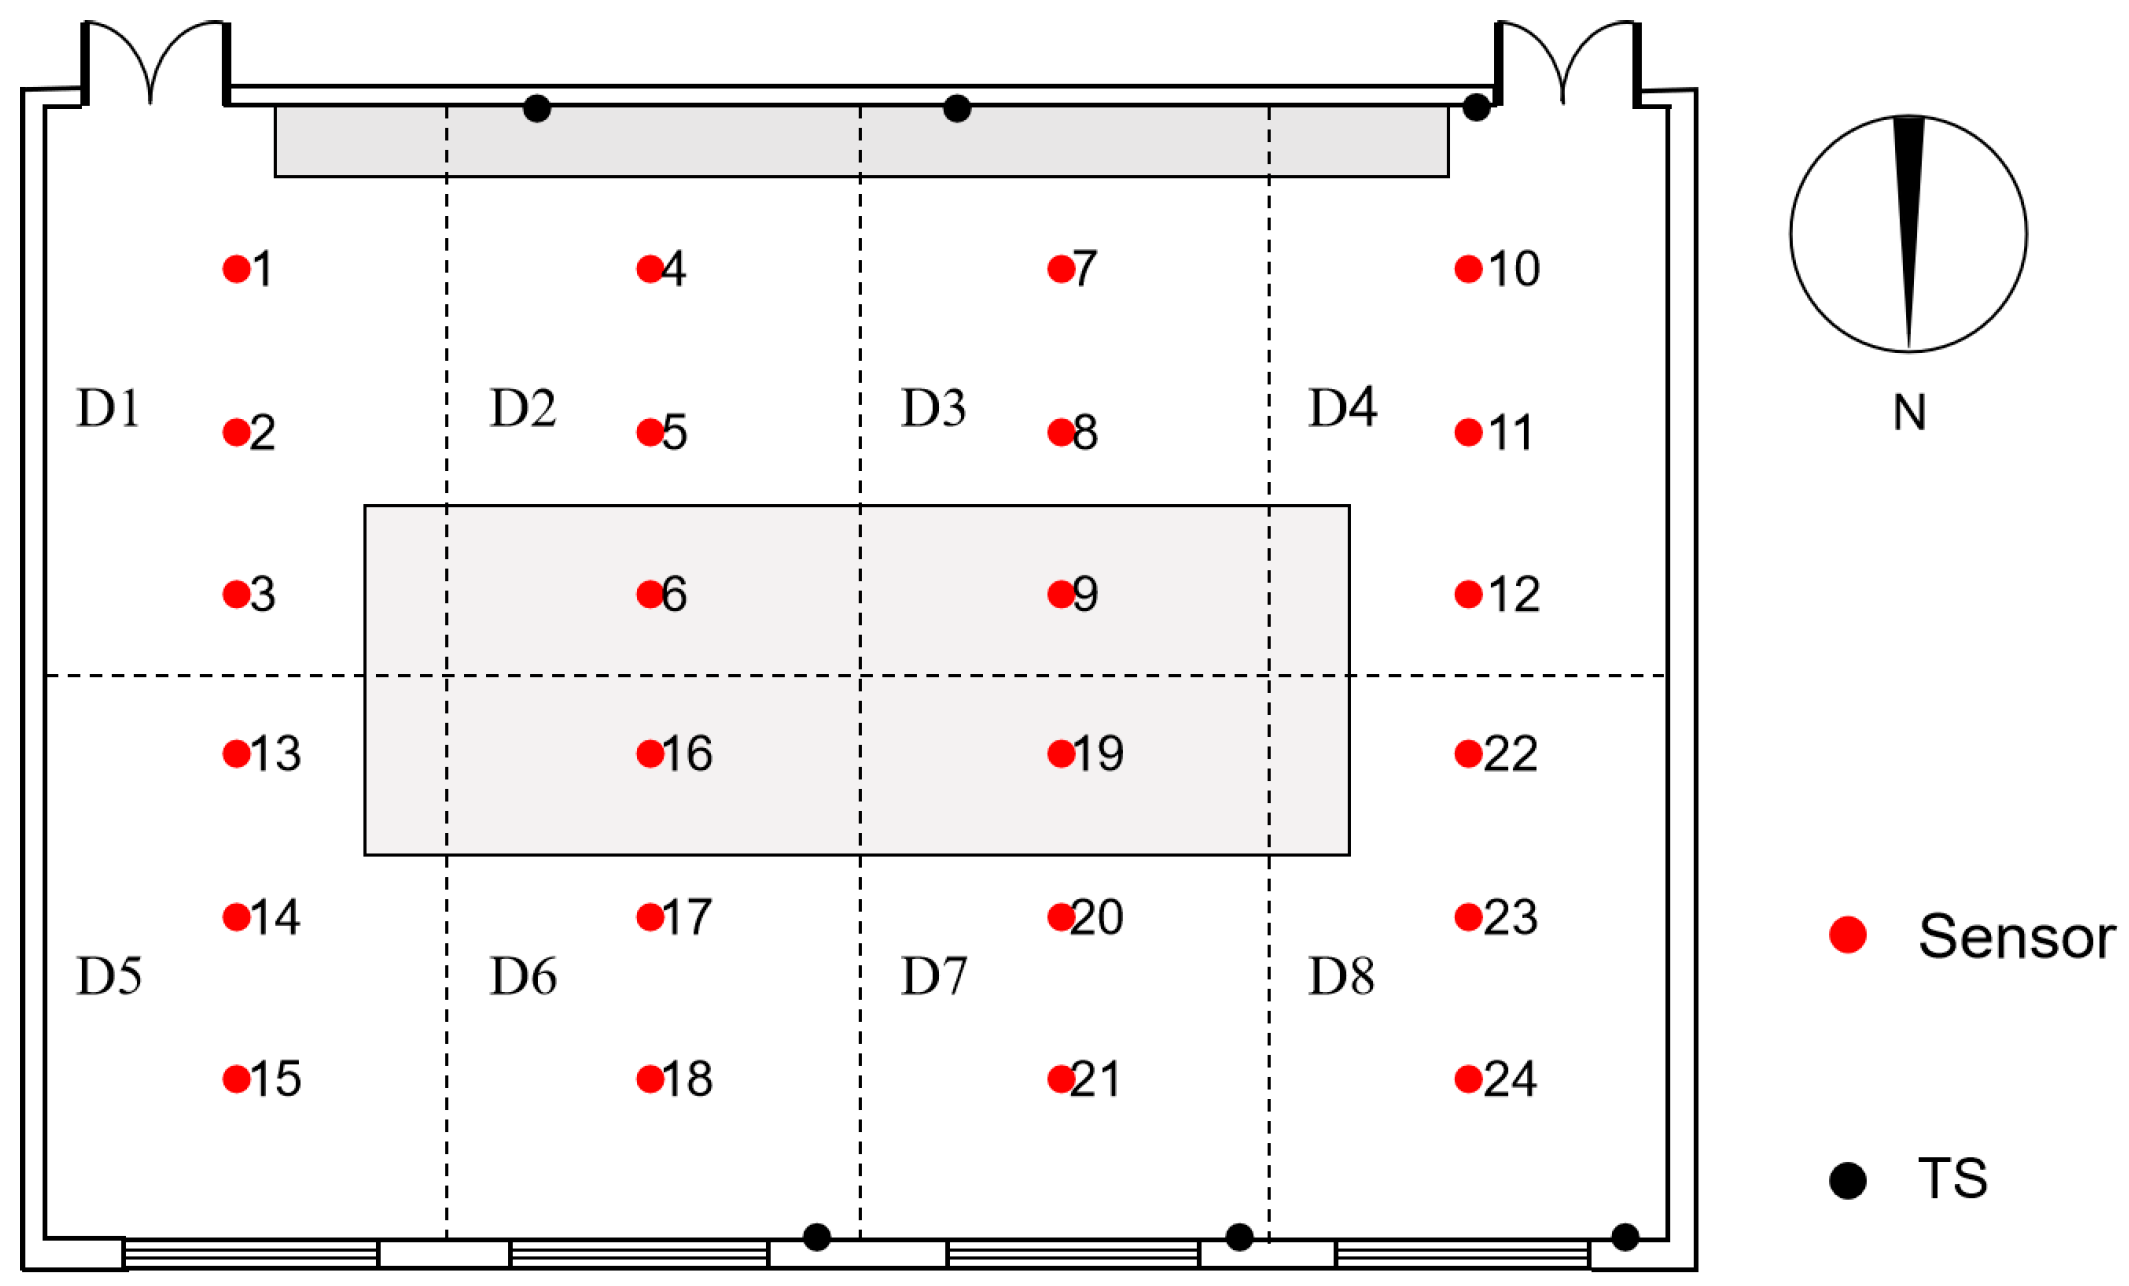
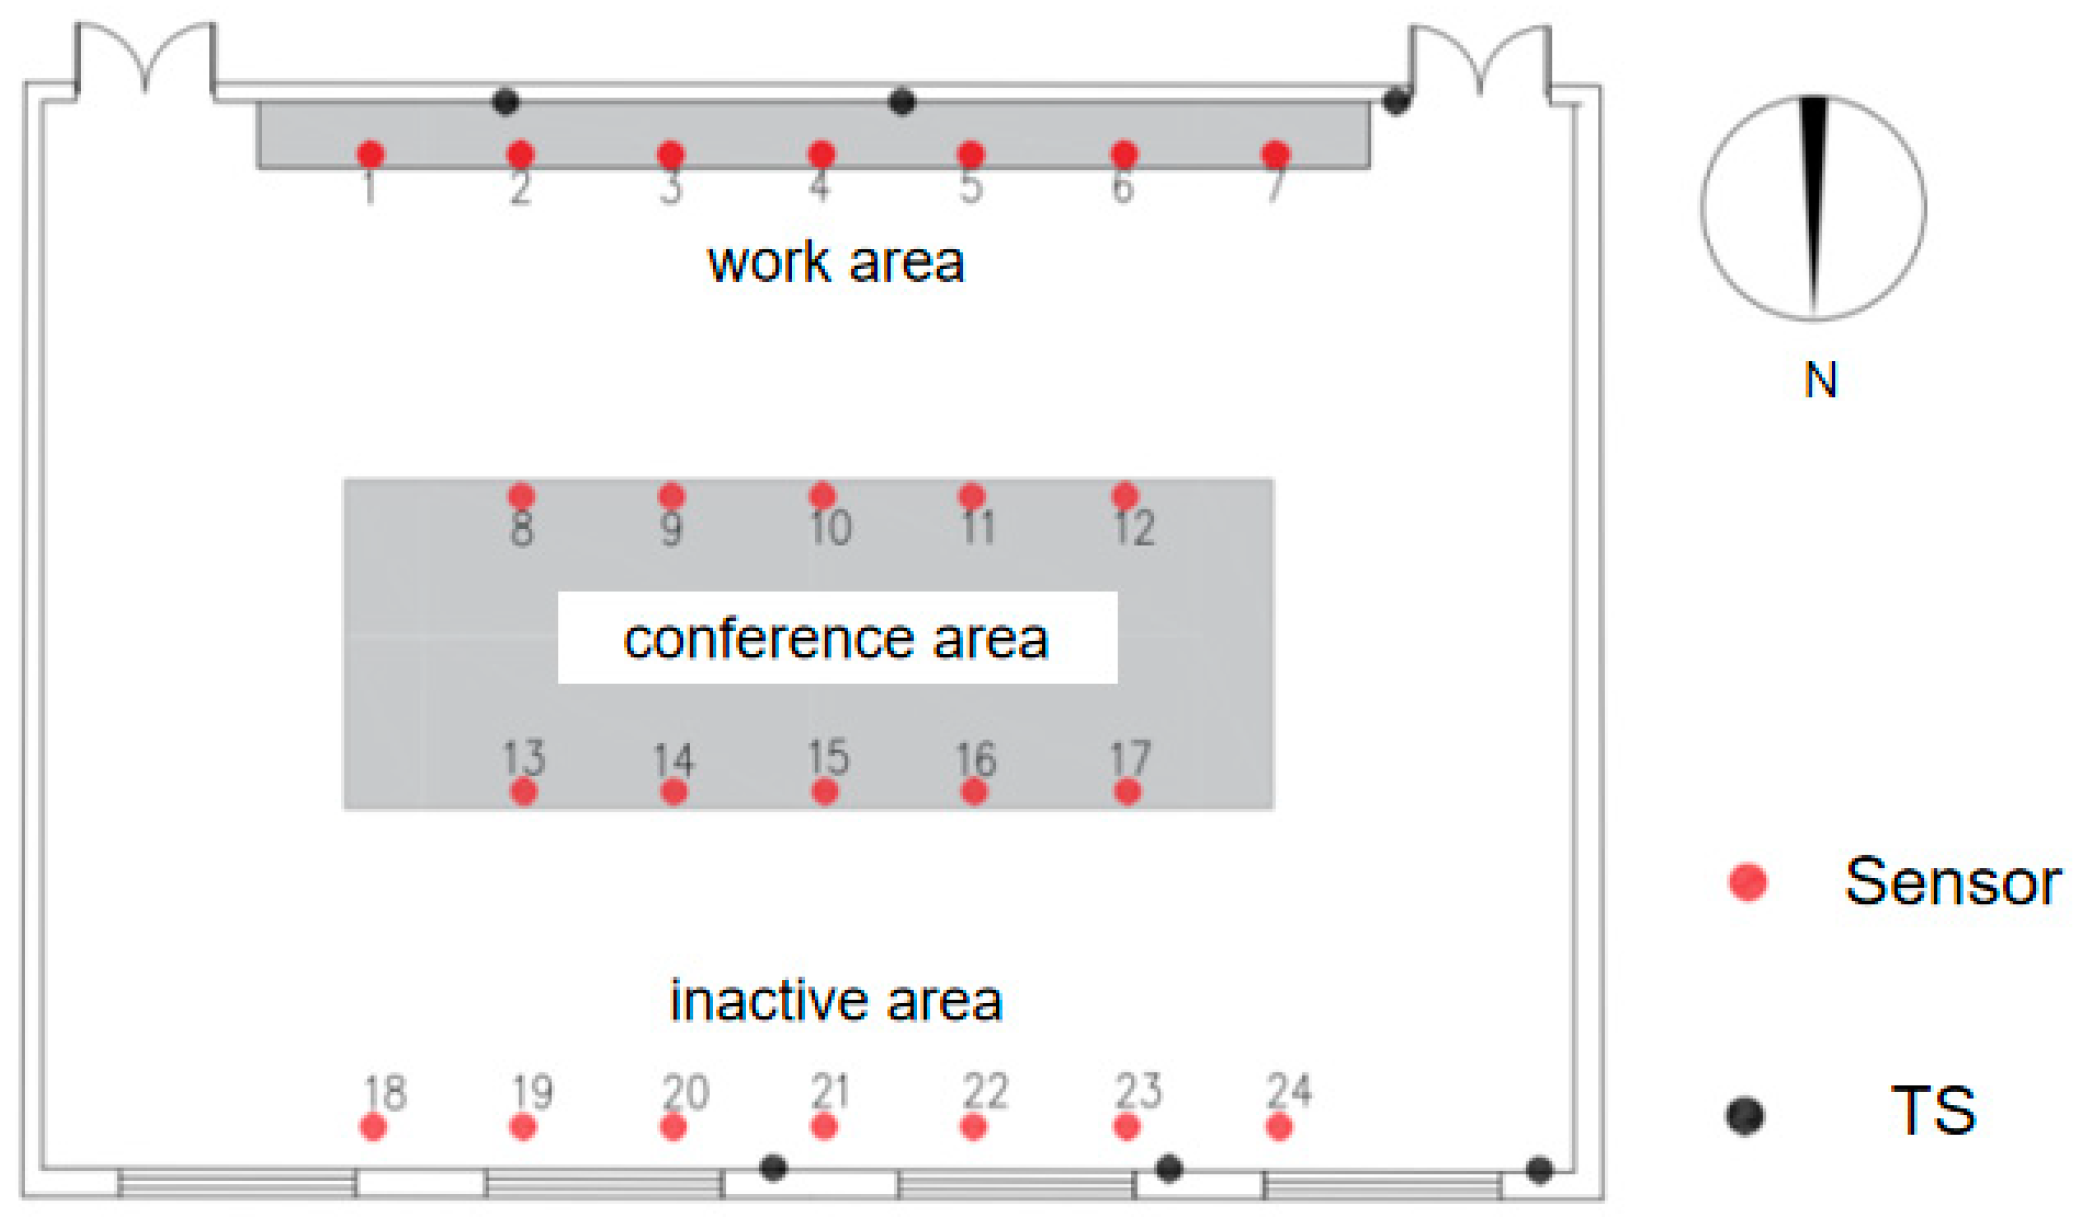
In the full-space operation mode of the air conditioner, deployment points were positioned as uniformly as possible, with a horizontal distance greater than 0.5 m from the wall and located on the central axis of the area, as illustrated in Figure 11. The numbers D1–D8 are the sub-regions, and the numbers 1–24 are the locations of the measuring points. The primary objective of this experiment was to determine average temperature and air velocity in each respective area.
For either the conference area or work area operation mode, measurement points were classified into two groups. Category A measured thermal and humidity environment parameters in occupied areas while Category B was positioned near walls far from occupied areas and required optimized placement. The room was divided into three sections: the conference area, the work area, and non-occupied area with equal spacing for each category. Ten measurement points were allocated to the conference area, seven to the work area, and seven to the non-occupied area. In addition to on-site measurements, six temperature sensors were wall-mounted near outlets. Figure 12 illustrates the arrangement of measurement points for partial-space operational conditions.The numbers 1–24 are the location of the measuring point.
During the experimental phase, the parameters to be measured included indoor temperature, air velocity, and air volume. The selected instrumentation comprised a hygrometer–thermometer, a hot-wire anemometer, and a wind tunnel. Comprehensive details of the chosen instruments and equipment, including their respective models and parameters, are presented in Table 8.

4.3. Results and Analysis

Firstly, we adjusted the water valve to achieve the desired air supply temperature, followed by adjusting the fan speed and damper opening to attain the set air velocity and volume. Additionally, we aligned the air supply angle with the designated angle. Once the air conditioning system stabilized, we measured the temperature and air velocity at specific points for evaluation purposes.
(1)
During full-space mode operation of the air conditioning system, analysis of room measurement point temperatures revealed that all points fluctuated around a design value of 20 °C. Measurement point 8, located near the air outlet, exhibited a slightly higher temperature of 20.5 °C compared to measurement point 1 with a lower temperature of 19.6 °C; however, this difference was of less than 1 °C, indicating relatively uniform room temperatures. Analysis of air velocity at measurement points indicated that most areas within personnel activity experienced airflow below 0.05 m/s as per code requirements while some points near the air outlet had an approximate air velocity of 0.07 m/s; these conditions ensured that no strong drafts were felt by individuals and demonstrated good distribution of airflow. The parameters recorded at each measurement location are displayed in Table 9.
(2)
When the air conditioner was operating in the meeting-area mode, as the airflow angle changed, the isothermal jet would direct more heat towards the meeting area, resulting in a temperature gradient within the room. The temperature at measurement points 8–17 in the meeting area averaged around 20 °C, with a maximum temperature of 20.8 °C. Conversely, measurement points located far from areas of human activity experienced temperatures below 18 °C. Consequently, there existed an approximate temperature difference of 3.5 °C throughout the entire room, leading to a deterioration in overall temperature consistency. However, it should be noted that this higher temperature within the meeting area aligned with design specifications. Despite variations in jet, air velocity within the meeting area experienced only slight increases and still met required standards for human body air velocity.
(3)
When operating in work-area mode, the air conditioner’s airflow jet directed heated air predominantly towards this specific zone. As a result, all measurement points within this work area registered temperatures above or equal to the set value of 20 °C; thus ensuring good thermal comfort for personnel working there. In contrast to these elevated temperatures observed within designated work areas, measurement points outside exhibited lower temperatures averaging at only 17.2 °C and reaching a maximum of 18.8 °C; consequently generating significant horizontal temperature differences across different regions of space. The velocity distribution pattern observed during this mode mirrored that seen previously. The air velocity slightly increased within work areas while local air velocity near outlets was measured at approximately 0.08 m/s, meeting personnel air velocity requirements while remaining stable without any noticeable sensation elsewhere.
The airflow organization evaluation for each region in the room under different operating conditions is presented in Table 10. After adjusting the supply air angle, the average temperatures in the meeting area and work area exceeded the design values, reaching 20.1 °C and 20.5 °C, respectively. Despite an increase in both temperature uniformity coefficient and velocity uniformity coefficient compared to what was noted in the previous operating condition, they still complied with thermal comfort requirements of occupants. Moreover, a perfect ADPI value of 100% indicated that most individuals perceived the airflow organization as satisfactory. In contrast, with an average room temperature of 19 °C and 17.7 °C along with ADPI values of only 50% and 29.2%, respectively, it could be inferred that there was a decrease in airflow organization consistency within the room itself. This specific supply air pattern allowed for meeting design requirements within specific areas such as the meeting area and work area while maintaining lower temperatures in other regions, aligning well with energy saving objectives for air conditioning operation as supported by simulation results.

5. Conclusions and Future Work

5.1. Conclusions

The present paper simulated and experimentally investigated the air-conditioned environment of a large office space with partial occupancy, analyzing the distribution patterns of indoor temperature and airflow velocity under various conditions. Furthermore, by evaluating the coefficient of temperature uniformity, coefficient of velocity uniformity, and ADPI value, a comparative analysis was conducted to assess the obtained results. The findings demonstrate that effective control over factors such as the number and positioning of air outlets, airflow velocities, and supply angles can facilitate the creation of a comfortable thermal environment for individuals within occupied areas while achieving significant energy saving benefits. The key conclusions are as follows:
(1)
When adopting the traditional full-space air supply mode for air conditioning, the room temperature can reach the set value, ensuring a relatively uniform distribution of airflow. The ADPI values indicate a consistent thermal environment in the room, with scores of 93.1% and 100%.
(2)
By utilizing only the central area of the room, it is possible to effectively address the issue of hot air rising during the full-space operation mode of air conditioning and ensure improved airflow distribution, thereby maintaining a temperature of 20 °C in the meeting area. Consequently, compared to the full-space operation mode, there is a decrease in the average room temperature by 1.5 °C, resulting in an overall reduction in the ADPI value from 93.1% to 40.7%.
(3)
Adjusting the supply air temperature, reducing the supply air volume, and selectively closing some of the supply air outlets in the room when one side of the work area is occupied lead to enhanced thermal comfort in that specific area while failing to meet the thermal comfort requirements for personnel in other areas. Consequently, this results in a decrease in the average room temperature to 18.5 °C and an overall ADPI value reduction to 19.4%, thereby accomplishing energy consumption reduction objectives for air conditioning.

5.2. Future Work

In this paper, three common schemes have been proposed for simulating airflow in a confined space. Our research focused on optimizing the simulation object and determining the supply air temperature, air velocity, and supply air angle, followed by experimental verification. Nevertheless, there remain certain issues in this paper that necessitate further discussion and improvement. To investigate the impact of spatial airflow organization on room temperature distribution, multiple air supply modes (such as up-to-up/up-to-down/down-to-down, etc.) should be established and the distribution characteristics of room temperature under dynamic loads with different air supply modes should be studied.

Author Contributions

Conceptualization, T.C.; methodology, M.Z. and T.C.; experiment and result analysis, M.Z. and S.H.; writing—original draft preparation, Y.H.; writing—review and editing, T.C. All authors have read and agreed to the published version of the manuscript.

Funding

This research received no external funding.

Data Availability Statement

The original contributions presented in the study are included in the article, further inquiries can be directed to the corresponding author.

Acknowledgments

This work was supported by the Plan of Introduction and Cultivation for Young Innovative Talents in Colleges and Universities of Shandong Province.

Conflicts of Interest

The authors declare no conflicts of interest.

References

  1. Bauman, F.; Zhang, H.; Arens, E.A.; Benton, C. Localized comfort control with a desktop task conditioning system: Laboratory and field measurements. Ashrae Trans. 1993, 99, 733–749. [Google Scholar]
  2. Habchi, C.; Chakroun, W.; Alotaibi, S.; Ghali, K.; Ghaddar, N. Effect of shifts from occupant design position on performance of ceiling personalized ventilation assisted with desk fan or chair fans. Energy Build. 2016, 117, 20–32. [Google Scholar] [CrossRef]
  3. Information, V.F.A.; Trebilcock, M. A systematic review of Personal Comfort Systems from a post-phenomenological view. Ergonomics 2024, 21–24. [Google Scholar]
  4. Boudier, K.; Hoffmann, S. Analysis of the Potential of Decentralized Heating and Cooling Systems to Improve Thermal Comfort and Reduce Energy Consumption through an Adaptive Building Controller. Energies 2022, 15, 1100. [Google Scholar] [CrossRef]
  5. Zhu, W.; Gao, R.; Zhou, L.; Liu, Y.; Jing, R.; Zhang, Z.; Li, A. Multi-objective Air Terminal of a Household Air Conditioner Based on the Principle of Central Projection. Energy Build. 2021, 249, 111212. [Google Scholar] [CrossRef]
  6. Fong, M.L.; Lin, Z.; Fong, K.F.; Chow, T.T.; Yao, T. Evaluation of thermal comfort conditions in a classroom with three ventilation methods. Indoor Air 2011, 21, 231–239. [Google Scholar] [CrossRef] [PubMed]
  7. Li, S.; Jia, X.; Peng, C.; Zhu, Y.; Cao, B. Effects of temperature cycles on human thermal comfort in built environment under summer conditions. Sci. Total Environ. 2024, 912, 168756. [Google Scholar] [CrossRef] [PubMed]
  8. Wu, Q.; Liu, J.; Zhang, L.; Zhang, J.; Jiang, L. Study on thermal sensation and thermal comfort in environment with moderate temperature ramps. Build. Environ. 2019, 171, 106640. [Google Scholar] [CrossRef]
  9. Gao, S.; Li, Y.; Wang, Y.A.; Meng, X.Z.; Zhang, L.Y.; Yang, C.; Jin, L.W. A human thermal balance based evaluation of thermal comfort subject to radiant cooling system and sedentary status. Appl. Therm. Eng. 2017, 122, 461–472. [Google Scholar] [CrossRef]
  10. Zhang, S.; Lin, Z.; Ai, Z.; Huan, C.; Cheng, Y.; Wang, F. Multi-criteria performance optimization for operation of stratum ventilation under heating mode. Appl. Energy 2019, 239, 969–980. [Google Scholar] [CrossRef]
  11. Li, Q.; Yoshino, H.; Mochida, A.; Lei, B.; Meng, Q.; Zhao, L.; Lun, Y. CFD Study of The Thermal Environment in an Air-conditioned Train Station Building. Build. Environ. 2009, 44, 1452–1465. [Google Scholar] [CrossRef]
  12. Feng, G.; Lei, S.; Gu, X.; Guo, Y.; Wang, J. Predictive control model for variable air volume terminal valve opening based on backpropagation neural network—ScienceDirect. Build. Environ. 2020, 188, 107485. [Google Scholar] [CrossRef]
  13. Zhao, Y.; Li, W.; Jiang, C. Thermal sensation and occupancy-based cooperative control method for multi-zone VAV air-conditioning systems. J. Build. Eng. 2023, 66, 105859. [Google Scholar] [CrossRef]
  14. Lei, L.; Liu, W. Predictive control of multi-zone variable air volume air-conditioning system based on radial basis function neural network. Energy Build. 2022, 261, 111944. [Google Scholar] [CrossRef]
  15. Zhang, J.; Xiao, F.; Li, A.; Ma, T.; Xu, K.; Zhang, H.; Yan, R.; Fang, X.; Li, Y.; Wang, D. Graph neural network-based spatio-temporal indoor environment prediction and optimal control for central air-conditioning systems. Build. Environ. 2023, 242, 110600. [Google Scholar] [CrossRef]
  16. Zhang, L.; Yu, X.; Lv, Q.; Cao, F.; Wang, X. Study of transient indoor temperature for a HVAC room using a modified CFD method. Energy Procedia 2019, 160, 420–427. [Google Scholar] [CrossRef]
  17. Liang, C.; Shao, X.L.; Melikov, A.K.; Li, X.T. Cooling load for the design of air terminals in a general non-uniform indoor environment oriented to local requirements. Energy Build. 2018, 174, 603–618. [Google Scholar] [CrossRef]
  18. Noh, K.-C.; Oh, M.-D.; Lee, S.-C. A numerical study on airflow and dynamic cross-contamination in the super cleanroom for photolithography process. Build. Environ. 2005, 40, 1431–1440. [Google Scholar] [CrossRef]
  19. ANSI/ASHRAE Standard 113; Method of Testing for Room Air Diffusion. American Society of Heating, Refrigeration and Air-Conditioning (ASHRAE): Peachtree Corners, GA, USA, 2009.
  20. GB50736-2012; Design Code for Heating, Ventilation and Air Conditioning of Civil Buildings. China Architecture and Construction Press: Beijing, China; Ministry of Housing and Urban-Rural Development: Beijing, China, 2012; pp. 6–8.
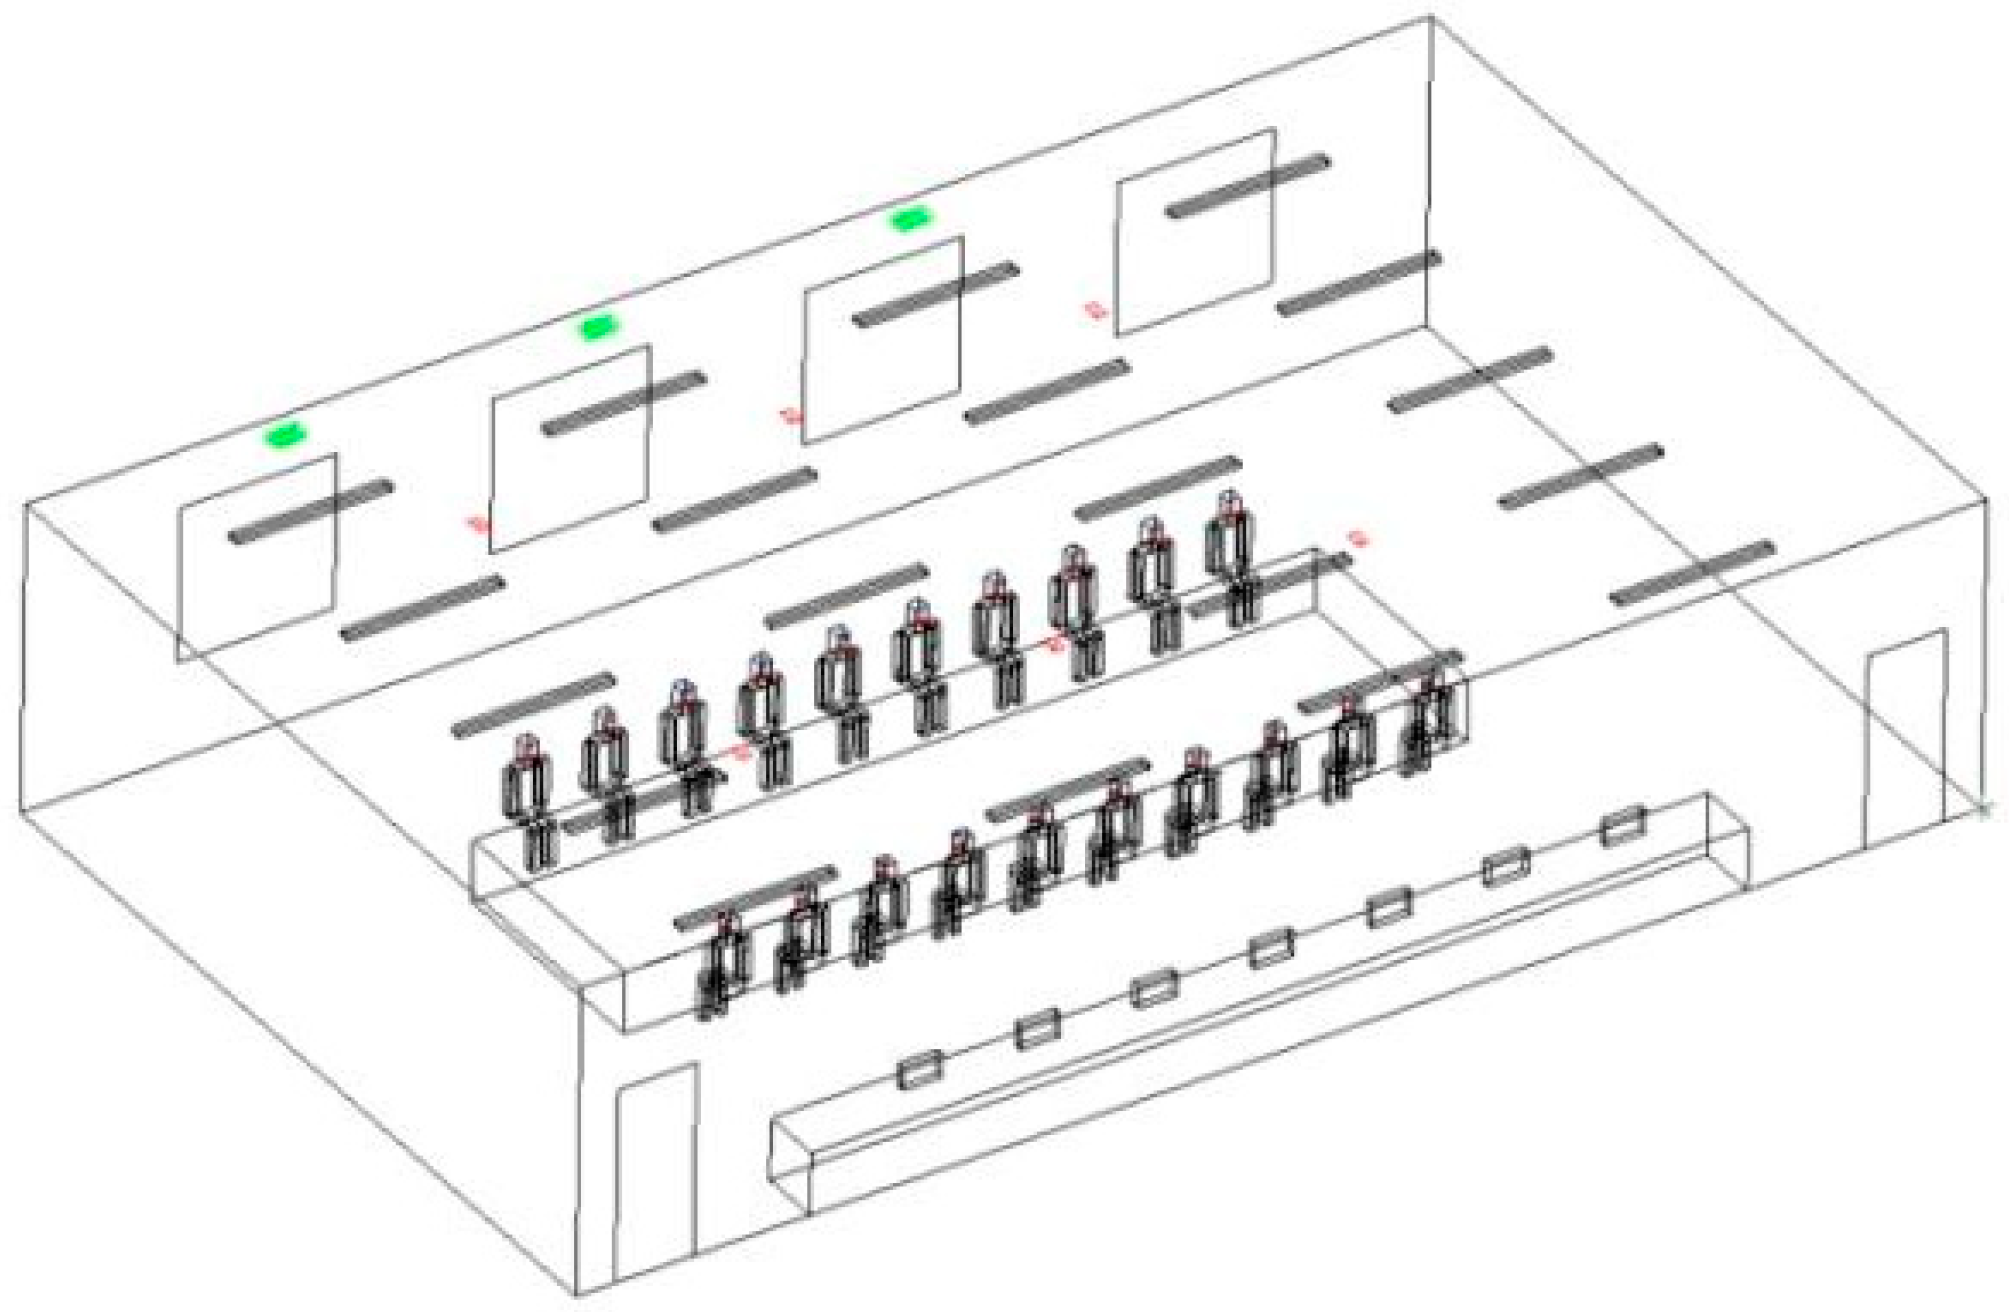
Figure 1. Three-dimensional model of the building.
Energies 17 05041 g001
Figure 2. Schematic diagram of simulated measuring points.
Energies 17 05041 g002
Figure 3. Full-space operating temperature: cloud pictures of air conditioner in winter conditions.
Energies 17 05041 g003
Figure 4. Cloud pictures of the air conditioner’s full-space air velocity in winter conditions.
Energies 17 05041 g004
Figure 5. Operating temperature cloud pictures of air conditioning only in the conference area in winter conditions.
Energies 17 05041 g005aEnergies 17 05041 g005b
Figure 6. Cloud pictures of air conditioning air velocity only in the conference area under winter conditions.
Energies 17 05041 g006aEnergies 17 05041 g006b
Figure 7. Operating temperatures: cloud pictures of air conditioning only in the working area in winter conditions.
Energies 17 05041 g007
Figure 8. Cloud images of air conditioner air velocity only in working area in winter conditions.
Energies 17 05041 g008
Figure 9. Temperature distributions at different vertical heights of the room.
Energies 17 05041 g009
Figure 10. Schematic diagram of air conditioning VAV system.
Energies 17 05041 g010
Figure 11. Temperature sensor layout in full-space operation mode.
Energies 17 05041 g011
Figure 12. Layout of temperature sensors in partial-space operation mode.
Energies 17 05041 g012
Table 1. Main abbreviations: comparison table.
AbbreviationFull Name
VAVVariable air volume
HVACHeating, ventilation, and air conditioning
PCSVPersonalized ceiling supply ventilation
SFSeat fan
ACPVAir Clothing Personalized Ventilation
PECSPersonal environmental comfort system
OPSISOrder preference by similarity to ideal solution
CFDComputational fluid dynamics
TSOCCThermal-sensation-and-occupancy-based cooperative control
RBFRadial basis function
ADPIAir Diffusion Performance Index
Table 2. Summary table of parameters in different running modes.
Air Conditioning
Operation Mode Air
Temperature/°CAir Volume
/(m3/h)
Airflow Velocity
/(m/s)
Diffusion Angle
Complete space3211701.590°
Conference Area3210141.345°
Working area326631.745°
Table 3. Airflow organization of air conditioner in full-space operation mode in winter conditions.
Area12345678
ADPI100%100%88.9%100%100%100%100%100%
Coefficient of temperature non-uniformity0.1140.1970.1880.1490.0660.0740.0650.035
Coefficient of velocity non-uniformity0.0310.0660.0430.050.0290.0520.0210.019
Table 4. Winter conditions: airflow organization of air conditioning in only the conference area operation mode.
Area12345678Conference Area
ADPI/100%100%//33.3%33.3%/100%
Coefficient of temperature non-uniformity0.1270.2540.1170.3180.4440.7260.7260.4790.361
Coefficient of velocity non-uniformity0.0220.0270.0140.0180.0090.0230.0180.0160.015
Table 5. Airflow organization of air conditioner in working area only in winter conditions.
Area12345678Working Area
ADPI/44.4%55.6%/////100%
Coefficient of temperature non-uniformity0.4380.8960.6820.7970.2370.3940.2610.2880.375
Coefficient of velocity non-uniformity0.0370.0540.0380.0620.0190.0210.0250.0180.012
Table 6. Evaluation criteria of room airflow organization under winter conditions.
Air Conditioning
Operation Mode
Average
Temperature/°C
Airflow Rate
/(m/s)
Exhaust Air Temperature
/°C
Temperature
Non-Uniformity
Coefficient
Velocity
Non-Uniformity
Coefficient
ADPI
Total space20.30.0620.50.2240.01393.1%
Conference area18.70.0718.80.3890.01640.7%
Working area15.50.0612.60.7020.01212.5%
Table 7. Return air temperature and air volume under different air conditioner operating modes.
Air conditioning Operation ModeReturn Air
Temperature/°C
Air Volume
/(m3/h)
Air Velocity/(m/s)
Complete space20.711101.5
Conference area19.210001.3
working area15.16351.7
Table 8. Parameters of each experimental instrument.
Instrument NameModelAccuracyMeasurement ParameterMeasurement RangeManufacturerLocation
Temperature and humidity self-planningTH11R±0.2 °C Resolution 0.1 °CTemperature−40–85 °CHuahanwei Technology Co., Ltd.Shenzhen, China
Hot-wire anemometerKA230.00–4.99 m/s ± 2%FS
5.00–50.0 m/s ± 2%FS
Air velocity0.00–50.0 m/skANOMAXOsaka, Japan
Volume hoodGTI610±3% of the reading ± 10 m3/h
(>85 m3/h)
Air volume40–4300 m3/hSwemaStockholm, Sweden
Table 9. Measuring point parameters of air conditioner full-space operation mode.
Station Position123456789101112
Temperature/°C19.619.720.219.819.920.32020.520.220.119.820.3
Air velocity/(m/s)0.020.030.040.030.070.050.030.060.020.010.020.01
Station position131415161718192021222324
Temperature/°C2019.919.720.120.220.220.120.319.920.220.320.1
Air velocity/(m/s)0.010.030.020.050.060.040.060.050.020.020.010.02
Table 10. Evaluation indexes of room airflow organization under different working conditions.
Air
Conditioning Operation Mode
RegionAverage
Temperature/°C
Average Air
Velocity/(m/s)
Coefficient of
Temperature
Non-Uniformity
Coefficient of Velocity Non-UniformityADPI
Total spaceroom20.10.030.230.01891.7%
Conference areaConference area20.10.060.460.067100%
Working area190.030.280.02428.5%
room190.040.360.04450%
Working areaConference area17.90.020.570.011/
Working area20.50.050.20.037100%
room17.70.030.410.02229.2%
Disclaimer/Publisher’s Note: The statements, opinions and data contained in all publications are solely those of the individual author(s) and contributor(s) and not of MDPI and/or the editor(s). MDPI and/or the editor(s) disclaim responsibility for any injury to people or property resulting from any ideas, methods, instructions or products referred to in the content.