Abstract
A significant challenge in utilizing hydrogen in conventional internal combustion engines is achieving a balance between NOx emissions and brake power output. A lean premixed charge (Lambda ≈ 2.5) allows for efficient and stable combustion with minimal NOx emissions. However, this comes at the cost of reduced power density due to the higher air requirements of the thermodynamic process. While supercharging can mitigate this drawback, it introduces increased complexity, cost, and size. An intriguing alternative is the 2-stroke cycle, particularly in an opposed piston (OP) configuration. This study presents the virtual development of a single-cylinder 2-stroke OP engine with a total displacement of 0.95 L, designed to deliver 25 kW at 3000 rpm. Thanks to its compact size, high thermal efficiency, robustness, modularity, and low manufacturing cost, this engine is intended for use either as an industrial power unit or in combination with electric motors in hybrid vehicles. The overarching goal of this project is to demonstrate that internal combustion engines can offer a practical and cost-effective alternative to hydrogen fuel cells without significant penalties in terms of efficiency and pollutant emissions. The design of this novel engine started from scratch, and both 1D and 3D CFD simulations were employed, with particular focus on optimizing the cylinder’s geometry and developing an efficient low-pressure injection system. The numerical methodology was based on state-of-the-art commercial codes, in line with established engineering practices. The numerical results indicated that the optimized engine configuration slightly surpasses the target performance, achieving 29 kW at 3000 rpm, while maintaining near-zero NOx emissions (<20 ppm) and high brake thermal efficiency (~40%) over a wide power range. Additionally, the cost of this engine is projected to be lower than an equivalent 4-stroke engine, due to fewer components (e.g., no cylinder head, poppet valves, or camshafts) and a lighter construction.
1. Introduction
It is widely recognized that hydrogen (H2) generated from renewable sources (green H2 [1,2]) can substantially decrease CO2 emissions and other pollutants from internal combustion engines [3]. However, the primary challenge with hydrogen combustion is managing NOx emissions, which either necessitates an expensive after-treatment system or requires a specific combustion control strategy [4].
Hydrogen’s high resistance to auto-ignition, thanks to its Research Octane Number (RON) exceeding 120, makes it an appealing option for spark ignition (SI) engines [5]. However, adapting a traditional 4-stroke (4S) gasoline engine to operate with hydrogen presents several challenges and requires substantial design changes to accommodate the distinct characteristics of hydrogen, including its low-volumetric energy density and high diffusivity [6,7,8,9].
The optimal balance between nitrogen oxide emissions (NOx) and brake thermal efficiency (BTE) was achieved with equivalence ratios (Φ) in the range of 0.35–0.40 (λ between 2.5 and 2.9). Bao et al. [10,11], for example, investigated a turbocharged 4S, 4-cylinder engine with an hydrogen direct-injection system, demonstrating that nearly zero (<20 ppm) NOx emissions along with a high BTE were possible across key operating conditions. Their study examined the effects of the Miller cycle, ignition timing, and fuel injection strategies on engine performance. Two combustion approaches were evaluated as the following: ultra-lean combustion (λ = 2.8, Φ = 0.36) with standard spark timing and lean combustion (λ = 2.5, Φ = 0.40) using advanced spark timing. Among these, lean combustion paired with advanced spark timing proved to be the most efficient in terms of reducing emissions while enhancing overall efficiency. Ensuring that the center of the burn curve (CA50) occurred within a 15–20-degree crank angle after Top Dead Center (CAD aTDC) was key to achieving smooth and knock-free combustion. This approach resulted in in-cylinder temperatures comparable to those observed with ultra-lean mixtures (Φ = 0.36), thereby minimizing NOx emissions and reducing heat losses while ensuring steady performance. Furthermore, the increased enthalpy of the exhaust gases improved the turbocharger’s speed and airflow, which in turn enhanced the engine torque and power without compromising the BTE.
A significant limitation of 4S H2 engines operating on lean mixtures—as demonstrated in [1,2]—is their need for an extremely high air mass flow rate to meet performance targets. Achieving these high-volumetric efficiency levels can be challenging, particularly for high-speed engines. Supercharging alone often falls short, even when employing advanced technologies like Variable Geometry turbines, which struggle to maintain high boost pressures across a broad range of engine speeds. As a result, achieving both high- low-end torque and peak power output, without the use of a complex and expensive supercharging system, becomes nearly unreachable. This challenge underscores the inherent difficulty of balancing performance characteristics in traditional engine configurations.
An alternative approach to hydrogen engine development involves the use of a 2-stroke (2S) cycle [12], particularly the opposed piston (OP) configuration. This concept is not entirely new, having first been introduced in aircraft engines in the late 1930s. Although most existing OP engines utilize compression ignition, spark ignition combined with direct fuel injection can be implemented without significant difficulty [13,14].
Compared to 4-stroke engines, 2-stroke OP engines offer several advantages [15,16,17]:
- The increased cycle frequency enables performance targets to be met with smaller engine displacement, lower rotational speeds, and a reduced brake mean effective pressure (BMEP).
- Heat losses are significantly reduced because of the smaller surface area of the combustion chamber, which is enclosed by the crowns of both pistons and the liner section in between. This configuration also removes the need for a cylinder head.
- Mechanical losses are lowered as a result of the absence of valves. Instead, airflow is controlled by two sets of ports, which are opened and closed through the movement of the pistons. However, it is crucial to account for the influence of the motion of both crankshafts.
- High levels of in-cylinder turbulence contribute to improved air–fuel mixing, which in turn accelerates combustion.
These benefits collectively contribute to an improved BTE.
For equivalent performance targets, OP engines typically incur lower production costs, primarily due to fewer components and decreased thermal and mechanical stresses. The primary challenges in developing an OP hydrogen engine can be summarized as follows.
To minimize fuel short-circuiting during scavenging, hydrogen should be injected as late as possible into the cylinder. However, delayed injection limits the time available for proper air–fuel mixing, especially at high engine speeds. While this issue is less pronounced compared to 4-stroke engines—due to the increased turbulence levels within the cylinder and more flexibility in injector positioning—it remains a critical factor in the engine’s design.
It is worth noting that the injectors can be mounted either in the liner or in the scavenging manifold. In the latter scenario, a low-cost, low-pressure injection system can be used, provided that the injection timing is well coordinated with the scavenging phase to prevent fuel from accumulating in the manifold, which may lead to backfire.
Low-pressure injection can also be applied when introducing fuel directly into the cylinder during scavenging or shortly after the ports have closed. In these conditions, one major challenge is the thermal stress experienced by the injector tip that faces the cylinder. This issue can be mitigated by injecting hydrogen through several smaller ducts, allowing the injector to be positioned at a slight distance from the liner without directly facing it. Even more effective from a thermal stress perspective would be installing these ducts in the scavenging manifold, with their orientation directed toward the ports.
One potential issue for the upcoming generation of OP engines is the combustion of lubricating oil, which results in CO2 emissions. The European Union has set a stringent limit of 1 g CO2/kWh for zero-carbon powertrains [18]. As a result, forced lubrication of the crankcase is crucial to preventing lubricating oil from mixing with the fresh air–fuel charge, which contrasts with the approach used in smaller crankcase-scavenged 2-stroke engines. Furthermore, minimizing blow-by between the cylinder and both crankcases requires precise engineering of the piston rings and the liner–piston interface. Achates Power [19] reported that current OP engines already emit significantly below the regulatory CO2 limits, indicating that similarly low oil consumption can be expected from future hydrogen-powered units.
In the absence of a crankcase pump, employing a supercharger becomes essential for pushing fresh air through the cylinder. It is important to highlight that a turbocharger alone is insufficient to adequately supply the engine, as it cannot consistently maintain the necessary pressure differential across the cylinder under all operating conditions. Therefore, a dedicated supercharging system is crucial to ensuring proper airflow and optimal performance across a range of conditions. Typically, this role is fulfilled by either a mechanical or electric compressor.
For low power outputs (below 30 kW), as examined in this study, a two-stage system comprising a turbocharger, a mechanical or electric supercharger, and one or two charge coolers does not seem to be a practical solution. Therefore, the most interesting option is the use of a mechanical supercharger, with a bypass valve to control the load: when the torque output has to be reduced, the opening of the bypass permits the precise calibration of the airflow rate feeding the cylinder, sending excess air directly to the exhaust. A charge cooler between the supercharger and the cylinder is an option that should be carefully considered; on the one hand, the heat exchanger permits an increase in air density and lowers the risk of auto-ignition, particularly critical when the air–fuel mixture is close to stoichiometric or it contains a high fraction of burnt gas from the previous cycle, while on the other hand, this cumbersome component may be avoided, if the pressure ratio across the supercharger is limited (<1.6) and combustion is ultra-lean (λ > 2.2).
Last but not least, the combustion system for a hydrogen OP engine has to be designed from scratch, due to the lack of references in the open literature. A previous study by the authors [20] suggested that the installation of a small radial pre-chamber with a single spark plug may be sufficient for providing a regular and complete combustion. This outcome is explained by the very high level of turbulence in the combustion chamber, speeding up the development of the flame front; another reason is the very low surface-to-volume ratio of the combustion chamber, which minimizes heat losses, at least when the piston crowns are flat or have a shallow bowl. The scavenging system design has been optimized over several studies provided by the authors [21,22].
The main competitor for the 2-stroke OP engine is the electric motor powered by hydrogen fuel cells (FCs). At present, piston engines are less complex and significantly more cost-effective. Additionally, internal combustion engines (ICEs) have the advantage of being able to use hydrogen with a purity level of 98% to 99%, whereas fuel cells require hydrogen at nearly 100% purity. This higher purity requirement makes hydrogen for fuel cells more costly to produce and distribute. Furthermore, fuel cells face other challenges, including reliability issues, high initial investment costs, and increased maintenance requirements. For hydrogen-powered internal combustion engines to be a feasible alternative, they need to reach efficiency levels similar to those of fuel cells. Although fuel cells can reach peak efficiencies as high as 60%, their performance drops substantially under increased loads. One study [23] indicated that the average efficiency of a fuel cell stack is below 50%, and the overall system efficiency falls to less than 40% under high loads, primarily due to parasitic losses from air compressors and other auxiliary components. Furthermore, fuel cells necessitate the use of electric motors for vehicle propulsion, further reducing total system efficiency. Considering these aspects, 2-stroke OP hydrogen engines could offer a significant advantage for commercial vehicles operating under heavy load conditions. Battery electric vehicles (BEVs) are often hindered by limitations such as weight and extended recharging times, making them less suitable for long-haul applications. Hydrogen-powered internal combustion engines also show substantial promise for applications in stationary power generation, off-road vehicles, marine vessels, and industrial machinery.
The goal of this study was to develop from scratch a novel, single-cylinder opposed piston SI hydrogen engine rated at 25 kW at 3000 rpm. The fundamental constraints of the project were the following:
- Achieve a best value of brake thermal efficiency (BTE) of 40%;
- Adopt a low-pressure fuel injection system;
- Adopt a mechanical supercharger with intercooler;
- Avoid the use of complex devices for reducing knocking, such as water injection;
- Adopt conventional technologies for the construction of the engine (no exotic solutions).
Due to the absence in the literature of similar prototypes, the design was entirely driven by state-of-the-art CFD tools (both 1D and 3D), following well-established engineering practice. Particular care was devoted to the analysis of hydrogen injection using 3D CFD simulations and the to the prediction of brake performances through 1D CFD simulations.
The following sections provide a detailed report of the research, describing in detail the adopted design solutions, with particular reference to the cylinder’s geometry and the injection system, and showing the performance parameters predicted by the simulations. Finally, this research examined the dimensions and weight of the prototype, assessing how design choices could impact its physical shape and mass.
2. Methodology
As already mentioned, the design of the engine started from scratch. Without the guidance of experimental data, the only possible approach was a numerical analysis, employing state-of-the art CAE tools.
This study was carried out by means of 1D and 3D CFD simulations, using GT-Power v2022, by Gamma Technologies [24] and FIRE-M 2023R2, by AVL [25].
The numerical approach for the development of the engine was standard engineering practice, where the results of both the 1D and 3D simulations were integrated in an iterative process. Once the main characteristics of the engine were defined, at least as a first guess, a complete 1D-CFD model was built, including the cylinders, intake and exhaust systems, et cetera. This model permitted a preliminary optimization of the main parameters, such as the timing of the inlet/exhaust ports, the airflow rate, the charge pressure in the intake manifold, et cetera. Obviously, these first results were affected by many uncertainties, in particular about the complex cylinder processes, such as scavenging, injection, and combustion. For the analysis of these processes, 3D-CFD simulations were needed. The computational domain of the 3D study was limited to the cylinder and the intake and exhaust manifolds; therefore, the boundary and initial conditions were provided by the previous 1D-CFD analysis. The results of the 3D-CFD simulations drove the optimization of the geometric details of the cylinders; moreover, they provided fundamental information for the calibration of the sub-models incorporated in the 1D-CFD software. Further iterations were performed by first running the 1D-CFD simulation, then the 3D analyses, with updated boundary and initial conditions.
As the 3D-CFD analysis of the combustion process was quite time-consuming, the use of an accurate predictive combustion model in the 1D-CFD engine simulations was absolutely necessary to speed up the design process. In a previous study by the authors [20], the predictive quasi-dimensional hydrogen combustion model included in GT-Power was calibrated with the support of experimental data and 3D-CFD simulations. Table 1 shows the setup of the main parameters of this model and a full report on the calibration process can be found in the reference paper.

Table 1.
SI TURB setup for the combustion and NOx model.
Obviously, once a promising engine configuration was found, a full 3D study of the engine cycle was needed to validate the 1D results, at least in the operating points of high interest.
The final 1D-CFD model resulting from the iterative process was able to analyze different control strategies and further optimize the engine performance.
It should be noted that the methodology described above was already deployed by the authors for several applications involving 2S opposed piston engines [20]. Also, Lawler et al. [26,27,28] adopted an identical approach to analyze the same type of engines, generally finding a good agreement with the experimental data.
The main geometric features of the engine, optimized by means of the numerical approach described above, are listed in Table 2.
Table 2.
Main features of the OP 2S engine.
Particular care was devoted in this study to the development of the low-pressure injection system, with a specific focus on the 3D CFD optimization of the injection process, using the initial conditions and constraints provided by the calibrated 1D model. The following section describes the main outcomes of this analysis.
3. Intake and Exhaust Manifolds
In Table 3 are reported the main characteristics of the intake and exhaust ports. The clearance between the ports’ holes and cylinder metal of almost 4 mm allowed piston ring stability despite the high number of holes. In fact, the ratio between the total ports’ width and the cylinder’s circumference was always below 0.8, as suggested theoretically [12].
Table 3.
OP ports’ main characteristics.
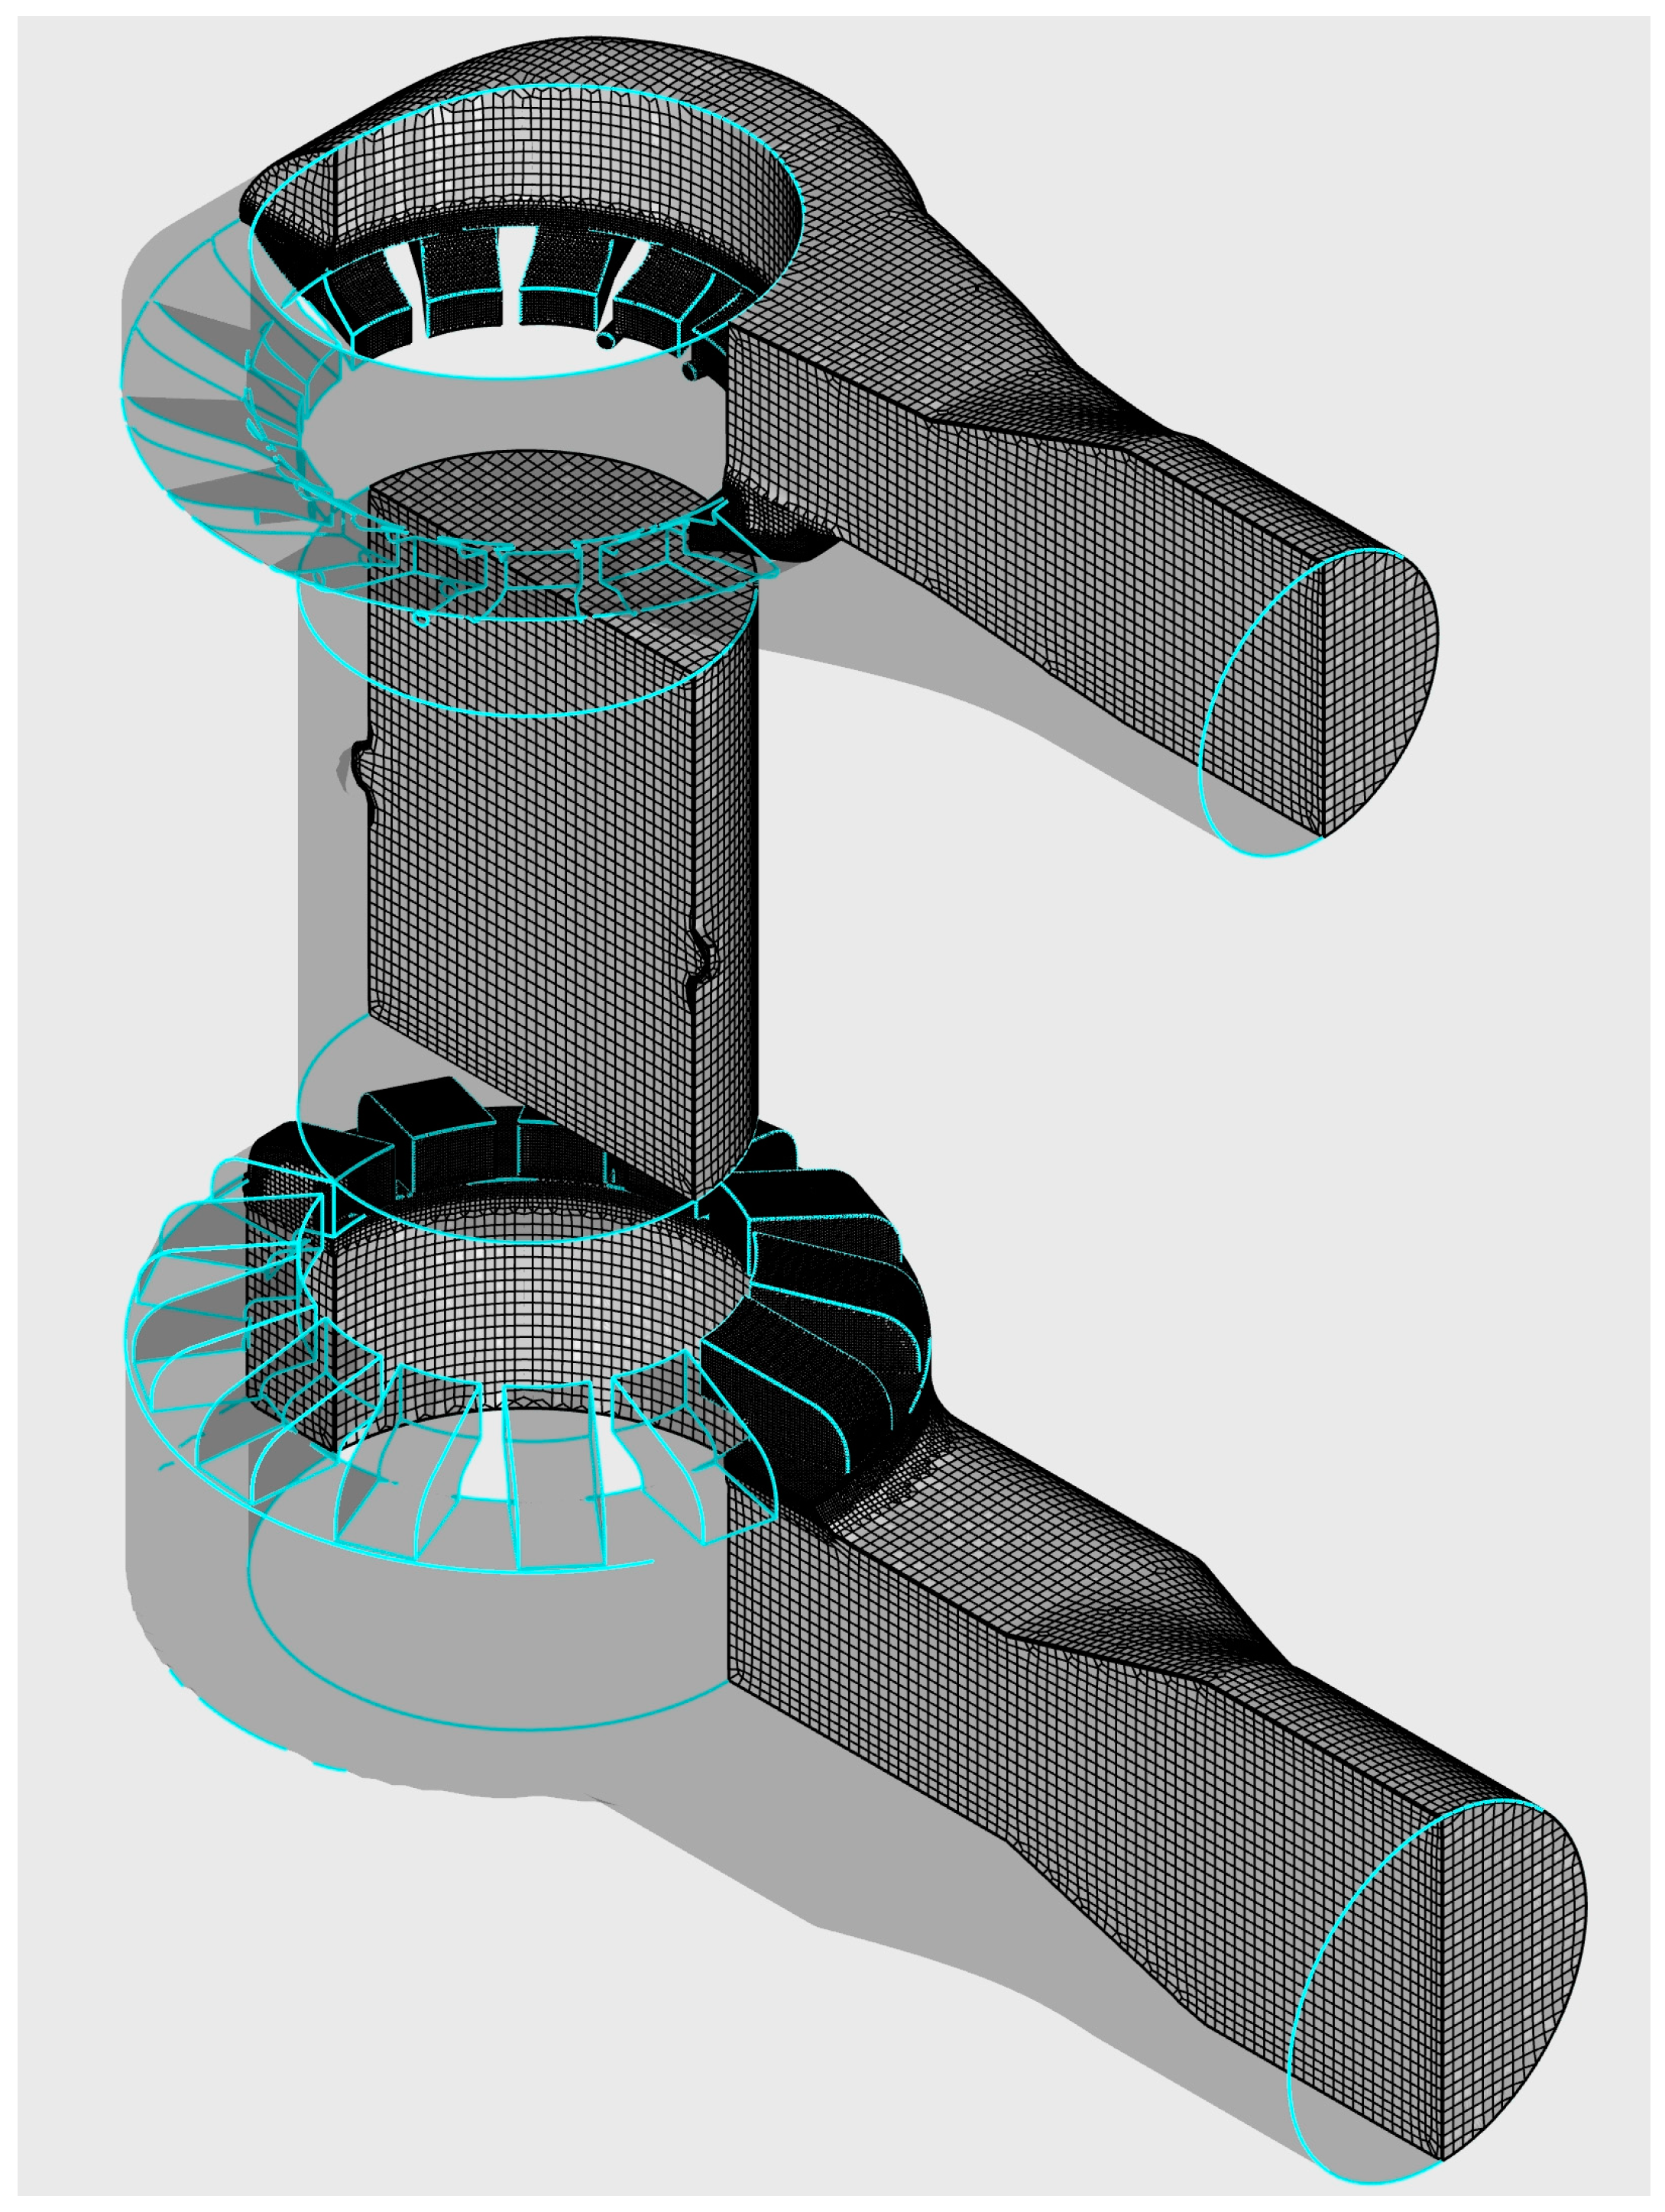
Figure 1 displays the entire computational volume, segmented into three zones: the cylinder at the center, intake at the top, and exhaust at the bottom. Within the central plane of the cylinder, two recesses were designed to accommodate up to two spark plugs, should they have been required during the engine’s developmental phase. The exhaust volume features rectangular port section that descend toward a volume with a 25-degree tilt angle. This “toroid-shaped” volume then narrows into a circular tube section that connects to the exhaust system.
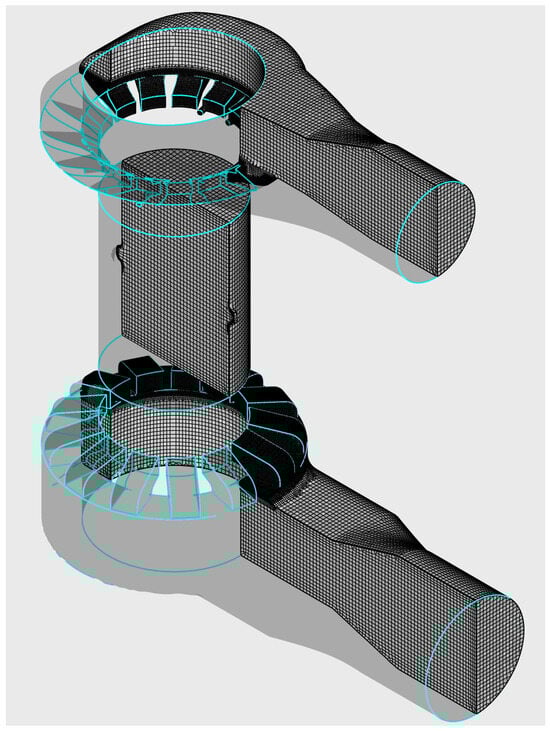
Figure 1.
Mesh of the cylinder (volume between the two pistons at half of the stroke), scavenge manifold (bottom), and exhaust manifold.
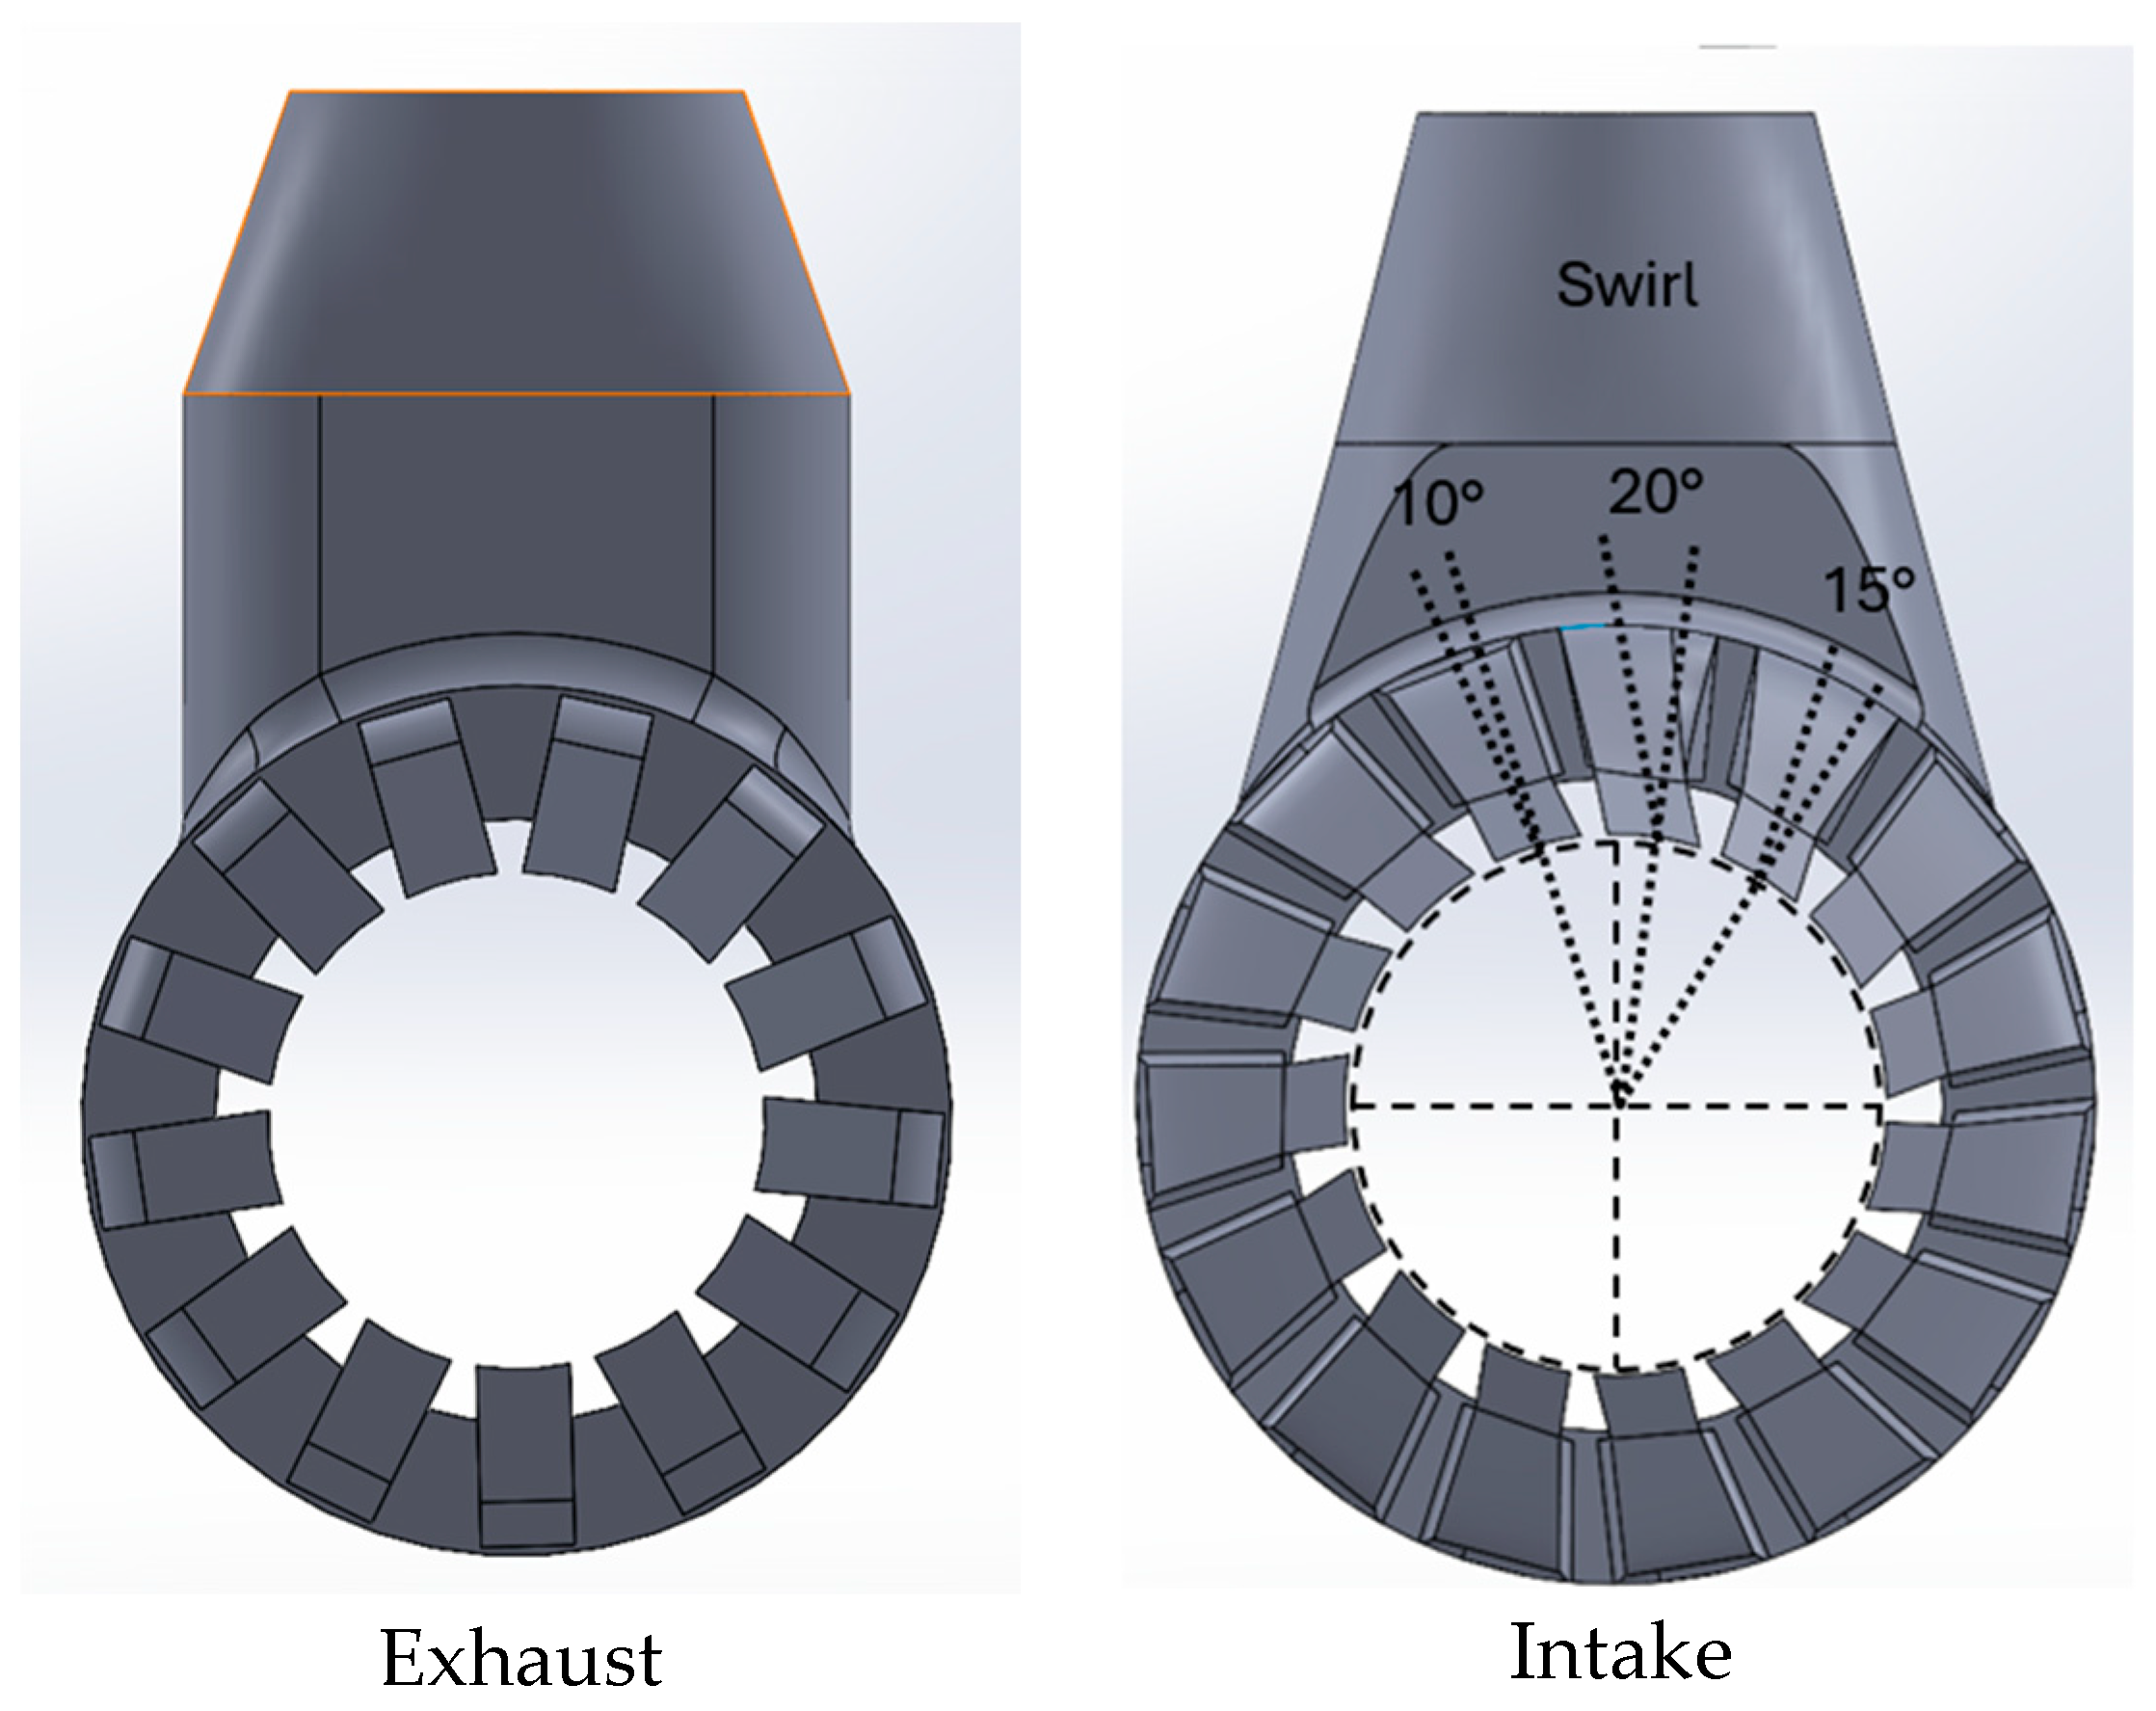
For the intake system, a tilt angle of 15 degrees is complemented by an additional swirl angle, enhancing the swirling motion of the incoming air charge. Similar to the exhaust, the intake ports connect to a toroidal volume before merging with the intake system. This design ensures a uniform distribution of air across all ports, preventing the ports nearest to the intake mouth from monopolizing the airflow, thereby ensuring that distant ports also receive adequate fresh air. To enhance the airflow velocity within the intake volume and ensure that air reached the farther ports, the cross-sectional area was progressively reduced, moving away from the intake. Figure 2 further illustrates how the swirl angle was adjusted based on the specific port, with all intake ports featuring a 10-degree swirl angle, except for the two directly facing the intake duct, which are more steeply inclined to prevent creating a preferential air pathway toward the cylinder. For the exhaust side, all the ports are radially oriented, while the intake ports are inclined enhancing swirl motion. Two of the 15 ports are even more ‘swirled’ to 15deg and 20deg. The angles chosen for the inclination of the intake and exhaust ducts were based on previous studies [22].
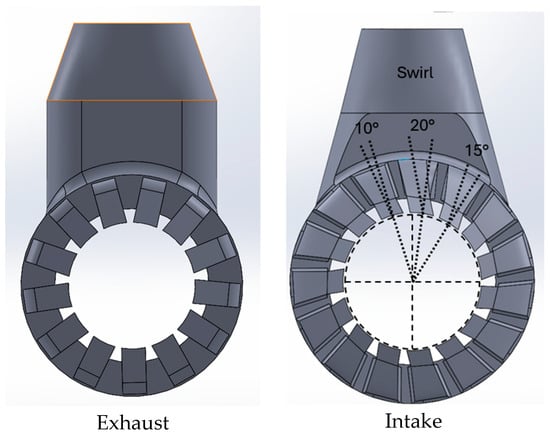
Figure 2.
Exhaust and intake (or scavenge) manifolds.
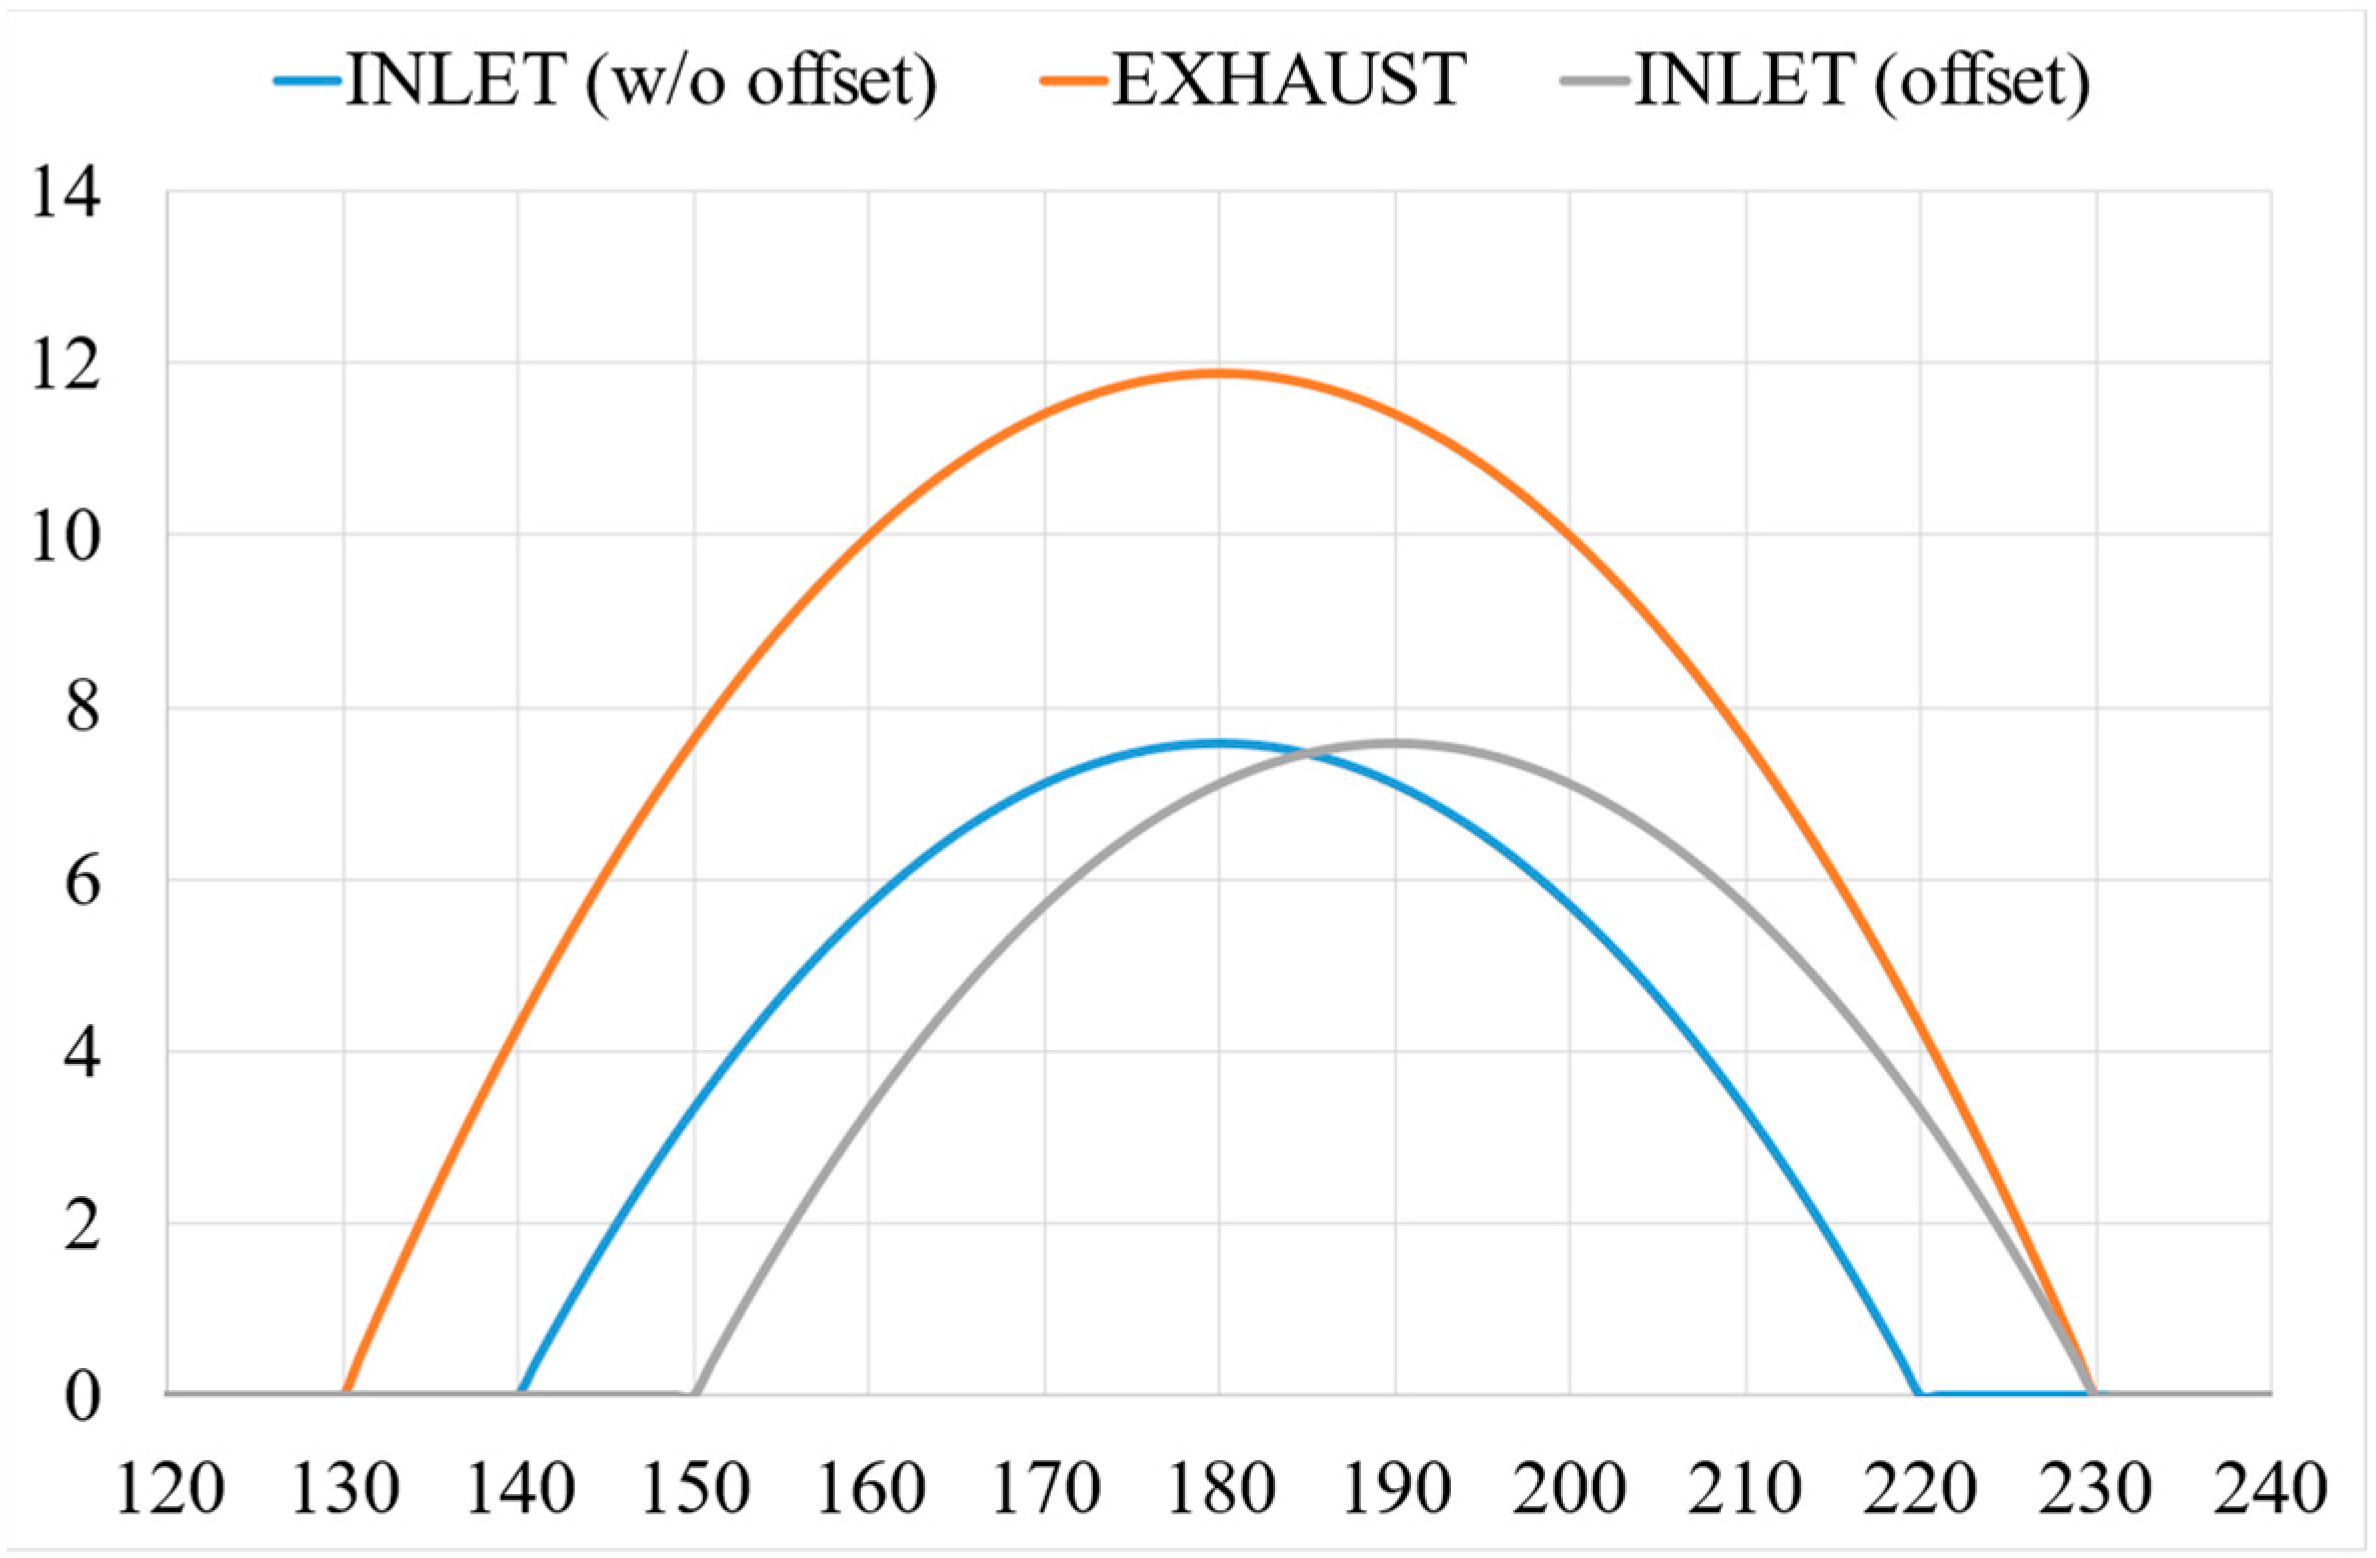
The preliminary 1D-CFD simulations suggested an offset angle of 10 degrees between the intake and exhaust shafts. It was assumed that the exhaust stroke remained symmetrical relative to the Bottom Dead Center (BDC = 180°), while the scavenge piston was delayed, so that it closed the ports simultaneously with the exhaust (Figure 3).
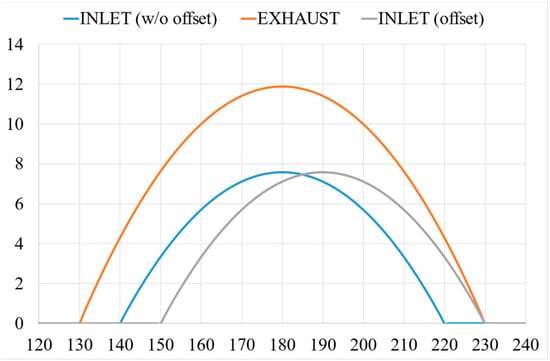
Figure 3.
Opening/closing law in case of a crankshaft shift.
For the 3D-CFD simulations, a hexahedral mesh was utilized, featuring extrusions of 50 mm at the inlet and 60 mm at the outlet. The largest cell size used in the mesh was 2.5 mm, with localized refinements at the intake and exhaust ports, reducing the cell size to a maximum of 0.625 mm in these areas. Additional mesh refinement was applied near the cylinder ends, where the maximum cell size was set to 1.25 mm, extending up to 15 mm from the piston face opposite the transfer ports and up to 18 mm from the piston facing the exhaust ports. This targeted refinement was specifically applied during the scavenging phase of the cycle, from 130 to 230 degrees.
The wall layer comprised four layers in a geometric progression:
- The height of the first cell was 0.01875 mm;
- The growth rate was 2, resulting in a total thickness of 0.28125 mm.
These parameters were chosen to follow a low Reynolds number approach (i.e., Y+ < 5).
In general, the authors followed the best practice suggested by the software developer (AVL). It should be noted that FIRE-M included an automatic function for moving the mesh, as well as a detailed check of the mesh quality.
The maximum number of cells was 2,393,714 when the exhaust piston was at BDC.
3.1. Scavenging Analysis
This section describes the setup of the 3D-CFD analyses, performed in order to characterize the scavenging process. All simulations were conducted at 3000 rpm, beginning at 40 crank angle degrees before the opening of the exhaust ports (90 deg) and concluding toward the end of the compression stroke (330 deg), according to the following specifications:
- Numerical Simulation Model: Reynolds-Averaged Navier–Stokes (RANS);
- Turbulence Model: k-zeta-f;
- Boundary Layer Approach: Hybrid;
- Boundary Conditions (BCs): Crank angle-dependent mass flow inlet and static pressure outlet, derived from the Gas Turbine Performance (GTP) model;
- Cylinder and Exhaust Initialization: Filled with all burnt gases to simulate post-combustion conditions;
- Intake Initialization: Contained air along with a passive scalar that would be used for the characterization of the scavenging process.
This configuration permitted an in-depth evaluation of the scavenging process, assessing the engine efficiency in expelling the exhaust gases and introducing fresh air under dynamic operating conditions.
Figure 4 plots the instantaneous amount of mass within the cylinder. A small difference can be observed between the final values at EPO and EPC (1052.6 vs. 1065.4 mg, a variation of 1.2%). This check was fundamental to ensure the simulation accuracy; large discrepancies in mass between the start and end of the simulation would indicate incorrect initial or boundary conditions. The scavenging simulation facilitated an analysis of the engine characteristic efficiencies, which are detailed in Figure 5:
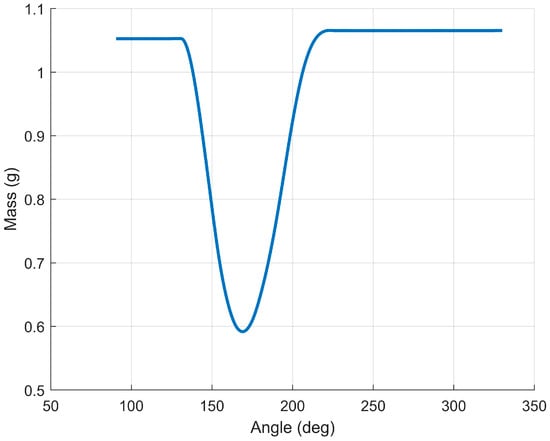
Figure 4.
In-cylinder mass evolution during scavenging.
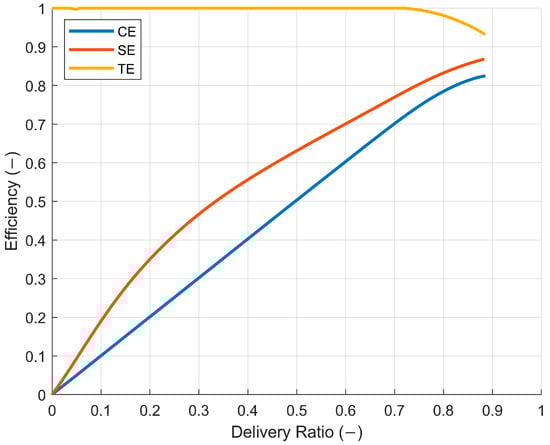
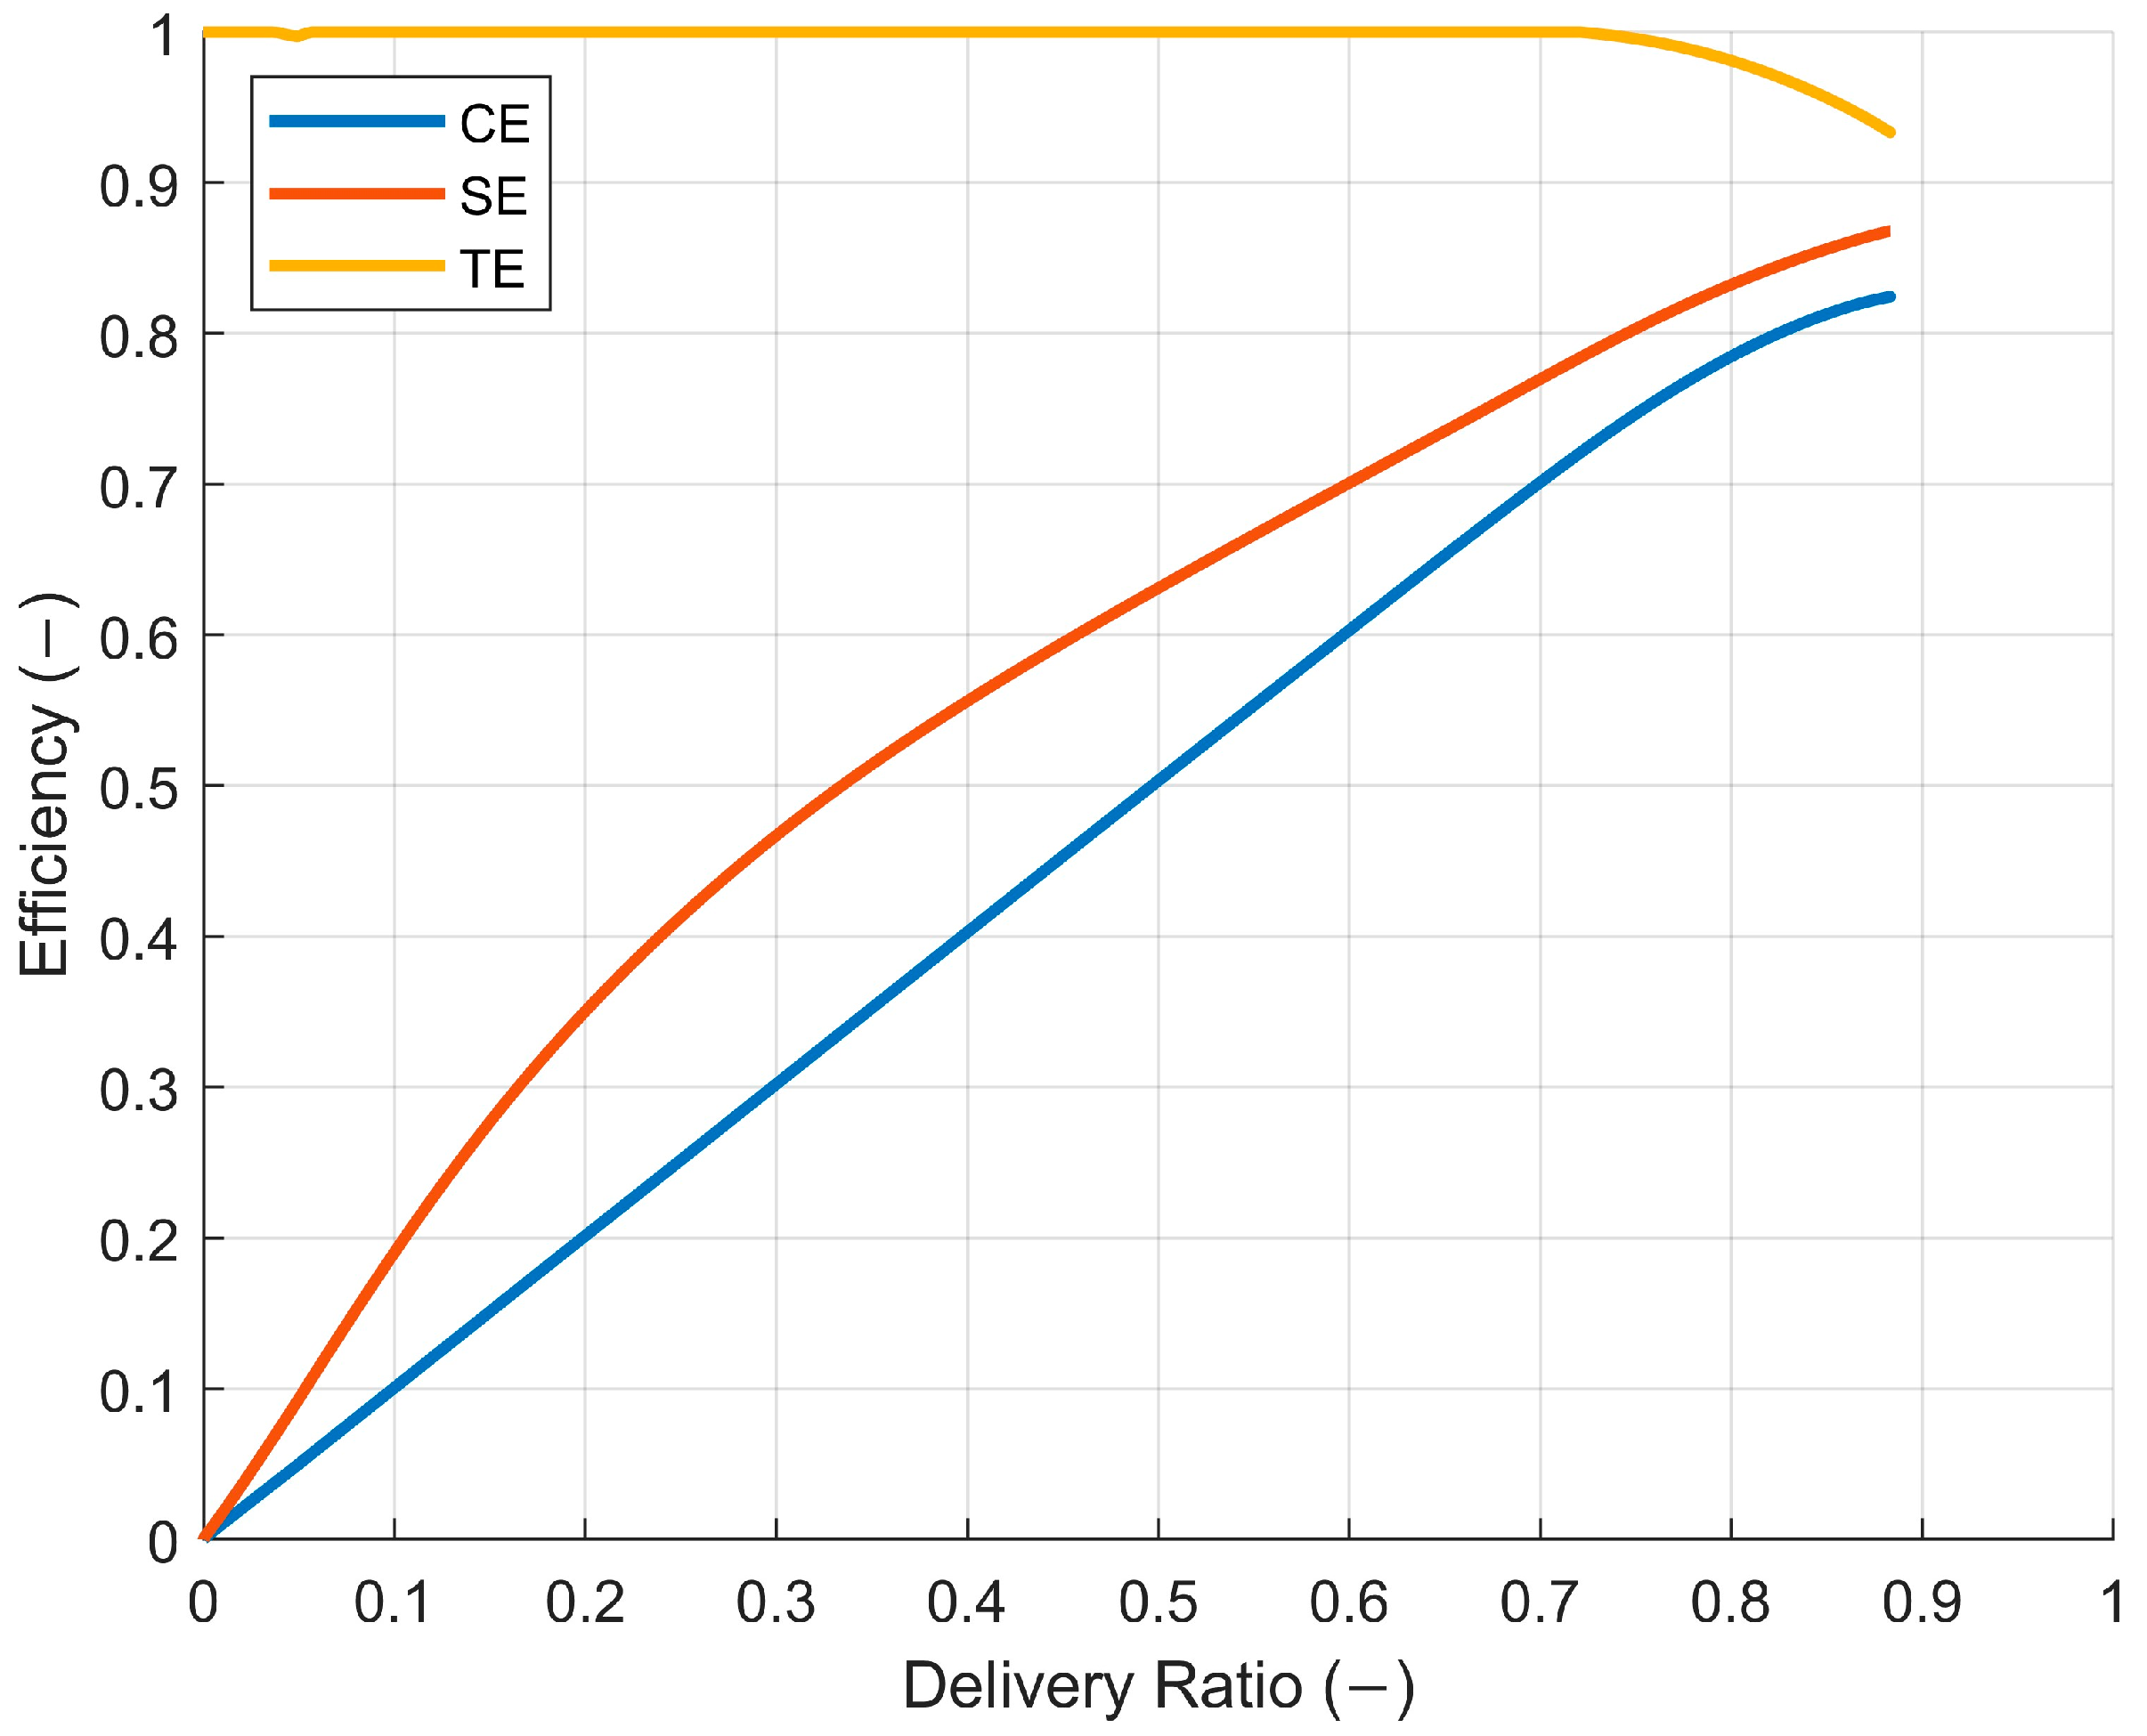
Figure 5.
Scavenging simulation efficiency parameters.
- Delivery Ratio (DR): the ratio of the mass of fresh charge entering a cylinder to the reference mass, which is calculated as the product of reference air density and cylinder displacement;
- Charging Efficiency (CE): the mass of the fresh charge retained within a cylinder compared to the reference mass;
- Scavenging Efficiency (SE): the ratio of the mass of fresh charge retained in a cylinder to the total mass present within the cylinder;
- Trapping Efficiency (TE): the ratio of the mass of fresh charge retained in a cylinder to the mass of the delivered charge.
The graph in Figure 5 illustrates the CE, SE, and TE as functions of the delivery ratio, highlighting how the TE remained nearly 1 for most of the DR, then dropped to nearly 0.9 at the end of the scavenging process. This confirmed that the proposed cylinder design is an efficient solution for achieving levels of fresh charge trapping comparable to a 4-stroke engine, despite being a 2-stroke engine.
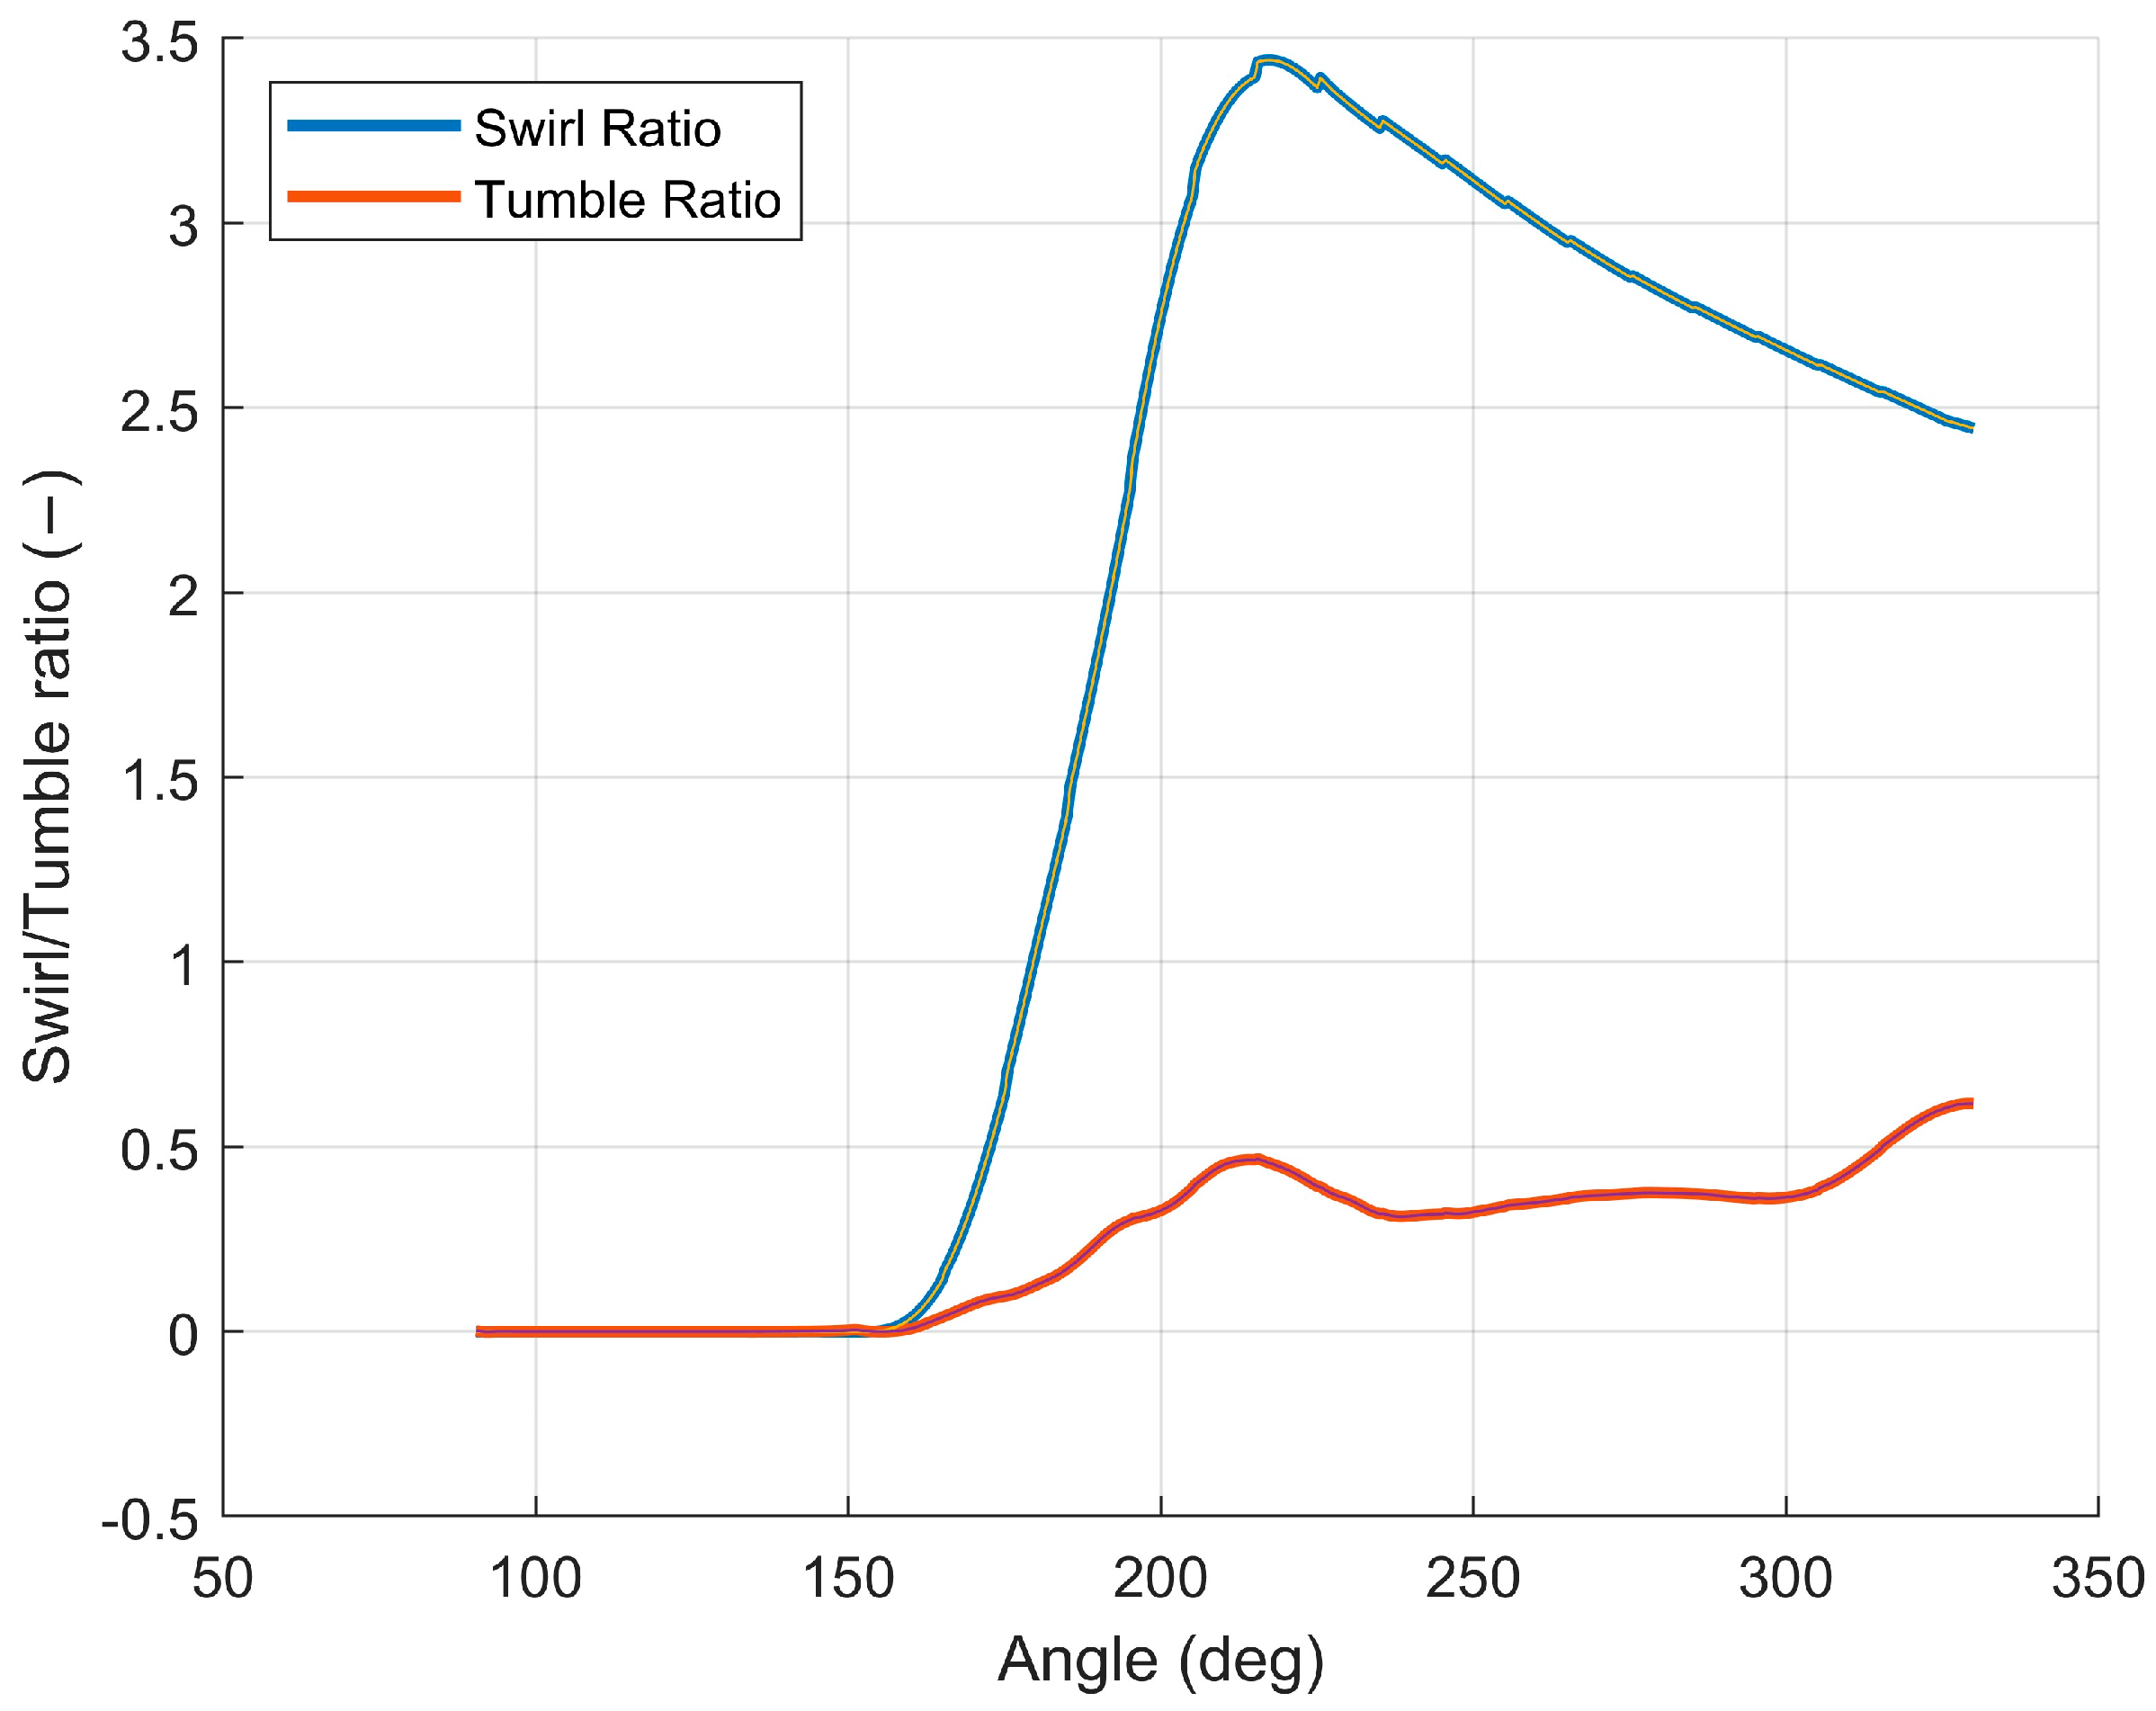
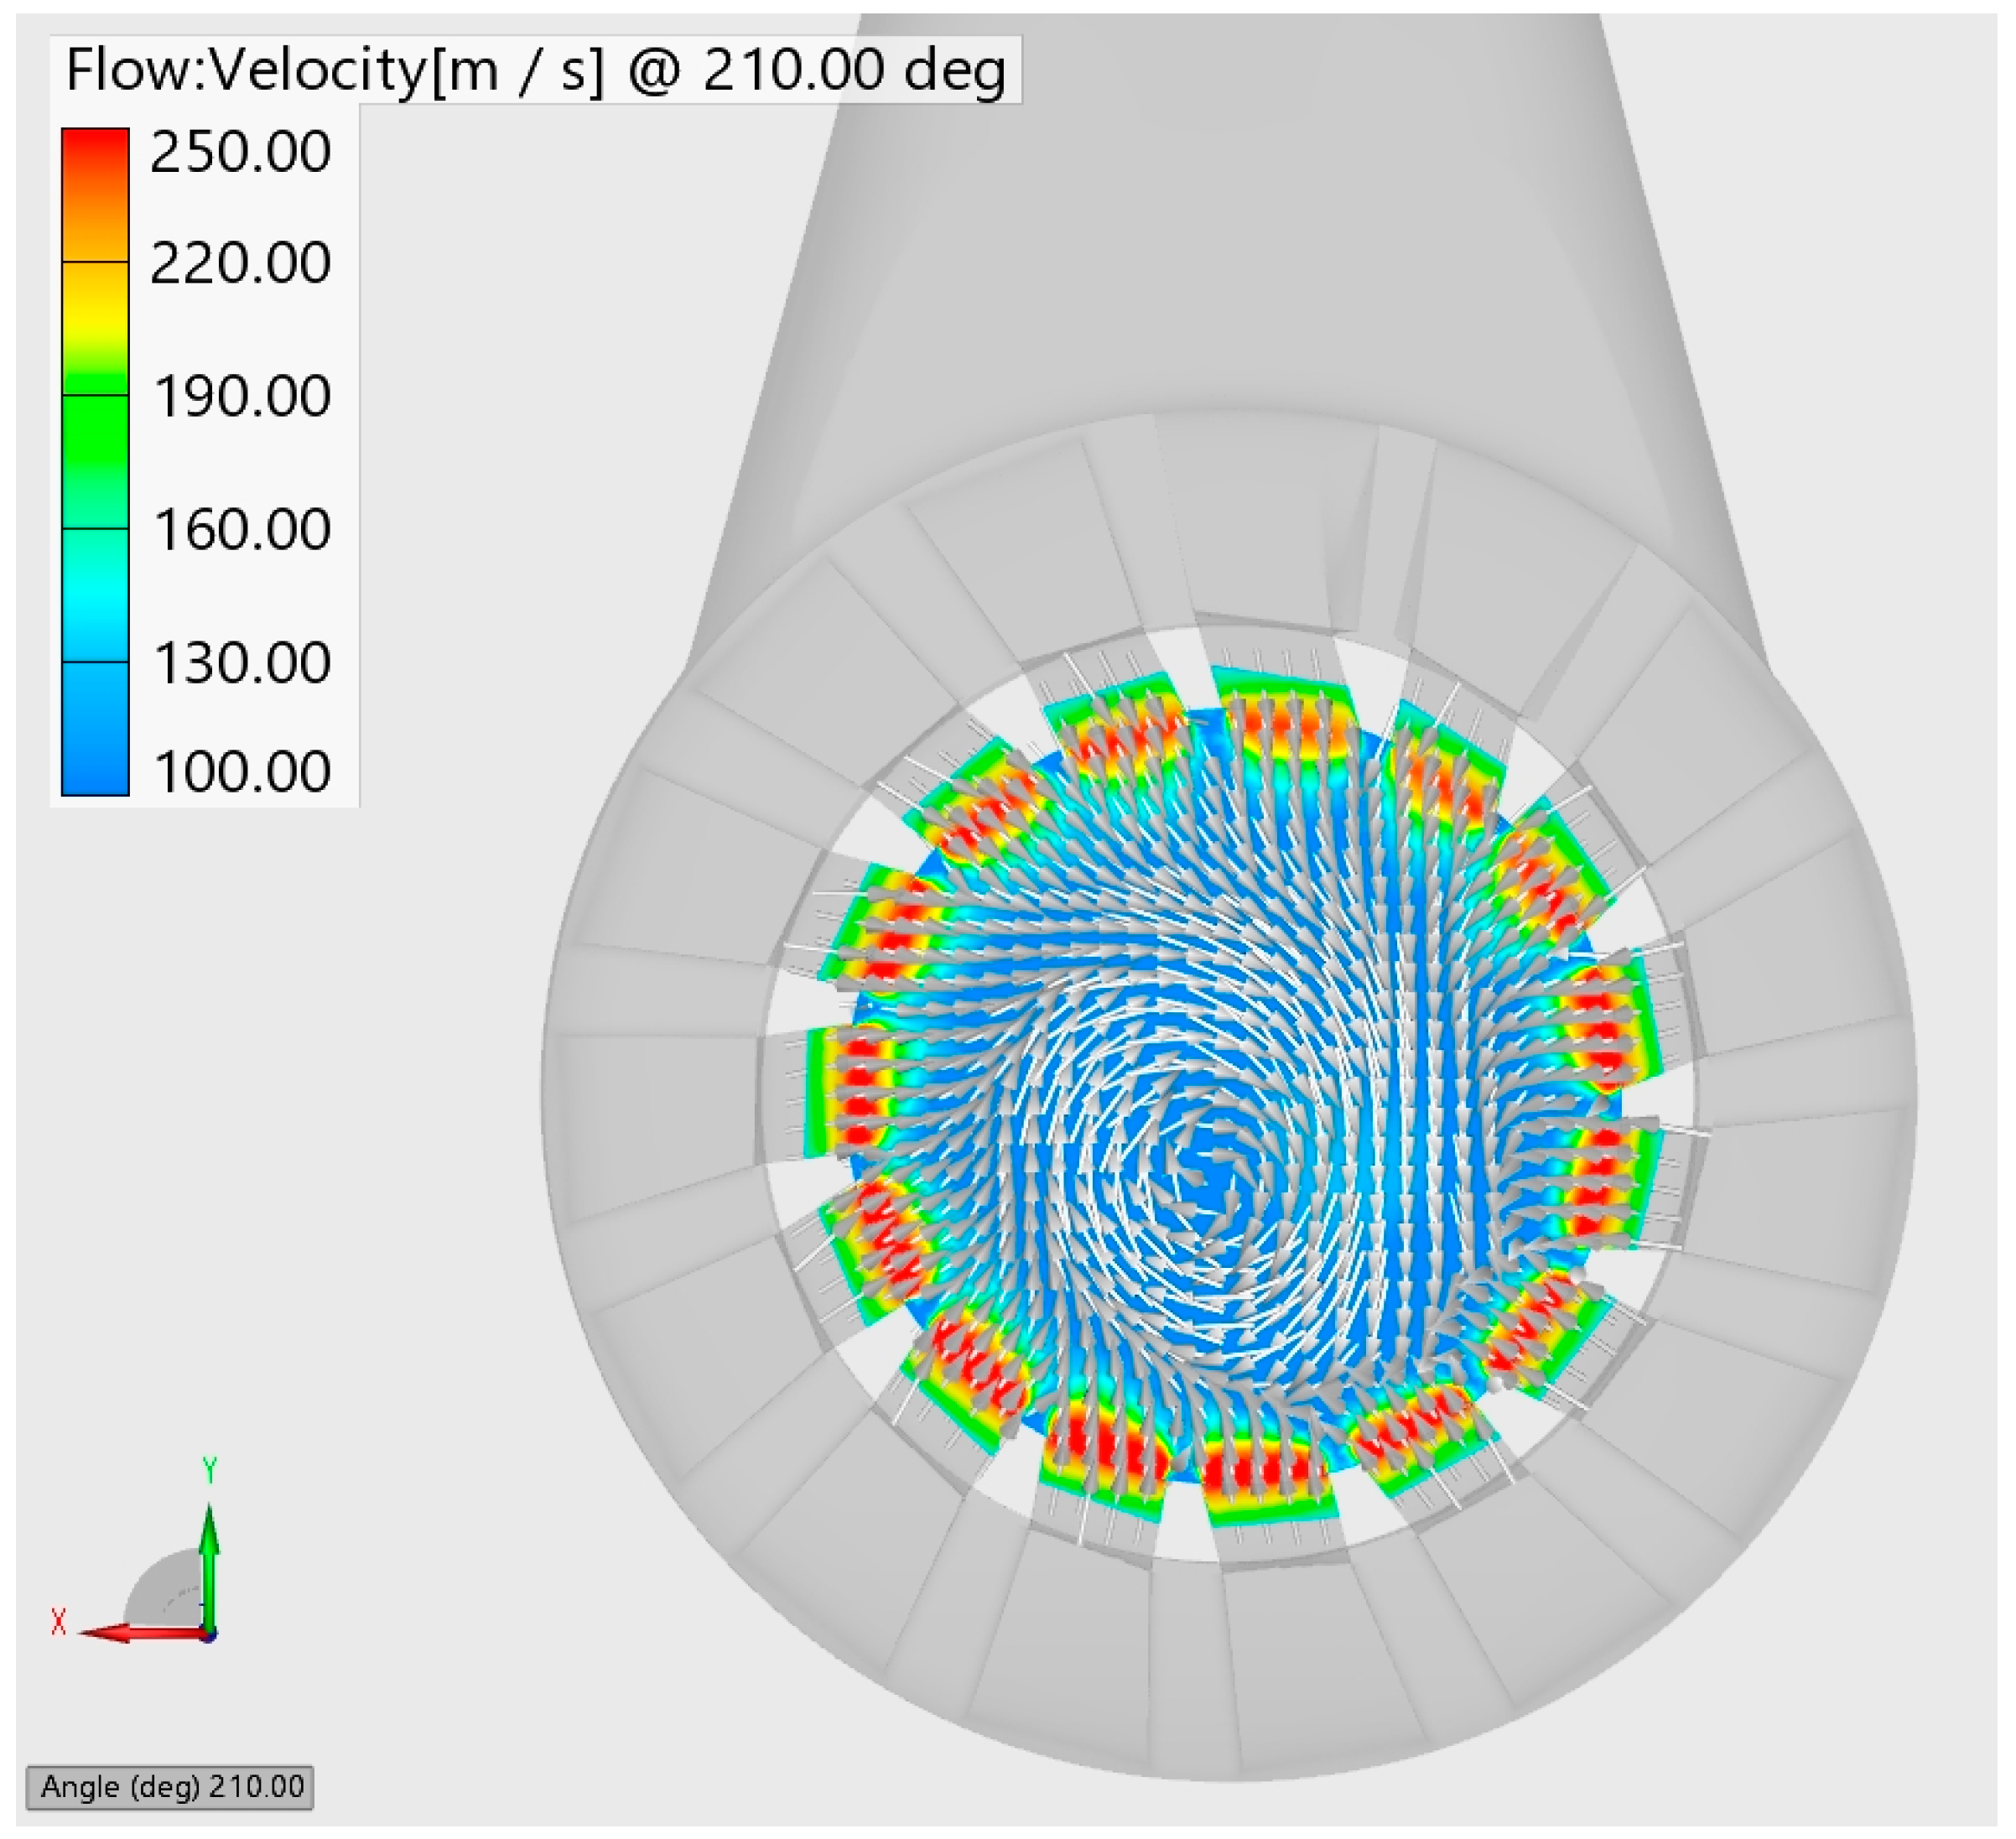
Figure 6 and Figure 7 illustrate the evolution of the swirl vortex during the scavenging stroke: the swirl ratio peaked at around 210 degrees at 3.4, with a slight offset from the cylinder axis by a few millimeters. It is also important to note the formation of a light tumble vortex, indicating that the transfer or exhaust ports were not uniformly fed.

Figure 6.
Scavenging simulation swirl and tumble development.
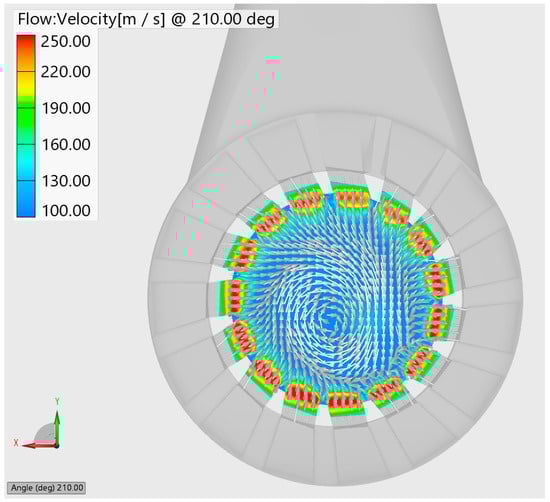
Figure 7.
Swirl vortex @210 deg aTDC (exhaust piston).
3.2. Calibration of the 1D-CFD Model
The 1D-CFD model of the engine was built using GT-Power software v2024 build 2.01. It represents, in a lumped fashion (zero or quasi-dimensional approach), the geometry of the cylinder and the ports; conversely, a 1D schematization was employed for the gas dynamic analysis of the whole intake and exhaust systems (pipes, manifolds, heat exchangers, valves, et cetera). The calibration/validation of a whole engine model generally requires experimental data from a physical prototype tested at the dynamometer bench. Since these data were not yet available, the calibration was focused on the cylinder model, referring to the 3D-CFD results of the scavenging simulation described in the previous section.
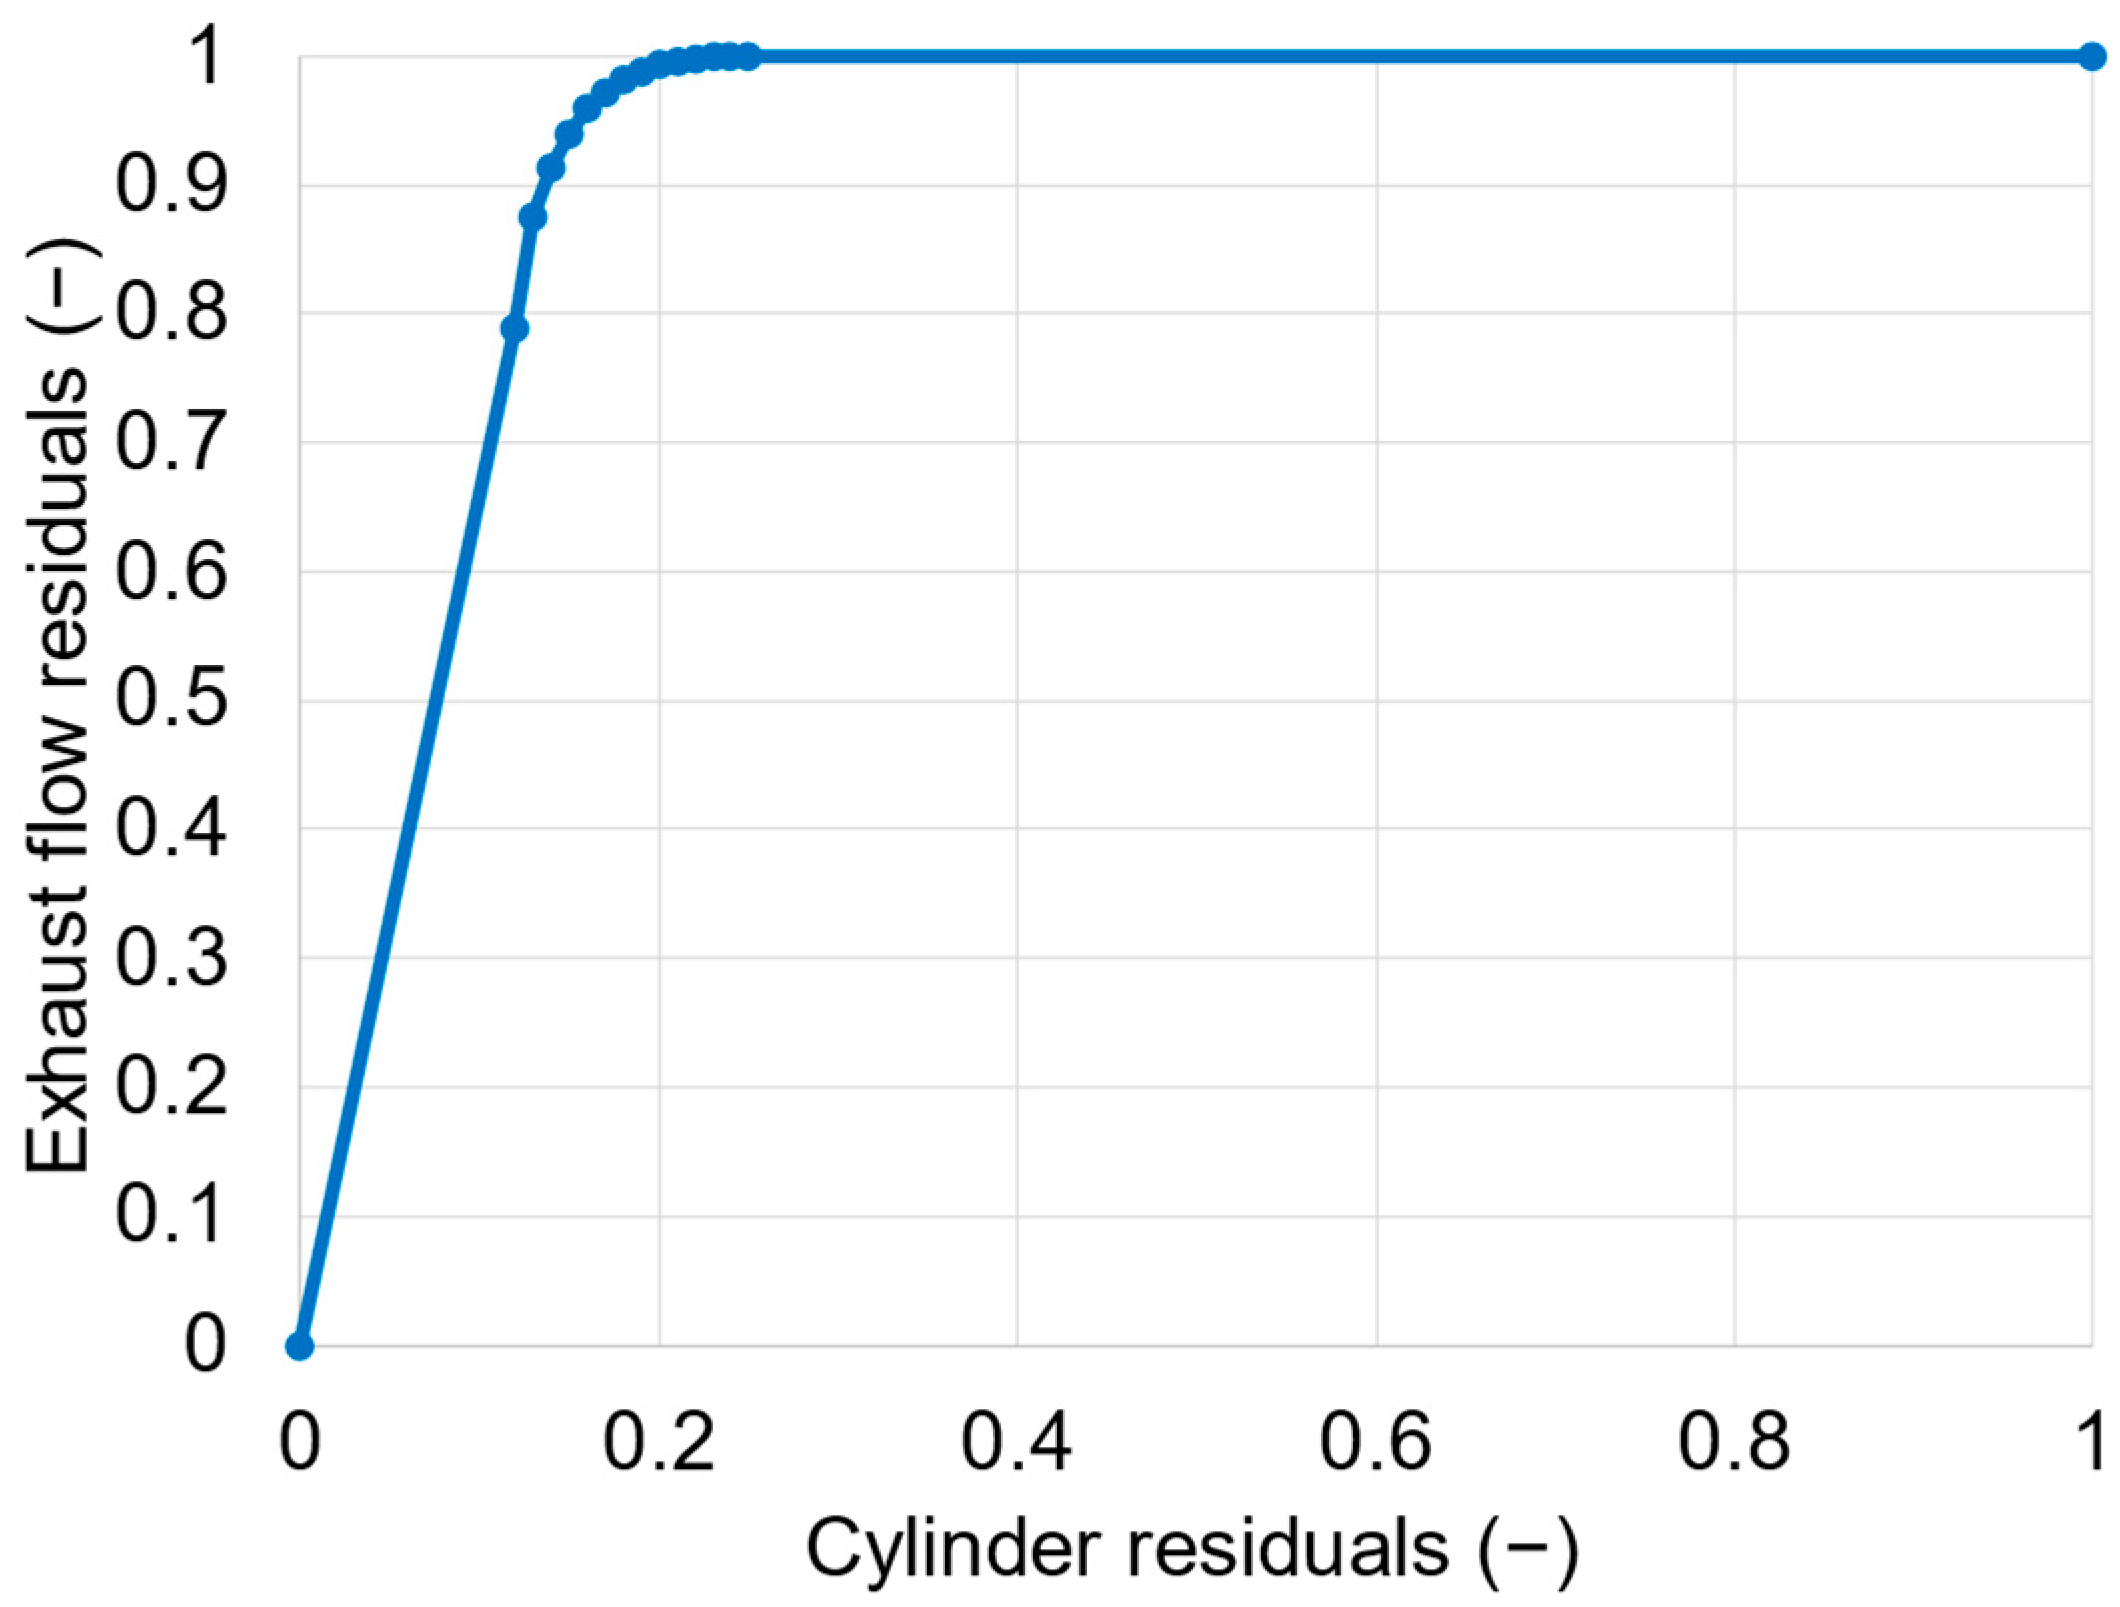
First of all, the scavenging curve calculated by the 3D simulation was entered as an input in the 1D software. This curve is shown in Figure 8, where the X-axis represents the amount of exhaust gas in the cylinder, and the Y-axis shows the amount of combustion residuals in the exhaust flow. The graph should be read from right to left: at the start of the scavenging process (opening of the inlet ports), the exhaust flow did not contain fresh charge, therefore the fraction of residuals in the exhaust was 1. As the scavenging proceeded, the curve corresponds to the ideal model of “Perfect displacement”, where no fresh charge was lost at the exhaust until the whole cylinder was filled with air. Toward the end of the scavenging process, the fresh charge started to slip in the exhaust flow; the later this occurs, the more effective is the scavenging.
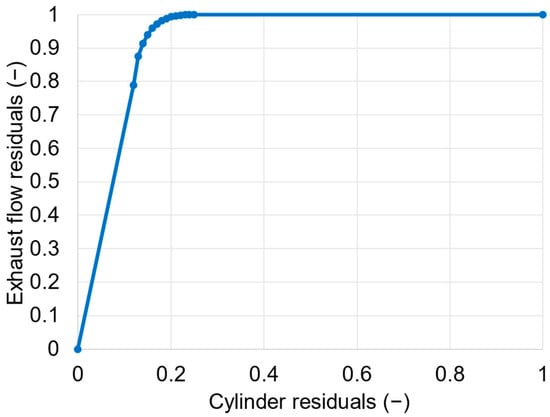
Figure 8.
Scavenging curve for the 1D CFD analysis.
Other parameters of the 1D model that could be calibrated by comparison with the 3D-CFD results were the discharge coefficients of the scavenge and exhaust ports. This calibration should have provided a good agreement between the 1D and 3D results in terms of instantaneous mass flow rates. Figure 9 shows this comparison, where the dashed lines correspond to the 3D values, while the solid lines represent the 1D results. The color red was used to represent the exhaust (EXH) ports and blue for the transfer/scavenge/inlet (referred to as TRA) ports. The alignment was excellent, both in terms of instantaneous and average values. The maximum difference in terms of total delivered mass was less than 4% (1065 mg of air predicted by FIRE-M, 1105 calculated by GT-Power).
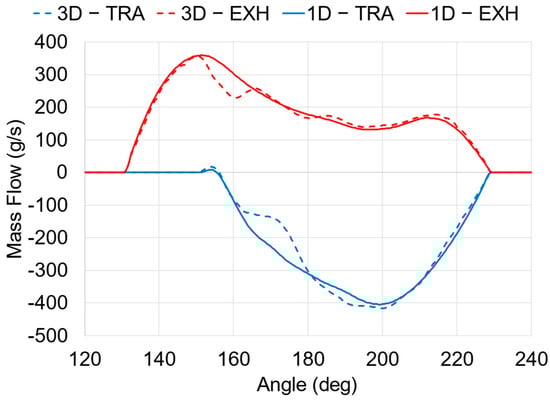
Figure 9.
Comparison between the 1D and 3D analyses in terms of instantaneous mass flow rates through the exhaust (EXH) and transfer/scavenge (TRA) ports.
Figure 10 presents a pictorial view of the scavenging process, considering different crank angles (from 150 degrees after exhaust TDC to 260 degrees, by steps of 10 degrees). The quantity plotted on a plane orthogonal to the X-axis is the mass fraction of fresh charge. It is important to note that the amount of fresh charge slipping through the exhaust (upper volume) was very small, and it occurred only after 220 degrees, near the closing of the exhaust ports.
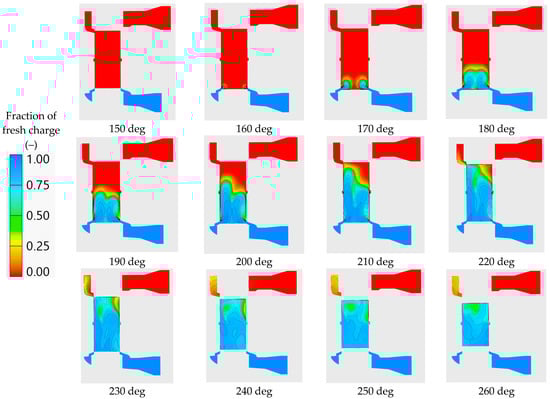
Figure 10.
Concentrations of fresh charges plotted on a plane orthogonal to the X-axis.
4. Injection Optimization
For the injection simulations, a GI25-H injector manufactured by LandiRenzo was selected. The main characteristics of this injector are listed below as the following:
- Nominal working pressure: 450 kPa
- Pressure range: 350–800 kPa
- Temperature range: −40–120 °C
- Opening time: 1.8 ms
- Closing time: 1.4 ms
- H2 static flow rate @ 450 kPa: 2.19 g/s
Setup of the CFD-3D Simulation
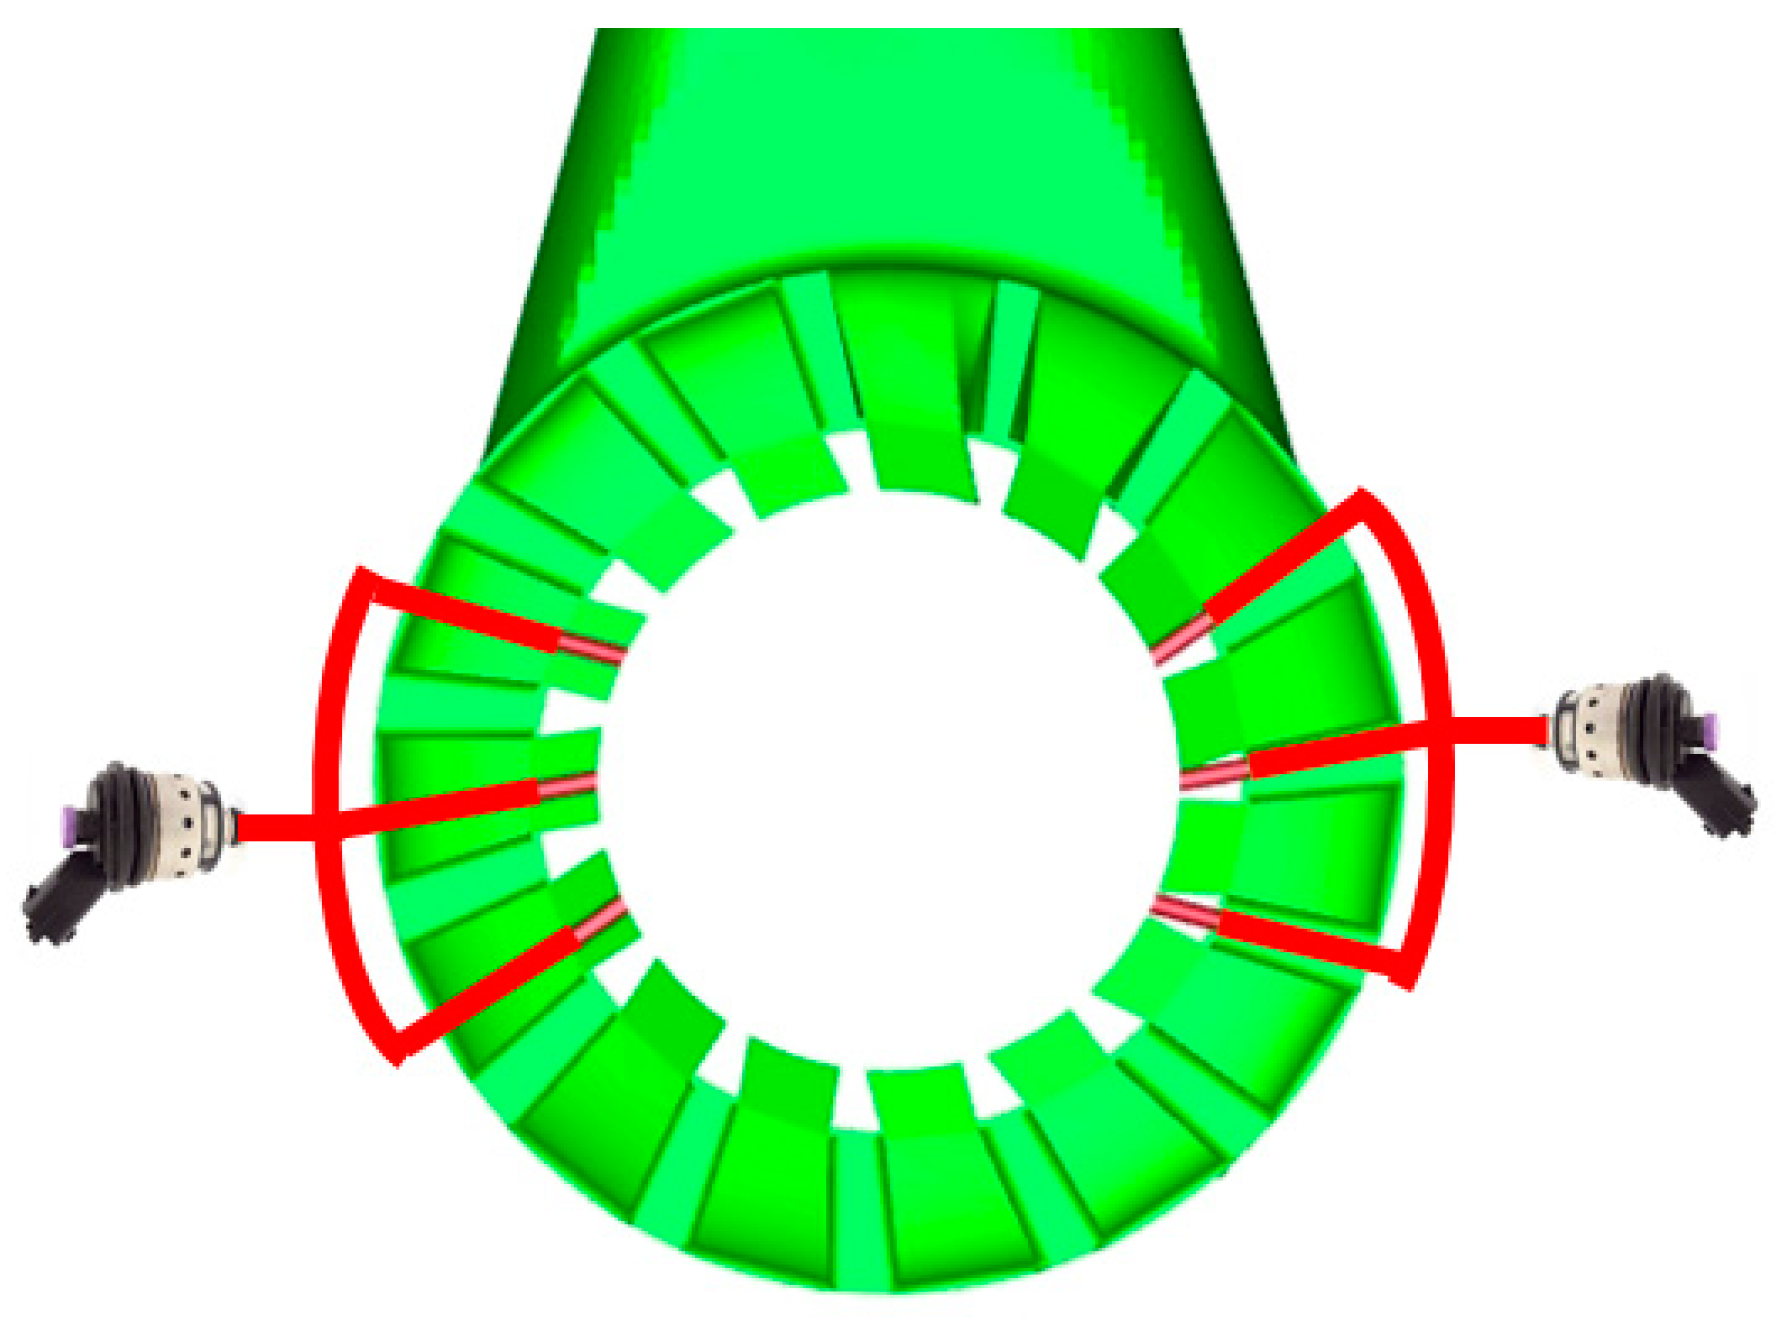
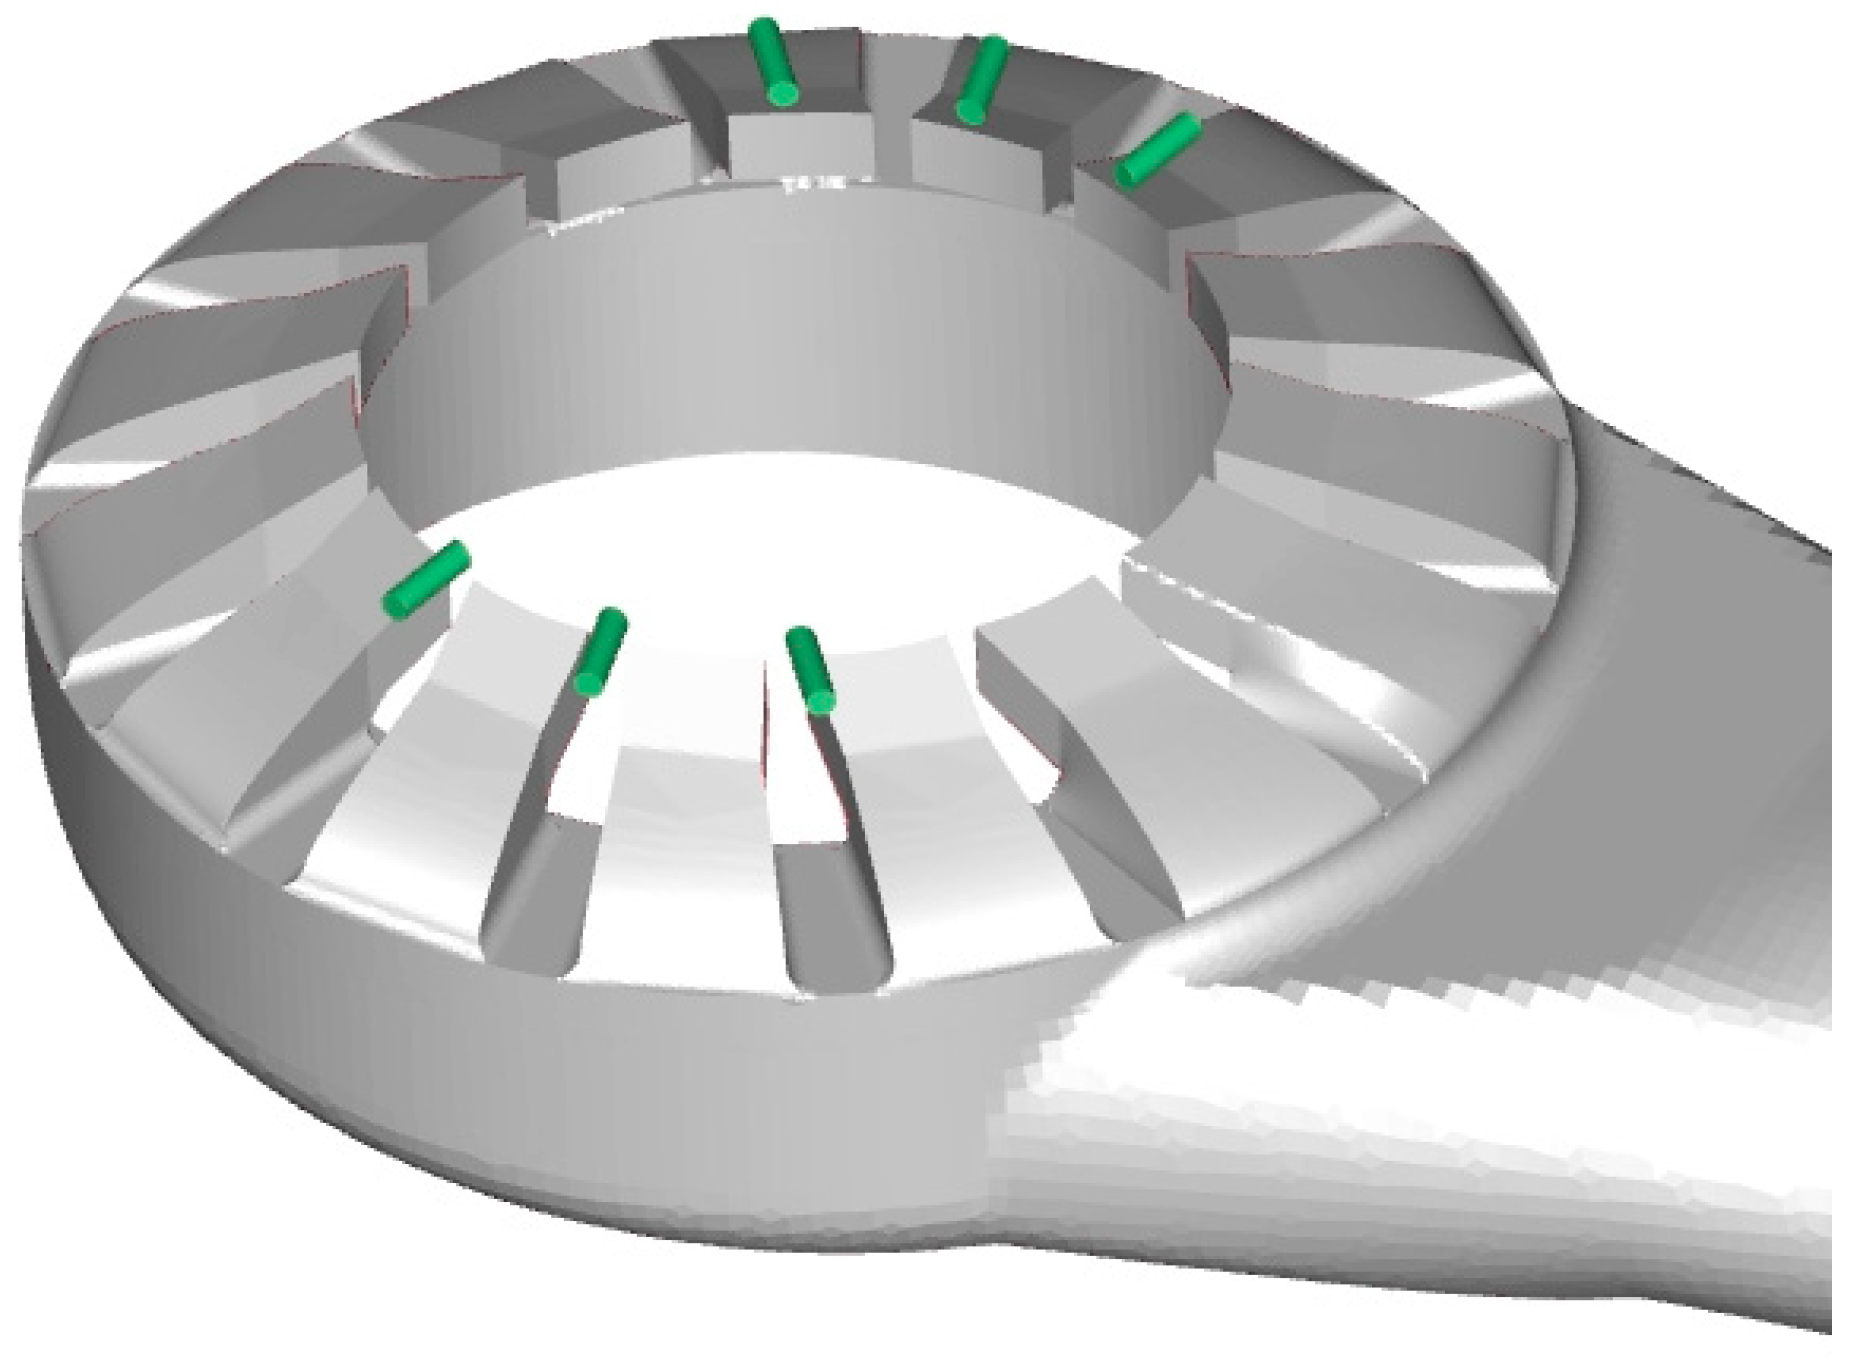
For the numerical simulations, the low-pressure injectors were represented as small ducts that opened onto the cylinder bore. As illustrated in Figure 11, it was hypothesized that two injectors placed on the sides of the cylinder would each feed three ducts positioned above the transfer ports and angled with the same swirl angle as the ports. Figure 12 displays these six ducts in green. The ducts had a diameter of 3 mm and were located 0.5 mm above the scavenge ports. This position was calculated in order to guarantee that the opening of the injection ducts always occurred after the opening of the exhaust ports; this condition prevented the overheating of the injector tip.
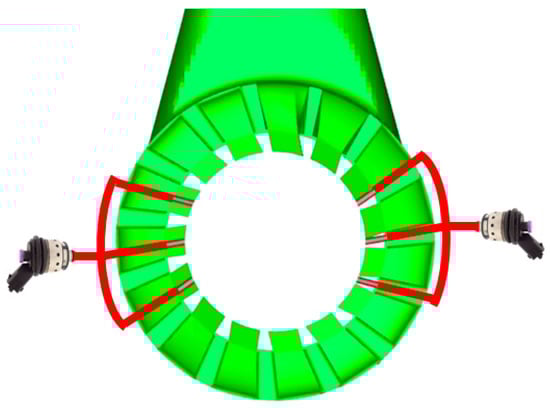
Figure 11.
Injection system layout.

Figure 12.
Injector position overview.
Figure 13 presents a cross-section of the intake volume mesh with the injector. Notice how the toroid shape was smoothly contoured to facilitate the flow’s entry into the cylinder. Additionally, a zoomed view of the injector mesh is provided to showcase its features: in this instance, the mesh was polyhedral with a size of 0.3 mm at the interface zone with the cylinder, while it remained hexahedral, aligned with the flow direction throughout the stabilization area, with a size of 0.2 mm. The boundary through which the hydrogen entered was on the extreme left side. This boundary functioned as a mass flow receiver during the injection phase and was changed to a wall boundary when injection was not active.
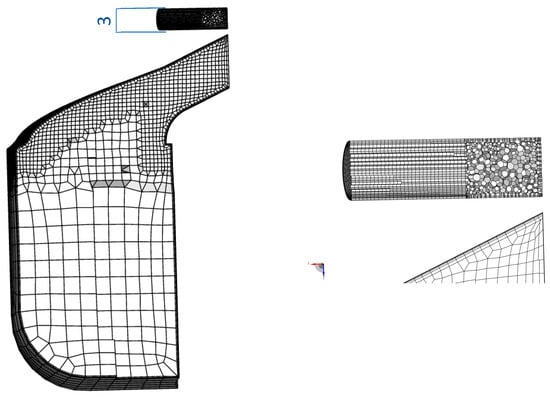
Figure 13.
Plane cut of the intake volume (left) with a zoomed in view of the injector mesh (right).
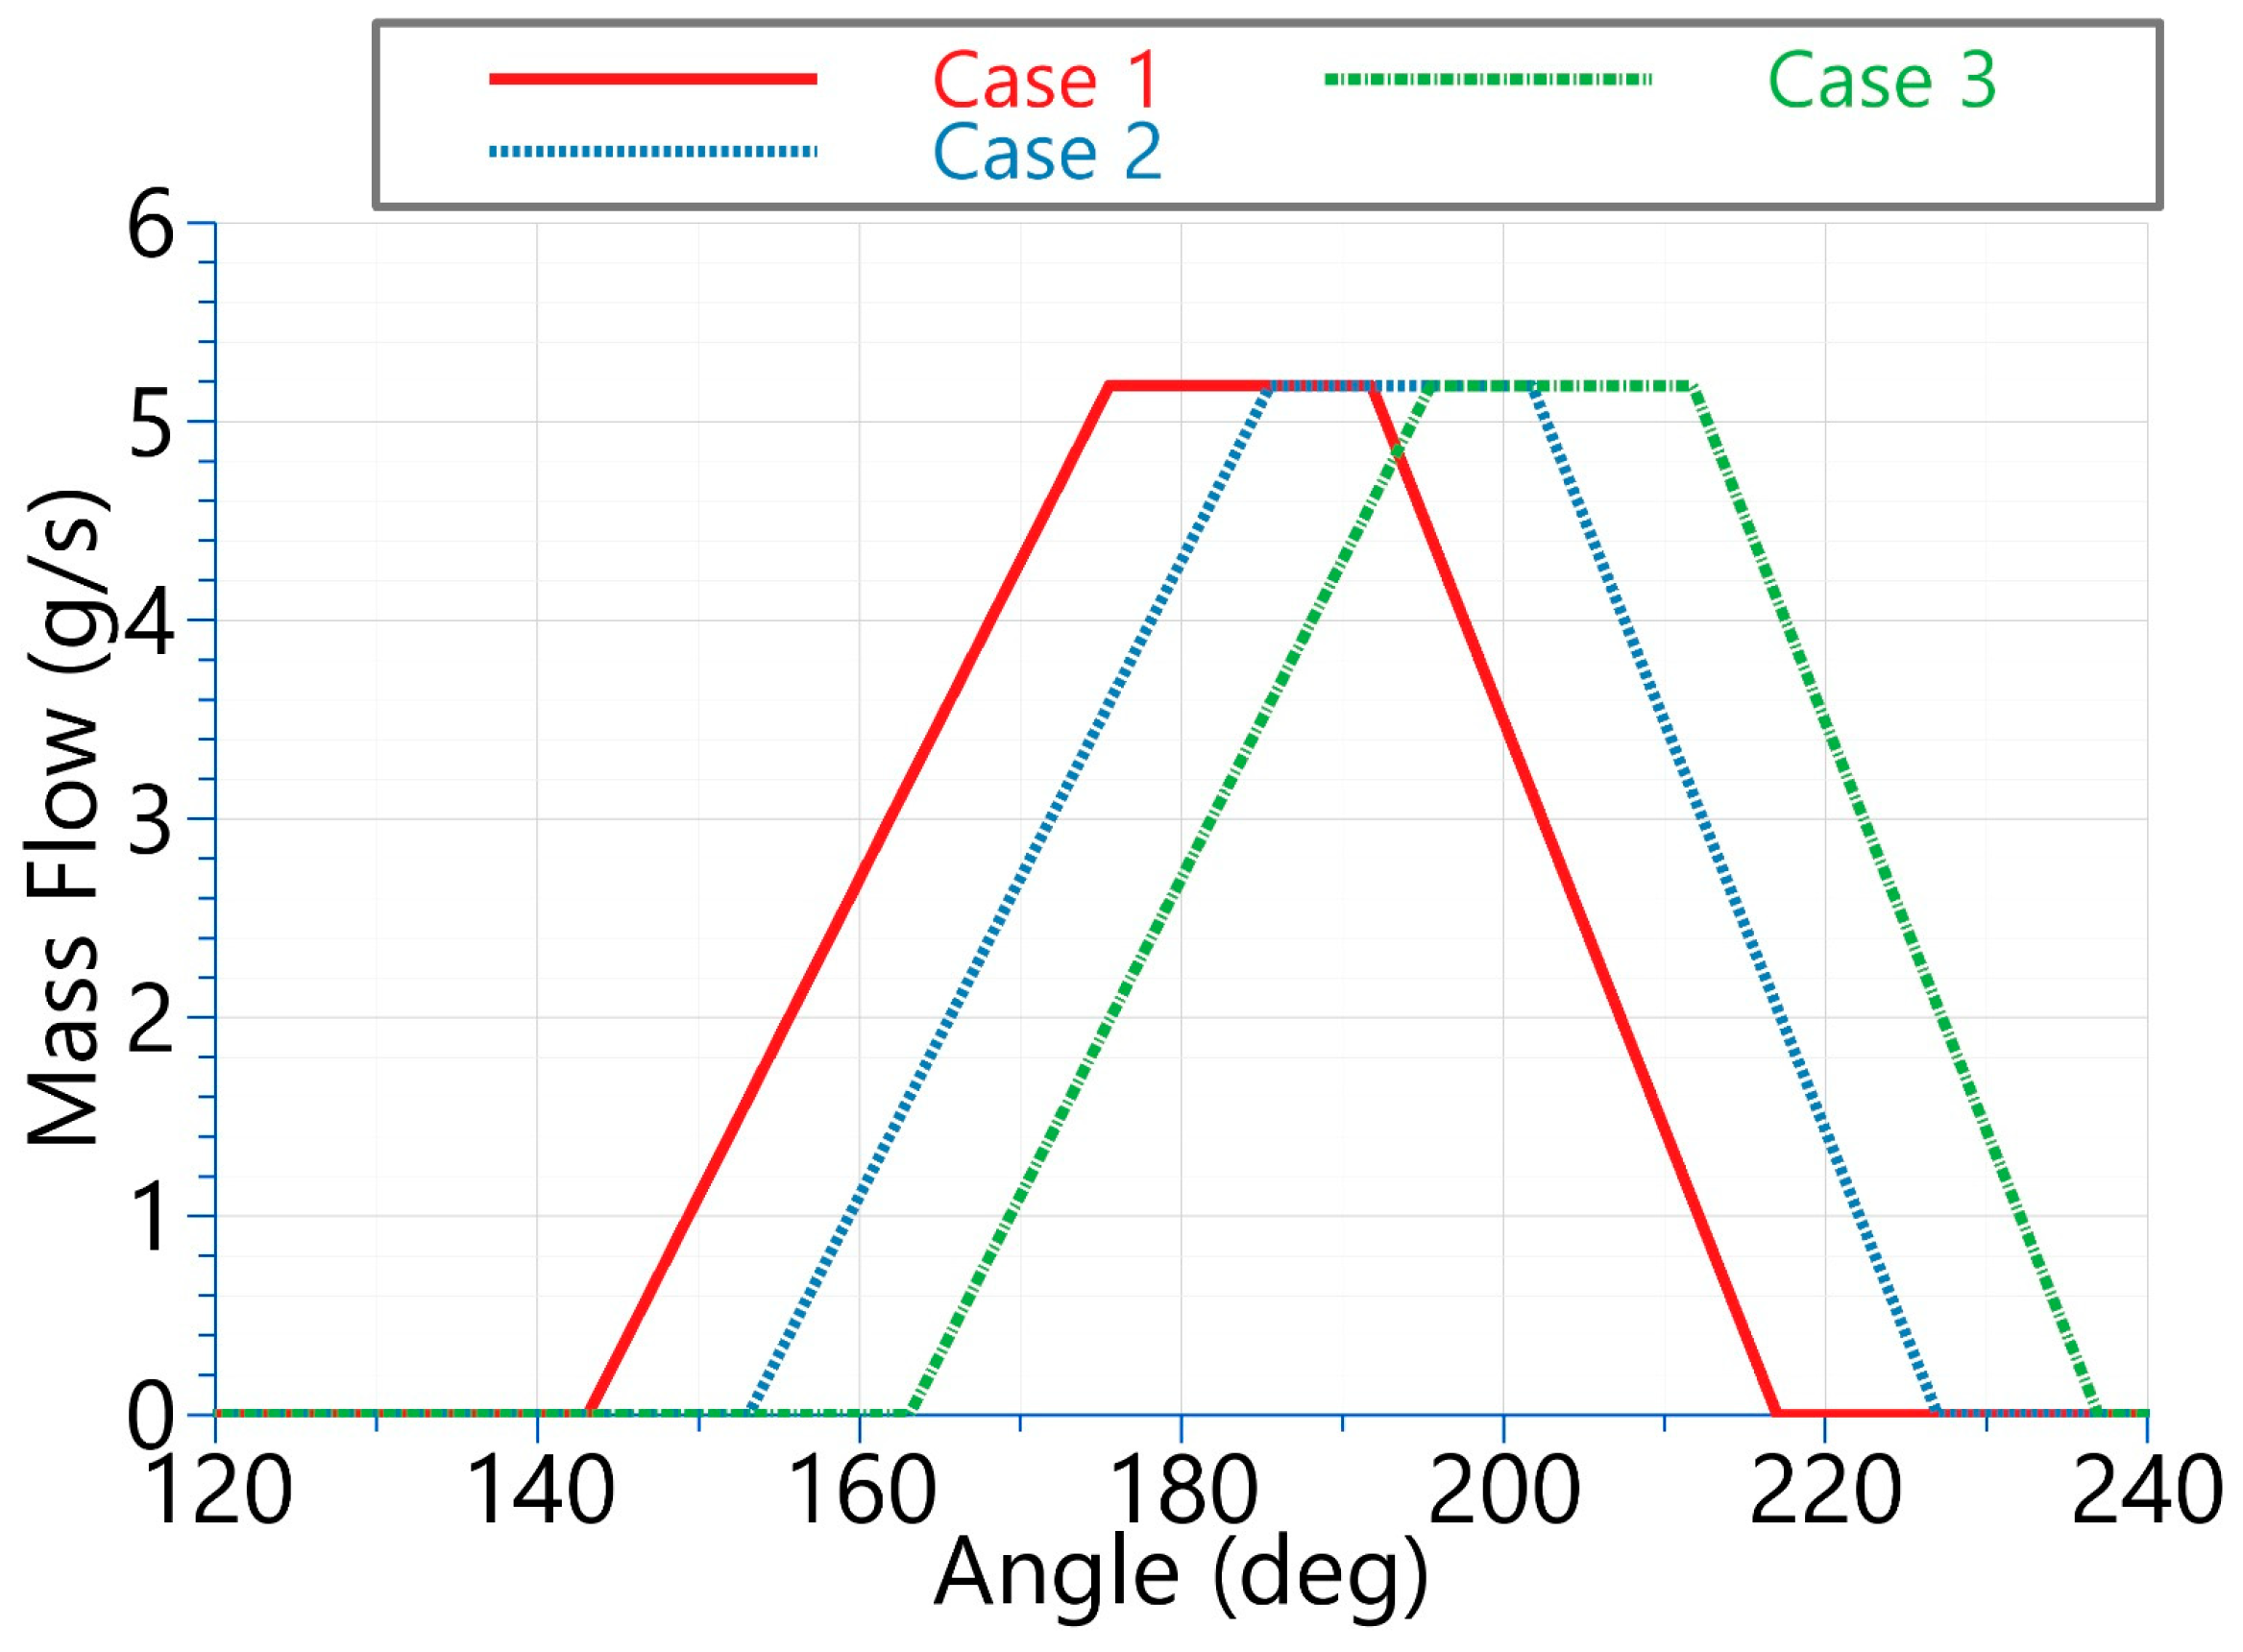
As specified in the injector’s datasheet, the injector operated with a nominal pressure of 4.5 bar, with the injector opening and closing times being 1.8 ms and 1.4 ms, respectively. The mass to be injected, derived from the GT-Power model, was approximately 11 mg to achieve a target internal cylinder equivalence ratio of 0.4. At 3000 rpm, the injection duration under these conditions was 74 degrees. A sweep of the start-of injection (SOI) angle was conducted, as shown in Figure 14, to analyze potential trends regarding fuel trapping and charge homogeneity at the end of compression. An end-of-injection (EOI) angle of 237 degrees after Top Dead Center (aTDC) the latest possible moment that the injector duct could be closed by piston movement was considered, thus serving as the boundary limit within which the injection had to be completed. Retrospectively, two other cases (Case 1 and Case 2) were selected, spaced by 10 degrees, respectively. It is important to note that the TPO was at 150 degrees aTDC, also making Case 1 a lower limit for the SOI.
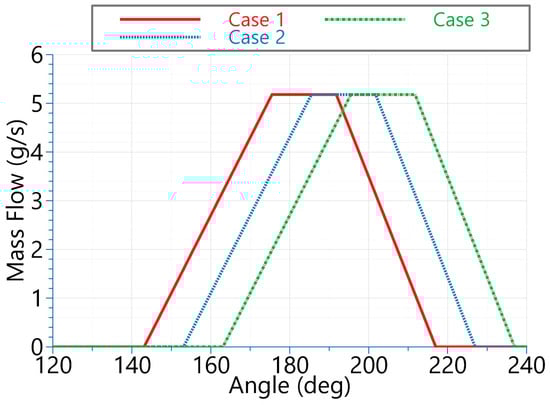
Figure 14.
Injection sweeps every 10 deg.
The simulation was run with the same settings as the scavenging simulation, with the exception of the BDC settings, which were updated based on the new 1D model, and the addition of hydrogen injection.
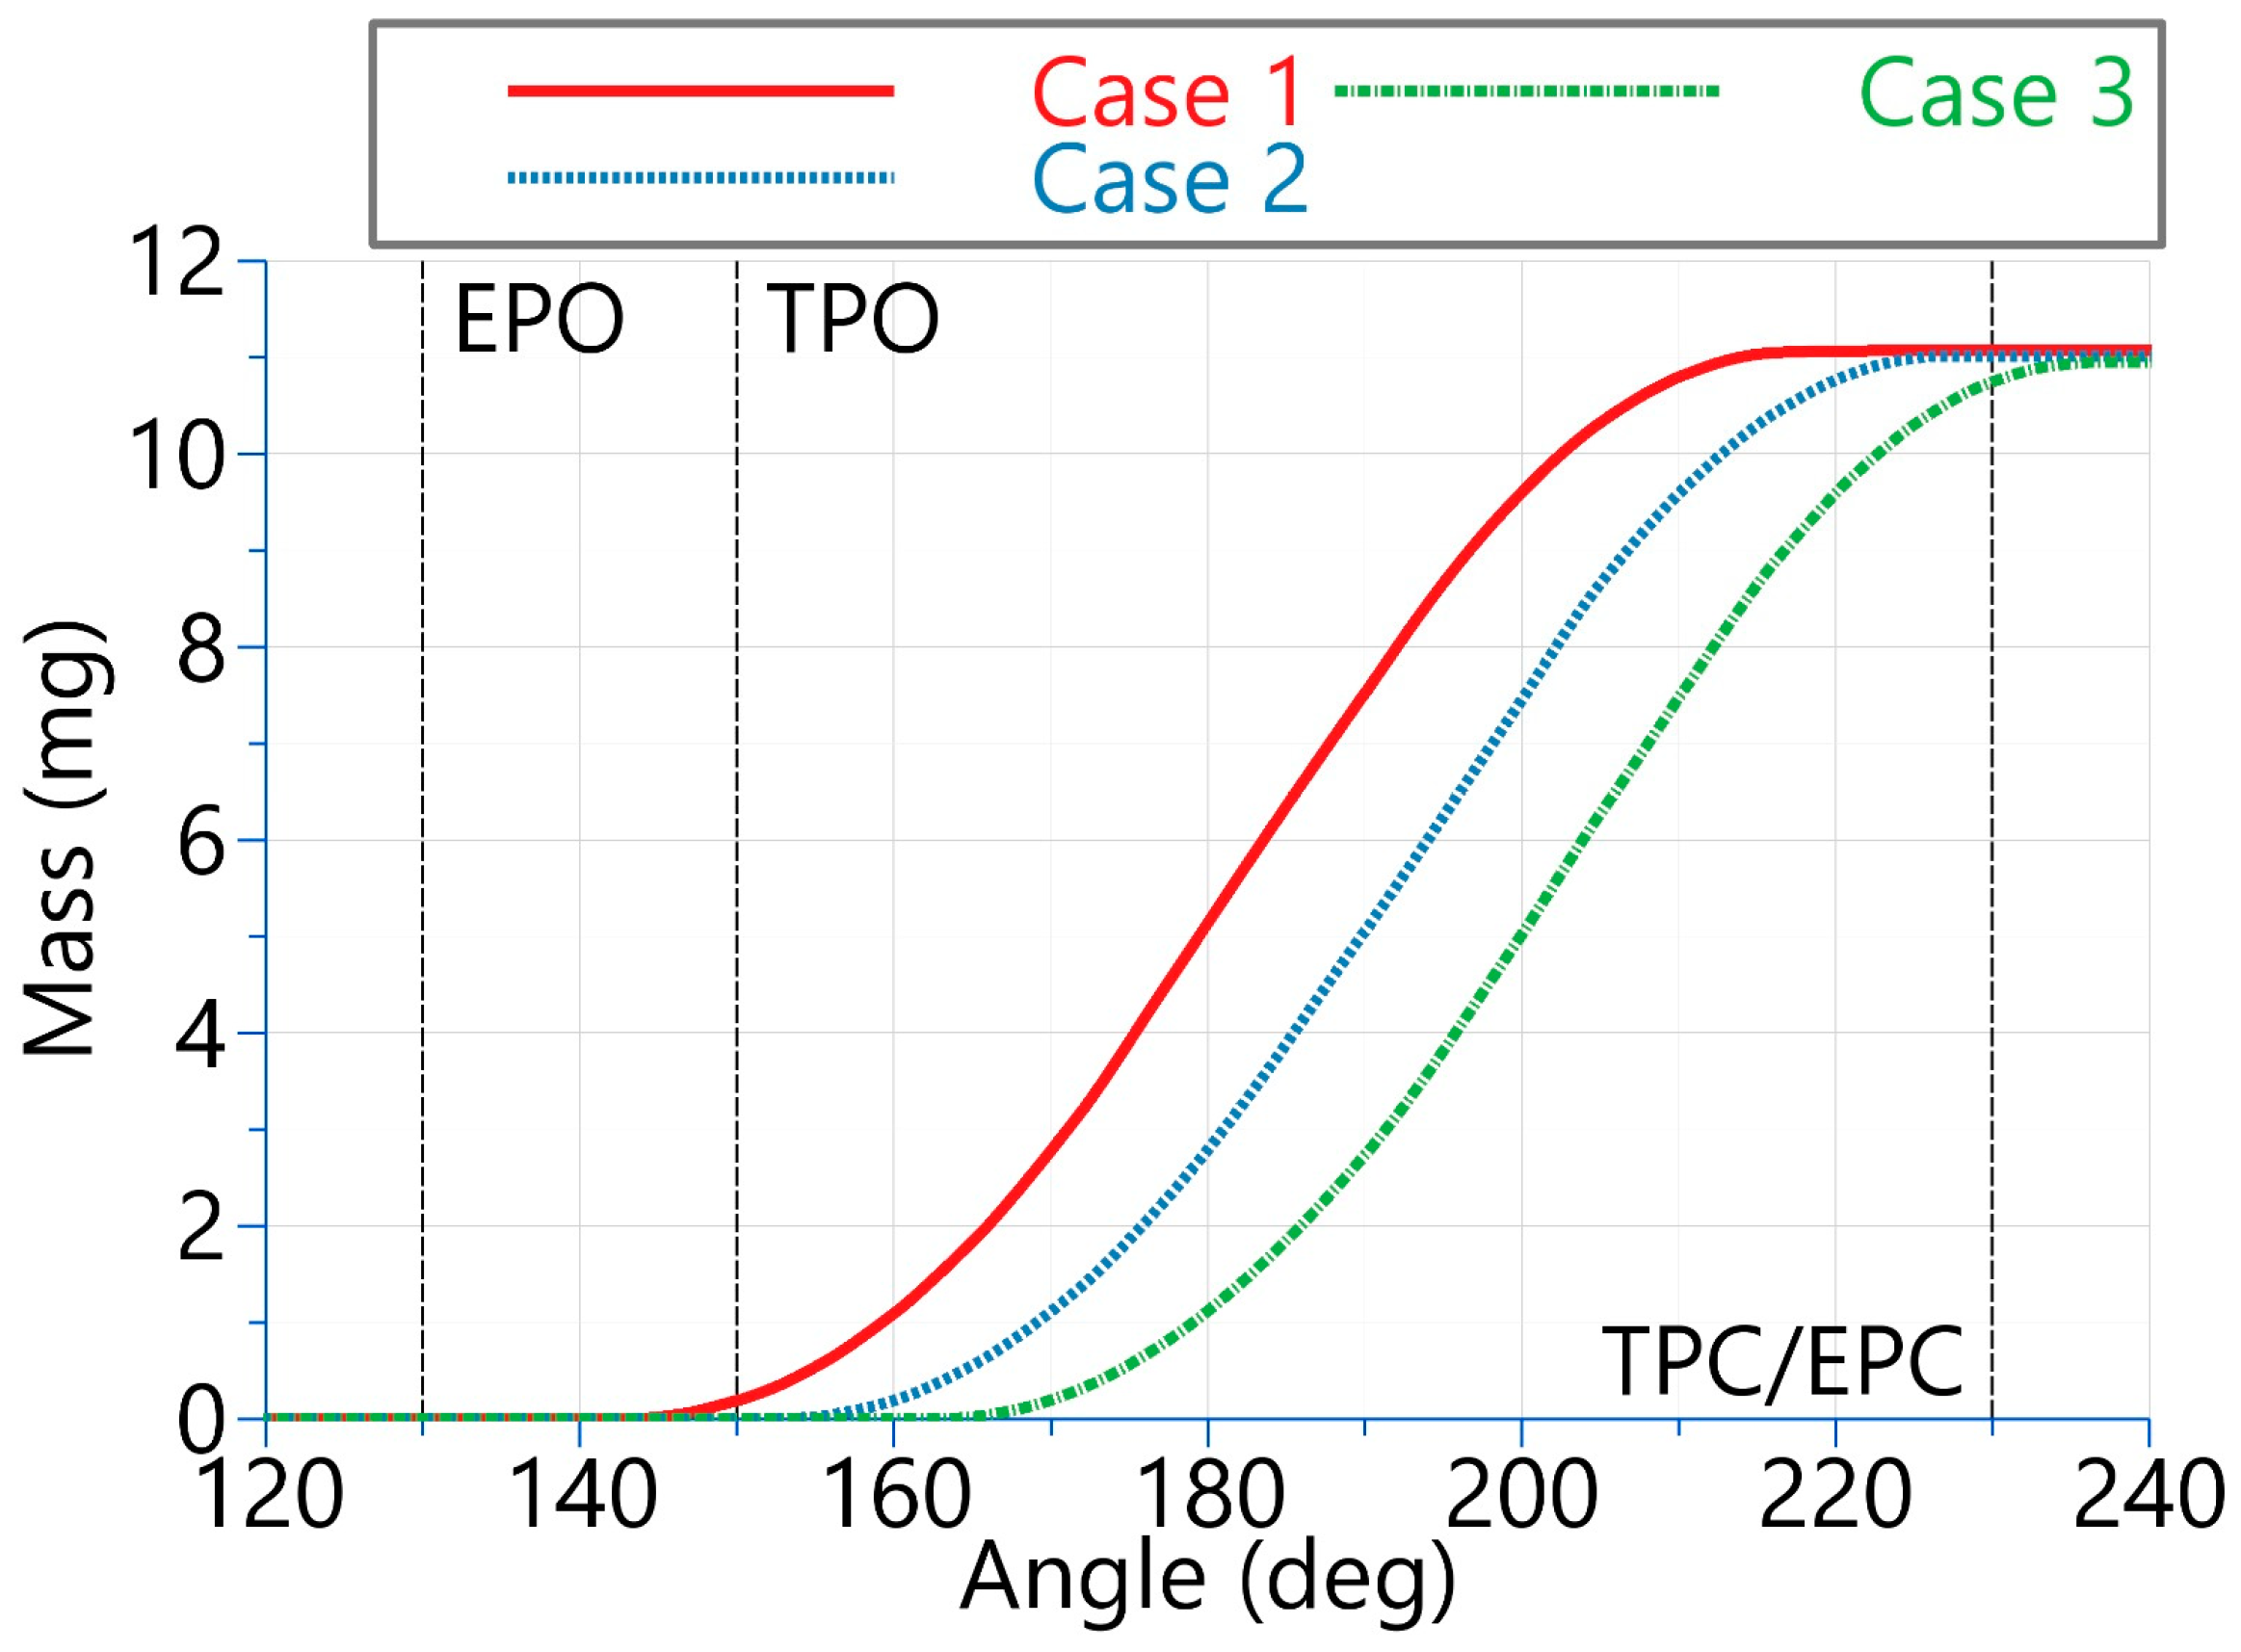
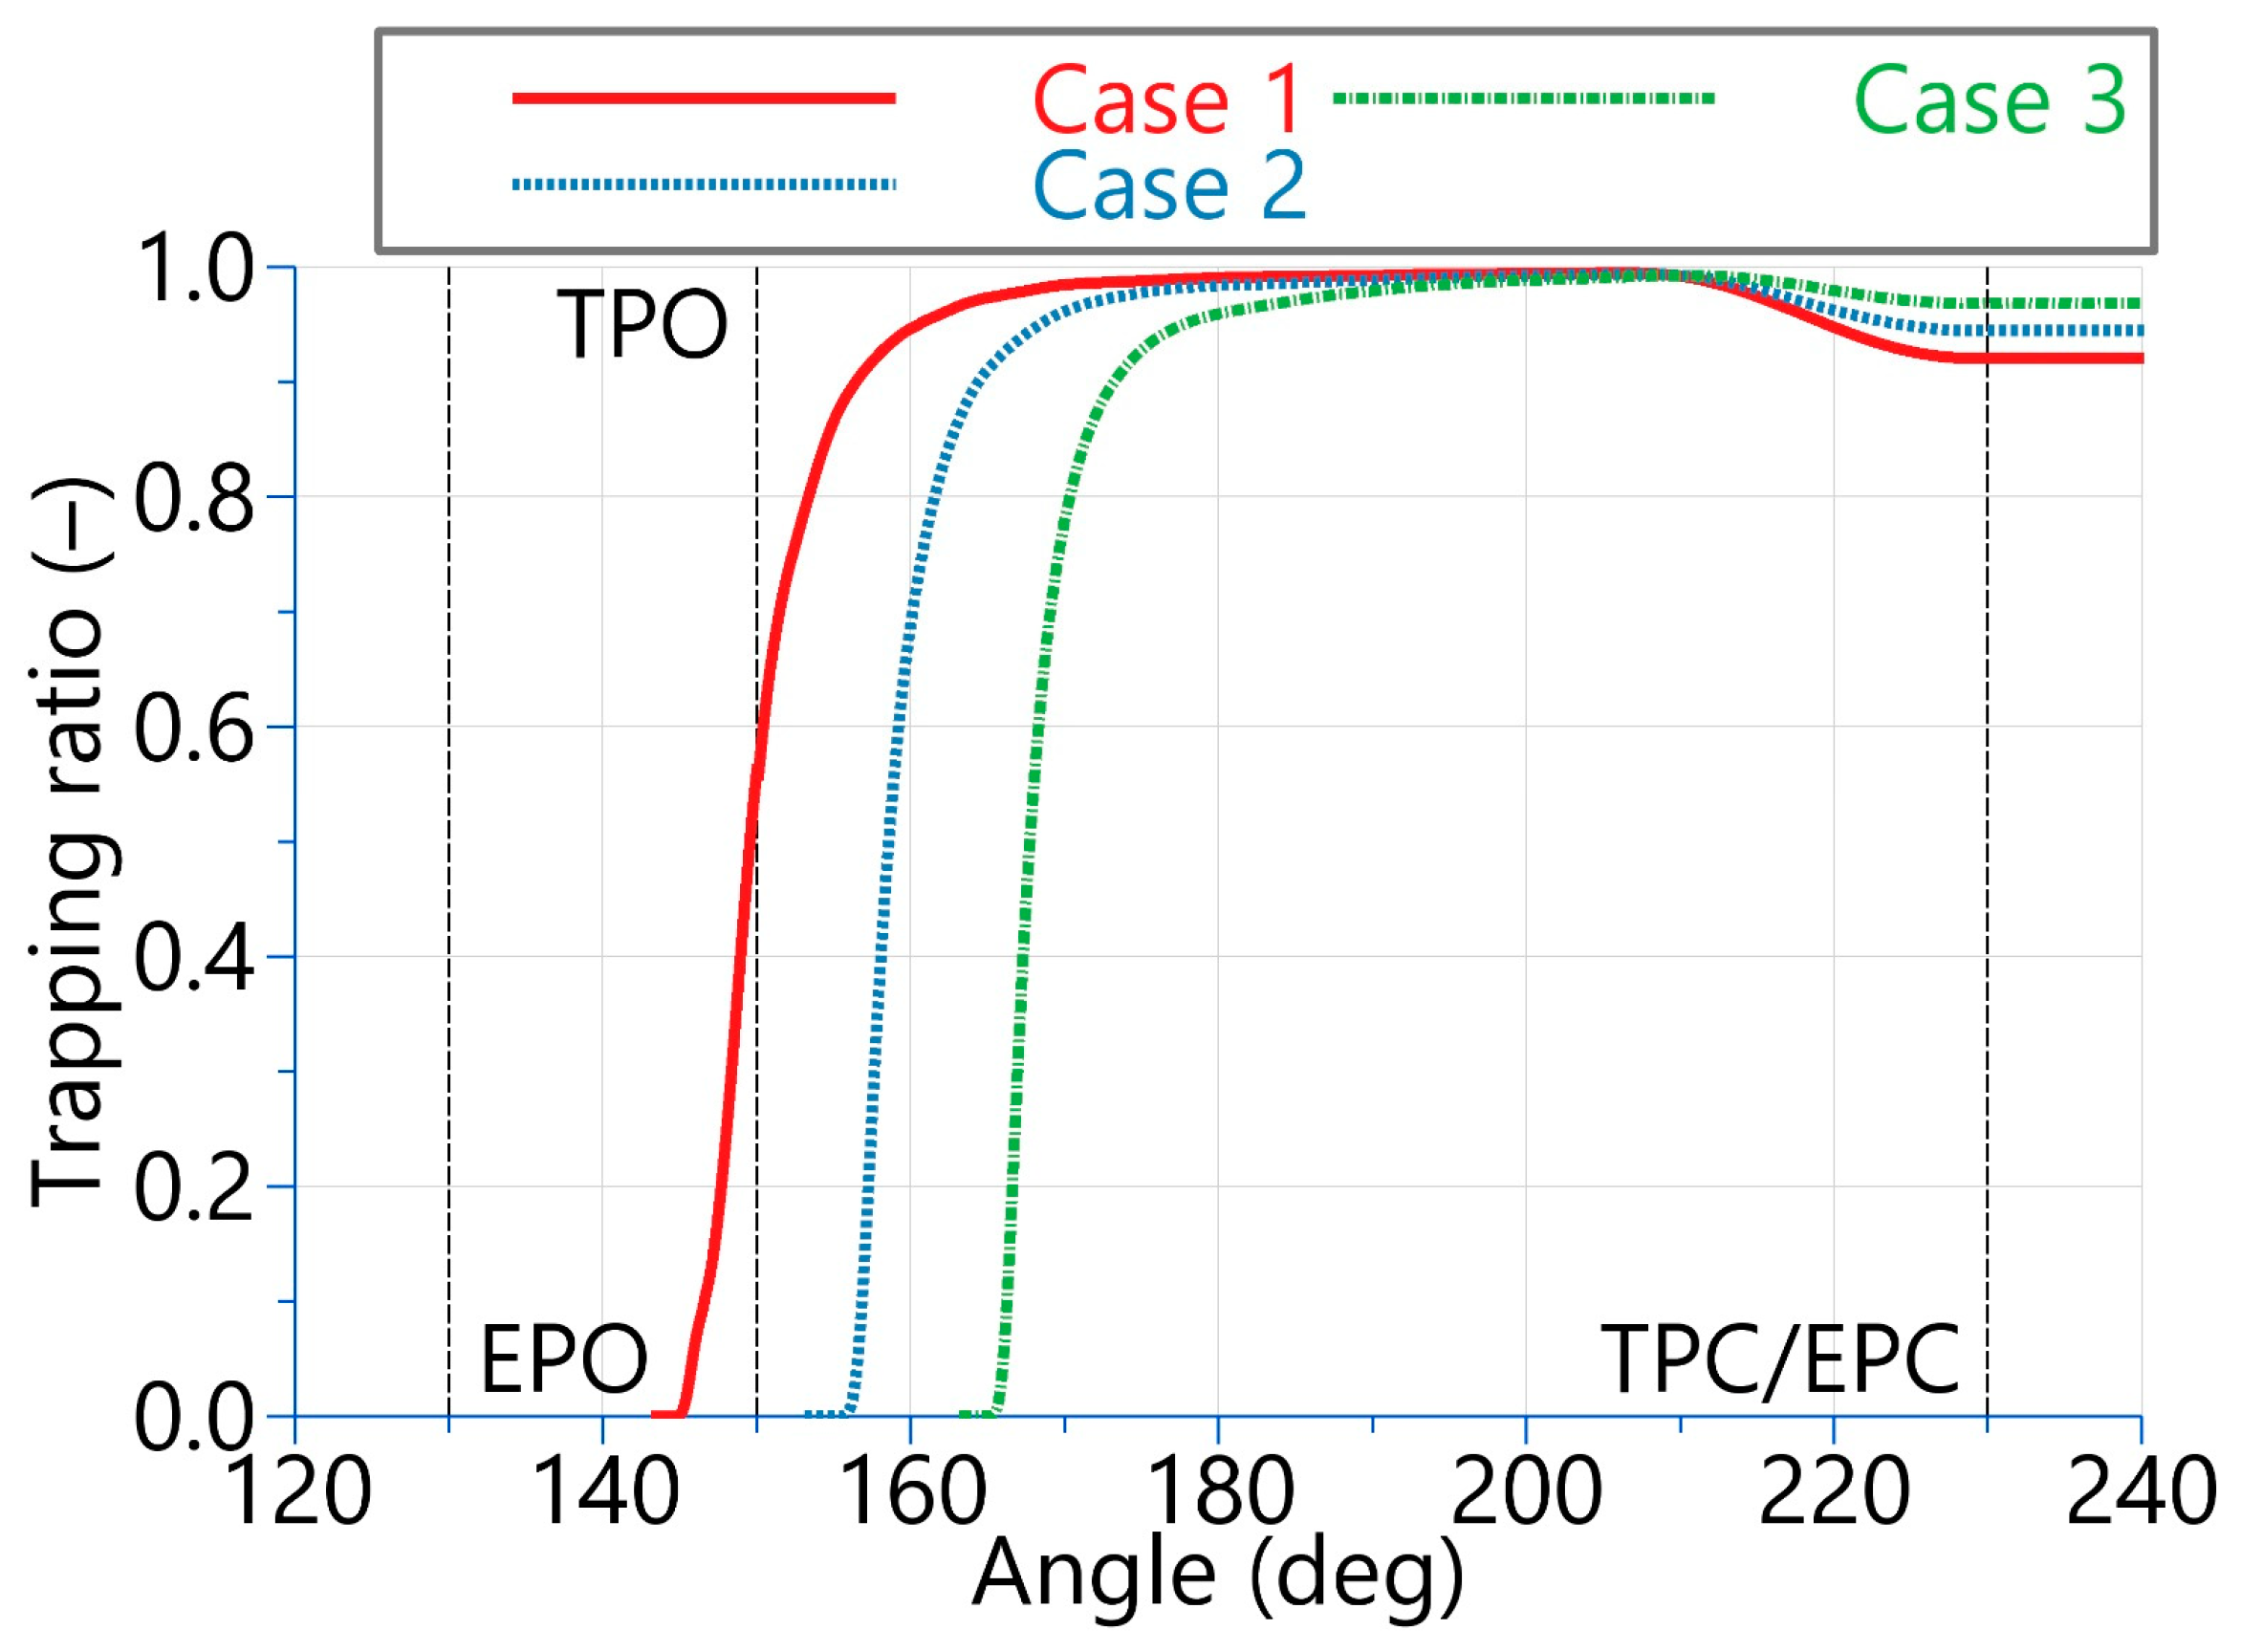
The results presented in Figure 15 and Figure 16 show that the injected mass was consistent across the three cases, around 11 mg. Regarding the mass of hydrogen trapped in the cylinder, a clear trend began to emerge, which was also confirmed by Table 4: the later the injection, the better the fuel Trapping Efficiency. From the table, it can be extrapolated that there was an improvement in trapping of up to 5% from Case 1 to Case 3.
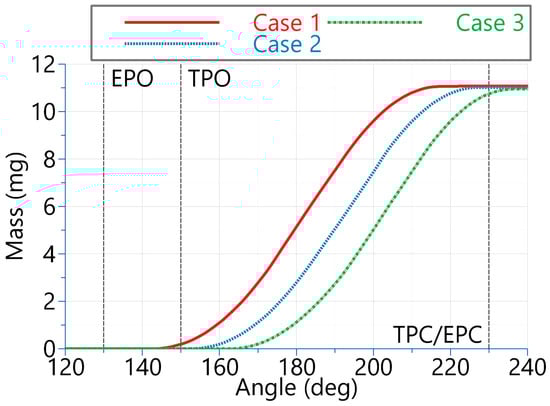
Figure 15.
Hydrogen-injected masses for Cases 1, 2, and 3.
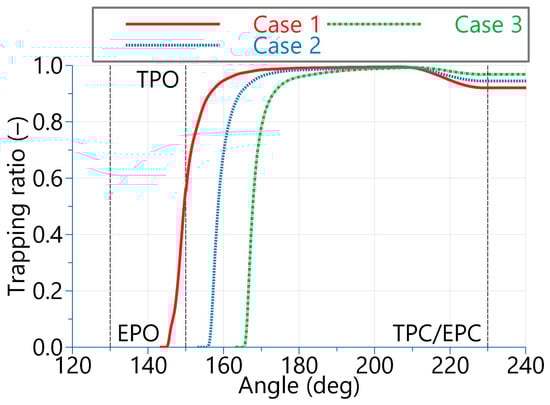
Figure 16.
Hydrogen in-cylinder trapped mass for Cases 1, 2, and 3.
Table 4.
Main results of the injection sweep simulations.
Figure 17 depicts the isovolumes of hydrogen, showing the equivalence ratios between 0.35 and 0.55 during the scavenging process. It is notable that as hydrogen began to enter the cylinder, two swirling tongues with helical motion were formed. Around 220 degrees aTDC, a small amount of hydrogen escaped to the exhaust, significantly mixed with the exhaust gases.
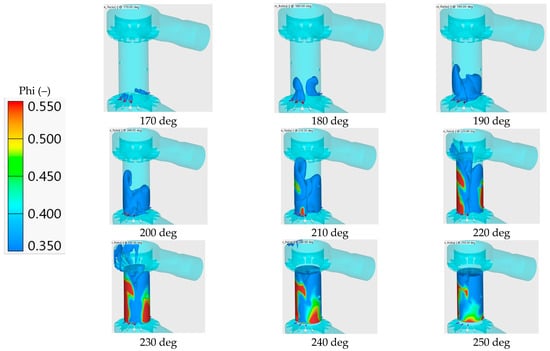
Figure 17.
Case 3 hydrogen injection process: isovolumes of equivalence ratios (phi).
In addition to the results presented in Table 4, Figure 18 illustrates the distributions of the equivalence ratios on the central +Z plane in the combustion chamber for the three analyzed cases. Although the average ratio in the chamber was similar across all three cases, the isolines revealed that Cases 1 and 3 exhibited slightly greater inhomogeneity compared to Case 2.
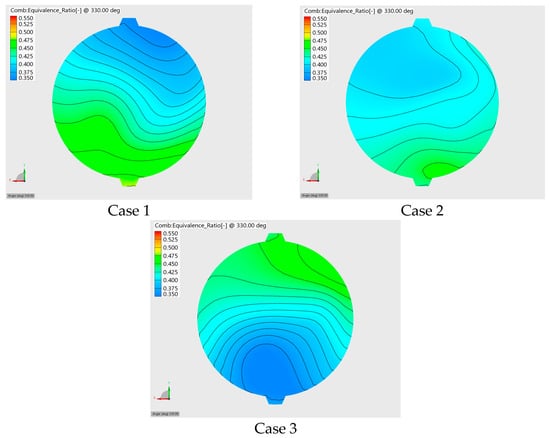
Figure 18.
Phi distributions @330 deg for Cases 1, 2, and 3.
An angle of 30 degrees bTDC (330 cad in the simulations) was selected as representative of the homogeneity, as it allowed space for subsequent analysis of ignition timing advancement for combustion.
From this analysis, it could be inferred that injecting as late as possible, as in Case 3, achieved the best trapping ratio, the least amount of hydrogen lost to the exhaust, and a satisfactory charge homogeneity, although the best charge homogeneity was obtained with a slightly earlier injection timing (Case 2).
In an attempt to increase trapping, a test was also conducted increasing the injection pressure at the upper limit suggested by the datasheet: 8 bar. Under these conditions, as seen in Figure 19, the injection law became triangular while maintaining the total injected mass. The end of injection was set at 237 degrees, derived from the previous sweep, with the start of injection occurring around the BDC.
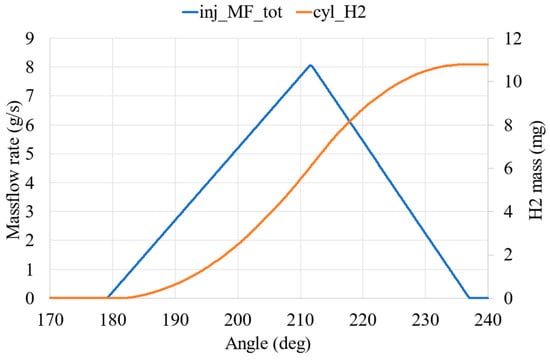
Figure 19.
Increased injection pressure mass flow rate.
In this latest simulation, the injection pressure was increased up to 8 bar, with the same injected mass of 10.727 mg, while the mass of hydrogen trapped in the cylinder was 10.61 mg. This resulted in a trapping ratio of 98.9%, leaving only 0.05 mg of hydrogen in the exhaust volume. The mean equivalence ratio was 0.4232, but the phi uniformity, as illustrated in Figure 20, seemed to be worse compared to cases with lower injection pressure.
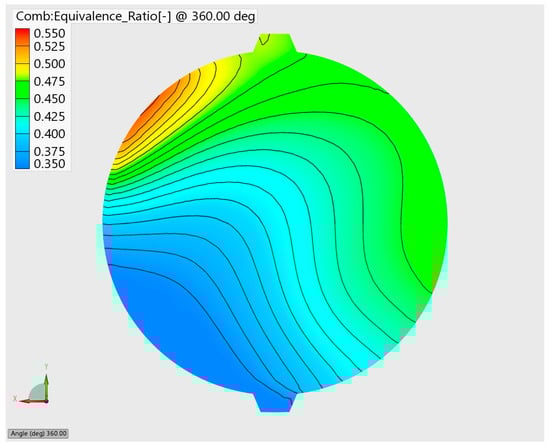
Figure 20.
Increased injection pressure phi distribution.
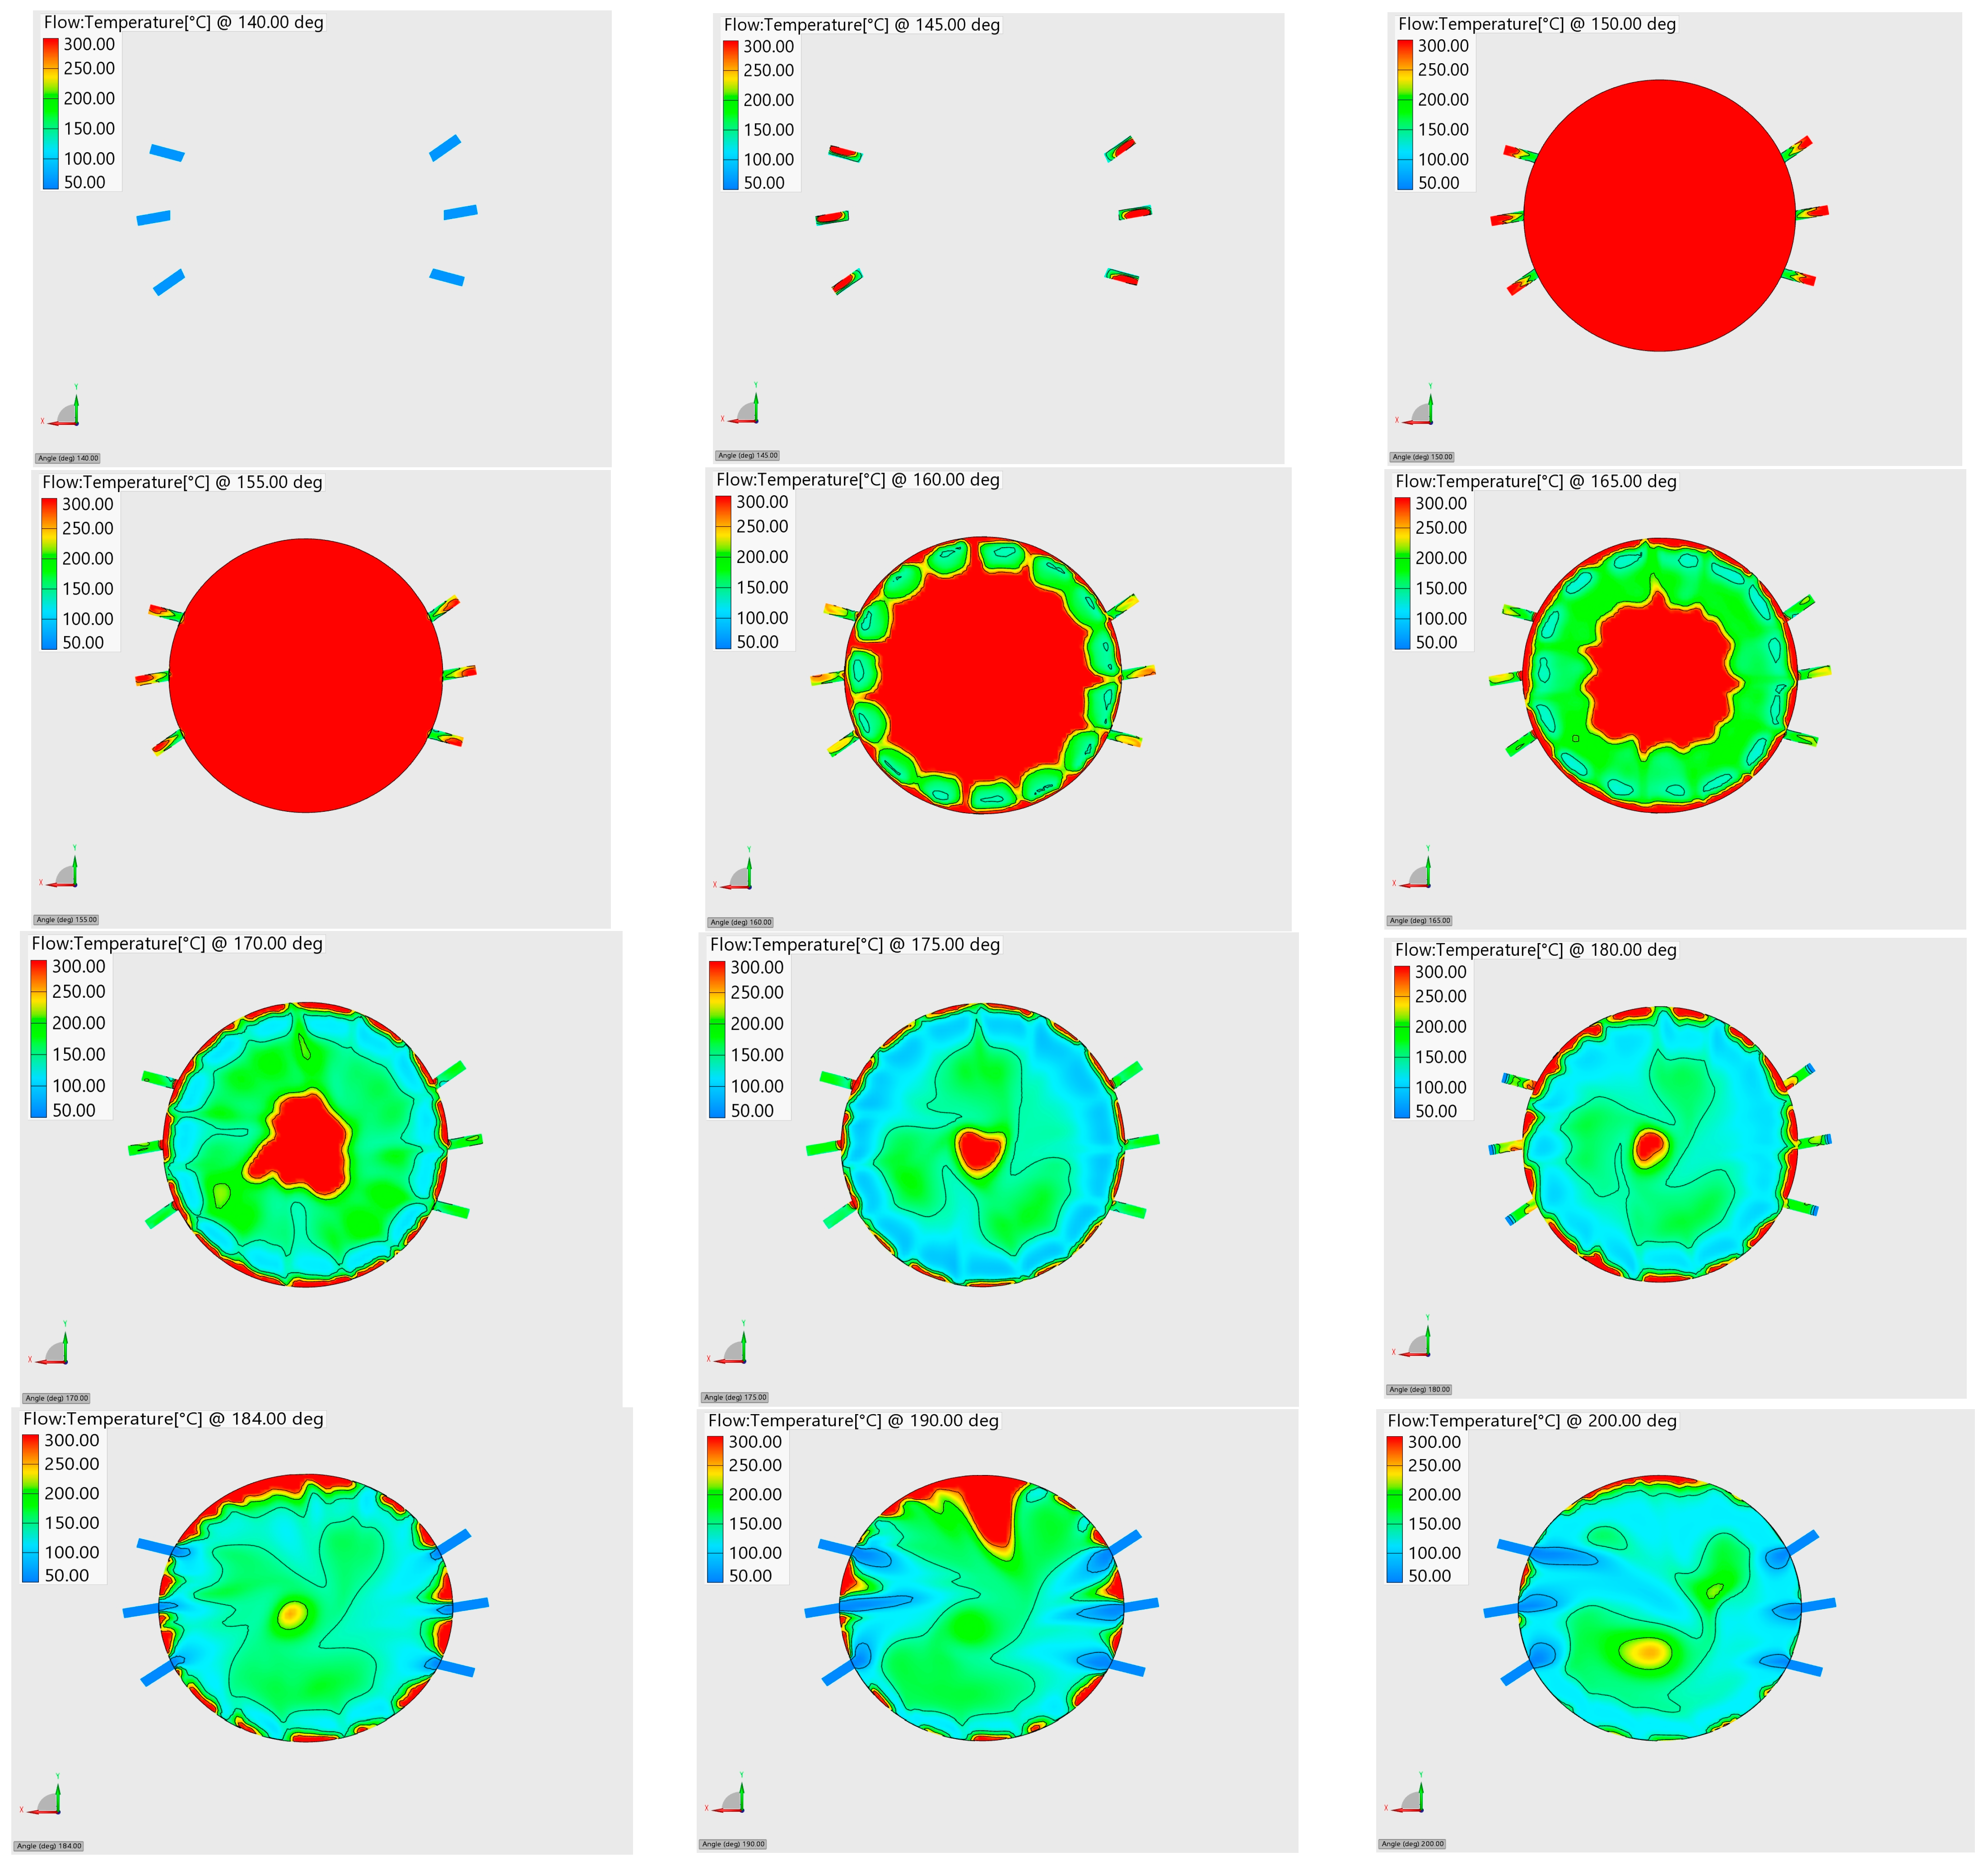
Finally, the simulations conducted could provide valuable insights into the temperatures to which the injector was subjected, although the analysis of thermal stresses on the injector was not within the scope of this article. To avoid excessive detail and conserve space, the temperature profiles associated with the last case analyzed are reported in the Appendix A, as it was possible to see the temperature increase abruptly during the injector duct opening because of the exhaust gases, but 20–30 deg later, before the injection started, the temperatures went up to 150–200 °C.
5. 1D CFD Performance Analysis
A 1D-CFD analysis was carried out at a full load, from 1000 to 3000 rpm. The relative air–fuel ratio of the trapped charge was set at 2.4, while the spark advance was calculated by the predictive quasi-dimensional combustion model in order to impose the 50% burn angle at about 17° after TDC. The reason for this setup was to maintain coherence with the experimental data employed to calibrate the predictive model.
Figure 21 shows a very flat brake torque curve: the ratio between the minimum and the maximum values over the whole range was 88%. This meant that the engine could be employed also on small vehicles.
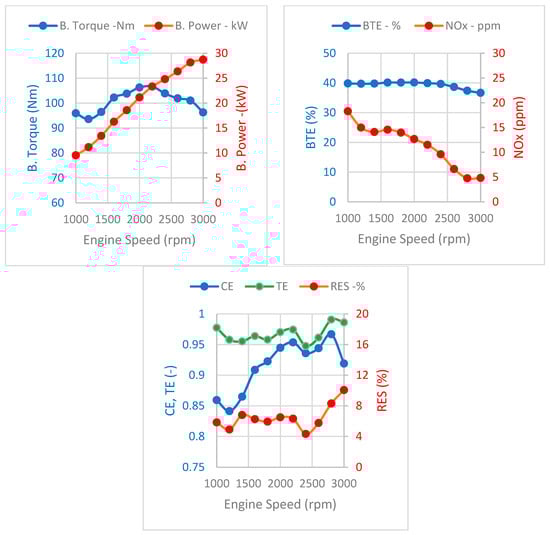
Figure 21.
Engine performance at full load, λ = 2.4, with a 50% burn angle set at 17°.
The target power of 25 kW was reached at 2400 rpm, while the peak value of 29 kW was obtained at the maximum speed.
Figure 21 also shows the full load values of the BTE and NOx concentrations: the 40% efficiency target was obtained from 1000 to 2400 rpm, while the concentration of NOx was always below 20 ppm (5 ppm at maximum power).
Finally, Figure 21 presents an overview of the key parameters used to characterize the scavenging process: the Charging Efficiency (CE), which is defined as the ratio of trapped air to the ideally delivered air; Trapping Efficiency (TE), which measures the ratio of trapped air to the actual delivered air; and the exhaust residual gas fraction (RES), representing the ratio of burnt gas mass to the total mass present at the beginning of the cycle. The effectiveness of the scavenging process was very good for all the operating conditions, as expected for this type of engine; the TE was always higher than 95%, while, at the same time, the residual fraction never exceeded 10%. This meant that the risk of fuel losses at the exhaust was very low, and the dilution of the charge was not critical for auto-ignition.
If the engine were to be coupled with an electric motor, which could occur for a gen-set or for a series hybrid powertrain, it was convenient to analyze engine performance as a function of the brake power output.
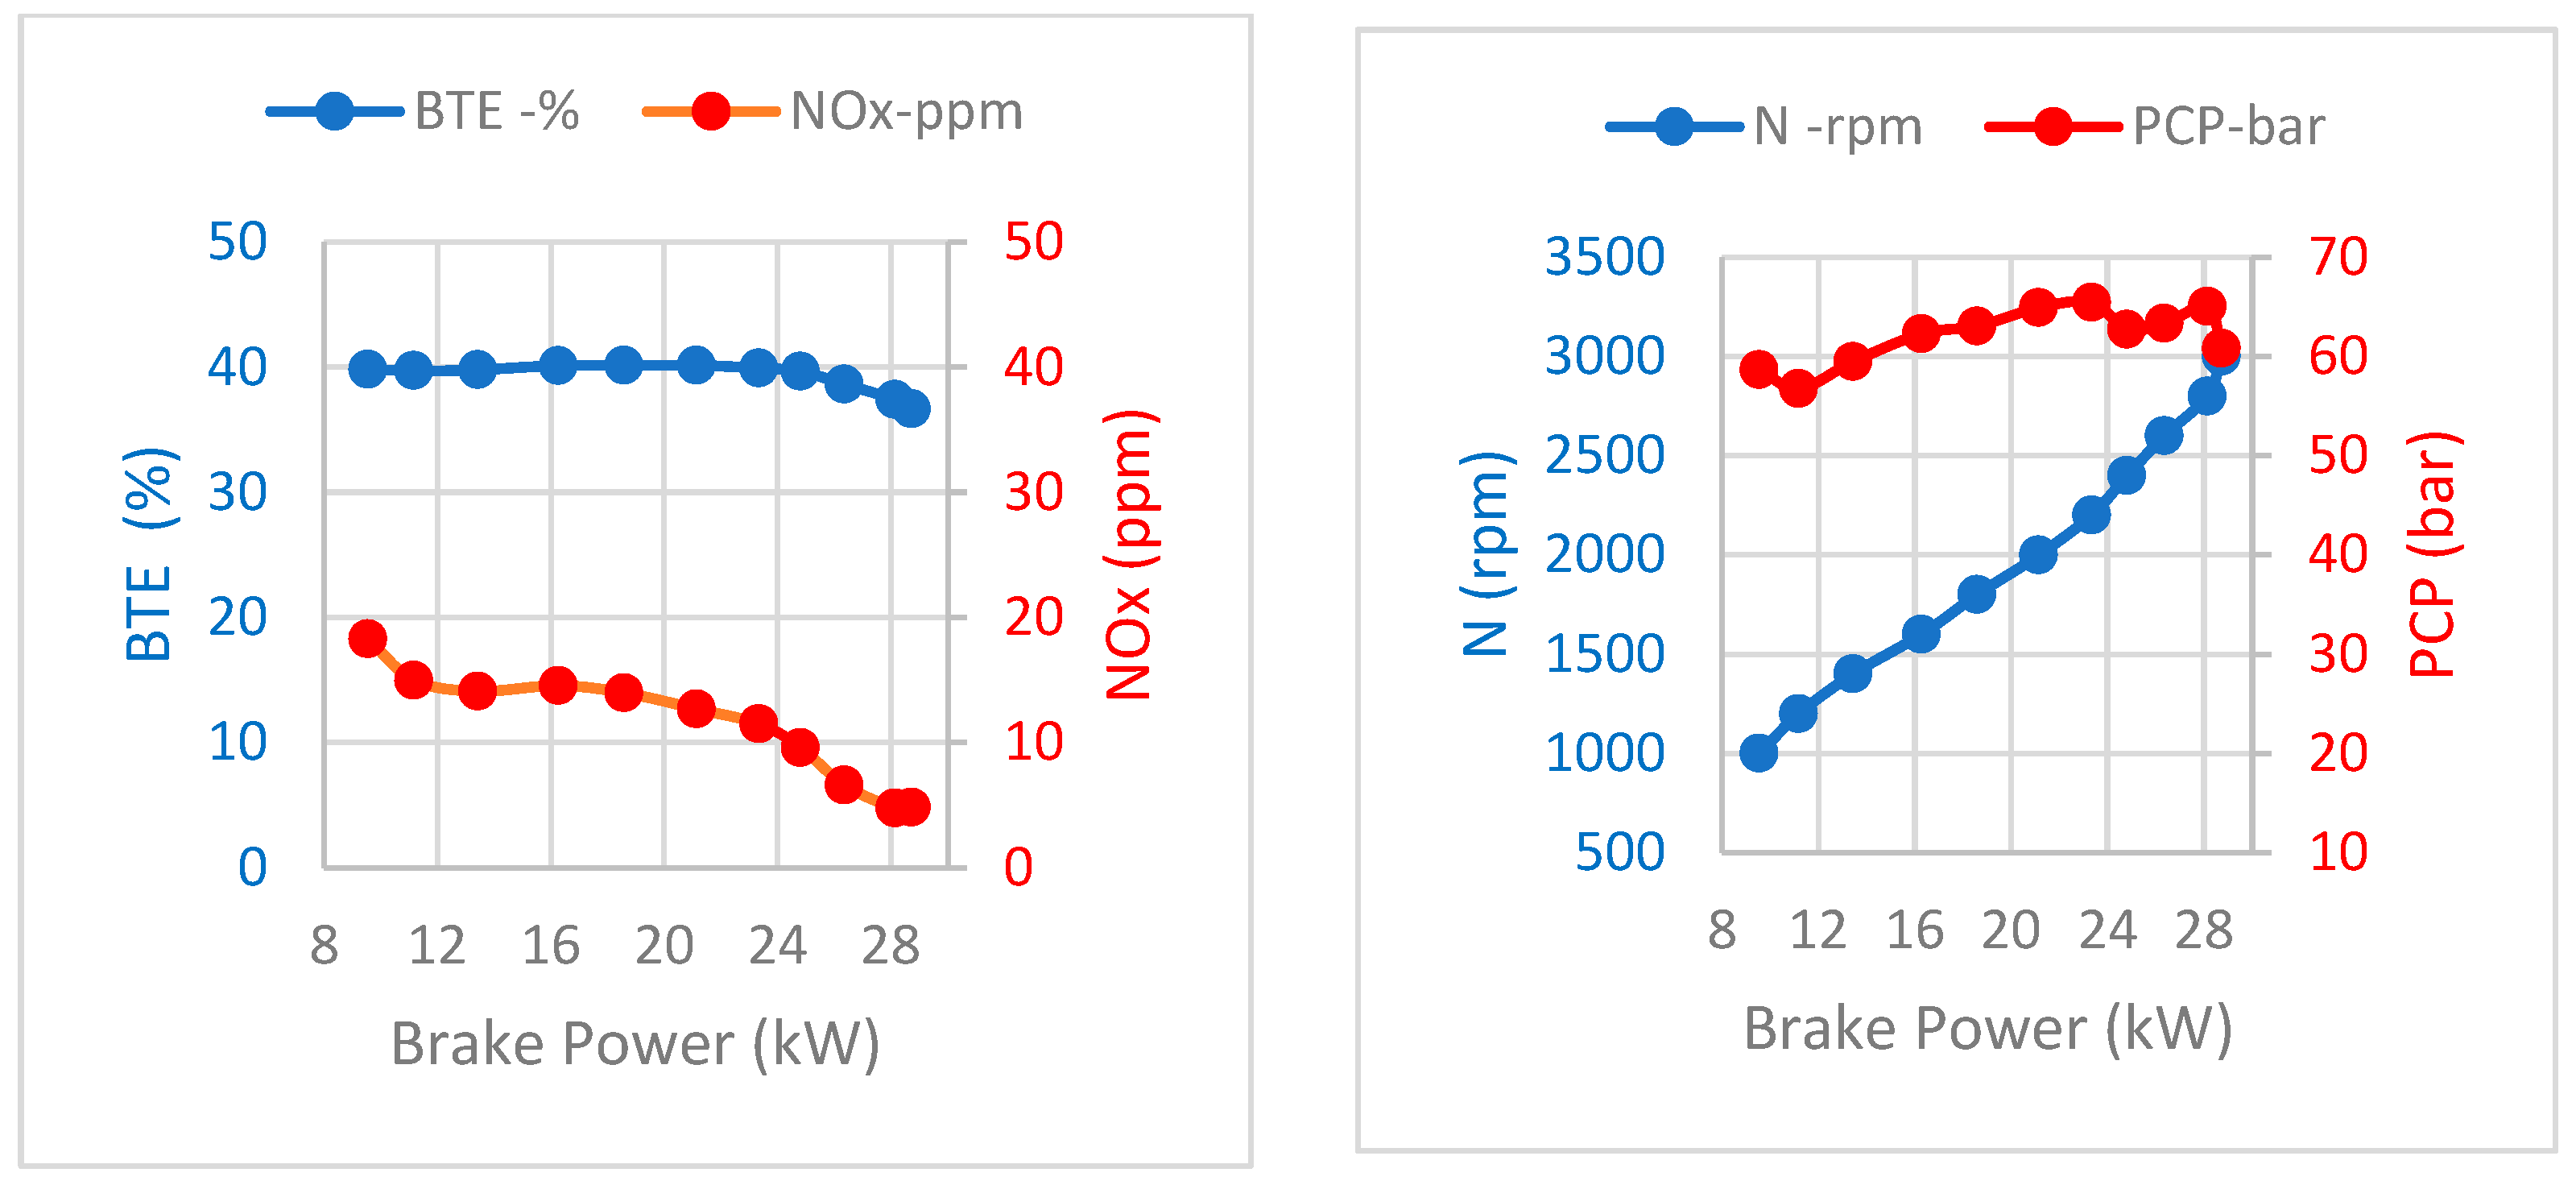
Considering this point of view, Figure 22 demonstrates that a hydrogen opposed piston engine may have performances not far from a fuel cell, especially when the required power is high. In particular, at the target power of 25 kW, the thermal efficiency was 40%, while all the pollutant emissions were close to zero (NOx < 15 ppm). At this operating condition, the typical parameters employed to assess the mechanical stress of the engine showed very promising values: the Peak Cylinder Pressure (PCP) was about 65 bar (in a commercial diesel engine it may exceed 200 bar), while the engine speed of 2400 rpm corresponded to a mean piston speed of just 7.2 m/s (maximum mean piston speeds can reach 20–25 m/s).
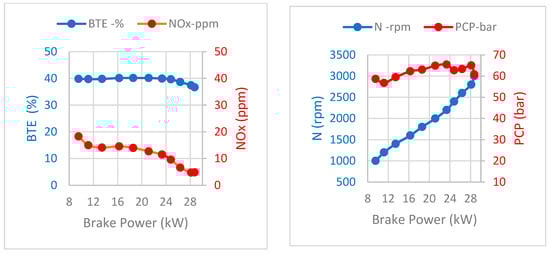
Figure 22.
Brake thermal efficiency (BTE), NOx concentration, engine speed (N), and Peak Cylinder Pressure (PCP) as functions of brake power at full load.
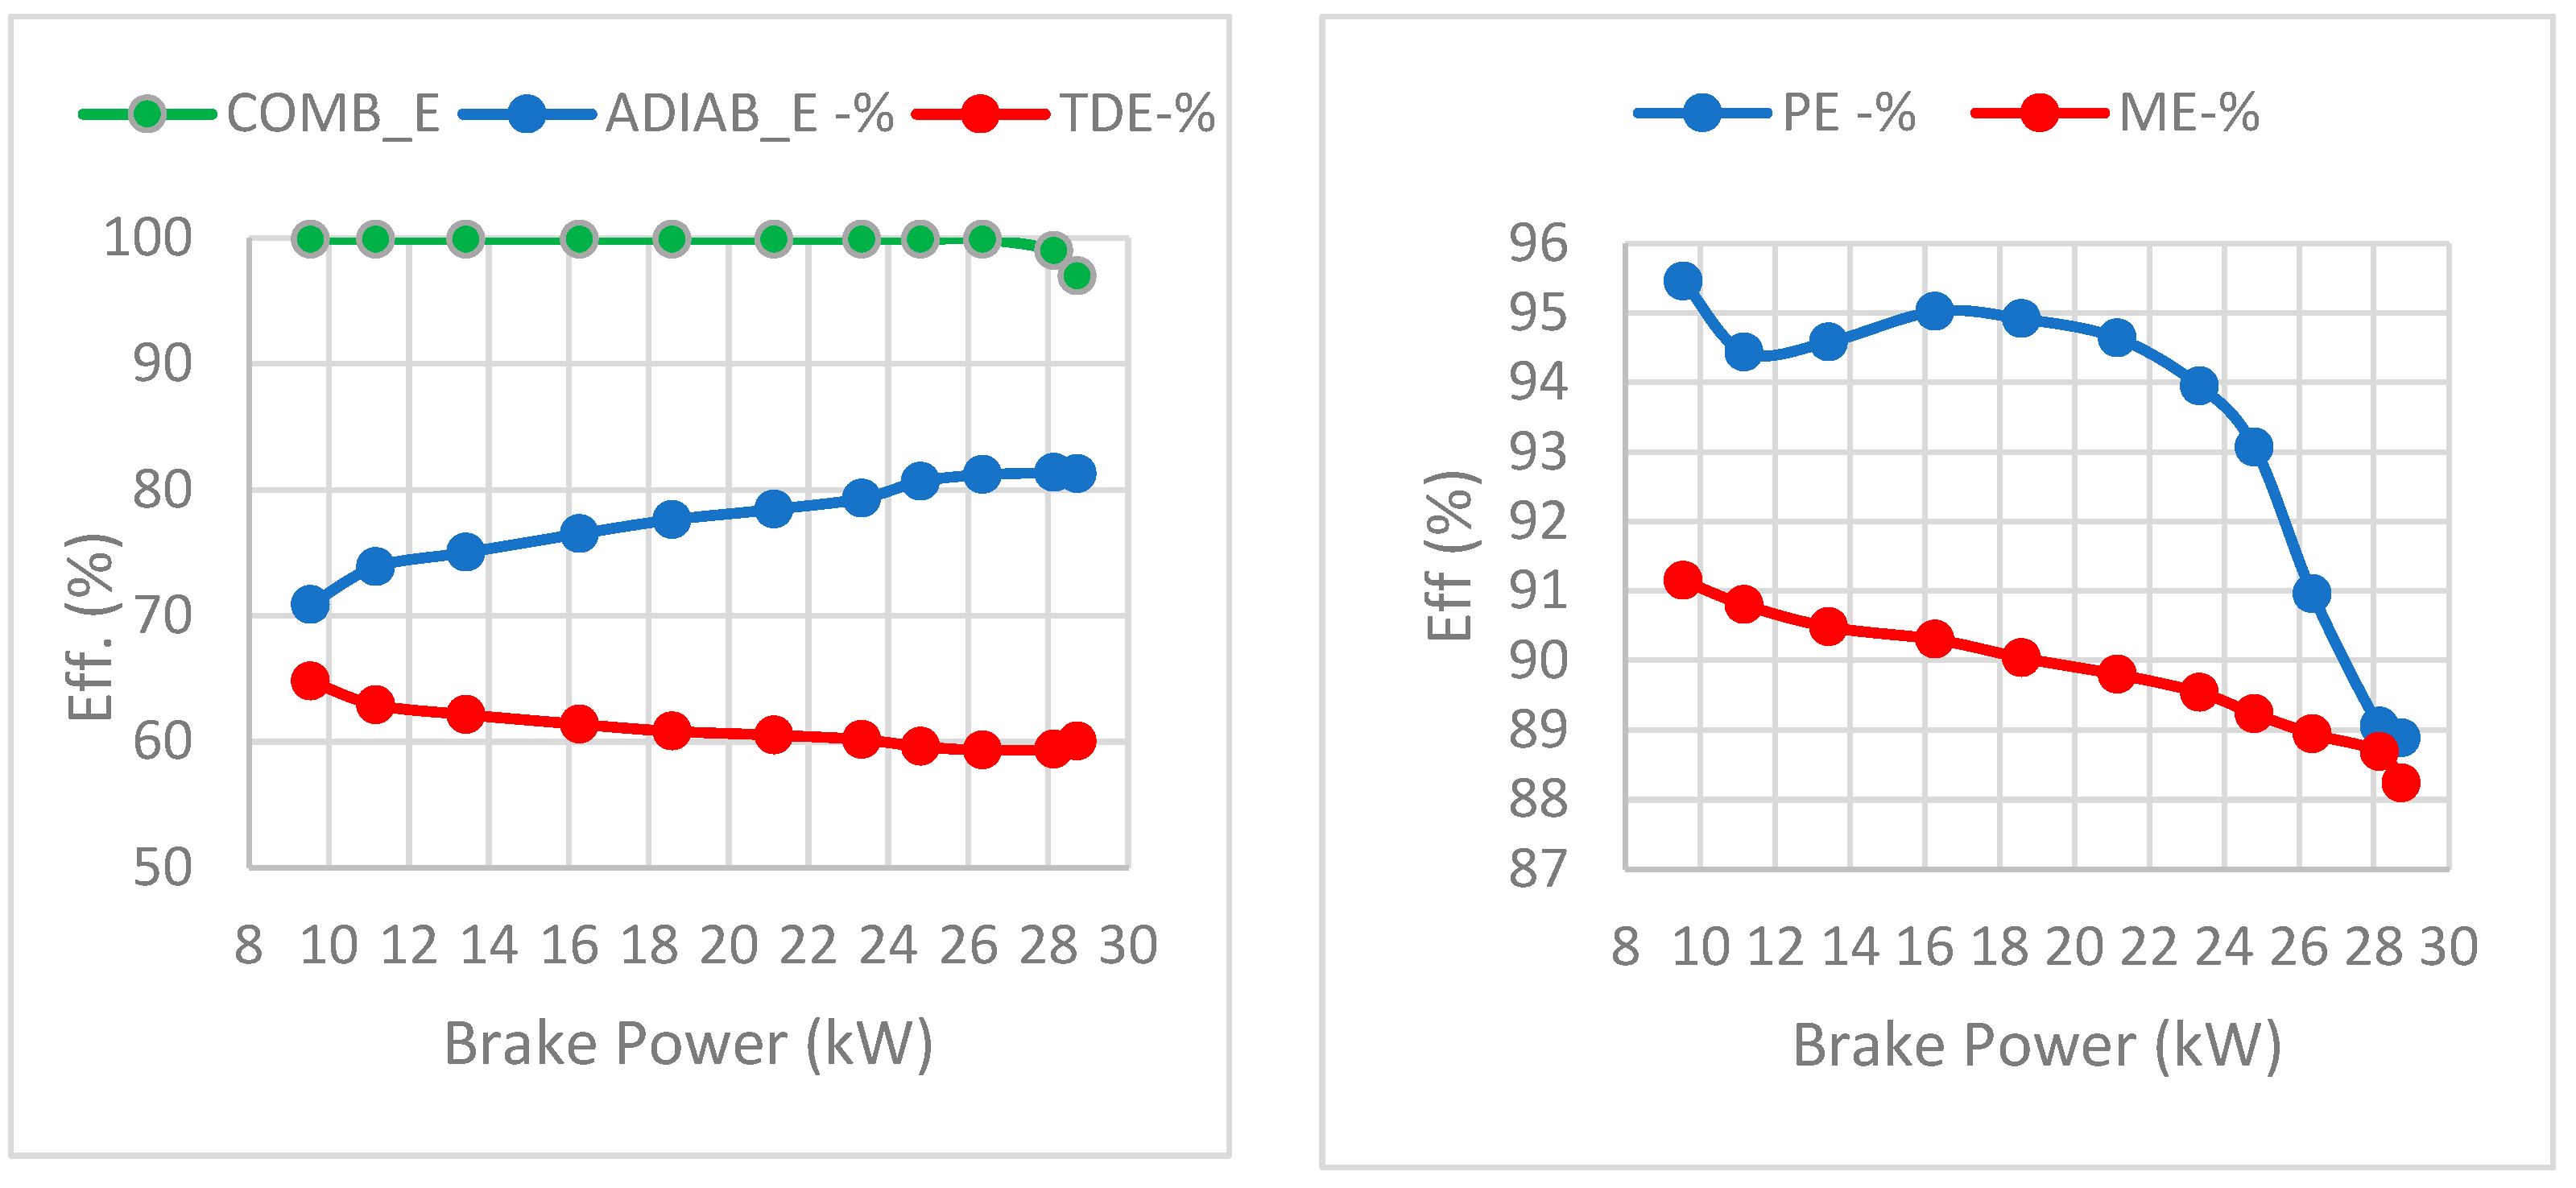
In comparison to other types of internal combustion engines, an advantage of this solution is the possibility of maintaining constant and high values of BTE even when the required power decreases. This peculiarity is explained by Figure 23, showing all the main parameters that had an influence on the brake thermal efficiency. The definitions of the parameters employed in this study are given below as the following:
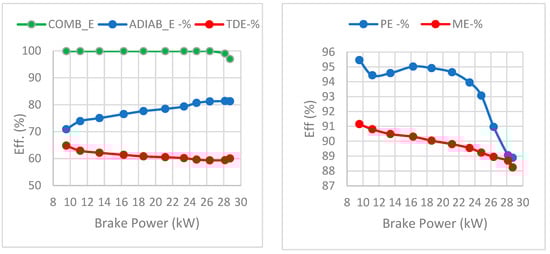
Figure 23.
Efficiency parameters for the characterization of the engine cycle: Combustion Efficiency (COMB_E), Adiabatic Efficiency (ADIAB_E), Thermodynamic Efficiency (TDE), Pumping Efficiency (PE), and Mechanical Efficiency (ME).
COMBUSTION EFFICIENCY (COMB_E): ratio of the total heat released by combustion, divided by the energy of the injected fuel (mass of fuel time Lower Heating Value);
ADIABATIC EFFICIENCY (ADIAB_E): ratio of the apparent heat released by combustion (different between the total heat and the wall thermal losses) to the total combustion heat;
THERMODYNAMIC EFFICIENCY (TDE): ratio of the indicated cycle work to the apparent heat;
PUMPING EFFICIENCY (PE): in a 2-stroke engine, it is defined as the ratio of useful indicated cycle work (difference between the indicated cycle work and the energy adsorbed per cycle by the supercharger) to indicated cycle work;
MECHANICAL EFFICIENCY (ME): brake work to the useful indicated cycle work. This parameter also considers the mechanical losses associated with the mechanical link between two crankshafts.
Figure 23 shows that only the adiabatic efficiency improved as the power output increased. This trend can be explained by the reverse dependence of thermal losses on engine speed, which was almost proportional to brake power. Conversely, mechanical efficiency was higher when the power output was low. This outcome was due to the lower values of the mechanical losses, compared to the indicated cycle work. A similar explanation can be repeated for the pumping efficiency: as the power decreases, the work required to compress the charge decreases, because the supercharger outlet pressure decreases. The trend of the thermodynamic efficiency, decreasing as power increases, depends on the angular duration of combustion, which in turn depends on the engine speed: as the speed increased, the model predicted a slower combustion, which tended to reduce the efficiency of the thermodynamic cycle. Finally, combustion efficiency is always very close to the unit, except at peak power, due to a small loss of fuel at the exhaust.
6. Design of the Prototype
The first layout of the engine was based on the geometrical parameters found by the calculation campaign reported above.
The design flexibility and robustness were fundamental, as the prototype had to be able to incorporate the alternative solutions that were to be tested at the dynamometer bench.
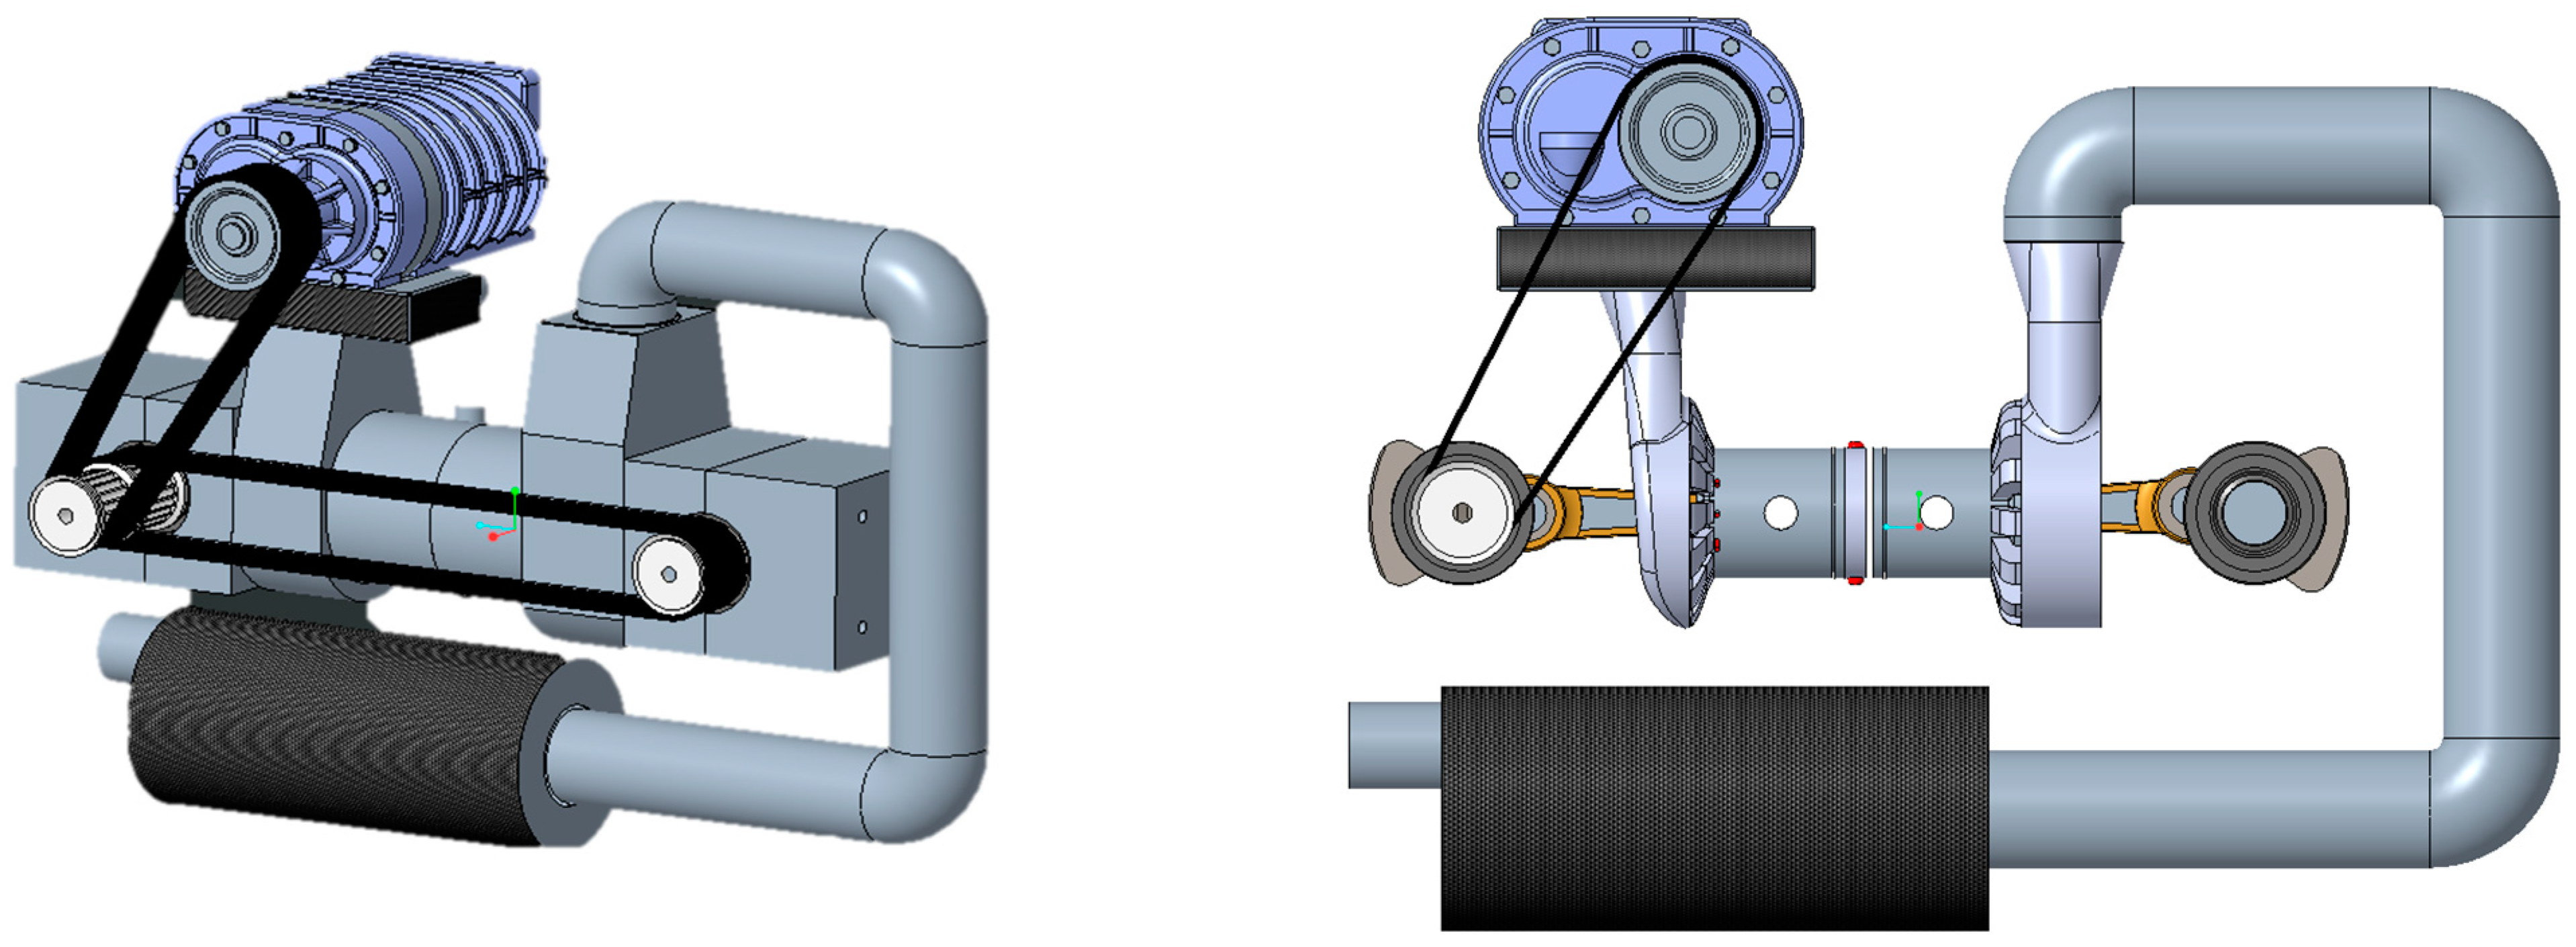
Figure 24 shows the first CAD model of the engine, developed for assessing the overall dimensions.

Figure 24.
Whole engine model.
Air is pushed into the cylinder by a positive displacement supercharger (Eaton M65) driven by a belt. The lubrication is identical to a conventional 4-stroke engine. The belt type required by the compressor is a standard HTD belt that is directly driven by one the crankshafts. Just after the blower, a small intercooler (shown in black) was installed to cool the air charge; the intercooler is a WCAC, which permits drastically reducing dimensions and weight and introduces the possibility of easily controlling the inlet temperature of the fresh charge just by adding a PWM water pump.
In opposed piston engines, it is crucial to connect the crankshafts while maintaining a predetermined offset between the two pistons. This connection was implemented using the same HTD belt employed for the blower. This configuration is simple and flexible, as it does not require a lubrication system; it is also very rigid, ensuring high accuracy in determining the pistons’ position. Therefore, only one encoder was needed for the indicating analysis.
Furthermore, the offset between the crankshafts can be easily modified, even if the possible values are limited by the number of the teeth of the pulley. If finer tuning is required, the relative position between the crankshaft and the pulley can be modified.
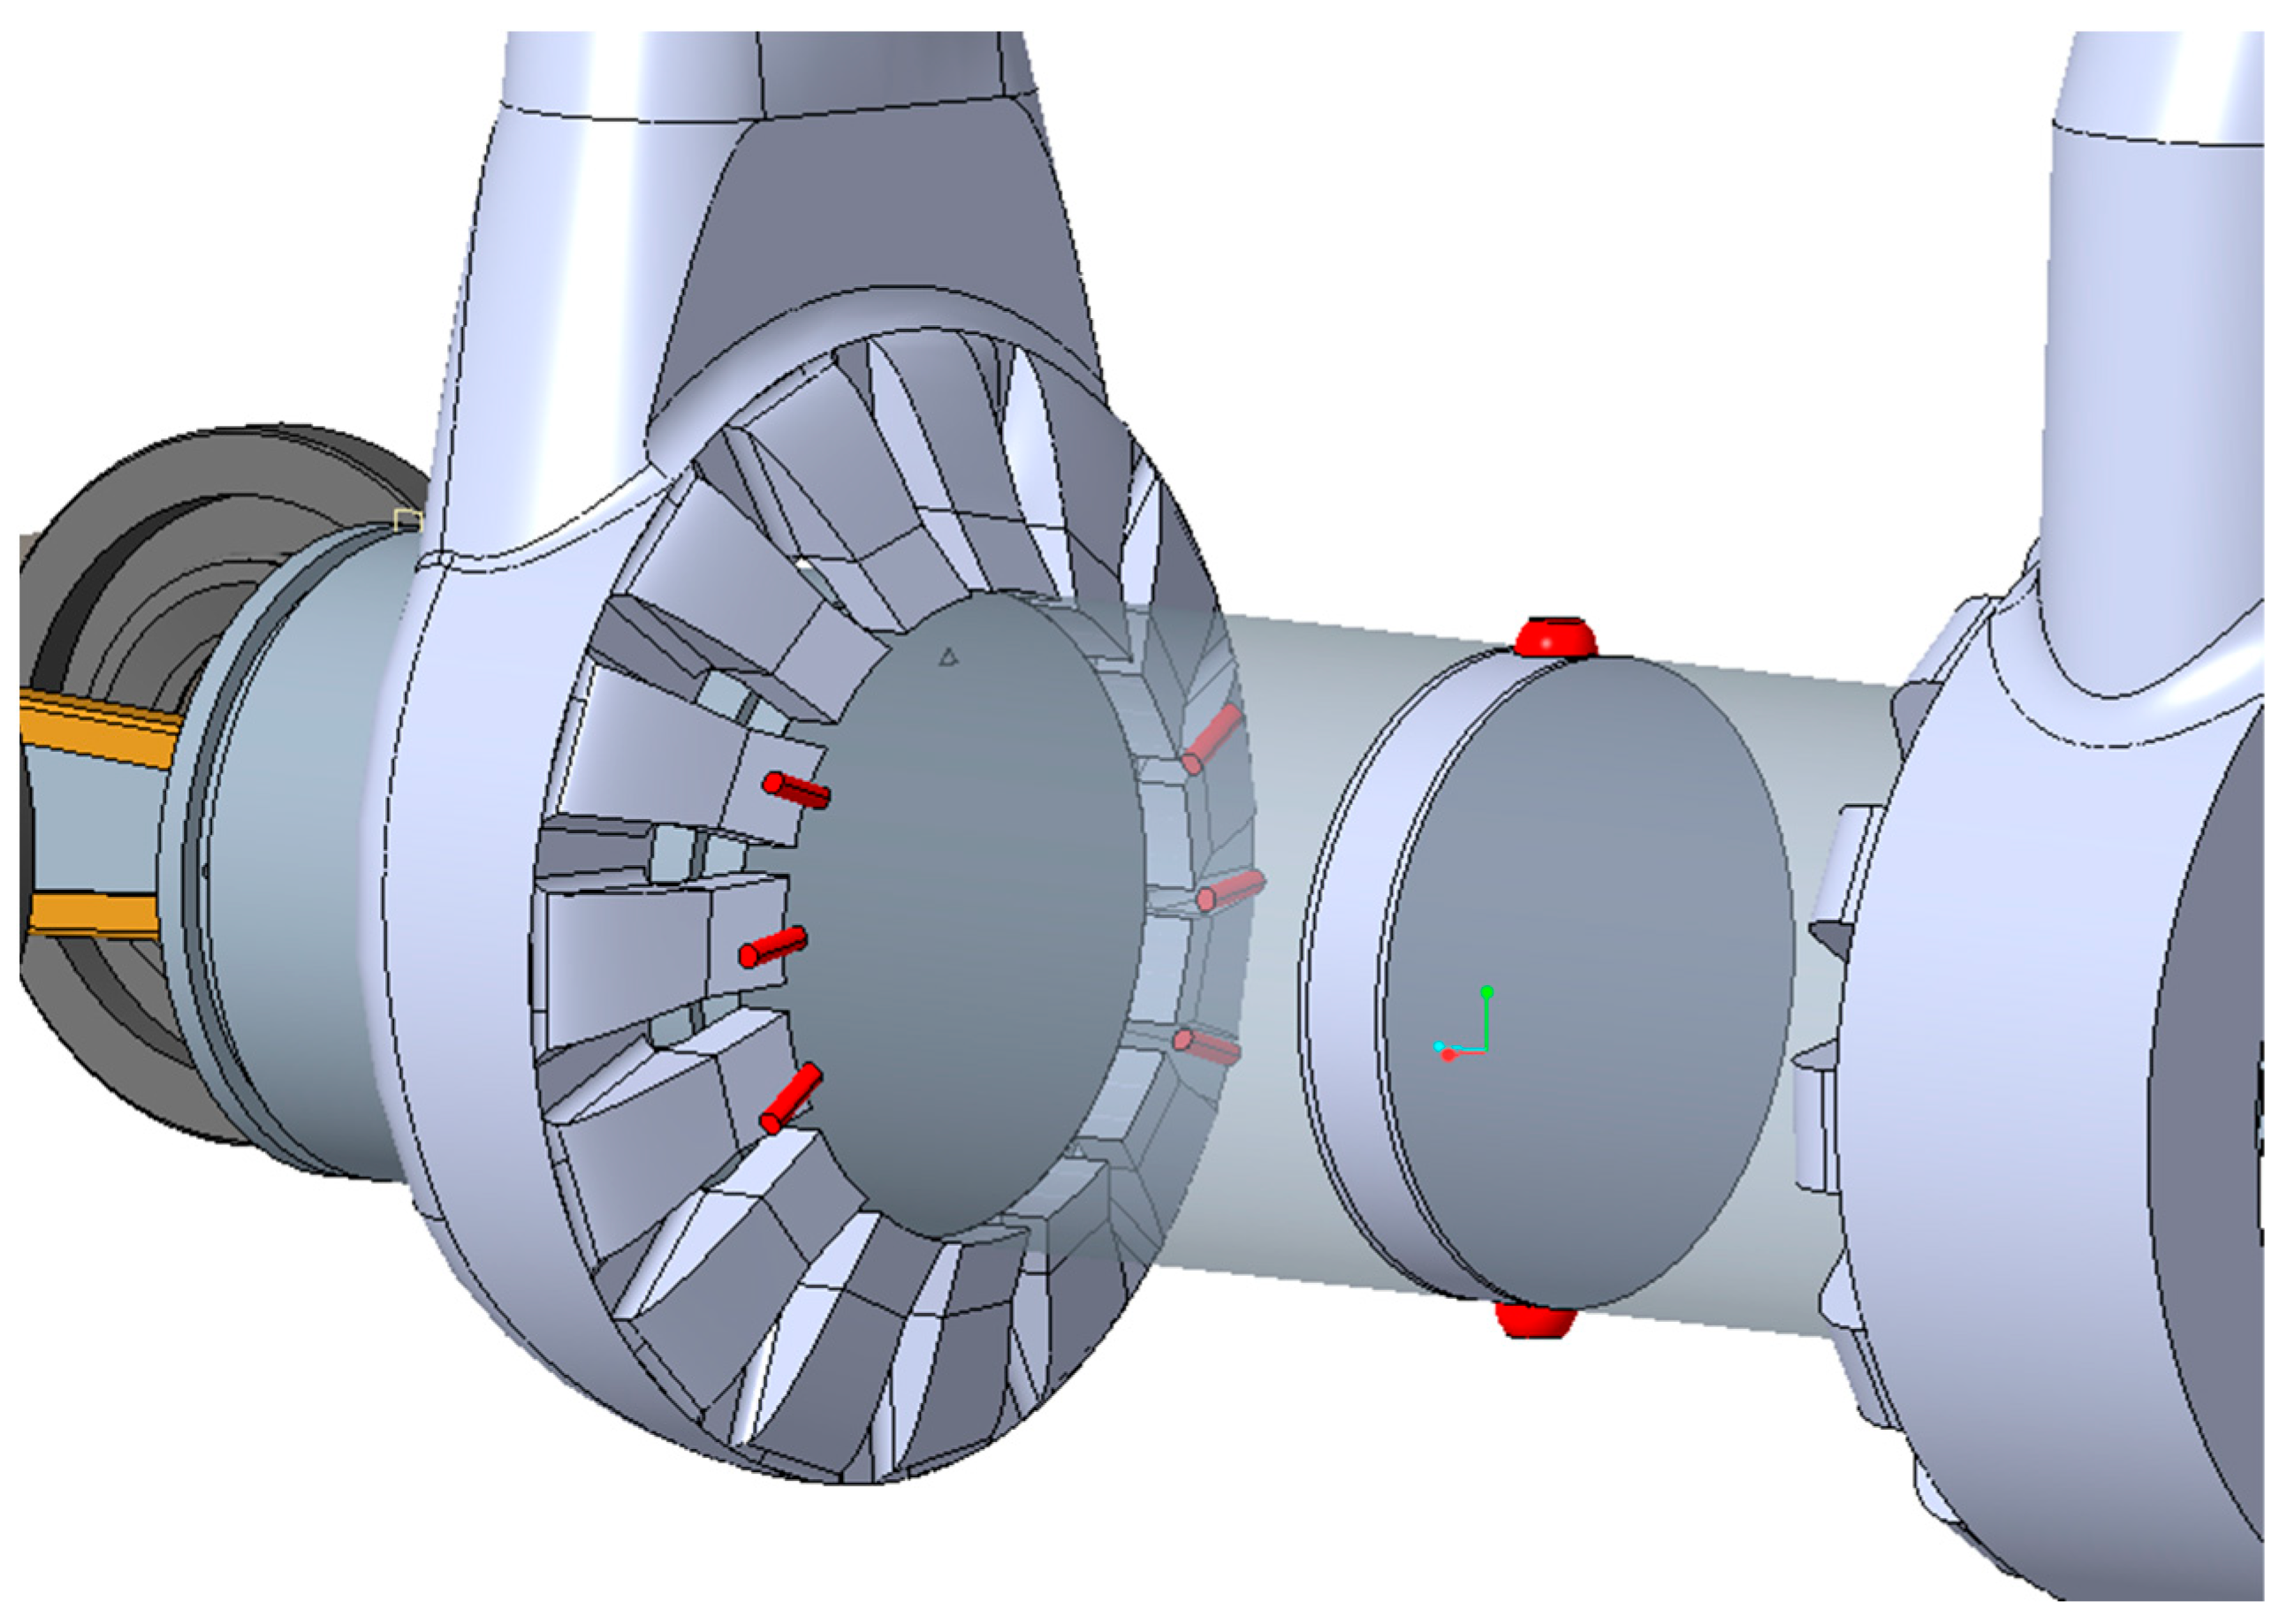
Figure 25 below shows more details of the engine, specifically highlighting the crankshafts, pistons, and “fluid domain”.
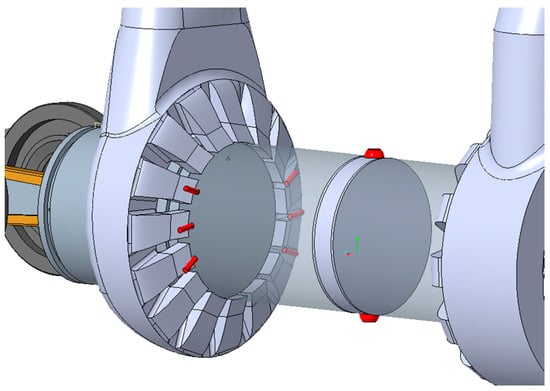
Figure 25.
Injection points and spark plug chamber.
The lubrication system in each crankcase is of the dry sump type in order to minimize the blow-by, and thus, the presence of oil in the combustion chamber.
Additionally, the ventilation of the crankcases strongly reduces the risk of explosions, in case some hydrogen flows in the sump. This is particularly important because of hydrogen’s high flammability.
The injection system is made up of two injectors, each one feeding a small rail equipped with three small ducts (highlighted in red in Figure 25). The geometric details of the injection system were optimized through CFD simulations, as previously discussed. The two sets of ducts were not directly derived from the cylinder cast, but added after. This choice avoided problems of leakage deriving from the die casting process and yielded a higher flexibility.
Due to the high turbulence generated during the scavenging process, the spark plug was positioned inside a small pre-ignition chamber to prevent misfiring (Figure 25), and the spark plug position can be adjusted by adding or removing some spacers.
In this configuration, the engine’s mass was estimated to be ~30 kg, including the blower and the intercooler. The overall dimensions are 600 mm in width, 400 mm in depth, and 800 mm in length. The length of this engine is considerably higher, compared to other internal combustion engines. This architecture can be compared to a boxer; however, even with the same displacement and bore–stroke ratio, the overall length is expected to be larger due to the specific requirements of the opposed piston setup.
This design demonstrates the feasibility of this type of engine architecture, maintaining a lighter construction compared to a four-stroke engine.
Looking forward to mass production, the cost of the whole engine should be competitive for the following reasons: it has a low number of components in comparison to a 4-stroke (no valves, no camshafts, no cylinder head, one intake, and one exhaust manifold for two pistons); for each cylinder, the two crankshafts, connecting rods, and pistons are identical; and the cylinder, which is the most expensive component, binds both pistons, clearly reducing the construction costs in comparison to equivalent two-cylinder engines.
7. Conclusions
This paper describes the virtual development of a hydrogen opposed piston engine, rated at 27 kW at 3000 rpm, featuring an LPDI injection system. This study focused on the optimization of the scavenging process, including fuel injection and mixing. The 3D CFD simulations, carried out in the most critical operating condition (rated power), demonstrated that the proposed design of the cylinder and of the injection system enabled a quite effective scavenging process, with a fuel Trapping Efficiency of about 97%, along with a good homogeneity of the charge.
This study analyzed, in particular, the influence of injection timing, considering commercial injectors operating at 4.5 bar. At a rated power, the duration of the process was 74 deg, slightly shorter than the transfer port opening duration (80°). The best configuration corresponded to the most retarded SOI.
In an attempt to further improve hydrogen’s Trapping Efficiency, the injection pressure was increased to 8 bar, reducing the time necessary to inject the same mass and imposing the EOI as in the previous case. With this configuration, the fuel trapping ratio could increase up to 99%, but with a slightly worse mixture homogeneity.
Concerning the overall performances, the engine is equipped with a compressor and an intercooler, and it was capable of reaching the target of 25 kW already at 2500 rpm, with near-zero NOx emissions and a BTE between 35% and 40%.
Considering these overall dimensions, this preliminary study estimated the engine weight at approximately 30 kg, considering the full engine layout. This design not only meets stringent efficiency and emission standards but also demonstrates the potential for a lightweight engine construction.
Author Contributions
Conceptualization, T.S., S.C., A.V., C.M.D.G.I., E.M. and C.A.R.; methodology, T.S., S.C., A.V., C.M.D.G.I., E.M. and C.A.R.; validation, T.S., S.C., A.V., C.M.D.G.I., E.M. and C.A.R.; writing, T.S., S.C., A.V., C.M.D.G.I., E.M. and C.A.R. All authors have read and agreed to the published version of the manuscript.
Funding
This research received no external funding.
Data Availability Statement
The data presented in this study are available on request from the corresponding author.
Acknowledgments
GAMMA TECHNOLOGIES is gratefully acknowledged for the GT-SUITE license granted to the University of Modena and Reggio Emilia. AVL is gratefully acknowledged for the FIRE-M R2023.2 license granted to the University of Modena and Reggio Emilia. The authors wish to thank Michele Arena for the calculations performed during the project for his degree thesis.
Conflicts of Interest
The authors declare no conflicts of interest. Tommaso Savioli is the founder and CEO of Atris Engineering, a company which works for automotive industries in engine research and development.
Abbreviations
| H2 | Hydrogen |
| 4S | 4-Stroke |
| 2S | 2-Stroke |
| BTE | Brake Thermal Efficiency |
| Φ-phi | Equivalence Ratio |
| λ | Lambda Value |
| CAD | Crank Angle Degree |
| BDC | Bottom Dead Center |
| TDC | Top Dead Center |
| bBDC | before Bottom Dead Center |
| aBDC | after Bottom Dead Center |
| aTDC | after Top Dead Center |
| OP | Opposed Piston |
| BMEP | Brake Mean Effective Pressure |
| ICE | Internal Combustion Engine |
| FC | Fuel Cell |
| TPO | Transfer Port Opening |
| TPC | Transfer Port Closing |
| EPO | Exhaust Port Opening |
| EPC | Exhaust Port Closing |
| CD | Discharge Coefficient |
| EPDC | Exhaust Port Discharge Coefficient |
| TPDC | Transfer Port Discharge Coefficient |
| WOT | Wide Open Throttle |
| RANS | Reynolds-Averaged Navier–Stokes |
| DR | Delivery Ratio |
| CE | Charging Efficiency |
| SE | Scavenging Efficiency |
| TE | Trapping Efficiency |
| PCP | Peak Cylinder Pressure |
| COMB_E | Combustion Efficiency |
| ADIAB_E | Adiabatic Efficiency |
| TDE | Thermodynamic Efficiency |
| PE | Pumping Efficiency |
| ME | Mechanical Efficiency |
| WCAC | Water Charge Air Cooler |
| PWM | Pulse Width Modulation |
| RON | Research Octane Number |
Appendix A
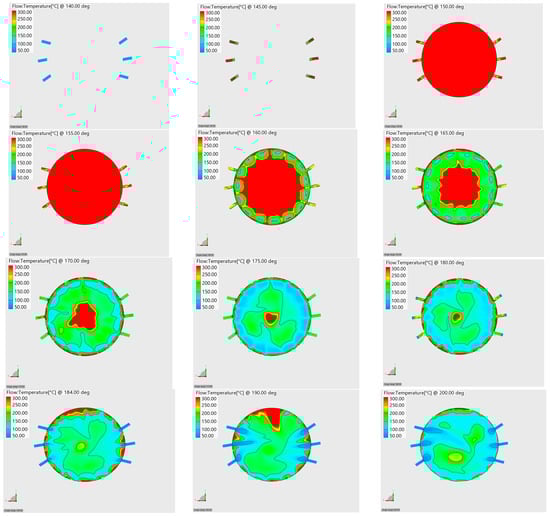
Figure A1.
plane cut +Z showing the temperature in the injector plane from 140 deg to 200 deg aTDC.
Figure A1.
plane cut +Z showing the temperature in the injector plane from 140 deg to 200 deg aTDC.
References
- Oliveira, A.M.; Beswick, R.R.; Yan, Y. A green hydrogen economy for a renewable energy society. Curr. Opin. Chem. Eng. 2021, 33, 100701. [Google Scholar] [CrossRef]
- Bockris, J.O. A Hydrogen Economy. Science 1972, 176, 1323. [Google Scholar] [CrossRef] [PubMed]
- Hosseini, S.E.; Butler, B. An overview of development and challenges in hydrogen powered vehicles. Int. J. Green Energy 2020, 17, 13–37. [Google Scholar] [CrossRef]
- Millo, F.; Piano, A.; Rolando, L.; Accurso, F.; Gullino, F.; Roggio, S.; Bianco, A.; Pesce, F.; Vassallo, A.; Rossi, R.; et al. Synergetic Application of Zero-, One-, and Three-Dimensional Computational Fluid Dynamics Approaches for Hydrogen-Fuelled Spark Ignition Engine Simulation. SAE Int. J. Engines 2021, 15, 561–580. [Google Scholar] [CrossRef]
- Verhelst, S.; Wallner, T. Hydrogen-fueled internal combustion engines. Prog. Energy Combust. Sci. 2009, 35, 490–527. [Google Scholar] [CrossRef]
- Ji, C.; Hong, C.; Wang, S.; Xin, G.; Meng, H.; Yang, J.; Qiang, Y. Evaluation of the variable valve timing strategy in a direct-injection hydrogen engine with the Miller cycle under lean conditions. Fuel 2023, 343, 127932. [Google Scholar] [CrossRef]
- Ma, D.-S.; Sun, Z. Progress on the studies about NOx emission in PFI-H2ICE. Int. J. Hydrogen Energy 2020, 45, 10580–10591. [Google Scholar] [CrossRef]
- Azeem, N.; Beatrice, C.; Vassallo, A.; Pesce, F.; Davide, G.; Guido, C.; Rossi, R.; Azeem, N.; Beatrice, C.; Vassallo, A.; et al. Comparative Analysis of Different Methodologies to Calculate Lambda (λ) Based on Extensive and Systemic Experimentation on a Hydrogen Internal Combustion Engine; SAE International: Warrendale, PA, USA, 2023. [Google Scholar] [CrossRef]
- Stępień, Z. A Comprehensive Overview of Hydrogen-Fueled Internal Combustion Engines: Achievements and Future Challenges. Energies 2021, 14, 6504. [Google Scholar] [CrossRef]
- Bao, L.-Z.; Sun, B.-G.; Luo, Q.-H.; Li, J.-C.; Qian, D.-C.; Ma, H.-Y.; Guo, Y.-J. Development of a turbocharged direct-injection hydrogen engine to achieve clean, efficient, and high-power performance. Fuel 2022, 324, 124713. [Google Scholar] [CrossRef]
- Bao, L.-Z.; Sun, B.-G.; Luo, Q.-H. Optimal control strategy of the turbocharged direct-injection hydrogen engine to achieve near-zero emissions with large power and high brake thermal efficiency. Fuel 2022, 325, 124913. [Google Scholar] [CrossRef]
- Blair, G. Design and Simulation of Two-Stroke Engines; SAE International: Warrendale, PA, USA, 1996; ISBN 978-0-7680-2516-3. [Google Scholar]
- Ma, F.; Zhao, C.; Zhang, S. Study on Dual-spark Ignition Rapid Combustion Characteristic of Opposed-piston Two-stroke GDI Engine. Energy Procedia 2014, 61, 722–725. [Google Scholar] [CrossRef]
- Flint, M.L.S.; Pirault, J.-P. Opposed Piston Engines: Evolution, Use, and Future Applications; SAE International: Warrendale, PA, USA, 2009; ISBN 978-0-7680-2175-2. [Google Scholar]
- Naik, S.; Johnson, D.; Fromm, L.; Koszewnik, J.; Redon, F.; Regner, G.; Abani, N. Achieving Bharat Stage VI Emissions Regulations while Improving Fuel Economy with the Opposed-Piston Engine. SAE Int. J. Engines 2017, 10, 17–26. [Google Scholar] [CrossRef]
- Herold, R.; Wahl, M.; Regner, G.; Lemke, J.; Foster, D.E. Thermodynamic Benefits of Opposed-Piston Two-Stroke Engines; SAE Technical Paper 2011-01-2216; SAE International: Warrendale, PA, USA, 2011. [Google Scholar] [CrossRef]
- Regner, G.; Johnson, D.; Koszewnik, J.; Dion, E.; Redon, F.; Fromm, L. Modernizing the Opposed Piston, Two Stroke Engine for Clean, Efficient Transportation; SAE Technical Paper 2013-26-0114; SAE International: Warrendale, PA, USA, 2013. [Google Scholar] [CrossRef]
- Communication from The Commission to The European Parliament, The European Council, The Council, The European Economic and Social Committee and The Committee of the Regions. The European Green Deal. 2019. Available online: https://eur-lex.europa.eu/legal-content/EN/TXT/?uri=COM%3A2019%3A640%3AFIN (accessed on 18 August 2024).
- Salvi, A.; Redon, F.; Youngren, D.; Fromm, L. Low CO2, Ultralow NOx Heavy Duty Diesel Engine: Experimental Results; SAE Technical Paper 2022-01-0426; SAE International: Warrendale, PA, USA, 2022. [Google Scholar] [CrossRef]
- Volza, A.; Scrignoli, F.; Caprioli, S.; Mattarelli, E.; Rinaldini, C.A. Exploring the Potential of Hydrogen Opposed Piston Engines for Single-Cylinder Electric Generators: A Computational Study; SAE Technical Paper 2023-24–0128; SAE International: Capri, Italy, 2023. [Google Scholar] [CrossRef]
- Mattarelli, E.; Cantore, G.; Rinaldini, C.A.; Savioli, T. Combustion System Development of an Opposed Piston 2-Stroke Diesel Engine. Energy Procedia 2017, 126, 1003–1010. [Google Scholar] [CrossRef]
- Mattarelli, E.; Rinaldini, C.; Savioli, T.; Cantore, G.; Warey, A.; Potter, M.; Gopalakrishnan, V.; Balestrino, S. Scavenge Ports Ooptimization of a 2-Stroke Opposed Piston Diesel Engine; SAE Technical Paper 2017-24–0167; SAE International: Warrendale, PA, USA, 2017. [Google Scholar] [CrossRef]
- Lohse-Busch, H.; Stutenberg, K.; Duoba, M.; Iliev, S. Technology Assessment of a Fuel Cell Vehicle: 2017 Toyota Mirai. Available online: https://www.anl.gov/argonne-scientific-publications/pub/144774 (accessed on 18 August 2024).
- Gamma Technologies. GT-SUITE Engine Performance Manual v2022. 2022. Available online: https://www.gtisoft.com/gamma_news/gt-suite-v2022-2-released/ (accessed on 18 August 2024).
- AVL. AVL FIRETM M. Available online: https://www.avl.com/en/simulation-solutions/software-offering/simulation-tools-a-z/avl-fire-m (accessed on 18 August 2024).
- O’Donnell, P.C.; Gainey, B.; Vorwerk, E.; Prucka, R.; Lawler, B.; Huo, M.; Salvi, A. An Investigation into the Effects of Swirl on the Performance and Emissions of an Opposed-Piston Two-Stroke Engine using Large Eddy Simulations; SAE Technical Paper 2022-01–1039; SAE International: Warrendale, PA, USA, 2022. [Google Scholar] [CrossRef]
- O’Donnell, P.C.; Gandolfo, J.; Gainey, B.; Vorwerk, E.; Prucka, R.; Filipi, Z.; Lawler, B.; Hessel, R.; Kokjohn, S.; Huo, M.; et al. Effects of Port Angle on Scavenging of an Opposed Piston Two-Stroke Engine; SAE Technical Paper 2022-01–0590; SAE International: Warrendale, PA, USA, 2022. [Google Scholar] [CrossRef]
- Vorwerk, E.; O’Donnell, P.; Robertson, D.; Prucka, R.; Lawler, B.; Redon, F.; Huo, M.; Salvi, A. Evaluation of electrified airpath configurations for an opposed piston two stroke compression ignition architecture. Int. J. Powertrains 2024, 13, 19–54. [Google Scholar] [CrossRef]


Disclaimer/Publisher’s Note: The statements, opinions and data contained in all publications are solely those of the individual author(s) and contributor(s) and not of MDPI and/or the editor(s). MDPI and/or the editor(s) disclaim responsibility for any injury to people or property resulting from any ideas, methods, instructions or products referred to in the content. |
© 2024 by the authors. Licensee MDPI, Basel, Switzerland. This article is an open access article distributed under the terms and conditions of the Creative Commons Attribution (CC BY) license (https://creativecommons.org/licenses/by/4.0/).