Abstract
One of the challenges in energy supply for isolated power systems is maintaining a steady balance between generated and consumed energy. The application of energy storage systems and flexible energy sources is the most preferable approach for these systems. Small- and medium-sized nuclear power plants are promising, carbon-free options for energy supply to isolated power systems. However, these plants have low maneuverability. To solve this problem, this article discusses the use of a thermal accumulator using a phase change material (solar salt) to heat feedwater. Tubes with longitudinal fins are used to intensify heat transfer in the storage system. This paper presents a method for calculating heat transfer along the entire heat exchange surface of such an accumulator. A series of 2D simulations were conducted to study the solidification process of solar salt around a heat exchange tube at various temperatures on the inner wall surface. The regression dependences of heat transfer on the temperature of the inner surface of the wall and the thickness of the solid PCM layer were determined. Using the presented method and the obtained regression dependencies, we determined the time graphs of the temperature change in the heat transfer fluid at the outlet of the accumulator during discharge. Based on the results presented, it was found that an accumulator with 72.7 tons of solar salt (dimensions: 6 × 3.71 × 2.15 m) can replace a high-pressure heater №1 at a low-power nuclear power plant (50 MW) during 3450 s.
1. Introduction
The development of remote territories of the Russian Federation has great potential for Russia and the global economy [1,2,3]. Enterprises for the extraction and processing of hydrocarbon and mineral resources are located in these territories [4,5,6]. Sustainable development is an important aspect of the development of these territories [7,8,9]. This is why scientific research is conducted to achieve an environmentally friendly, safe, and efficient energy supply for these enterprises [10,11,12].
Such industrial facilities are often located in isolated power systems, which presents several challenges for energy supply [13]. One of these challenges is uneven daily energy consumption under conditions of limited demand and limited maneuverability of energy sources [14]. This poses a threat to the quality of power supply to industrial facilities. This problem is exacerbated by the introduction of alternative energy sources [15,16]. At the same time, it is important to note that the quality of the power supply is crucial to the success of industrial processes [17,18].
Therefore, it is recommended to use power sources with good maneuverability and various storage systems for power supply in isolated power systems [19,20].
Low- and medium-power nuclear power plants are promising energy sources for isolated power systems [21,22]. This energy source offers several benefits, including low specific fuel costs, zero CO2 emissions, and long fuel cycles [23]. Almost all leading countries in the world are developing these types of nuclear power plants [24]. For example, Russia operates a low-power nuclear power plant on the icebreaker «Akademik Lomonosov» [25]. There is a project for a low-power stationary nuclear power plant that will provide power to cities and enterprises in remote areas [26]. However, nuclear power plants have significant maneuverability limitations due to the design, safety, and operating principles of nuclear reactors [27]. The low maneuverability of nuclear power plants is an obstacle to the active implementation of low- and medium-power nuclear power plants for the energy supply of isolated regions [28]. Thus, developing additional methods to increase the flexibility of nuclear plants is a priority task.
Several works describe solutions for introducing heat accumulators into nuclear power plant circuits to increase the maneuverability of nuclear power plants [29,30,31]. Heat accumulators can be used to store excess reactor heat during hours of minimum electricity demand and return the stored heat to the steam turbine cycle to generate additional electricity during peak hours [32,33,34]. The most preferred option is to use heat accumulators to replace high-pressure heaters (HPHs) [29,35].
The most promising direction in the field of heat storage is heat accumulators with phase change materials (PCMs) [36,37]. These devices use latent heat of melting/solidification and have high heat storage density. PCMs are efficient technologies that allow for storing heat in a limited temperature range [38]. The use of PCMs allows one to accumulate 5–14 times more heat than when storing heat only due to the heat capacity [39]. Depending on the temperature regime, organic compounds, crystalline hydrates, salts and eutectic salts, and metals are used as PCMs [40]. PCMs are used in various applications [41]: cooling systems [42], heat supply systems [43], structures of buildings [44], traditional coal-fired power plants [45], heat recovery systems in industry [46], technological processes [47], solar energy [48,49,50], and others.
A separate problem is the choice of PCM for a specific application. It is known that the temperature regime of the PCM (and its melting point) should be between the hot and cold heat transfer fluids. Positive qualities of PCMs include high heat of phase transition, high thermal conductivity, high density, high heat capacity, and low corrosion activity [44,51]. The ideal way to compare PCMs is the pairwise comparison method. In this method, candidates with the same parameters are selected, except for one [52]. However, this method is difficult to apply to PCM selection due to the limited number of PCMs. In practice, several PCMs with the required melting point are initially selected. Then, the final selection is made using the method of expert assessment, simple ranking, sum of weighted criteria, or another criterion [49,53].
One of the main challenges in actively implementing a heat accumulator with a PCM is the reduction in heat transfer from the PCM to the heat transfer fluid during the solidification of the PCM [54]. For this reason, it is necessary to have large heat transfer surfaces in order to efficiently utilize these types of accumulators. To solve this problem, it is recommended to intensify heat transfer from the PCM side. To achieve this, nanoparticles can be integrated into the PCM, or complex heat exchange surfaces can be used [55].
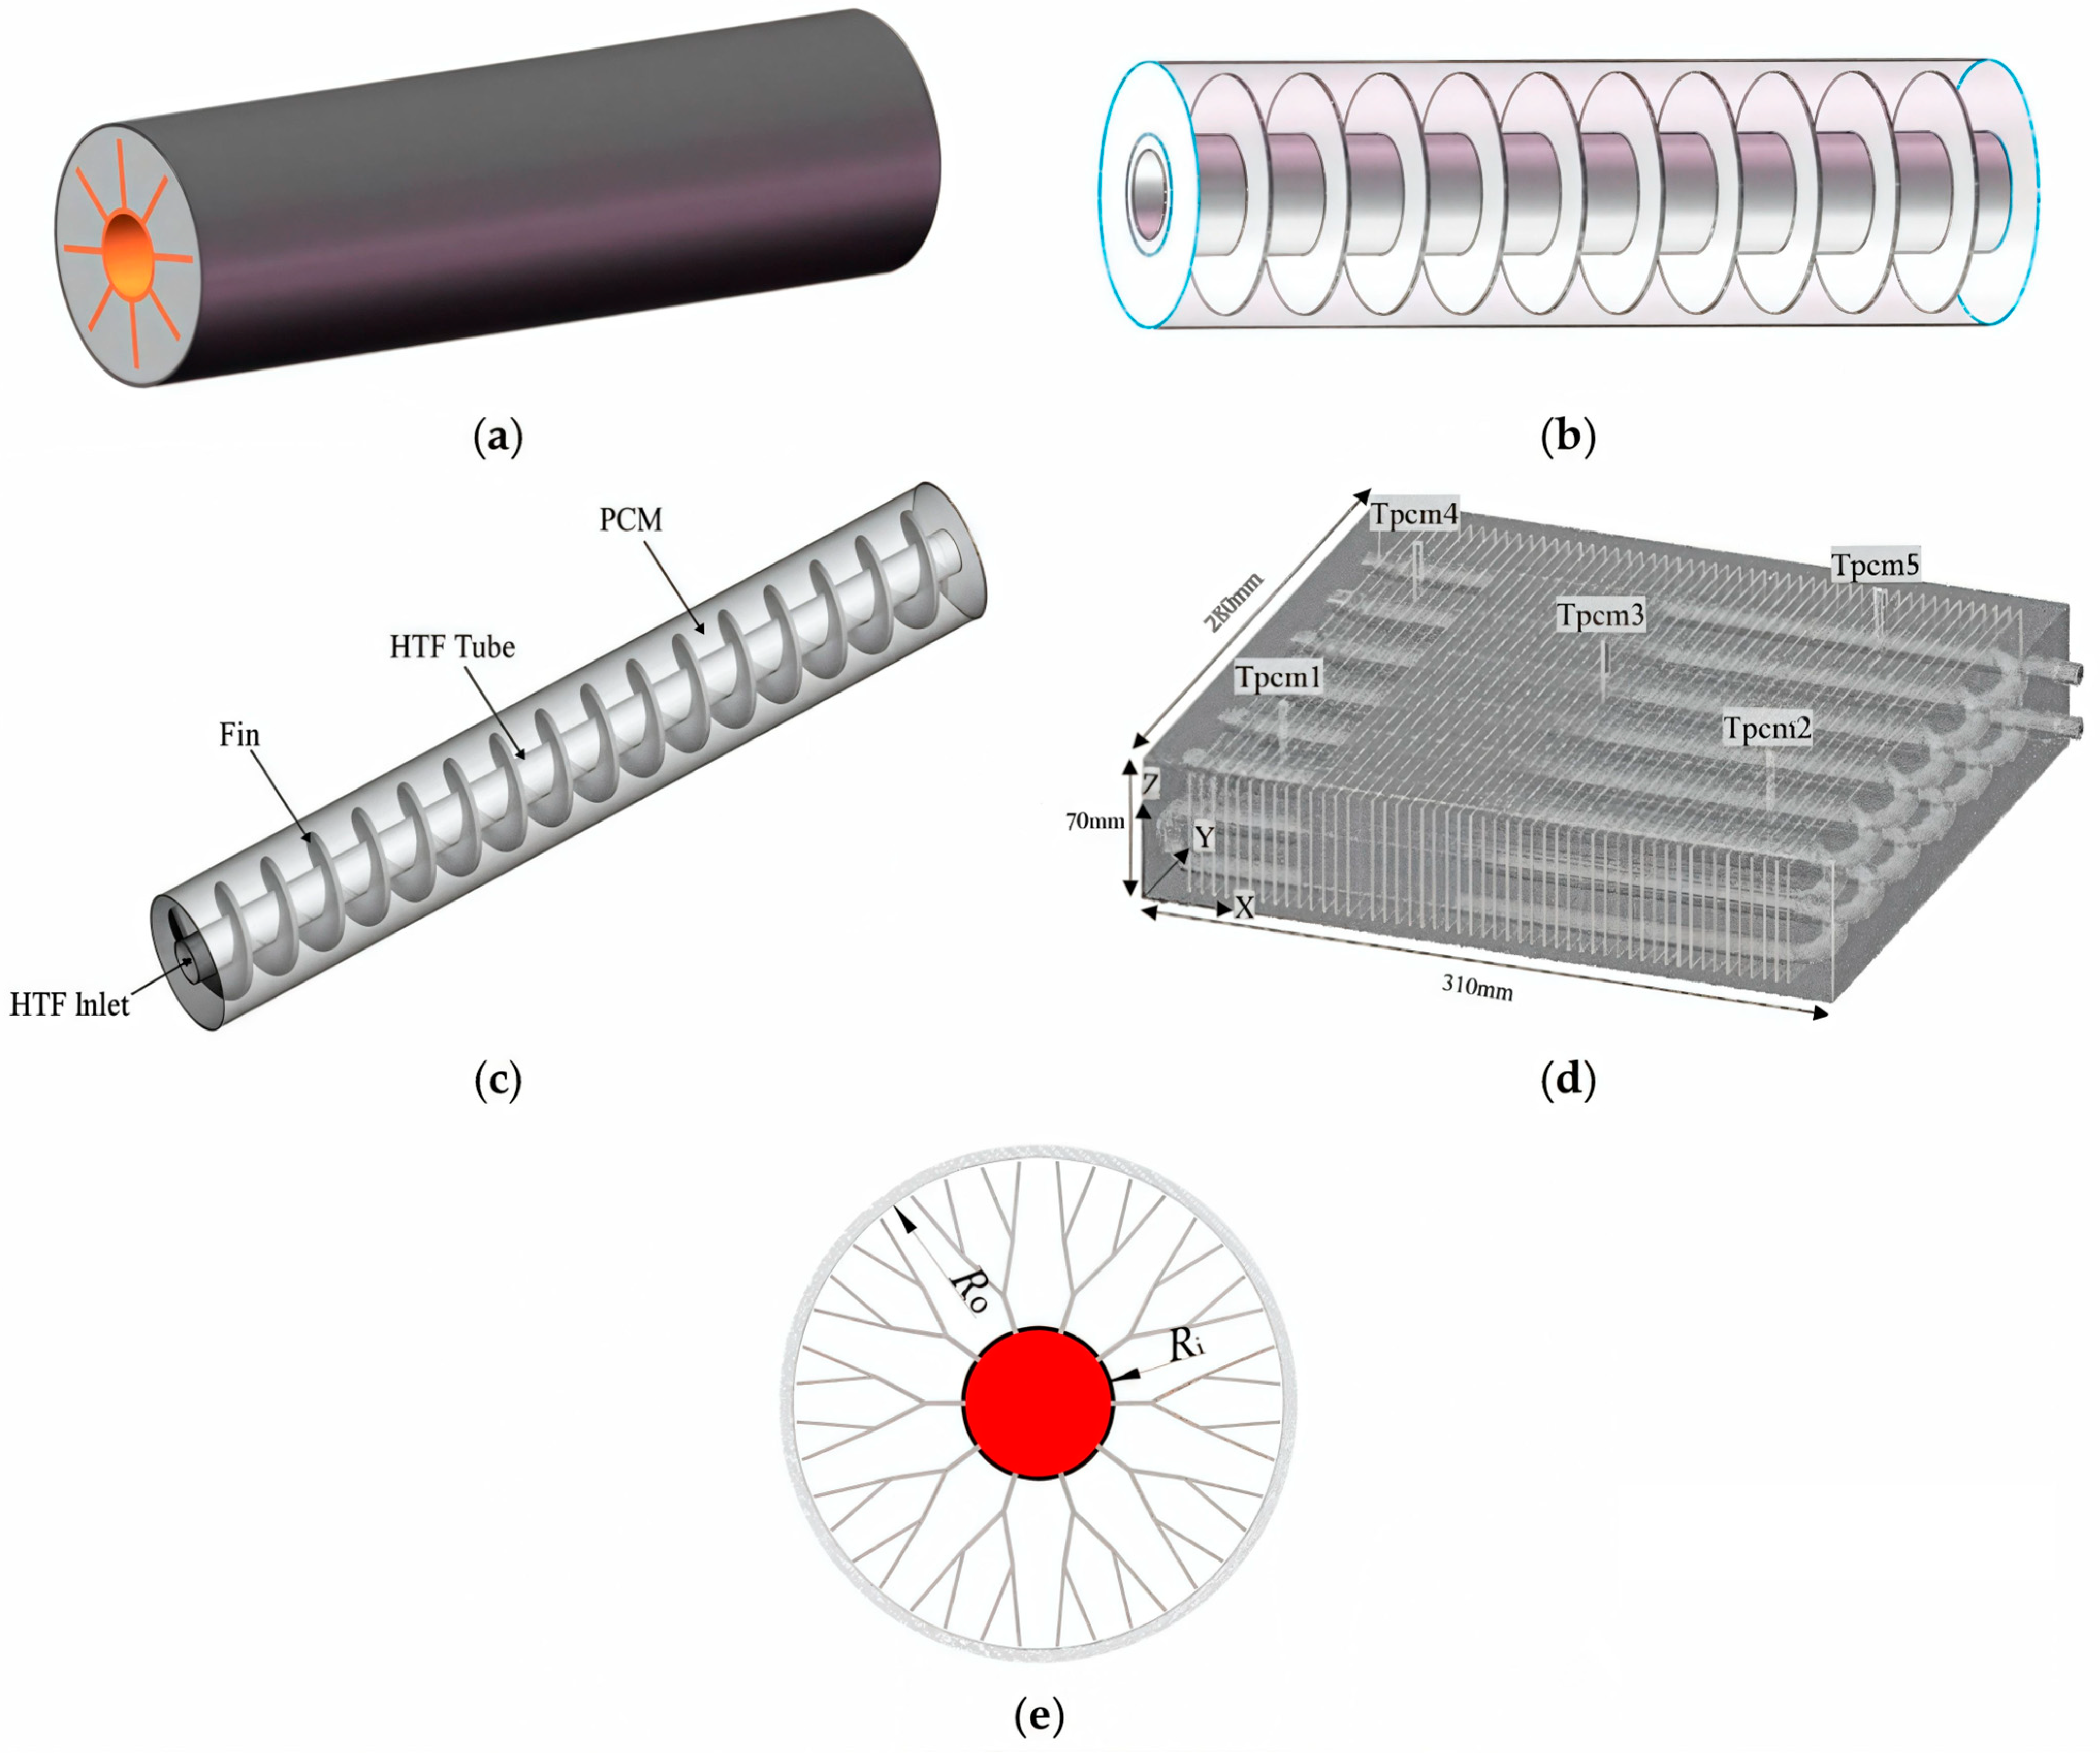
The literature presents various designs for heat exchange surfaces to intensify heat transfer in heat accumulators with PCMs [55,56,57]. Plate heat exchanger [58,59], helical-coil heat exchanger [60,61,62], circular (radial) fins [63,64], helical fins [65,66,67], longitudinal fins [68,69,70], Y- and V-shaped fins [71,72], and others [73] are used to intensify heat transfer. The use of these designs allows for significant increases in heat transfer between a PCM and heat transfer fluid significantly and reduces the time required for the melting/solidification of the PCM [74,75]. Various surface designs for efficient heat exchange with PCMs are shown in Figure 1.
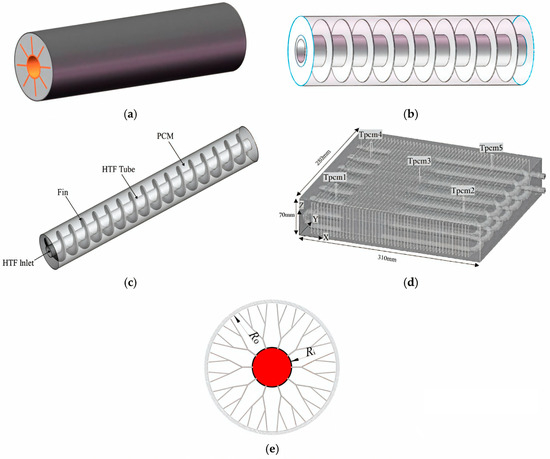
Figure 1.
Various heat exchange surfaces to intensify heat exchange in a heat accumulator with PCMs. (a) Rectangular fins; (b) annular fins; (c) spiral fins; (d) plate fins; (e) dendritic fins [56].
The problem of using heat exchange intensifying structures is to reduce the area of the PCM and reduce convective heat transfer within the PCM [76]. Another problem with these heat transfer surfaces is the safety of operation in terms of mechanical strength, as mechanical damage to the surface can occur due to thermal expansion and changes in the density of the PCM during melting/solidification [77,78]. The most vulnerable areas are the junctions of individual elements, especially in large-scale heat accumulators [79,80]. Therefore, an optimal size and design for each application are needed, and a further increase is impractical.
The authors of many studies conducted a comparison of different heat exchange surfaces for accumulators using PCMs. In [81], the authors compared annular and longitudinal fins with similar masses. They concluded that the longitudinal finned tube demonstrated better charging characteristics, but there were no significant differences in the discharge process. The study [82] compared various spiral heat transfer surfaces and combined them with spiral fins. This reduced the melting and solidification times by 44% and 21%, respectively, compared to straight cylindrical pipes. The comparison of heat transfer was presented for various fin designs (straight, spiral, and annular) in the work [83]. The melting rate increased by 30–37%, compared to straight cylindrical pipes, for all fin types. The authors of [84] reported an increase in the heat flux density of 32–45% during the melting/solidification process using longitudinal fins. Other authors [85,86,87] reported on the effectiveness of applying various heat transfer intensification designs in accumulators with PCMs. All of these designs have a significant positive effect, but it is impossible to identify a single best surface for heat transfer intensification.
Longitudinal fins seem to be the most promising solution for enhancing heat transfer in the current study. These fins increase the overall rigidity of the structure, which is a positive feature for large-scale accumulators with PCMs [77]. Many researchers reported on the effectiveness of dendritic longitudinal fins [71,83,88] (Figure 1e). However, the use of dendritic fins is associated with an increase in the number of individual structural elements and connecting joints [89]. This complicates and increases the cost of construction, as well as increasing the risk of violation of the mechanical strength of the structure. Reliability issues are a topic of concern in equipment in the nuclear industry, so this paper considers intensification through simple longitudinal fins. This solution is effective, reliable, and easy to implement [90]. It is possible to create such a design by welding standard round pipes and standard metal strips together.
The heat exchange in a heat accumulator using PCMs is a non-stationary heat exchange [91]. Therefore, classical methods for calculating heat exchange surfaces do not apply to heat accumulators with PCMs. The operating time of a heat accumulator (during a charge/discharge cycle) depends on the amount of PCM and the heat exchange surface area. Therefore, it is necessary to determine the amount of PCM and heat exchange surface area for each specific use case. Designing a PCM-based accumulator for a specific application is not a standard task, and it may be beneficial to develop a custom design methodology for each case [92].
To calculate the heat exchange surface area and the amount of PCM required for a specific application, it is necessary to evaluate the heat transfer across the entire heat exchange surface of the heat accumulator at every moment in time.
Calculating the heat transfer power during a non-stationary phase transition is a challenging task. The finite element method is widely used to simulate heat transfer during the melting and solidification processes of PCMs. Specialized software is available for this purpose, such as ANSYS, which produces accurate results that match experimental data [93].
The main challenge of finite element modeling is the vast number of computational operations required [94]. In the modeling process, the area to be simulated must be divided into small, elementary cells. For example, if we want to model an area with a volume of 1 cubic meter, it will require between 8,000,000 and 1,000,000,000 cells. If we simulate a high-power accumulator with a power of several MW and a volume of several tens m3 [94], then it will require a significant amount of computing power and time [95,96].
It is possible to significantly reduce the number of calculations using 2D modeling [95]. However, 2D simulation of a heat exchange surface alone does not allow for an accurate estimation of the dimensions of large heat accumulators with long heat exchange surfaces. This is because it is not possible to know the law of distribution of temperatures of heat transfer fluid or the law of density distribution of heat flux along the length of a heat exchanger at any given time in advance.
The results of two-dimensional finite element modeling of heat transfer in the cross sections of a heat exchange surface can be used to create a surrogate model for heat transfer in a thermal accumulator with a PCM. This approach involves defining general heat transfer equations in which the heat flux density depends on the temperature of the heat transfer fluid and the state parameters of the PCM surrounding the heat exchange surface area. Then, these equations can be applied to the entire accumulator, which is considered a set of sequentially arranged sections. For each heat transfer section, the dependencies of heat transfer obtained will be valid. A similar method is described in [96,97] for simulating heat transfer in heat accumulators using a PCM. The use of surrogate modeling for heat transfer in an accumulator with a PCM allows for a reduction in the number of calculations by a factor of 10–50 compared to finite element modeling [96].
This study presents a new method for calculating the heat transfer surface and the amount of PCM for a high-power heat accumulator, namely, for an accumulator used in a nuclear power plant. The method uses surrogate modeling to calculate heat transfer over the entire heat transfer surface of the accumulator. Based on 2D simulations, statistical dependencies of heat transfer on the temperature at the inner wall and parameters in the PCM region are determined. These dependencies are then interpreted for each section of the heat exchange surface in the heat accumulator at each time point.
The presented method will allow us to evaluate the heat transfer along the long surface of the heat accumulator with the PCM and avoid three-dimensional modeling of a large-sized heat accumulator, which requires colossal computing capacities and operations.
The current work contains five subsections on research methods in Section 2 and six subsections on results in Section 3.
Section 2.1 describes the case of heat accumulator application. Section 2.2 describes topological optimization of heat transfer design. Section 2.3 presents a new method developed by authors for calculating heat transfer along the entire length of the heat exchange surface in heat accumulators with PCMs using a surrogate heat transfer model. Section 2.4 describes a simulation using ANSYS FLUENT to determine general heat transfer dependencies used in the method described in Section 2.3. Section 2.5 describes the conduct of the experimental study to verify the adequacy of the simulation.
Section 3.1 presents the results of a grid-independence study in ANSYS FLUENT. Section 3.2 presents the results from experimental verification of the modeling in ANSYS FLUENT. Section 3.3 presents the topological optimization results for choosing the best design for the heat transfer surface. Section 3.4 presents the results of modeling heat transfer at different expected temperatures of the heat exchange wall, which are used to determine the general heat transfer dependencies for the surrogate heat transfer model described in Section 2.3. Section 3.5 presents the modeling results for heat transfer along the entire length of heat exchange surfaces to estimate the size of the accumulator and the amount of PCM required for the application. Section 3.6 presents verification–comparison results of general heat transfer relationships used in the method described in Section 2.3 and modeling results in ANSYS FLUENT (Student version 2021 R2).
2. Materials and Methods
2.1. Method of Application of the Heat Accumulator with a PCM at a Low-Power Nuclear Power Plant
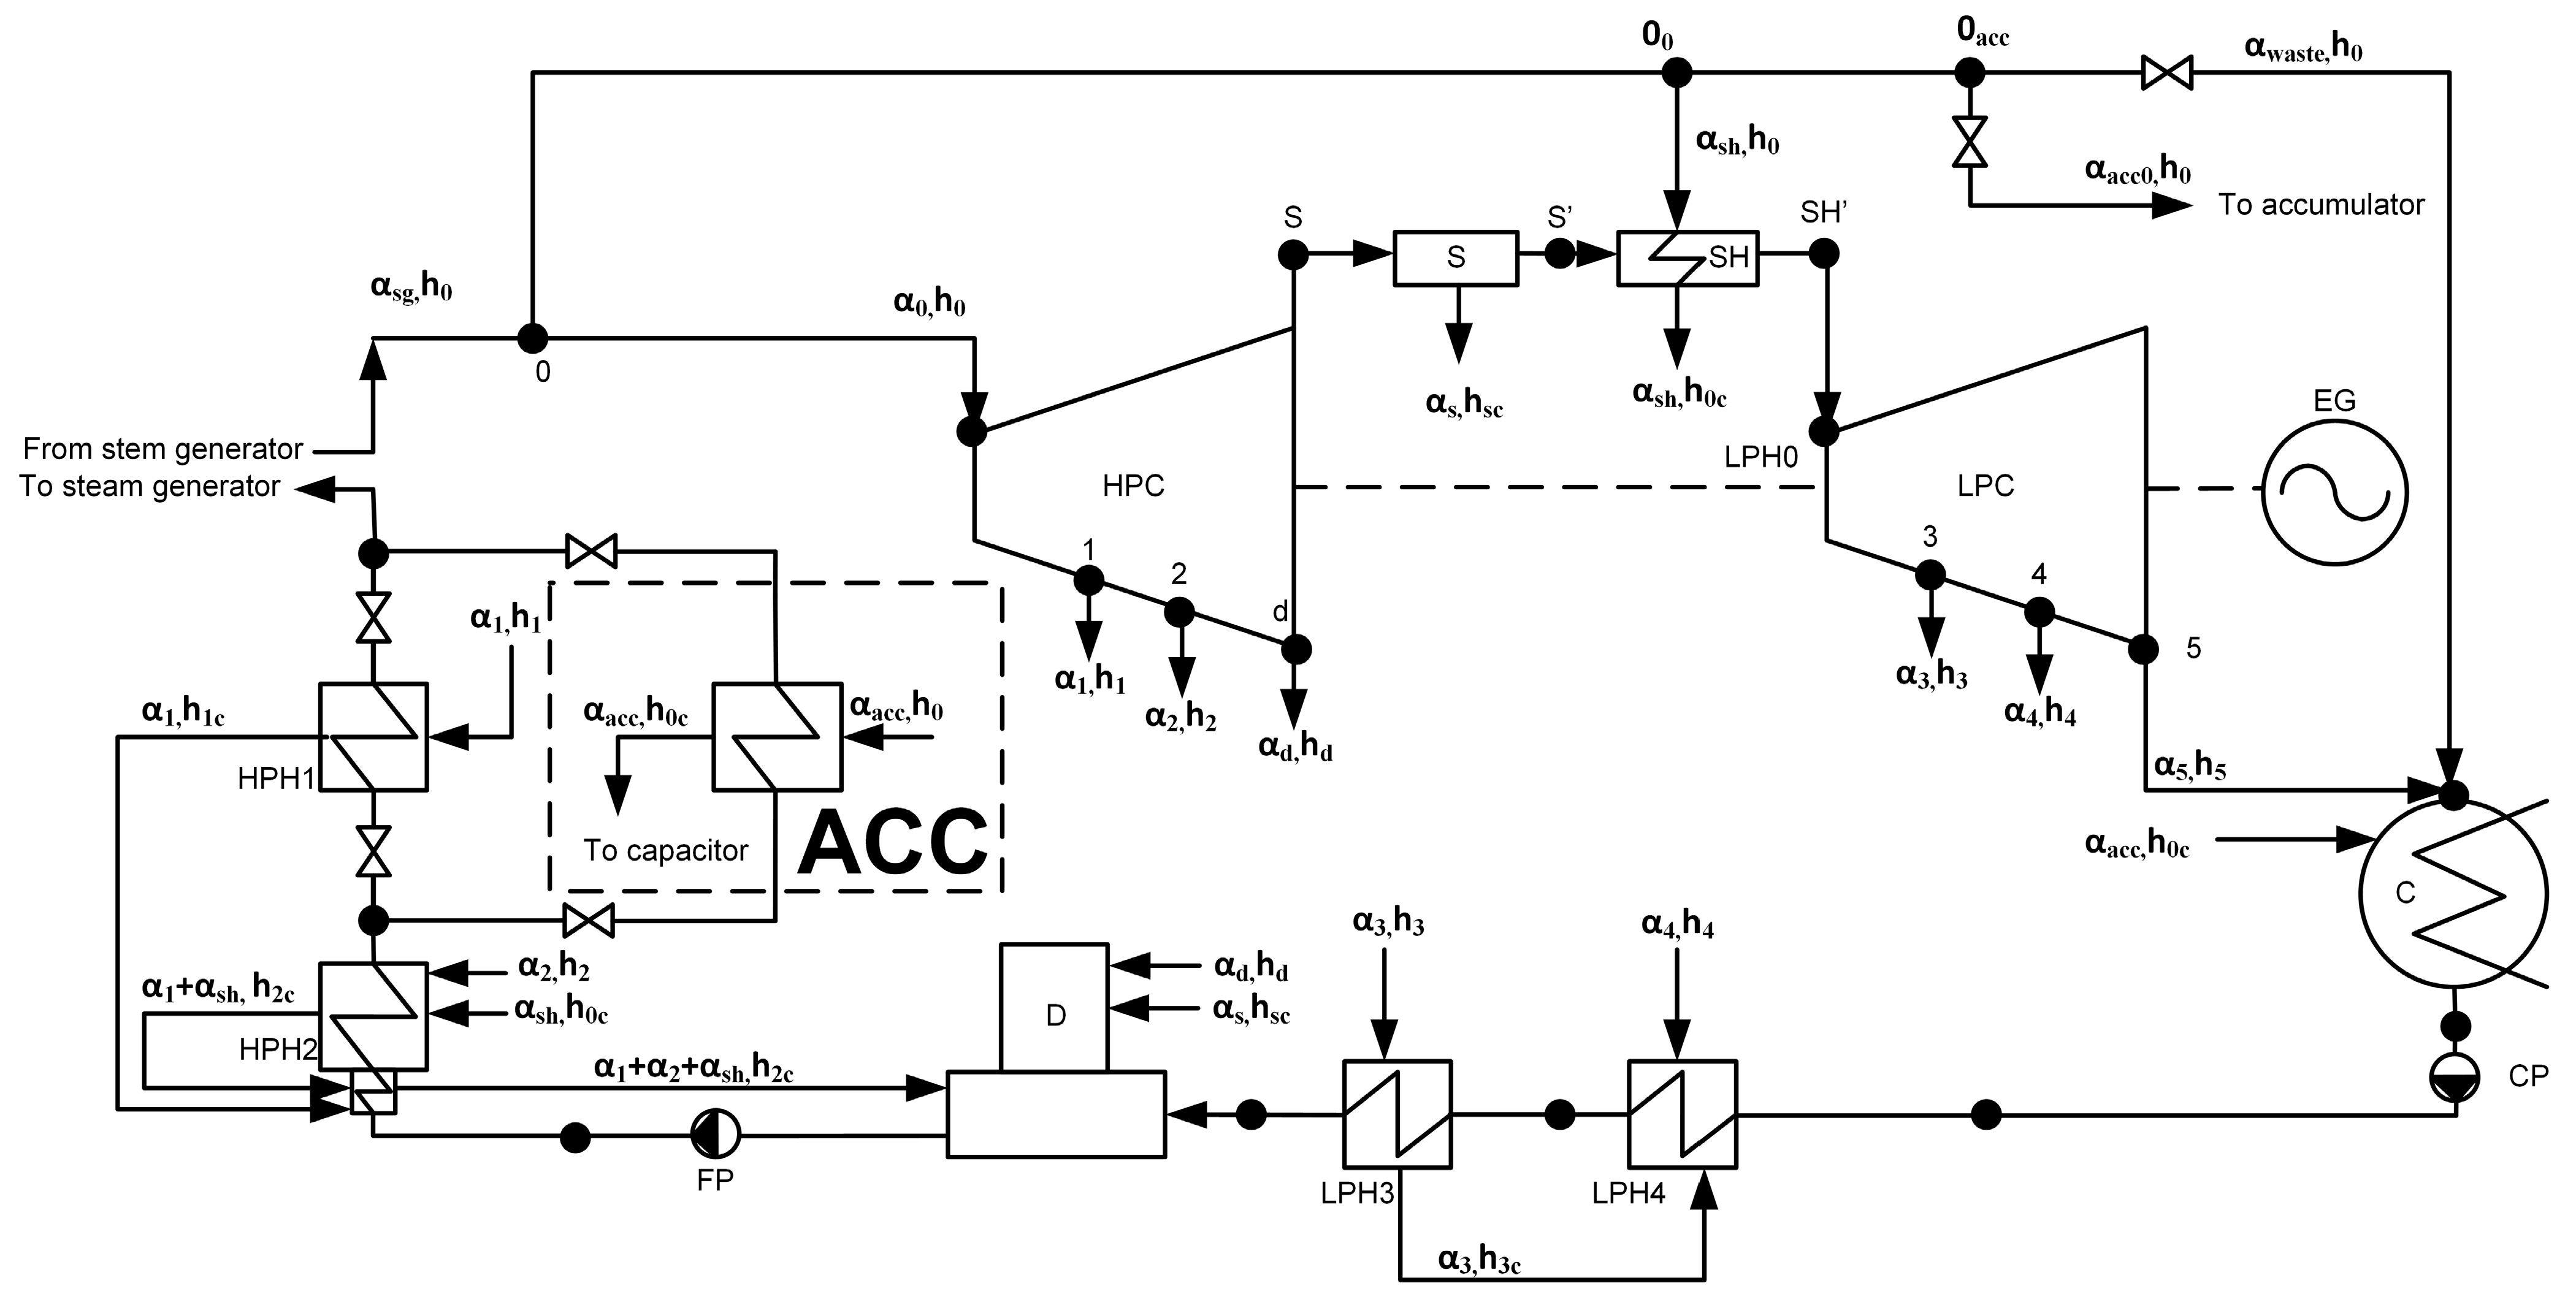
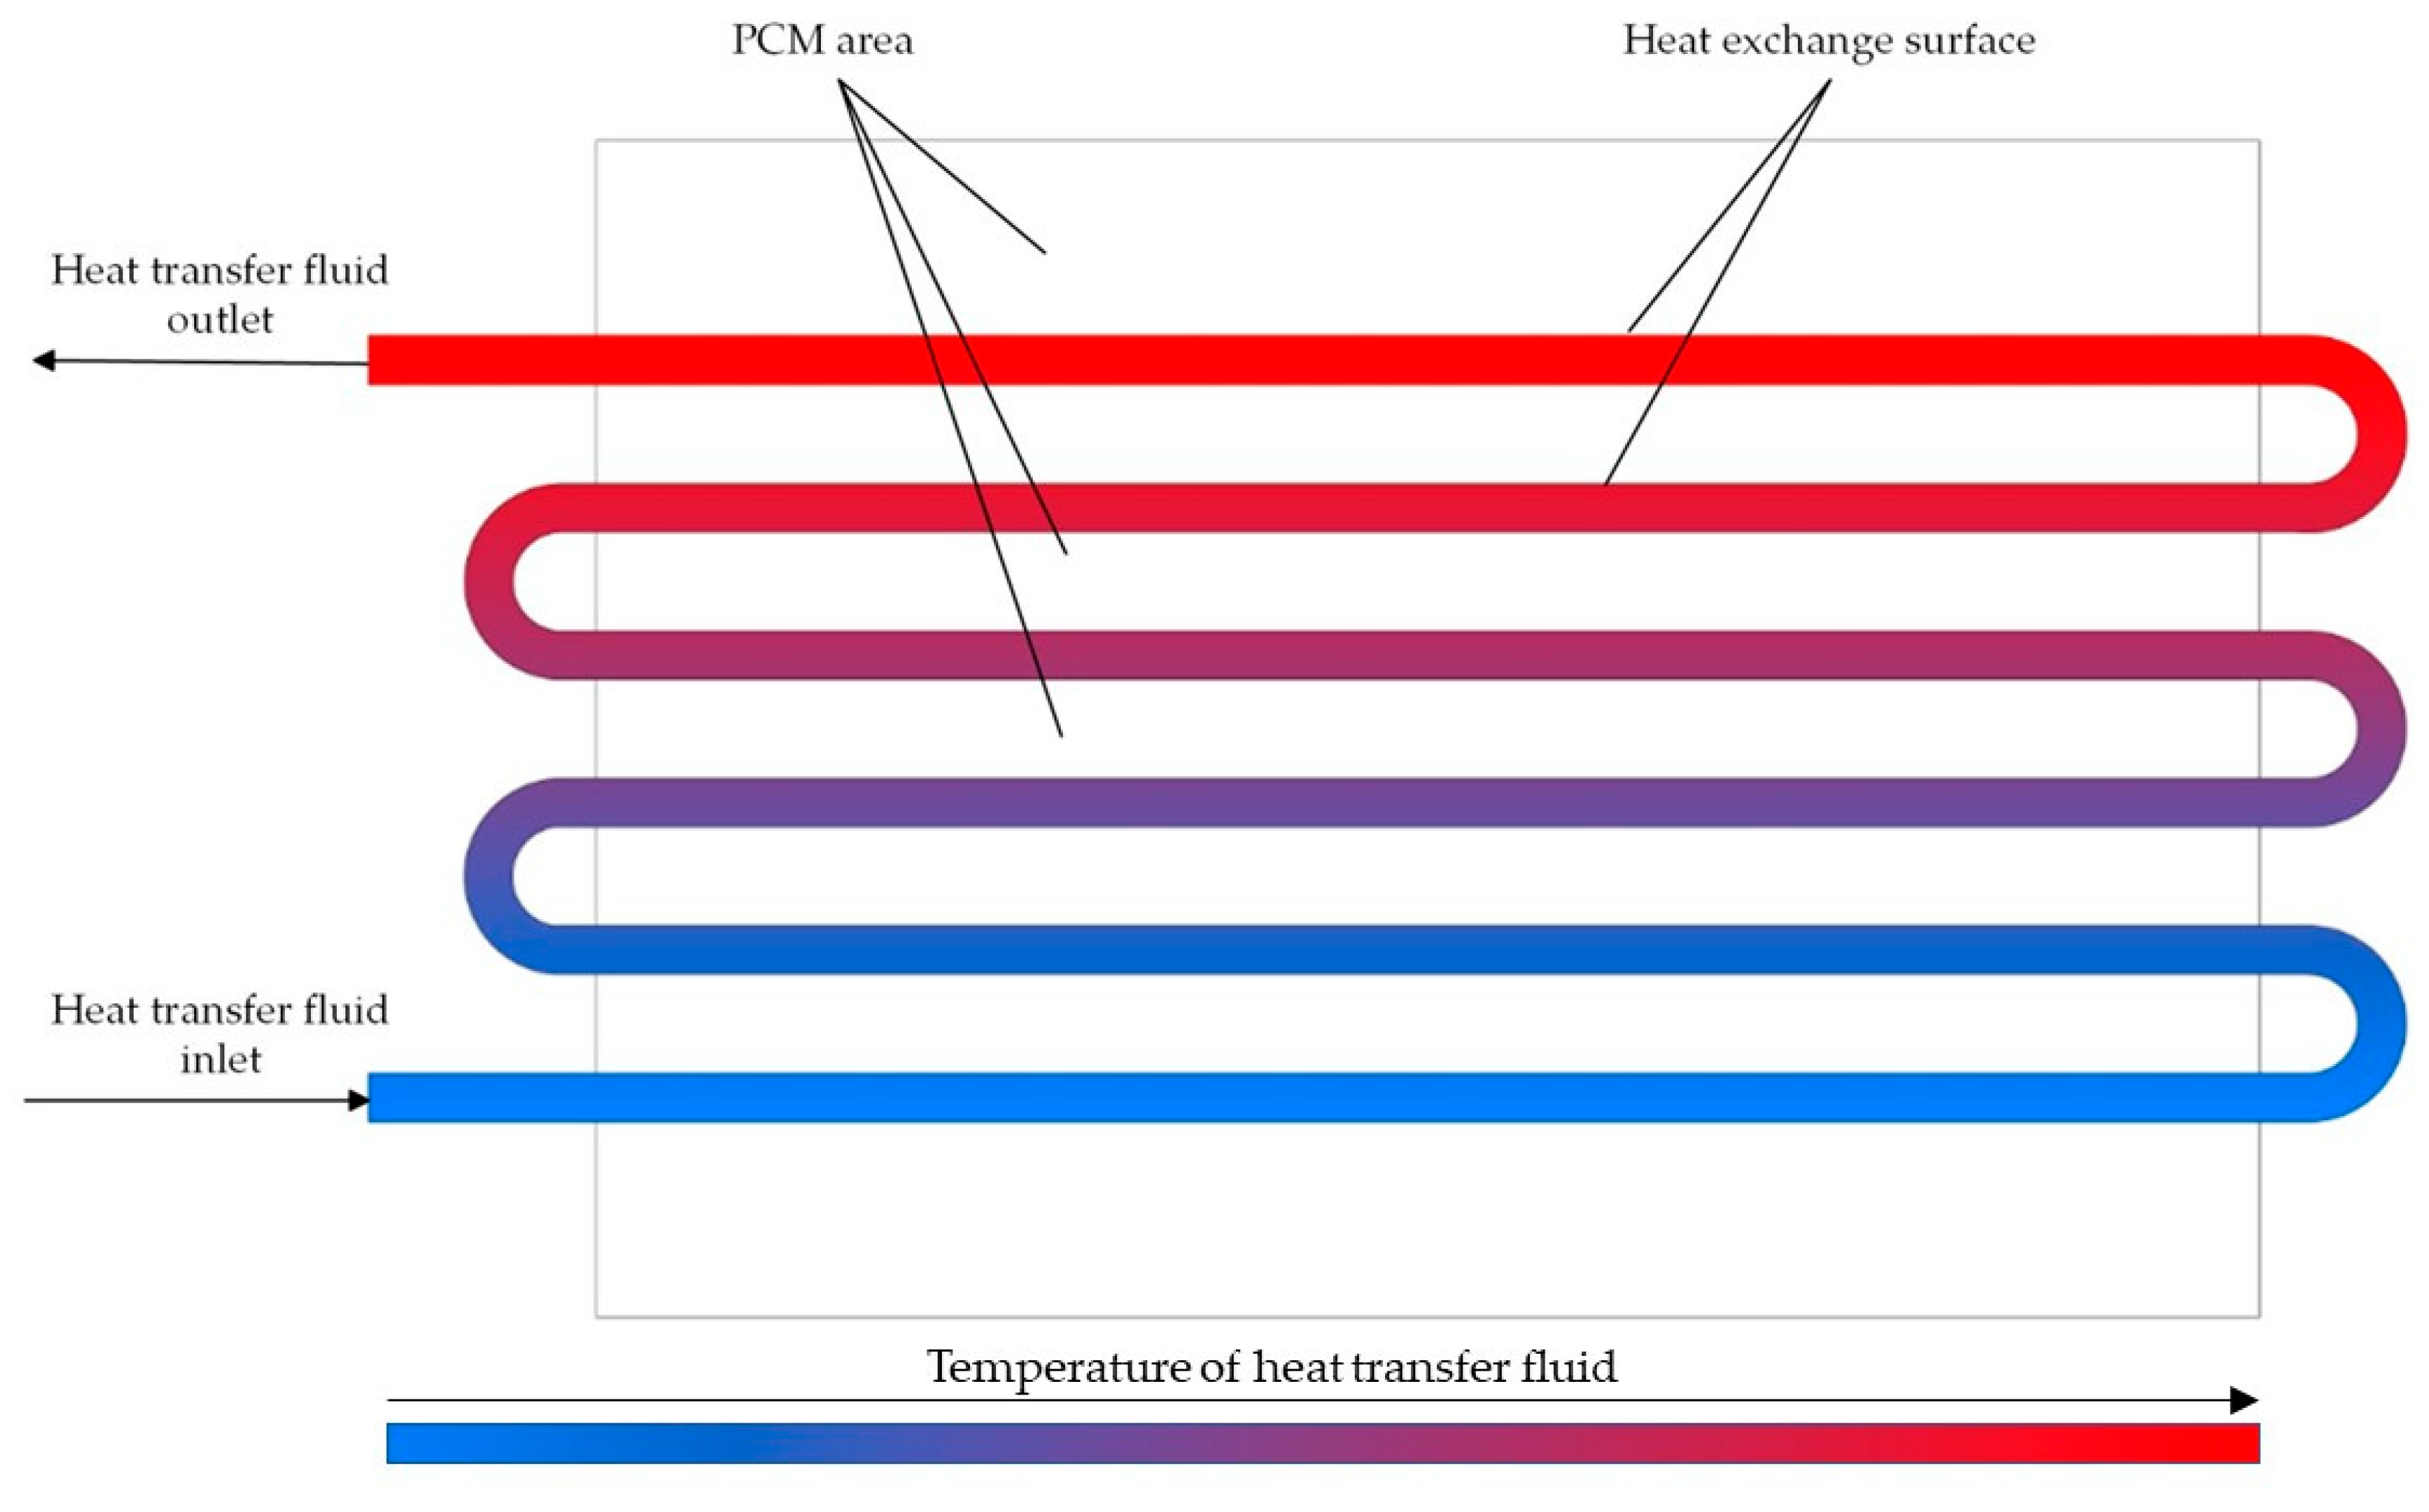
In the previous work [98], we considered the method of using a heat accumulator with a PCM in low-power nuclear power plants. The schematic diagram of a low-power nuclear power plant with a heat accumulator with a PCM is shown in Figure 2. The heat exchange surface of the accumulator is a coil (Figure 3). The area between the tubes is filled with a PCM. In [98], solar salt was chosen as the PCM using the weighted sum method. The thermophysical properties of the solar salt are presented in Table 1.
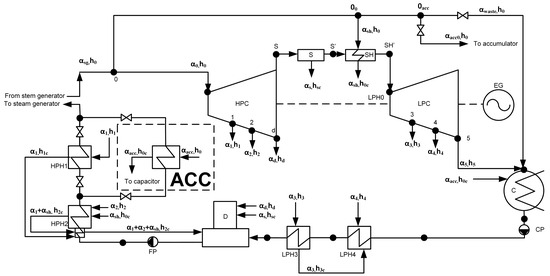
Figure 2.
The thermal scheme of a low-power nuclear power plant with a heat accumulator. HPC—high-pressure cylinder, LPC—low-pressure cylinder, ACC—heat accumulator; D—deaerator, HPH—high-pressure heater; LPH—low-pressure heater; S—separator; SH—superheater; C—condenser; FP—feed pump; CP—condensate pump; EG—electric generator; h is the enthalpy; α is the proportion of the flow rate; indices: 0—live steam; sg—steam generator; 1—on HPH 1; 2—on HPH 2; d—to the deaerator; 3—on LPH 3; 4—on LPH 4, 5—to condenser; s—from the separator; sh—to/from superheater; c—condensate; acc—to the heat accumulator, waste—waste steam [98].
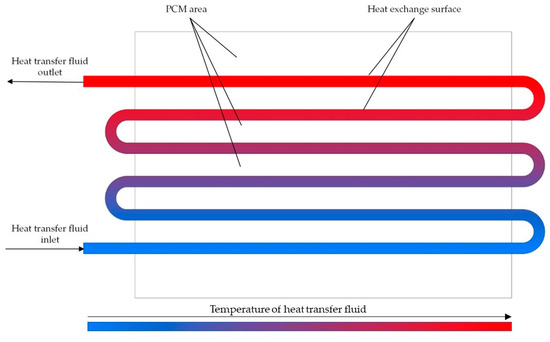
Figure 3.
The heat accumulator with coil heat exchange surface.

Table 1.
The thermophysical properties of the solar salt [98].
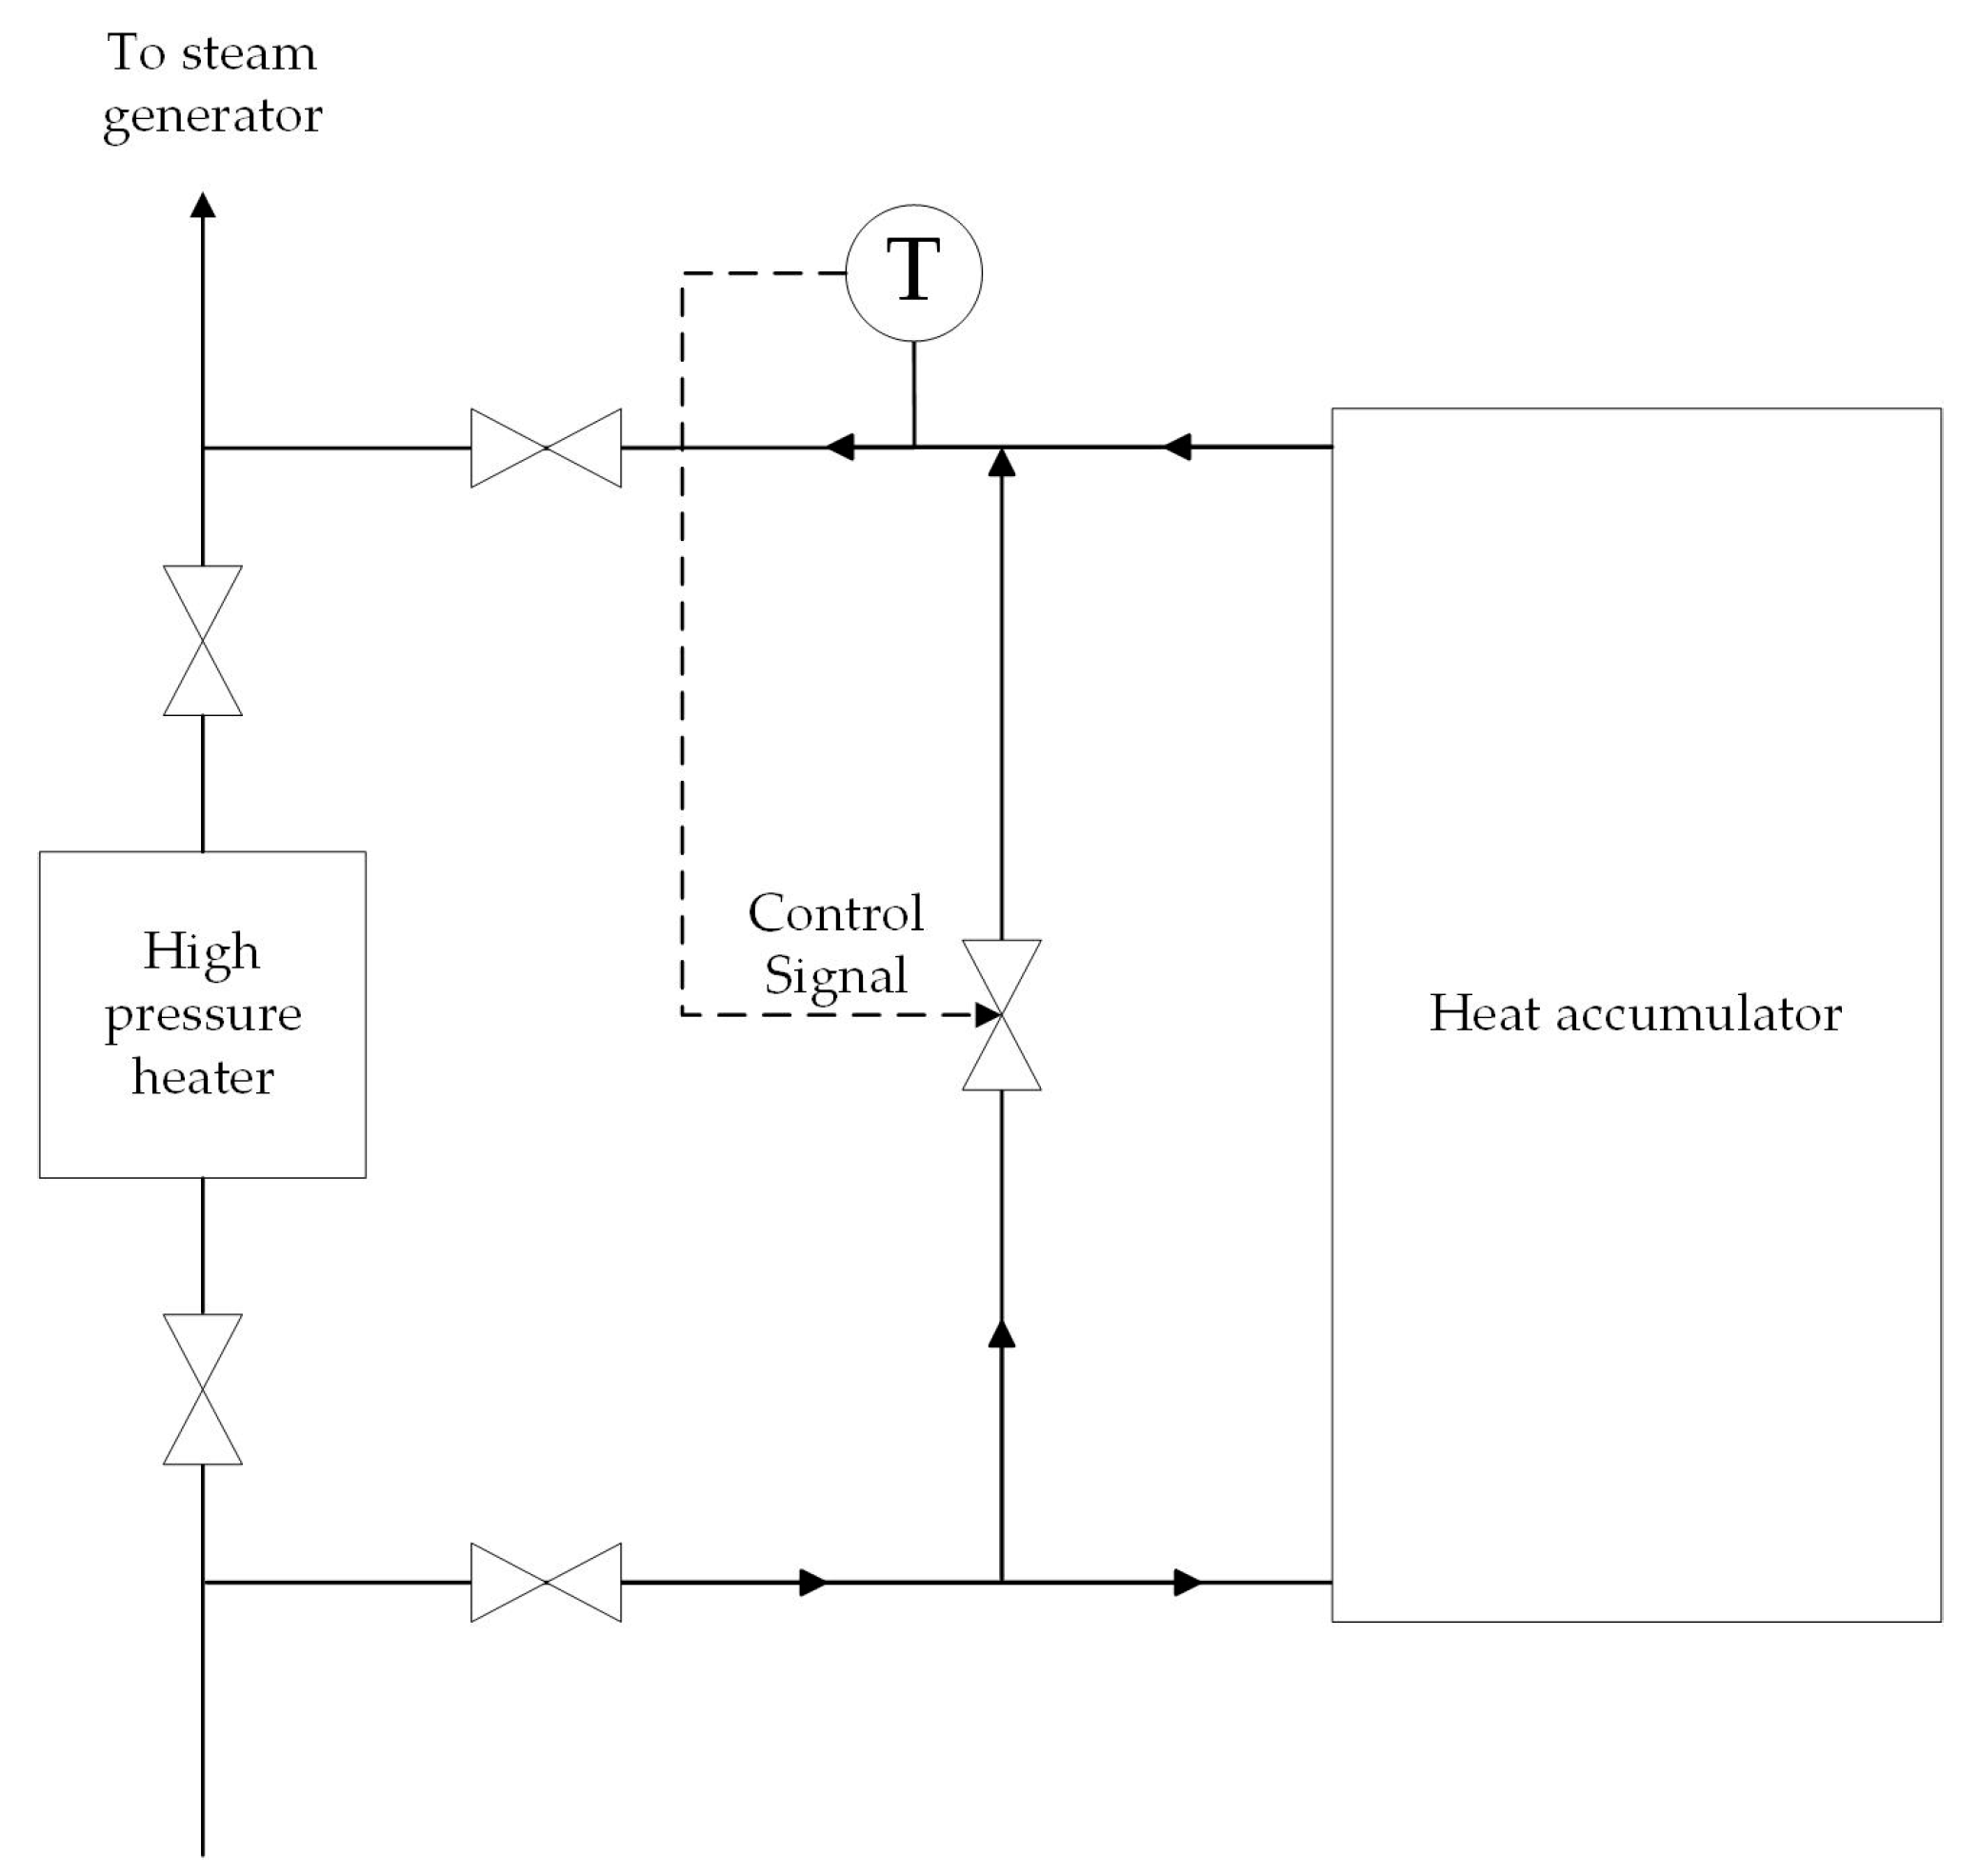
The heat accumulator operates in discharge mode during the hours of maximum electricity demand. During this time, regenerative extraction № 1 from the high-pressure cylinder (HPC) to the high-pressure heater № 1 is turned off. The electric power of the turbine unit is increased by increasing the steam flow through the turbine sections after regenerative extraction № 1. Feed water is heated from 140 to 170 °C in a heat accumulator. The feed water pressure is 3.8 MPa. The mass flow rate of feed water is 261 t/h. Thus, the heat accumulator in discharge mode temporarily performs the function of HPH №1. The accumulator is charged with excess fresh stream from the steam generator during hours of minimum electricity demand. The fresh steam is superheated steam at a temperature of 285 °C and a pressure of 3.5 MPa. The heat transfer fluid flow control system maintains the water temperature at 170 °C at the outlet of the accumulator. Figure 4 shows the heat transfer fluid system, which regulates the flow of heat transfer fluid Equation (7).
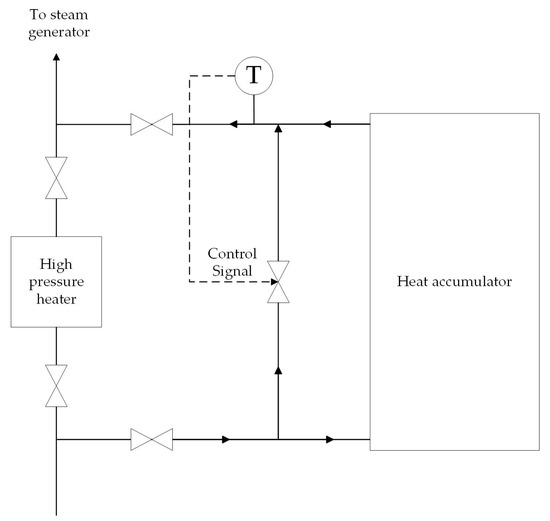
Figure 4.
The heat transfer fluid flow control system.
The heat accumulator allows for an additional generation of 3 MW, or 5.8% of the nominal power of a low-power nuclear power plant, during the discharge of the accumulator [98].
In this study, we investigate a similar application of heat accumulator with a PCM. The heat exchange surface, in this case, is also a coil heat exchanger, but with longitudinal fins added to intensify heat transfer. The performance of an accumulator with a PCM operating in discharge mode was investigated for various lengths of the heat exchange surface.
The required operating time of an accumulator in discharge mode depends on the duration of load peaks in a power system. The size of accumulators for different nuclear power plants in different power systems will vary depending on load schedules that are unknown in advance. Therefore, we need to develop a method for estimating the size of these accumulators in order to scale them for use in different nuclear power plants.
2.2. Topological Optimization
As mentioned in the introduction, to intensify the heat exchange, a heat exchange surface with longitudinal fins was adopted. We conducted a topological optimization to determine the optimal number of fins. To do this, we modeled the heat transfer process using heat exchange surfaces with different numbers of longitudinal fins: 2, 3, 4, 5, and 6. The optimization criteria are the total amount of energy transferred within 30 min and the dynamics of the heat flux density over 30 min. The heat transfer modeling was performed using the ANSYS FLUENT (Student version 2021 R2). The simulation process is described in Section 2.4 in more detail.
2.3. Method for Calculating Heat Transfer Across the Entire Heat Exchange Surface of a Heat Accumulator Using a PCM
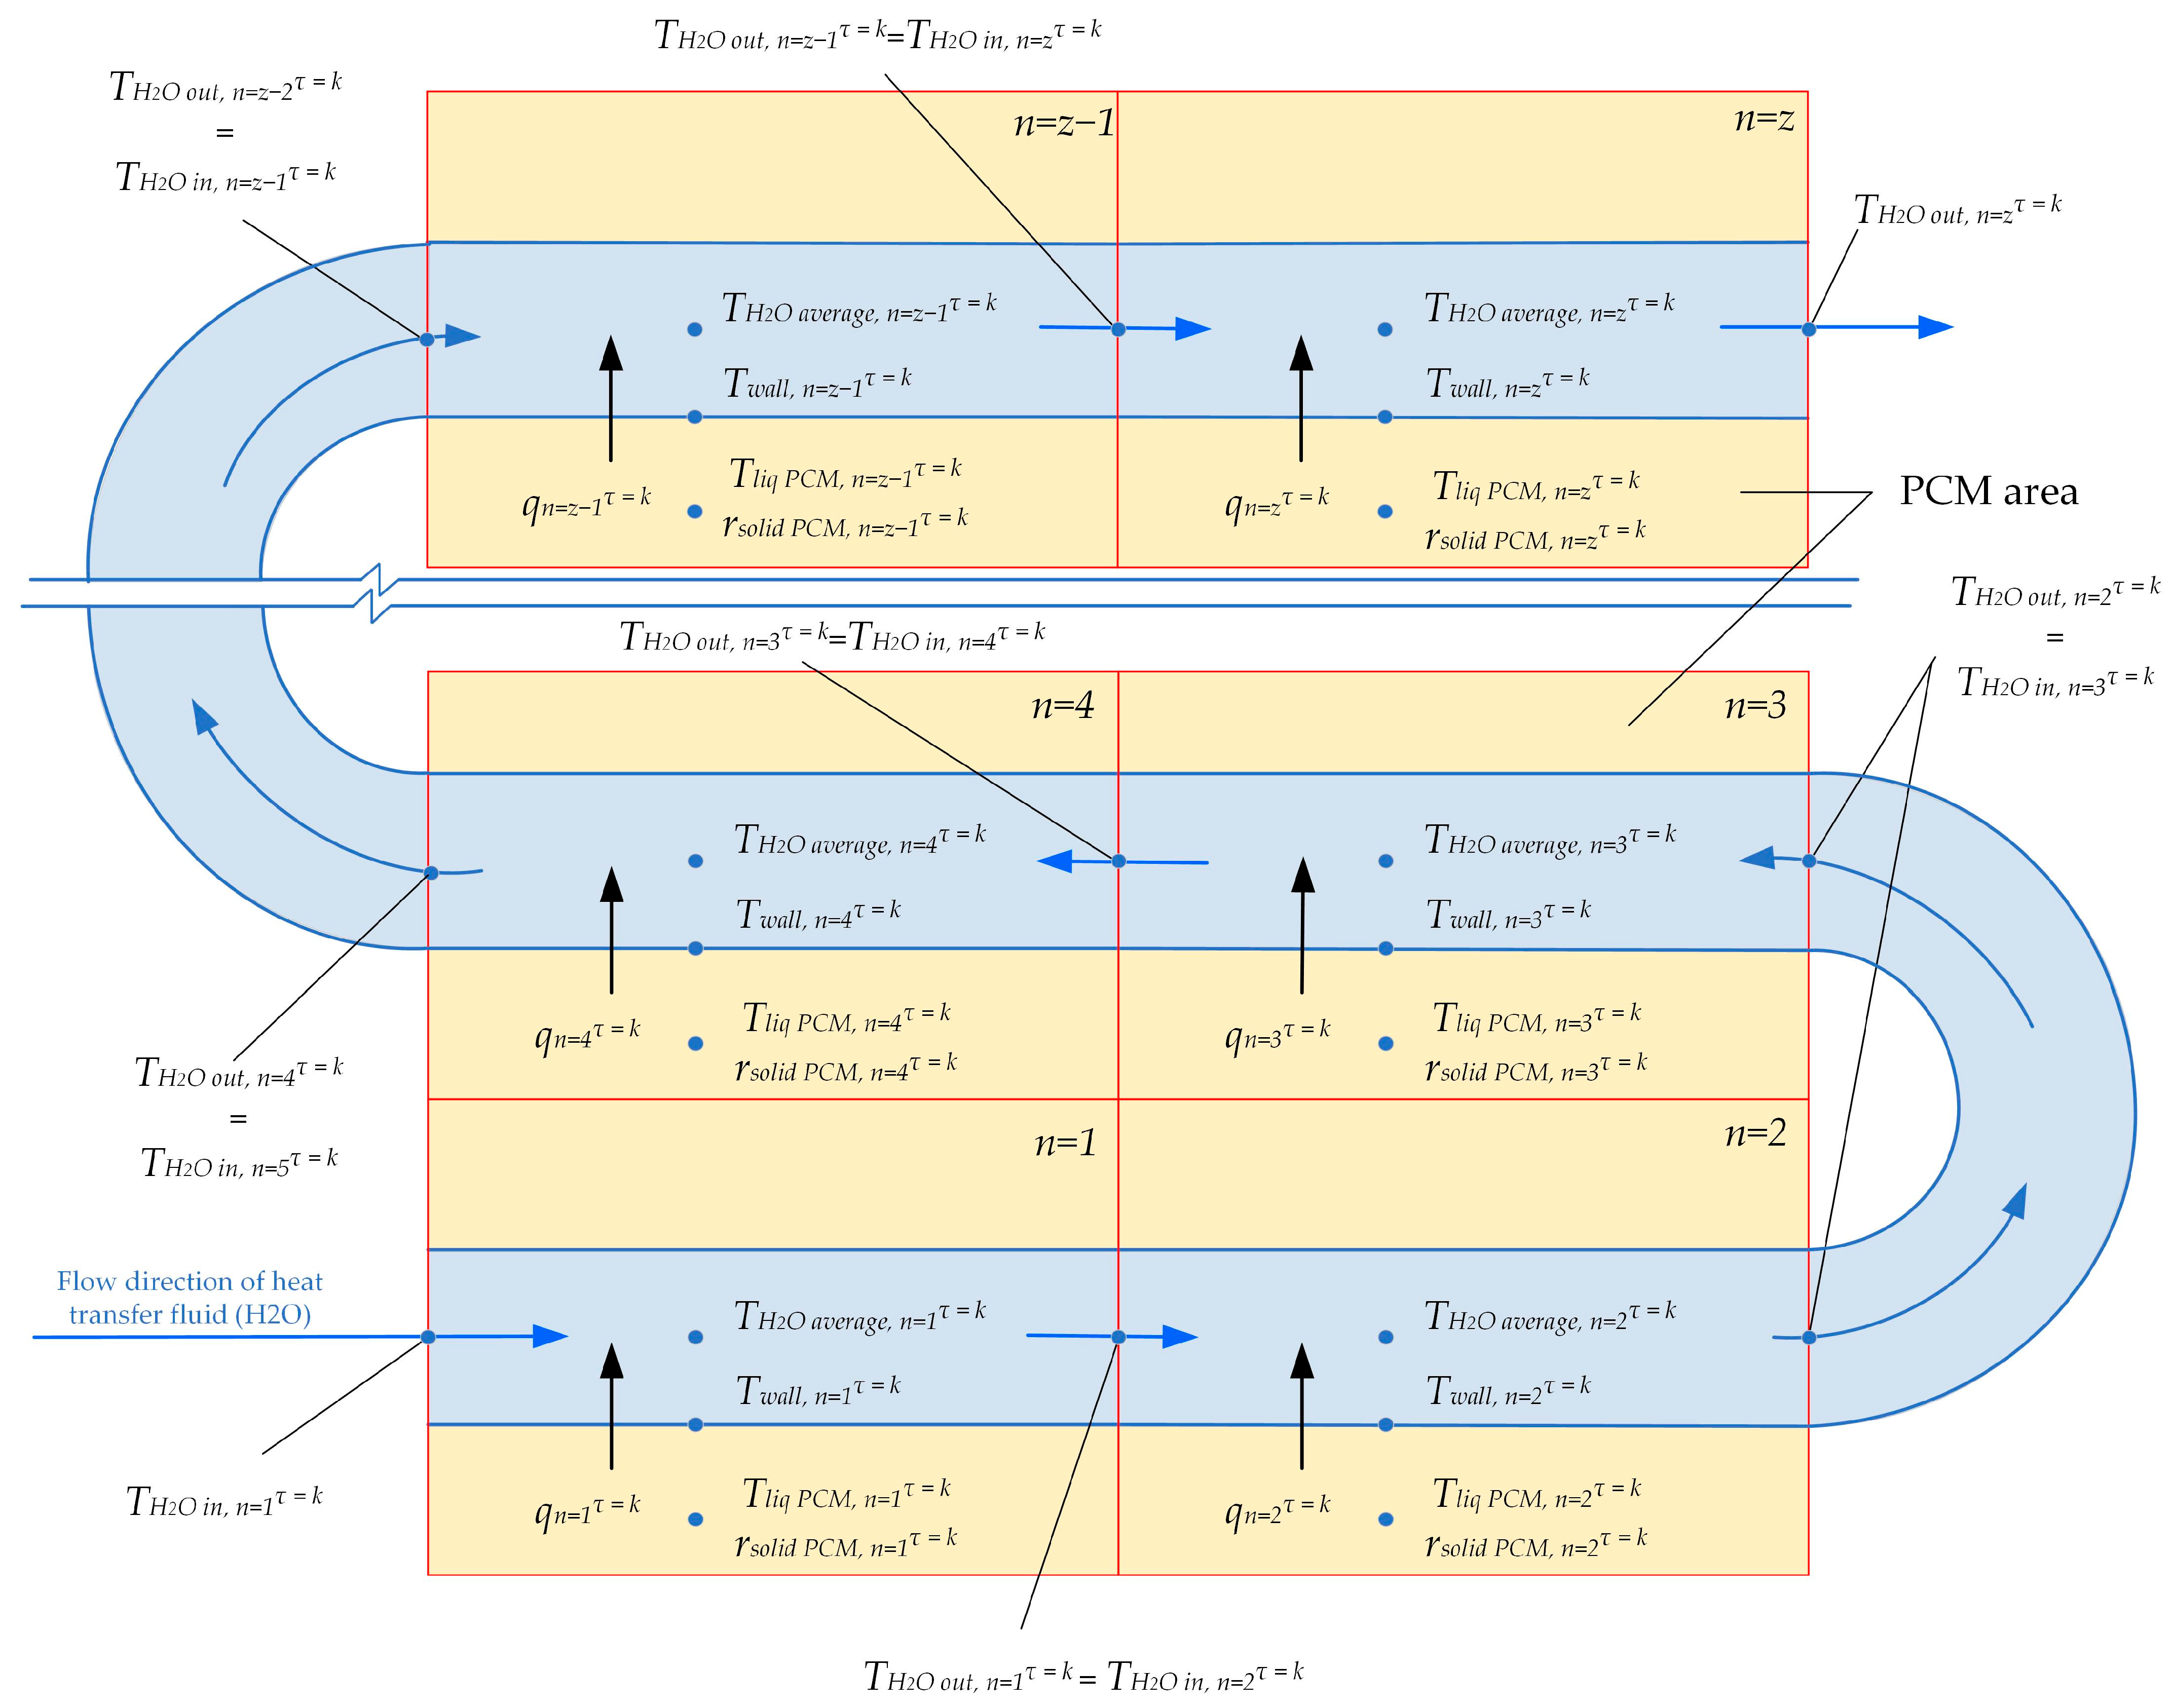
Heat transfer along the entire length of the heat exchange surface is modeled using a surrogate heat transfer model. At each time step τ, the total surface area of the heat exchanger coil is considered to be a set of z consecutive heat exchange sections (see Figure 5). Each heat exchange section has a length of 1 m. The heat transfer is calculated for three different lengths of heat exchange surfaces: 80 m, 100 m, and 120 m. The total heat exchange surface consists of 30 parallel pipes with an inner diameter of 50 mm. The temperature of the heat transfer fluid entering the n + 1 section of the heat exchanger is equal to the temperature of the fluid leaving the previous section.
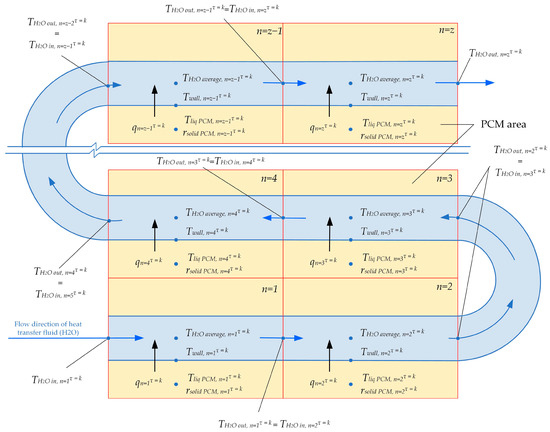
Figure 5.
Separation of the heat transfer coil surface into consecutive sections.
The heat transfer at each section numbered n, for each time step τ, can be uniquely described by the “black box” model Equation (1). The input data for Equation (1) includes (1) the temperature on the inner surface of the heat exchanger (from the side of the heat transfer fluid) at section n, at time step τ; (2) the temperature of the liquid phase of the PCM, in the region around section n at time τ; (3) the average thickness of the solid phase of PCM surrounding section n at time step τ. The output data from Equation (1) are the density of heat flux through the wall at section n at time step τ.
The change in the state of the PCM between time steps τ = k and τ = k + 1 around each section n of the heat exchange surface is described by the “black box” model Equations (2) and (3). The input data for these equations include (1) the density of heat flux in section n at time step τ = k. (2) The temperature on the inner surface of the heat exchange surface (from the heat transfer fluid side) at section n at the time step τ = k. (3) The temperature in the liquid phase of the PCM around section n at the time step τ = k. (4) The average thickness of the solid phase of the PCM around section n at the time step τ = k.
The heat flux density, W/m2, is as follows:
The temperature change in the liquid phase of the PCM, degrees Celsius per 5 s (°C/(5 s)), is as follows:
The changing of thickness of the PCM solid layer, meters per 5 s (m/(5 s)), is as follows:
where
rsolid PCM—the thickness of the PCM solid layer, m;
Twall—the temperature on the inner surface of the heat exchanger tube (from the heat transfer fluid side), °C;
Tliq—the temperature in the liquid phase region of the PCM, °C;
Twall is calculated by iterative calculation according to the expression:
where
αH2O, W/(m2∙K)—the coefficient of heat transfer between the wall surface and the heat transfer fluid. αH2O is determined using the Nusselt and Reynolds numbers [99].
Taverage H2O, °C—the average temperature of the heat transfer fluid in the considered section n is determined using the expression:
where
Tin H2O, °C—the temperature of the heat transfer fluid at the input to the section n;
Tout H2O, °C—the temperature of the heat transfer fluid at the output from the section n. It is determined using the following expression:
where
S, m—the area of the heat exchange surface between the heat transfer fluid and the wall for one section n;
GH2O = Gk/i, m3/s—the volumetric flow rate of the heat transfer fluid in one heat exchange coil (i = 30—number of parallel heat exchange coils);
cH2O, J/(kg·K)—the heat capacity of the heat transfer fluid;
ρH2O, kg/m3—the density of the heat transfer fluid.
The flow rate of the heat transfer fluid in the heat accumulator at the time step τ = k is as follows:
where
Tnom, °C—the required temperature of the heat transfer fluid at the outlet of HPH1 = 170 °C—nominal temperature of feed water at the steam generator inlet;
Tacc in k, °C—the temperature of the heat transfer fluid entering the accumulator = 140 °C—the temperature at output of the high-pressure heater №2 (see Figure 2);
Tacc out k, °C—the temperature of the heat transfer fluid outlet of the accumulator (last section n) before the control system at time step k.
The full flow rate of the heat transfer fluid, Gfull, is 261 tons per hour before the control system (Figure 4). Due to the high flow rate of the heat transfer fluid, the heat exchange surface is divided into 30 parallel coils. The parameters and flow rate of the heat transfer fluid are consistent with the nominal specifications of a prototype of a low-power nuclear power plant that uses a RITM-200 reactor.
The temperature in the region of the liquid phase of the PCM at time step τ = k + 1 is determined by the following expressions:
The thickness of the solid PCM layer at time step τ = k + 1 is determined by the following expression:
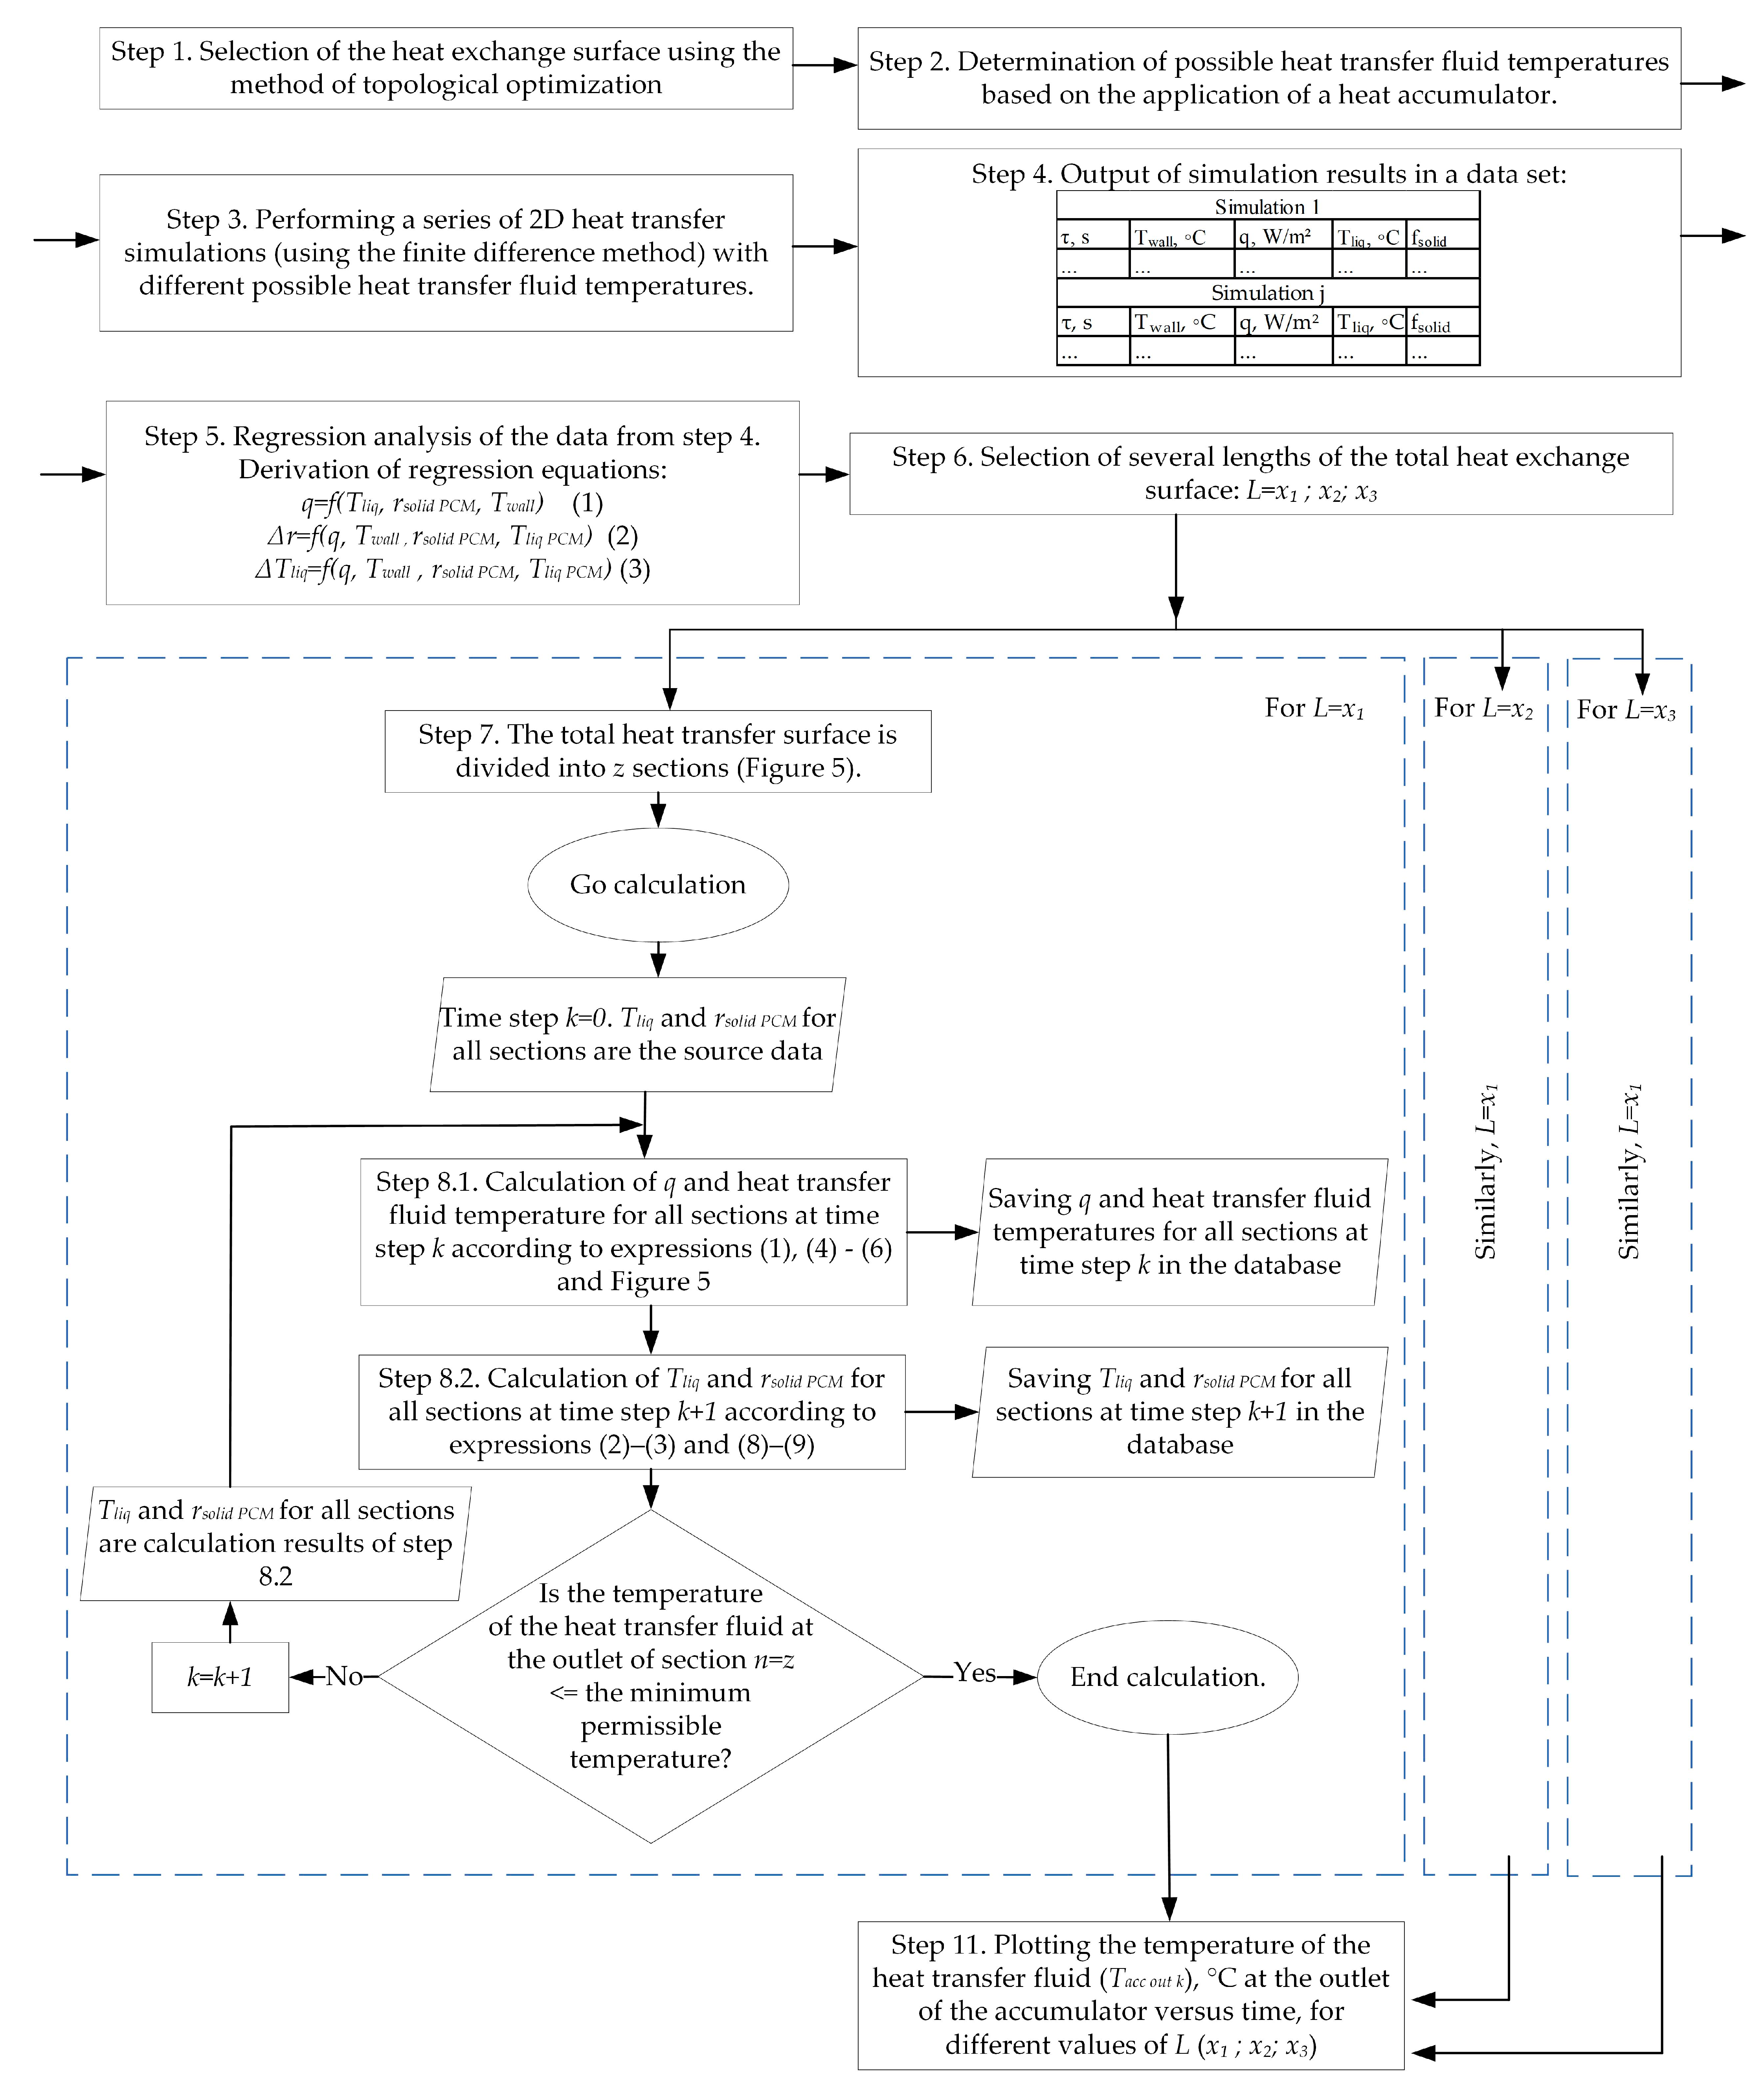
By analogy with previous work [98], the described calculation method makes the following assumption: certain sections of the heat exchange tube up to 1 m long and the area of the PCM around tubes are considered separately, without considering the influence of adjacent sections. A flowchart of the method is shown in Figure 6.
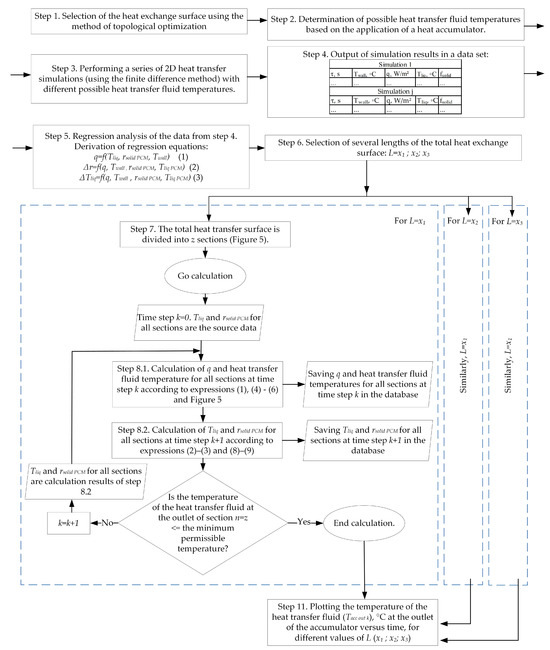
Figure 6.
Flowchart of the proposed method for calculating heat transfer across the entire surface of the heat exchanger coil in a thermal accumulator with a PCM.
A regression analysis of the results of the simulation of heat exchange (Section 3.4) is performed to determine the dependencies (1)–(3). The dependencies are expressed in the form of a second-order polynomial regression equation. We used a second-degree polynomial equation because this type of equation often accurately describes the statistical relationship between several values in a dataset, assuming there is a relationship. This type of equation is quite often used to describe heat transfer processes [100]. Regression coefficients are determined using the least squares method.
The disadvantage of using statistical dependencies to determine heat transfer equations is that the resulting equations may not fully capture the physical meaning of the problem. Despite this disadvantage, regression equations obtained can be used to describe heat transfer.
Thus, it is assumed that the heat transfer between the heat transfer fluid and the PCM at each moment in each discrete section is uniquely determined by the wall temperature, the thickness of the solid layer of the PCM, and the temperature of the liquid PCM. It is also assumed that the change in the solid layer of the PCM and the temperature of the liquid PCM at each moment for each discrete section are uniquely determined by the heat flux density, wall temperature, thickness of the solid layer of the PCM, and the temperature of the liquid PCM.
The description of the obtained regression dependencies for Equations (1)–(3) is quite extensive and is not included in this work. To become acquainted with the description of these regression dependencies, please follow the link provided at the end of this document.
2.4. Simulation in ANSYS FLUENT
To determine the dependencies (1)–(3), a series of 2D simulations were performed using the ANSYS FLUENT (Student version 2021 R2). A simulation of the solidification process of solar salt around a steel tube was performed, with various expected temperatures set on the inner surface of the heat exchange wall. The simulation used a laminar turbulence model, assuming that the flows inside the PCM are laminar [101].
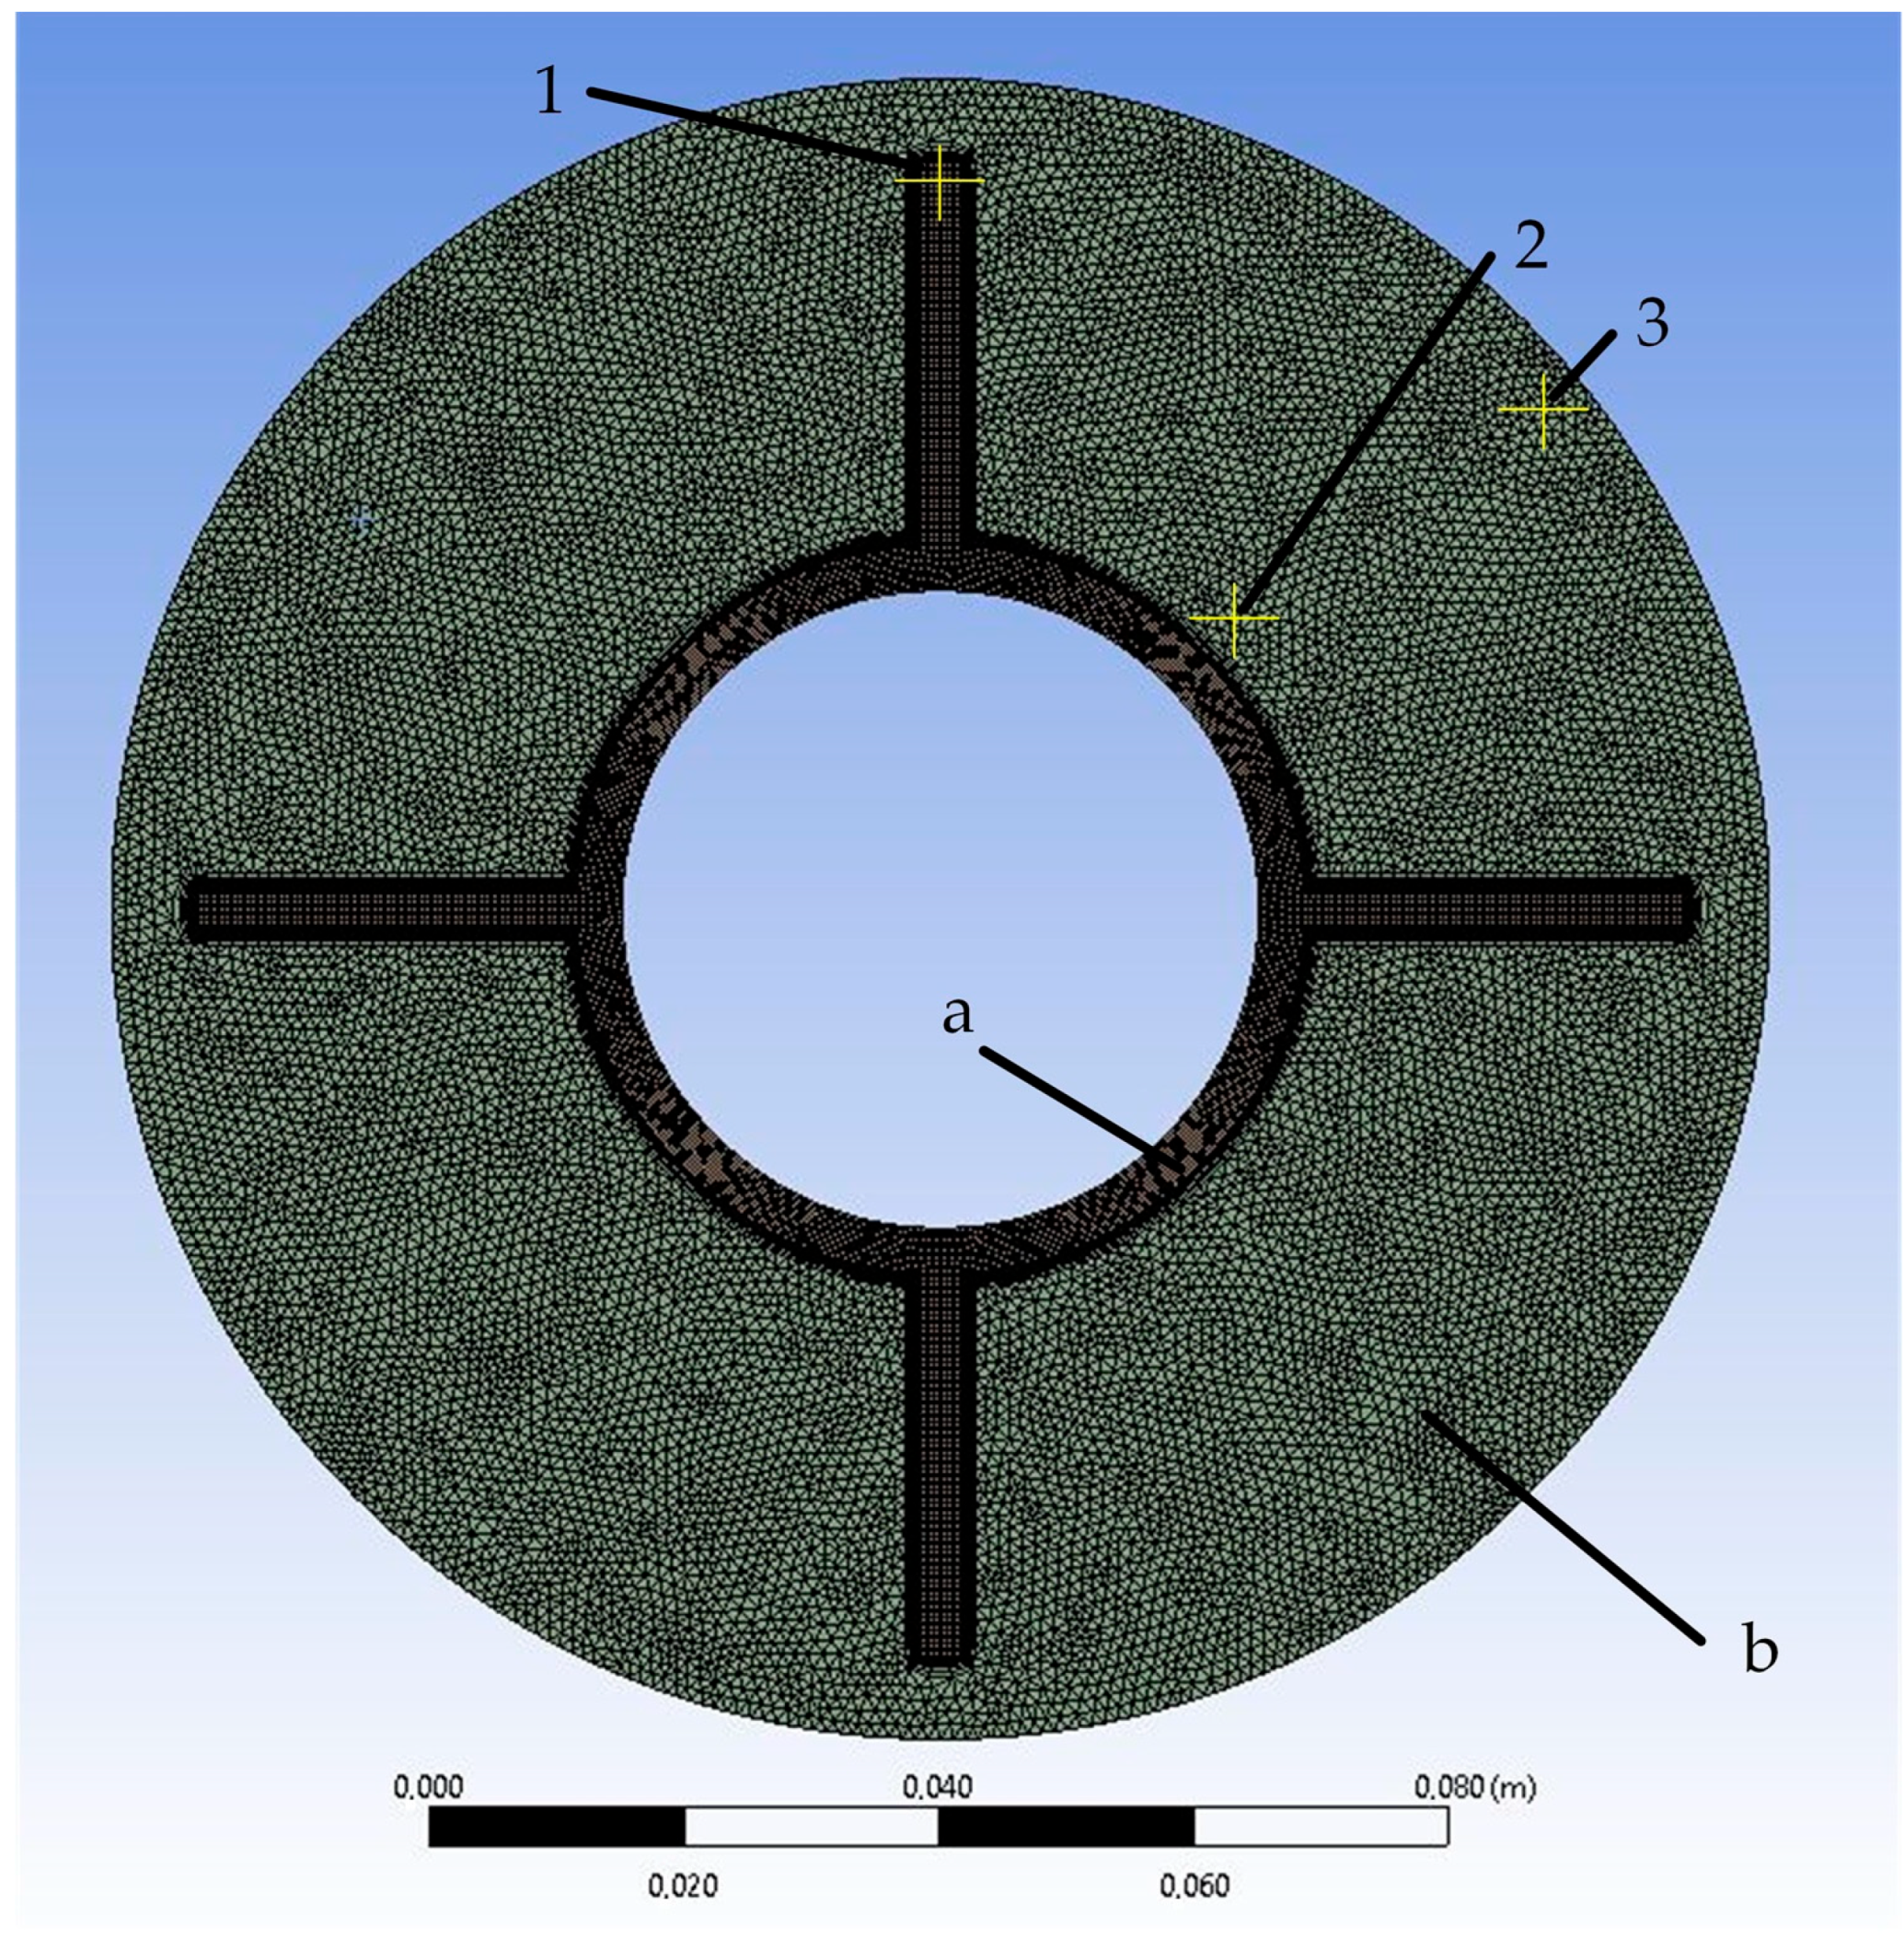
The simulated area is a circular area with a diameter of 130 cm. It consists of two zones: the heat exchange tube zone and the PCM zone (Figure 7). The heat exchange tube has an inner diameter of 50 mm and an outer diameter of 57 mm. Four longitudinal fins with a height of 30 mm and a width of 3 mm are attached to the inside of the tube from the outside.
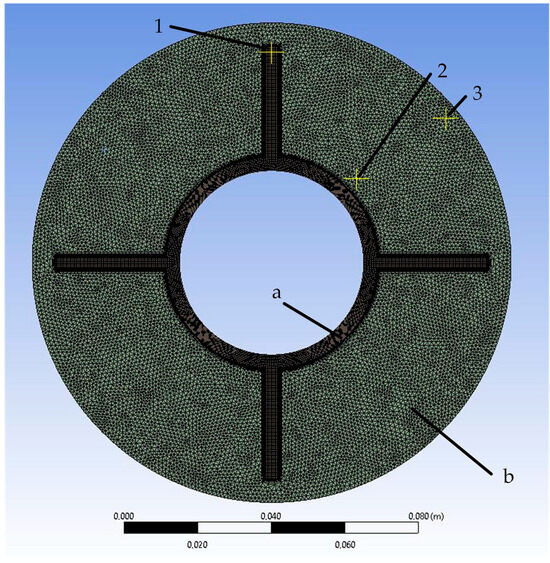
Figure 7.
Mesh of the simulated area: (a)—area of heat exchange wall; (b)—PCM area. 1, 2, 3—control points for grid-independence study.
The outer boundary of the simulated area is an adiabatic wall. The first-kind boundary condition, which is the law of change in temperature with time, is set at the inner boundary. The initial temperature in the simulated area is 240 °C.
The thermophysical properties of the solar salt used in the model are presented in Table 1. The viscosity of the solar salt is 0.04 poise, and the coefficient of thermal expansion is 0.00036.
In the grid-independence study, the sizes of the grid elements were compared to 2, 1, and 0.5 mm. The results of the comparison are presented in Section 3.1. Based on the results, it was concluded that the independence of the solution was achieved with a grid element size of 1 mm. With a further decrease in the grid element size, the difference in heat transfer intensity at the corresponding time points did not exceed 2%. There were no significant temperature changes at the control points (see Figure 7) at the corresponding time points.
The simulated area is divided into triangular cells (see Figure 7). The element size is 3 mm, and mesh inflation is used in the contact areas between the PCM and the wall. The model consists of 24,766 elements and 33,791 nodes. The minimum orthogonal quality is 0.48, and there are no negative cell volumes.
The pressure-velocity coupling algorithm “SIMPLE” was used in the solution methods. The “PRESTO!” interpolation scheme was employed to calculate the pressure on the cell surface. A second-order upwind scheme was used for the energy and momentum equations. Convergence criteria were set at 10−6, 10−6, and 10−9 for continuity, velocity, and energy equations, respectively. The time step was set to 0.5 s, which ensures convergence of the solution.
ANSYS FLUENT uses an enthalpy-porosity model [102,103]. The liquid–solid mushy zone is treated as a porous zone with porosity equal to the liquid fraction, and appropriate momentum sink terms are added to the momentum equations to account for the pressure drop caused by the presence of solid material. The mushy zone is where the liquid fraction lies between 0 and 1. It is modeled as a “pseudoporous” medium where the porosity decreases from 1 to 0 as the material solidifies. When a material is fully solidified in a cell, the porosity becomes zero, and, hence, the velocities also drop to zero [104,105,106]. The influence of convection in the PCM region is estimated by applying the Boussinesq approximation. The governing equations for the simulation are continuity, energy, and momentum (10)–(12).
Where ρ—density, β—volume fraction of liquid, —fluid velocity, —solid velocity due to the pulling of solidified material out of the domain, Amush—the mushy zone constant, S—source term (the momentum reducing due to the reduced porosity in the mushy zone), g—gravity, ε—small number (=0.001) to prevent division by zero, Cp—specific heat at constant pressure, href—reference enthalpy, h—sensible enthalpy, Tref—reference temperature, ΔH—latent heat, and L—heat of phase change.
Volume fraction of the liquid β can be defined as follows:
The controlled (variable) parameter in the simulation is the temperature on the inner surface of the heat exchange tube (Twall). The measured (output) parameters are the heat flux density (q) at the inner boundary of the heat exchange tube, the average temperature in the liquid phase region of the PCM (Tliq), and the proportion of the liquid phase of the PCM (f) within the volume of the PCM. The controlled simulation parameters are set according to the data provided in Table 2.

Table 2.
The controlled simulation parameters.
The simulations with wall temperatures Twall = 145 and 155 °C characterize the heat transfer dynamics in the initial sections of the heat exchange surface. The simulations, with a gradual decrease in wall temperature from 200 to 140 °C and from 175 to 145 °C, characterize the dynamics of heat exchange in the central region of the heat exchange surface. The simulations with gradual decreases in wall temperature from 240 to 180 °C, from 220 to 160 °C, and from 210 to 170 °C characterize the dynamics of heat exchange in the final region of the heat exchange surface. The results of the simulations are presented in Section 3.4.
2.5. Experimental Verification of the ANSYS FLUENT Model and Verification of the Received Regression Dependencies
An experimental verification of heat transfer modeling was carried out to verify the adequacy of the modeling in ANSYS FLUENT. During the experiment, we studied the dynamics of the heat flux density during cooling and solidification of the PCM. We repeated the experimental conditions using the settings specified in Section 2.4 of ANSYS FLUENT. We compared the results of the simulation in ANSYF with the experimental data. The results of the experimental validation of the ANSYS FLUENT model are presented in Section 3.2.
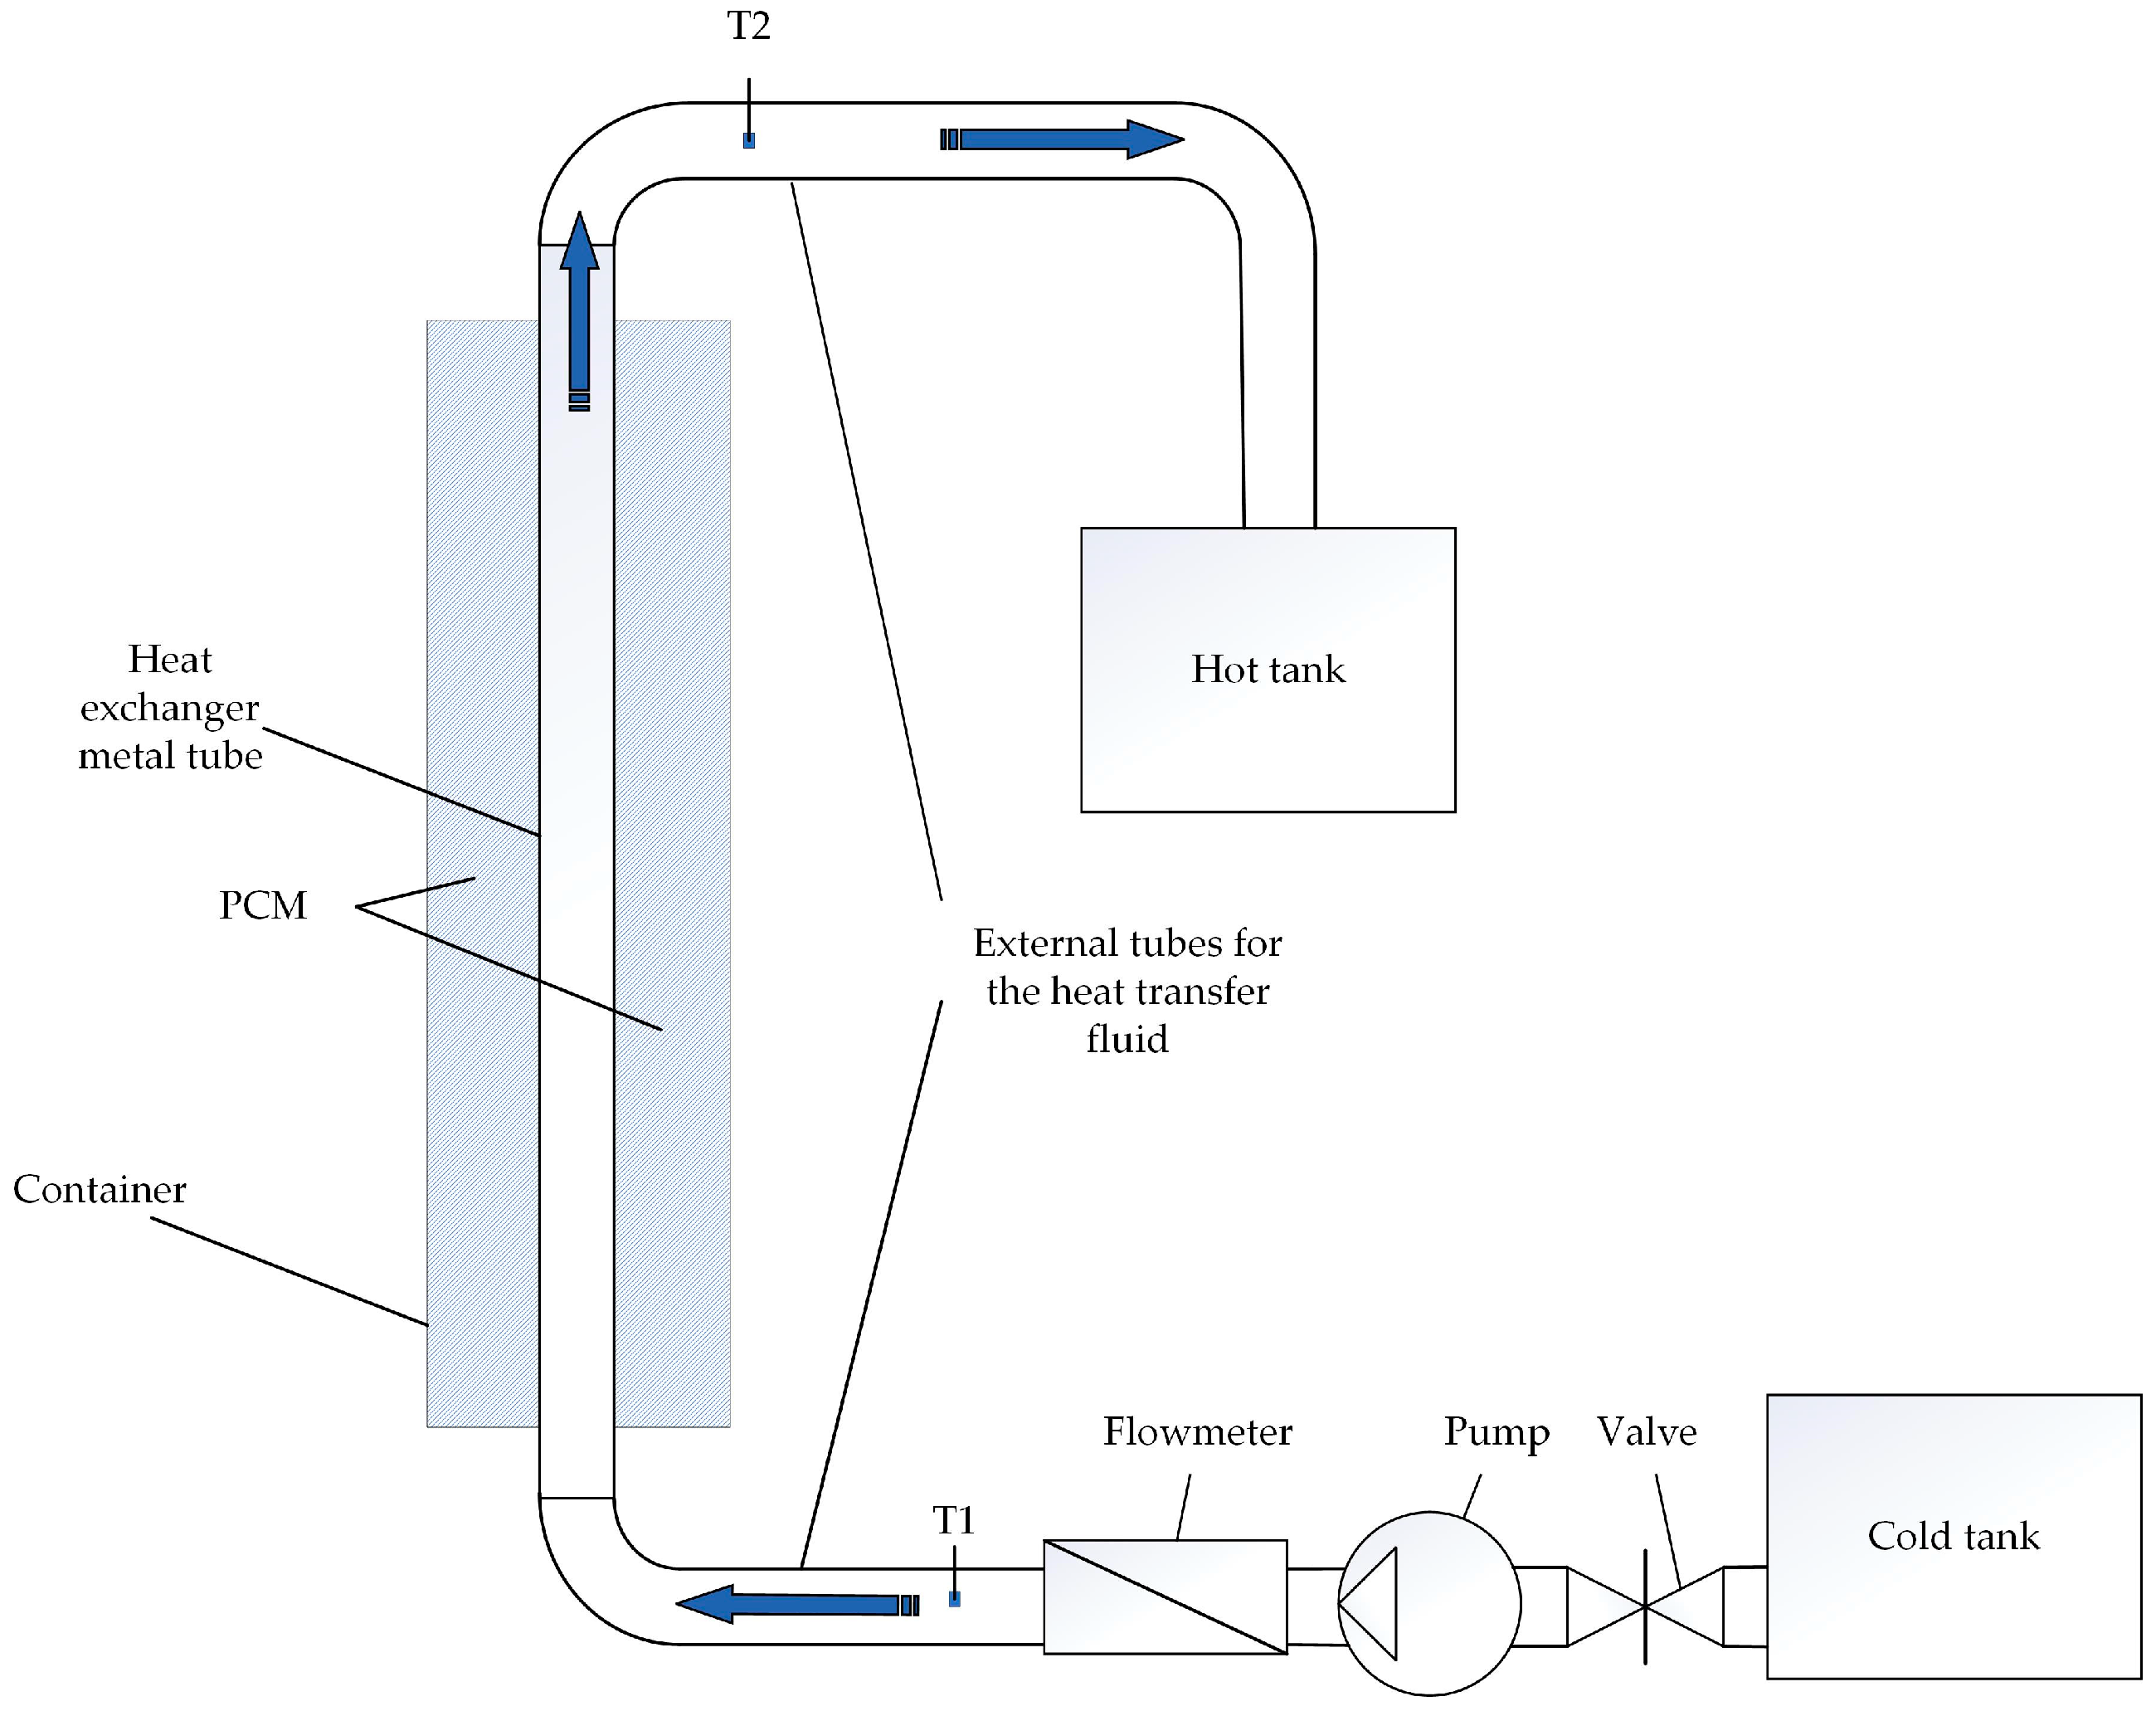
The PCM is located in a container with a height of 100 cm and a width and length of 15 × 15 cm. A vertical metal tube with a nominal diameter of 4 cm with four longitudinal fins was placed inside the container. The PCM container is thermalized. Temperature sensors T1 and T2 were placed at the inlet and outlet of the heat transfer fluid flow.
Before the experiment, the PCM melted due to the steam supply through an internal metal tube. The steam was generated by an atmospheric pressure generator. By the beginning of the experiment, all of the PCM in the container had melted, and the average temperature was about 80 °C. During the experiment, water from a “cold” tank was pumped by the pump into a steel tube located inside a container with a PCM. Inside the tube, the water was heated and then entered the “hot” tank. The flow rate of water was determined using a flow meter. The flow of water was regulated by changing the rotation speed of the pump and partially closing the valve. During the experiment, readings from temperature sensors and a flow meter were taken every 15 s. The water consumption was 16.4–17.3 L/min, and the temperature of the “cold water” at the entrance to the experimental installation was between 19.5 and 20.3 °C. The heat flux density for each measurement was determined according to the following expression:
where
T1—inlet water temperature, °C;
T2—outlet water temperature, °C;
cp—isobaric heat capacity of water;
ρ—density of water, kg/m3;
Gv—volumetric water flow, m3/s;
l—length of the heat exchanger tube, m;
d—inner diameter of the heat exchanger tube, m.
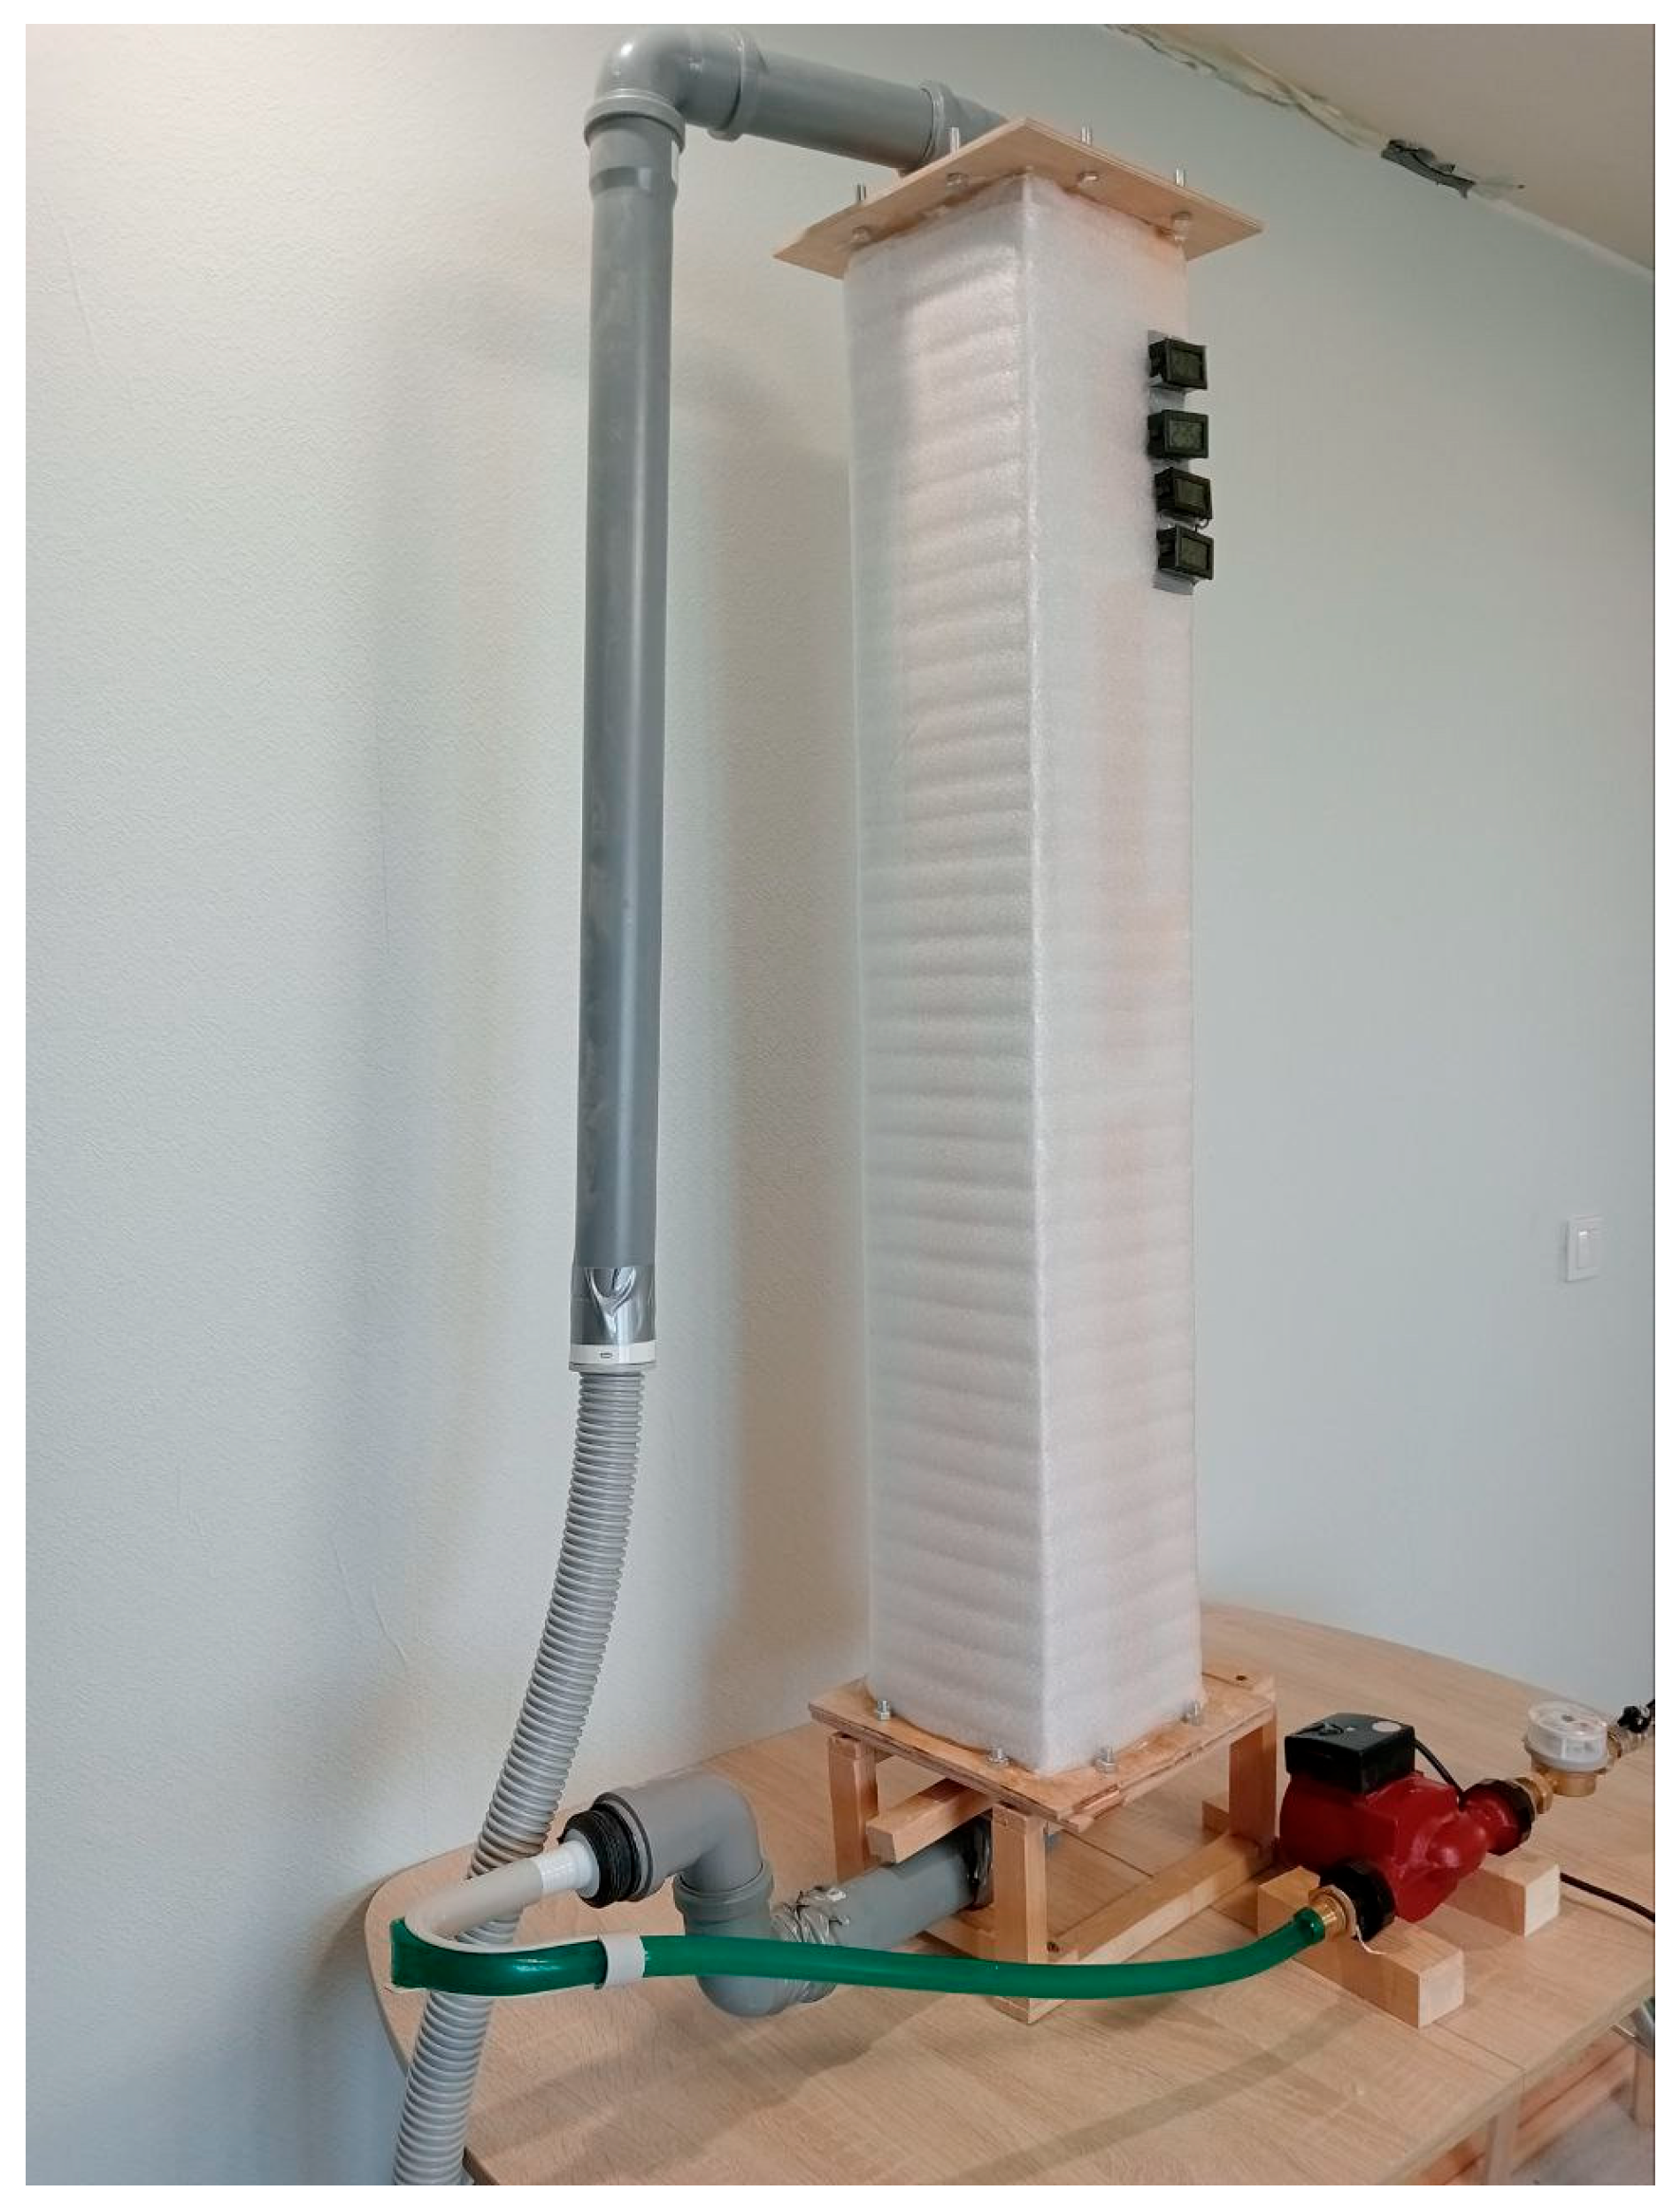
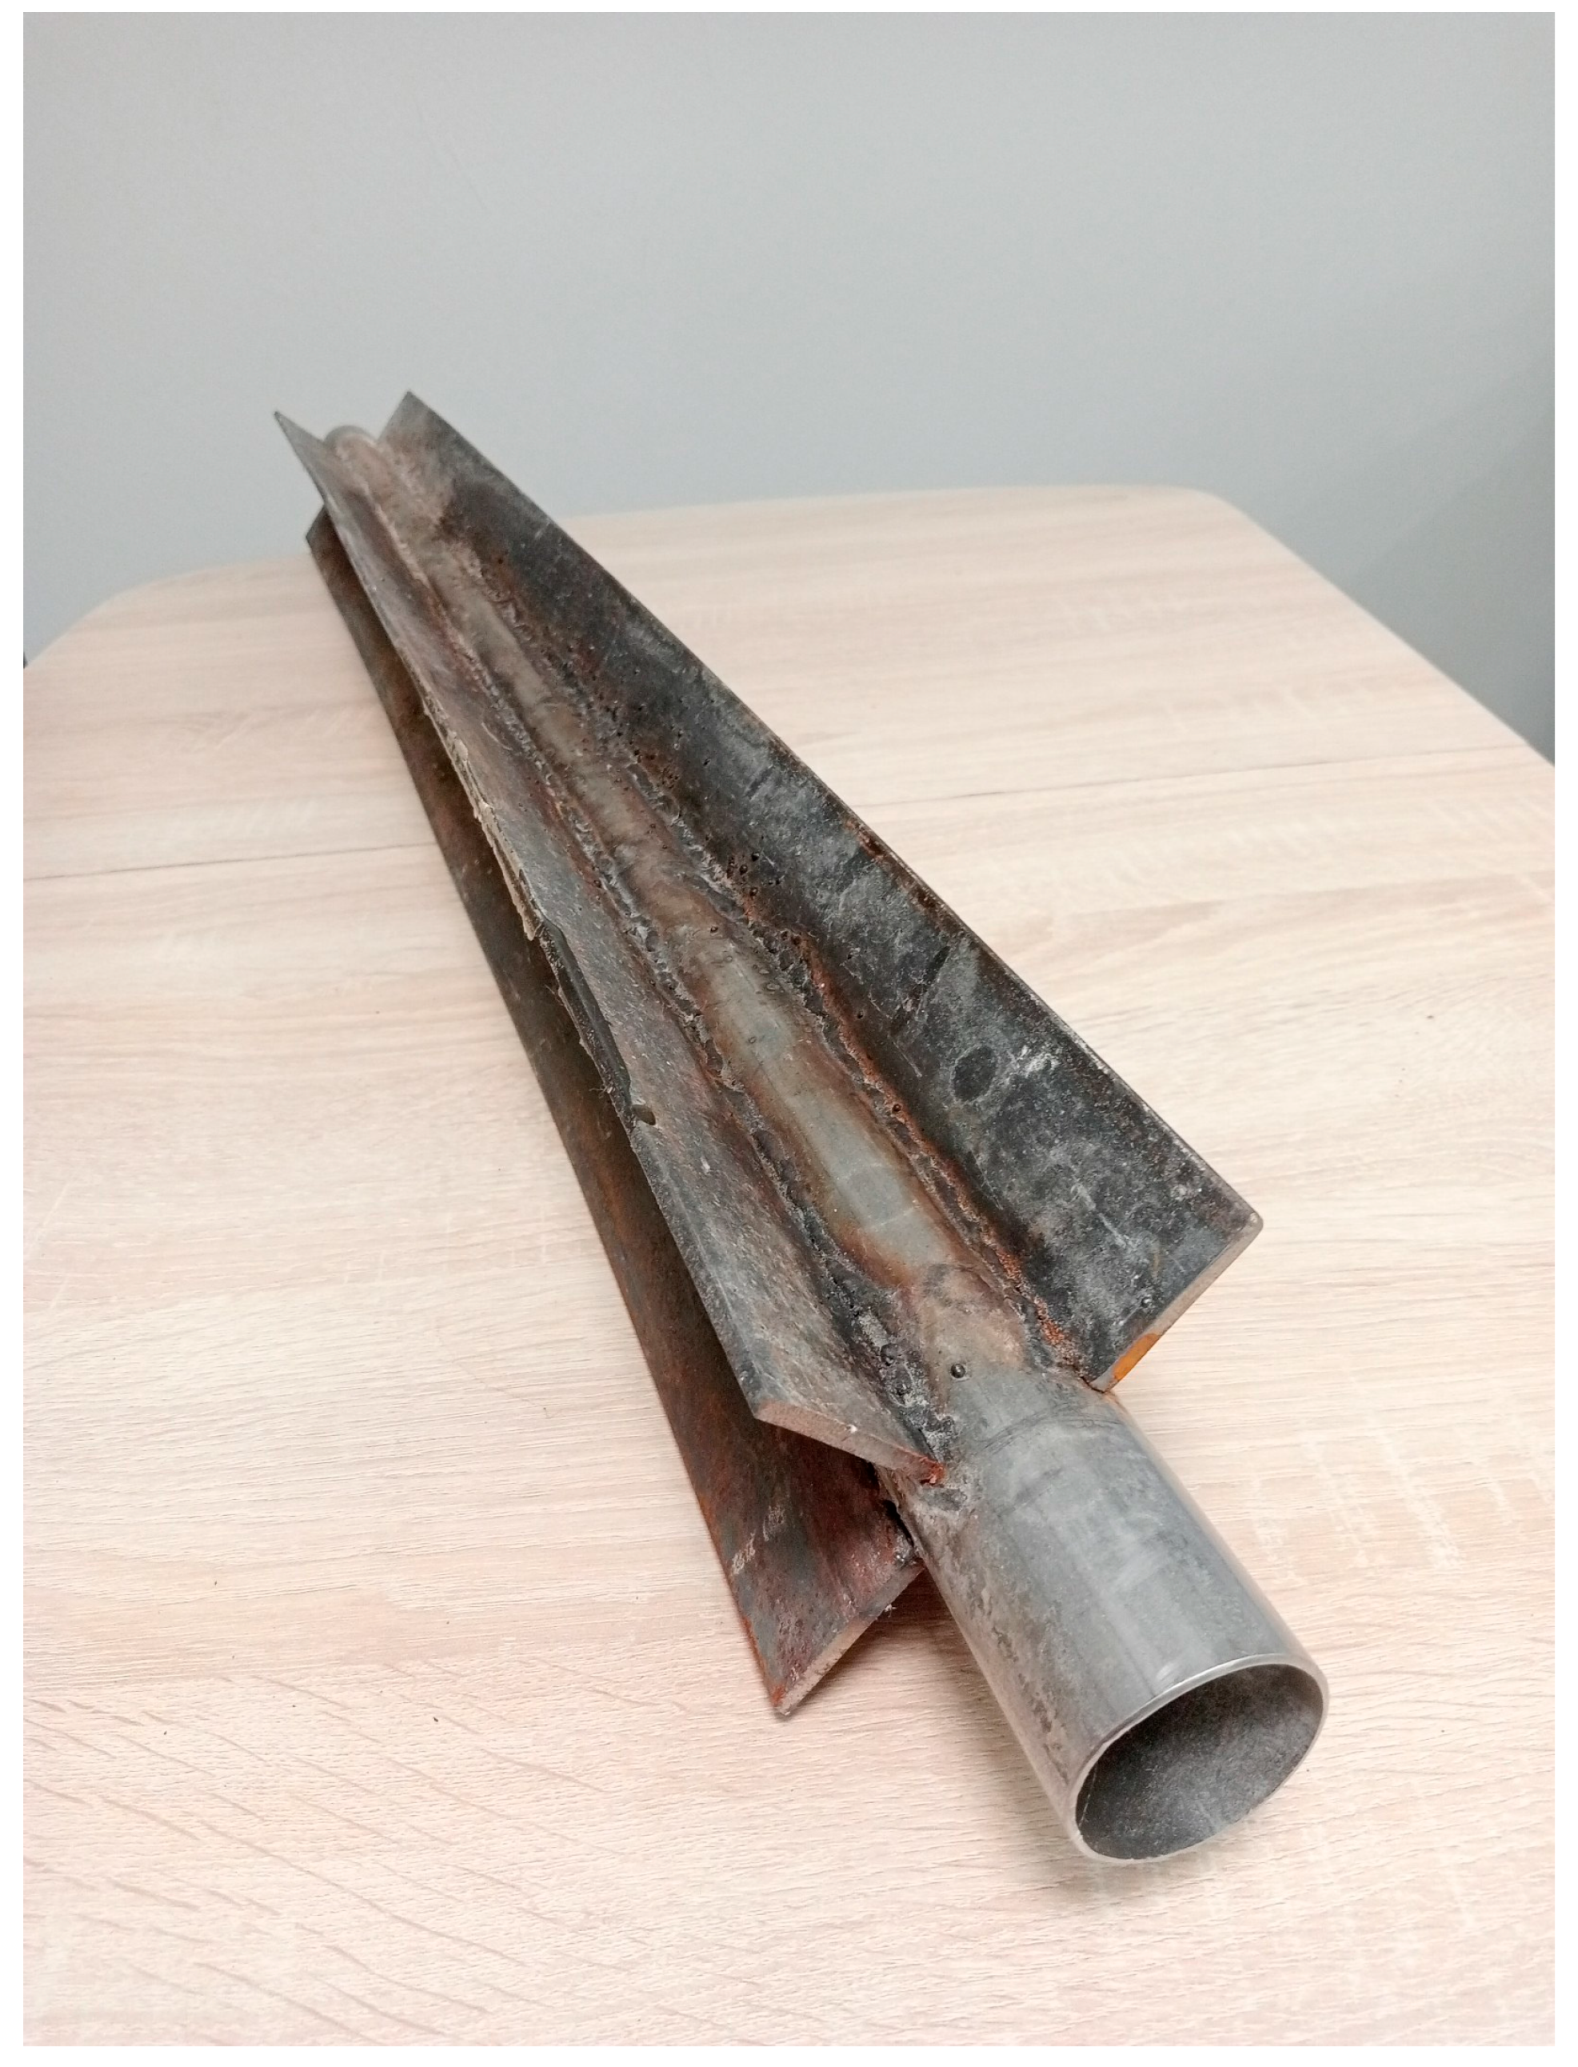
The scheme of the experimental stand is shown in Figure 8. The photo of the experimental stand is shown in Figure 9. The heat exchange tube with four longitudinal fins used in the experimental stand is shown in Figure 10.
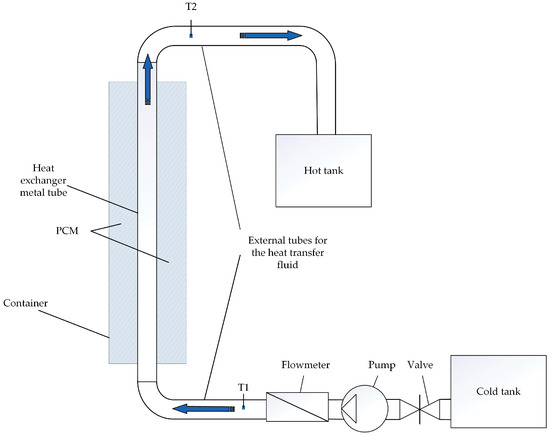
Figure 8.
The scheme of the experimental stand.
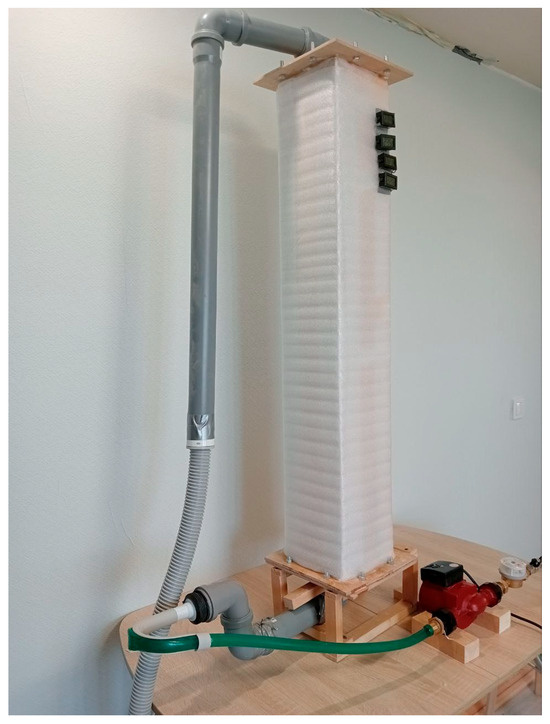
Figure 9.
Photo of the experimental stand.
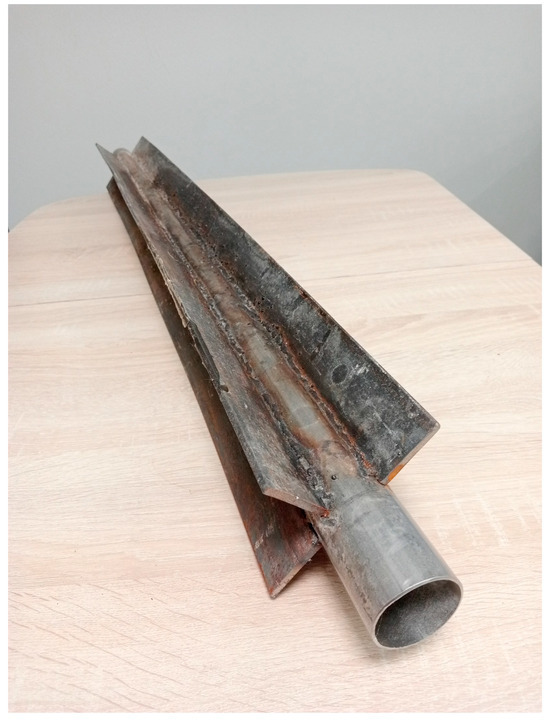
Figure 10.
Steel heat exchange tube with four longitudinal fins used in the experimental stand.
Paraffin P-2 was used as a PCM in the experiment. The thermophysical properties of the PCM are presented in Table 3.

Table 3.
Thermophysical properties of Paraffin P-2.
We used Fisher’s test to verify the accuracy of simulation results [107]. The Fisher test is related to the concept of the null hypothesis—the default assumption that there is no connection between two observed events. If the calculated value of the Fisher criterion is less than the tabular one, then the null hypothesis is confirmed, i.e., there is no relationship between the values. Conversely, if the calculated value is greater than the table value, the significance of the relationship between values is confirmed. Thus, If the calculated value of the Fisher criterion (Fcalc) is greater than its critical value from the table (Ftable), then the received dependencies are considered correct.
The formula for calculating the Fisher criterion is as follows:
where
m—number of independent variables;
a—the number of analyzed points (number of measurements).
The tabular value of the Fisher criterion is determined using a significance level of a = 0.05, and degrees of freedom of f1 = a − 1 and f2 = m − a − 1.
The correctness of the received dependencies (1)–(3) was also verified using the Fisher test. Verification simulations were conducted using ANSYS. Temperatures versus time graphs for the inner surfaces of different heat transfer surface sections were determined using the method described in Section 2.3. During verification simulations, these temperature–time curves were set on the inner surfaces for the ANSYS simulations. The results of the validation of the dependencies obtained (1)–(3) are presented in Section 3.6.
3. Results
3.1. Grid-Independence Study
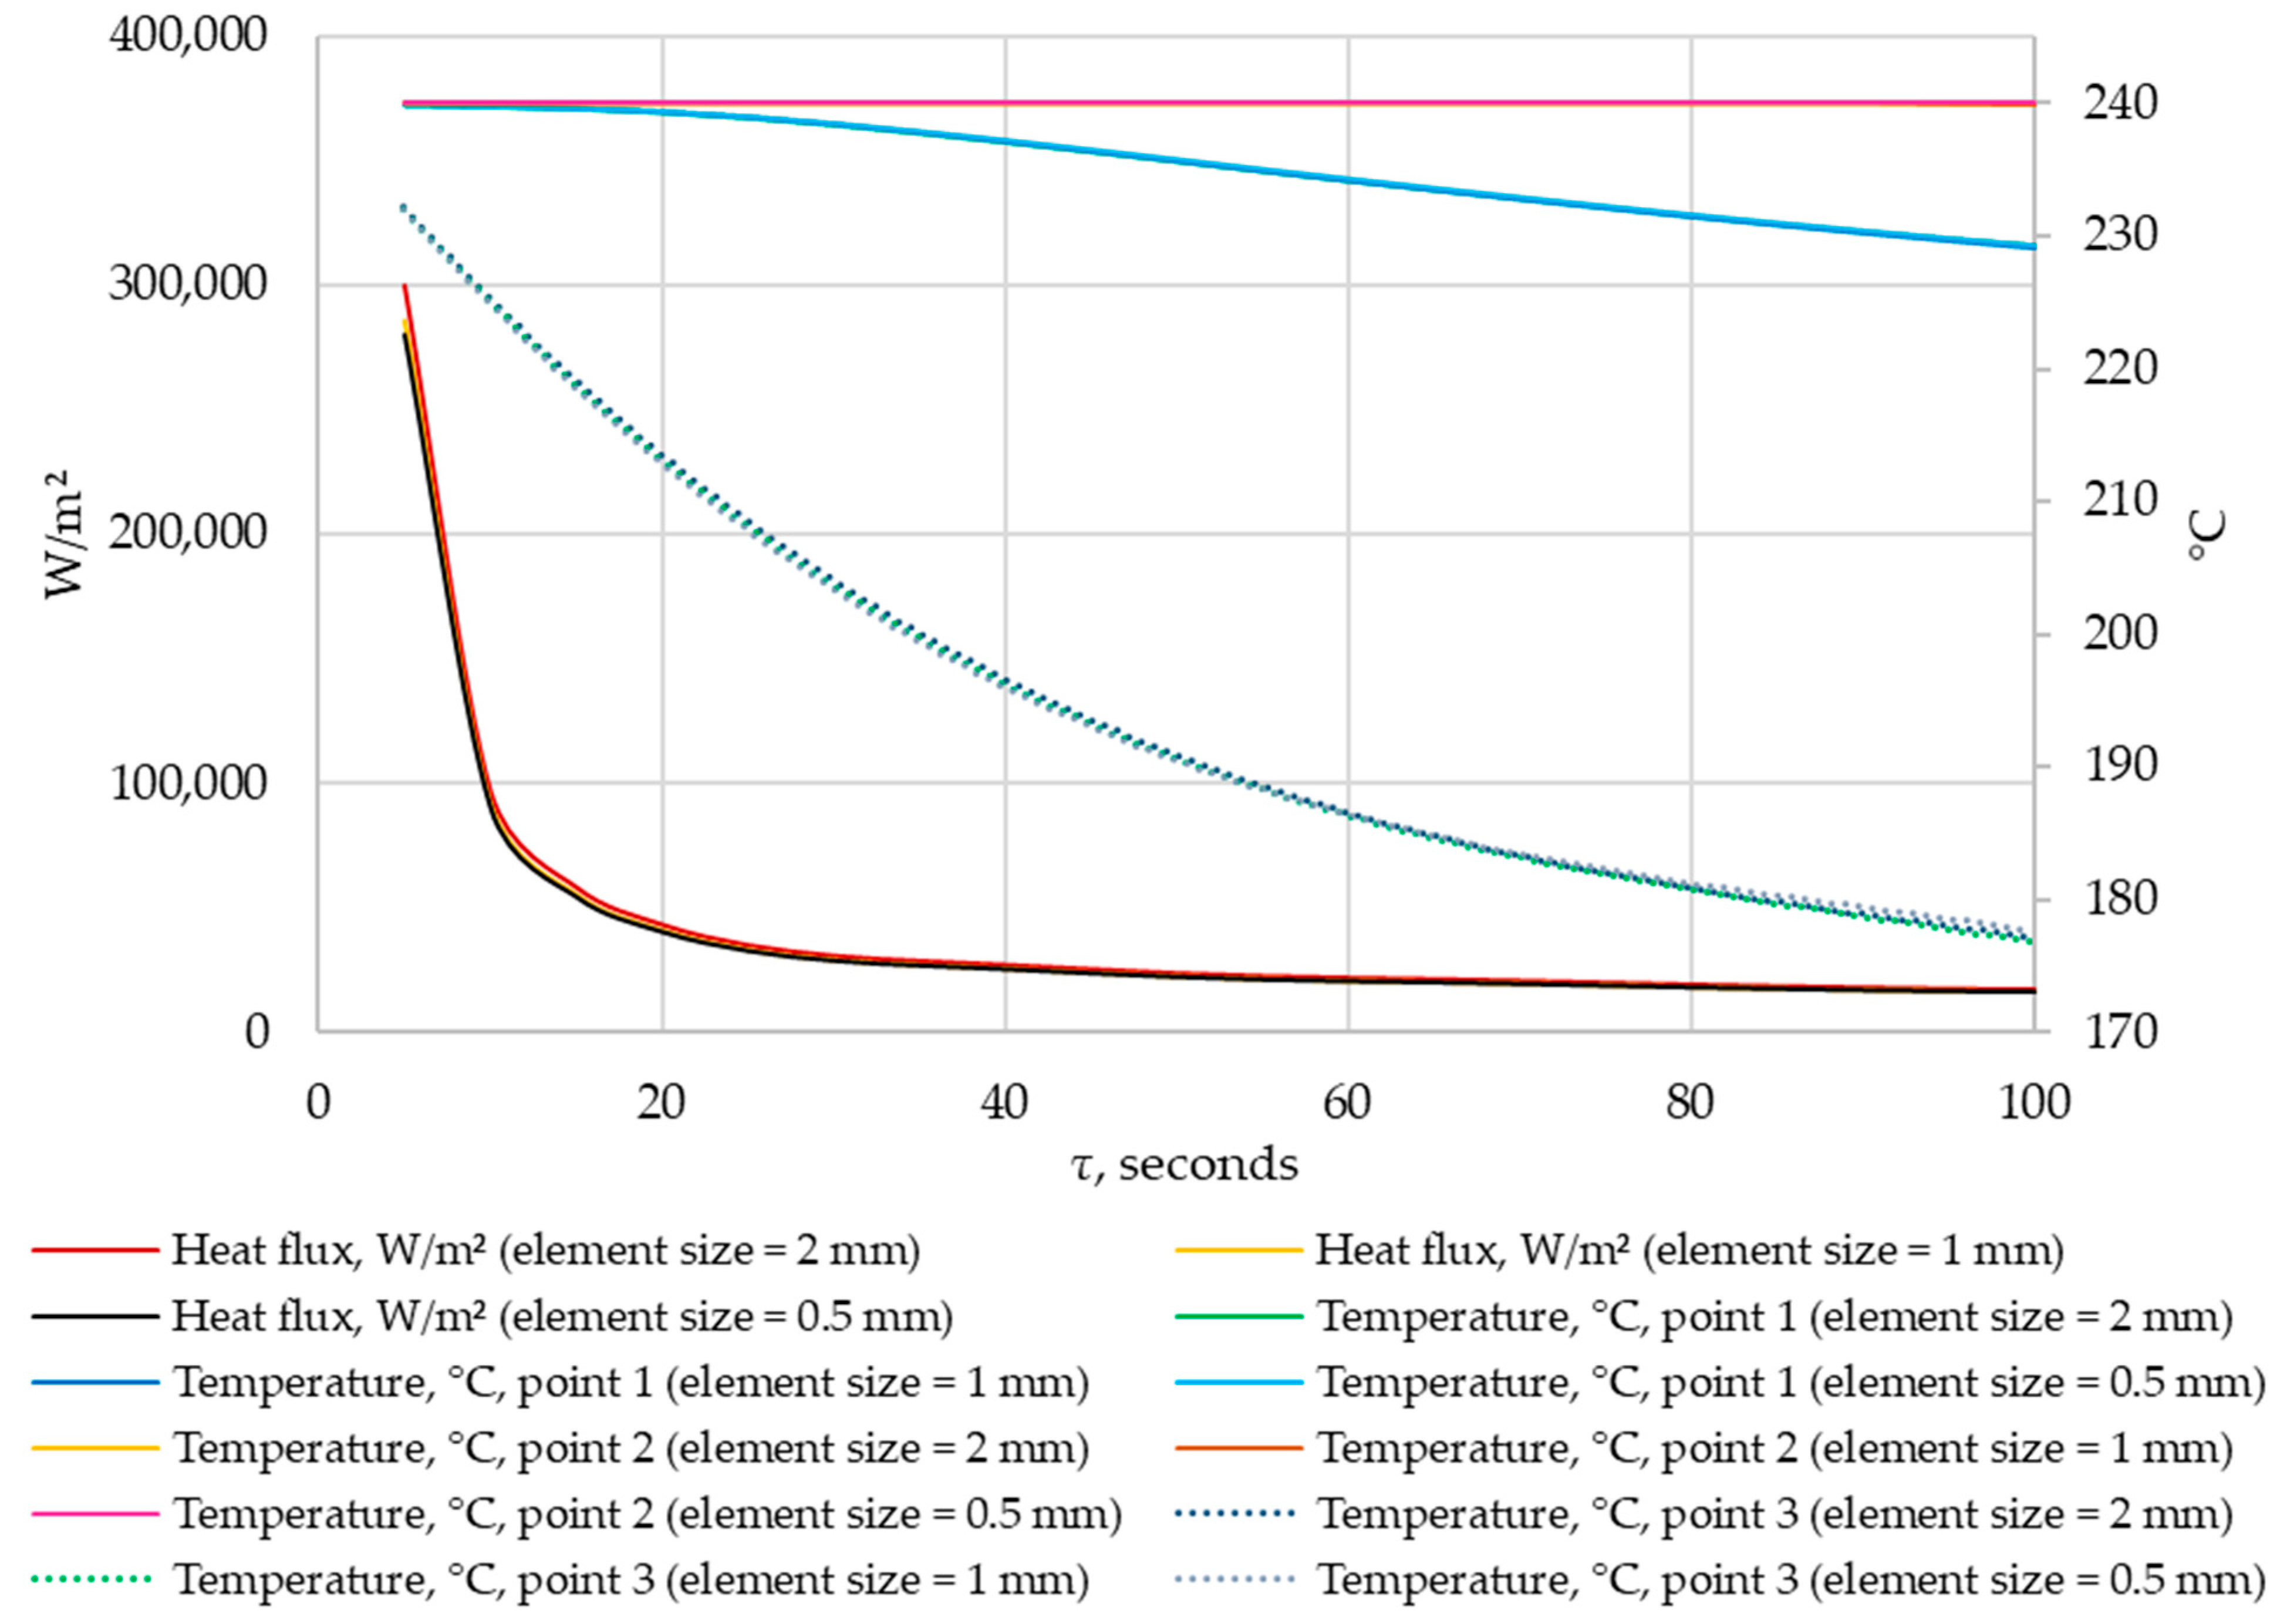
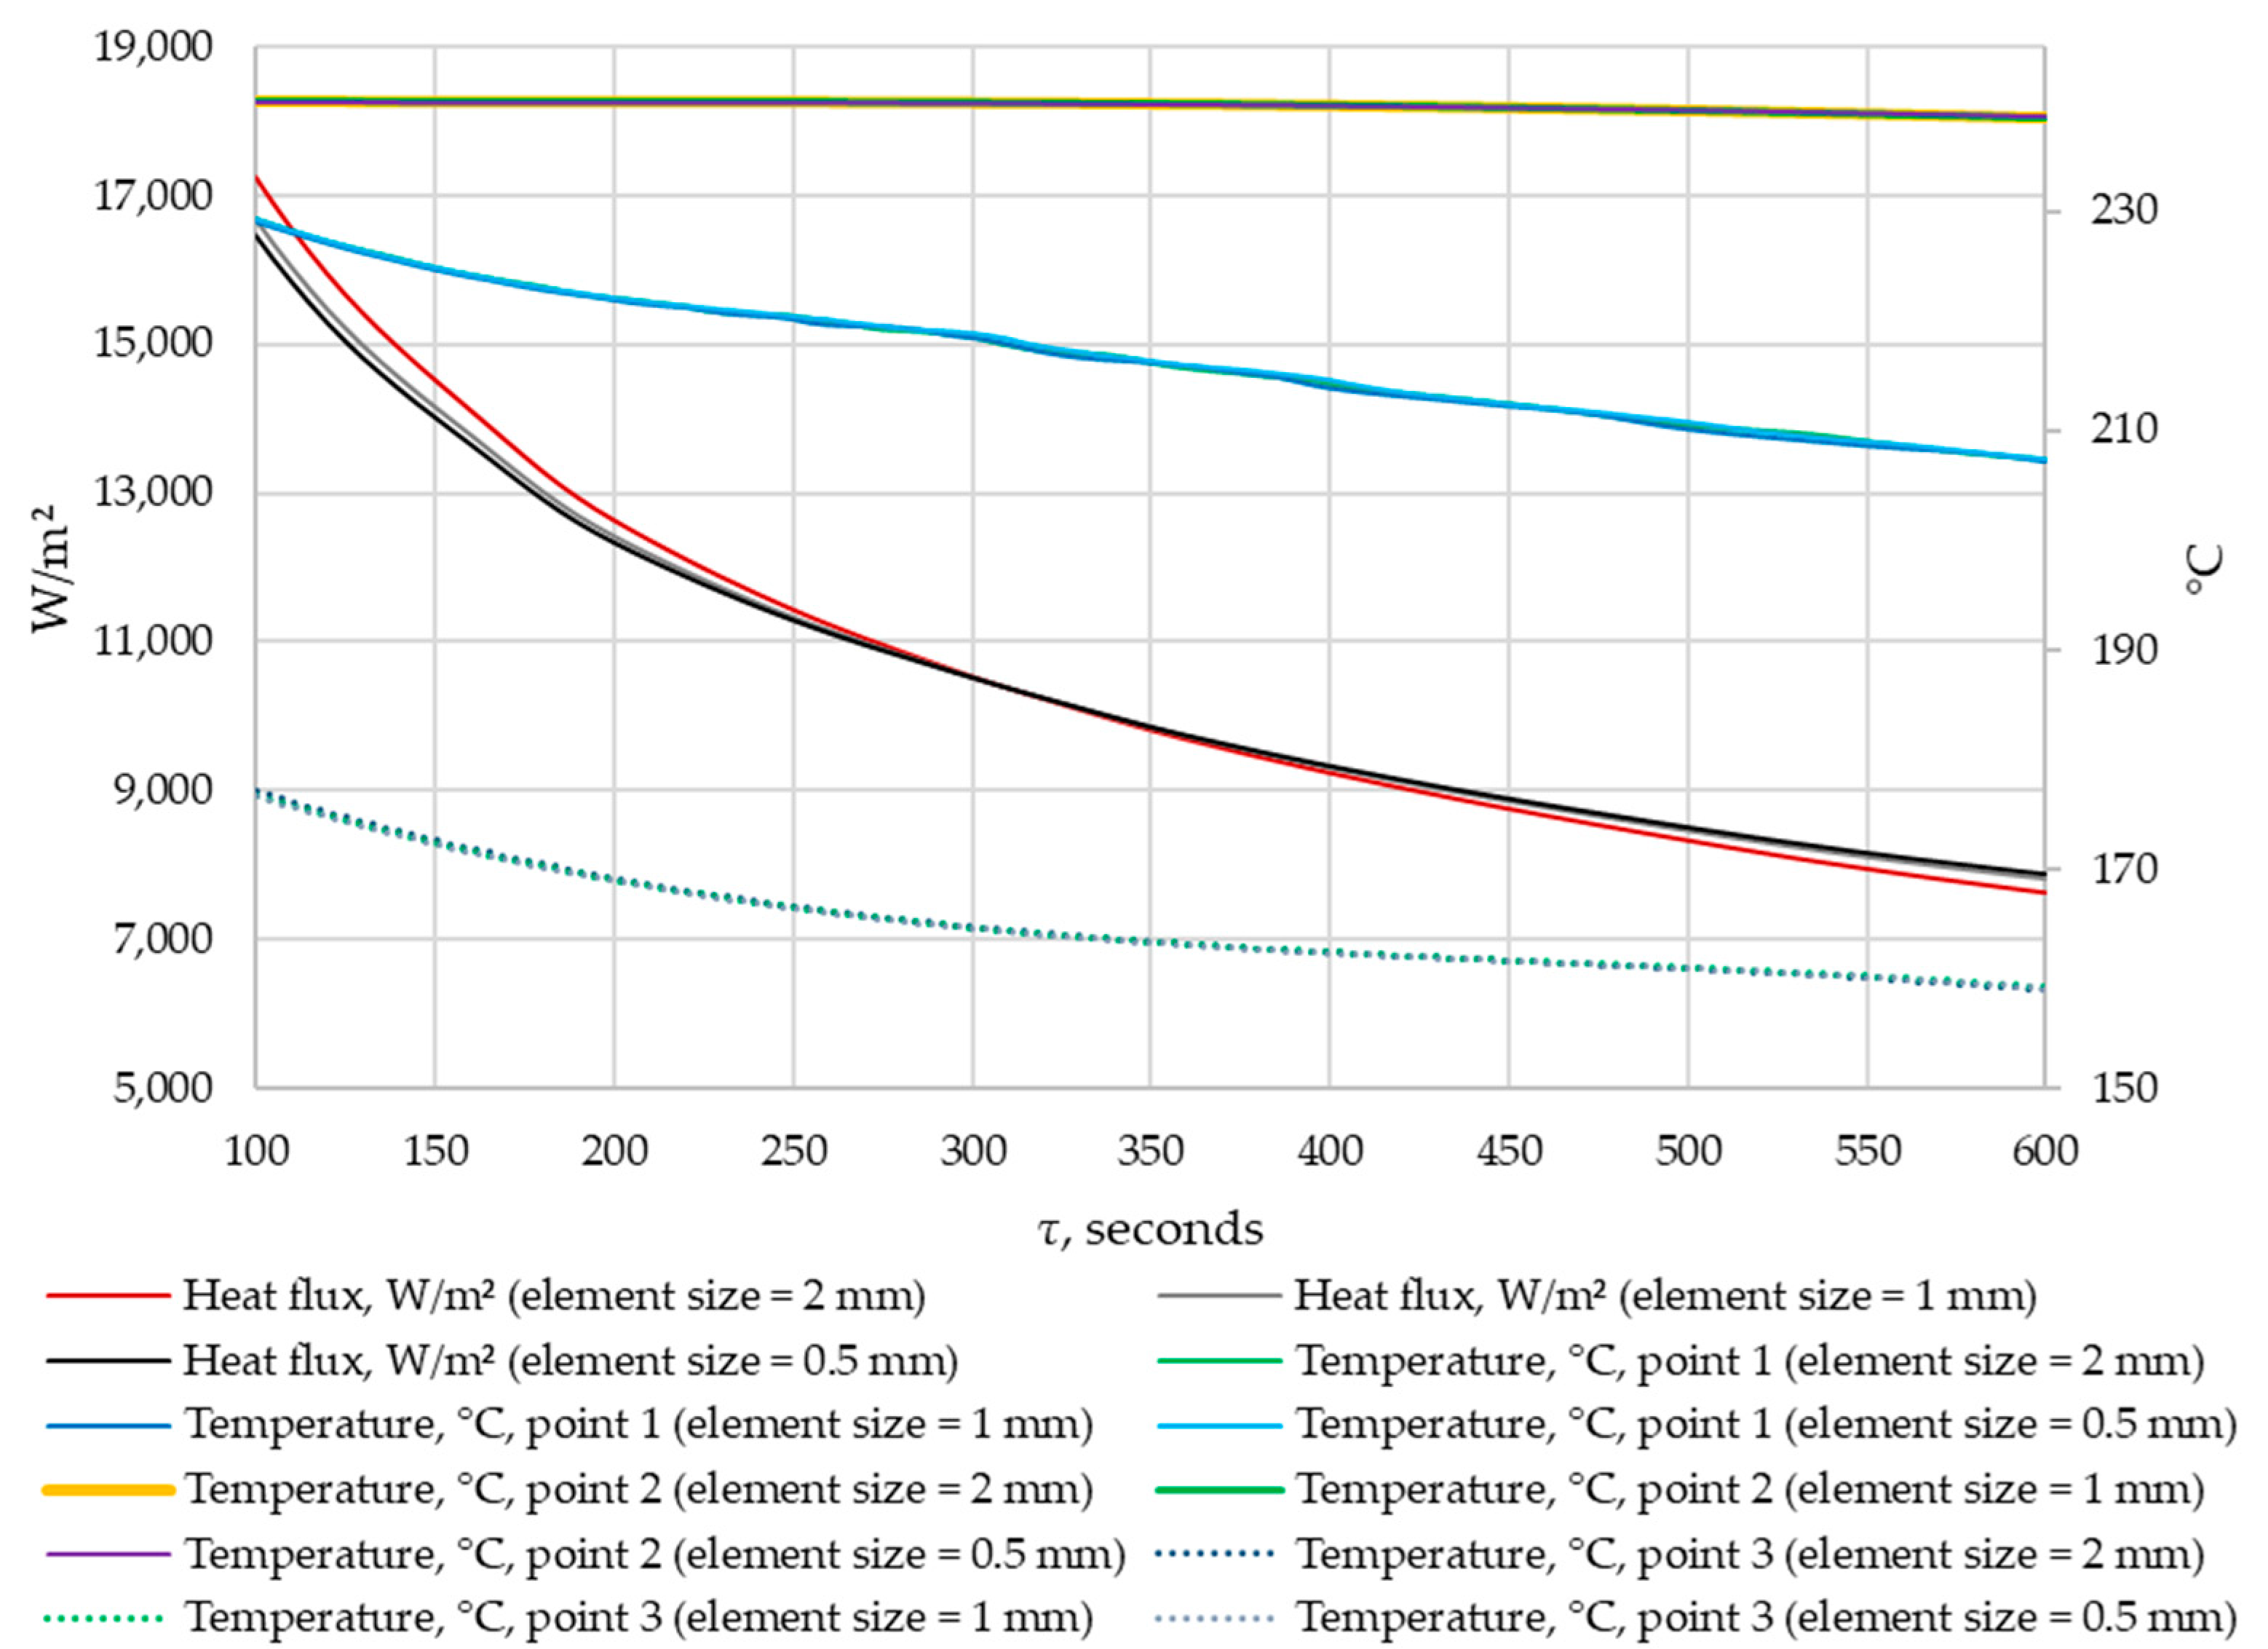
A grid-independence study was conducted. The results were compared for grids with elements of 0.5 mm, 1 mm, and 2 mm in size. The density of heat flow through the heat exchange wall and the temperatures in the control points were compared at corresponding time points. The results are shown in Figure 11 and Figure 12.
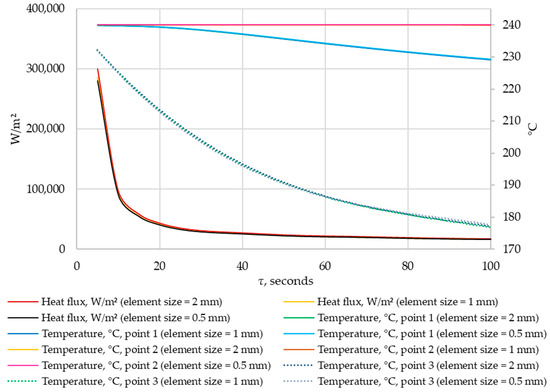
Figure 11.
The density of heat flow and temperature at control points at different mesh element sizes (τ = 0…100 s).
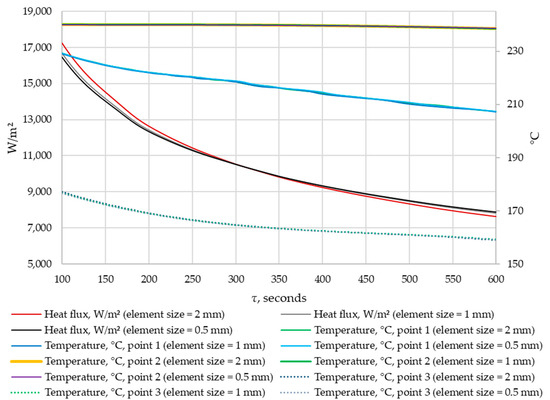
Figure 12.
The density of heat flow and temperature at control points at different mesh element sizes (τ = 100…600 s).
According to the data in Figure 11 and Figure 12, when the size of the grid element changes from 2 mm to 1 mm, the maximum deviation in heat flux density is 5%. When the size of grid elements changes from 1 mm to 0.5 mm, the maximum heat flux deviation is 1.8%. No significant changes in temperature were detected at the control points when the grid size changed.
Thus, the independence of the solution from the size of the mesh element is achieved when the size of a mesh element is 1 mm. This mesh element size is used in all simulations in this study.
3.2. The Results of the Experimental Verification of the ANSYS FLUENT Model
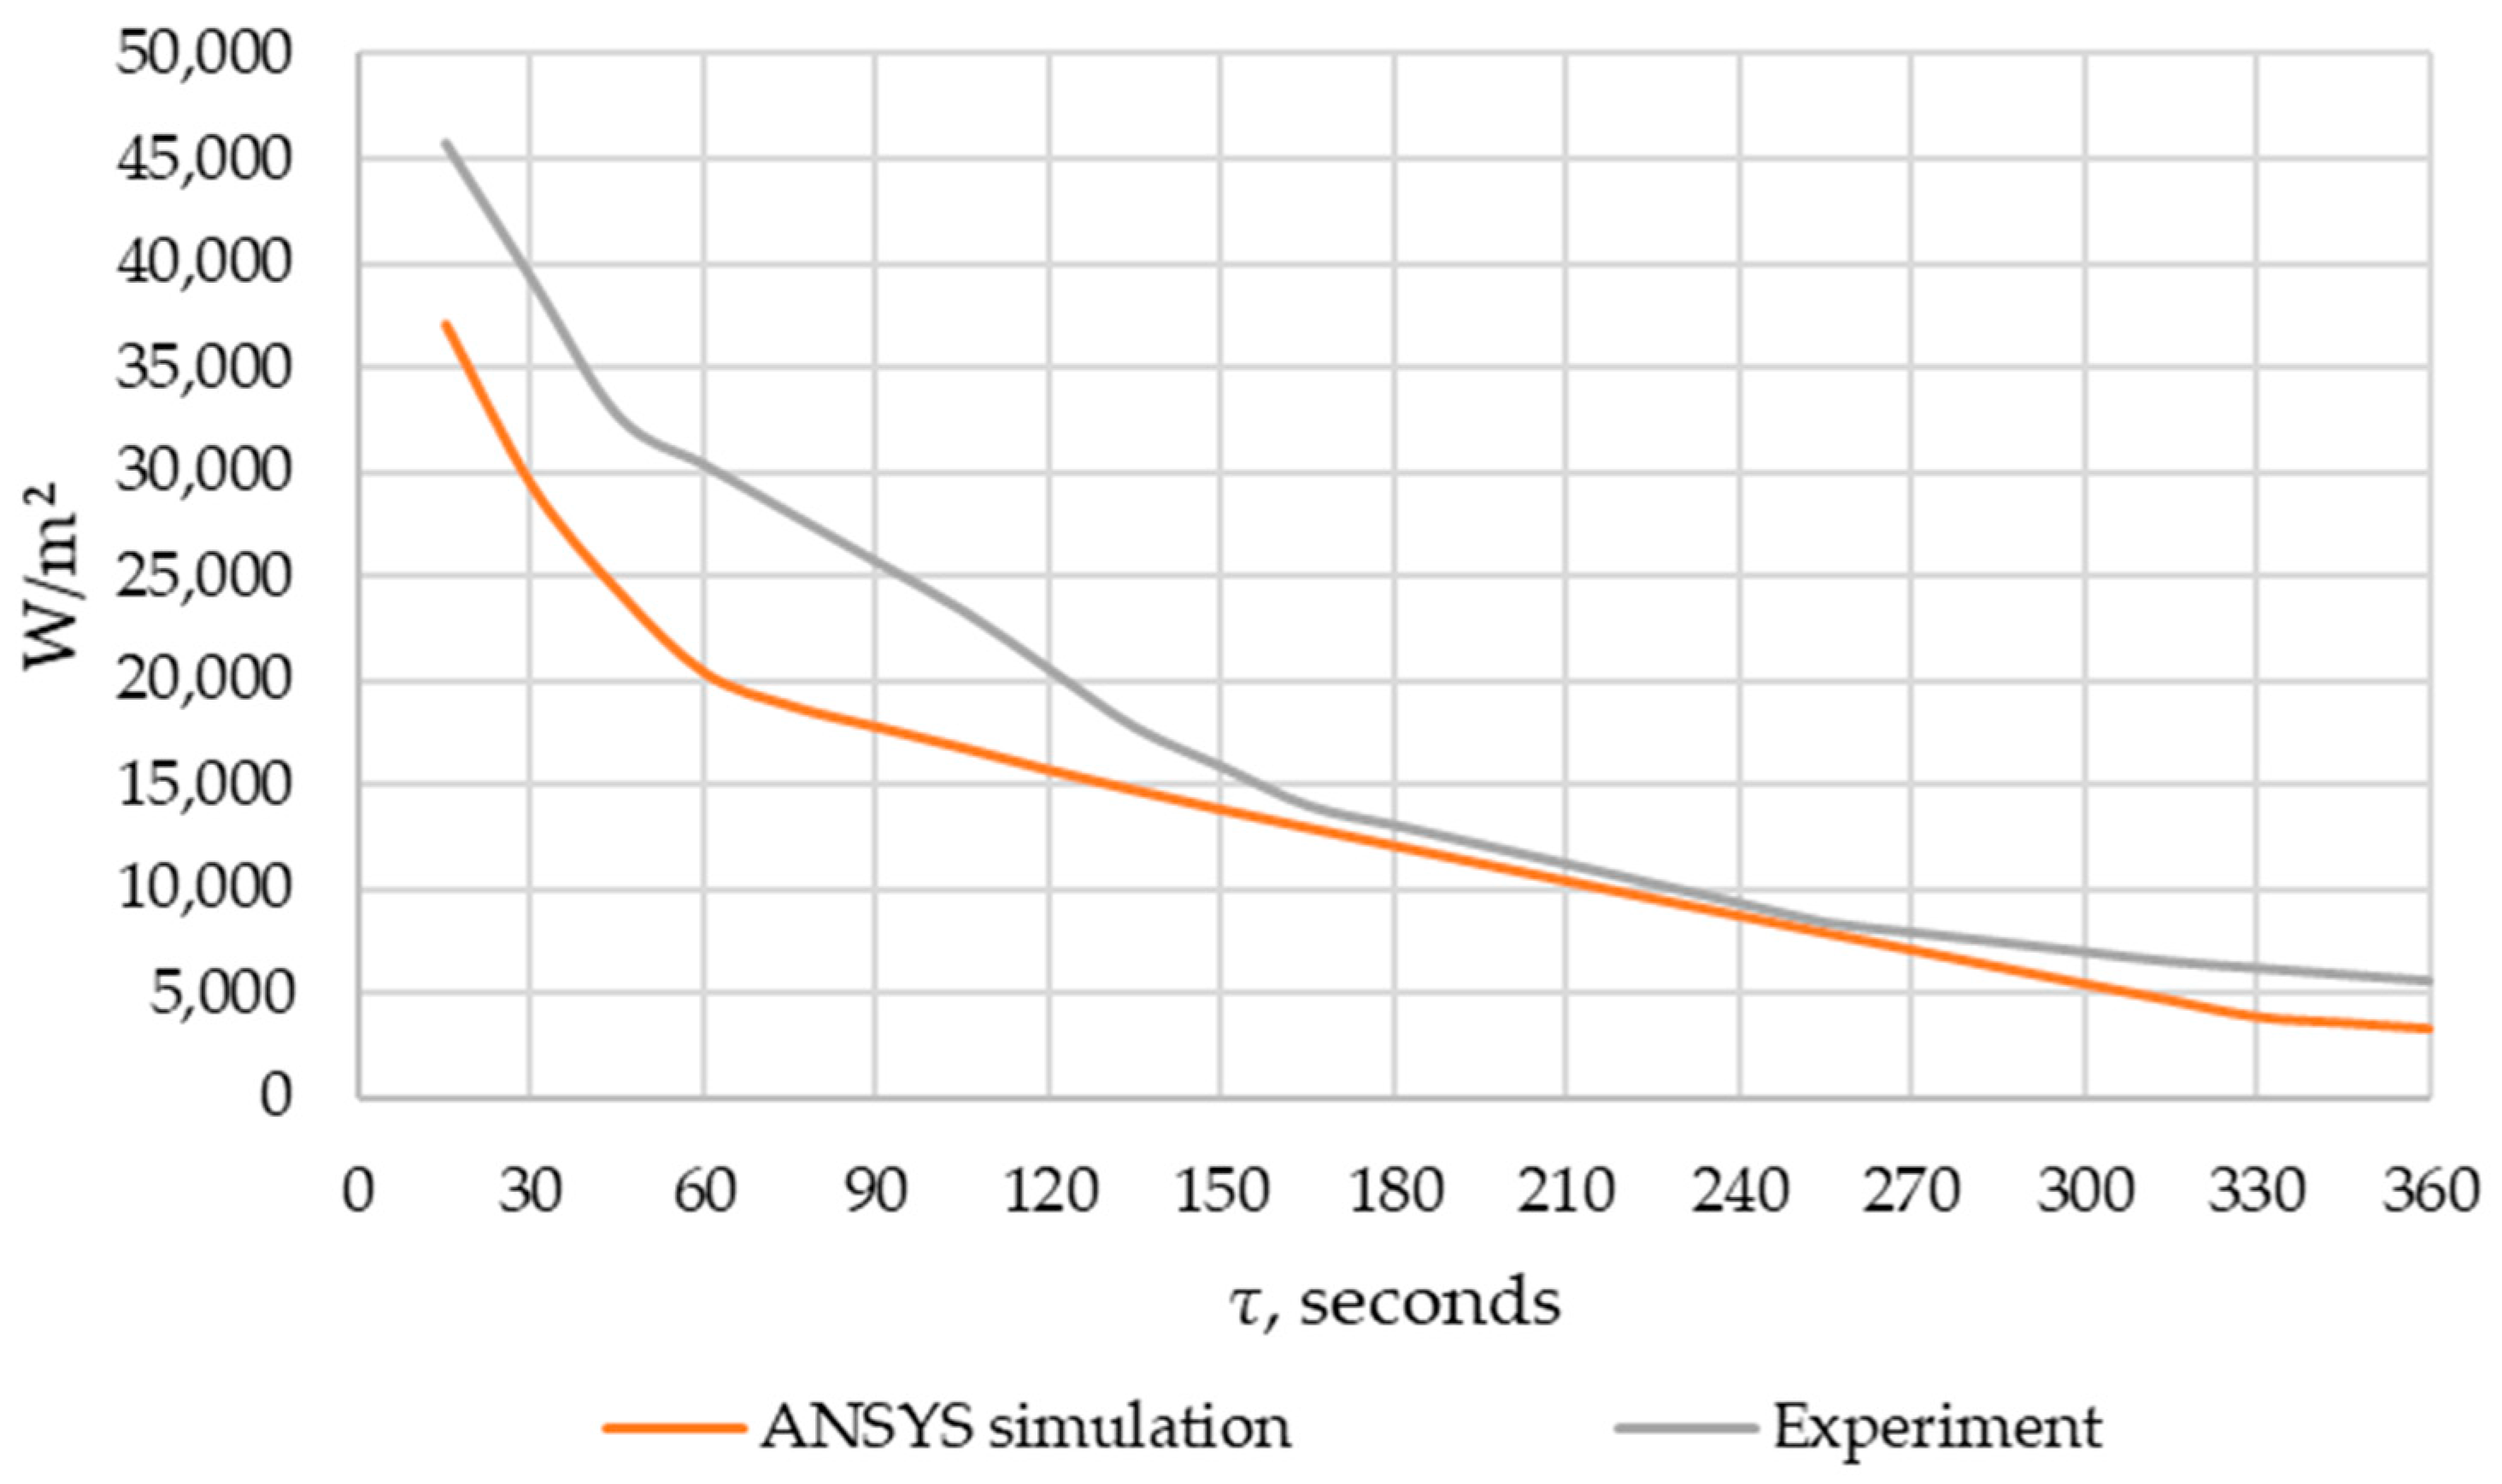
An experimental verification of the ANSYS FLUENT model was carried out in accordance with the description provided in Section 2.5. The results of heat flux densities obtained during the experiment and modeling in ANSYS FLUENT are shown in Figure 13.
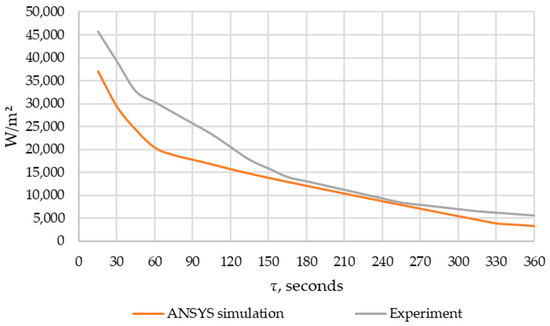
Figure 13.
Comparison of the heat flow obtained using modeling in ANSYS FLUENT and experimental data.
When comparing the experimental and simulated data using the Fisher test, the Fisher criterion calculated value was 25.0 while the tabulated value was 4.3. Since the calculated value was higher than the tabulated one, we concluded that the model was adequate (according to the description in Section 2.5).
3.3. Results of Topological Optimization of Heat Transfer Surface
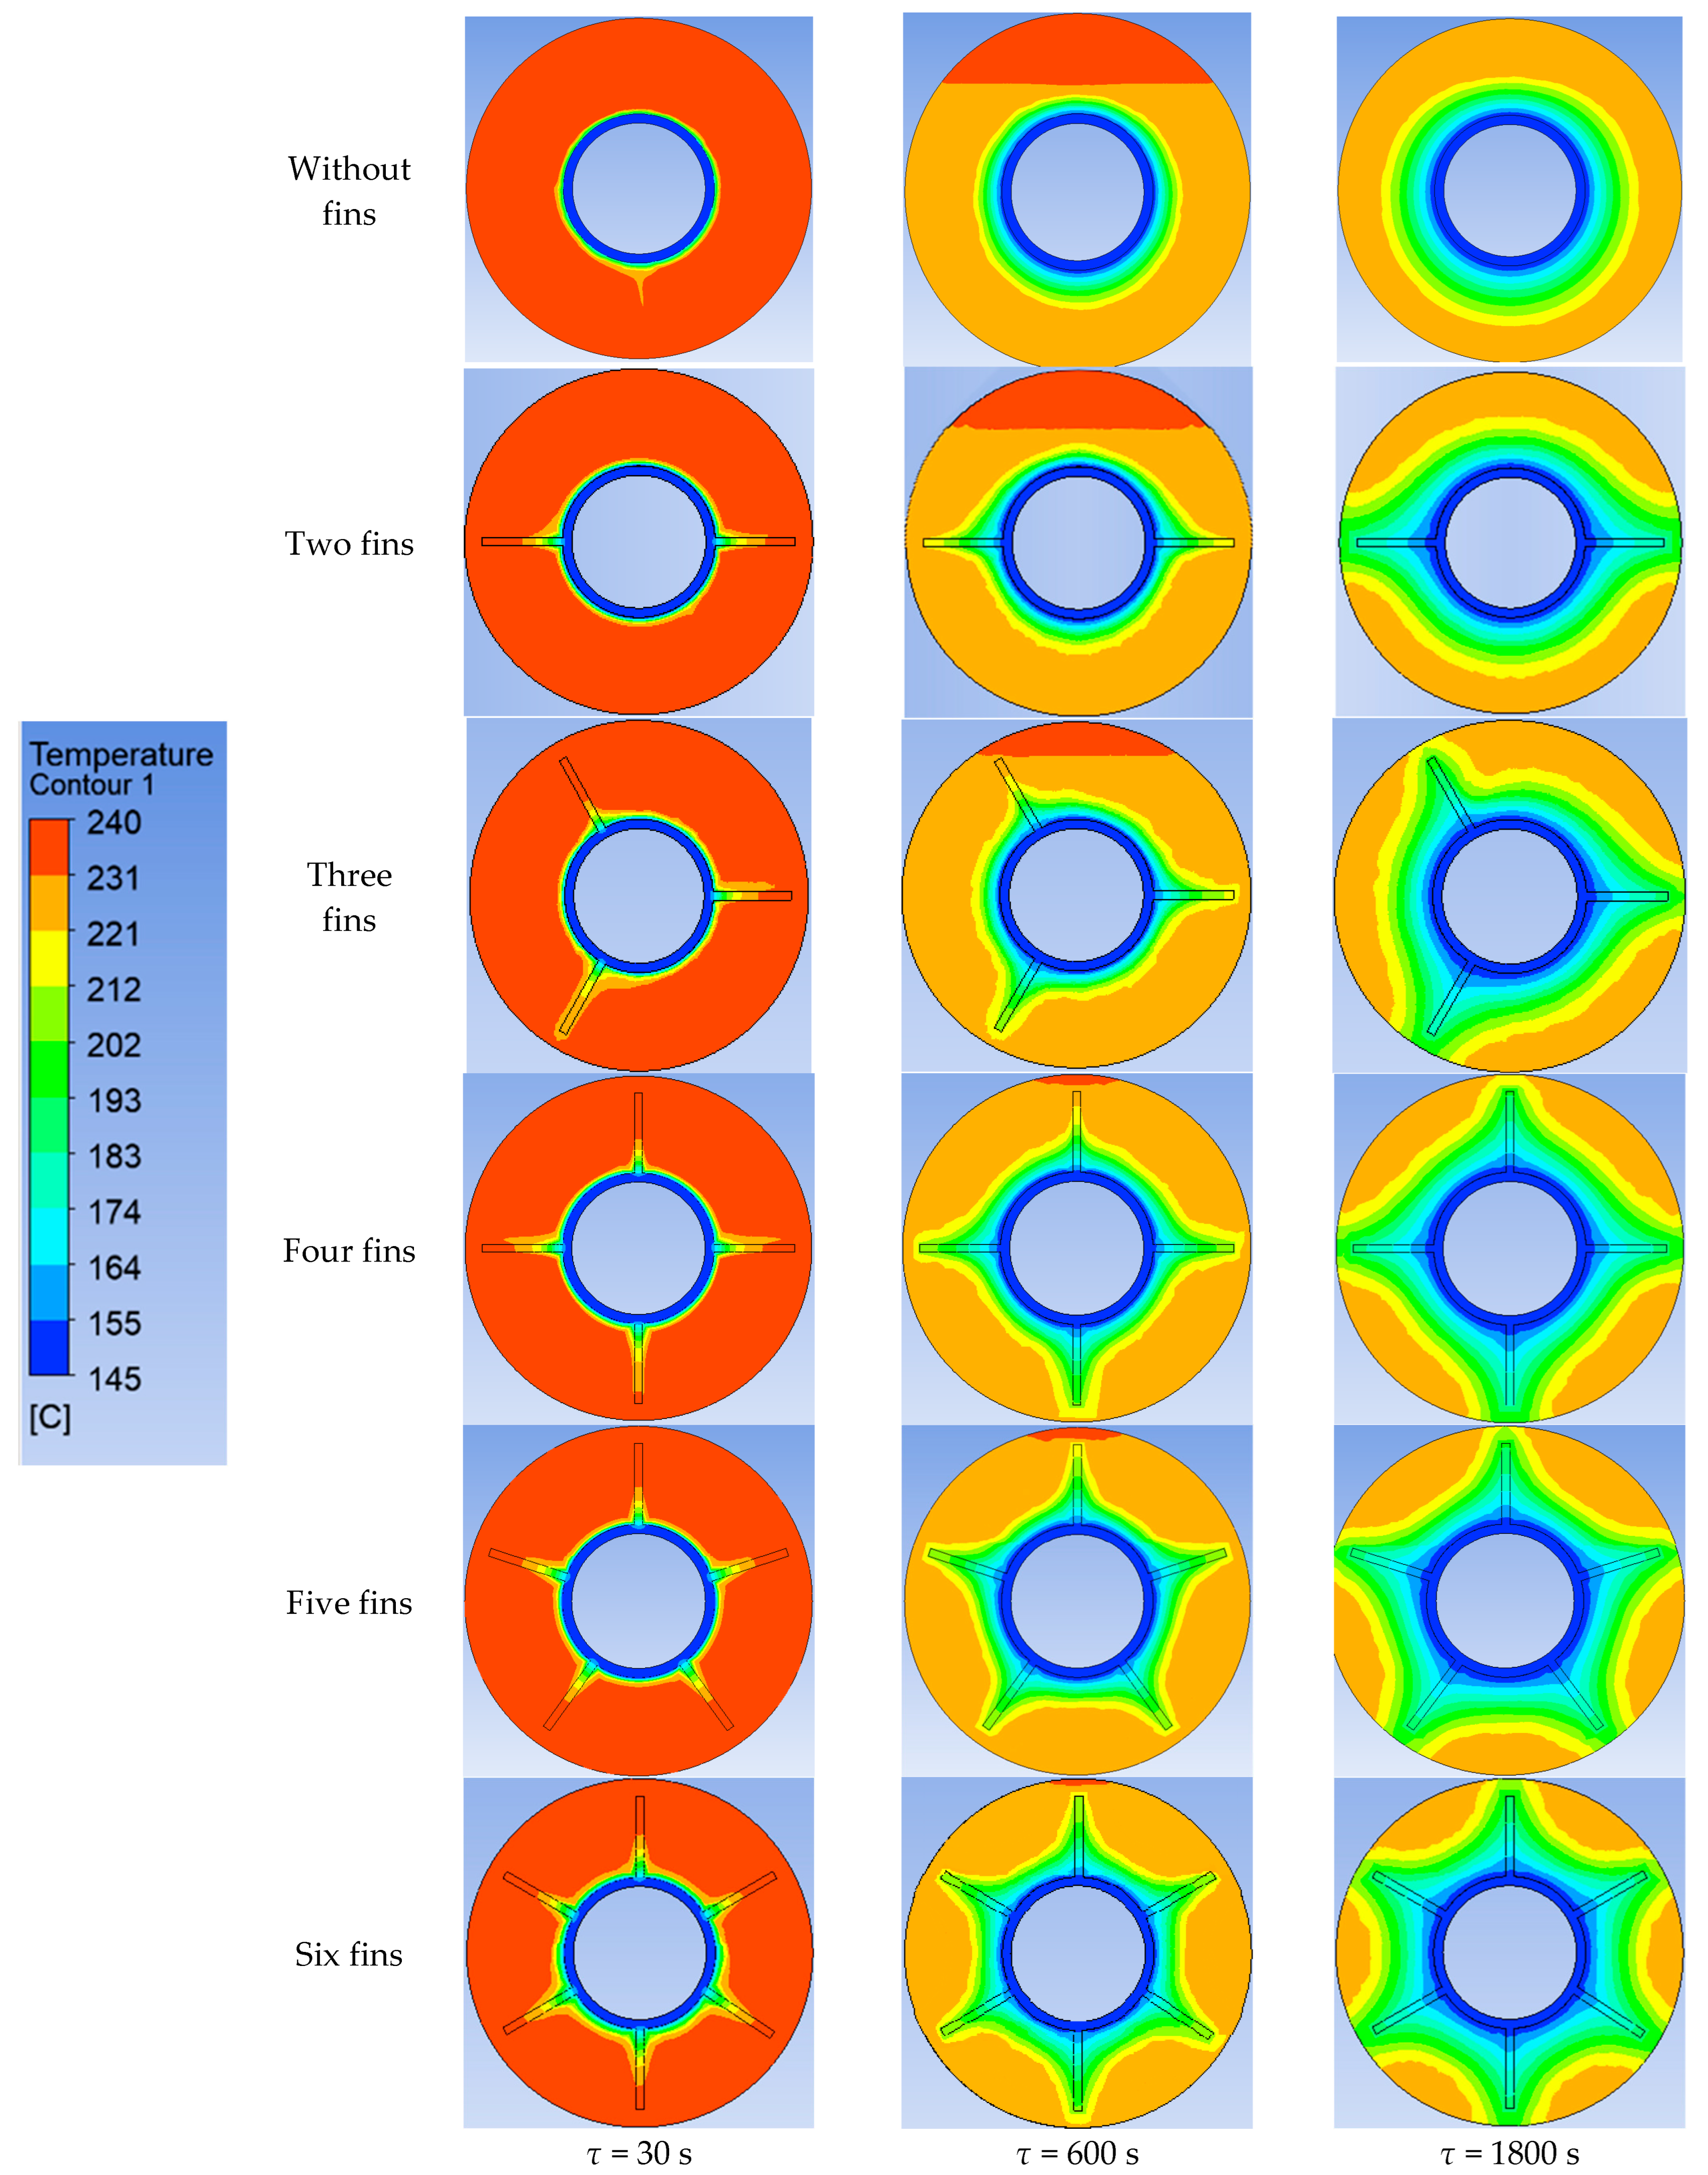
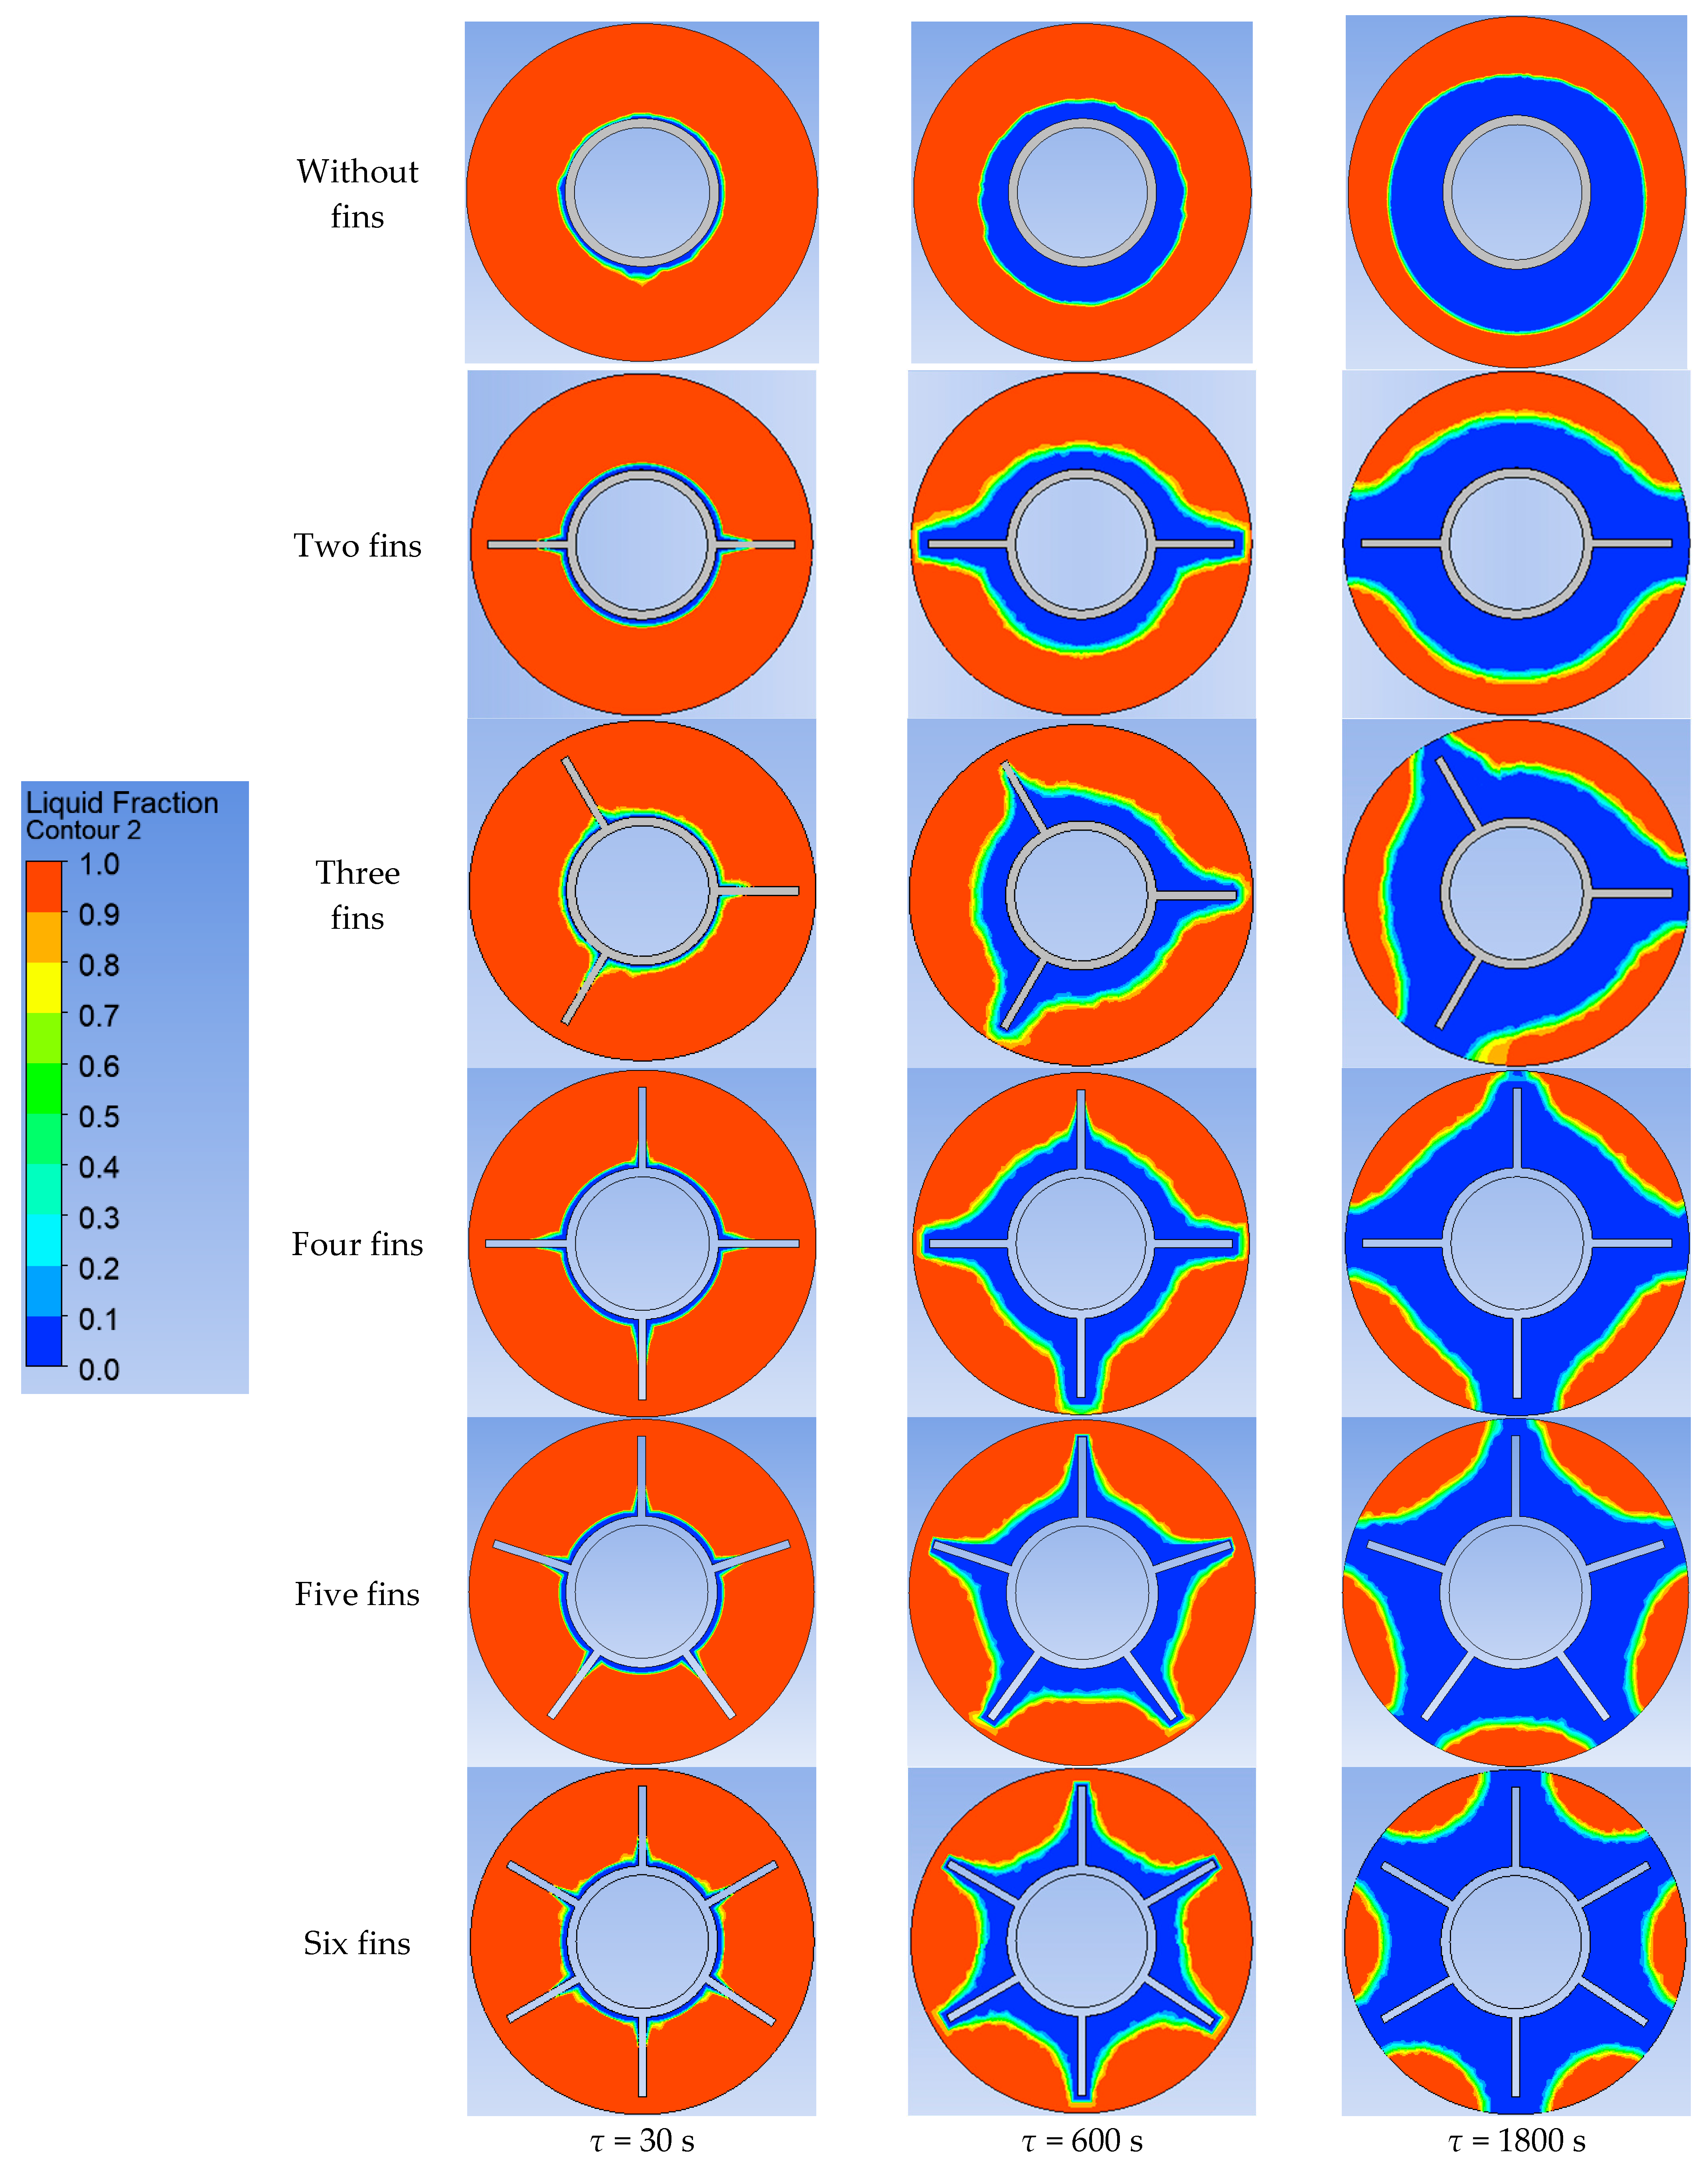
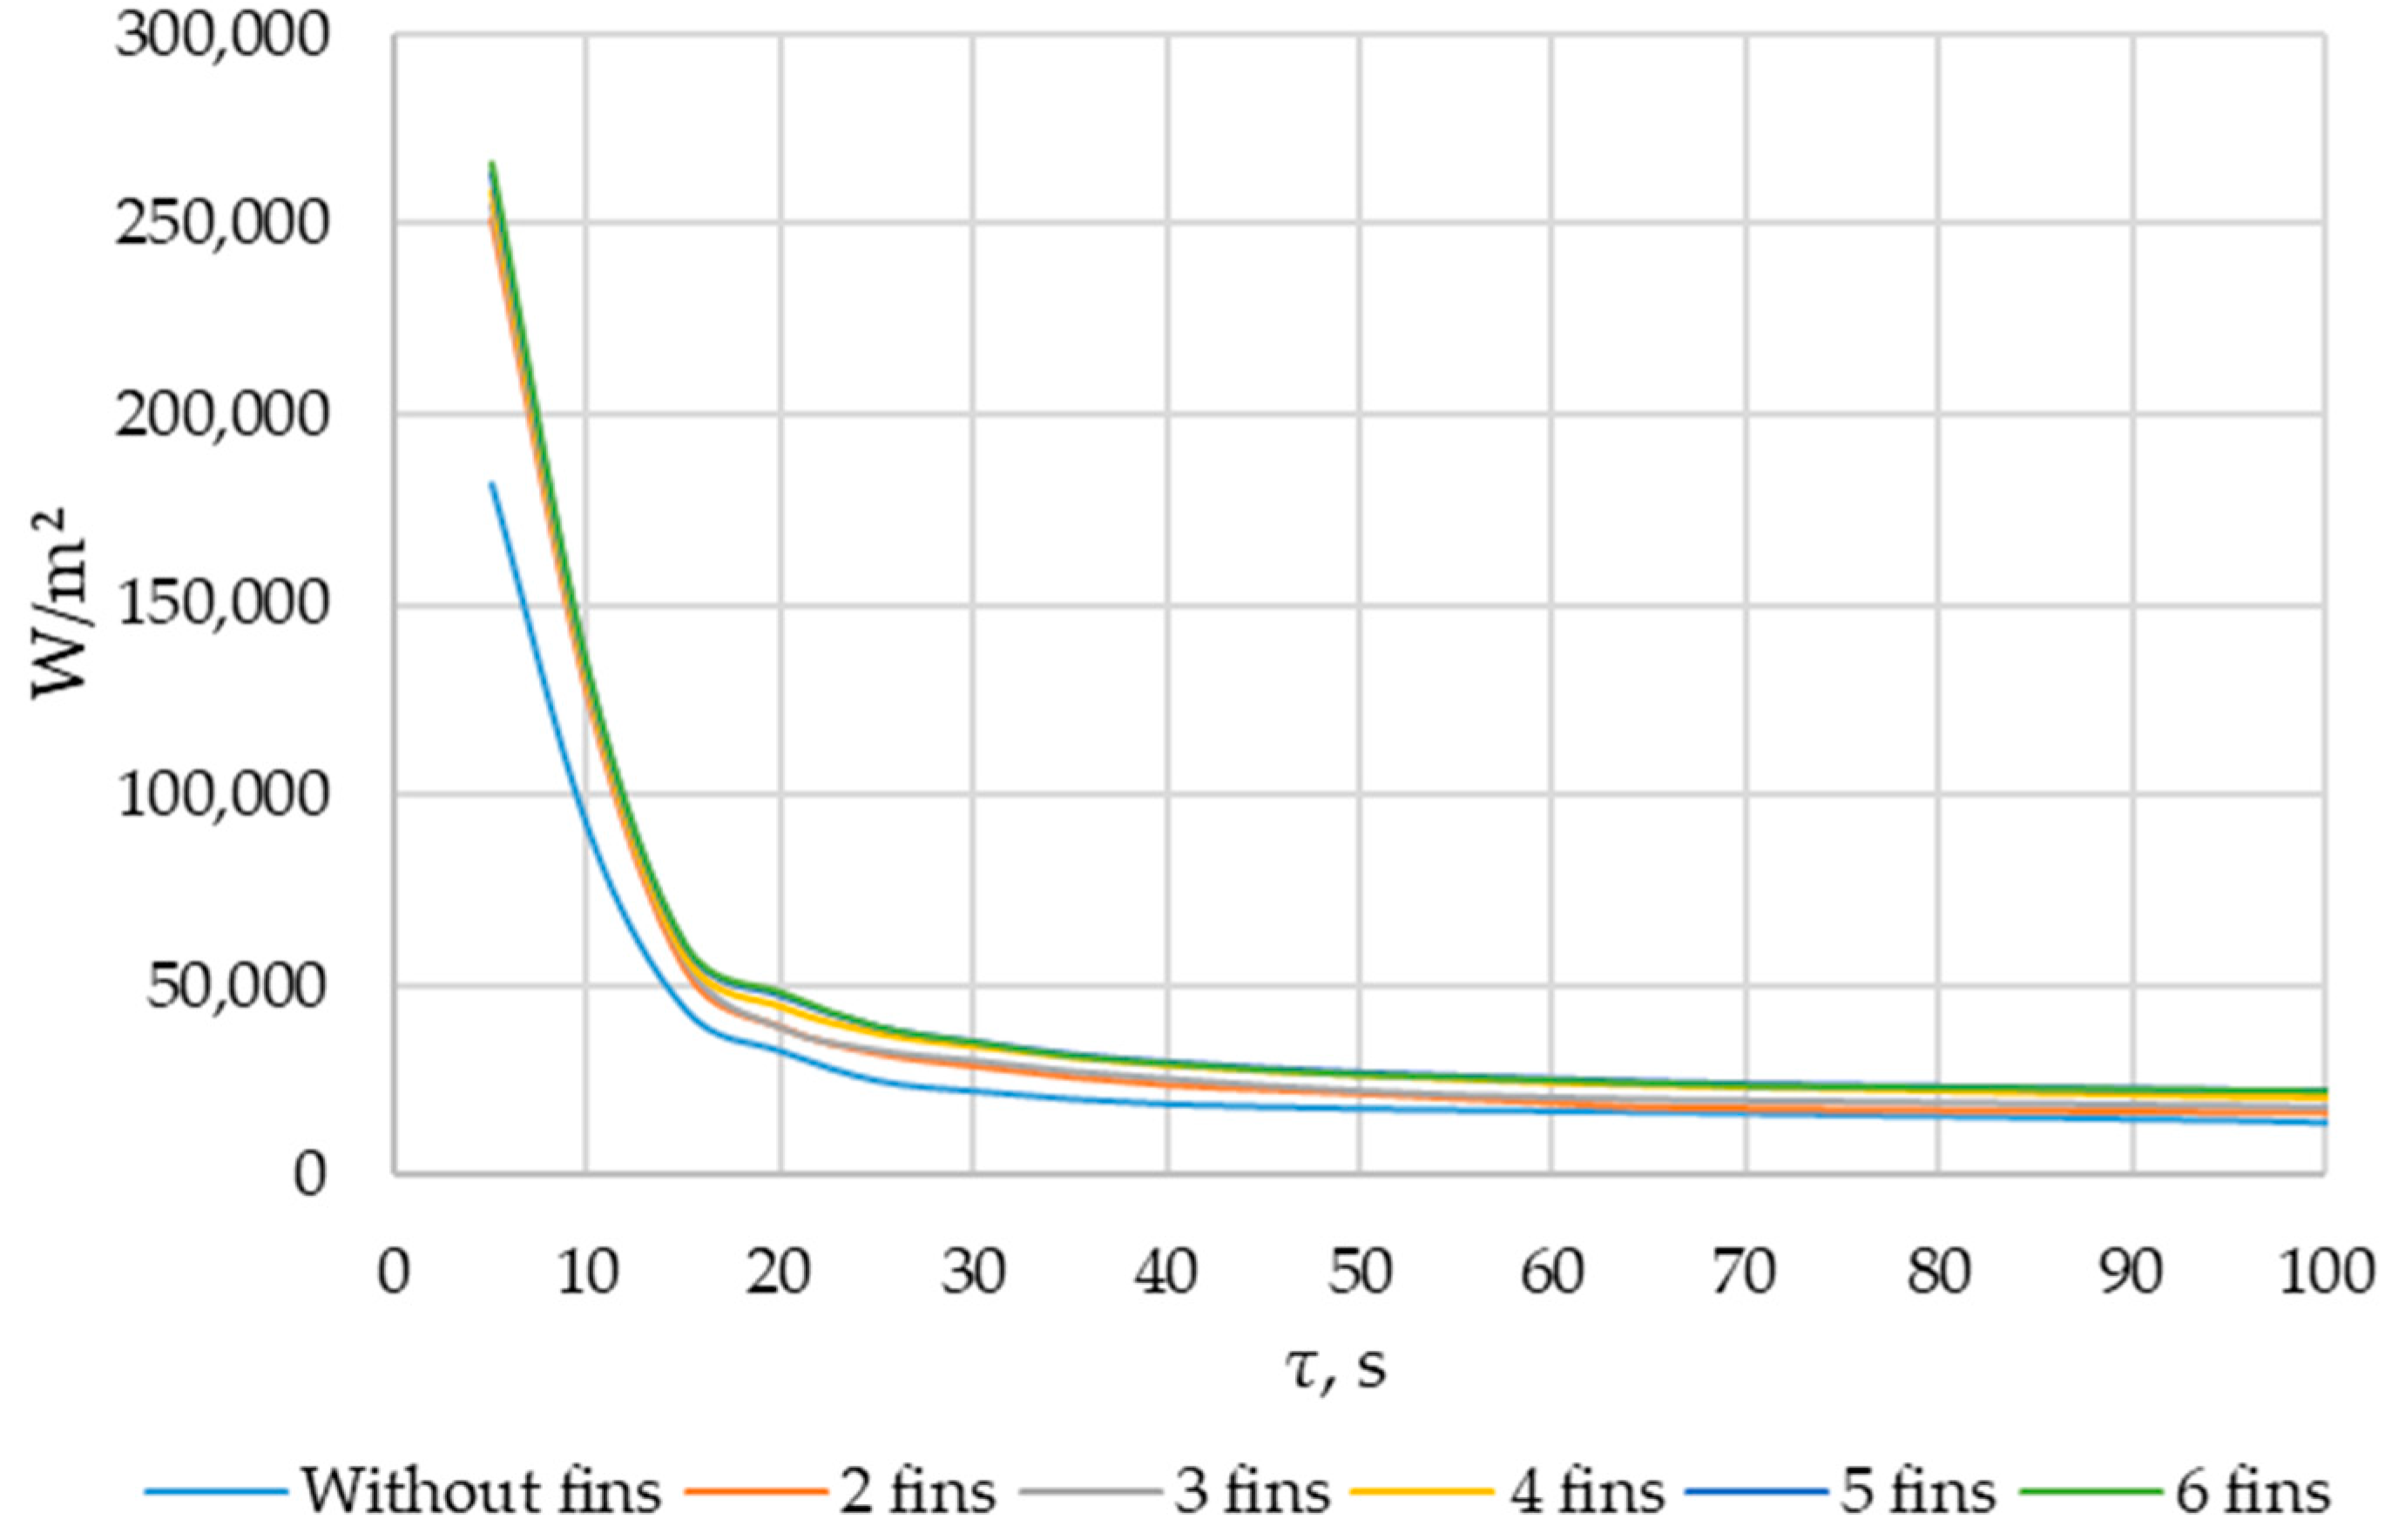
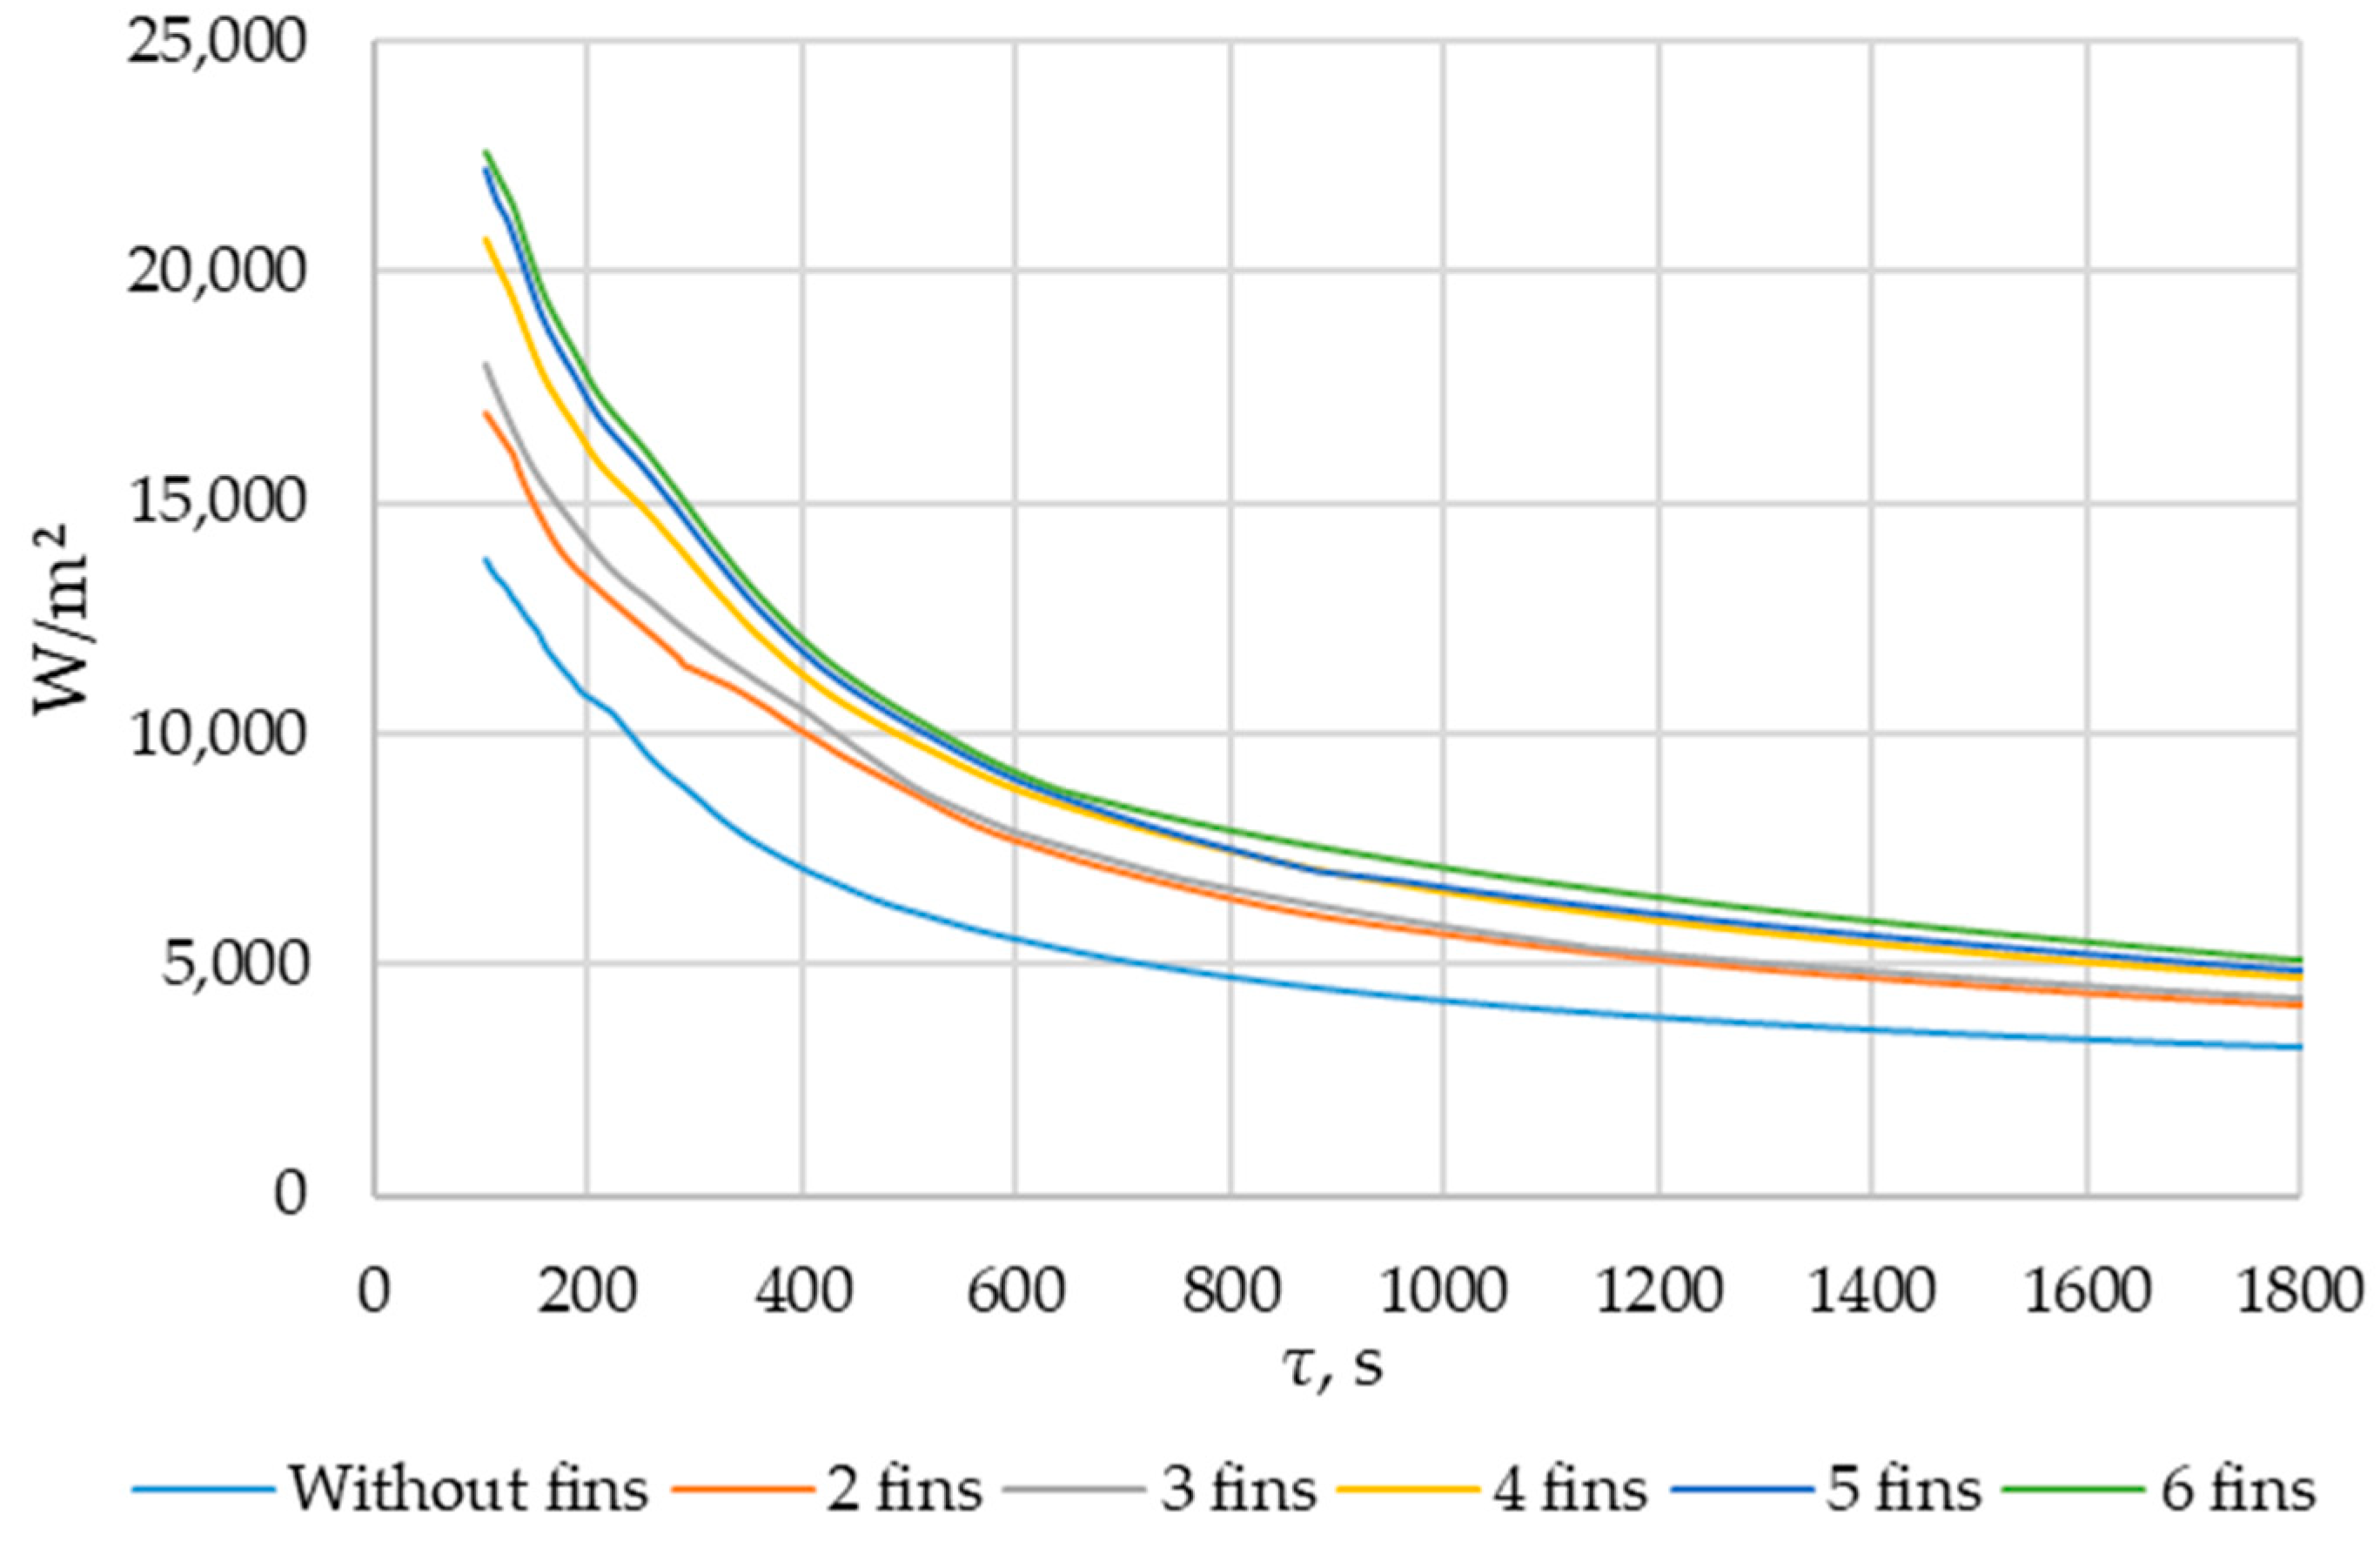
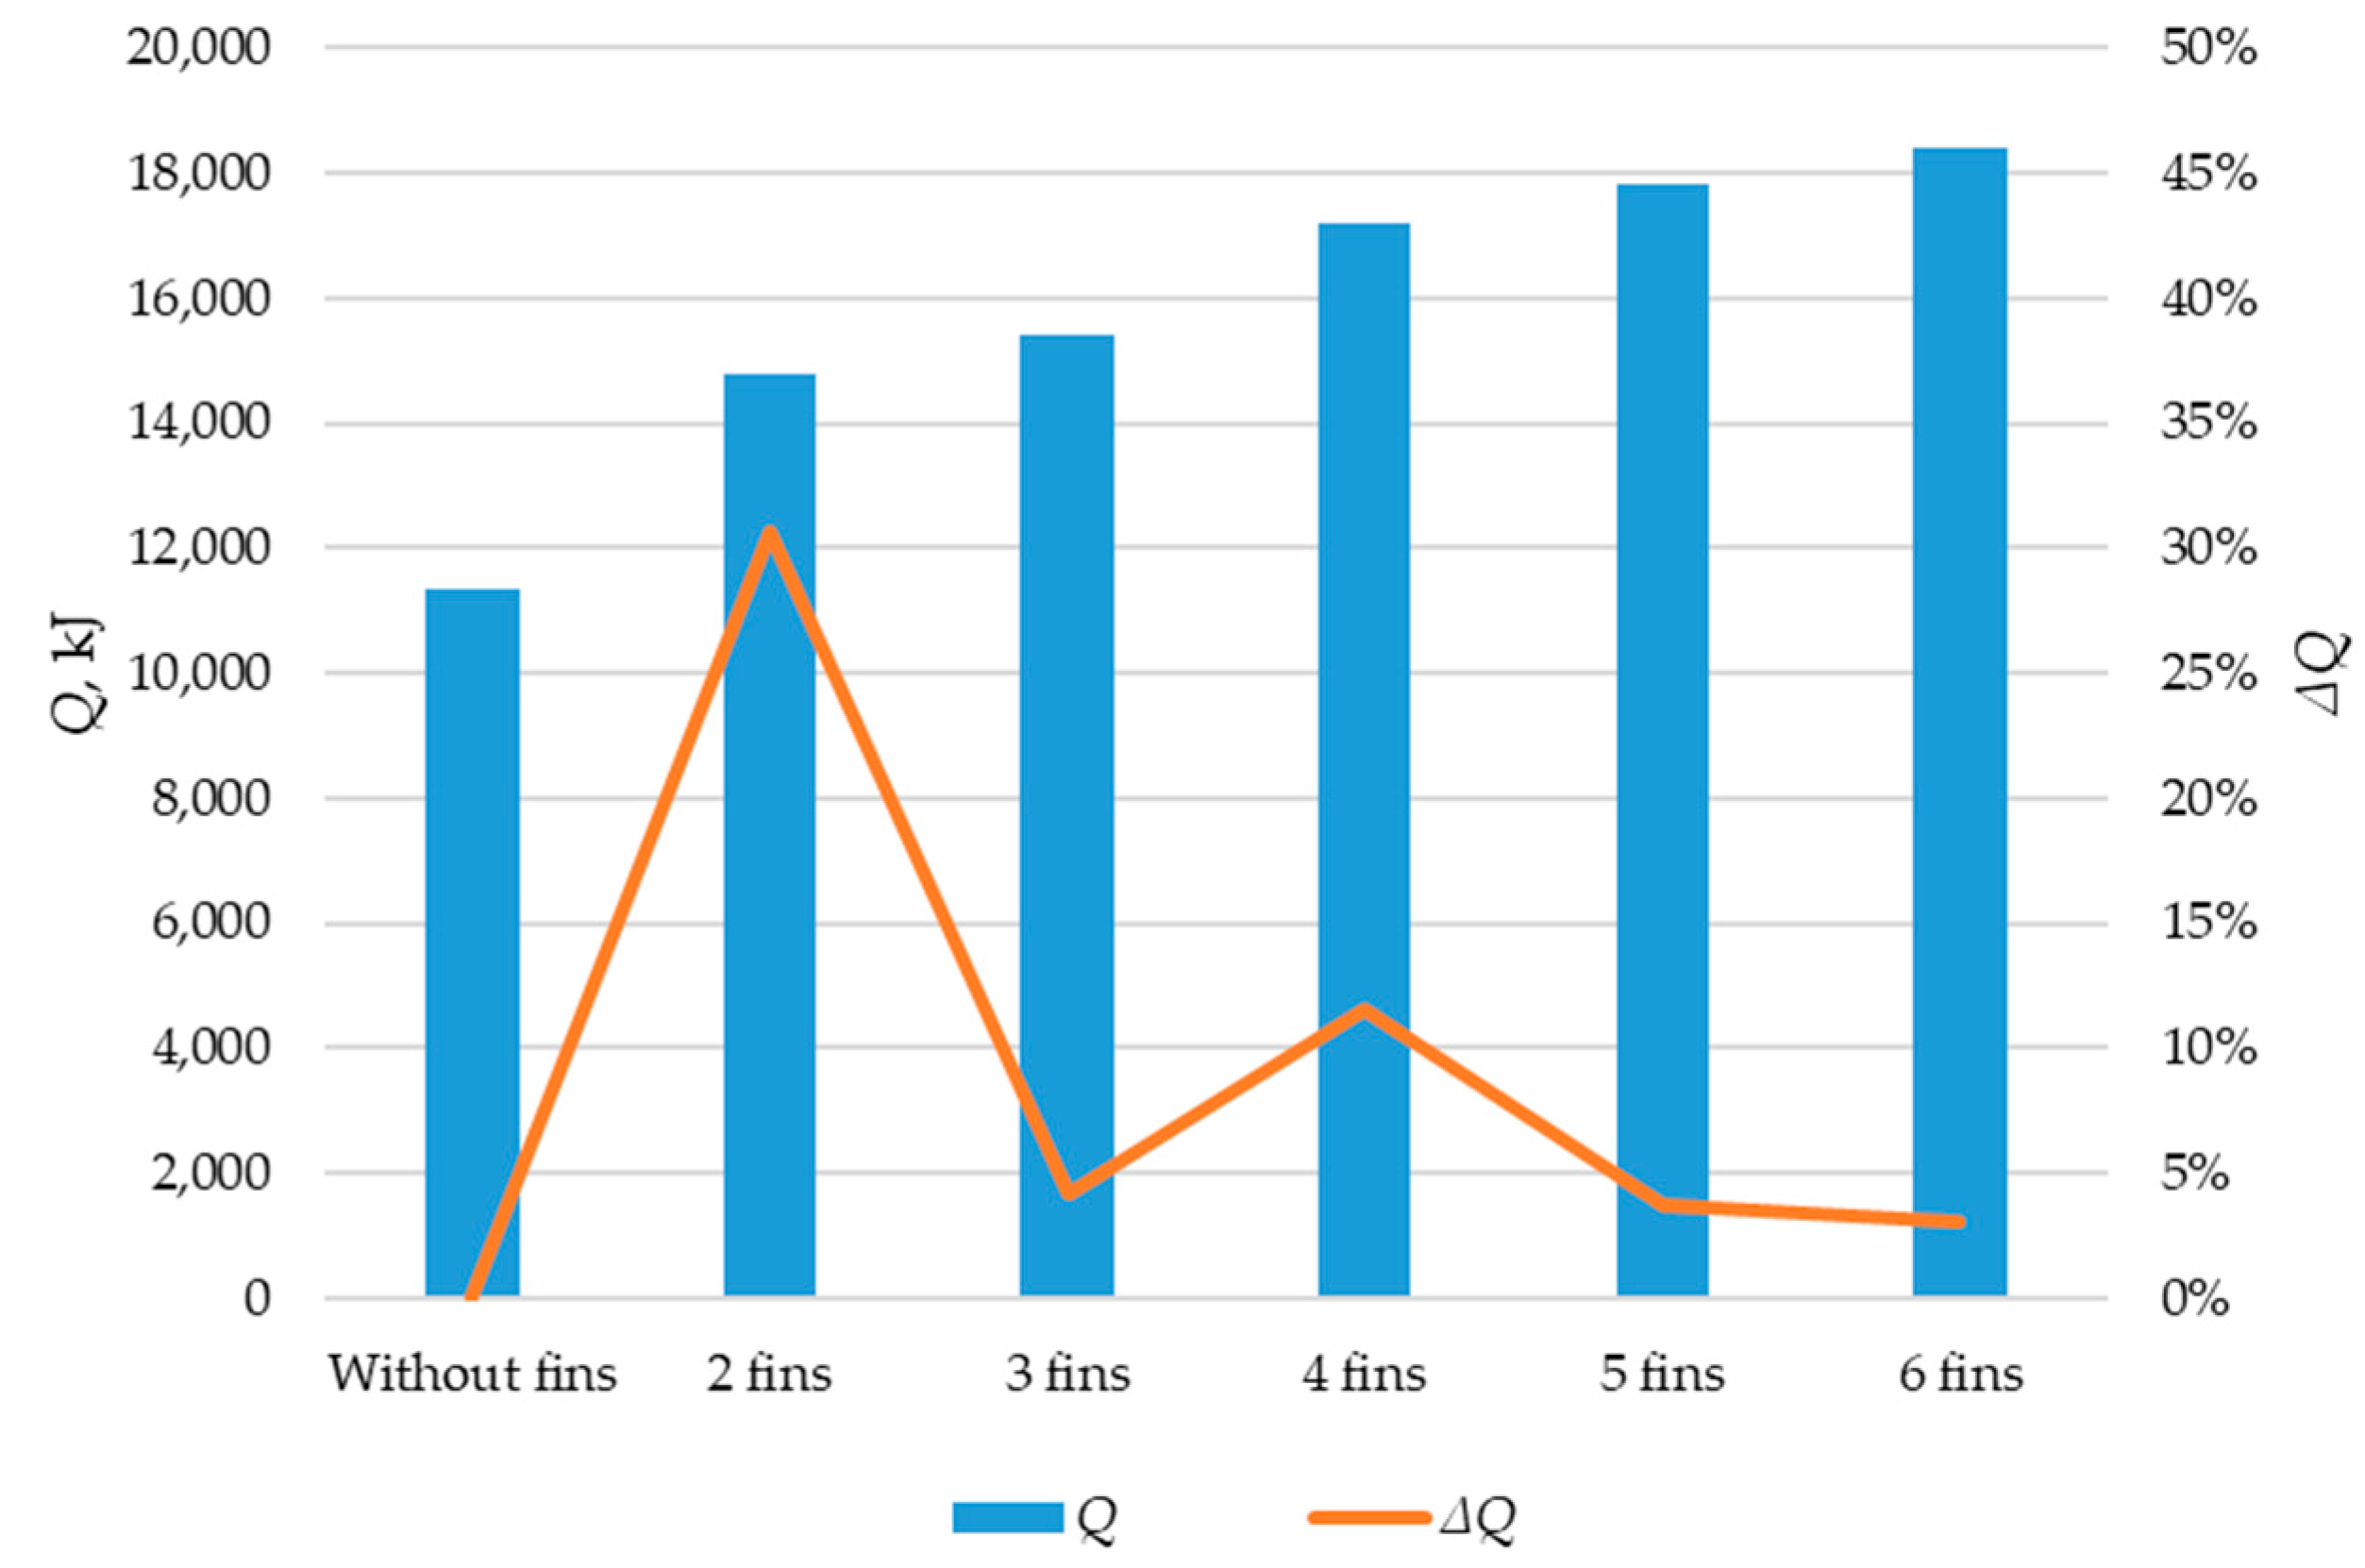
Using ANSYS FLUENT, we modeled the heat transfer between the PCM and the inner wall surface using various configurations of heat transfer surfaces: without fins and with two fins, three fins, four fins, five fins, and six fins (as described in Section 2.2 and Section 2.4). The results of this 2D simulation are shown in Figure 14, Figure 15, Figure 16, Figure 17 and Figure 18. The temperature on the inner surface of the heat exchange wall (on the side of the heat transfer fluid) was 145 °C (it corresponds to the temperature at the outlet of HPH №2 + 5 °C), and the initial temperature of the simulated area was 240 °C (it corresponds to the condensation temperature of fresh steam—5 °C). Figure 18 shows the total amount of thermal energy transferred through the heat exchange surface during the simulation period.
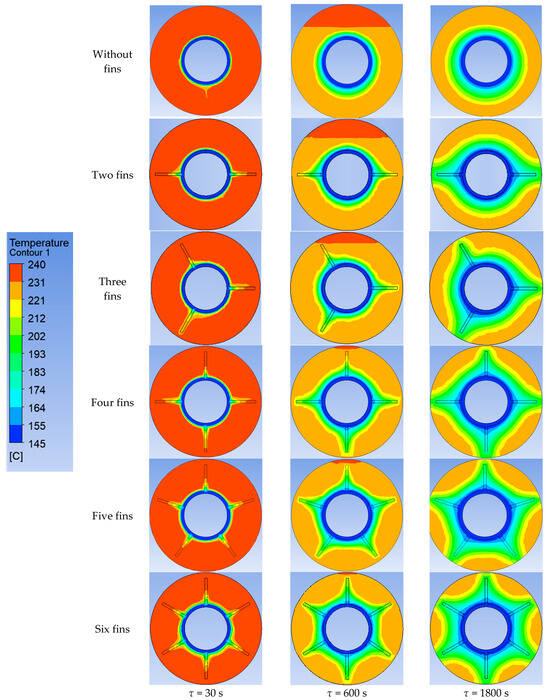
Figure 14.
Simulation results of heat transfer between the PCM and the inner surface of the wall using various heat transfer surface configurations. Temperatures in the simulated area.
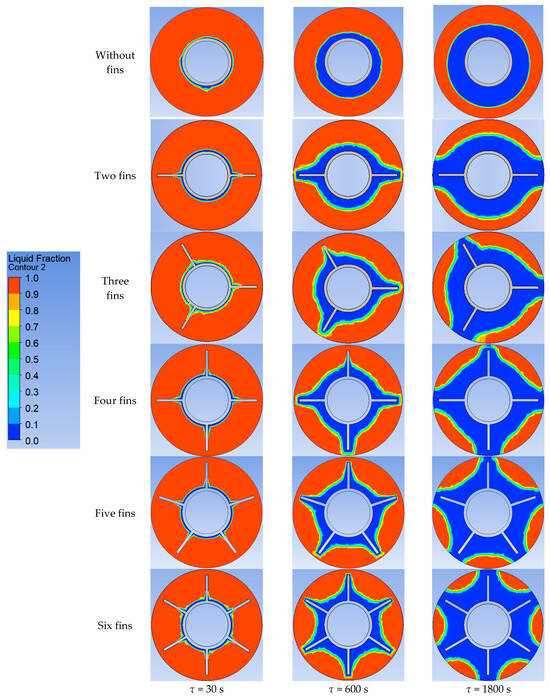
Figure 15.
Simulation results of heat transfer between the PCM and the inner surface of the wall using various heat transfer surface configurations. Liquid fraction of the PCM.
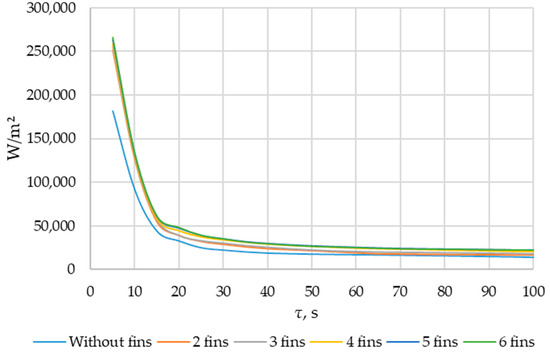
Figure 16.
Simulation results of heat transfer between the PCM and the inner surface of the wall using various heat transfer surface configurations. Heat flux density on the inner surface of the heat exchange wall (τ = 5…120 s).
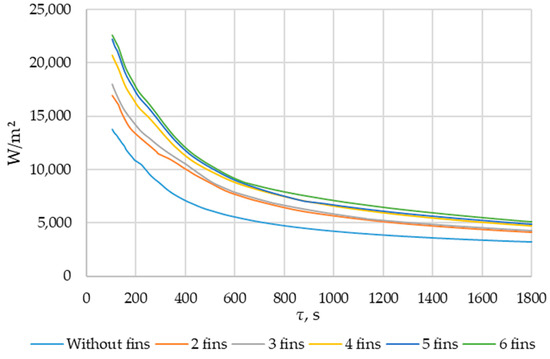
Figure 17.
Simulation results of heat transfer between the PCM and the inner surface of the wall using various heat transfer surface configurations. Heat flux density on the inner surface of the heat exchange wall (τ = 100…1800 s).
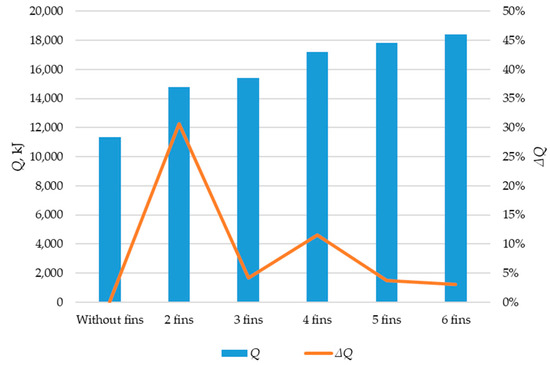
Figure 18.
Simulation results of heat transfer between the PCM and the inner surface of the wall using various heat transfer surface configurations. The amount of energy transferred during the simulation (Q, kJ). The increase in the amount of energy transferred during the simulation (ΔQ, kJ).
The heat flux density and the intensity of phase change increase with an increased number of fins. During the simulation period (1800 s), the heat flux decreased from 250,000… 270,000 W/m2 to 4000… 5000 W/m2 (when tubes with different numbers of fins were used as heat transfer surfaces). The heat flux density decreased from 170,000 W/m2 to 3000 W/m2 (when tubes without fins were used as heat transfer surfaces).
To verify the adequacy of the modeling in ANSYS, we compared our results with those of other researchers. The data for comparison are presented in Table 4.

Table 4.
Data about heat transfer when using a PCM from the current study and from studies by other researchers.
In the paper [108], the authors investigated the heat exchange between solar salt and high-temperature oil. The heat flux density decreased from 18,500 W/m2 to 2500 W/m2 over 1800 s in this study. Solar salt was located inside a spherical glass capsule, which was placed in a container containing oil.
The papers [109,110] present the results of studies on the heat exchange between a PCM (solar salt and pure NaNO3, respectively) and a thermal oil in a heat exchanger. The study [109] uses radial fins, and the work [110] uses a complex structure based on longitudinal fins.
The main parameter for comparison is the heat transfer coefficient between the heat transfer fluid and the PCM: kht = q/(Tpcm − THTF), W/(m2∙K). When comparing the heat transfer coefficients from our study to those of other authors, we found that they generally agreed with each other, indicating the validity of our results. However, some discrepancies were found.
The heat transfer coefficients at the end of the heat transfer process in studies [109,110] were significantly higher than in the current study. This can be explained by the fact that these studies used heat exchange surfaces with a larger fin area, resulting in a slower rate of heat transfer decrease. Additionally, the temperature differential between the heat transfer fluid and the PCM in [109,110] was 30–40 °C, while it was 95 °C in the current research. Due to this, the growth rate of the PCM solid layer during discharge in [109,110] was considerably lower than in our current research. This contributed to a more uniform heat transfer process compared to the current research.
The heat transfer rates at the start of the heat transfer process in [108,109] are lower than in the current study. This is due to the fact that heat accumulated in the heat exchange walls and the heat transfer inside these walls significantly affects the heat exchange during the initial stage of discharging the accumulator. Thus, with a wall thickness of 3 mm and the thermal conductivity of stainless steel λsteel = 16 W/(m∙K), the heat transfer coefficient can be kht = 16/0.003 ≈ 5000 W/(m2∙K). In our study, we used a 3.5 mm thick stainless-steel wall. In study [109], the wall thickness was 2 mm of steel, while study [108] used a silica glass wall, which had a significantly lower thermal conductivity. As a result, our current study shows a higher heat transfer coefficient at the beginning of the heat transfer process compared to other studies [108,109].
The greatest increase in the amount of energy transferred through the heat exchange surface occurs when comparing the tube without fins with a tube with two fins (30.4%). When comparing the two-fin tube to the three-fin tube, the amount of transferred heat energy increased by 4.2%. Comparing the three-fin tube to the four-fin tube, the increase was 12.1%. Adding a fifth and sixth fin resulted in further increases of 3.7% and 3.1%, respectively, in transferred heat.
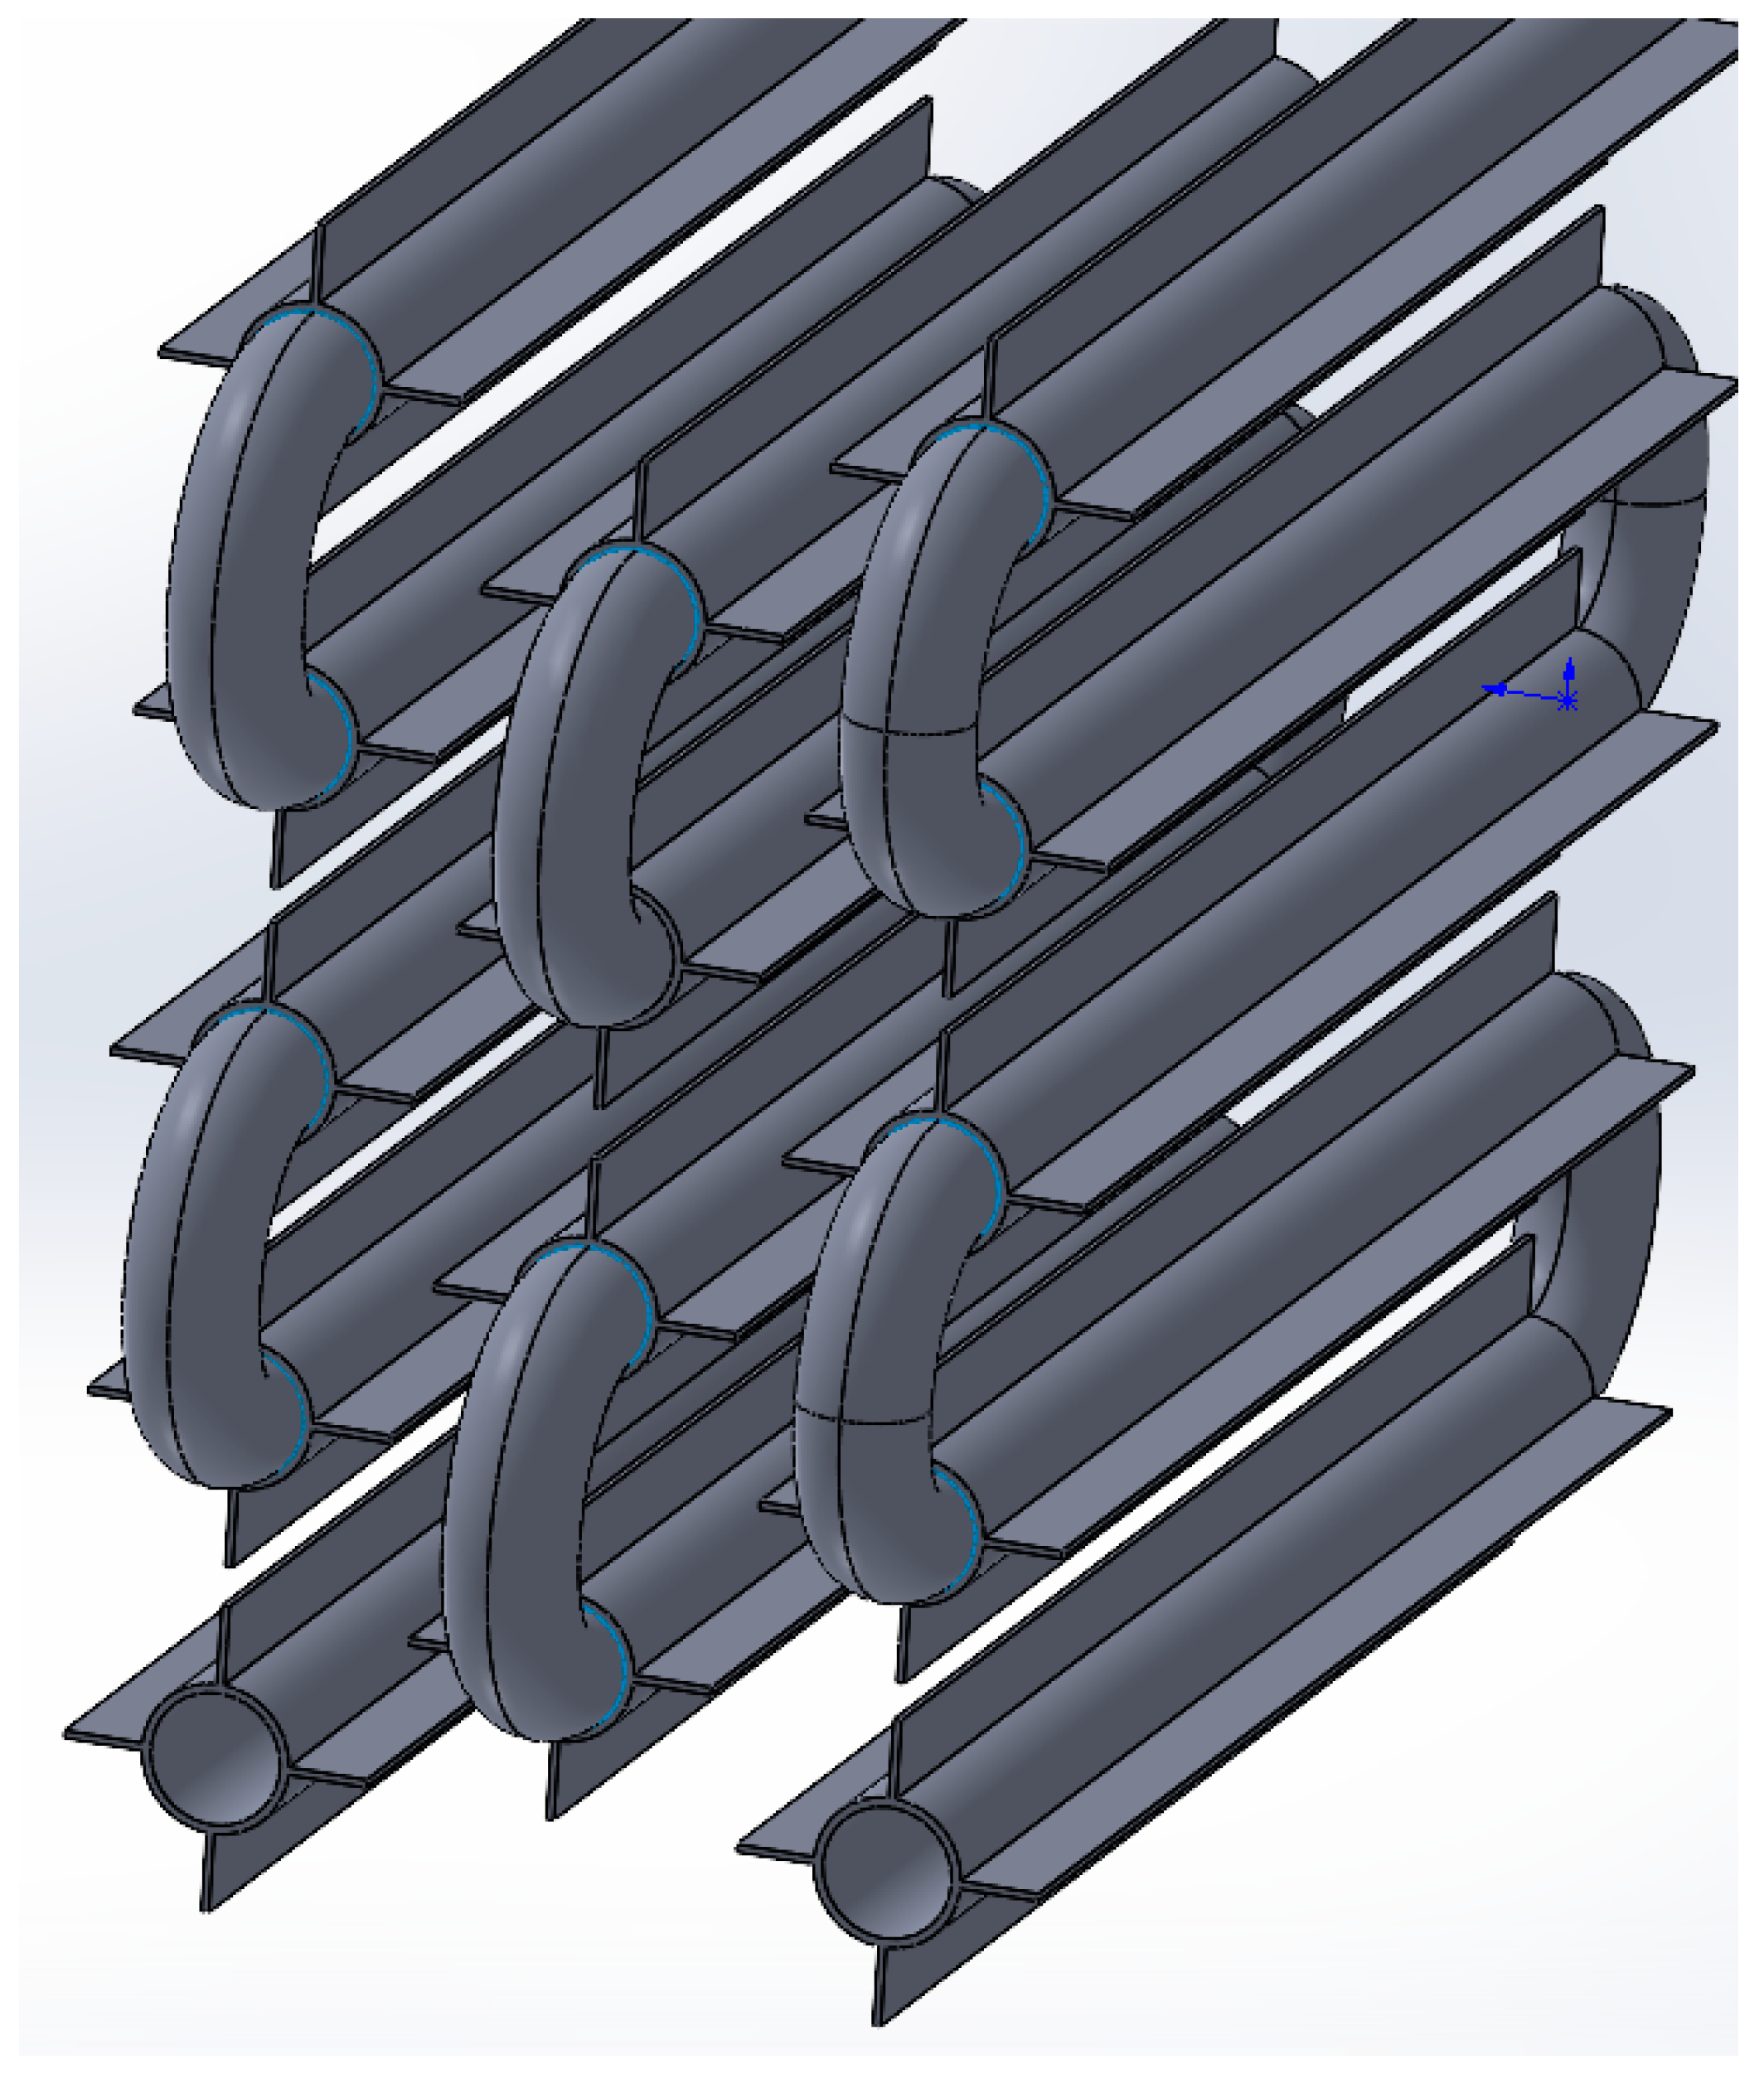
Thus, the four-fin design is the most optimal. A further increase in the number of fins does not significantly increase the amount of energy transferred through the heat exchange surface. A coil heat exchanger with heat intensification due to four longitudinal fins is shown in Figure 19.
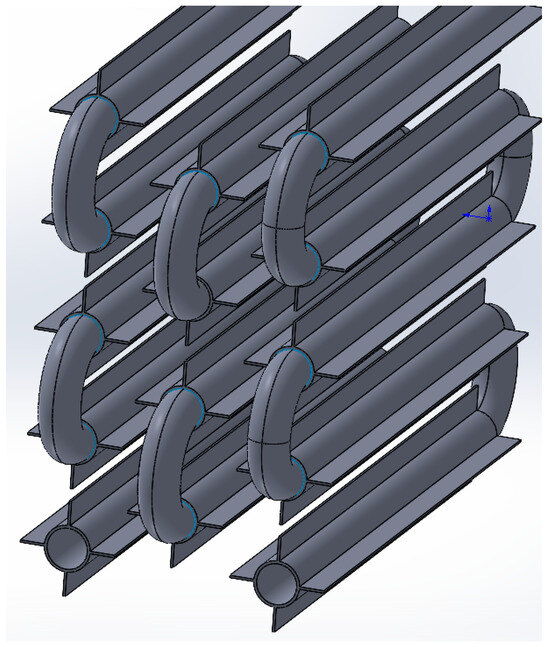
Figure 19.
A coil heat exchange surface with heat intensification due to four longitudinal fins.
As shown in Figure 19, the straight sections of the heat exchange surface have four longitudinal fins. The connections between the straight sections are made with connector bends without fins. Straight sections of the surface are staggered.
3.4. ANSYS Simulation of Heat Transfer at Different Tube Wall Temperature Conditions
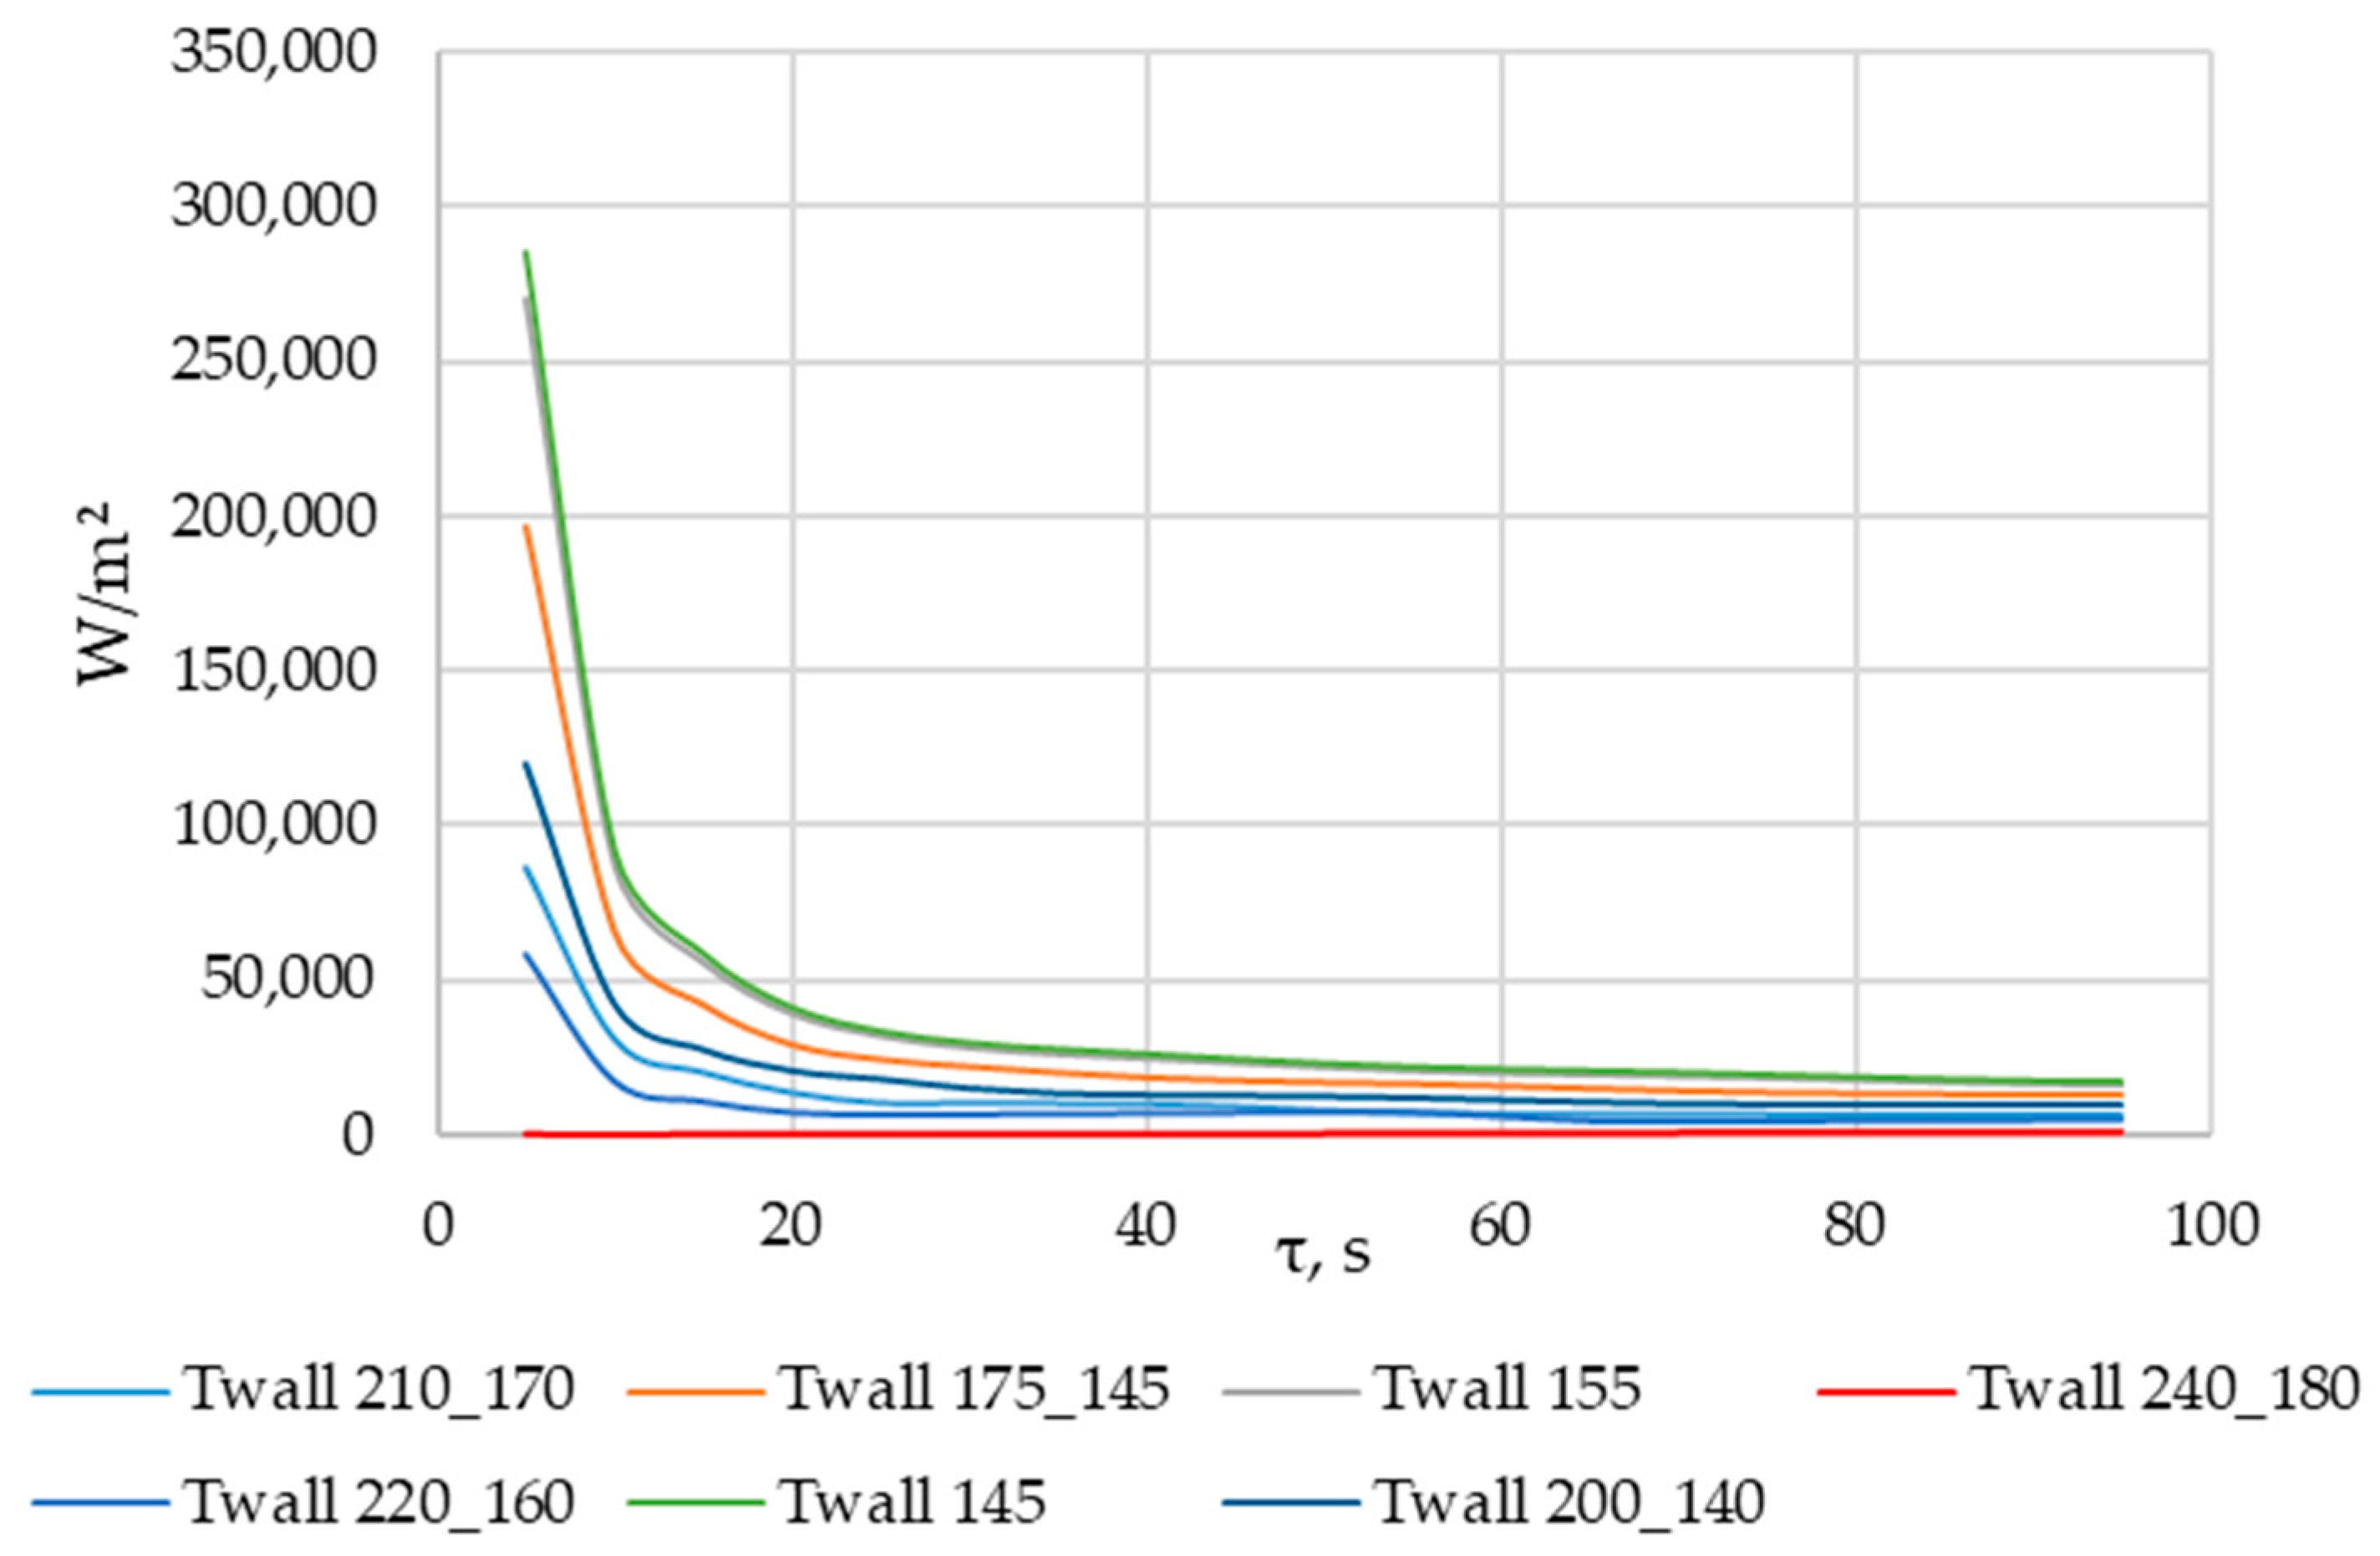
Using ANSYS FLUENT, we modeled the heat transfer between the PCM and the inner wall surface of the tube with four longitudinal fins, as described in Section 2.4. The simulation was conducted under different scenarios of the temperature of the inner surface of the heat exchange wall, as shown in Table 2. The simulation results are presented in Figure 20, Figure 21, Figure 22, Figure 23, Figure 24 and Figure 25.
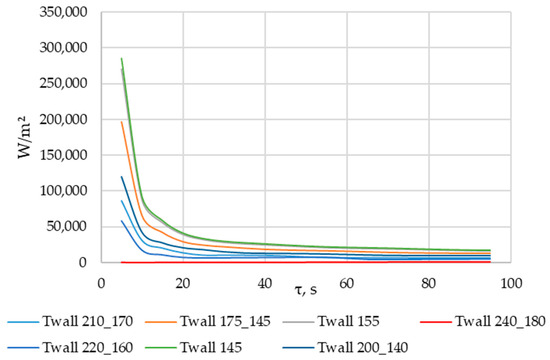
Figure 20.
Simulation results of heat transfer between the PCM and the inner surface of the wall with four longitudinal fins. Heat flux density on the inner surface (τ = 5…100 s).
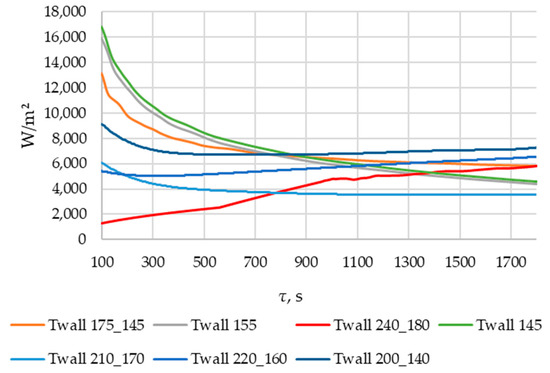
Figure 21.
Simulation results of heat transfer between the PCM and the inner surface of the wall with four longitudinal fins. Heat flux density on the inner surface (τ = 100…1800 s).
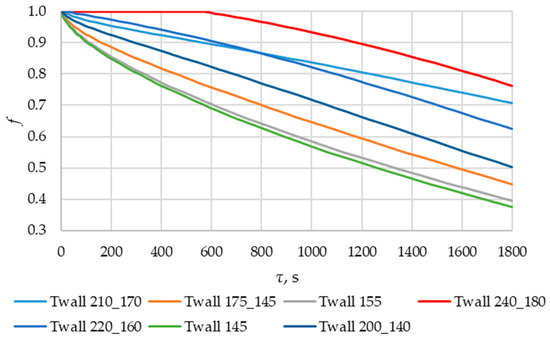
Figure 22.
Simulation results of heat transfer between the PCM and the inner surface of the wall with four longitudinal fins. Change of the volume fraction of the liquid phase in the PCM.
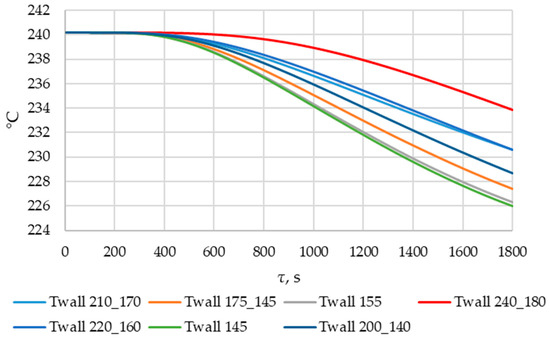
Figure 23.
Simulation results of heat transfer between the PCM and the inner surface of the wall with four longitudinal fins. Temperature change in the liquid phase of the PCM.
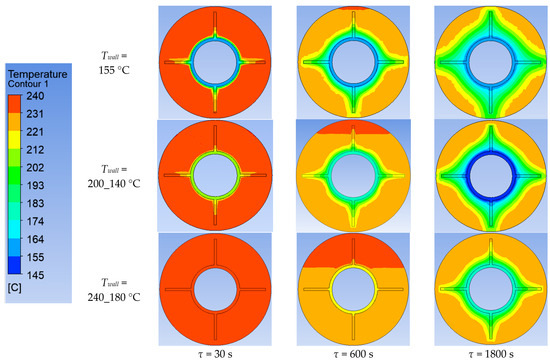
Figure 24.
Simulation results of heat transfer between the PCM and the inner surface of the wall with four longitudinal fins. Temperatures in the simulated area.
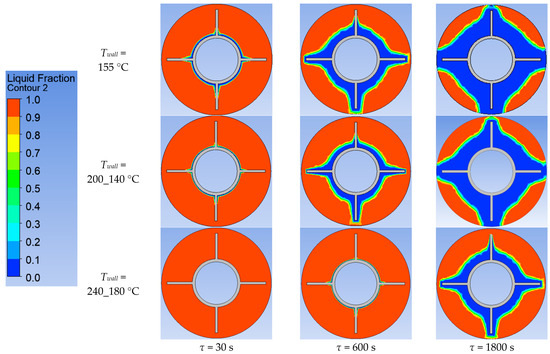
Figure 25.
Simulation results of heat transfer between the PCM and the inner surface of the wall with four longitudinal fins. Liquid fraction of the PCM.
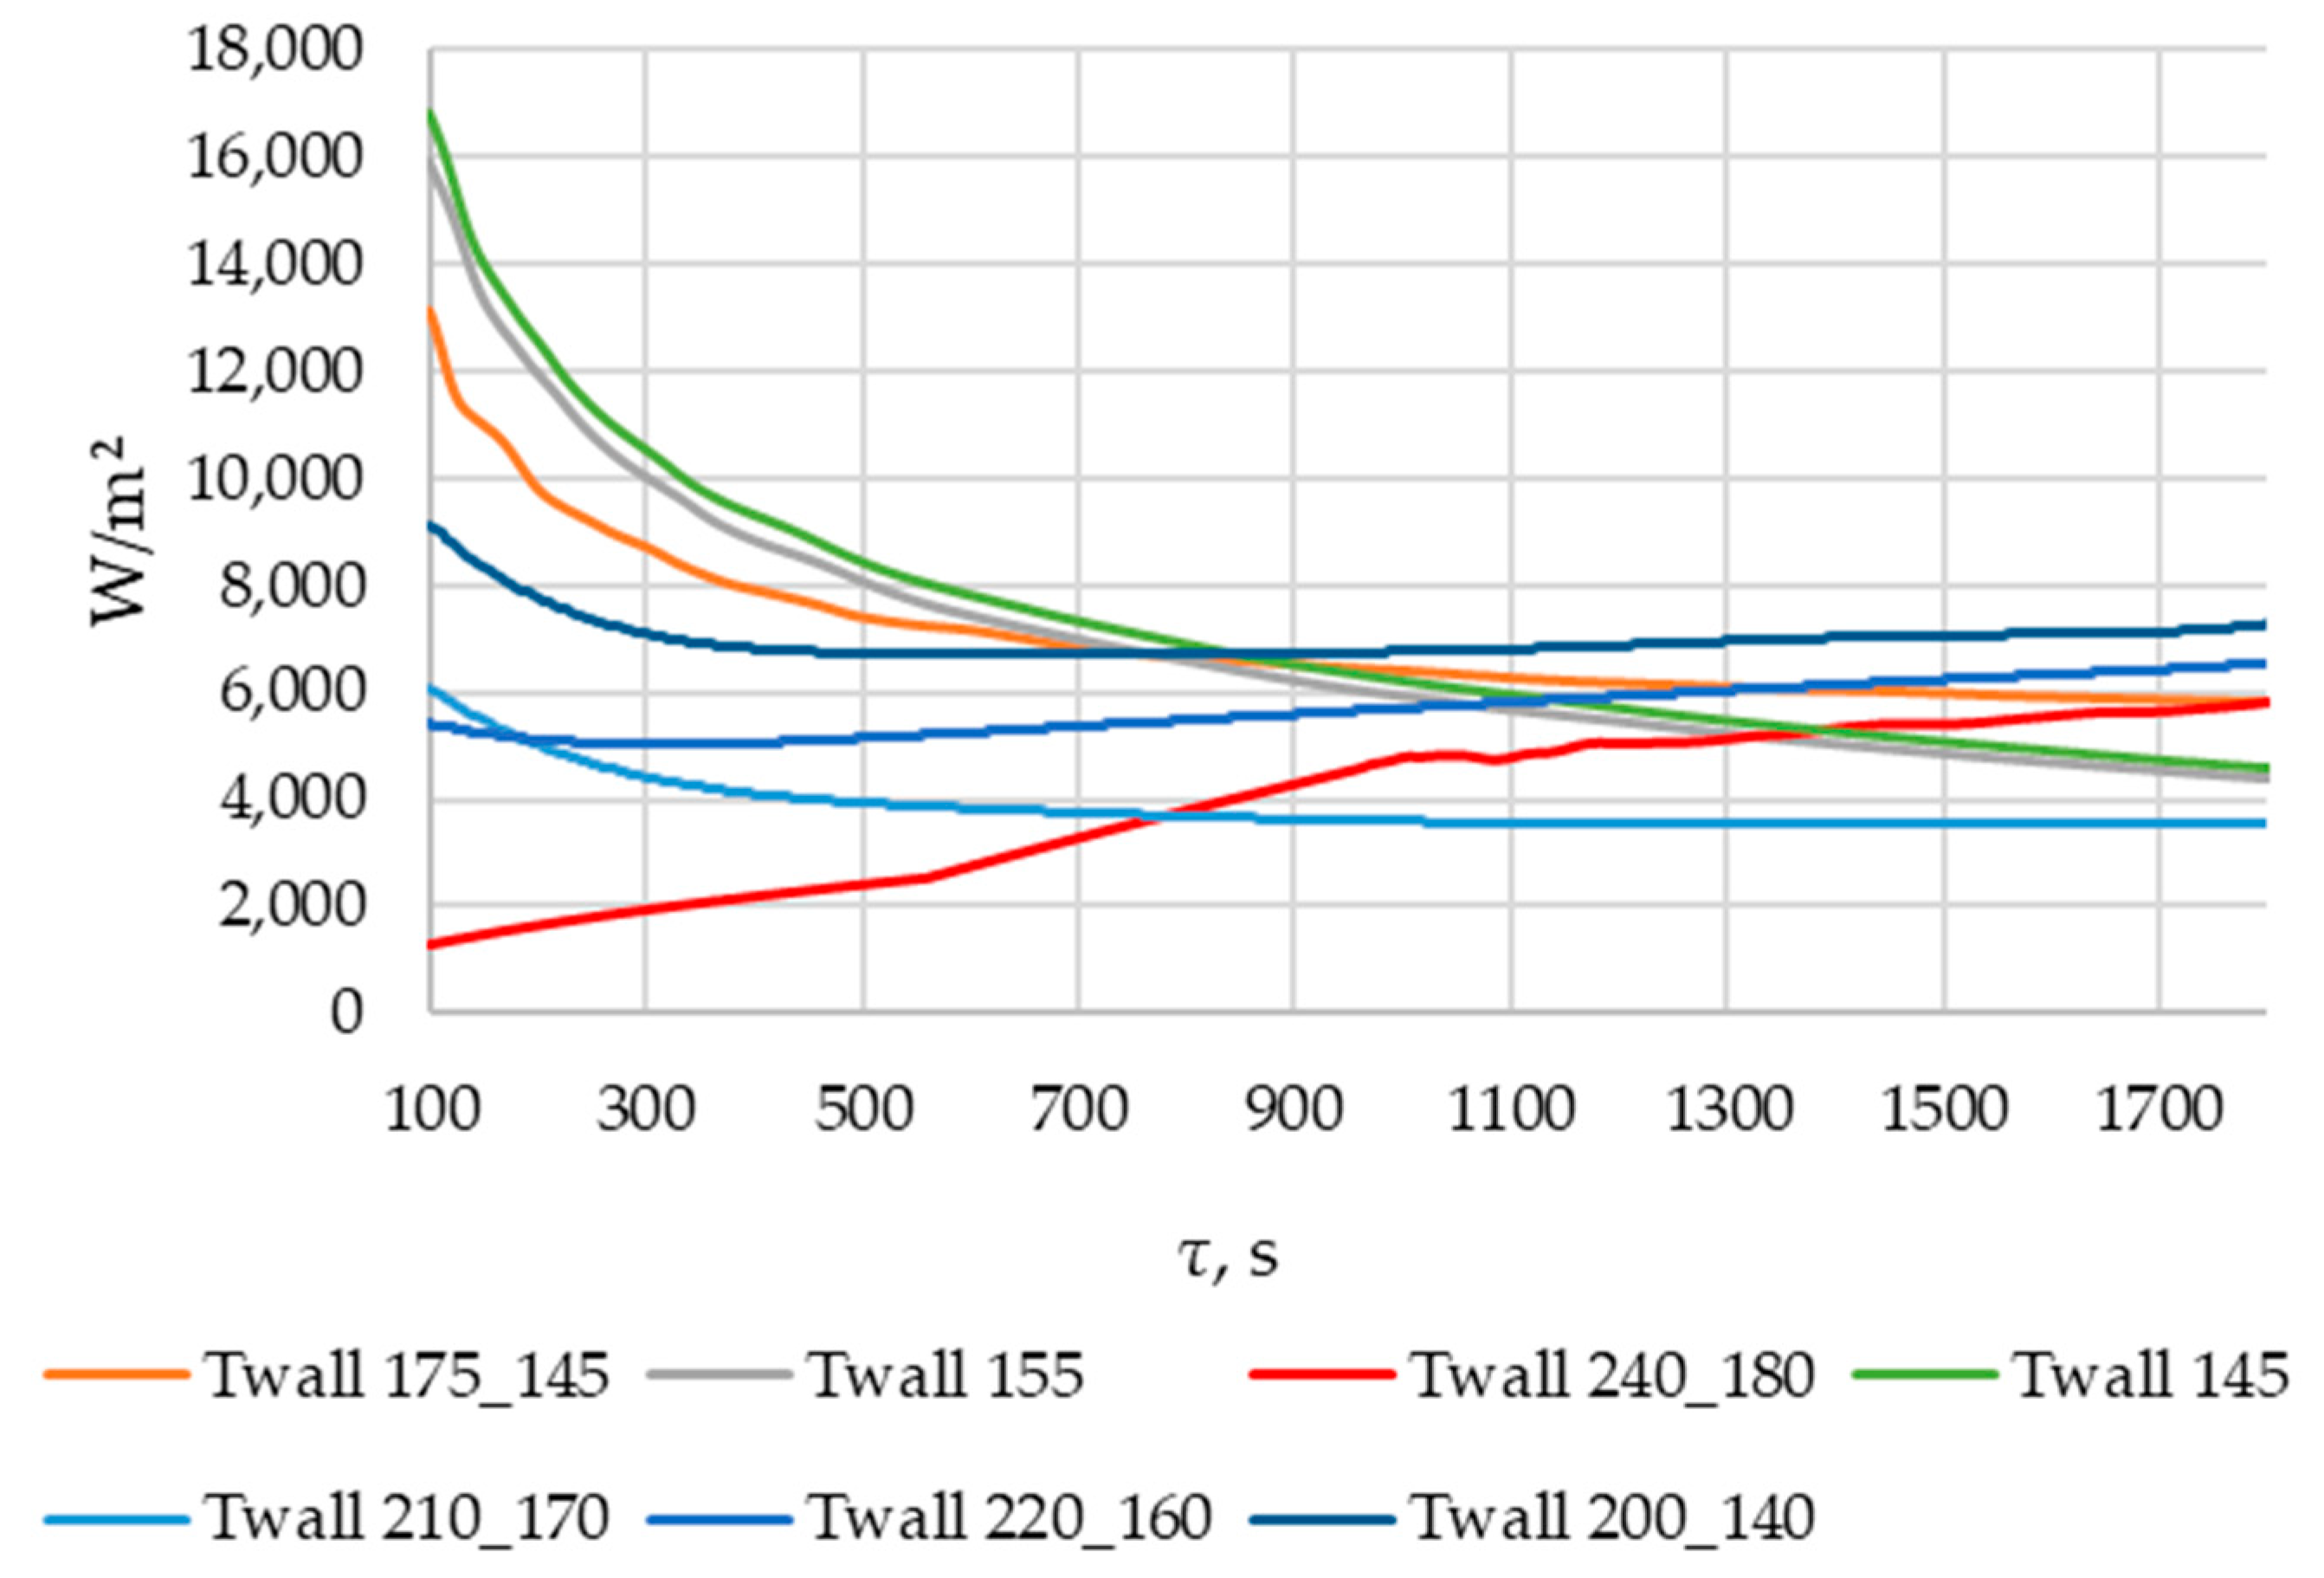
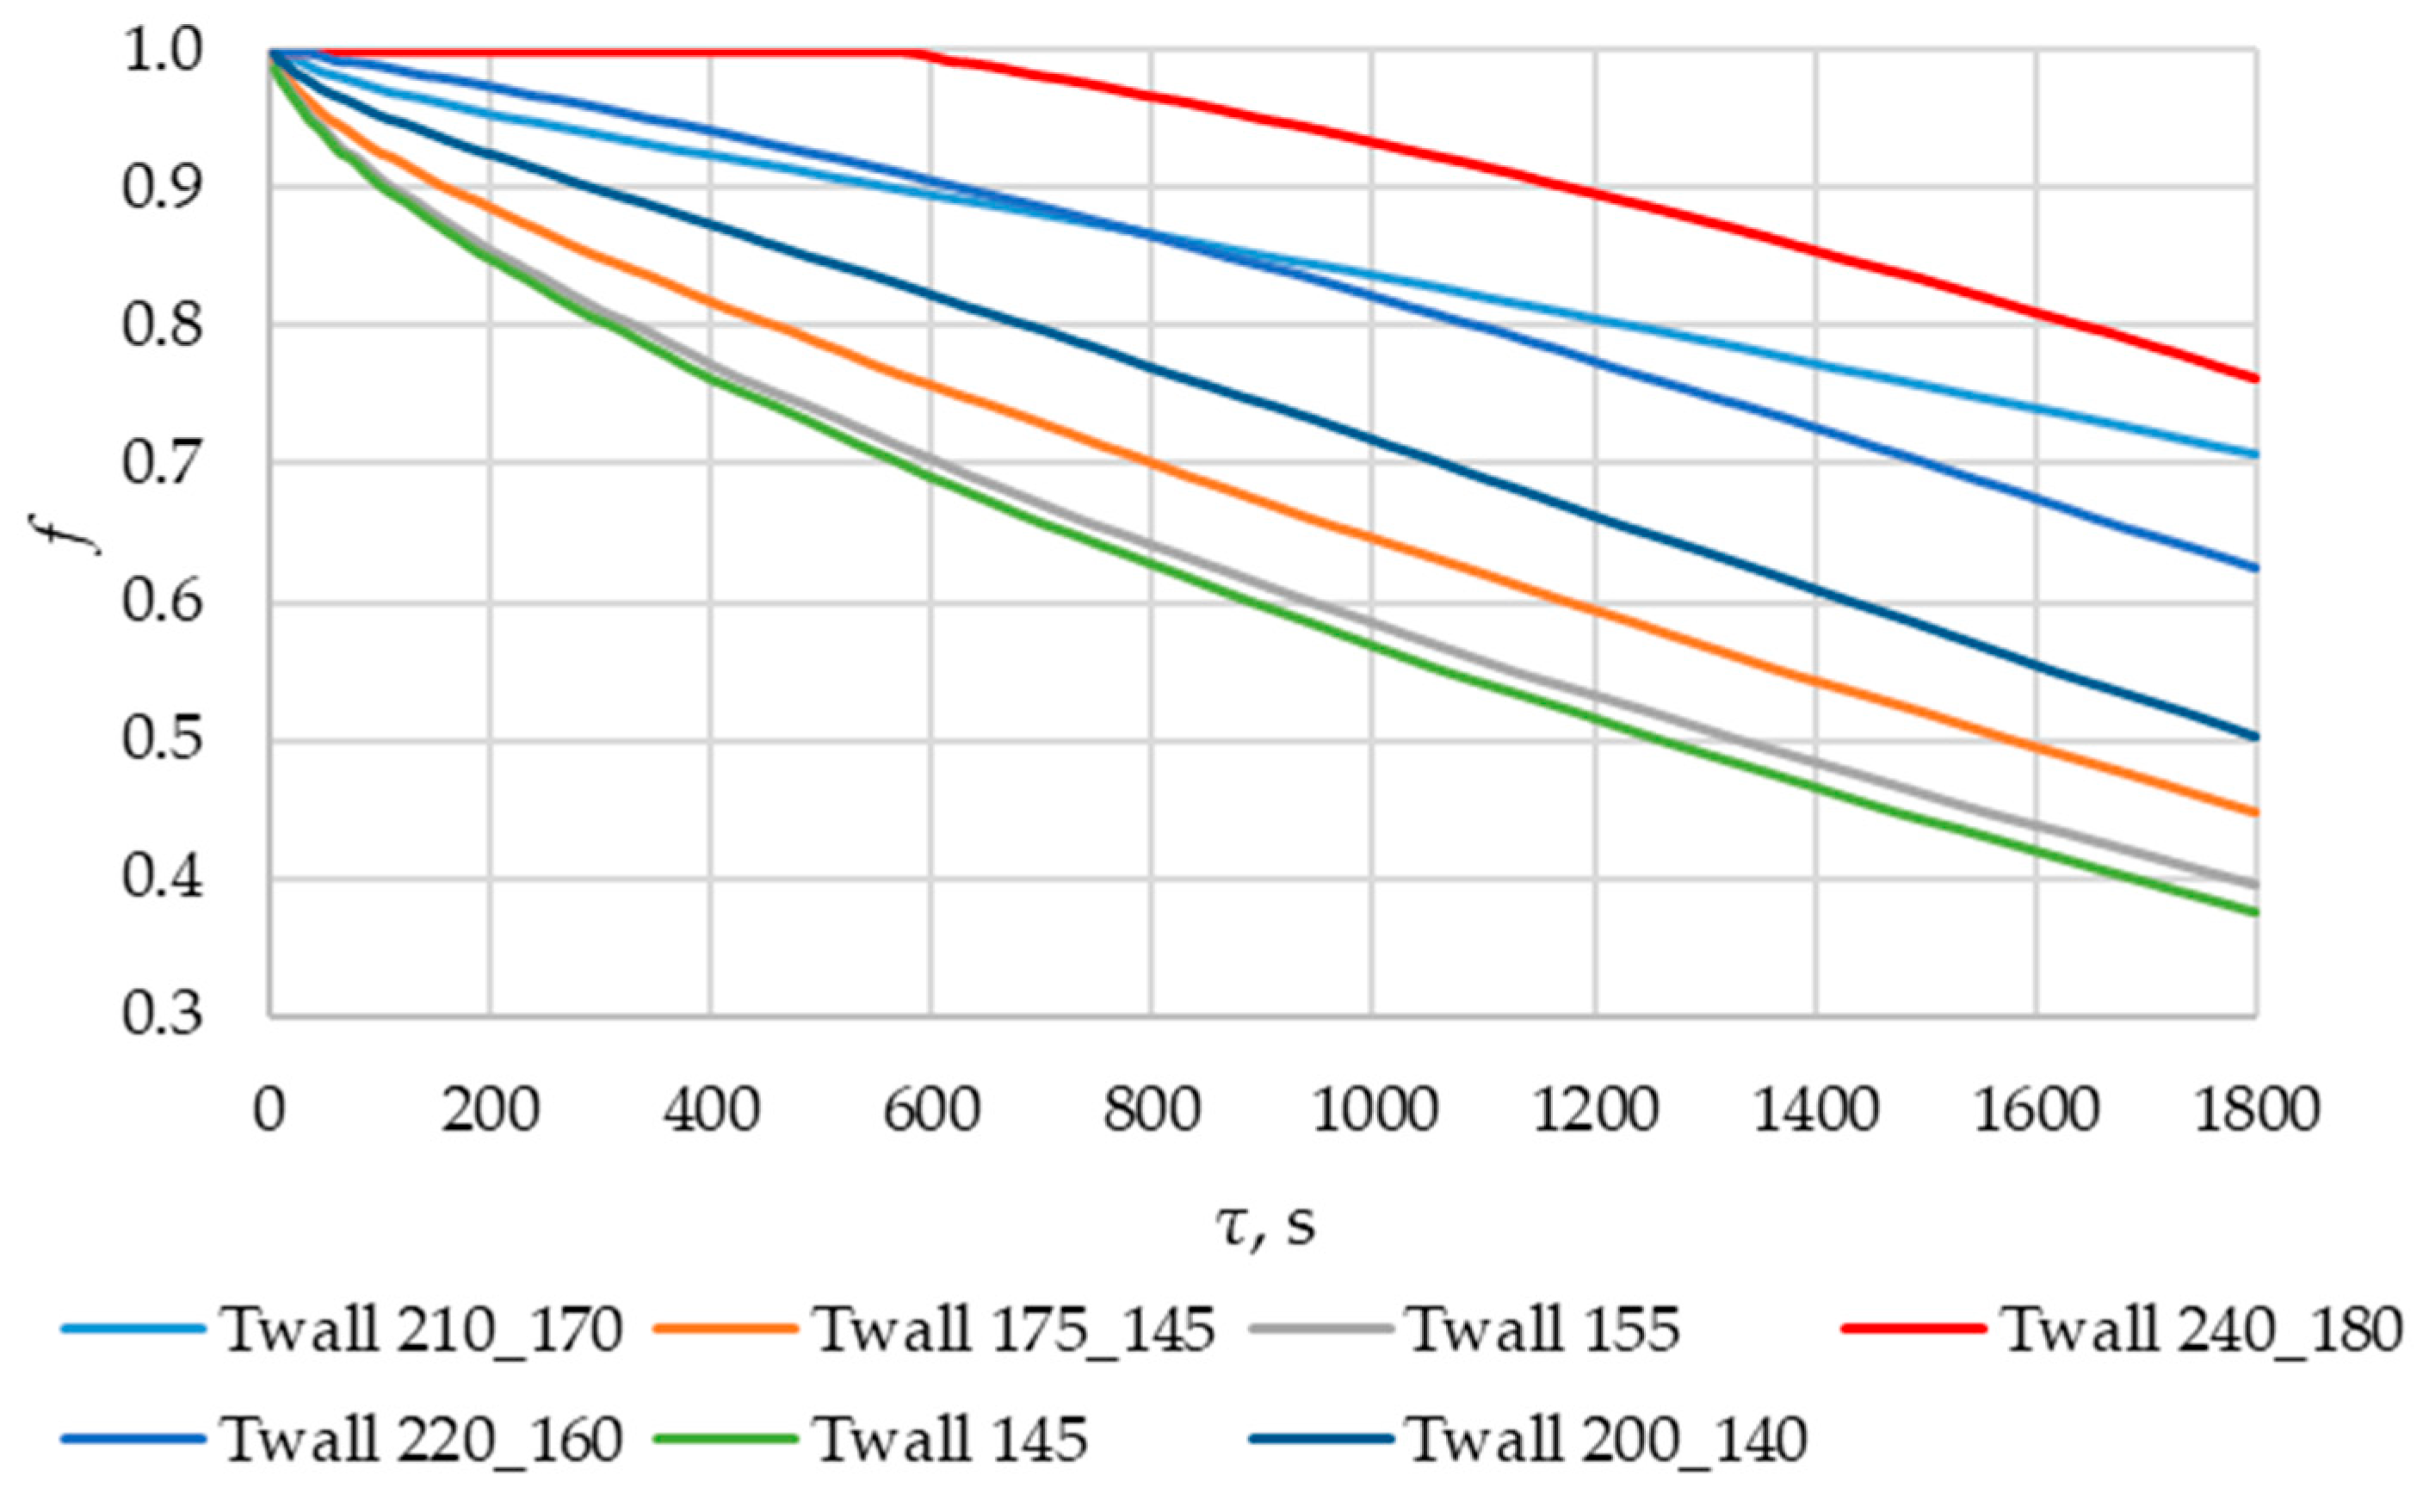
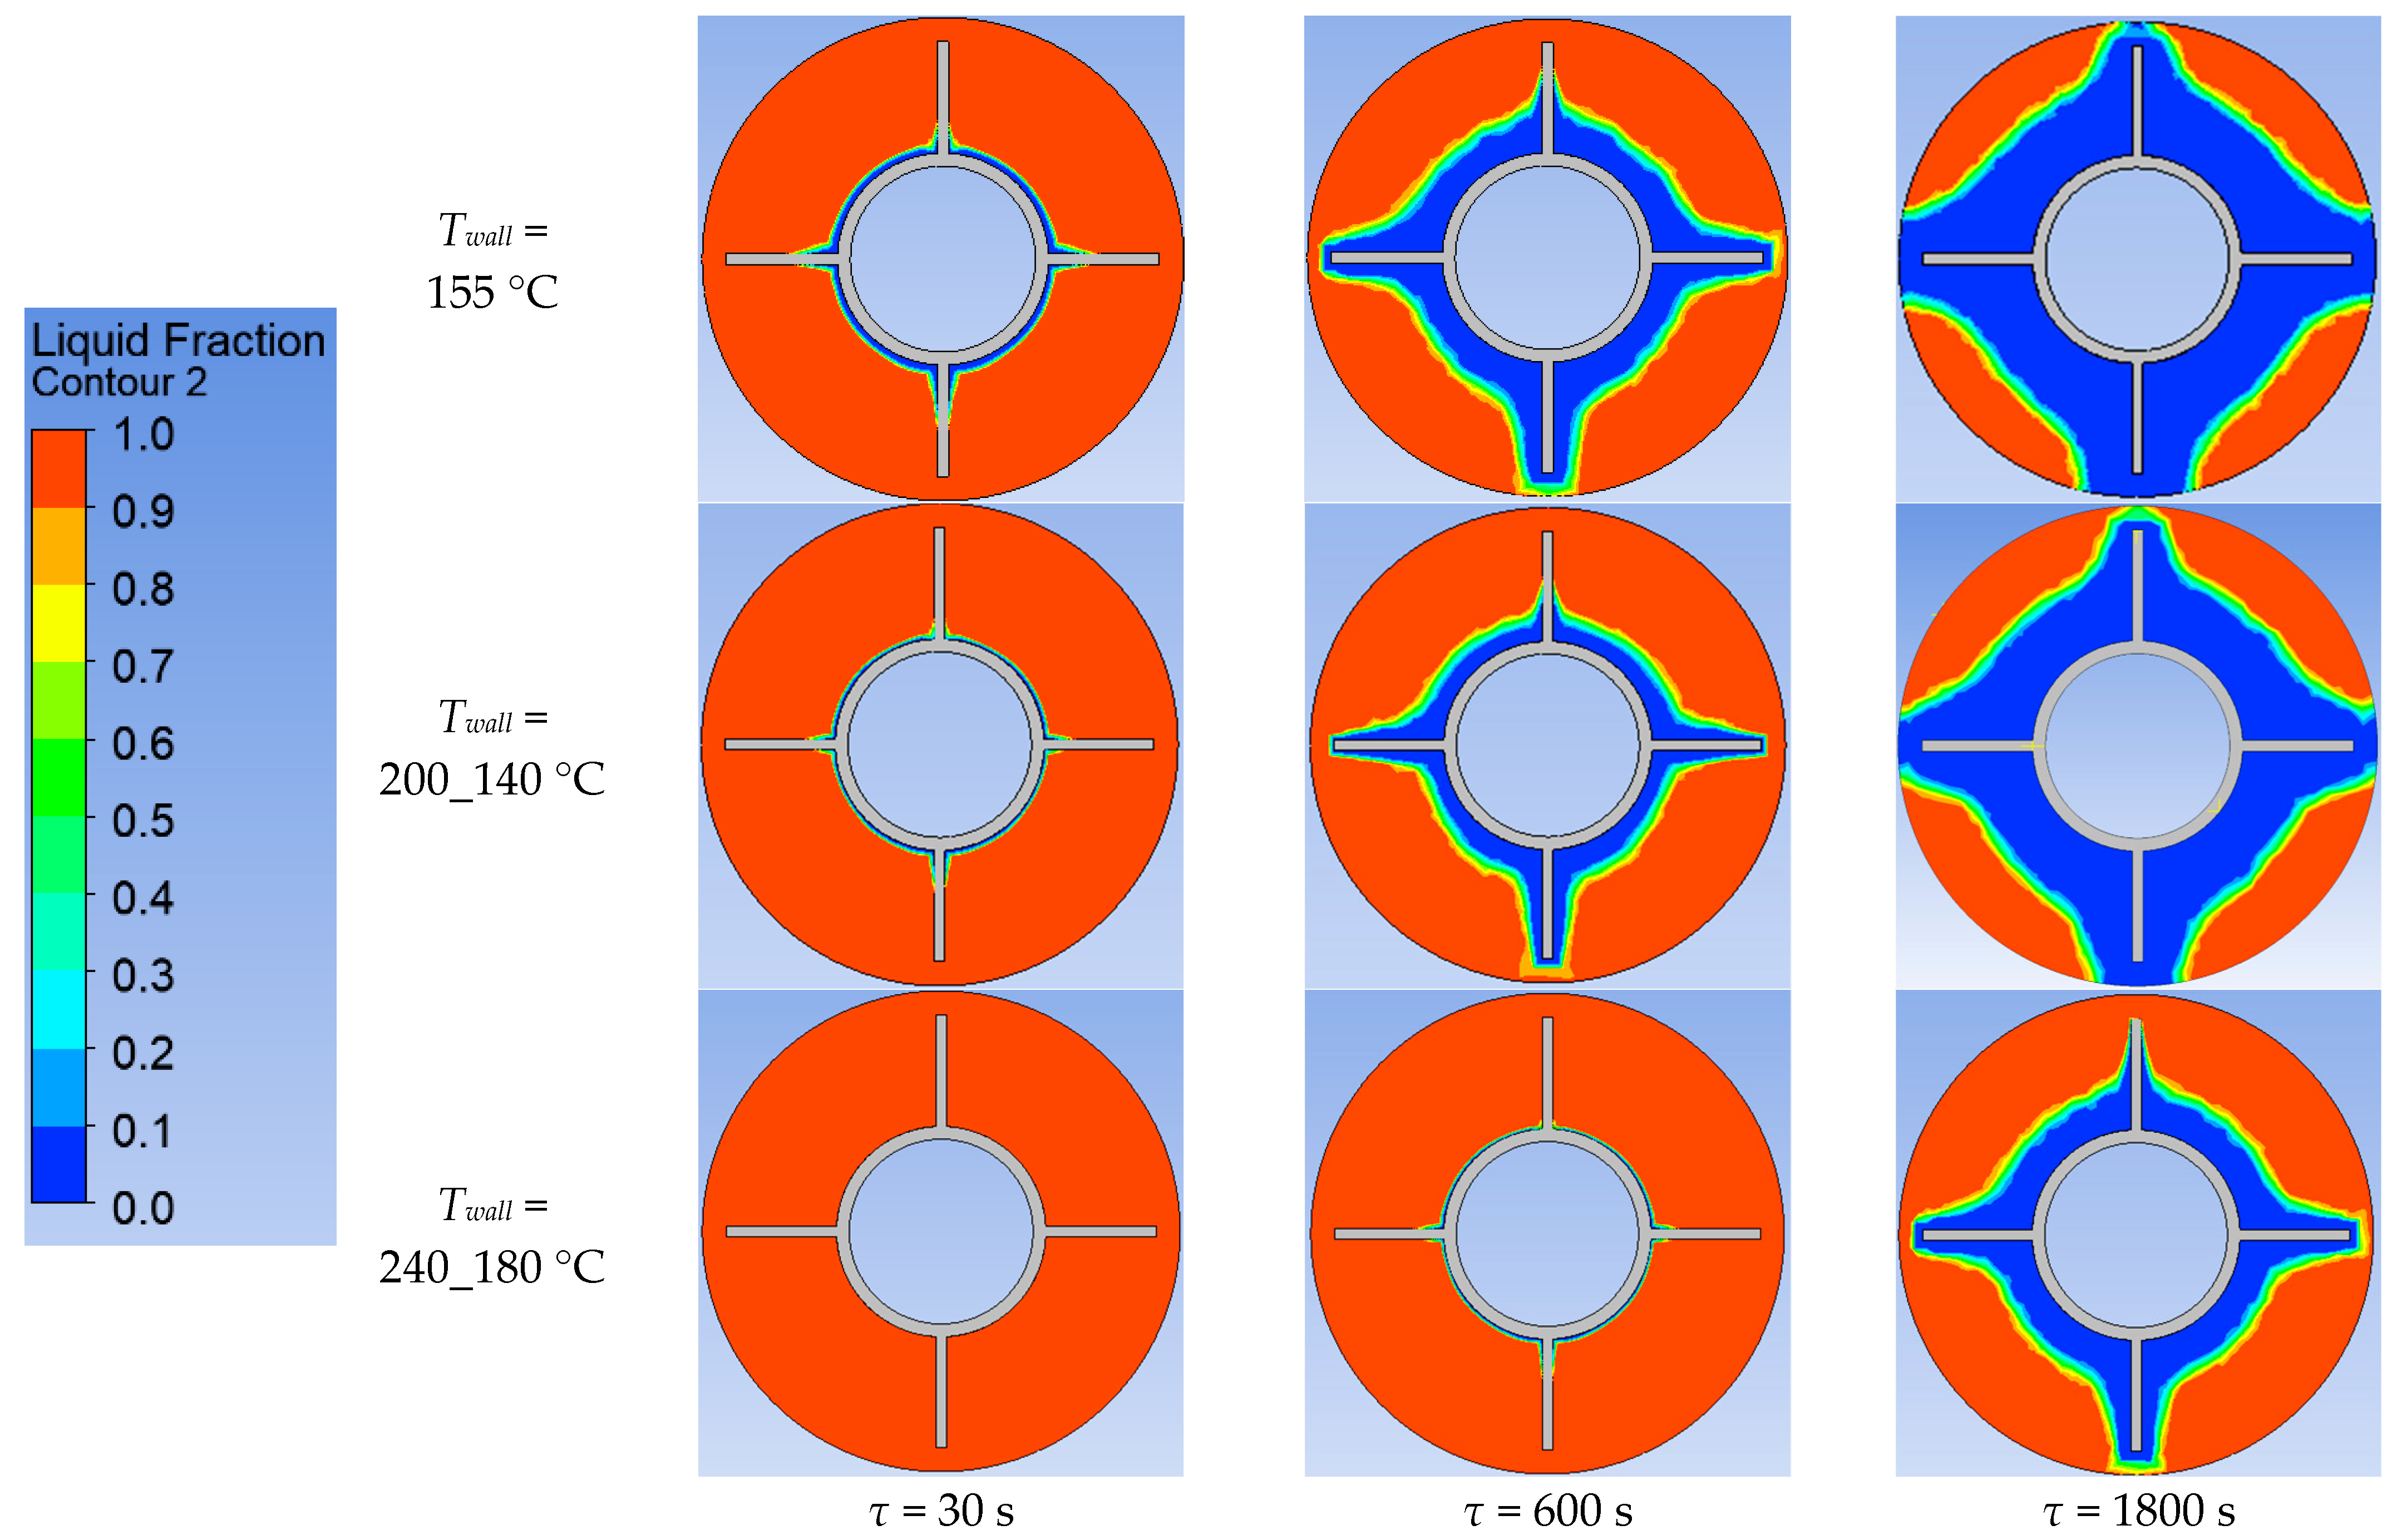
According to Figure 20 and Figure 21, the lower the wall temperature, the higher the heat flux density. A rapid decrease in heat flux density occurs at a wall temperature below the melting point. The heat flux density decreases from 50,000… 250,000 W/m2 (at the beginning of the heat exchange process) to 4000… 7000 W/m2 (after 900 s) (Figure 21). This is due to the intense growth of the solid phase layer of the PCM, as shown in Figure 22 and Figure 25.
In the simulations, where the wall temperature decreased uniformly from 200 °C to 140 °C and from 220 °C to 160 °C, the heat flux density increased starting from the 300th second (Figure 21). During the simulation, during which the temperature decreased uniformly from 240 °C to 180 °C, the heat flux density increased throughout the entire simulation time (Figure 21). These phenomena can be explained by the fact that, in these cases, the decrease in the temperature of the wall contributes more to the heat transfer than the increase in the thickness of the PCM solid layer.
3.5. Calculation of Heat Transfer Across the Entire Heat Transfer Surface
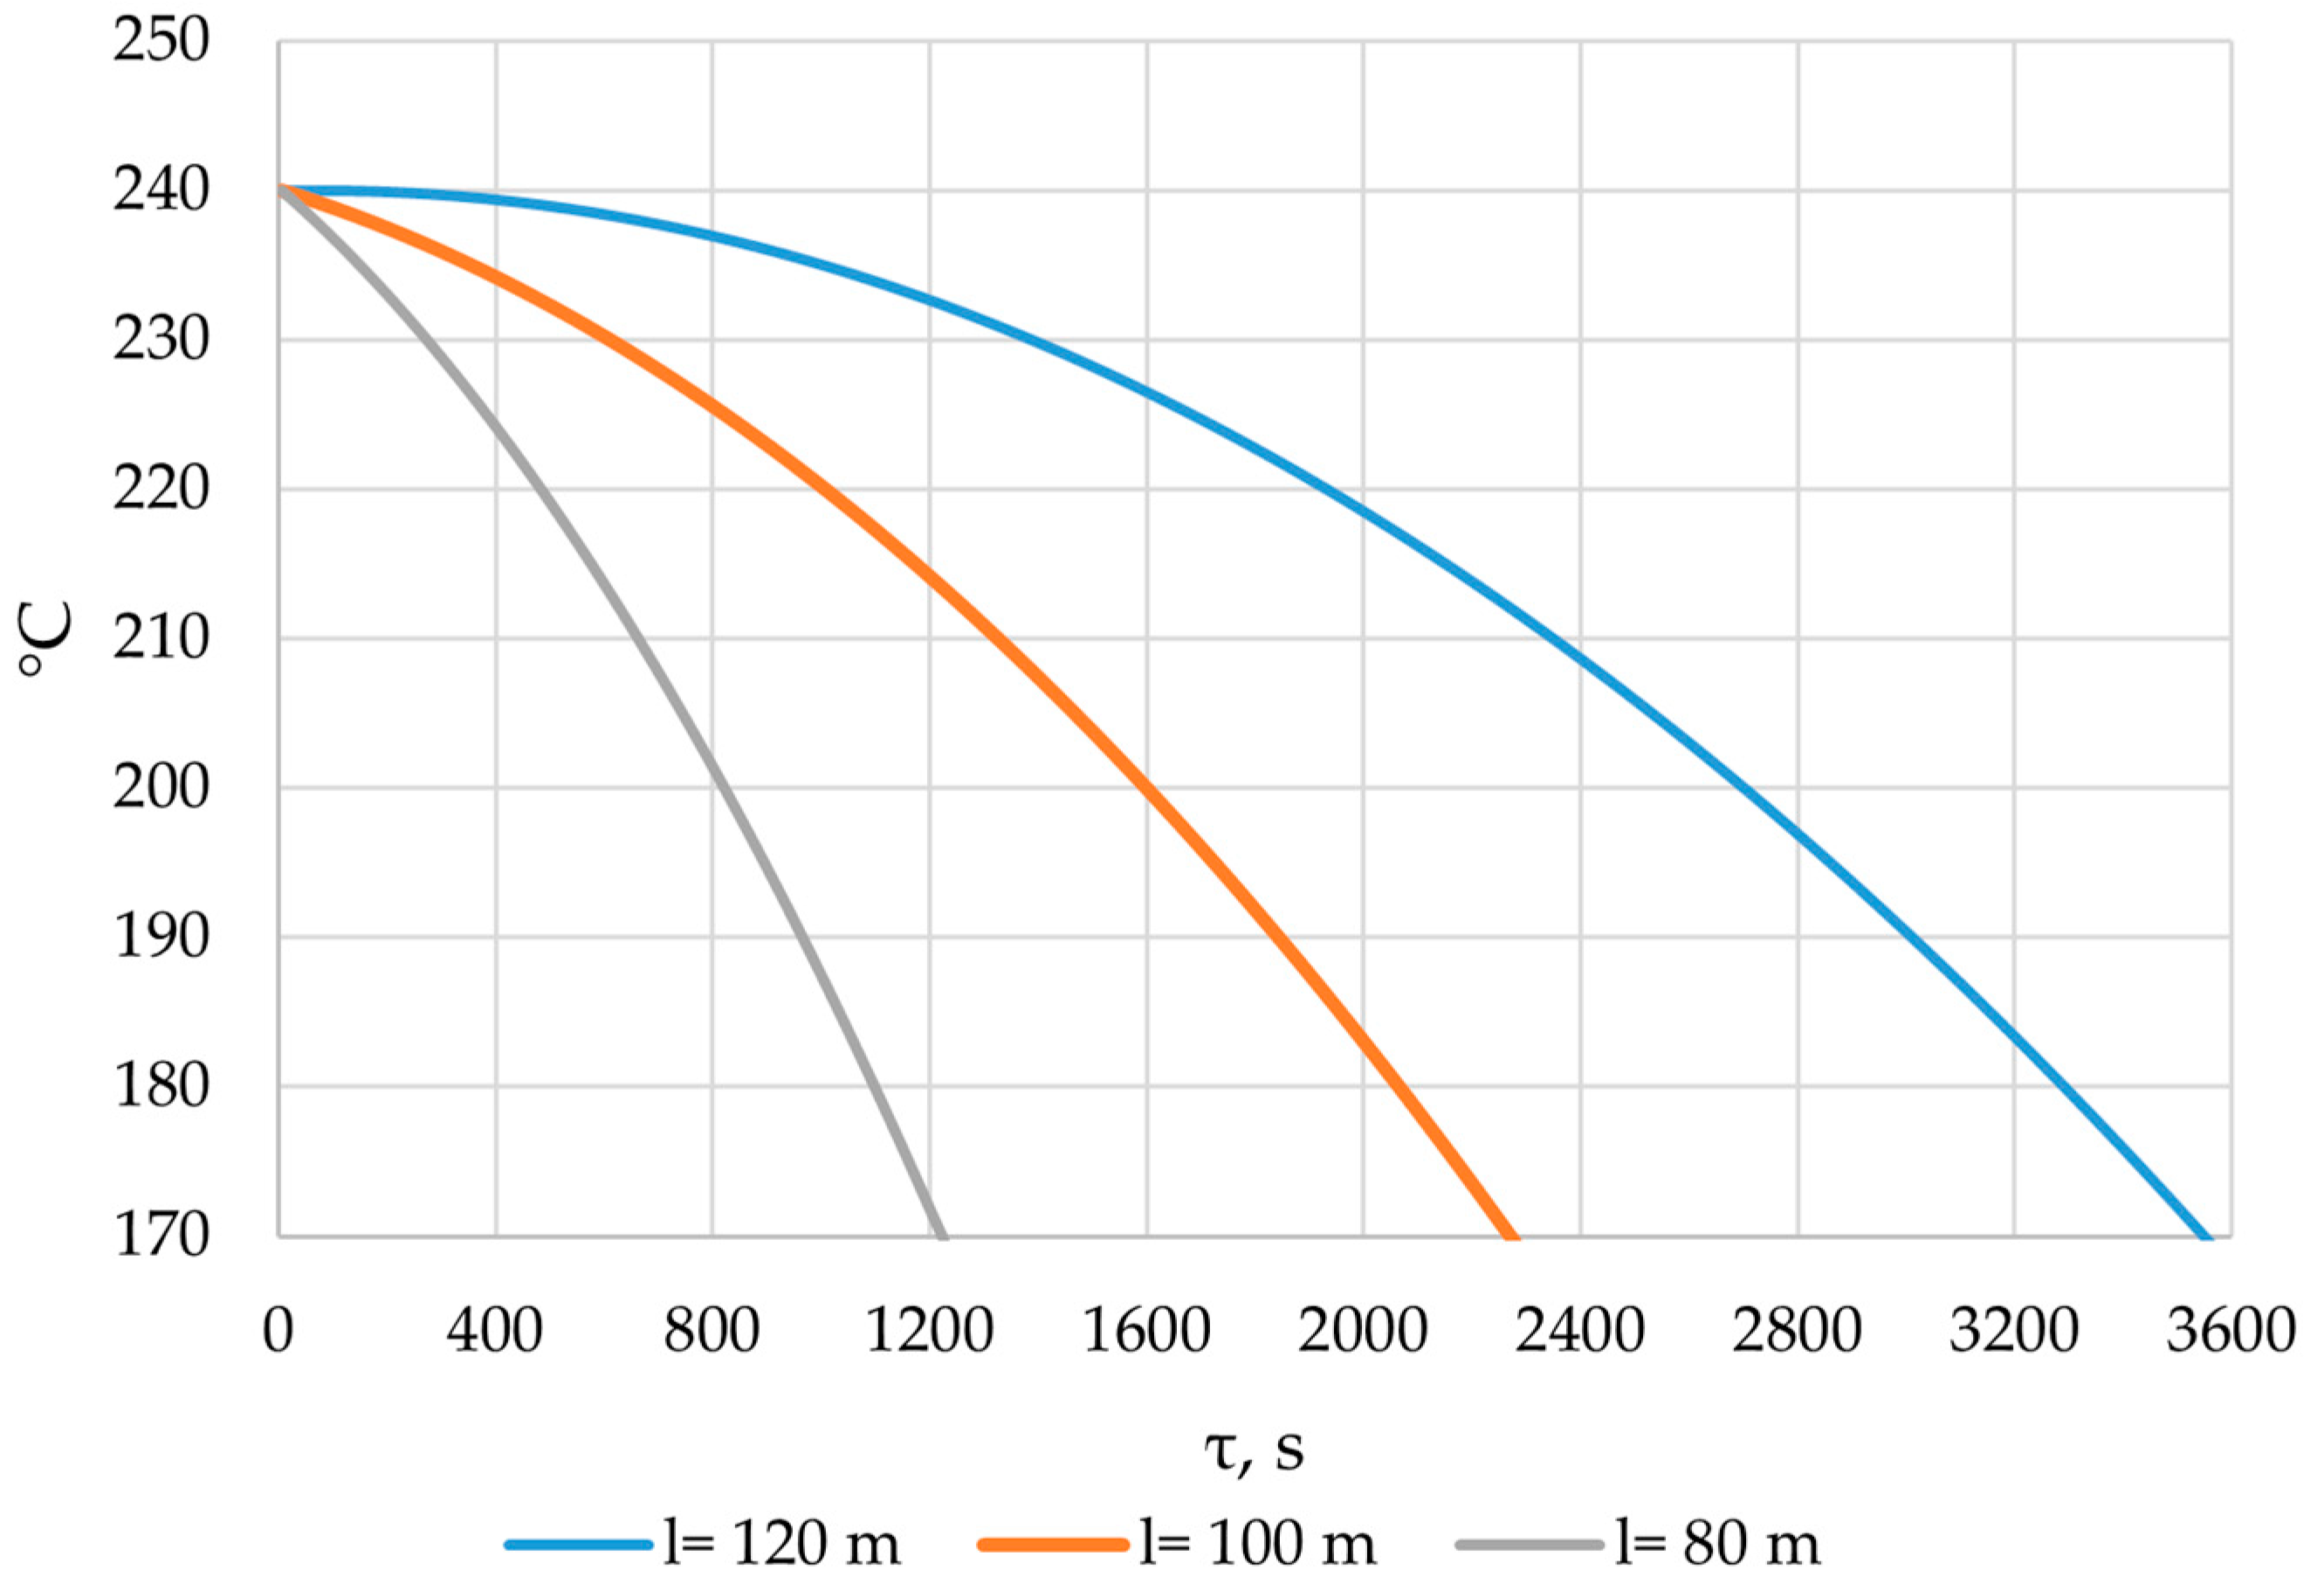
The simulation of heat transfer between the heat transfer fluid and the PCM across the entire heat transfer surface was performed using the method described in Section 2.3. Heat exchange surfaces with lengths of 80 m, 100 m, and 120 m were modeled. The results are presented in Figure 26, Figure 27, Figure 28, Figure 29, Figure 30, Figure 31 and Figure 32.
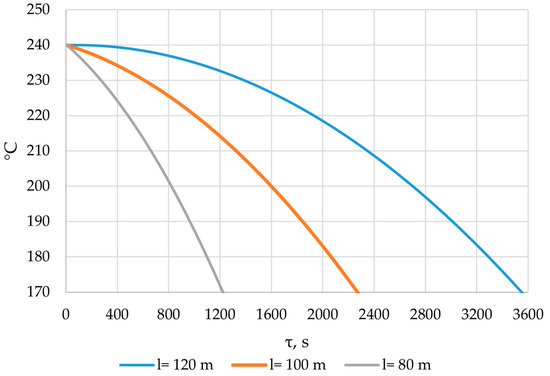
Figure 26.
The temperature of the heat transfer fluid at the outlet of the heat accumulator for different lengths of the heat exchange surface.
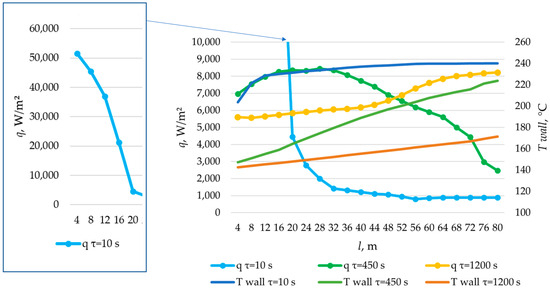
Figure 27.
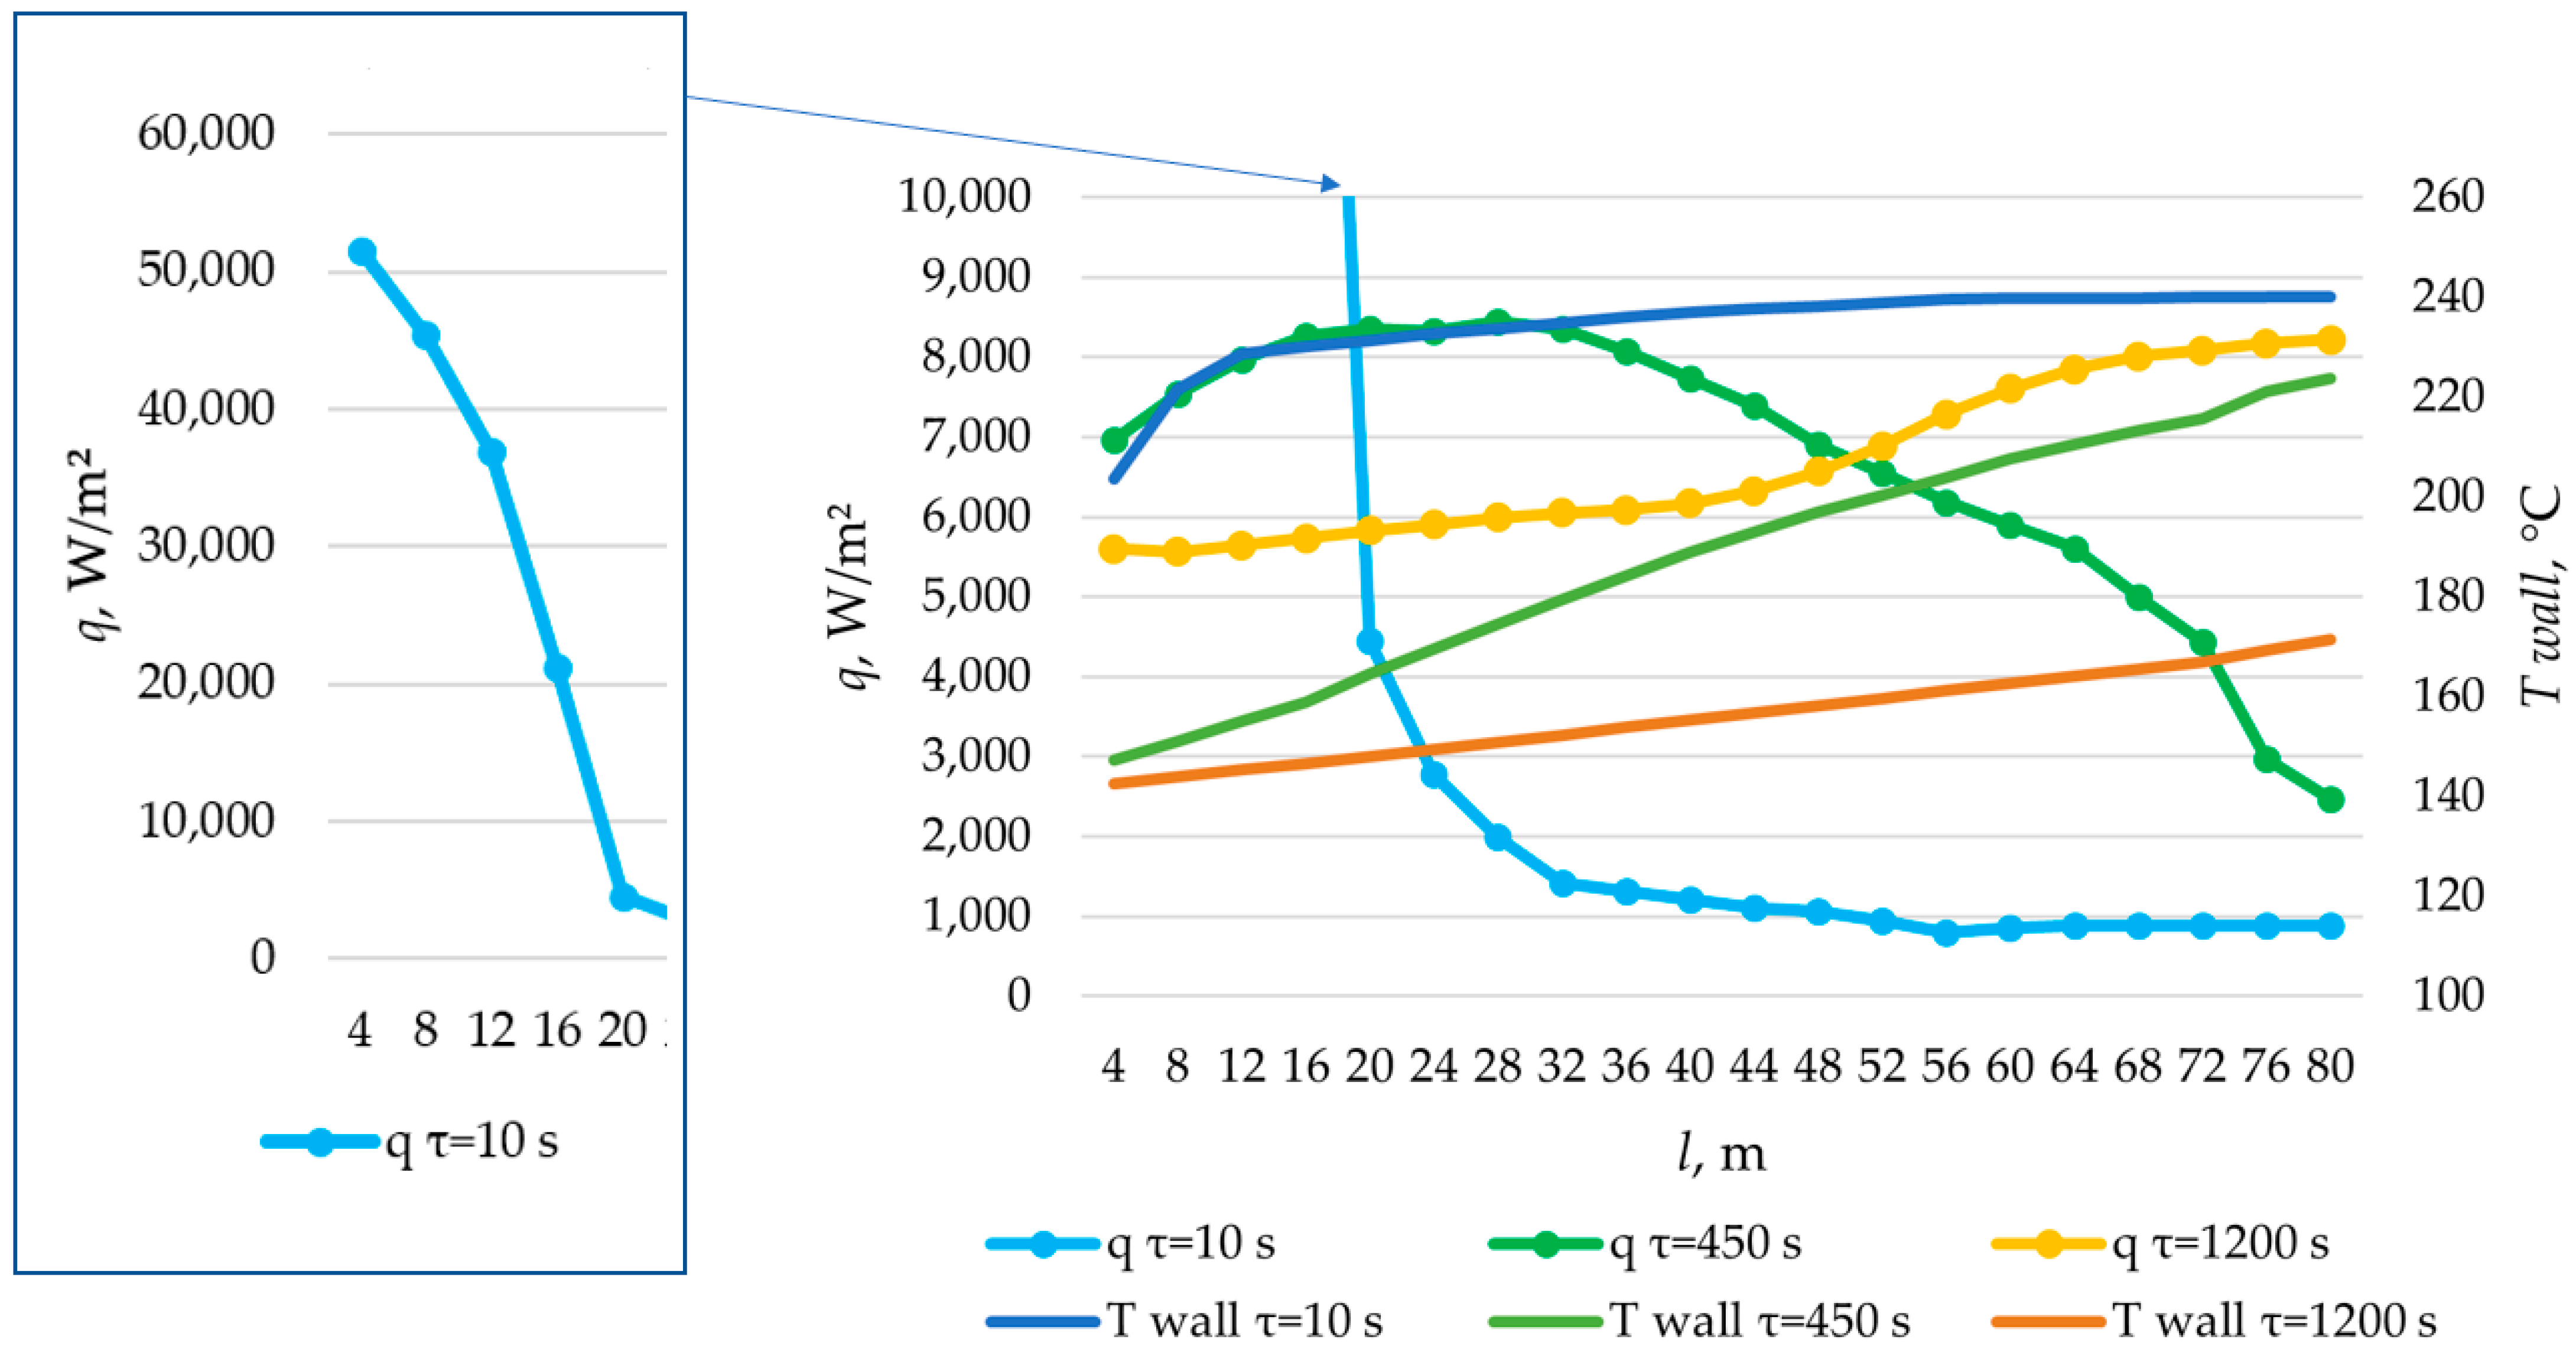
The temperature distribution on the inner surface of the heat exchange surface and the heat flux density distribution for a heat exchange. Heat transfer surface length = 80 m.
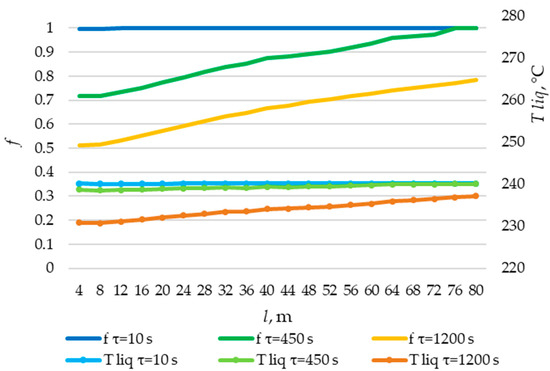
Figure 28.
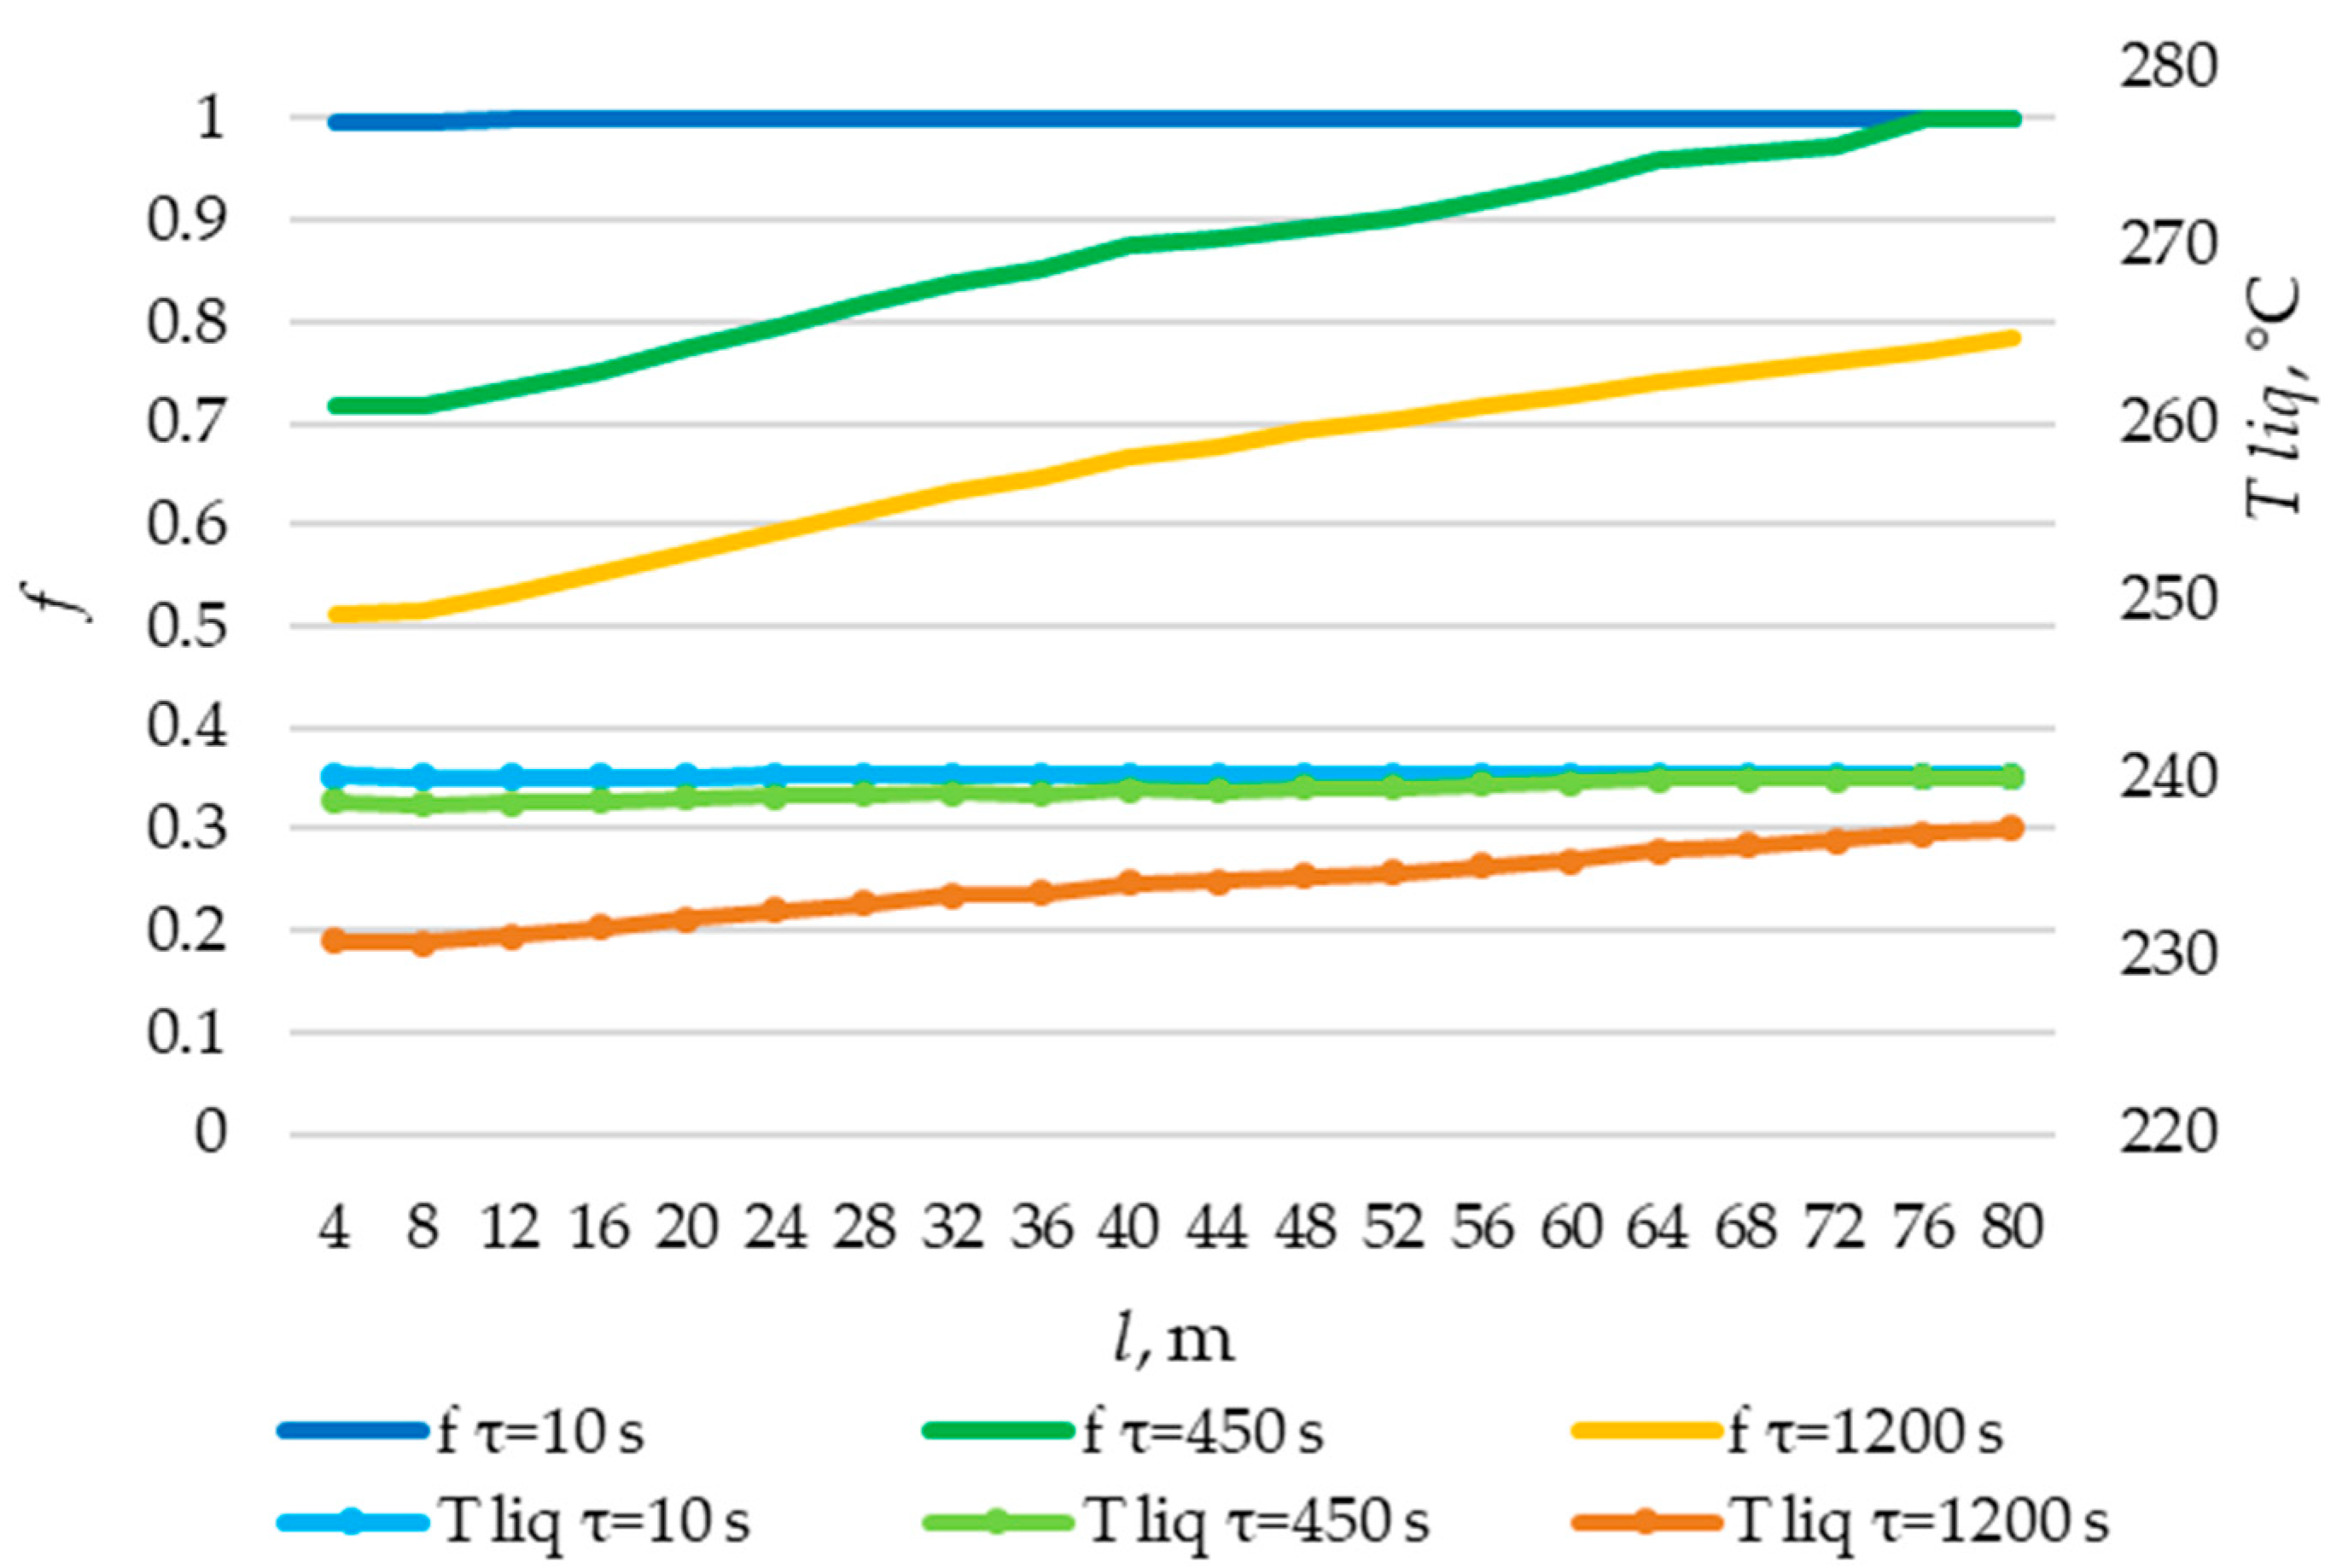
The temperature distribution of the liquid PCM and the distribution of the fraction of liquid PCM across the heat exchange surface. Heat transfer surface length = 80 m.
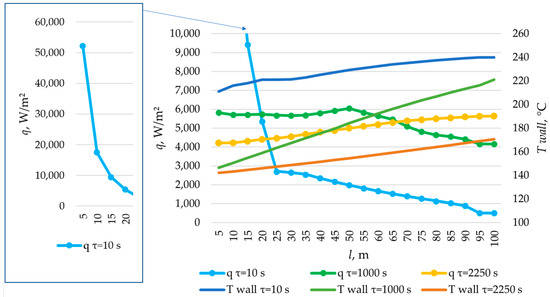
Figure 29.
The temperature distribution on the inner surface of the heat exchange surface and the heat flux density distribution for a heat exchange. Heat transfer surface length = 100 m.
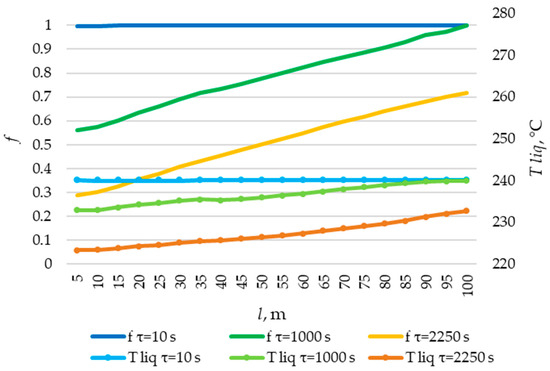
Figure 30.
The temperature distribution of the liquid PCM and the distribution of the fraction of liquid PCM across the heat exchange surface. Heat transfer surface length = 100 m.
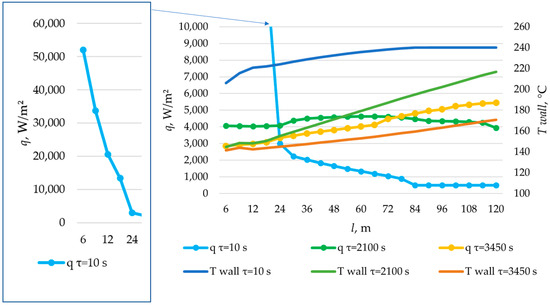
Figure 31.
The temperature distribution on the inner surface of a heat exchange surface and the heat flux density distribution for a heat exchange. Heat transfer surface length = 120 m.
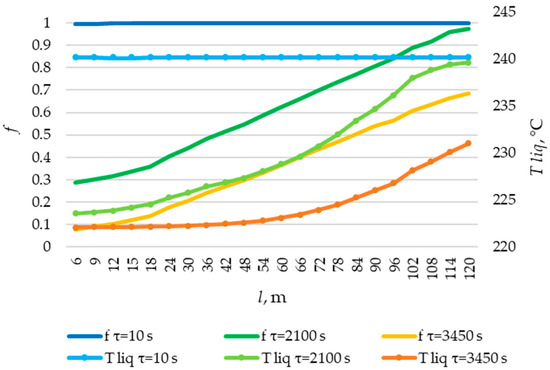
Figure 32.
The temperature distribution of the liquid PCM and the distribution of the fraction of liquid PCM across the heat exchange surface. Heat transfer surface length = 120 m.
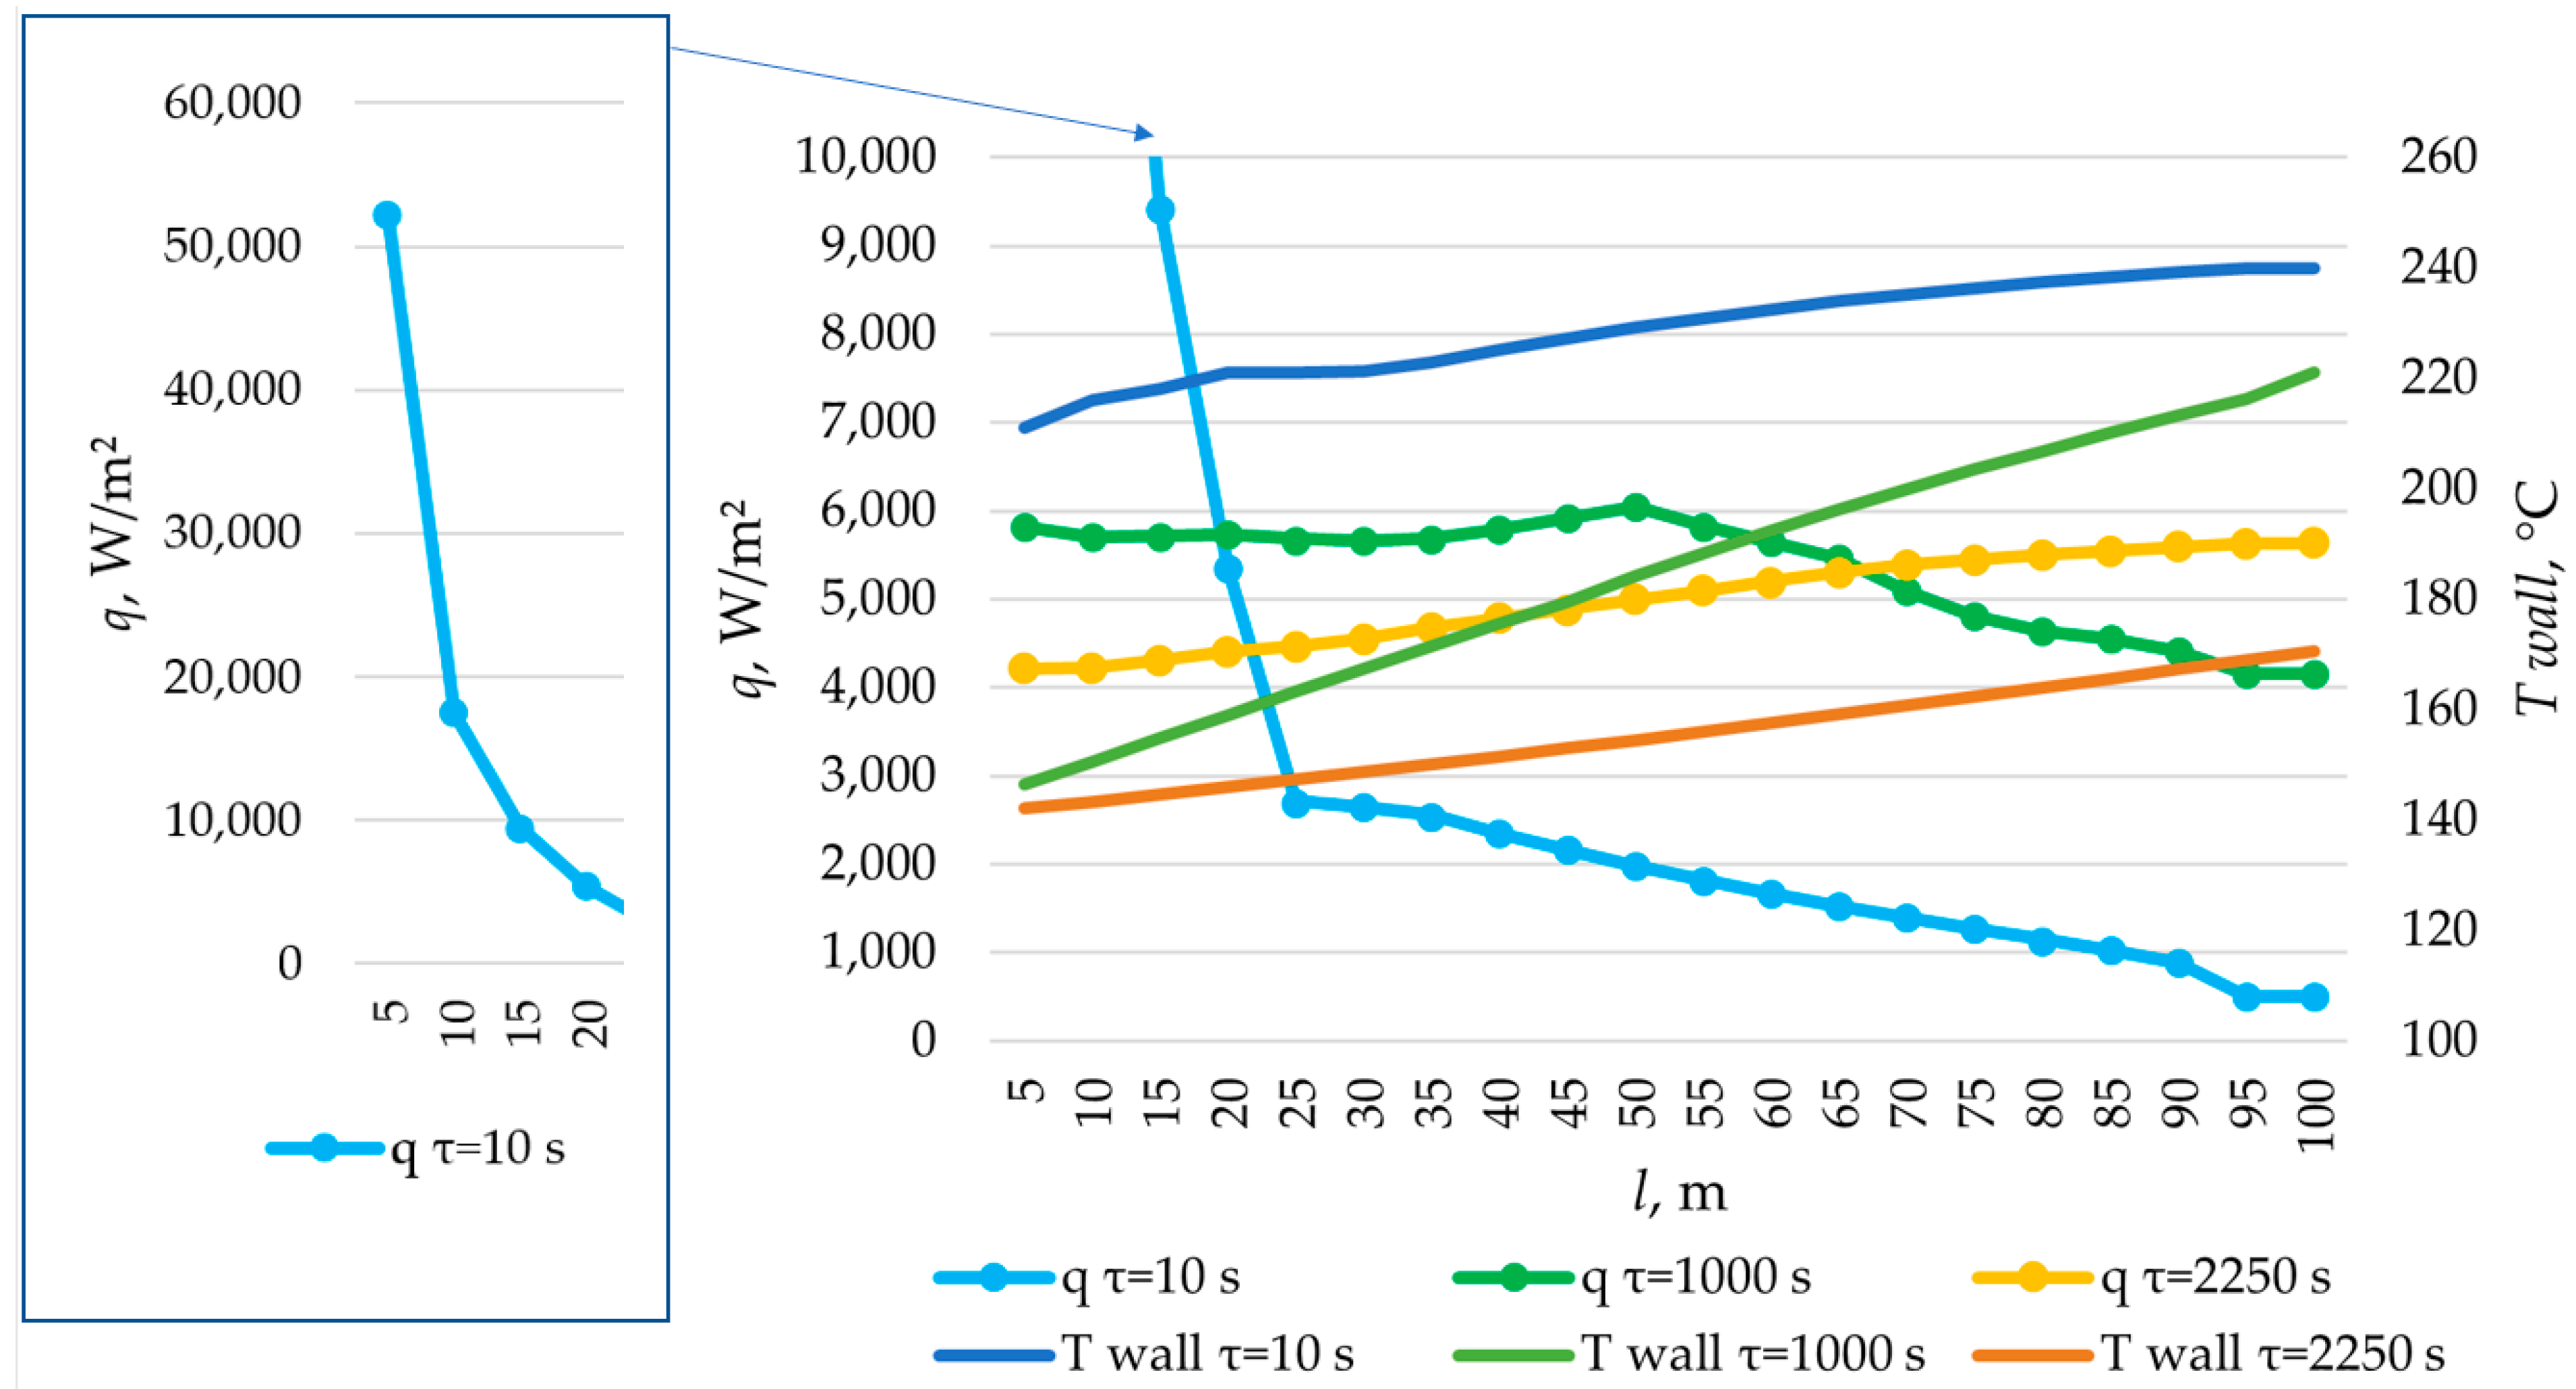
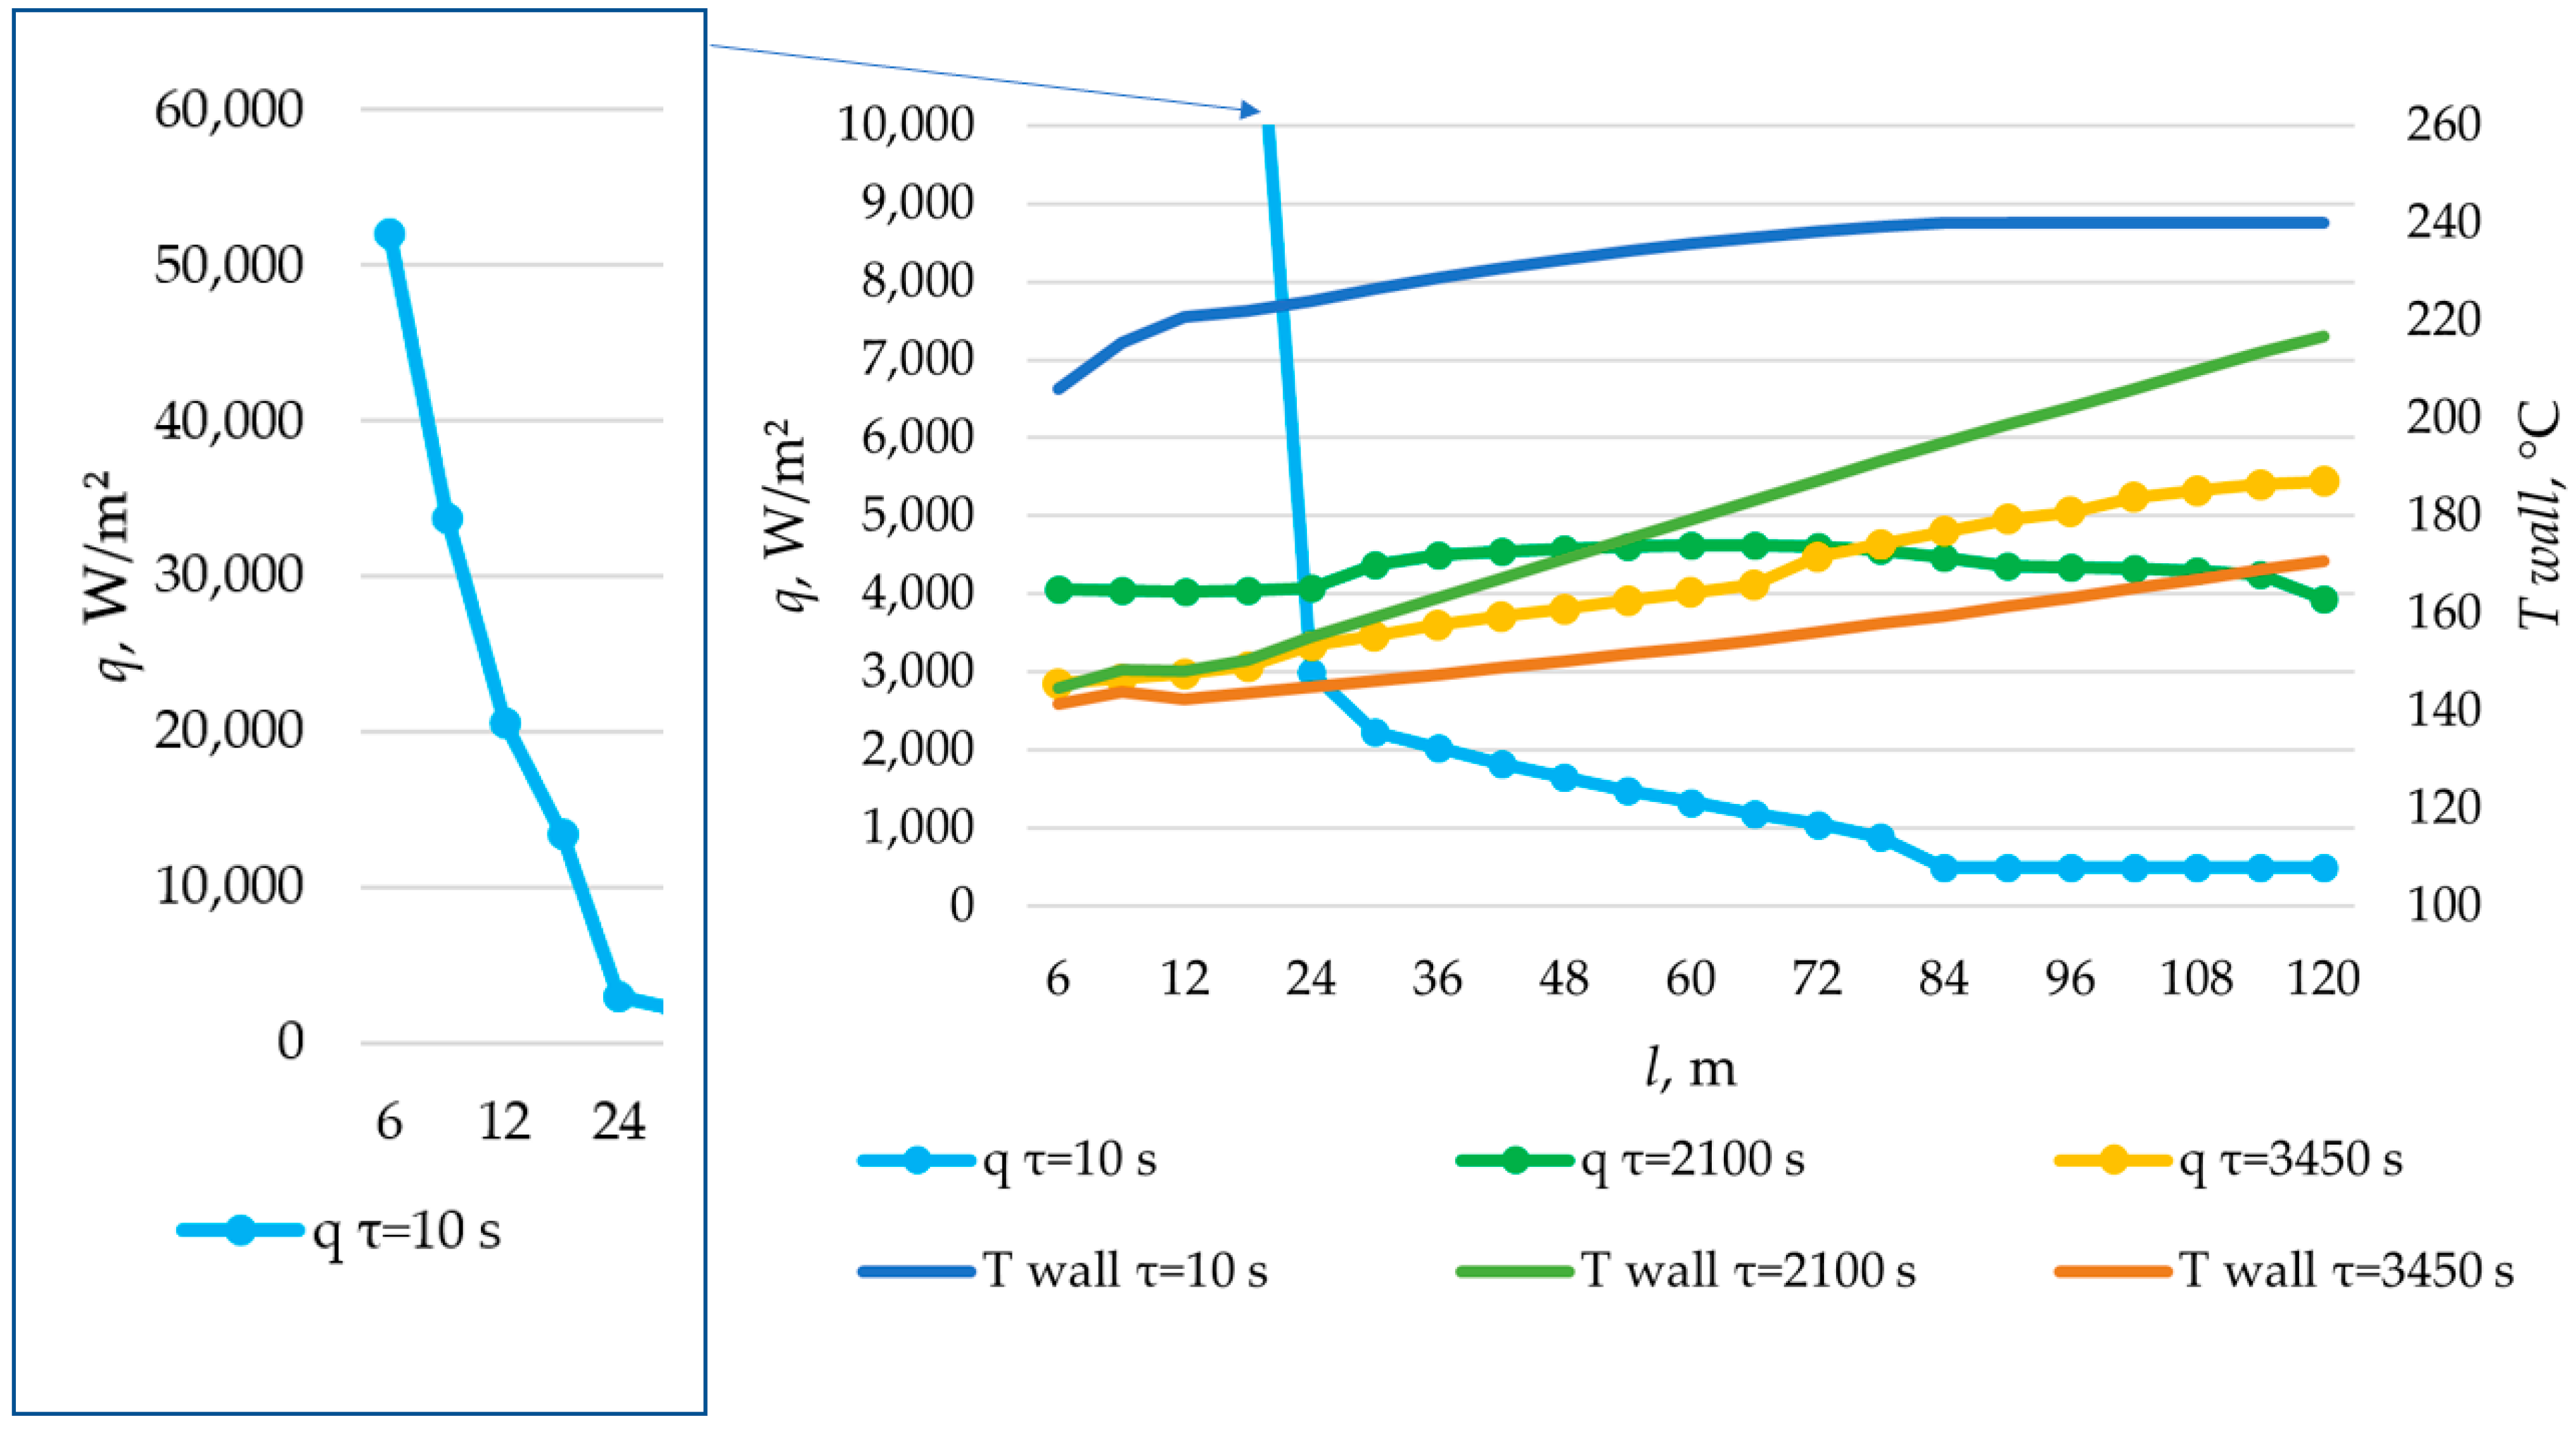
According to the data in Figure 26, the temperature of the heat transfer fluid at the outlet of the heat accumulator decreased from 240 °C to 170 °C over a period of 1200, 2200, and 3450 s, with a total length of the heat exchange surface of 80, 100, and 120 m, respectively.
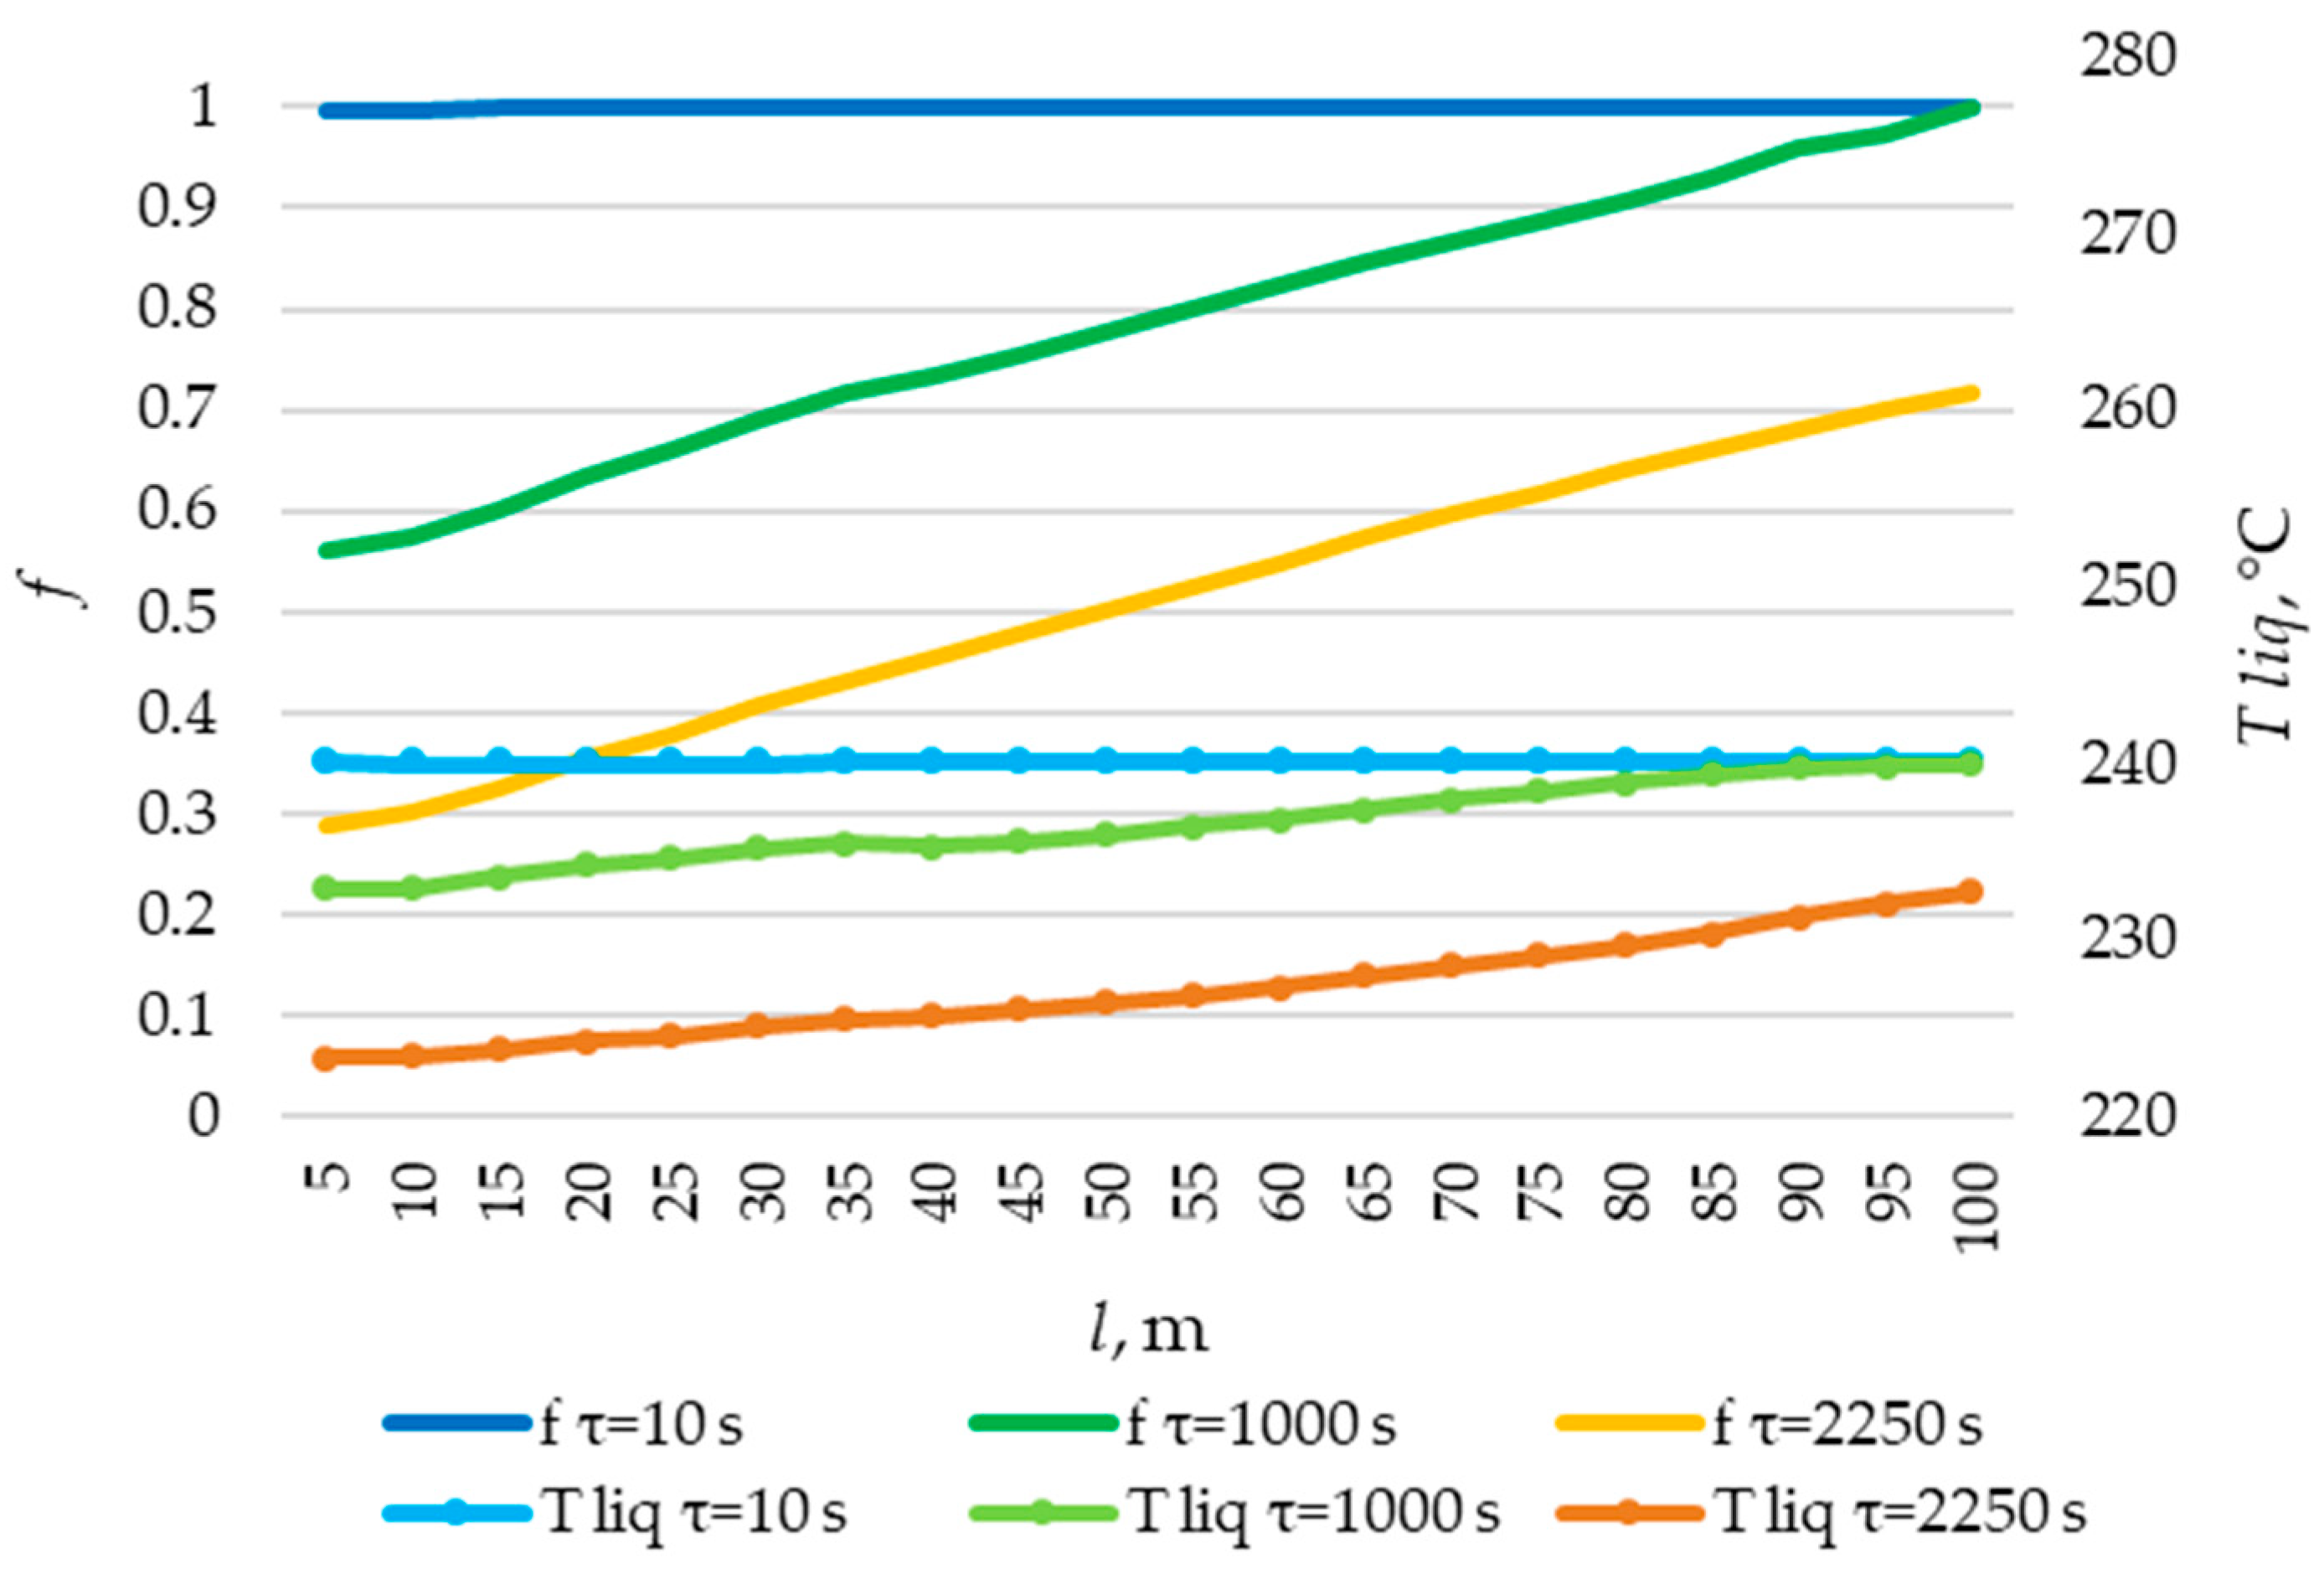
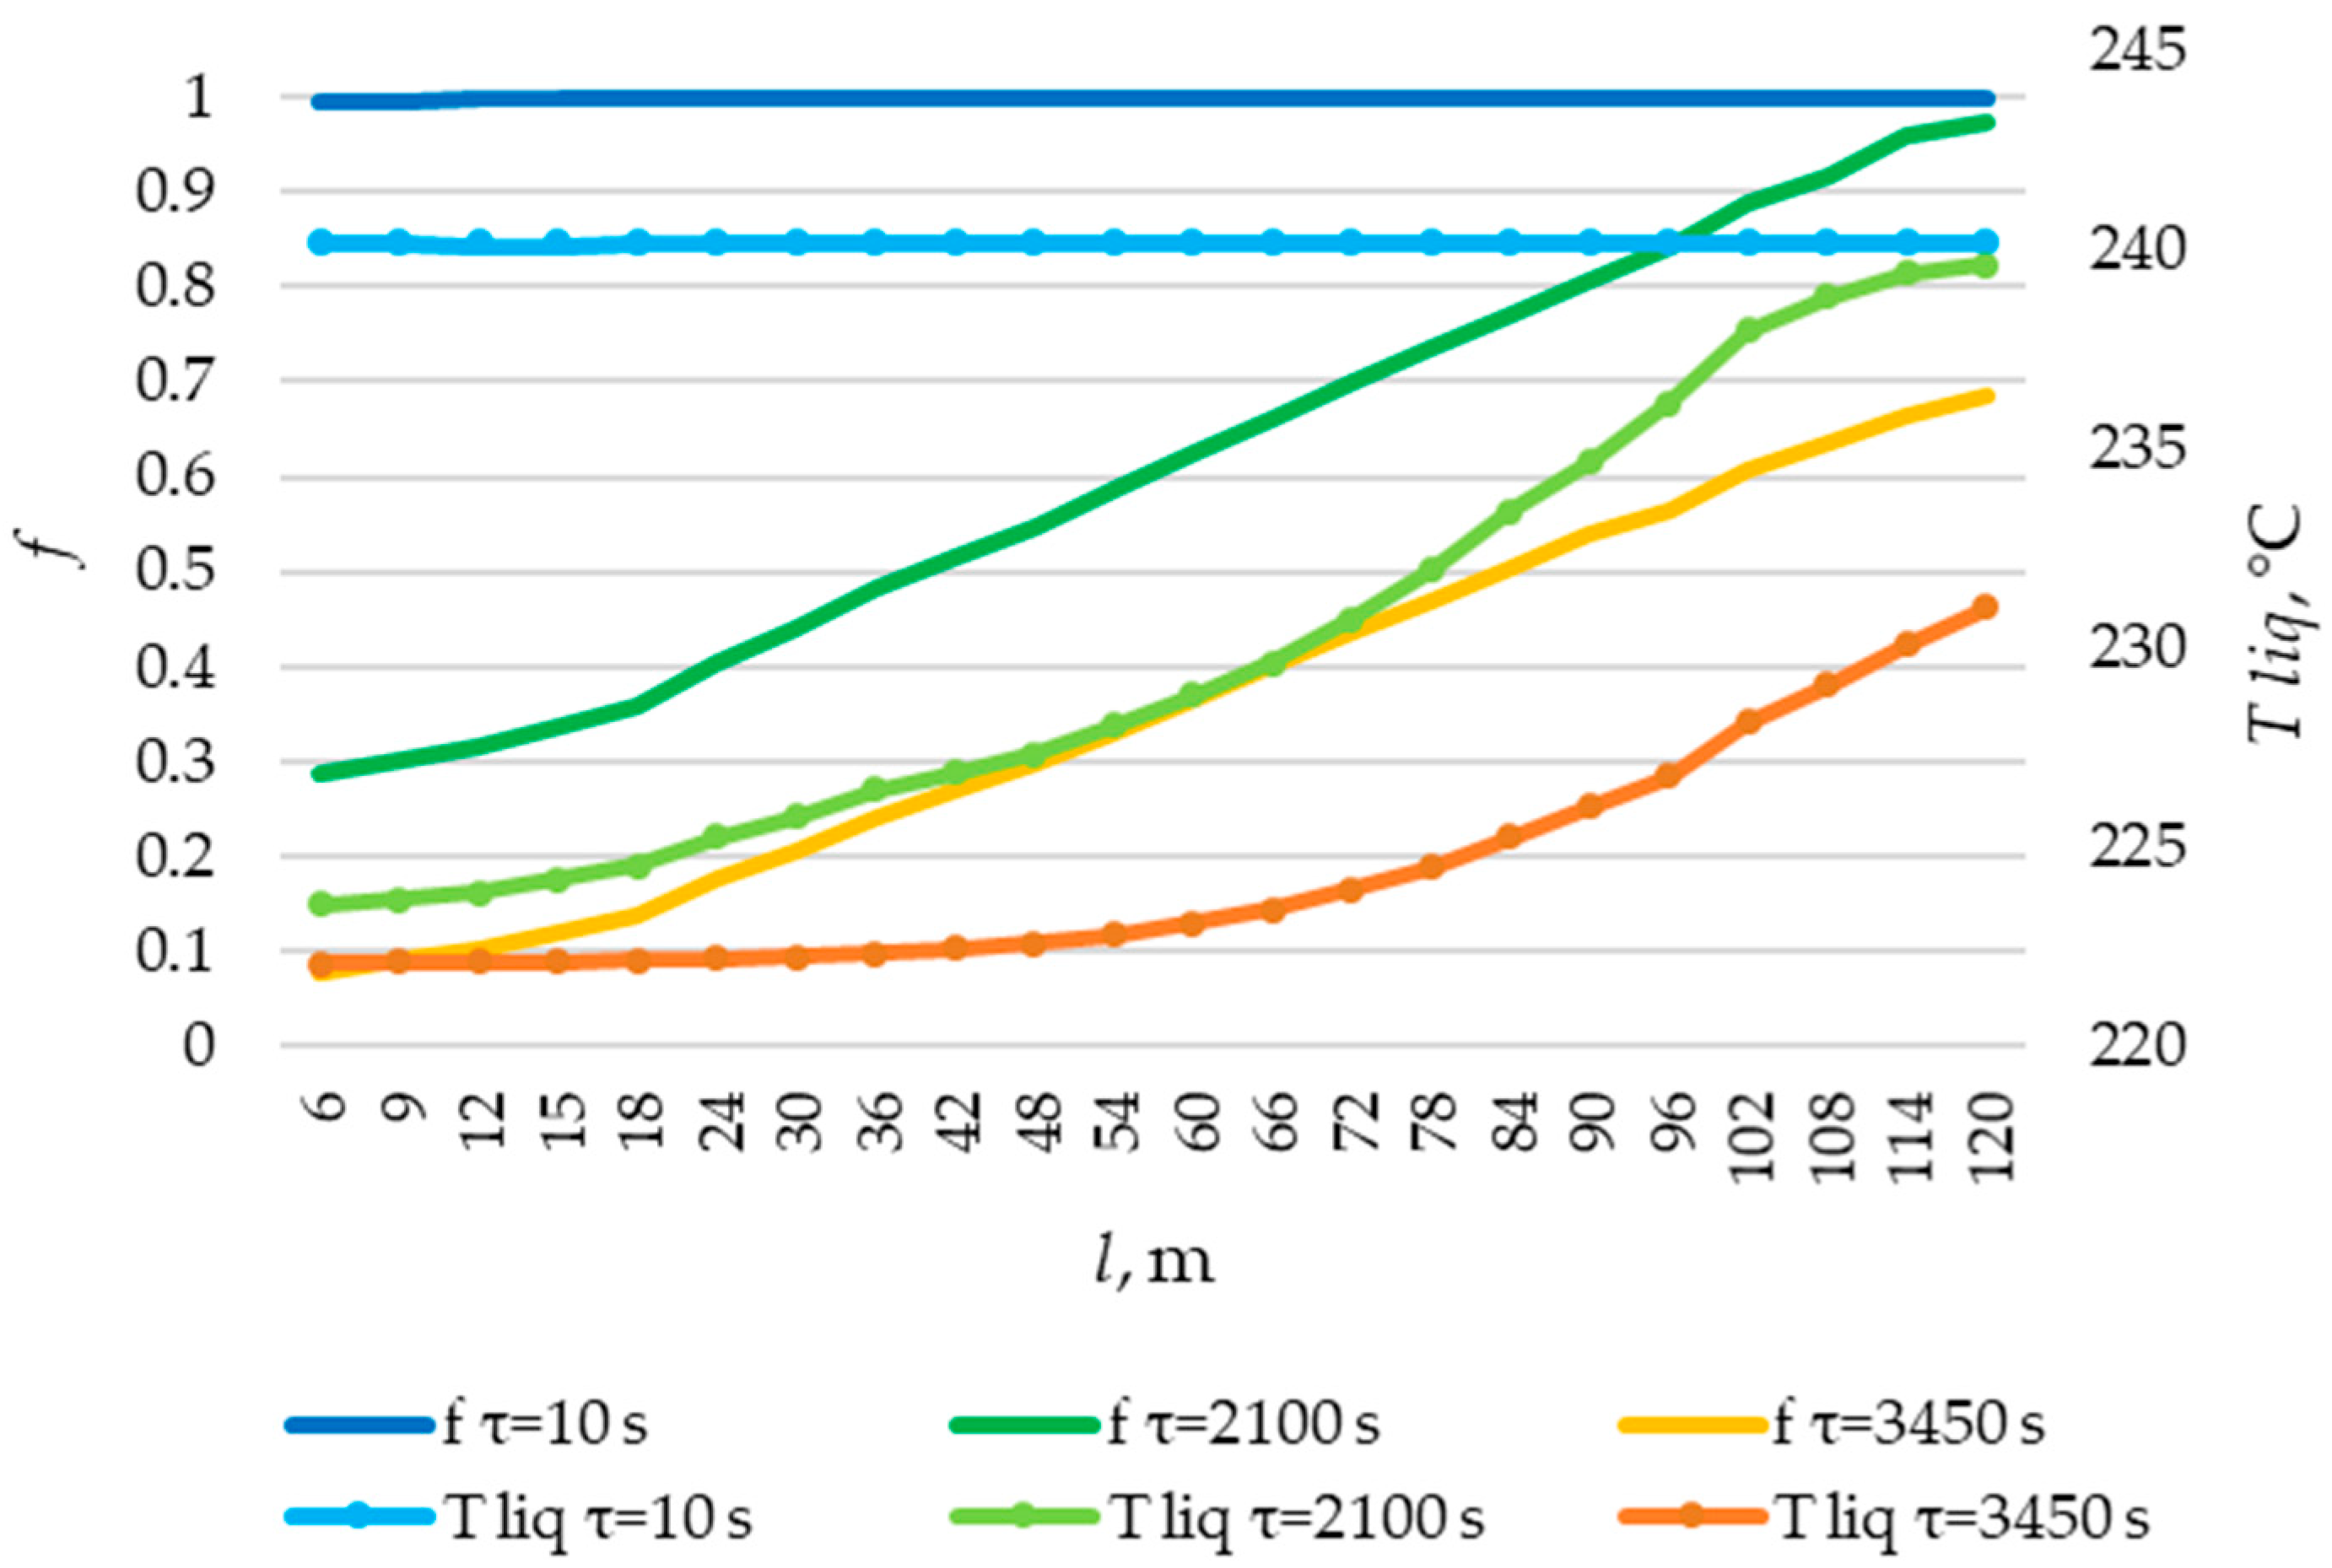
According to the data presented in Figure 27, Figure 29 and Figure 31, at time t = 10 s, the heat flux density decreased from ≈52,000 W/m2 to ≈5000 W/m2 during the first 20 m and then decreased more uniformly to ≈0 W/m2. This occurs because the heat transfer fluid rapidly heats up from 140 °C to 222 °C (222 °C corresponding to the melting point of the PCM), and then the temperature of the heat transfer fluid gradually approaches the temperature of the PCM in its liquid state (≈240 °C). Thus, at τ = 10 s, there is practically no solid PCM (as can be seen in Figure 28, Figure 30 and Figure 32). The distribution of heat flux density along the length of the heat exchange surface is determined solely by the temperature difference between the heat transfer fluid and the PCM.
In the middle of the heat exchange process (τ = 450, 1000, and 2100 s, as shown in Figure 27, Figure 29 and Figure 31), the heat flux density initially increased and then decreased. This is because, at that point in time, there was already a significant amount of solid PCM around the initial part of the heat exchange area, which reduced the heat flux density despite the large temperature difference between the heat transfer fluid and the PCM (as can be seen in Figure 28, Figure 30 and Figure 32). The heat transfer fluid in the initial sections of the heat exchange surface heats up slightly. Because of this, a relatively cold heat transfer fluid enters the middle part. Therefore, there is a large temperature difference between the heat transfer fluid and the PCM in the middle of the exchange surface, and a high heat flux density occurs in this area. A significantly heated fluid enters the last sections of the heat transfer surface, so the heat flux is low there despite the absence of a solid PCM.
At the end of the heat exchange process, as shown in Figure 27, Figure 29 and Figure 31 (τ = 1200, 2250, and 3450 s, respectively), the heat flux density along the length of the heat exchange surface increased from ≈5000 to ≈8000, from ≈4000 to ≈6000, and from ≈3000 to ≈5000 W/m2, respectively, for heat exchange surface lengths of 120 m, 100 m, and 80 m. At this time, the solid PCM layer reduced the intensity of heat transfer at all areas of the heat exchange surface (as can be seen in Figure 28, Figure 30 and Figure 32).
The solid layer of PCM increased more intensively over time in the initial sections of the heat exchange surface and less intensively in the final sections. Similarly, the temperature in the liquid phase of the PCM decreases more quickly in the initial sections of the heat exchanger and more slowly in the final sections. In general, this is due to the fact that the temperature of the heat transfer fluid is lower at the beginning and higher at the end of the heat exchange surface at each point in time.
3.6. Checking the Received Dependencies
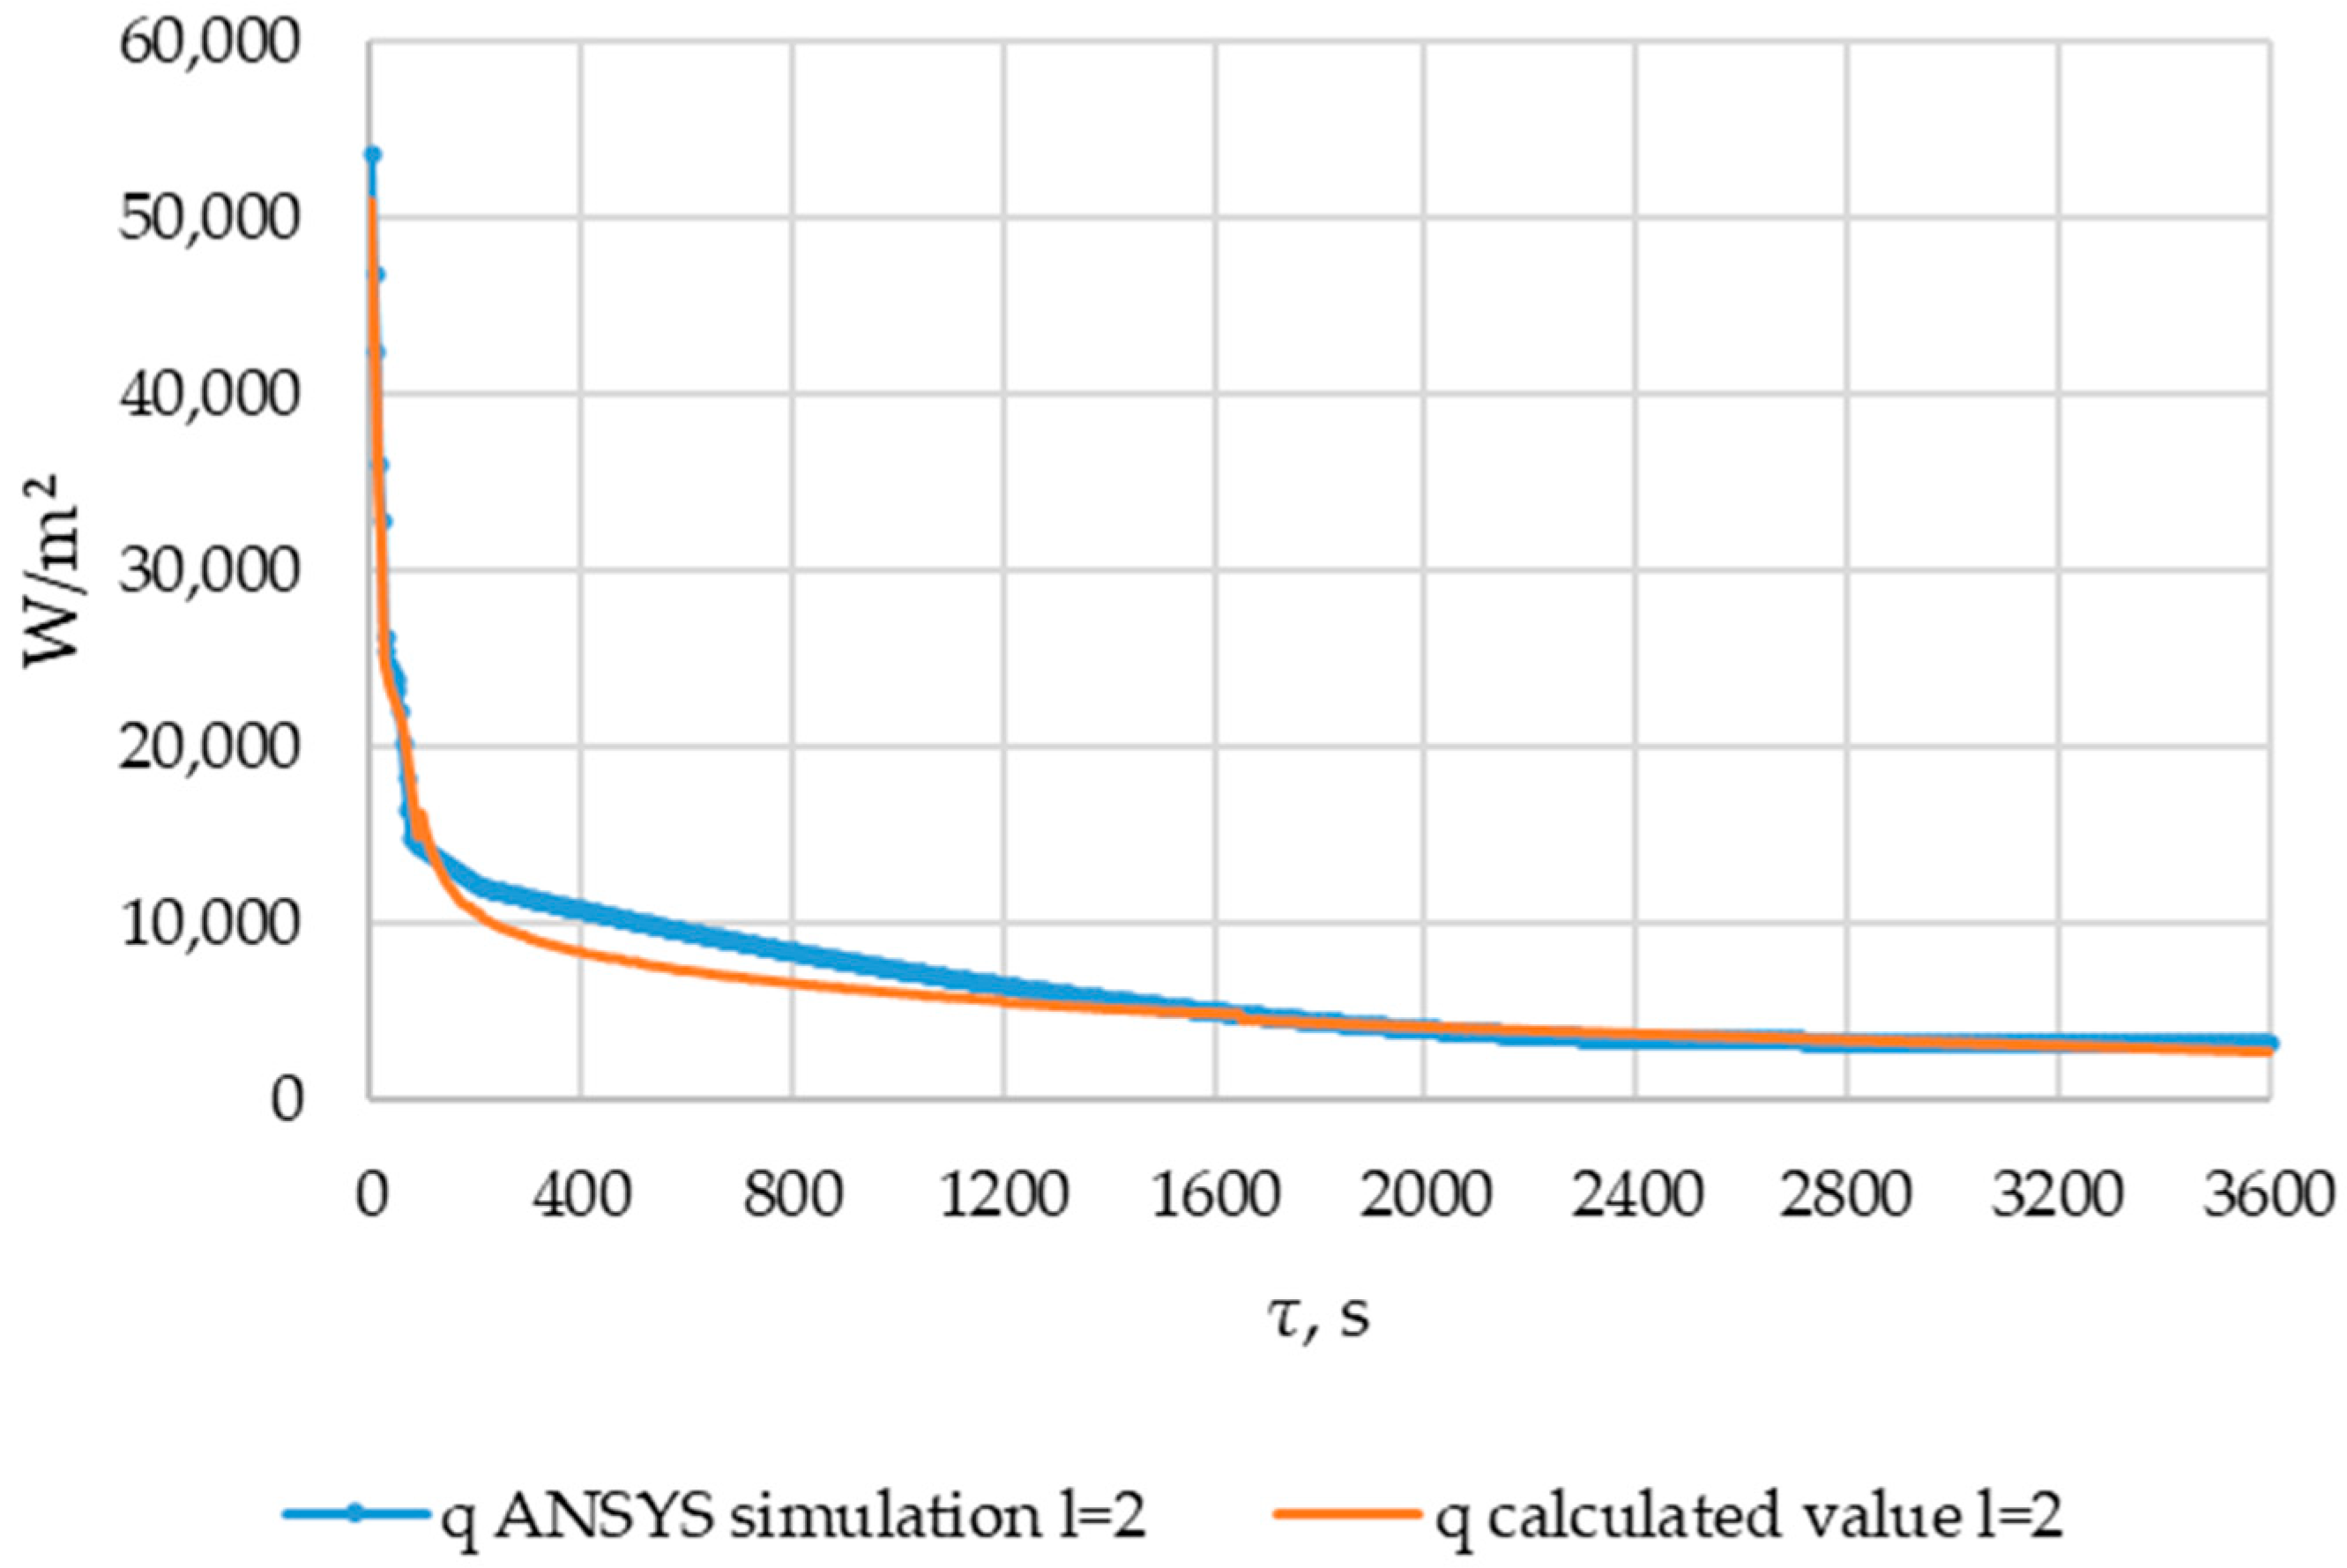
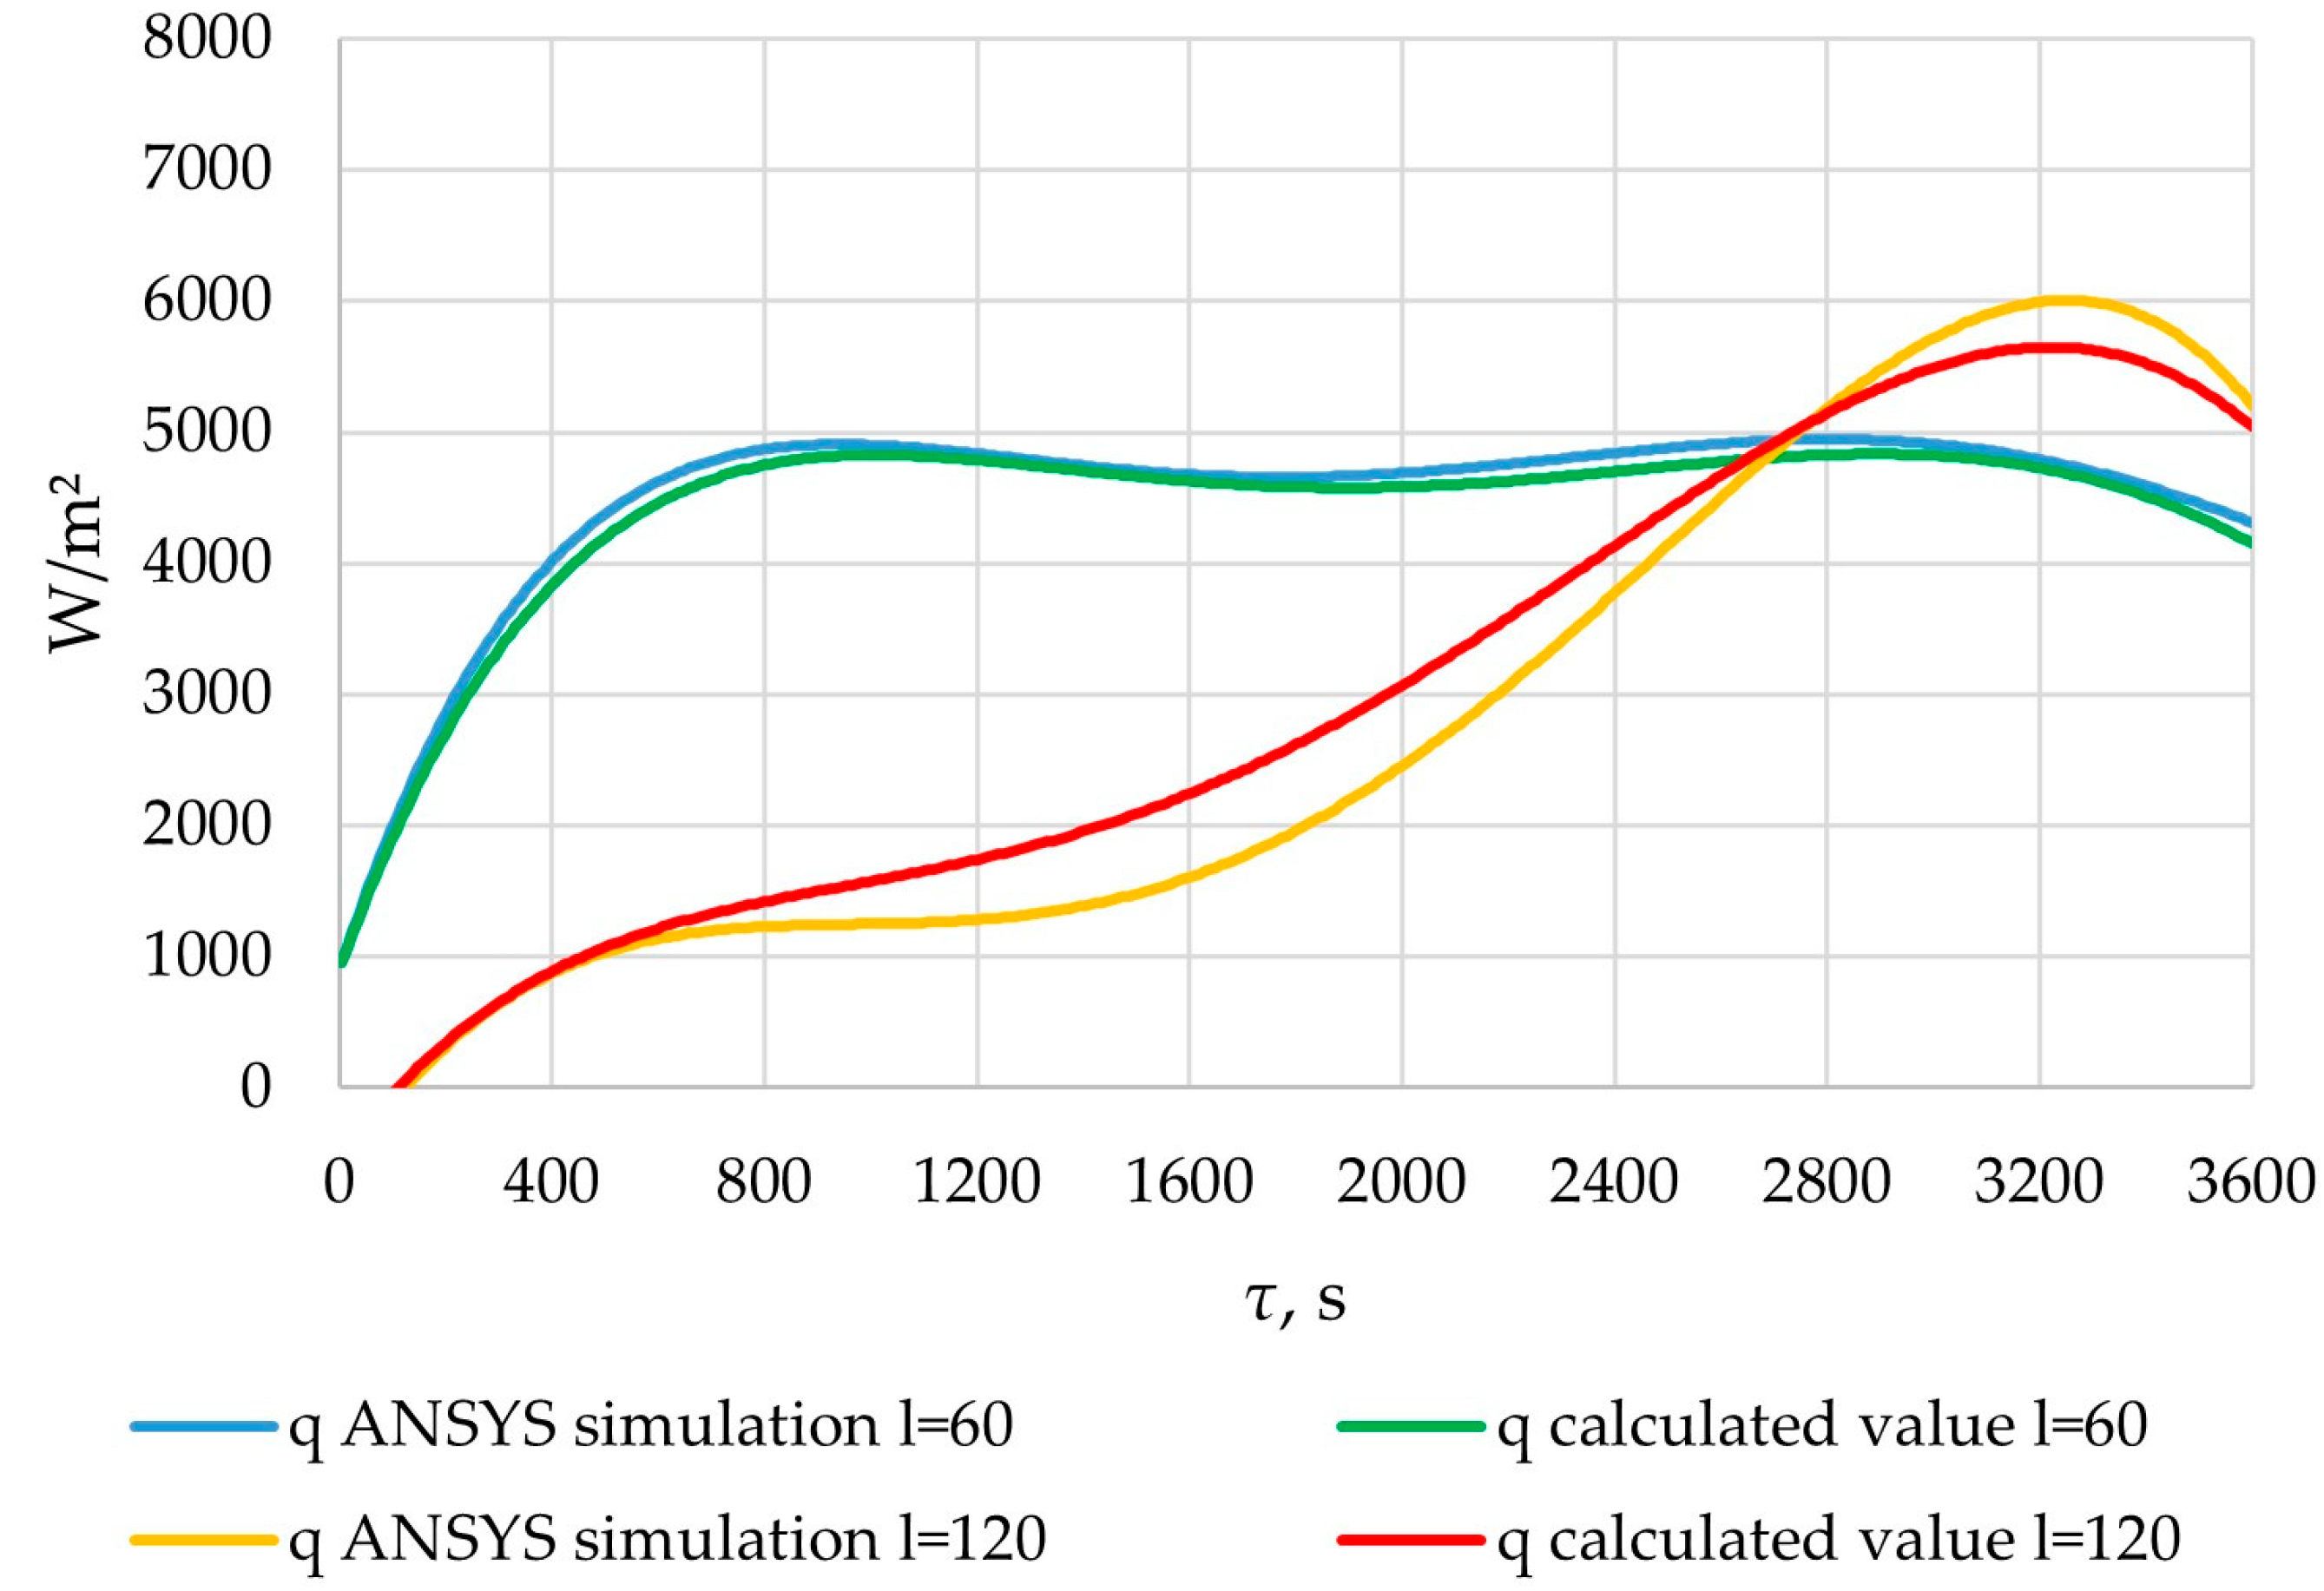
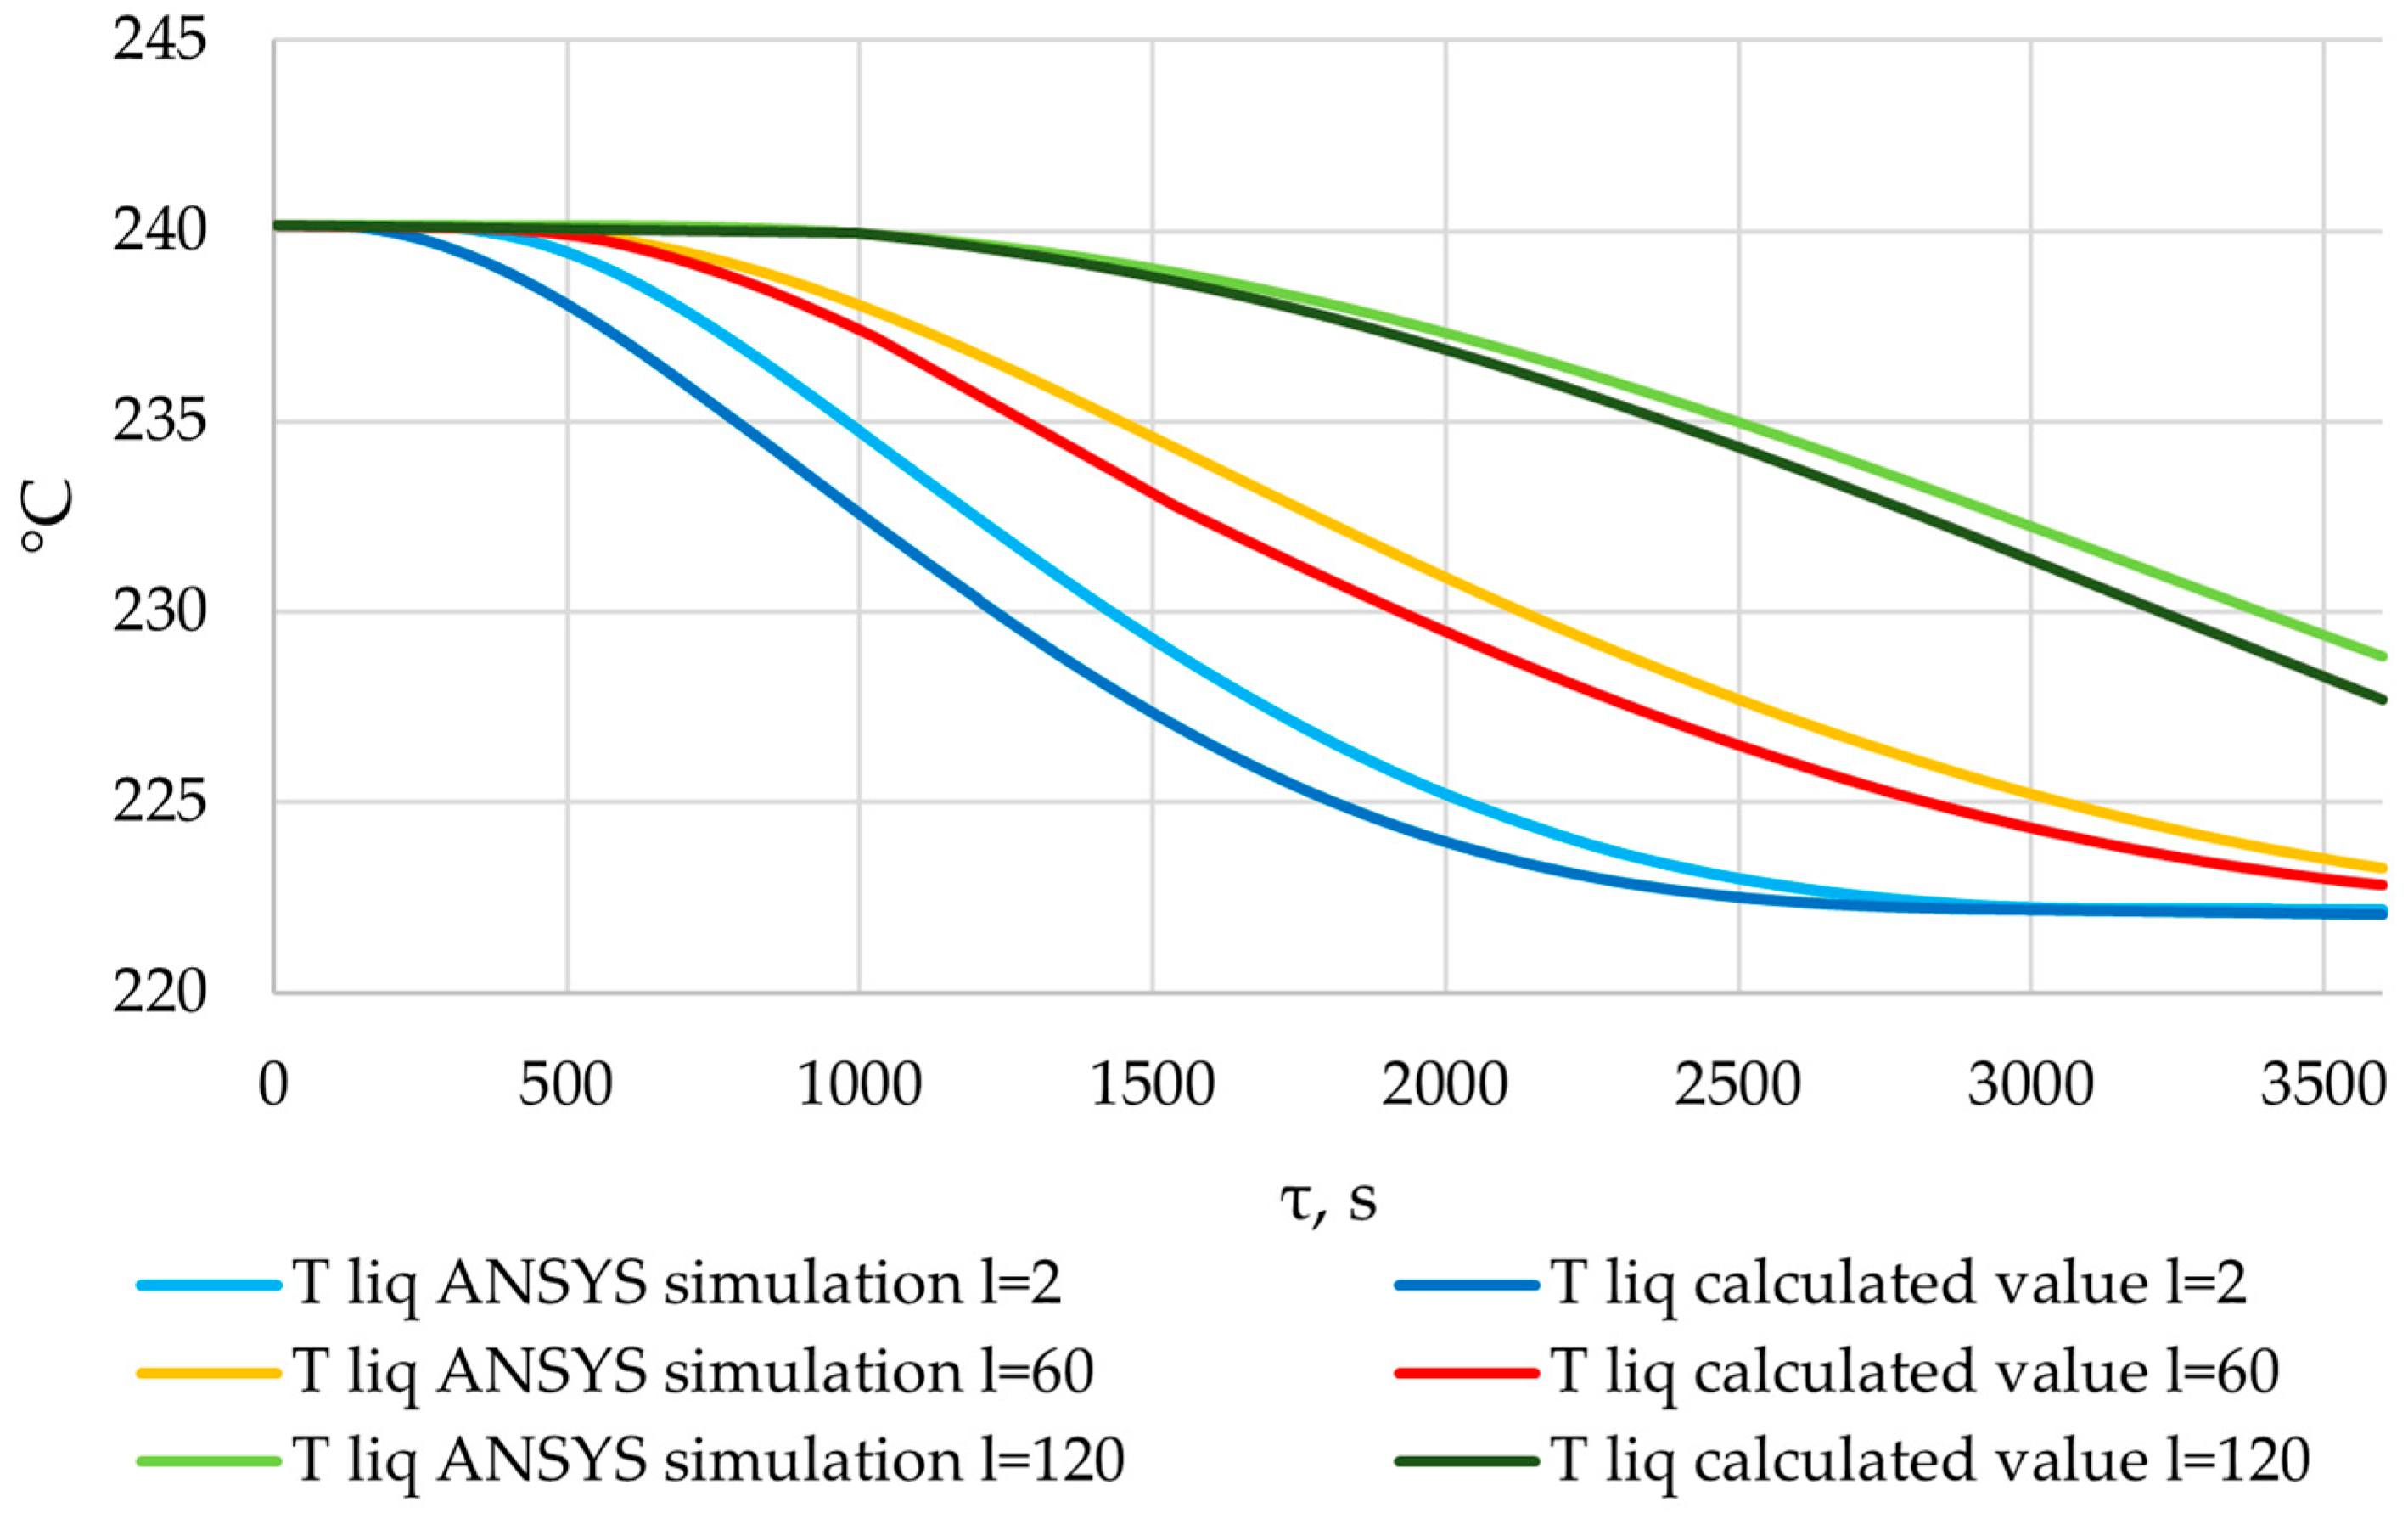
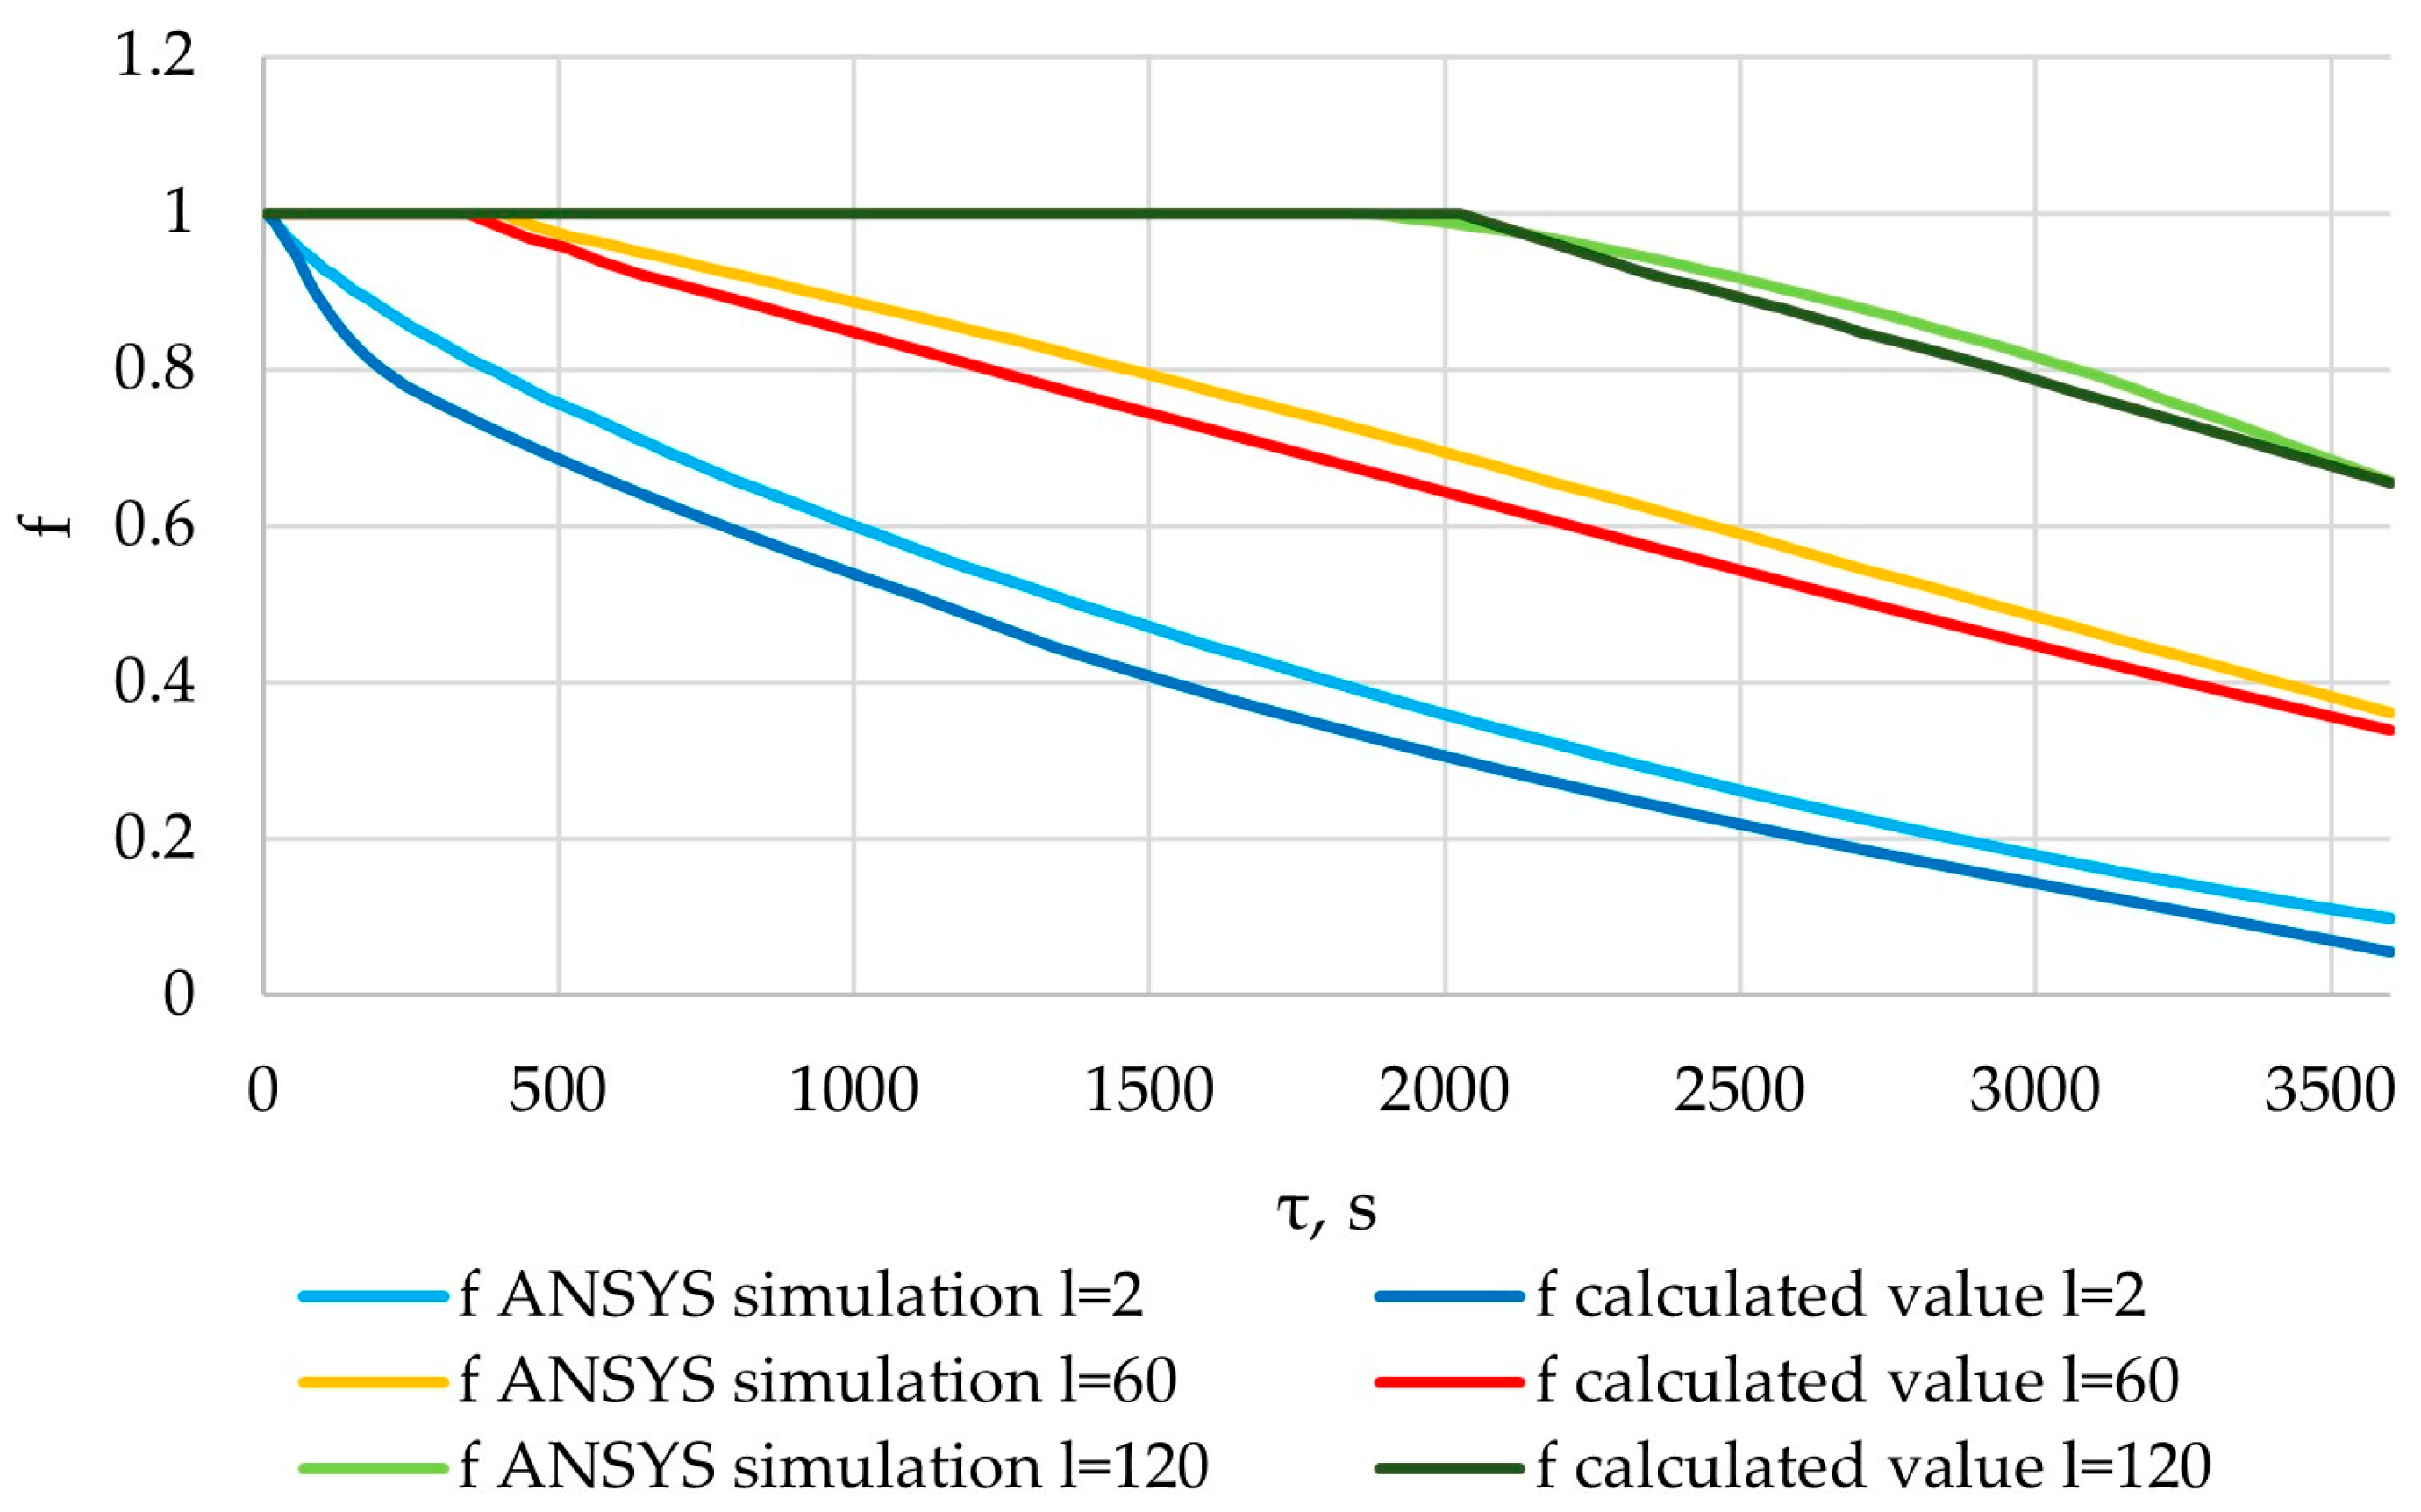
The regression dependencies obtained for (1)–(3) and the method described in Section 2.3 were verified. The results presented in Section 3.5 for the full length of the heat exchange surface l = 120 m were compared with the results of the verification simulation in ANSYS Fluent. The densities of the heat flux, the temperatures of the liquid phase of the PCM, and the fraction of the liquid PCM at each time step in individual sections of the heat exchange surface were compared. The parameters corresponding to cross-sections with heat exchange surfaces at the points of length l = 2, 60, and 120 m were compared. The results are shown in Figure 33, Figure 34, Figure 35 and Figure 36. In Section 3.5, temperature versus time graphs were determined for the inner surface of tubes in different sections. During verification simulations, these temperatures were applied to the inner surfaces of the tubes.
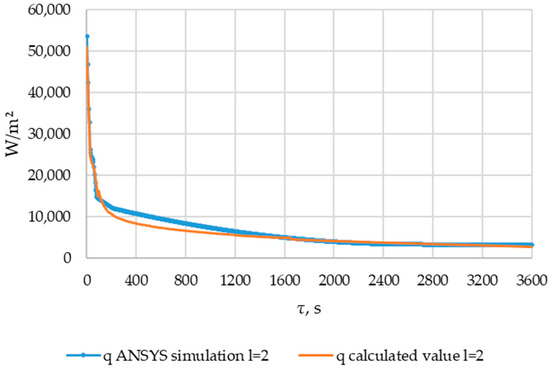
Figure 33.
The heat flux densities obtained from the results of verification ANSYS simulation and heat flux densities calculated using the method described in Section 2.3. Point of length l = 2 m of the heat exchange surface.
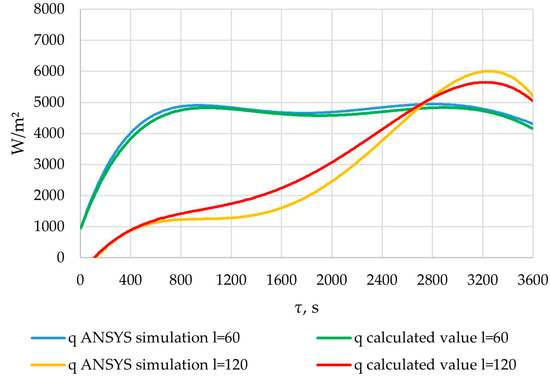
Figure 34.
The heat flux densities obtained from the results of verification ANSYS simulation and heat flux densities calculated using the method described in Section 2.3. Points of length l = 60 m and l = 120 m of the heat exchange surface.
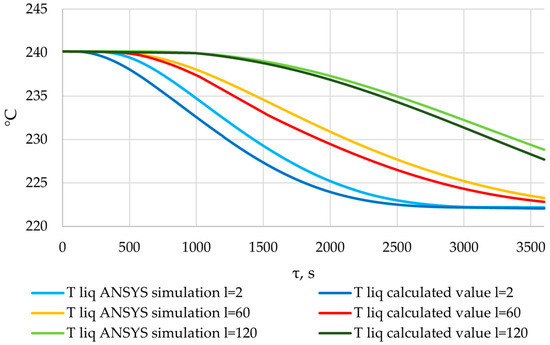
Figure 35.
Liquid PCM temperatures obtained from the results of the verification of the ANSYS simulation, and liquid PCM temperatures calculated using the method described in Section 2.3.
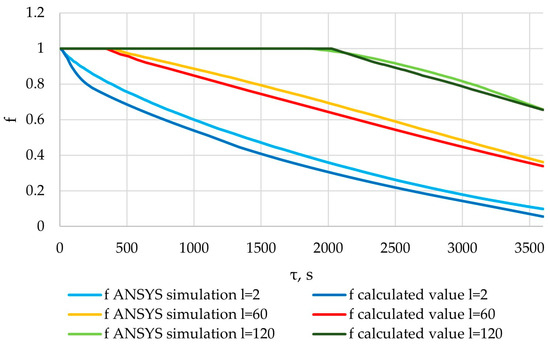
Figure 36.
The liquid fraction of the PCM obtained from the results of the verification of the ANSYS simulation, and the liquid fraction of the PCM calculated using the method described in Section 2.3.
The heat flux density in the cross-section l = 2 m decreased from ≈50,000 W/m2 to ≈10,000 W/m2 within 200 s. Then, within 3400 s, the heat flux density decreased to 3000 W/m2.
In the cross-section corresponding to the position l = 60 m, the heat flux density increased from 1000 to 5000 W/m2 over a period of 1000 s. At this period, the reduction in the temperature of the heat transfer fluid has a greater impact than the growth of the solid PCM layer. Then, for the next 800 s, it decreased by 300–400 W/m2. At this period, the temperature difference between the heat transfer fluid and the PCM does not significantly change. The reduction in heat transfer intensity can be explained by the formation of a solid layer of PCM. After that, for the next 1000 s, the value continued to increase by the same amount due to a decrease in the temperature of the heat transfer fluid. Finally, at the end of the heat exchange process, the flux density decreased to 4200 W/m2 in the time interval between 2800 and 3600 s. At this stage, increasing the solid PCM content has a larger impact on the heat transfer intensity than decreasing the temperature of the heat transfer fluid.
In the cross-section corresponding to the position of l = 120 m, the heat flux density increased from 0 to 6000 W/m2 over a period of 3200 s. After that, within 400 s, it decreased to 5000. During the first stage, the decrease in the temperature of the heat transfer fluid contributed more to the intensity of heat transfer than the increase in the thickness of the solid PCM layer. In contrast, during the second stage, this was reversed.
The temperature decrease in the liquid phase of the PCM occurs intensively from the very beginning, at the point l = 2. In the cross-sections corresponding to positions l = 60 m and l = 120 m, there is an intense decrease in temperature in the liquid phase of the PCM beginning at the 500th and 1000th seconds, respectively. This can be explained by the dynamics of heat transfer intensity in these sections (see Figure 33 and Figure 34).
In the cross-section corresponding to the position of l = 2 m, an intensive formation of a solid PCM can be observed from the very beginning of the heat transfer process. In the cross sections corresponding to the positions l = 60 and l = 120, an intensive formation of solid PCM is observed, starting at the 400th and 2000th seconds, respectively. This can be explained by the dynamics of the heat transfer fluid temperature in these sections (Figure 31). A solid layer of PCM forms at a heat transfer fluid temperature lower than the melting point of the PCM.
The calculated and tabular values of the Fisher criterion are shown in Table 5.

Table 5.
The calculated and tabular values of the Fisher criterion.
Figure 33, Figure 34, Figure 35 and Figure 36 indicate a good correlation between the regression and simulation results. The calculated values of the Fisher criterion are significantly higher than the tabular values. The confidence interval is 0.95. Regression dependencies and the proposed method are adequate (according to the description in Section 2.5).
4. Discussion
Section 3.1 presents the grid-independence study. The acceptable size of a grid element is 1 mm, with a time step of 0.5 s. When comparing simulation results using grids with elements of 1 and 0.5 mm, the maximum difference in heat flow across the heat exchange surface at corresponding time points is less than 2%. There were no significant temperature changes at control points at corresponding times for different grids.
In Section 3.2, the results of the experimental verification of the model in ANSYS FLUENT are presented. When comparing the experimental and simulated data using the Fisher test, the calculated Fisher criterion value was 25.0, while the tabulated value was 4.3. Since the calculated value was higher than the tabulated one, we concluded that the model was adequate.
Section 3.3 presents the results of topological optimization of the heat transfer surface. The initial temperature of the PCM in the liquid state was 240 °C. The PCM was a eutectic compound called “solar salt” (KNO3-NaNO3, 55/45 mass. %), and the temperature on the inner surface of the heat transfer wall was 145 °C. Round tubes without fins and tubes with two, three, four, five, and six fins were used as heat exchange surfaces. Under these conditions, the heat flux density nonlinear decreased from 250,000… 270,000 W/m2 to 4000…5000 W/m2 (depending on the number of fins) within 1800 s. The heat flux density decreased from 170,000 W/m2 to 3000 W/m2 (when tubes without fins were used as heat transfer surfaces). During the first minute (Figure 16), the heat flux decreased from an initial value of 250,000… 270,000 W/m2 to 17,000…23,000 W/m2 (12–15 times). After that, the heat flux density continued to decrease at a slower rate, reaching ≈5000 W/m2 (Figure 17).
It should be noted that, at the beginning of the heat exchange process, direct cooling of the heat exchange surface significantly contributes to the heat flow. In other studies (Table 4), with a wall thickness less than that in the current study, and when using a low-conductivity material (such as silica glass), the heat transfer was initially lower than in the current study. It does not follow from this that the wall thickness has a positive effect on the efficiency of the heat accumulator with a PCM. By analogy with finning and other forms of surface area increase, the material of the heat exchange surface has high thermal conductivity. Under certain conditions (in our case, at the beginning of the heat transfer process), it increases heat transfer. However, a thick heat-exchange wall does not improve the efficiency of heat transfer into the depth of the PCM. It also reduces the volume of the PCM, thus reducing the amount of energy stored.
According to the results of the topological optimization presented in Section 3.3, the optimal design for intensifying heat transfer in our case is four longitudinal fins. This design increased the total amount of energy transferred through the heat exchange surface by 12.1% compared to the design with three fins. With a further increase in the number of edges, from four to five and five to six, the amount of energy transferred increases by 3.7% and 3.1%, respectively. This means that each subsequent fin adds less and less to the intensity of heat transfer but reduces the area for the PCM.
Section 3.4 presents the results of heat transfer modeling at different expected inner wall temperatures (Twall) when a tube with four longitudinal fins is used as a heat exchange surface.
As can be seen in Figure 20 and Figure 21, at wall temperature significantly below the melting point of the PCM, the heat flux density decreased from 200,000…250,000 W/m2 (the beginning of the heat transfer process) to 4000… 6000 W/m2 (after 900 s). This is typical for the initial and central sections of the heat exchange surface for the case under consideration.
In the simulation series, where the wall temperature decreased uniformly from 220 to 160 °C, from 210 to 170 °C, and from 200 to 140 °C (see Figure 20 and Figure 21), the heat flux density decreased from 120,000… 60,000 W/m2 (beginning of the heat exchange process) to 4000… 7000 W/m2 (period from 500 to 700 s). Then, it remained constant or increased slowly. This is typical for the central sections of the heat exchange surfaces in the case under consideration.
The heat flux density increases from 0 to 6000 W/m2, with a uniform decrease in wall temperature from 240 °C to 180 °C (see Figure 20 and Figure 21). This dynamic is typical of the final sections of the heat exchange surface in the case under consideration.
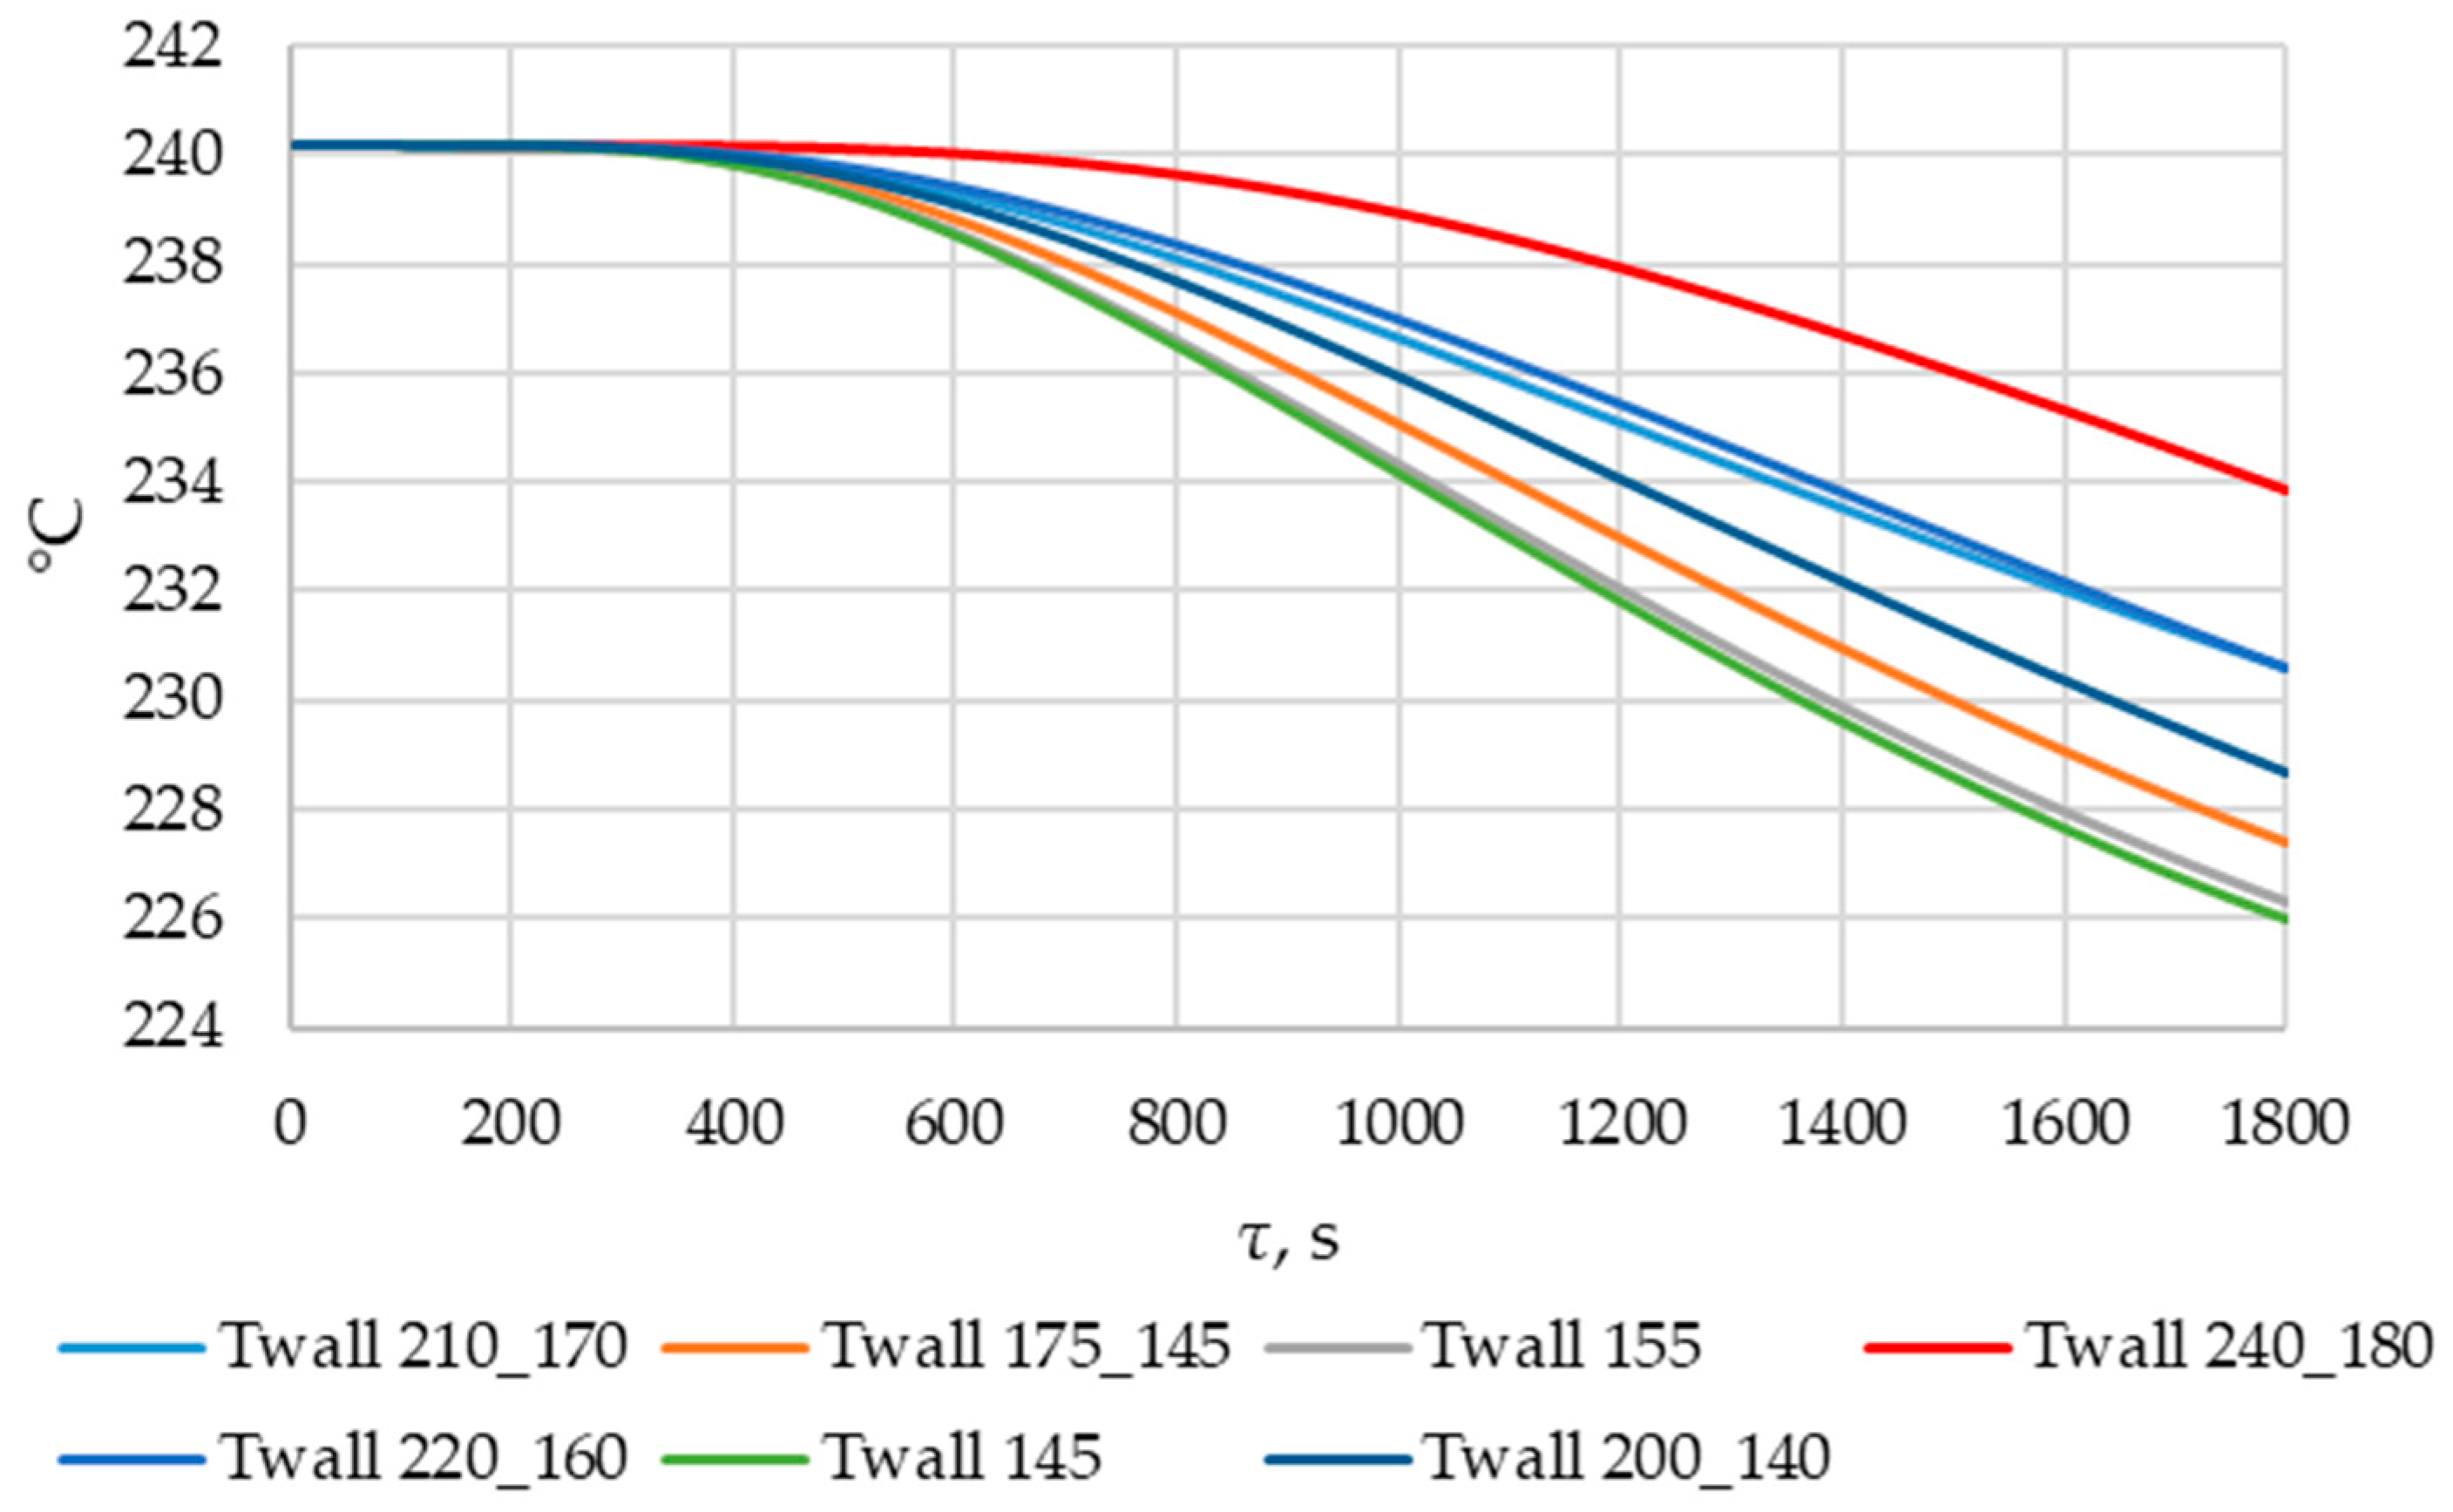
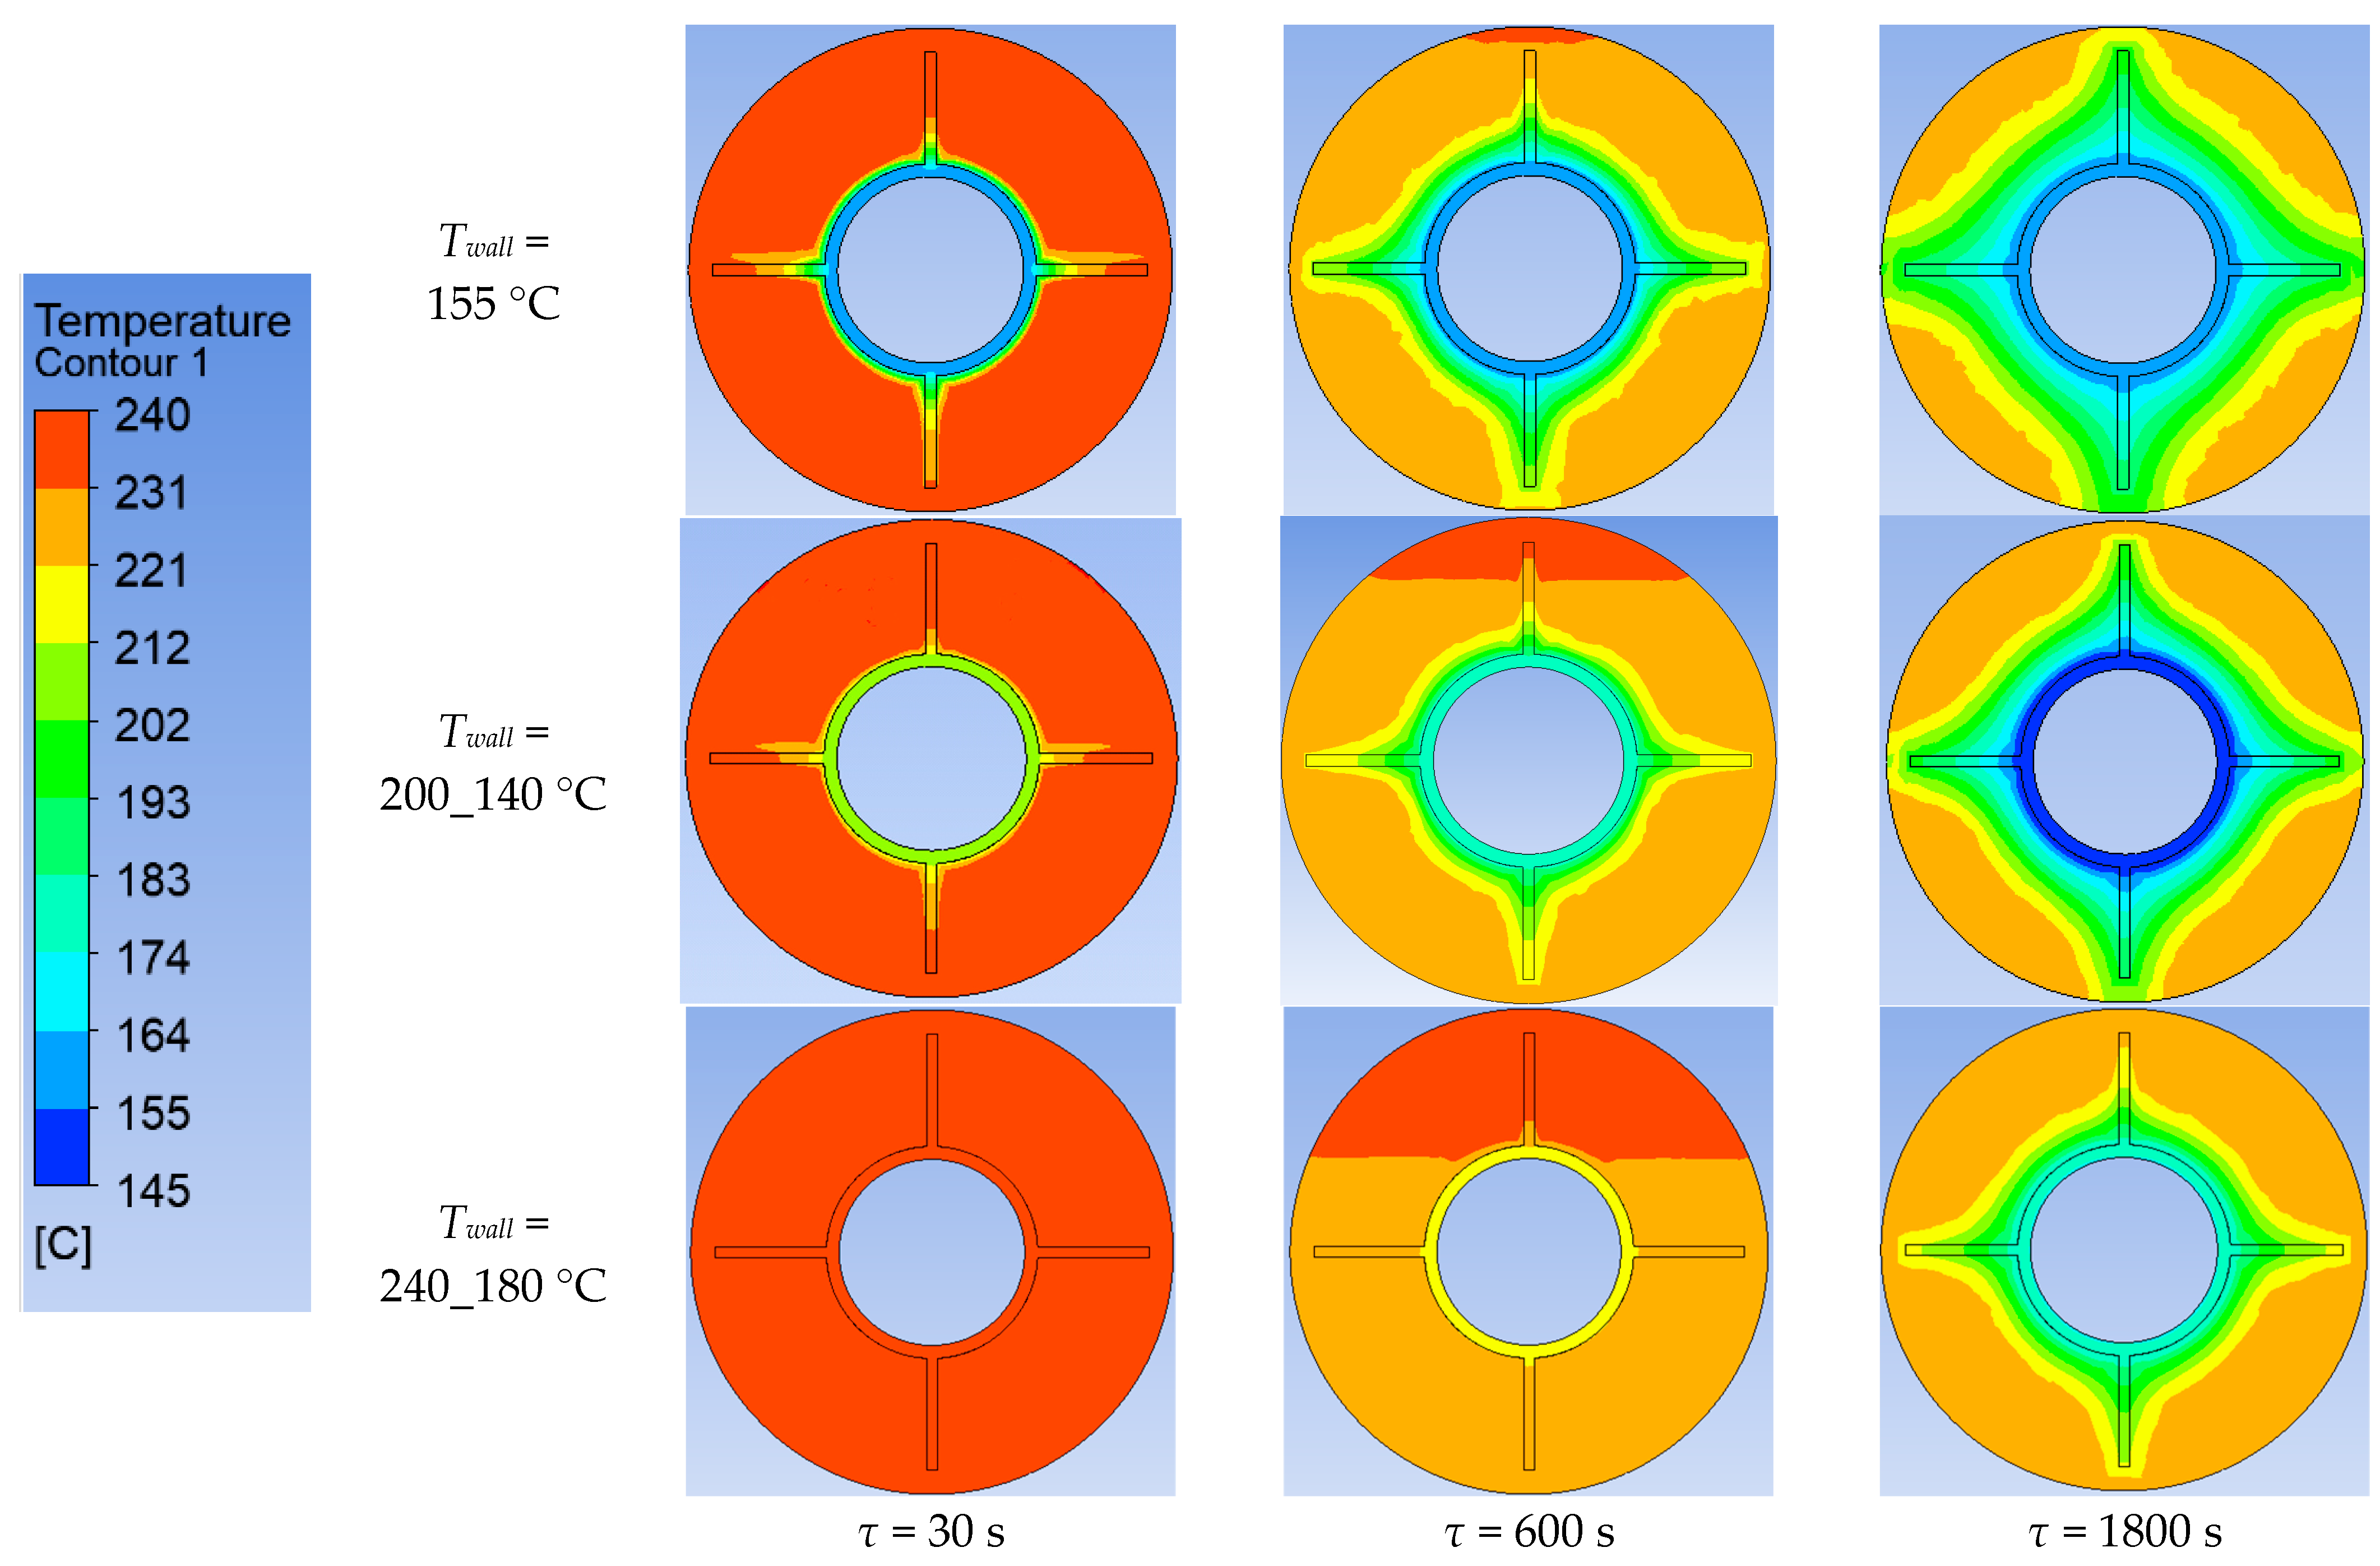
The lower the wall temperature, the higher the heat flux density (see Figure 20 and Figure 21). The proportion of the solid phase in the PCM region at the end of the modeling process is higher when the wall temperature is lower (Figure 22 and Figure 25). The situation is similar for the temperature in the PCM region. The higher the wall temperature is, the lower the temperature will be in the PCM at corresponding time points for different simulations (Figure 23 and Figure 24). These data are planned to be used in future work to optimize the volume of PCM around the final sections of the heat exchange surface.
Section 3.5 presents the results of modeling heat transfer across the total heat transfer surface in a heat accumulator for the application under consideration. The results presented in Section 3.5 were obtained using the method described in Section 2.3 (Figure 5 and Figure 6) and regression dependencies for Equations (1)–(3).
The temperature of the heat transfer fluid at the outlet of the heat accumulator decreases from 240 to 170 °C over a period of 1200, 2200, and 3450 s for heat exchanger surface lengths of 80, 100, and 120 m, respectively (Figure 26). In order to replace the high-pressure heater, according to the proposed application (Section 2.1), the heat accumulator needs to heat the feed water to 170 °C. This means that, with heat exchange surface lengths of 80, 100, and 120 m, the accumulator can perform the required function for 1200, 2200, and 3450 s, respectively.
According to the data presented in Figure 27, Figure 29 and Figure 31, at the time point of 10 s (beginning of the process), the most intense heat exchange in the heat accumulator takes place in the initial sections of the surface. In the middle of the process under consideration (τ = 450, 1000, and 2100 s in Figure 27, Figure 29 and Figure 31, respectively), the intensity of heat exchange along the length of the heat exchange surface increases from the beginning to the middle, then decreases. At the end of the process (τ = 1200, 2200, and 3450 s in Figure 27, Figure 29 and Figure 31, respectively), the intensity of heat transfer along the heat exchange surface increases from the beginning to the end. These processes are explained by the distribution of wall temperature and the amount of solid PCM along the heat exchange surface at different points in time (see Figure 28, Figure 30 and Figure 32). A more detailed description of these processes is provided immediately after Figure 32.
Section 3.6 presents a comparison of the simulation results obtained using the method described in Section 2.3 with the verification simulations in ANSYS. The calculated values of the Fisher criterion are significantly higher than their tabular values. The methods described in Section 2.3 are considered adequate. Figure 33, Figure 34, Figure 35 and Figure 36, which present the results obtained using the method described in Section 2.3 and verification simulations in ANSYS, visually support this conclusion. Figure 33, Figure 34, Figure 35 and Figure 36 show the time graphs of the temperature on the inner surface of the heat exchange wall, the temperature in the liquid region of the PCM, as well as the fraction of the liquid phase of the PCM for cross-sections corresponding to the point of lengths l = 2, 60, and 120 m of the heat exchange surface. A detailed description of these graphs is provided near Figure 33, Figure 34, Figure 35 and Figure 36.
5. Conclusions
In this paper, we presented a new method for calculating the total heat transfer surface in a high-power heat accumulator using a PCM with intensification due to additional surfaces on the PCM side. This method is based on surrogate modeling of heat transfer in heat accumulators using a PCM.
The main provisions of the method are as follows:
- Heat transfer over the entire coil heat exchange surface in a heat accumulator with a PCM is calculated at discrete sections at each time step, taking into account the parameters and state of the heat transfer fluid in those sections and the parameters and condition of the PCM surrounding those sections;
- The heat flux density at each time step for each discrete section is determined by the dependence: q = f(Tliq, rsolid PCM, Twall);
- The surface temperature of the wall at each discrete section, from the side of the heat transfer fluid, is determined by a method of iterative calculation that takes into account heat transfer between the fluid and the wall: q = f(Tliq, rsolid PCM, Twall) = αH2O(Twall-Taverage);
- The change in the solid phase of the PCM Δrsolid PCM and the temperature of the liquid region of the PCM ΔTliq between time steps around each discrete section of the heat exchange surface is determined by the following expressions: Δr = f(q, Twall, rsolid PCM, Tliq PCM) and ΔTliq = f(q, Twall, rsolid PCM, Tliq PCM);
- The expressions q = f(Tliq, rsolid PCM, Twall), Δr = f(q, Twall, rsolid PCM, Tliq PCM), and ΔTliq = f(q, Twall, rsolid PCM, Tliq PCM) can be determined based on the results of a series of experiments or simulations.
In this work, a heat accumulator using solar salt was considered for temporarily heating feed water instead of a high-pressure heater in a low-power nuclear power plant. The presented method determines the dimensions and the number of PCMs for such an accumulator.
Accumulators of the design under consideration (Figure 19), with 30 parallel heat exchange surfaces in the form of coils, will provide the necessary heating of feed water (from 140 to 170 °C) for 1200 s, 2200 s, and 3450 s (the length of the heat exchanger surface is 80 m, 100 m, and 120 m, respectively). The dimensions and weight of the PCM for these accumulators will be 4 × 3.71 × 2.15 m (48.5 tons of solar salt), 5 × 3.71 × 2.15 m (60.6 tons of solar salt), and 6 × 3.71 × 2.15 m (72.7 tons of solar salt), respectively. These dimensions are suitable for placing an accumulator in a stationary low-power nuclear power plant.
To further develop the solution, a pyramid-shaped container could be used for a PCM. With this design, the amount of PCM around the heat exchange surface at the end sections will be less than at the beginning. It would also be worth considering more complex surfaces to intensify heat transfer while justifying the mechanical strength of the construction.
Author Contributions
Conceptualization, V.L. and A.D.; methodology, V.L. and A.D.; software, A.D. and K.D.; validation, V.L.; formal analysis, V.L.; data curation, A.D.; writing—original draft preparation, A.D. and K.D.; writing—review and editing, A.D. and K.D.; visualization, A.D. and K.D.; supervision, V.L. All authors have read and agreed to the published version of the manuscript.
Funding
This research received no external funding.
Data Availability Statement
Data are available in a publicly accessible repository that does not issue DOIs. Publicly available datasets were analyzed in this study. These data can be found here: https://disk.yandex.ru/d/2Vp2zoNfIjzdQw (accessed on 20 October 2024).
Conflicts of Interest
The authors declare no conflicts of interest.
References
- Gendler, S.G.; Fazylov, I.R. Application efficiency of closed gathering system toward microclimate normalization in operating galleries in oil mines. Min. Inf. Anal. Bull. 2021, 9, 65–78. (In Russian) [Google Scholar] [CrossRef]
- Blinov, P.A.; Sadykov, M.I.; Gorelikov, V.G.; Nikishin, V.V. Development and research of backfill compounds with improved elastic and strength properties for oil and gas well lining. J. Min. Inst. 2024, 268, 588–598. [Google Scholar]
- Myakotnykh, A.A.; Ivanova, P.V.; Ivanov, S.L. Criteria and technological requirements for creation of a bridge platform to extract peat raw materials for climate-neutral geotechnology. Russ. Min. Ind. 2024, 4, 116–120. (In Russian) [Google Scholar] [CrossRef]
- Zhukovskiy, Y.; Koshenkova, A.; Vorobeva, V.; Rasputin, D.; Pozdnyakov, R. Assessment of the impact of technological development and scenario forecasting of the sustainable development of the fuel and energy complex. Energies 2023, 16, 3185. [Google Scholar] [CrossRef]
- Gendler, S.; Prokhorova, E. Risk-Based Methodology for Determining Priority Directions for Improving Occupational Safety in the Mining Industry of the Arctic Zone. Resources 2021, 10, 20. [Google Scholar] [CrossRef]
- Zhukovskiy, Y.; Tsvetkov, P.; Buldysko, A.; Malkova, Y.; Stoianova, A.; Koshenkova, A. Scenario modeling of sustainable development of energy supply in the Arctic. Resources 2021, 10, 124. [Google Scholar] [CrossRef]
- Nazarychev, A.N.; Dyachenok, G.V.; Sychev, Y.A. A reliability study of the traction drive system in haul trucks based on failure analysis of their functional parts. J. Min. Inst. 2023, 261, 363–373. [Google Scholar]
- Shklyarskiy, Y.E.; Skamyin, A.N.; Carrizosa, M.J. Energy efficiency in the mineral resources and raw materials complex. J. Min. Inst. 2023, 261, 323–324. [Google Scholar]
- Nevskaya, M.; Shabalova, A.; Kosovtseva, T.; Nikolaychuk, L. Applications of simulation modeling in mining project risk management: Criteria, algorithm, evaluation. J. Infrastruct. Policy Dev. 2024, 8, 5375. [Google Scholar] [CrossRef]
- Sychev, Y.; Nazarychev, A.N.; Dyachenok, G.V. Improving the Labor Safety of Mining Dump Truck Drivers by Reducing the Risk of Failure of the Functional Units of the Traction Electric Drive under Operating Conditions. Bezop. Tr. Promyshlennosti Occup. Saf. Ind. 2023, 9, 52–58. (In Russian) [Google Scholar] [CrossRef]
- Abramovich, B.N.; Bogdanov, I.A. Improving the efficiency of autonomous electrical complexes of oil and gas enterprises. J. Min. Inst. 2021, 249, 408–416. [Google Scholar] [CrossRef]
- Korolev, N.A.; Zhukovskiy, Y.L.; Buldysko, A.D.; Baranov, G.D.; Chen, P. Energy resource evaluation from technical diagnostics of electromechanical devices in minerals sector. Min. Inf. Anal. Bull. 2024, 5, 158–181. (In Russian) [Google Scholar] [CrossRef]
- Lebedev, A.; Cherepovitsyn, A. Waste Management during the Production Drilling Stage in the Oil and Gas Sector: A Feasibility Study. Resources 2024, 13, 26. [Google Scholar] [CrossRef]
- Nepsha, F.S.; Varnavskiy, K.A.; Voronin, V.A.; Zaslavskiy, I.S.; Liven, A.S. Integration of renewable energy at coal mining enterprises: Problems and prospects. Min. Inst. 2023, 261, 455–469. [Google Scholar]
- Shpenst, V.A.; Belsky, A.A.; Orel, E.A. Improving the efficiency of autonomous electrical complex with renewable energy sources by means of adaptive regulation of its operating modes. J. Min. Inst. 2023, 261, 479–492. [Google Scholar]
- Shklyarskiy, Y.; Andreeva, I.; Sutikno, T.; Jopri, M.H. Energy management in hybrid complexes based on wind generation and hydrogen storage. Bull. Electr. Eng. Inform. 2024, 13, 1483–1494. [Google Scholar] [CrossRef]
- Shpenst, V.A.; Orel, E.A. Improving the Reliability of DC-DC Power Supply by Reserving Feedback Signals. Energ. Proc. CIS High. Educ. Inst. Power Eng. Assoc. 2021, 64, 408–420. [Google Scholar] [CrossRef]
- Skamyin, A.; Shklyarskiy, Y.; Gurevich, I. Influence of Background Voltage Distortion on Operation of Passive Harmonic Compensation Devices. Energies 2024, 17, 1342. [Google Scholar] [CrossRef]
- Belsky, A.; Glukhanich, D.; Sutikno, T.; Jopri, M.H. Estimation of hourly solar irradiation on tilted surfaces. Bull. Electr. Eng. Inform. 2023, 12, 3202–3214. [Google Scholar] [CrossRef]
- Belsky, A.A.; Glukhanich, D.Y. Standalone power system with photovoltaic and thermoelectric installations for power supply of remote monitoring and control stations for oil pipelines. Renew. Energy Focus 2023, 47, 100493. [Google Scholar] [CrossRef]
- Zhan, L.; Bo, Y.; Lin, T.; Fan, Z. Development and outlook of advanced nuclear energy technology. Energy Strategy Rev. 2021, 34, 100630. [Google Scholar] [CrossRef]
- Rogalev, N.; Rogalev, A.; Kindra, V.; Zlyvko, O.; Osipov, S. An Overview of Small Nuclear Power Plants for Clean Energy Production: Comparative Analysis of Distributed Generation Technologies and Future Perspectives. Energies 2023, 16, 4899. [Google Scholar] [CrossRef]
- Krūmiņš, J.; Kļaviņš, M. Investigating the potential of nuclear energy in achieving a carbon-free energy future. Energies 2023, 16, 3612. [Google Scholar] [CrossRef]
- Bhowmik, P.K.; Sabharwall, P.; Johnson, J.T.; Retamales, M.E.T.; Wang, C.; O’Brien, J.E.; Lietwiler, C.; Wu, Q. Scaling methodologies and similarity analysis for thermal hydraulics test facility development for water-cooled small modular reactor. Nucl. Eng. Des. 2024, 424, 113235. [Google Scholar] [CrossRef]
- Rahmanta, M.A.; Harto, A.W.; Agung, A.; Ridwan, M.K. Nuclear Power Plant to Support Indonesia’s Net Zero Emissions: A Case Study of Small Modular Reactor Technology Selection Using Technology Readiness Level and Levelized Cost of Electricity Comparing Method. Energies 2023, 16, 3752. [Google Scholar] [CrossRef]
- Petrunin, V.V.; Fadeev, Y.P.; Pakhomov, A.N.; Veshnyakov, K.B.; Polunichev, V.I.; Shamanin, I.E. Conceptual Design of Small NPP with RITM-200 Reactor. Energy 2019, 125, 365–369. [Google Scholar] [CrossRef]
- Peakman, A.; Merk, B.; Hesketh, K. The potential of pressurised water reactors to provide flexible response in future electricity grids. Energies 2020, 13, 941. [Google Scholar] [CrossRef]
- Gitelman, L.; Kozhevnikov, M.; Visotskaya, Y. Diversification as a method of ensuring the sustainability of energy supply within the energy transition. Resources 2023, 12, 19. [Google Scholar] [CrossRef]
- Aminov, R.Z.; Garievskii, M.V.; Anoshin, D.M. Development of Design Solutions for a Latent Heat Thermal Energy Storage under Conditions of Its Operation in a Single Energy Complex with an NPP. Therm. Eng. 2024, 71, 203–214. [Google Scholar] [CrossRef]
- Ali, M.; Alkaabi, A.K.; Lee, J.I. CFD simulation of an integrated PCM-based thermal energy storage within a nuclear power plant connected to a grid with constant or variable power demand. Nucl. Eng. Des. 2022, 394, 111819. [Google Scholar] [CrossRef]
- Alameri, S.A.; King, J.C.; Alkaabi, A.K.; Addad, Y. Prismatic-core advanced high temperature reactor and thermal energy storage coupled system–A preliminary design. Nucl. Eng. Technol. 2020, 52, 248–257. [Google Scholar] [CrossRef]
- Ali, M.; Alkaabi, A.K.; Alameri, S.A.; Addad, Y. Overall efficiency analysis of an innovative load-following nuclear power plant-thermal energy storage coupled cycle. Int. J. Exergy 2021, 36, 98–122. [Google Scholar] [CrossRef]
- Ali, M.; Alkaabi, A.K.; Addad, Y. Numerical investigation of a vertical triplex-tube latent heat storage/exchanger to achieve flexible operation of nuclear power plants. Int. J. Energy Res. 2022, 46, 2970–2987. [Google Scholar] [CrossRef]
- Aminov, R.Z.; Anoshin, D.M.; Garievsky, M.V. Numerical modeling of discharge modes and evaluation of the major characteristics of latent heat thermal energy storage at a nuclear power plant. J. Energy Storage 2024, 99, 113209. [Google Scholar] [CrossRef]
- Aminov, R.Z. Application of multifunctional systems with latent heat thermal energy storages: A way to improve NPP safety and efficiency. Therm. Eng. 2022, 69, 555–562. [Google Scholar] [CrossRef]
- Bocharov, G.S.; Dedov, A.V.; Eletskii, A.V.; Vagin, A.O.; Zacharenkov, A.V.; Zverev, M.A. Thermal Balance of a Water Thermal Accumulator Based on Phase Change Materials. J. Compos. Sci. 2023, 7, 399. [Google Scholar] [CrossRef]
- Xu, X.; Chang, C.; Guo, X.; Zhao, M. Experimental and Numerical Study of the Ice Storage Process and Material Properties of Ice Storage Coils. Energies 2023, 16, 5511. [Google Scholar] [CrossRef]
- Nascimento Porto, T.; Delgado, J.M.P.Q.; Guimarães, A.S.; Fernandes Magalhães, H.L.; Moreira, G.; Brito Correia, B.; Freire de Andrade, T.; Barbosa de Lima, A.G. Phase change material melting process in a thermal energy storage system for applications in buildings. Energies 2020, 13, 3254. [Google Scholar] [CrossRef]
- Porto, T.R.; Lima, J.A.; Andrade, T.H.; Delgado, J.M.; Lima, A.G. 3D Numerical Analysis of a Phase Change Material Solidification Process Applied to a Latent Thermal Energy Storage System. Energies 2023, 16, 3013. [Google Scholar] [CrossRef]
- Huang, Y.; Stonehouse, A.; Abeykoon, C. Encapsulation methods for phase change materials—A critical review. Int. J. Heat Mass Transf. 2023, 200, 123458. [Google Scholar] [CrossRef]
- Wang, G.; Tang, Z.; Gao, Y.; Liu, P.; Li, Y.; Li, A.; Chen, X. Phase change thermal storage materials for interdisciplinary applications. Chem. Rev. 2023, 123, 6953–7024. [Google Scholar] [CrossRef] [PubMed]
- Masood, U.; Haggag, M.; Hassan, A.; Laghari, M. A Review of Phase Change Materials as a Heat Storage Medium for Cooling Applications in the Built Environment. Buildings 2023, 13, 1595. [Google Scholar] [CrossRef]
- Shmyhol, D.; Rimár, M.; Fedak, M.; Krenický, T.; Lopušniak, M.; Polivka, N. Techniques for Enhancing Thermal Conductivity and Heat Transfer in Phase Change Materials in Hybrid Phase Change Material–Water Storage Tanks. Appl. Sci. 2024, 14, 3732. [Google Scholar] [CrossRef]
- Powała, K.; Obraniak, A.; Heim, D.; Mrowiec, A. Macroencapsulation of paraffin in a polymer–gypsum composite using granulation technique. Materials 2022, 15, 3783. [Google Scholar] [CrossRef] [PubMed]
- Wei, H.; Lu, Y.; Yang, Y.; Wu, Y.; Zheng, K.; Li, L. Research on Thermal Adaptability of Flexible Operation in Different Types of Coal-Fired Power Units. Energies 2024, 17, 2185. [Google Scholar] [CrossRef]
- Wu, S.; Yan, T.; Kuai, Z.; Pan, W. Thermal conductivity enhancement on phase change materials for thermal energy storage: A review. Energy Storage Mater. 2020, 25, 251–295. [Google Scholar] [CrossRef]
- Yu, K.; Jia, M.; Yang, Y.; Liu, Y. A clean strategy of concrete curing in cold climate: Solar thermal energy storage based on phase change material. Appl. Energy 2023, 331, 120375. [Google Scholar] [CrossRef]
- Khan, M.I.; Asfand, F.; Al-Ghamdi, S.G. Progress in research and development of phase change materials for thermal energy storage in concentrated solar power. Appl. Therm. Eng. 2023, 219, 119546. [Google Scholar] [CrossRef]
- Goel, V.; Saxena, A.; Kumar, M.; Thakur, A.; Sharma, A.; Bianco, V. Potential of phase change materials and their effective use in solar thermal applications: A critical review. Appl. Therm. Eng. 2023, 219, 119417. [Google Scholar] [CrossRef]
- Rashid, F.L.; Al-Obaidi, M.A.; Dulaimi, A.; Bahlol, H.Y.; Hasan, A. Recent advances, development, and impact of using phase change materials as thermal energy storage in different solar energy systems: A review. Designs 2023, 7, 66. [Google Scholar] [CrossRef]
- Musiał, M.; Lichołai, L.; Pękala, A. Analysis of the Thermal Performance of Isothermal Composite Heat Accumulators Containing Organic Phase-Change Material. Energies 2023, 16, 1409. [Google Scholar] [CrossRef]
- Bykowa, E.; Skachkova, M.; Raguzin, I.; Dyachkova, I.; Boltov, M. Automation of Negative Infrastructural Externalities As-sessment Methods to Determine the Cost of Land Resources Based on the Development of a “Thin Client” Model. Sustainability 2022, 14, 9383. [Google Scholar] [CrossRef]
- Zhou, Y.; Liu, Z. A cross-scale ‘material-component-system’ framework for transition towards zero-carbon buildings and districts with low, medium and high-temperature phase change materials. Sustain. Cities Soc. 2023, 89, 104378. [Google Scholar] [CrossRef]
- Zhang, S.; Yan, Y. Energy, exergy and economic analysis of ceramic foam-enhanced molten salt as phase change material for medium-and high-temperature thermal energy storage. Energy 2023, 262, 125462. [Google Scholar] [CrossRef]
- Radomska, E.; Mika, L.; Sztekler, K.; Lis, L. The impact of heat exchangers’ constructions on the melting and solidification time of phase change materials. Energies 2020, 13, 4840. [Google Scholar] [CrossRef]
- Ma, F.; Zhu, T.; Zhang, Y.; Lu, X.; Zhang, W.; Ma, F. A review on heat transfer enhancement of phase change materials using fin tubes. Energies 2023, 16, 545. [Google Scholar] [CrossRef]
- Hosseinpour, A.; Pourfallah, M.; Gholinia, M. Analysis of phase change material (PCM) melting utilizing environmentally friendly nanofluids in a double tube with spiral fins: A numerical study. Int. J. Thermofluids 2024, 22, 100620. [Google Scholar] [CrossRef]
- Taghavi, M.; Poikelispää, M.; Agrawal, V.; Syrjälä, S.; Joronen, T. Numerical investigation of a plate heat exchanger thermal energy storage system with phase change material. J. Energy Storage 2023, 61, 106785. [Google Scholar] [CrossRef]
- Cao, Z.; Zhang, G.; Wu, Y.; Yang, J.; Sui, Y.; Zhao, X. Energy storage potential analysis of phase change material (PCM) energy storage units based on tunnel lining ground heat exchangers. Appl. Therm. Eng. 2023, 235, 121403. [Google Scholar] [CrossRef]
- Moghadam, F.N.; Izadpanah, E.; Shekari, Y.; Amini, Y. Experimental evaluation of shell geometry impact on thermal and exergy performance in helical coiled tube heat exchanger with phase change material. J. Energy Storage 2024, 83, 110790. [Google Scholar] [CrossRef]
- Wang, Y.; Alvarado, J.L.; Terrell, W., Jr. Thermal performance of microencapsulated phase change material slurry in helical coils with reversed loops and wire coil inserts. Exp. Heat Transf. 2023, 36, 984–1011. [Google Scholar] [CrossRef]
- Sheikh, M.I.A.R.; Ahammed, M.E.; Gumtapure, V. Thermal behavior of composite phase change material of polyethylene in a shell and coil-based thermal energy storage: Numerical analysis. J. Energy Storage 2023, 74, 109438. [Google Scholar] [CrossRef]
- Shank, K.; Bernat, J.; Justice, Q.; Niksiar, P.; Tiari, S. Experimental study of a latent heat thermal energy storage system assisted by variable-length radial fins. J. Energy Storage 2023, 68, 107692. [Google Scholar] [CrossRef]
- Hosseini, A.; Banakar, A.; Gorjian, S.; Jafari, A. Experimental and numerical investigation of the melting behavior of a phase change material in a horizontal latent heat accumulator with longitudinal and annular fins. J. Energy Storage 2024, 82, 110563. [Google Scholar] [CrossRef]
- Zhang, W.; Pan, L.; Ding, D.; Zhang, R.; Bai, J.; Du, Q. Progress in the Study of Enhanced Heat Exchange in Phase Change Heat Storage Devices. ACS Omega 2023, 8, 22331–22344. [Google Scholar] [CrossRef]
- Dagdevir, T.; Ding, Y. Numerical investigation of battery thermal management by using helical fin and composite phase change material. J. Energy Storage 2024, 75, 109674. [Google Scholar] [CrossRef]
- Zhang, N.; Cao, X.; Fan, X.; Chen, L.; Qu, Y. Thermal storage performance of latent heat thermal energy storage device with helical fin under realistic working conditions. Appl. Therm. Eng. 2024, 236, 121668. [Google Scholar] [CrossRef]
- Palmer, B.; Arshad, A.; Yang, Y.; Wen, C. Energy storage performance improvement of phase change materials-based triplex-tube heat exchanger (TTHX) using liquid–solid interface-informed fin configurations. Appl. Energy 2023, 333, 120576. [Google Scholar] [CrossRef]
- Li, C.; Li, Q.; Ge, R. Comparative investigation of charging performance in shell and tube device containing molten salt based phase change materials for thermal energy storage. Case Stud. Therm. Eng. 2023, 43, 102804. [Google Scholar] [CrossRef]
- Qasem, N.A.; Belazreg, A.; Khetib, Y.; Abderrahmane, A.; Homod, R.Z.; Younis, O.; Rawa, M. Effect of novel fin distribution on the melting process of thermal storage units. Appl. Therm. Eng. 2024, 243, 122547. [Google Scholar] [CrossRef]
- Guo, X.; Han, X.; Lin, J.; Liu, S.; Han, Z. Effect of eccentricity and V-shaped fins on the heat transfer performance of a phase change heat storage system. J. Energy Storage 2023, 73, 108833. [Google Scholar] [CrossRef]
- İzgi, B.; Demirağ, H.Z. Multi-objective optimization of fin shape in a cylindrical encapsulated phase change material for thermal energy storage applications. Appl. Therm. Eng. 2023, 231, 120921. [Google Scholar] [CrossRef]
- Cai, L.; Mi, S.; Luo, C. Study on enhanced heat transfer of a phase change material slurry in transverse corrugated tubes. Appl. Therm. Eng. 2023, 226, 120293. [Google Scholar] [CrossRef]
- Belhadad, T.; Kanna, A.; Samaouali, A.; Kadiri, I. CFD Investigation of Fin Design Influence on Phase Change Material Melting for Solar Thermal Energy Storage. e-Prime-Adv. Electr. Eng. Electron. Energy 2023, 6, 100306. [Google Scholar] [CrossRef]
- Liu, Y.; Chen, Y.X.; Zhang, M.; Zhao, X.; Li, T. Enhanced thermal performance of shell and tube phase change heat accumulator with novel biomimetic spider web fins. Appl. Therm. Eng. 2023, 233, 121224. [Google Scholar] [CrossRef]
- Rogowski, M.; Andrzejczyk, R. Recent advances of selected passive heat transfer intensification methods for phase change material-based latent heat energy storage units: A review. Int. Commun. Heat Mass Transf. 2023, 144, 106795. [Google Scholar] [CrossRef]
- Urschitz, G.; Walter, H.; Brier, J. Experimental investigation on bimetallic tube compositions for the use in latent heat thermal energy storage units. Energy Convers. Manag. 2016, 125, 368–378. [Google Scholar] [CrossRef]
- Negi, A.; Ranakoti, L.; Bhandari, P.; Khargotra, R.; Singh, T. Thermo-physical characteristics and storage material compatibility in nano-enhanced phase change materials for solar distillation applications: A critical assessment. Sol. Energy Mater. Sol. Cells 2024, 271, 112870. [Google Scholar] [CrossRef]
- Riahi, S.; Evans, M.; Belusko, M.; Liu, M.; Bruno, F. Orientation impact on structural integrity of a shell and tube latent heat thermal energy storage system. J. Energy Storage 2022, 52, 104829. [Google Scholar] [CrossRef]
- Dal Magro, F.; Benasciutti, D.; Nardin, G. Thermal stress analysis of PCM containers for temperature smoothing of waste gas. Appl. Therm. Eng. 2016, 106, 1010–1022. [Google Scholar] [CrossRef]
- Beck, A.; Koller, M.; Walter, H.; Hameter, M. Transient numerical analysis of different finned tube designs for use in latent heat thermal energy storage devices. Energy Sustain. 2015, 56857, V002T13A004. [Google Scholar] [CrossRef]
- Wołoszyn, J.; Szopa, K. A combined heat transfer enhancement technique for shell-and-tube latent heat thermal energy storage. Renew. Energy 2023, 202, 1342–1356. [Google Scholar] [CrossRef]
- Al-Salami, H.A.; Dhaidan, N.S.; Abbas, H.H.; Al-Mousawi, F.N.; Homod, R.Z. Review of PCM charging in latent heat thermal energy storage systems with fins. Therm. Sci. Eng. Prog. 2024, 51, 102640. [Google Scholar] [CrossRef]
- Kirincic, M.; Trp, A.; Lenic, K.; Batista, J. Latent thermal energy storage performance enhancement through optimization of geometry parameters. Appl. Energy 2024, 365, 123255. [Google Scholar] [CrossRef]
- Karimi, A.R.; Siavashi, M.; Keshtkaran, A.H.; Tousi, R. Impact of using different numbers of fins on heat transfer augmentation in a phase-change material helical coil latent energy storage system. Int. Commun. Heat Mass Transf. 2024, 156, 107608. [Google Scholar] [CrossRef]
- Khedher, N.B.; Hosseinzadeh, K.; Abed, A.M.; Khosravi, K.; Mahdi, J.M.; Sultan, H.S.; Talebizadehsardari, P. Accelerated charging of PCM in coil heat exchangers via central return tube and inlet positioning: A 3D analysis. Int. Commun. Heat Mass Transf. 2024, 152, 107275. [Google Scholar] [CrossRef]
- Miao, X.; Riaz, F.; Alotaibi, B.; Agrawal, M.K.; Abuhussain, M.; Alsenani, T.R.; Lin, Q. Performance enhancement of latent heat thermal energy storage system by using spiral fins in phase change material solidification process. Process Saf. Environ. Prot. 2023, 176, 568–579. [Google Scholar] [CrossRef]
- Li, C.; Li, Q.; Ge, R. Comparison of performance enhancement in a shell and tube based latent heat thermal energy storage device containing different structured fins. Renew. Energy 2023, 206, 994–1006. [Google Scholar] [CrossRef]
- Palaev, A.G.; Krasnikov, A.A. Ultrasonic treatment of a welded joint from the external, internal and two sides on reducing residual welding stresses. Int. J. Eng. 2024, 37, 2171–2180. [Google Scholar] [CrossRef]
- Choure, B.K.; Alam, T.; Kumar, R. A review on heat transfer enhancement techniques for PCM based thermal energy storage system. J. Energy Storage 2023, 72, 108161. [Google Scholar] [CrossRef]
- Chen, Y.; Liu, Y.; Zeng, L.; Cui, W.; Xie, J. A novel topology optimization of fin structure in shell-tube phase change accumulator considering the double objective functions and natural convection. J. Energy Storage 2024, 80, 110327. [Google Scholar] [CrossRef]
- Diaconu, B.M.; Cruceru, M.; Anghelescu, L. Phase Change Materials—Applications and Systems Designs: A Literature Review. Designs 2022, 6, 117. [Google Scholar] [CrossRef]
- Li, Z.; Wang, X.; Li, Y.; Guo, J.; Huang, X.; Yang, X.; He, Y.L. Design and evaluation of metal foam horizontal tube-and-shell phase change accumulator: Optimal position distribution of heating tubes. Int. J. Heat Fluid Flow 2024, 107, 109367. [Google Scholar] [CrossRef]
- Laing, D.; Bauer, T.; Breidenbach, N.; Hachmann, B.; Johnson, M. Development of high temperature phase-change-material storages. Appl. Energy 2013, 109, 497–504. [Google Scholar] [CrossRef]
- Łach, Ł.; Svyetlichnyy, D. 3D Model of Heat Flow during Diffusional Phase Transformations. Materials 2023, 16, 4865. [Google Scholar] [CrossRef]
- Huang, R.; Mahvi, A.; Odukomaiya, W.; Goyal, A.; Woods, J. Reduced-order modeling method for phase-change thermal energy storage heat exchangers. Energy Convers. Manag. 2022, 263, 115692. [Google Scholar] [CrossRef]
- Zhang, Q.; Sazon TA, S.; Fadnes, F.S.; Peng, X.; Ahmed, N.; Nikpey, H.; Assadi, M. Design optimization of the cooling systems with PCM-to-air heat exchanger for the energy saving of the residential buildings. Energy Convers. Manag. X 2024, 23, 100630. [Google Scholar] [CrossRef]
- Lebedev, V.; Deev, A. Heat Storage as a Way to Increase Energy Efficiency and Flexibility of NPP in Isolated Power System. Appl. Sci. 2023, 13, 13130. [Google Scholar] [CrossRef]
- Bose, J.R.; Manova, S.; Angeline, A.A.; Asirvatham, L.G.; Gautam, S. Numerical study on the heat transfer characteristics of Cu-water and TiO2-Water nanofluid in a circular horizontal tube. Energies 2023, 16, 1449. [Google Scholar] [CrossRef]
- Arsenyeva, O.; Tovazhnyanskyy, L.; Kapustenko, P.; Klemeš, J.J.; Varbanov, P.S. Review of developments in plate heat exchanger heat transfer enhancement for single-phase applications in process industries. Energies 2023, 16, 4976. [Google Scholar] [CrossRef]
- Rosa, N.; Soares, N.; Costa, J.; Lopes, A.G. Validation of a Simplified Numerical Model for Predicting Solid–Liquid Phase Change with Natural Convection in Ansys CFX. Inventions 2023, 8, 93. [Google Scholar] [CrossRef]
- Erdoğan, A.; Çakmak, G. Investigation of numerical and experimental assessment of melting behavior of phase change material in U tube heat exchanger. Case Stud. Therm. Eng. 2023, 49, 103206. [Google Scholar] [CrossRef]
- Zaib, A.; Mazhar, A.R.; Aziz, S.; Talha, T.; Jung, D.W. Heat Transfer Augmentation Using Duplex and Triplex Tube Phase Change Material (PCM) Heat Exchanger Configurations. Energies 2023, 16, 4037. [Google Scholar] [CrossRef]
- Şimşek, F.; Demirci, H. Investigation of the use of new fin on the melting time of the phase change material stored in the heat exchanger by computational fluid dynamics analysis. J. Build. Eng. 2024, 91, 109505. [Google Scholar] [CrossRef]
- Abd El-Hamid, M.; Wei, G. Effect of varying the thermophysical properties of phase change material on the performance of photovoltaic/thermal-PCM hybrid module numerically. J. Energy Storage 2024, 86, 111326. [Google Scholar] [CrossRef]
- Shaban, M.; Khan, T.I.; Anwar, M.; Alzaid, M.; Alanazi, R. Effect of Asymmetric Fins on Thermal Performance of Phase Change Material-Based Thermal Energy Storage Unit. Materials 2023, 16, 2567. [Google Scholar] [CrossRef]
- Kos, Z.; Babii, I.; Grynyova, I.; Nikiforov, O. Ensuring the Energy Efficiency of Buildings through the Simulation of Structural, Organizational, and Technological Solutions for Facade Insulation. Appl. Sci. 2024, 14, 801. [Google Scholar] [CrossRef]
- Tian, Z.; Liao, Z.; Xu, C.; Jiang, K.; Du, X. Experimental and numerical investigation of the melting process of solar salt in a spherical capsule. J. Energy Storage 2023, 74, 109388. [Google Scholar] [CrossRef]
- Vogel, J.; Keller, M.; Johnson, M. Numerical modeling of large-scale finned tube latent thermal energy storage systems. J. Energy Storage 2020, 29, 101389. [Google Scholar] [CrossRef]
- Scharinger-Urschitz, G.; Walter, H.; Haider, M. Heat transfer in latent high-temperature thermal energy storage systems—Experimental investigation. Energies 2019, 12, 1264. [Google Scholar] [CrossRef]
Disclaimer/Publisher’s Note: The statements, opinions and data contained in all publications are solely those of the individual author(s) and contributor(s) and not of MDPI and/or the editor(s). MDPI and/or the editor(s) disclaim responsibility for any injury to people or property resulting from any ideas, methods, instructions or products referred to in the content. |
© 2024 by the authors. Licensee MDPI, Basel, Switzerland. This article is an open access article distributed under the terms and conditions of the Creative Commons Attribution (CC BY) license (https://creativecommons.org/licenses/by/4.0/).

