Article

Simulation of Dynamic Characteristics of Supercritical Boiler Based on Coupling Model of Combustion and Hydrodynamics

1
Inner Mongolia Power Research Institute Branch, Inner Mongolia Power (Group) Co., Ltd., Hohhot 010020, China
2
School of Energy and Power Engineering, Xi’an Jiaotong University, Xi’an 710049, China
*
Author to whom correspondence should be addressed.
Energies 2024, 17(21), 5349; https://doi.org/10.3390/en17215349
Submission received: 24 September 2024 / Revised: 17 October 2024 / Accepted: 25 October 2024 / Published: 28 October 2024
(This article belongs to the Section J: Thermal Management)

Abstract

:
To accommodate the integration of renewable energy, coal-fired power plants must take on the task of peak regulation, making the low-load operation of boilers increasingly routine. Under low-load conditions, the phase transition point (PTP) of the working fluid fluctuates, leading to potential flow instability, which can compromise boiler safety. In this paper, a one-dimensional coupled dynamic model of the combustion and hydrodynamics of a supercritical boiler is developed on the Modelica/Dymola 2022 platform. The spatial distribution of key thermal parameters in the furnace and the PTP position in the water-cooled wall (WCW) are analyzed in a 660 MW supercritical boiler when parameters on the combustion side change under full-load and low-load conditions. The dynamic response characteristics of the temperature, mass flow rate, and the PTP position are investigated. The results show that the over-fire air (OFA) ratio significantly influences the flue gas temperature distribution. A lower OFA ratio increases the flue gas temperature in the burner zone but reduces it at the furnace exit. The lower OFA ratio leads to a higher fluid temperature and shortens the length of the evaporation section. The temperature difference in the WCW outlet fluid between the 20% and 60% OFA ratios is 11.7 °C under BMCR conditions and 7.4 °C under 50% THA conditions. Under the BMCR and 50% THA conditions, a 5% increase in the coal caloric value raises the flue gas outlet temperature by 32.7 °C and 35.4 °C and the fluid outlet temperature by 6.5 °C and 9.9 °C, respectively. An increase in the coal calorific value reduces the length of the evaporation section. The changes in the length of the evaporation section are −2.95 m, 2.95 m, −2.62 m, and 0.54 m when the coal feeding rate, feedwater flow rate, feedwater temperature, and air supply rate are increased by 5%, respectively.

1. Introduction

In the current era of rapid renewable energy expansion, coal-fired power plants are increasingly tasked with peak load regulation to complement the variable output of renewable sources [1,2,3]. During periods of low-load operation and wide load variations, several critical issues arise, including unstable combustion, fluctuating hydrodynamics, and deteriorating control. These challenges are exacerbated by variation in the coal quality, seriously affecting the safe and stable operation of the unit [4]. Moreover, the presence of a two-phase zone on the working fluid side of supercritical boilers at low loads, coupled with frequent shifts in the phase transition point (PTP) within the water-cooled wall (WCW) during transient processes, can lead to abnormal fluctuations in thermodynamic parameters.
Currently, furnace combustion systems are commonly modeled using either mechanistic or data-driven approaches. The mechanism models can be further categorized into zero-dimensional [5,6,7], one-dimensional [8], and three-dimensional models [9,10,11]. While zero-dimensional models are simple, they fail to accurately represent the temperature and heat load distribution within the furnace. Three-dimensional models, on the other hand, can capture these distributions accurately, but the computational effort is enormous, making dynamic simulation difficult to achieve at present. The one-dimensional model is a more comprehensive approach, which gives access to the distribution of thermal parameters and is computationally fast enough to a enable real-time simulation. However, most mechanism models remain limited to static applications. Due to the complex reaction of furnaces, data-driven models have gained popularity in recent years [12,13]. The accuracy of models based on this approach relies heavily on massive measured or experimental data and they lack generalizability.
Dynamic modeling and simulations of WCWs are widely studied, but the models are mostly lumped-parameter models [14], which cannot focus on the spatial distribution of thermal parameters. Due to the drastic changes in the physical properties and thermal parameters of the fluid in the WCW, the models based on this approach struggle to adequately capture the parameter variations. The one-dimensional distributed-parameter model [15] offers a greater accuracy while maintaining moderate computational complexity, making it the preferred choice among scholars. Kim et al. [16] developed a one-dimensional dynamic model of the WCW of a supercritical boiler, and a step disturbance of the feedwater flow was applied to investigate the response characteristics of the fluid temperature. Wang et al. [17] analyzed the dynamic response characteristics of the outlet temperature of the WCW of a supercritical boiler during flame fluctuations. However, previous studies on the dynamic characteristics of the WCW have usually been too simplified to consider the influence of the combustion system, when the heat load boundaries on the working fluid side are described only by constant or empirical formulas [18], which leads to the omission of the interactions between the systems. In addition, under low-load conditions, there is a two-phase section of the working fluid inside the WCW, and the PTP position fluctuates when the operation conditions change, thus affecting boiler operation, but this aspect has received less attention, up until now.
The effects of parameter fluctuations on the combustion side on the operation of a supercritical boiler have been of interest. Li et al. [10] investigated the effects of the air-staging degree on the air/particle flow, combustion, temperature distribution within the WCW, and NOx emissions in a 350 MW supercritical boiler at low loads. Gu et al. [11] studied the influence of the over-fire air (OFA) ratio on combustion and NOx emissions in a 1000 MW supercritical boiler. Yin et al. [4] revealed the impact of coal quality variations on boiler operating characteristics and improved a control strategy to enhance the operational flexibility. Zhu et al. [19] built a dynamic model of a 1000 MW double-reheat unit and investigated the dynamic behavior of the steam temperature during flexible operation when the lower heating value (LHV) of the coal changes. However, the influence of the combustion-side parameters on key thermal parameters within the WCW, especially the PTP position, has rarely been mentioned.
To solve the above problems, this paper establishes a multi-segmented dynamic simulation mechanism model coupling the combustion side and the working fluid side in the furnace area. Additionally, it analyzes the spatial distribution of key thermal parameters in the furnace after the fluctuation in the combustion-side parameters of the boiler under the full-load and low-load conditions. It also investigates the dynamic response characteristics of the key thermal parameters, and pays attention to the fluctuation in the PTP within the WCW.

2. Research Focus

A 660 MW supercritical boiler with a single furnace was investigated in this study. The furnace has a cross-sectional size of 16.98 m × 22.16 m, with the bottom and top elevations at 7.5 m and 74.6 m, respectively. The furnace is arranged with three layers of burners and two stages of OFA. The lower furnace is a spiral WCW, while the upper furnace adopts a vertical WCW, and the partition height is about 52.34 m. The specific structure is illustrated in Figure 1. Table 1 presents the main parameters of the boiler under different working conditions. Table 2 provides a component analysis and LHV of the designed coal.

3. Model Development and Validation

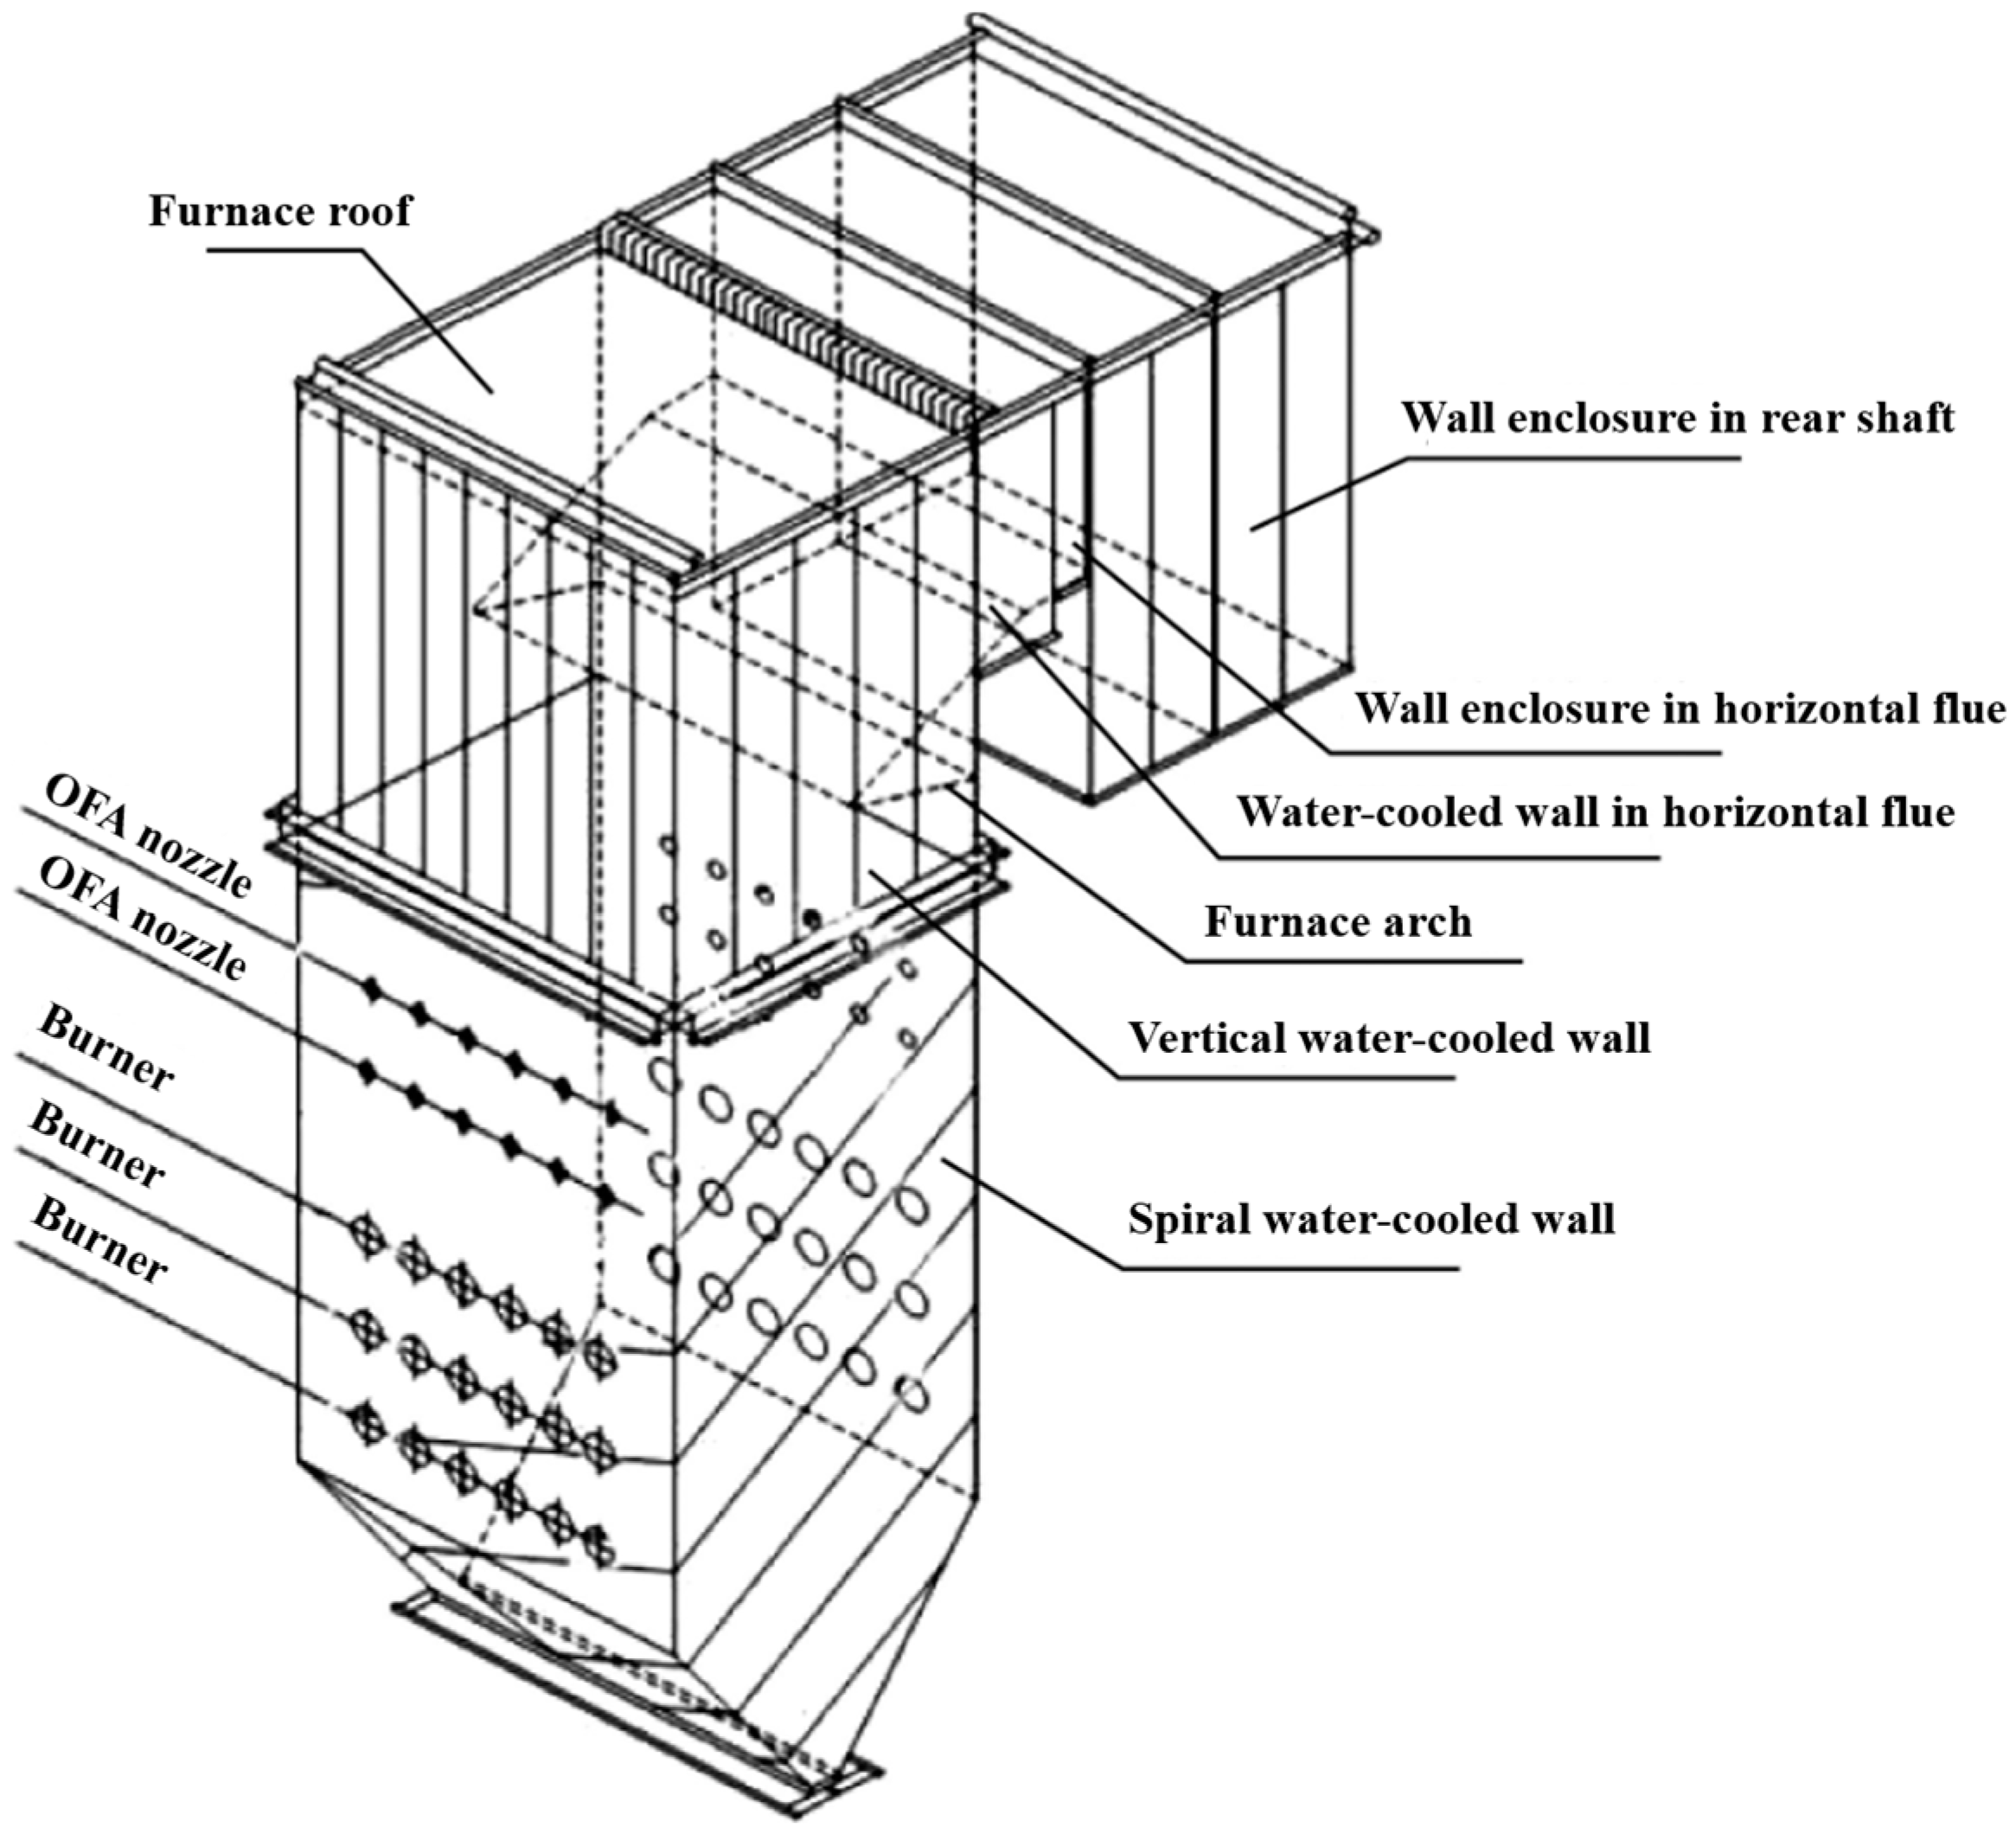
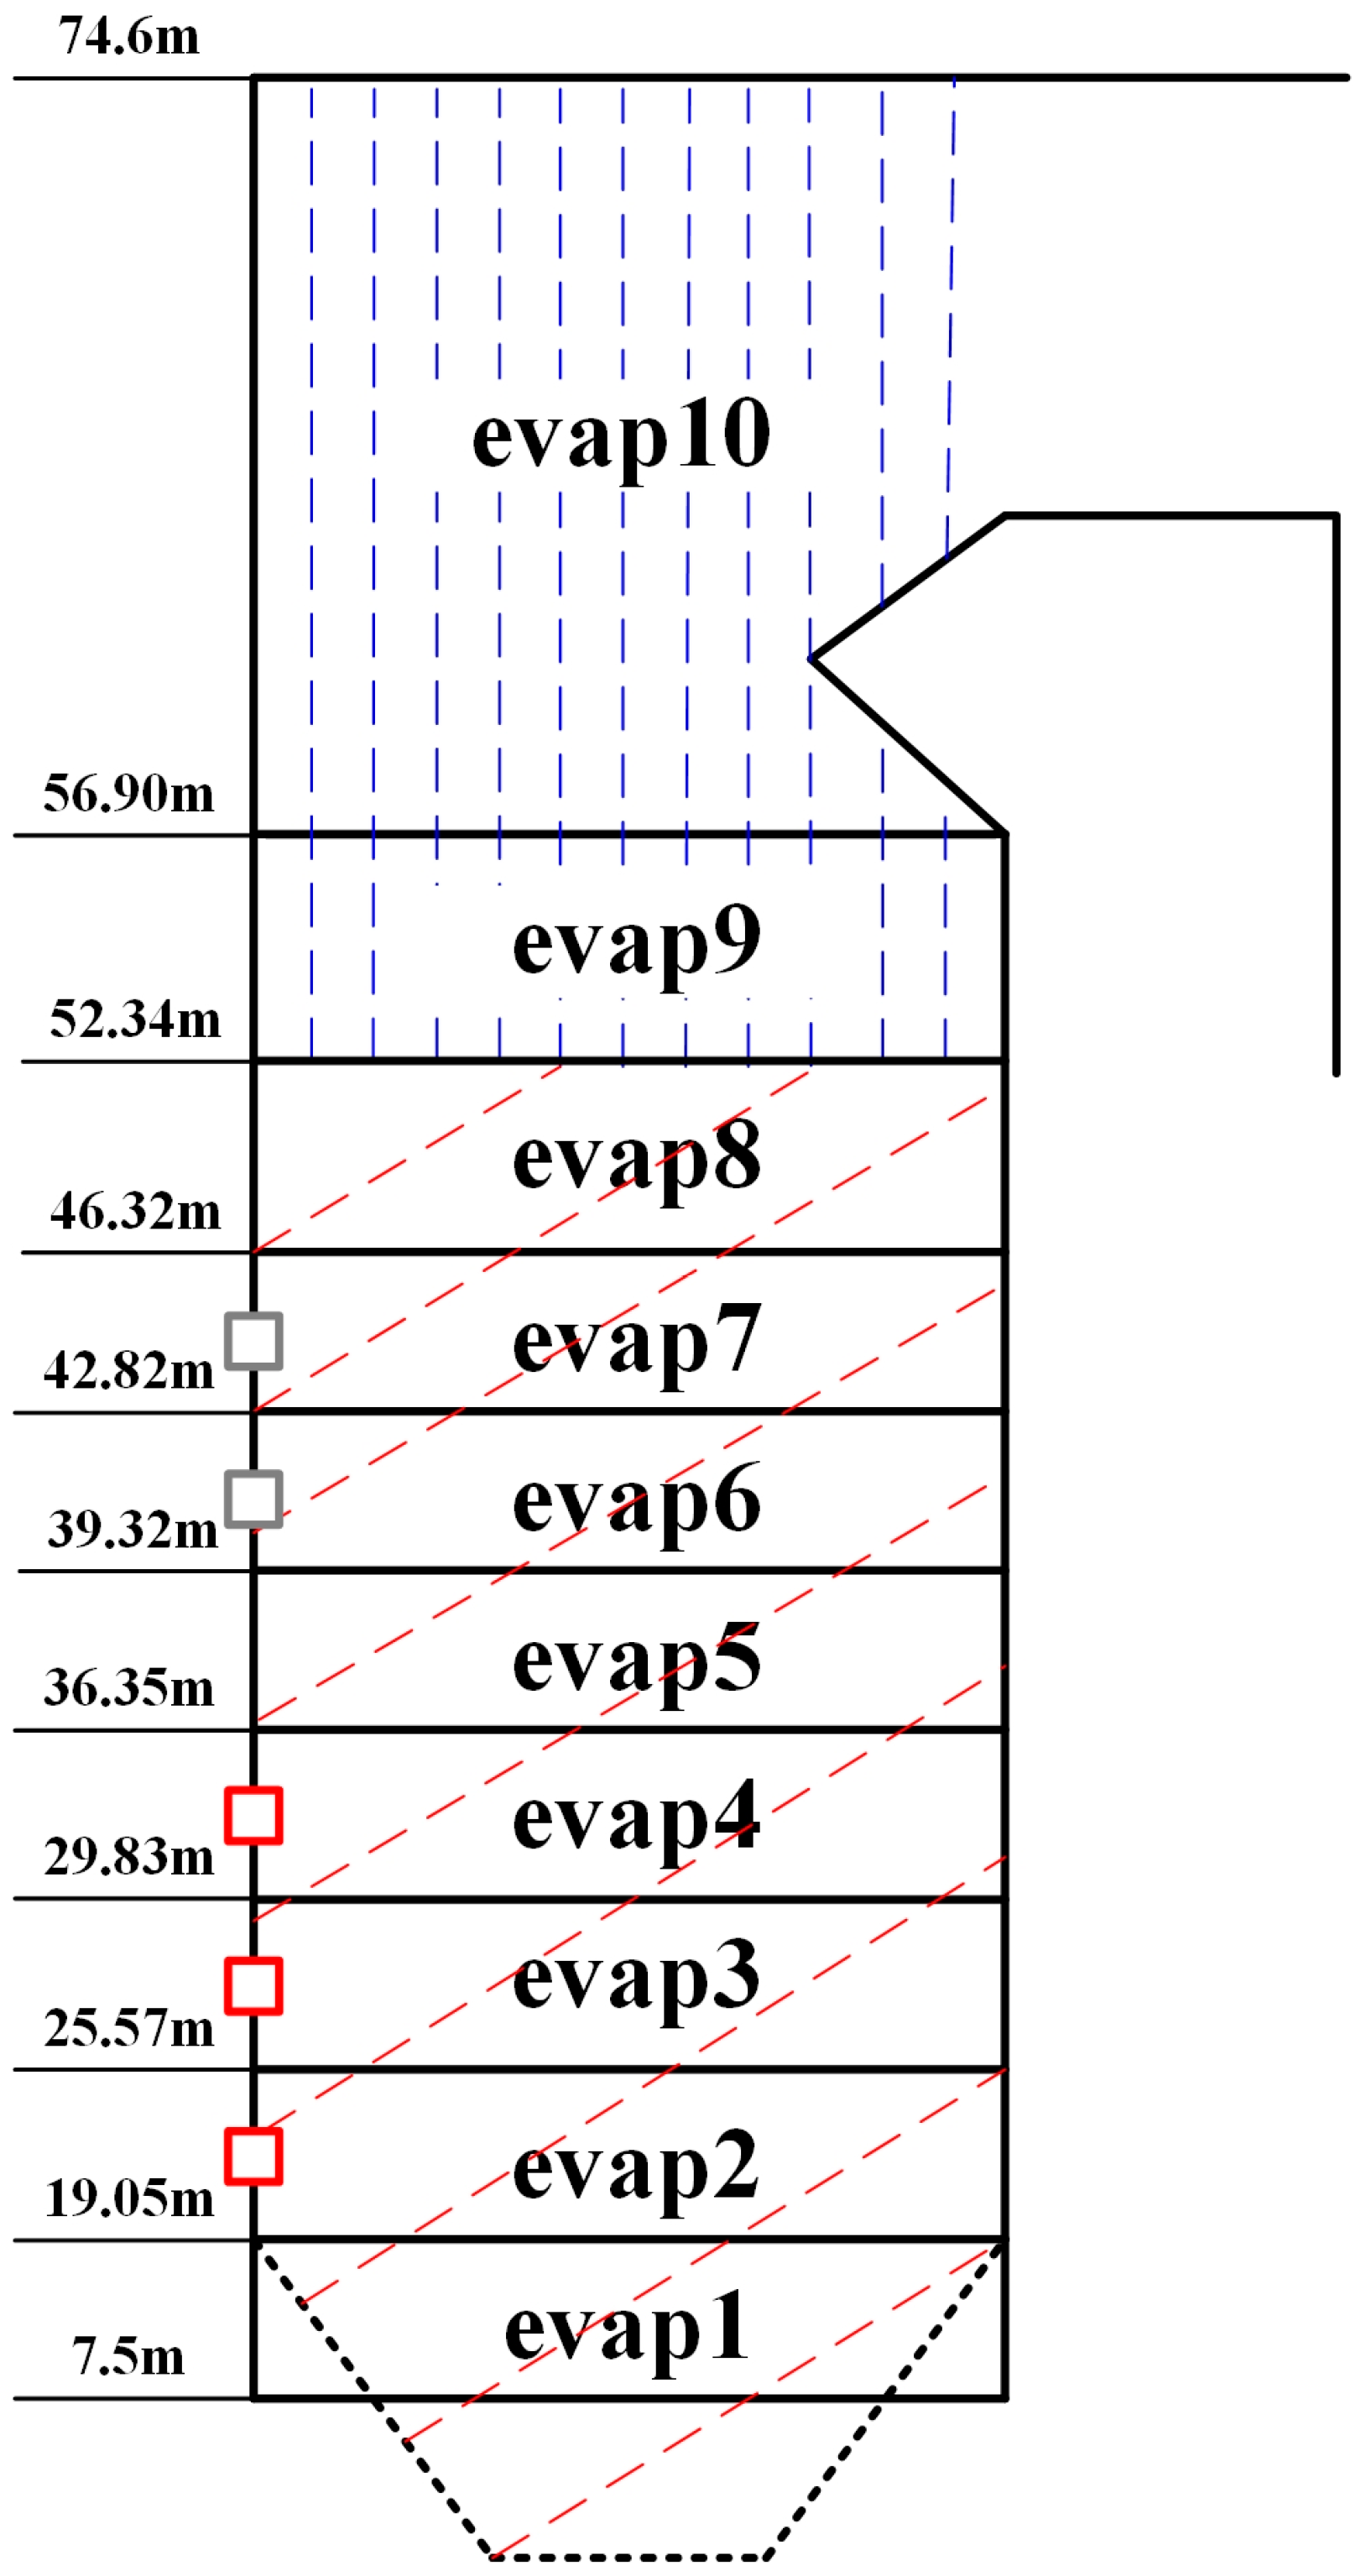
3.1. Model Development

Based on the geometric structure and operational flow of the target boiler, a dynamic simulation model of the furnace and WCW is built on the Modelica/Dymola platform. For the combustion side, considering the simplicity of the zero-dimensional model and the complexity of the three-dimensional model, we divided the furnace into an ash hopper zone, burner zone, and burnout zone along the height direction, and its one-dimensional model is built. Among them, each zone is discretized into a number of layers, and each layer is modeled by the lumped-parameter method. For the working fluid side, the WCW is also divided into segments according to the section division results on the combustion side. The section division in the furnace and the inlet and outlet heights of each layer are shown in Figure 2, in which the spiral WCW is from evap2 to evap8, and the vertical WCW is evap9 and evap10. In order to obtain the fluid parameters along the flow direction, we use the distributed-parameter method to model the pipe. On the basis of the layers in Figure 2, each layer is further divided into 10 segments.
For the simplification of the calculations, the following assumptions are made:
  • The coal type is fixed;
  • Radiative heat transfer in the furnace occurs only between adjacent layers;
  • The axial heat conduction of the tube wall is neglected.
The mathematical models for each element of the boiler are all based on mass, energy, and momentum conservation equations.
d m   d t = m ˙ in m ˙ out
d h d t = 1 m m ˙ in h in m ˙ out   h out   h V d ρ d t + Q ˙ + V d p d t
1 A d m ˙   d t = p in p out Δ p g Δ p f
where m is the mass, kg; m ˙ is the mass flow rate, kg/s; h is the specific enthalpy, kJ/kg; p is the pressure, Pa; Q ˙ is the heat source term, W; A is the cross-sectional area of the pipe, m2; and ∆pg and ∆pf are the gravitational pressure drop and frictional pressure drop, respectively, Pa. The subscripts in and out represent the inlet and outlet, respectively.
Δ p g = ρ g Δ z
For single-phase and two-phase flows, ∆pf is calculated using Equations (5) and (6), respectively [20].
Δ p f = f l 2 d m ˙ 2 A 2 ρ
Δ p f = l 0.3164 2 d i 1.25 ( μ liq 0 . 25 ρ liq + 2 x ( μ vap 0 . 25 ρ vap μ liq 0 . 25 ρ liq ) ) ( 1 x ) 1 / 3 + μ vap 0 . 25 ρ vap x 3 m ˙ 7 / 4
where l represents the pipe length, m; f is the friction resistance coefficient, calculated by the Colebrook–White law [21]; μ denotes the dynamic viscosity; Pa·s; x is the mass fraction of steam; K is the roughness. The subscripts liq and vap refer to the liquid and gas phases, respectively.
f = 1 4 log K 3.7 + 5.75 R e 0.9 2
The convective heat transfer is solved as follows:
Q ˙ conv = A eff α T w T g
where α is the heat transfer coefficient; Tw and Tg are the temperatures of the wall and gas, respectively.
For single-phase and two-phase flows, α is determined using the Gnielinski correlation [22] and Steiner–Taborek correlation [23], respectively.
N u = ζ / 8 ( R e 1000 ) P r 1 + 12.7 ζ / 8 P r 2 3 1 1 + d l 2 3
The Darcy friction factor ζ is calculated based on Filonenko’s correlation [24]:
ζ = 1.82 lg R e 1.64 2
α = α conv 3 + α nclt 3
where αconv and αnclt are the convective and nucleate boiling heat transfer coefficients, respectively.
The radiative heat transfer between adjacent furnace layers is expressed as
Q ˙ = A eff σ 1 1 ε upper   + 1 ε g   1 T upper   4 T out   4
where εupper and εg represent the gas emissivities of the upper layer and this layer, while Tupper and Tout denote the gas temperatures of the upper layer and this layer, respectively.
The radiative heat transfer between the flue gas and the wall is calculated as follows:
Q ˙ = A eff σ ε w   a g   + ε w   a g   ε w   a g   T w   4 ε g   T g   4
The energy balance of the tube wall is as follows:
ρ w A δ w c p , w d T w d t = Q ˙ 1 Q ˙ 2
where Q ˙ 1 and Q ˙ 2 represent the heat absorption by the wall and the fluid, respectively.

3.2. Model Validation

The simulation results of the WCW outlet fluid temperature are compared with the design data under different working conditions, as shown in Table 3. The maximum deviation under different loads is only 2.90%, which meets the actual requirements of engineering.
In addition, the dynamic simulation results of the model during load variations is compared with actual operating data, as detailed in our previous work [8].

4. Results and Discussion

4.1. Spatial Distribution of Thermodynamic Parameters

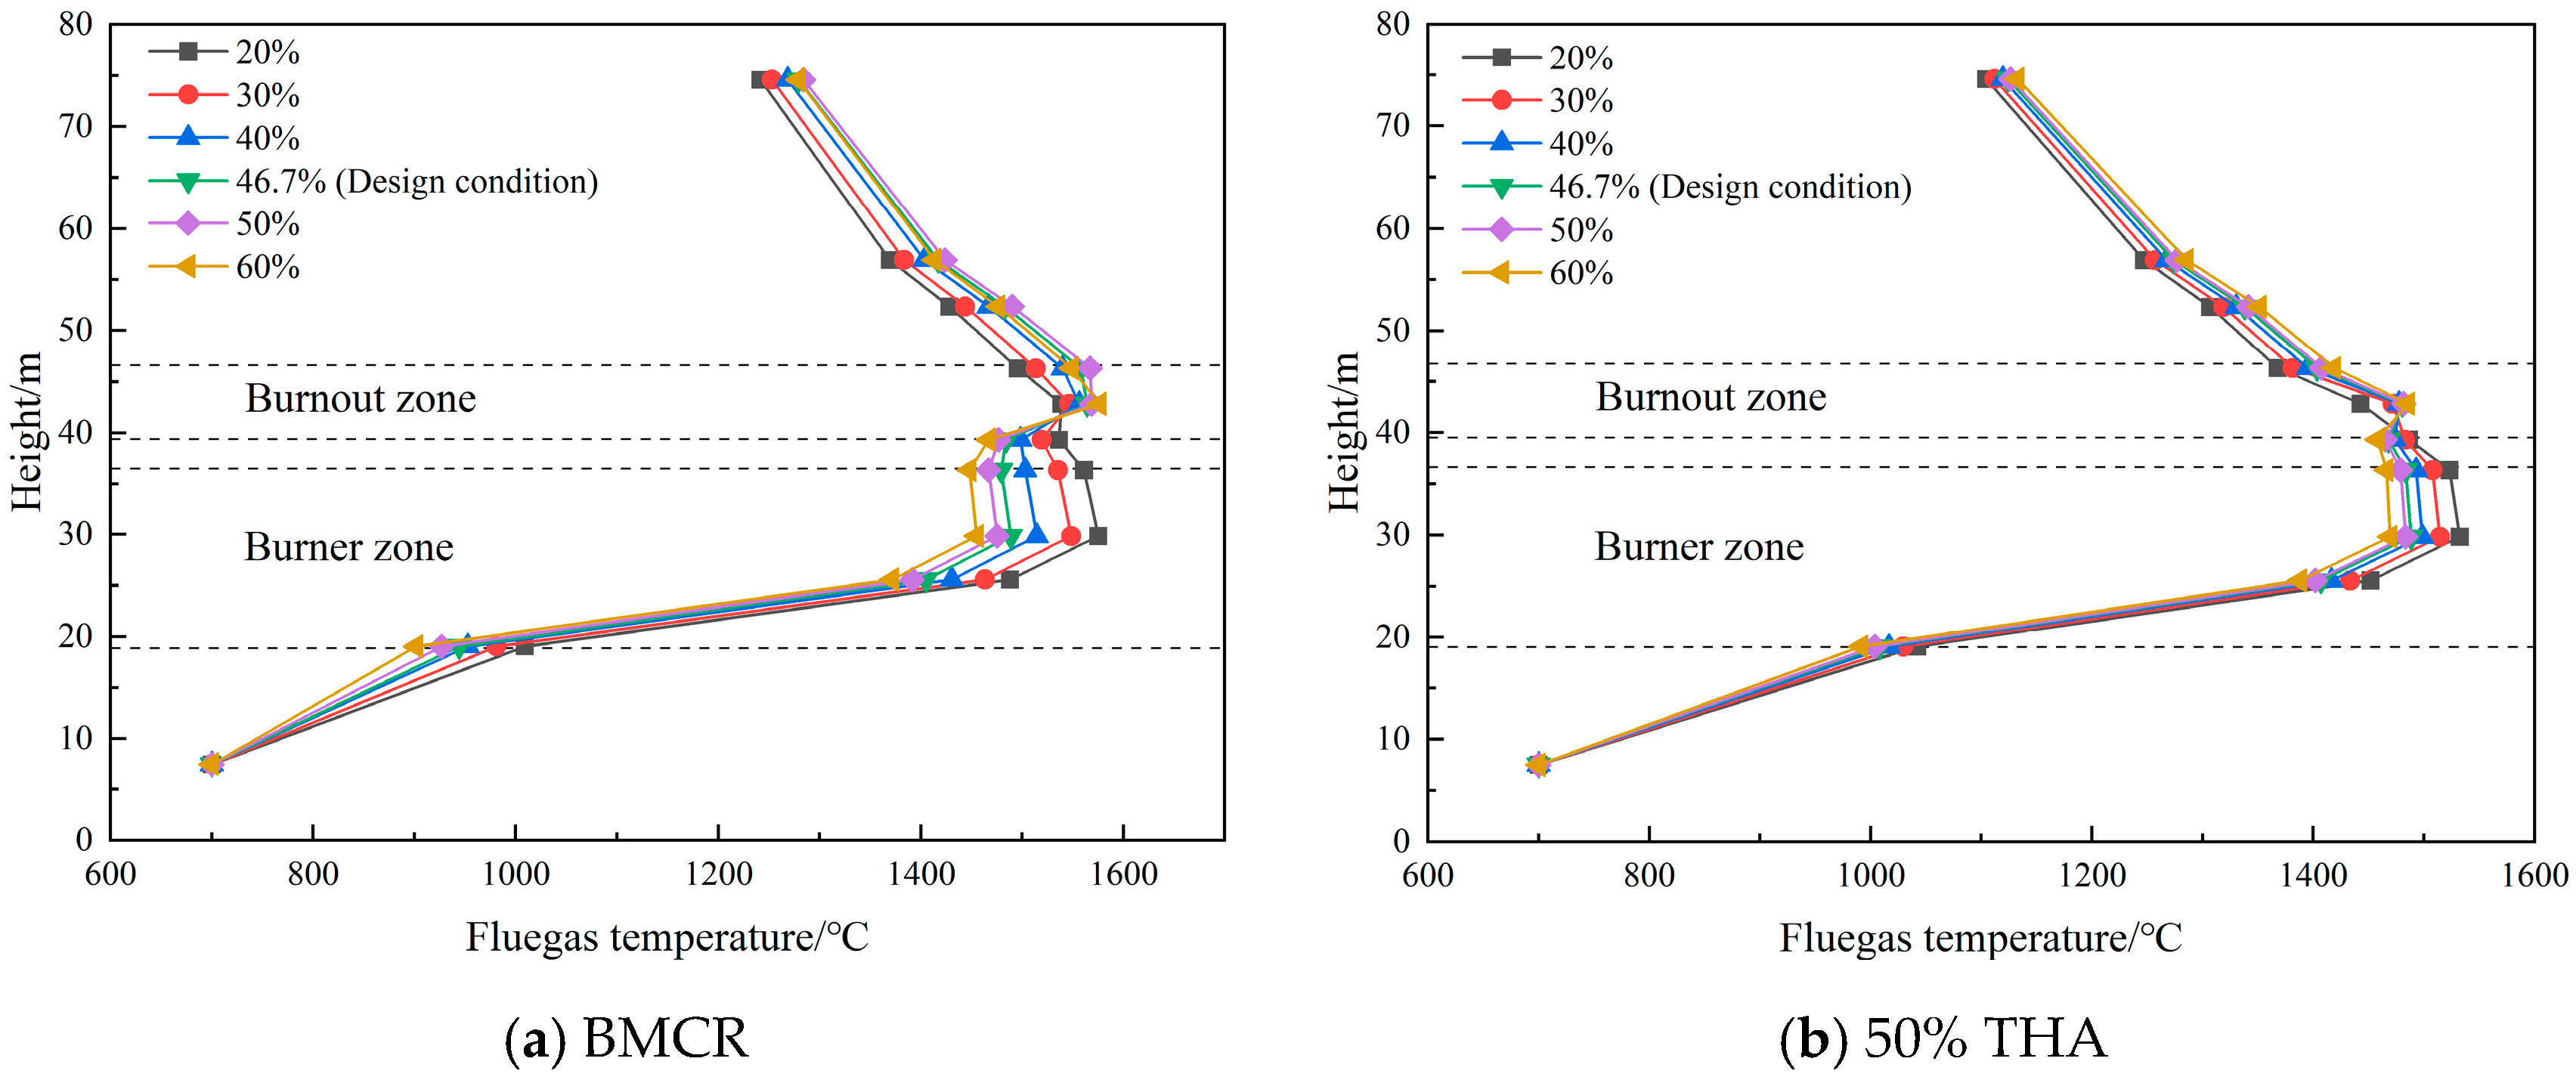
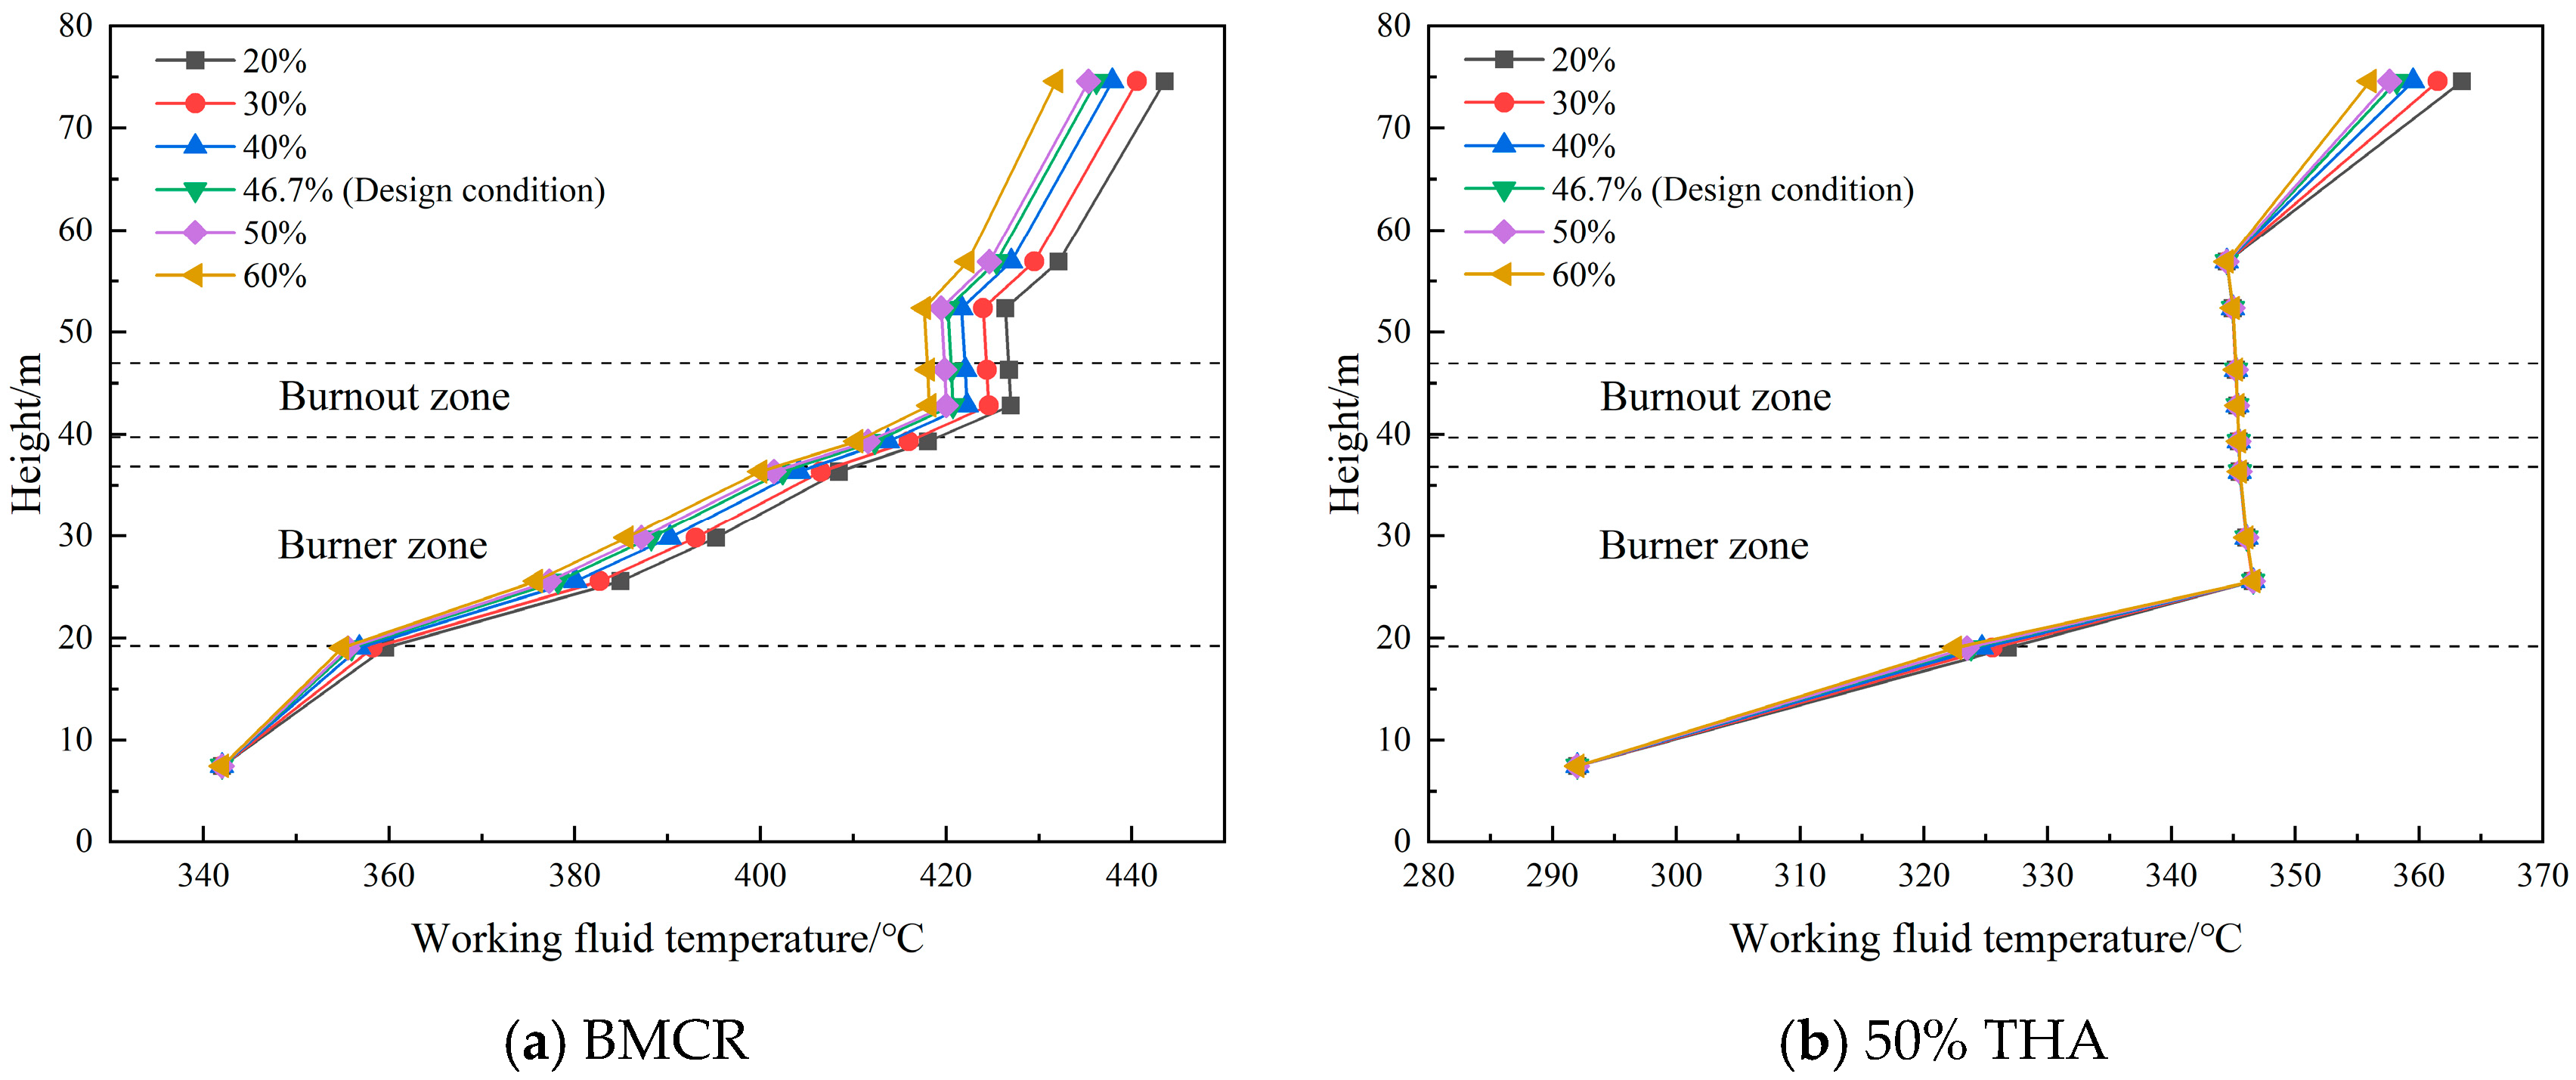
4.1.1. Different OFA Ratios

Under the condition that the total air supply remains unchanged, the ratio of OFA to secondary air is changed. Figure 3 illustrates the flue gas temperature distribution along the furnace height under both the full- and low-load conditions.
The flue gas temperature in the furnace under both conditions exhibits an ‘M’-shaped distribution along the height. The highest temperature occurs in the middle burner zone. Under the 50% THA condition, the temperature difference between the burner zone and the burnout zone becomes more obvious. At the same load, both the BMCR and 50% THA conditions lead to the highest temperature in the burner zone at a 20% OFA ratio, and the lowest at a 60% OFA ratio, while the opposite trend is observed in the burnout zone. This is because, when the OFA ratio is lower, the primary air volume and secondary air volume are greater, leading to a greater relative heat of ignition of pulverized coal, so the temperature of the burner zone is higher. For the burnout area, the higher the OFA ratio, the easier it is for the pulverized coal to burn out in this section, so its trend is the opposite of that in the burner zone.
The OFA ratio significantly affects the temperature distribution in the furnace. A lower OFA ratio increases the temperature in the burner zone while decreasing the flue gas temperature at the furnace exit. The difference between the flue gas exit temperatures at 20% and 60% OFA ratios under BMCR conditions is 37.1 °C, while at a 50% THA load, the difference is 28.4 °C.
The fluid temperature distribution under different working conditions is shown in Figure 4. Under each working condition, the fluid temperature along the height direction generally shows an upward trend. The fluid temperature continues to rise rapidly under BMCR conditions. In contrast, the fluid begins to boil and evaporate at a certain height under the 50% THA condition, causing the temperature to remain basically unchanged. The lower the OFA ratio, the higher the fluid temperature inside the WCW. Under the same load, the fluid temperature is higher at a 20% OFA ratio and lower at a 60% OFA ratio, and the temperature difference between the WCW outlet fluid temperatures at a 20% and 60% OFA ratio under the BMCR load is 11.7 °C, while the difference at the 50% THA load is 7.4 °C.
To investigate the changes in the PTP after the change in the operating conditions, we use the length of the evaporation section as a measurement result, which is the difference between the height of the evaporation point and the height of the boiling point. The boiling point is where the liquid phase changes to a gas–liquid coexistence state on the working fluid side, while the evaporation point is where the gas–liquid coexistence state changes to a pure gas state on the working fluid side. The locations of the phase transition points in the WCW under different combustion air conditions are shown in Table 4. Under the BMCR load, this parameter is not repeated because there is no phase transition point. Due to the decrease in the temperature of the working fluid side, the phenomenon of a higher proportion of OFA causing a higher boiling point and evaporation point is shown. At the same time, because the evaporation point rises faster than the boiling point, the evaporation section also shows a tendency to increase with the increase in the proportion of OFA.

4.1.2. Different Coal Calorific Values

The LHV of the coal is usually calculated using the Mendeleev empirical formula. The changed LHV is determined by the following equation [19]:
LHV = LHV 0 + 339 Δ C ar + 1031 Δ H ar 109 ( Δ O ar Δ S ar ) 25.1 Δ M ar
The effects of the coal calorific value on the distribution of flue gas and fluid temperatures are shown in Figure 5 and Figure 6, respectively. Regardless of the load, fluctuations in the coal calorific value have little impact on the overall trend in the flue gas and fluid temperature distribution along the furnace height. Under the same load, a decrease in the calorific value will lead to an overall decrease in the flue gas temperature and working fluid temperature in the furnace, and an increase in the calorific value will cause an overall increase in the flue gas temperature and working fluid temperature in the furnace. The effect of the fuel calorific value change on the temperature in the burner area is limited. Furthermore, the temperature difference is mainly reflected in the area above the combustion zone. Under the BMCR load, after a 5% increase in the calorific value, the flue gas outlet temperature is increased by 32.7 °C, and the WCW outlet temperature is increased by 6.5 °C. Meanwhile, under the 50% THA load, after a 5% increase in the calorific value, the flue gas outlet temperature is increased by 35.4 °C, and the WCW outlet temperature is increased by 9.9 °C.
The changes in the PTP locations when the coal calorific value is changed are shown in Table 5. Under low-load conditions, the working fluid from the burner zone to the end of the burnout zone is in the phase transition section, when the temperature basically does not change, and only in the WCW outlet does the temperature suddenly increase. Therefore, under actual operating conditions, it should be ensured that, during low-load operation, the coal calorific value variations should not be too large, to prevent the fluid temperature difference between the inside and the outlet of the WCW becoming too large, resulting in greater thermal stress. An increase in the coal calorific value moves the dryout point forward, resulting in a decrease in the length of the evaporation section, and conversely, a decrease in the coal calorific value results in a lengthening of the evaporation section.

4.2. Dynamic Characteristics of Thermodynamic Parameters

4.2.1. Step Disturbance of Coal Feeding Rate

With all the other variables held constant, a step disturbance test was conducted on the coal quantity after 250 s. The time-dependent distribution of the flue gas temperature under the BMCR and 50% THA conditions is shown in Figure 7. At the same load, the furnace outlet flue gas temperature increases as the coal feeding rate rises. However, under the BMCR load, the furnace outlet flue gas temperature under a 9% increase in coal feed tends to be the same as that under a 6% increase, which is presumed to be due to the insufficient air supply in the combustion zone, resulting in the coal not being able to burn completely in the furnace chamber. After a step perturbation in the coal quantity, the dynamic response time is short, which means that there are no peaks and troughs after the perturbation, and the response time under the BMCR condition is less than that under the 50% THA condition.
Figure 8 illustrates the distribution of the WCW outlet fluid temperature and flow rate over time under the BMCR and 50% THA load conditions, following a stepwise increase in the coal feeding rate. The fluid temperature exhibits a similar trend to that of the flue gas temperature, indicating that an increase in the coal feeding rate leads to an increase in the fluid temperature. This is because a higher coal feeding rate increases the heat generated by combustion, thereby raising both the flue gas and fluid temperatures. In contrast, changes in the coal feeding rate have a minimal impact on the WCW outlet fluid flow rate because the feedwater flow rate is unchanged.
Table 6 presents the variation in the PTP position following disturbances in the coal feeding rate. The boiling point height remains constant and the dryout point height decreases with the increasing coal feed. Therefore, the length of the evaporation section decreases with the increase in the coal feeding rate.

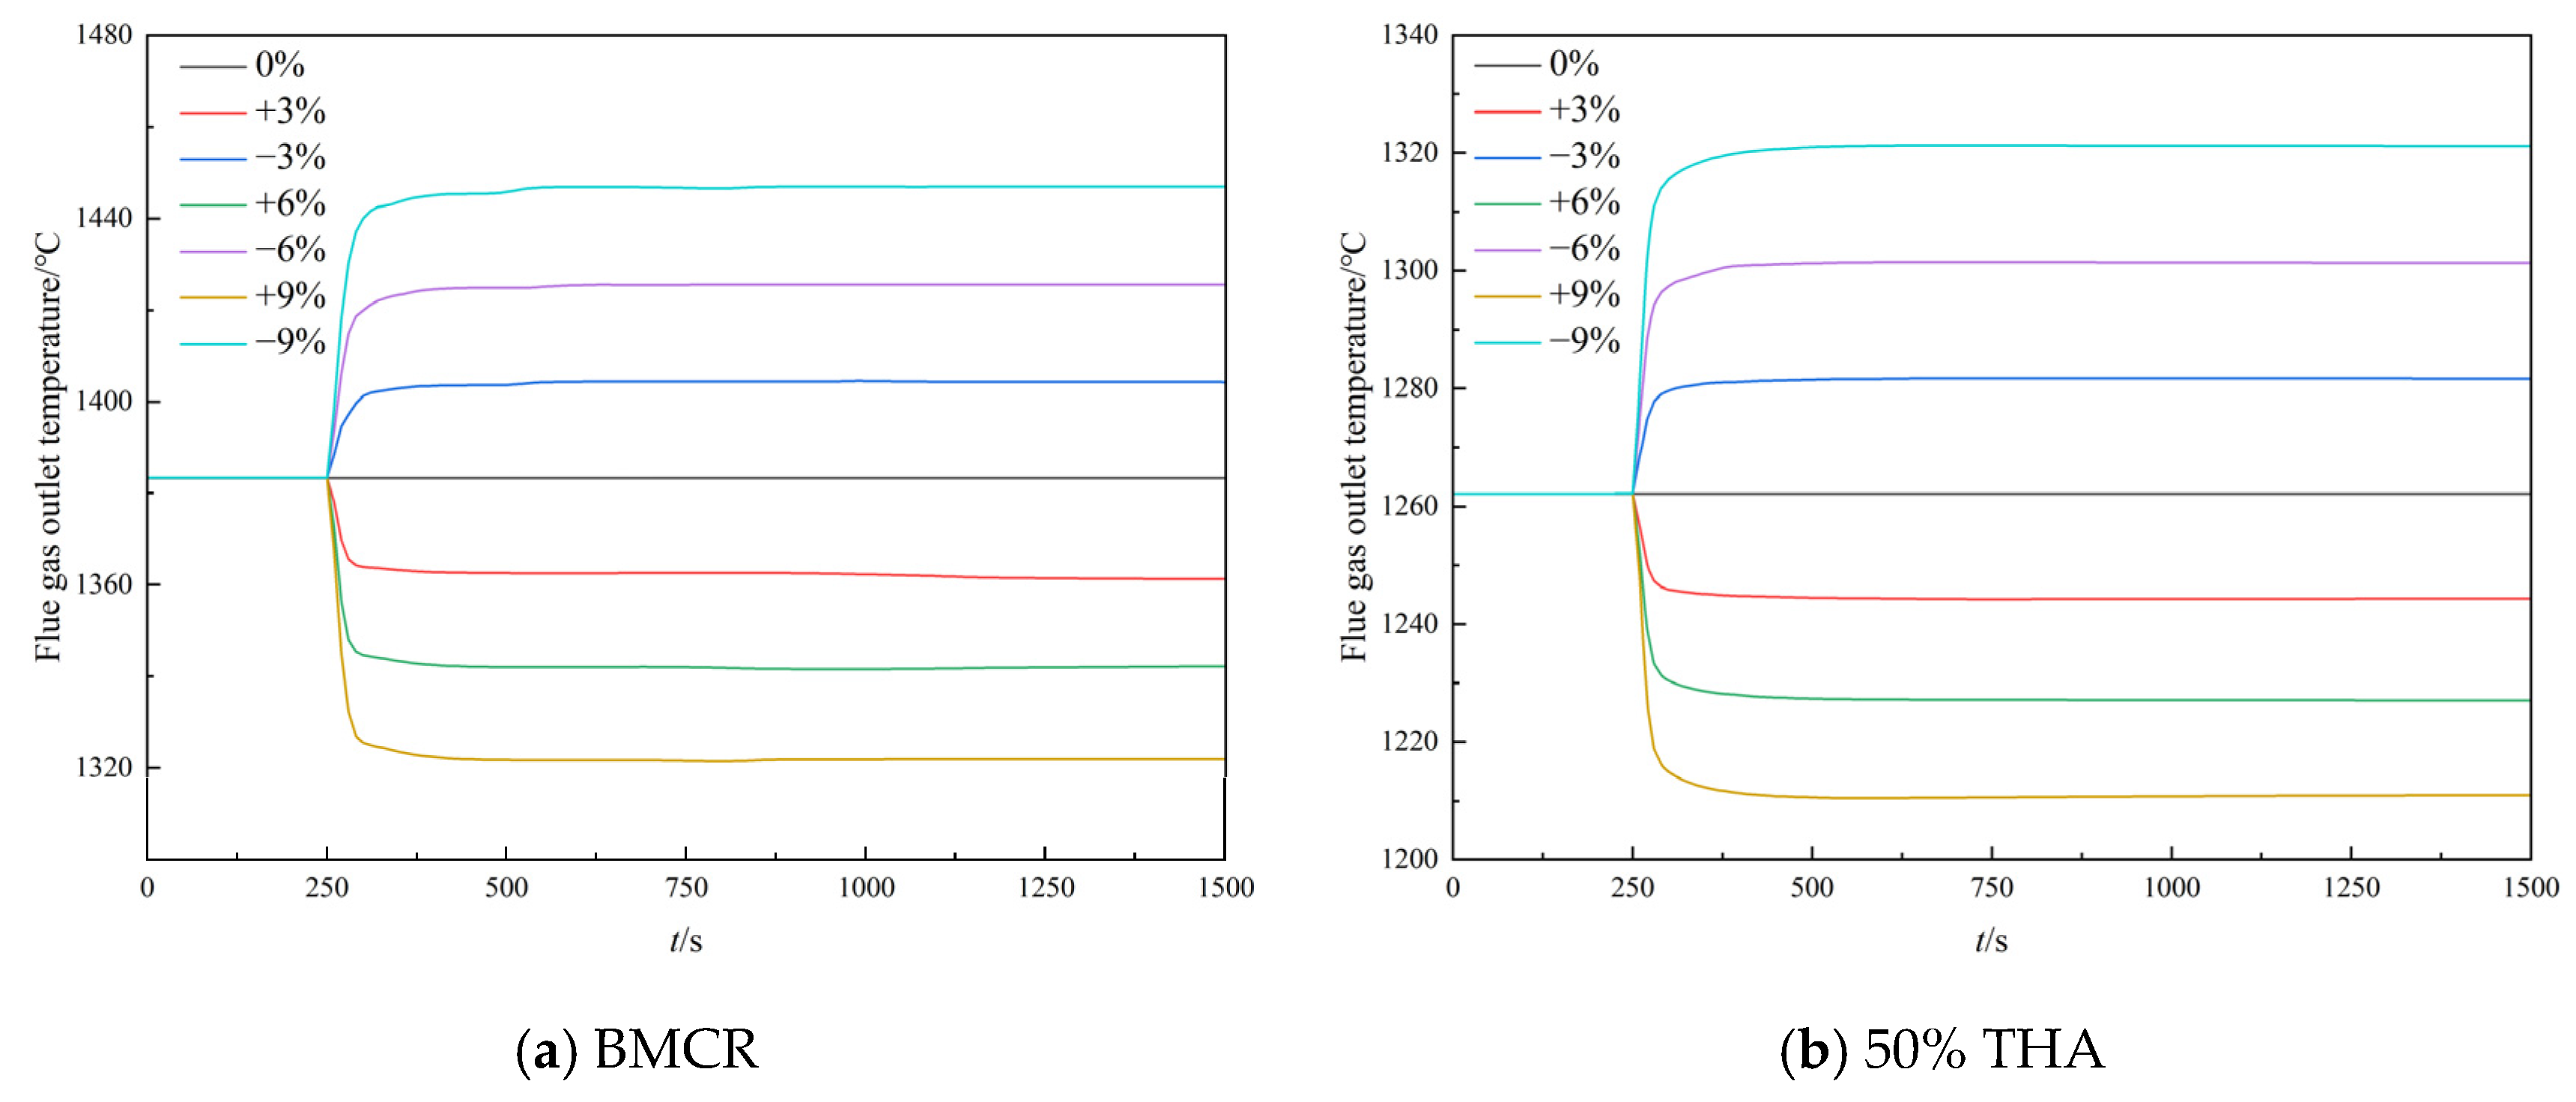
4.2.2. Step Disturbance of Air Flow Rate

Figure 9 shows the distribution of the furnace outlet flue gas temperature with time following a step disturbance in the air supply volume under the BMCR and 50% THA load conditions. The decrease in the air supply leads to an increase in the furnace outlet flue gas temperature, while the increase in the air supply leads to a decrease in the temperature. The greater the reduction in air supply, the lower the furnace outlet flue gas temperature. The response time is not more than 150 s. These results demonstrate a strong correlation between the flue gas temperature and air supply volume, with fluctuations in the air supply causing irreversible temperature changes in the furnace. Therefore, the prompt control of air supply is essential.
Figure 10 shows the distribution of the WCW outlet temperature and flow rate with time for the air supply step conditions of BMCR with a 50% THA load. A step increase in the air supply volume results in an increase in the fluid temperature, while a step decrease leads to a decrease in the WCW outlet temperature. However, compared with the flue gas side, the temperature fluctuation at the beginning of the perturbation is more obvious at the working fluid side, and there exists a wave peak generated after the perturbation, but the response time is still within 300 s. Comparing the different loads, the fluctuation in thermal parameters is more drastic for the 50% THA condition. Comparing the same load under different working conditions of the working fluid side of the outlet flow, it can be found that the flue gas side of the wind parameter changes on the water side of the flow of the steady-state value of the impact is not significant, showing that there is only a certain degree of flow fluctuations generated at the beginning of the perturbation, producing a different wave-like change: the larger the amount of perturbation, the higher the wave tendency. This is to regulate the WCW after the perturbation of a sudden increase or decrease in temperature, and then the flow is restored after a period of time.
The PTP position on the working fluid side under different air feeding rate disturbances is shown in Table 7. When the air supply volume decreases, the height of the boiling point gradually increases, and the height of the evaporation point gradually decreases; when the air supply volume increases, the boiling point height gradually decreases, and the dryout point height gradually increases. Eventually, the evaporation section length is extended with the increase in air supply.

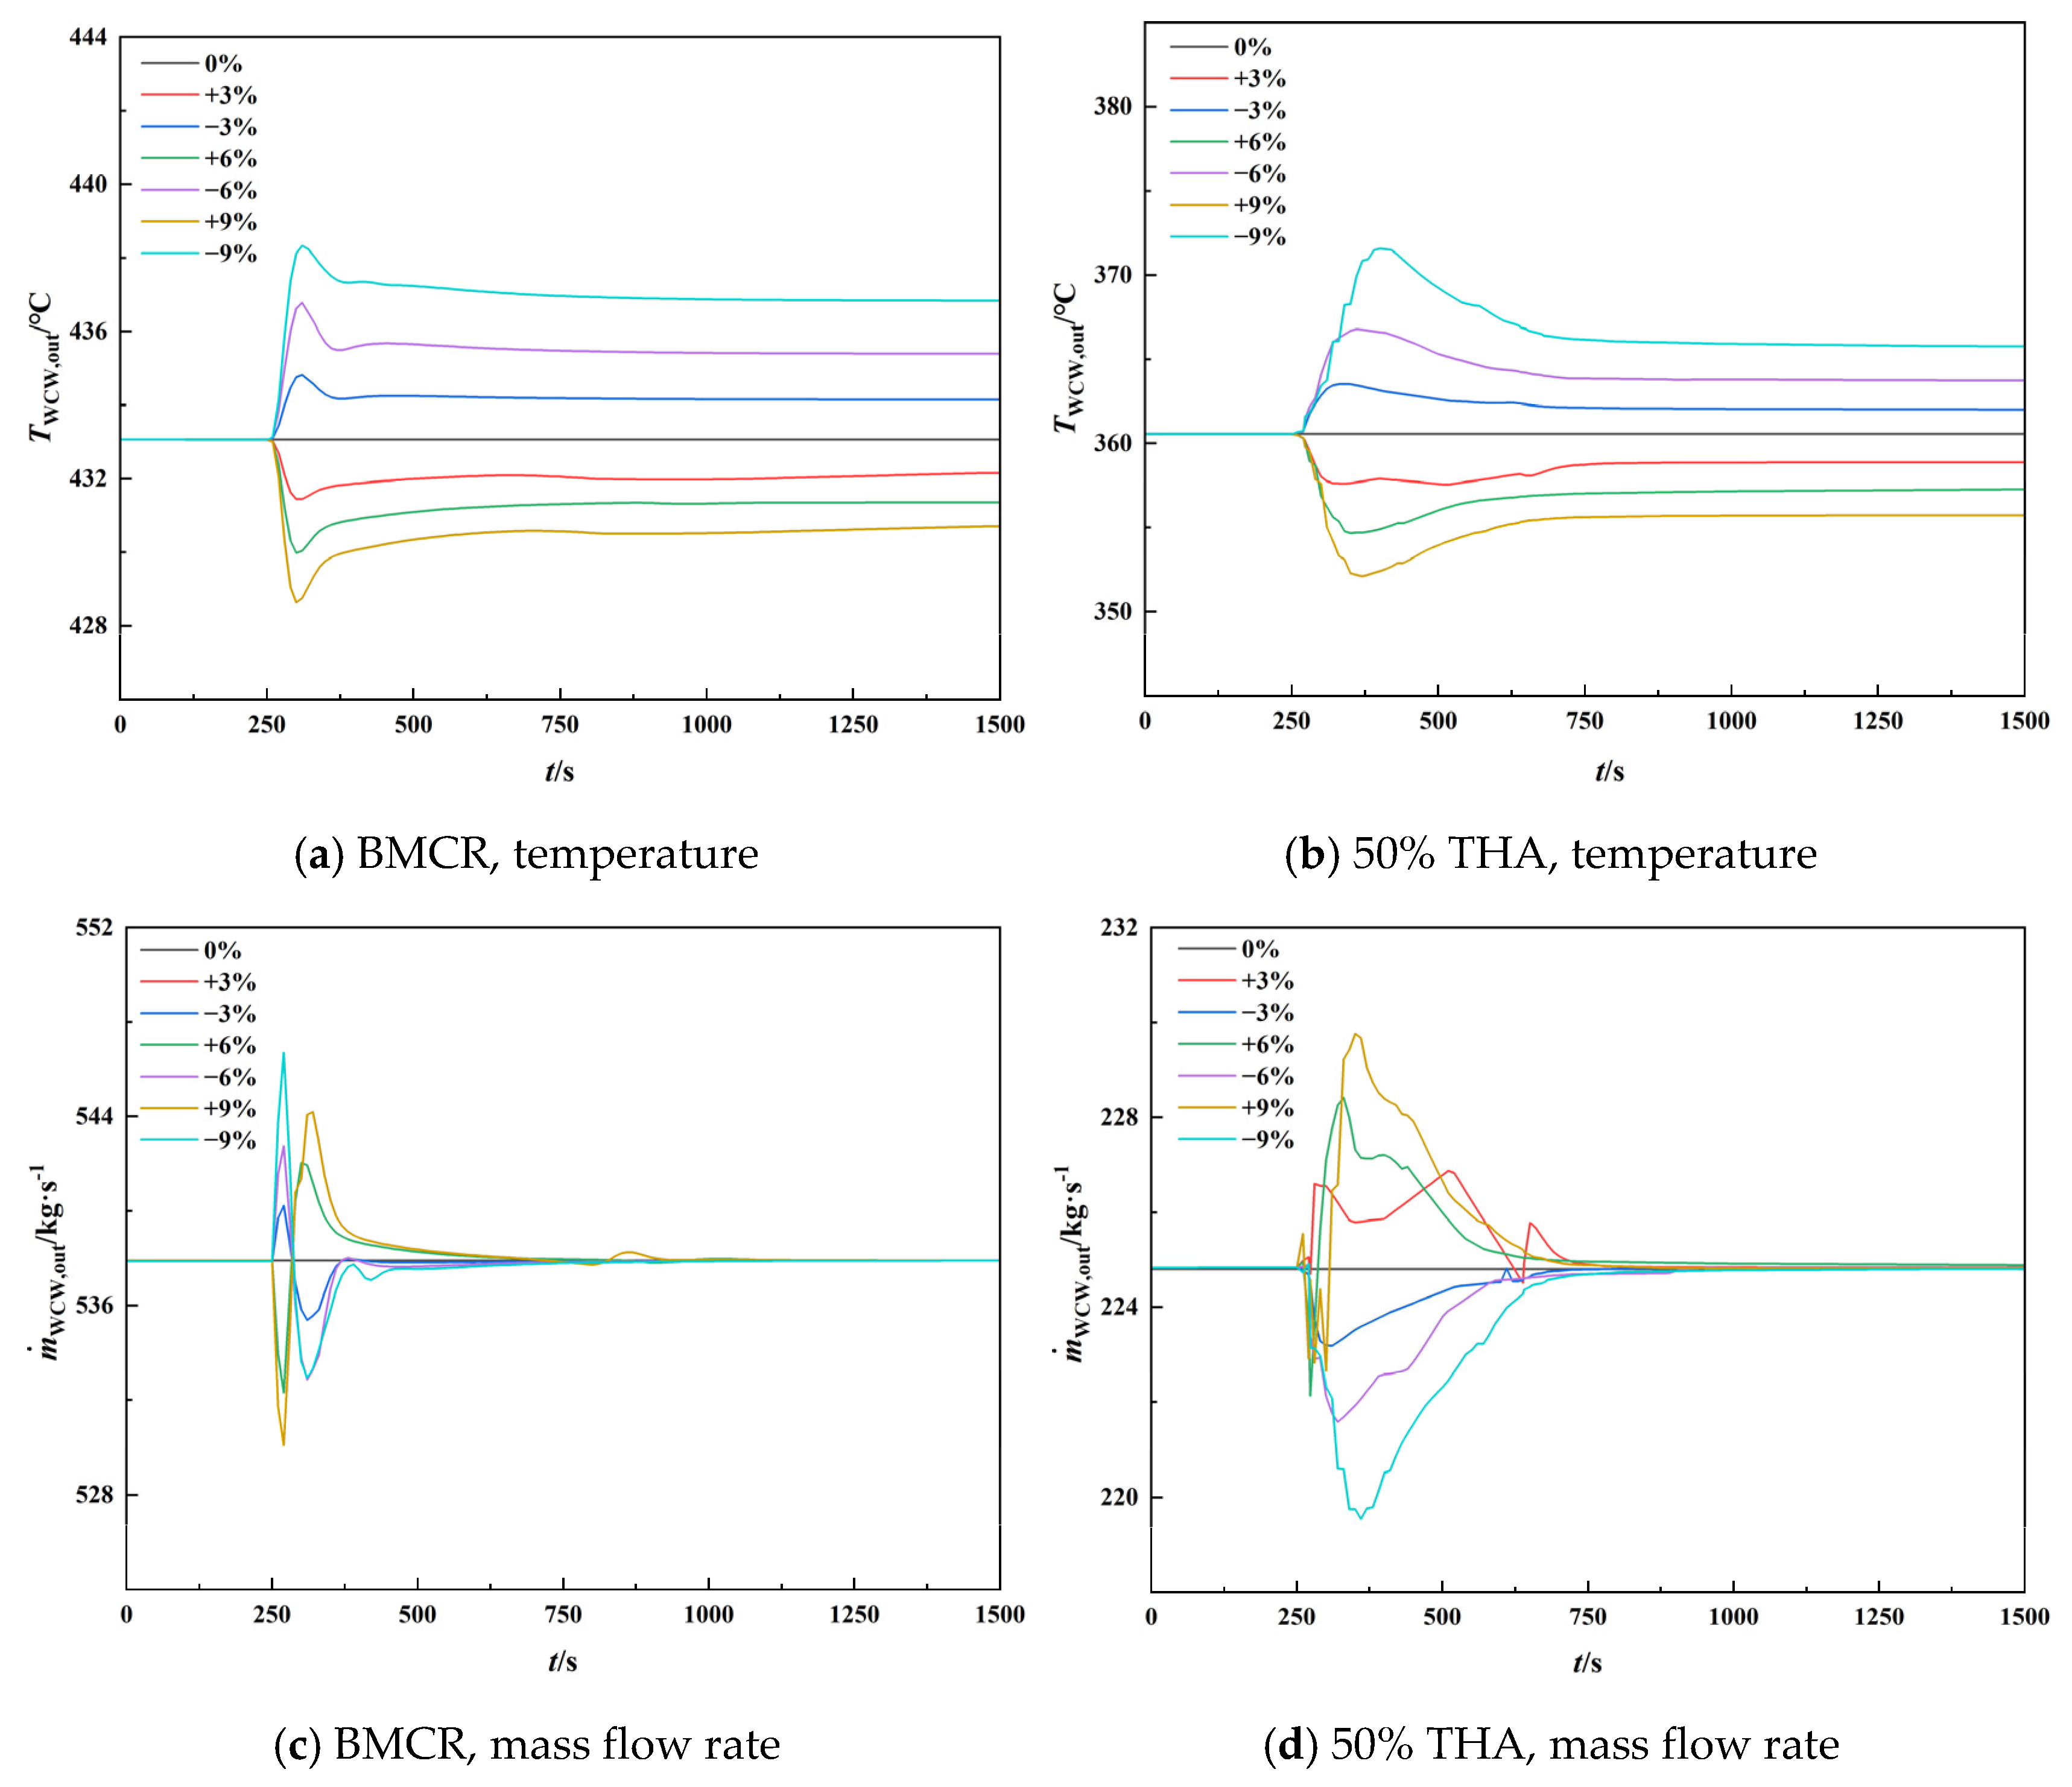
4.2.3. Step Disturbance of Feedwater Flow Rate

The distributions of the WCW outlet temperature and flow rate with time for the fluctuating feedwater conditions of BMCR and a 50% THA load are shown in Figure 11. Since the heat absorption of the WCW remains constant due to the constant heat released from coal combustion, the decrease in the feedwater flow rate will increase the heat absorption per unit mass flow rate of the fluid, thereby raising the WCW outlet fluid temperature. The greater the decrease in the water supply, the greater the increase in the fluid temperature at the WCW outlet. On the premise that combustion and heat transfer processes are not much different, the response time of each thermodynamic parameter of the WCW is also roughly the same. Due to the law of mass conservation, the mass flow rate of the working fluid at the outlet tends to follow a proportional distribution relative to changes in the working conditions.
Table 8 shows the distribution of the phase change point of the work mass under the fluctuation in the feed water quantity, and it is concluded that the boiling point and evaporation point of the working fluid side rise with the increase in the feedwater quantity. However, because the boiling point rises slower than the evaporation point does, the length of the evaporation section shows a general trend of increasing.

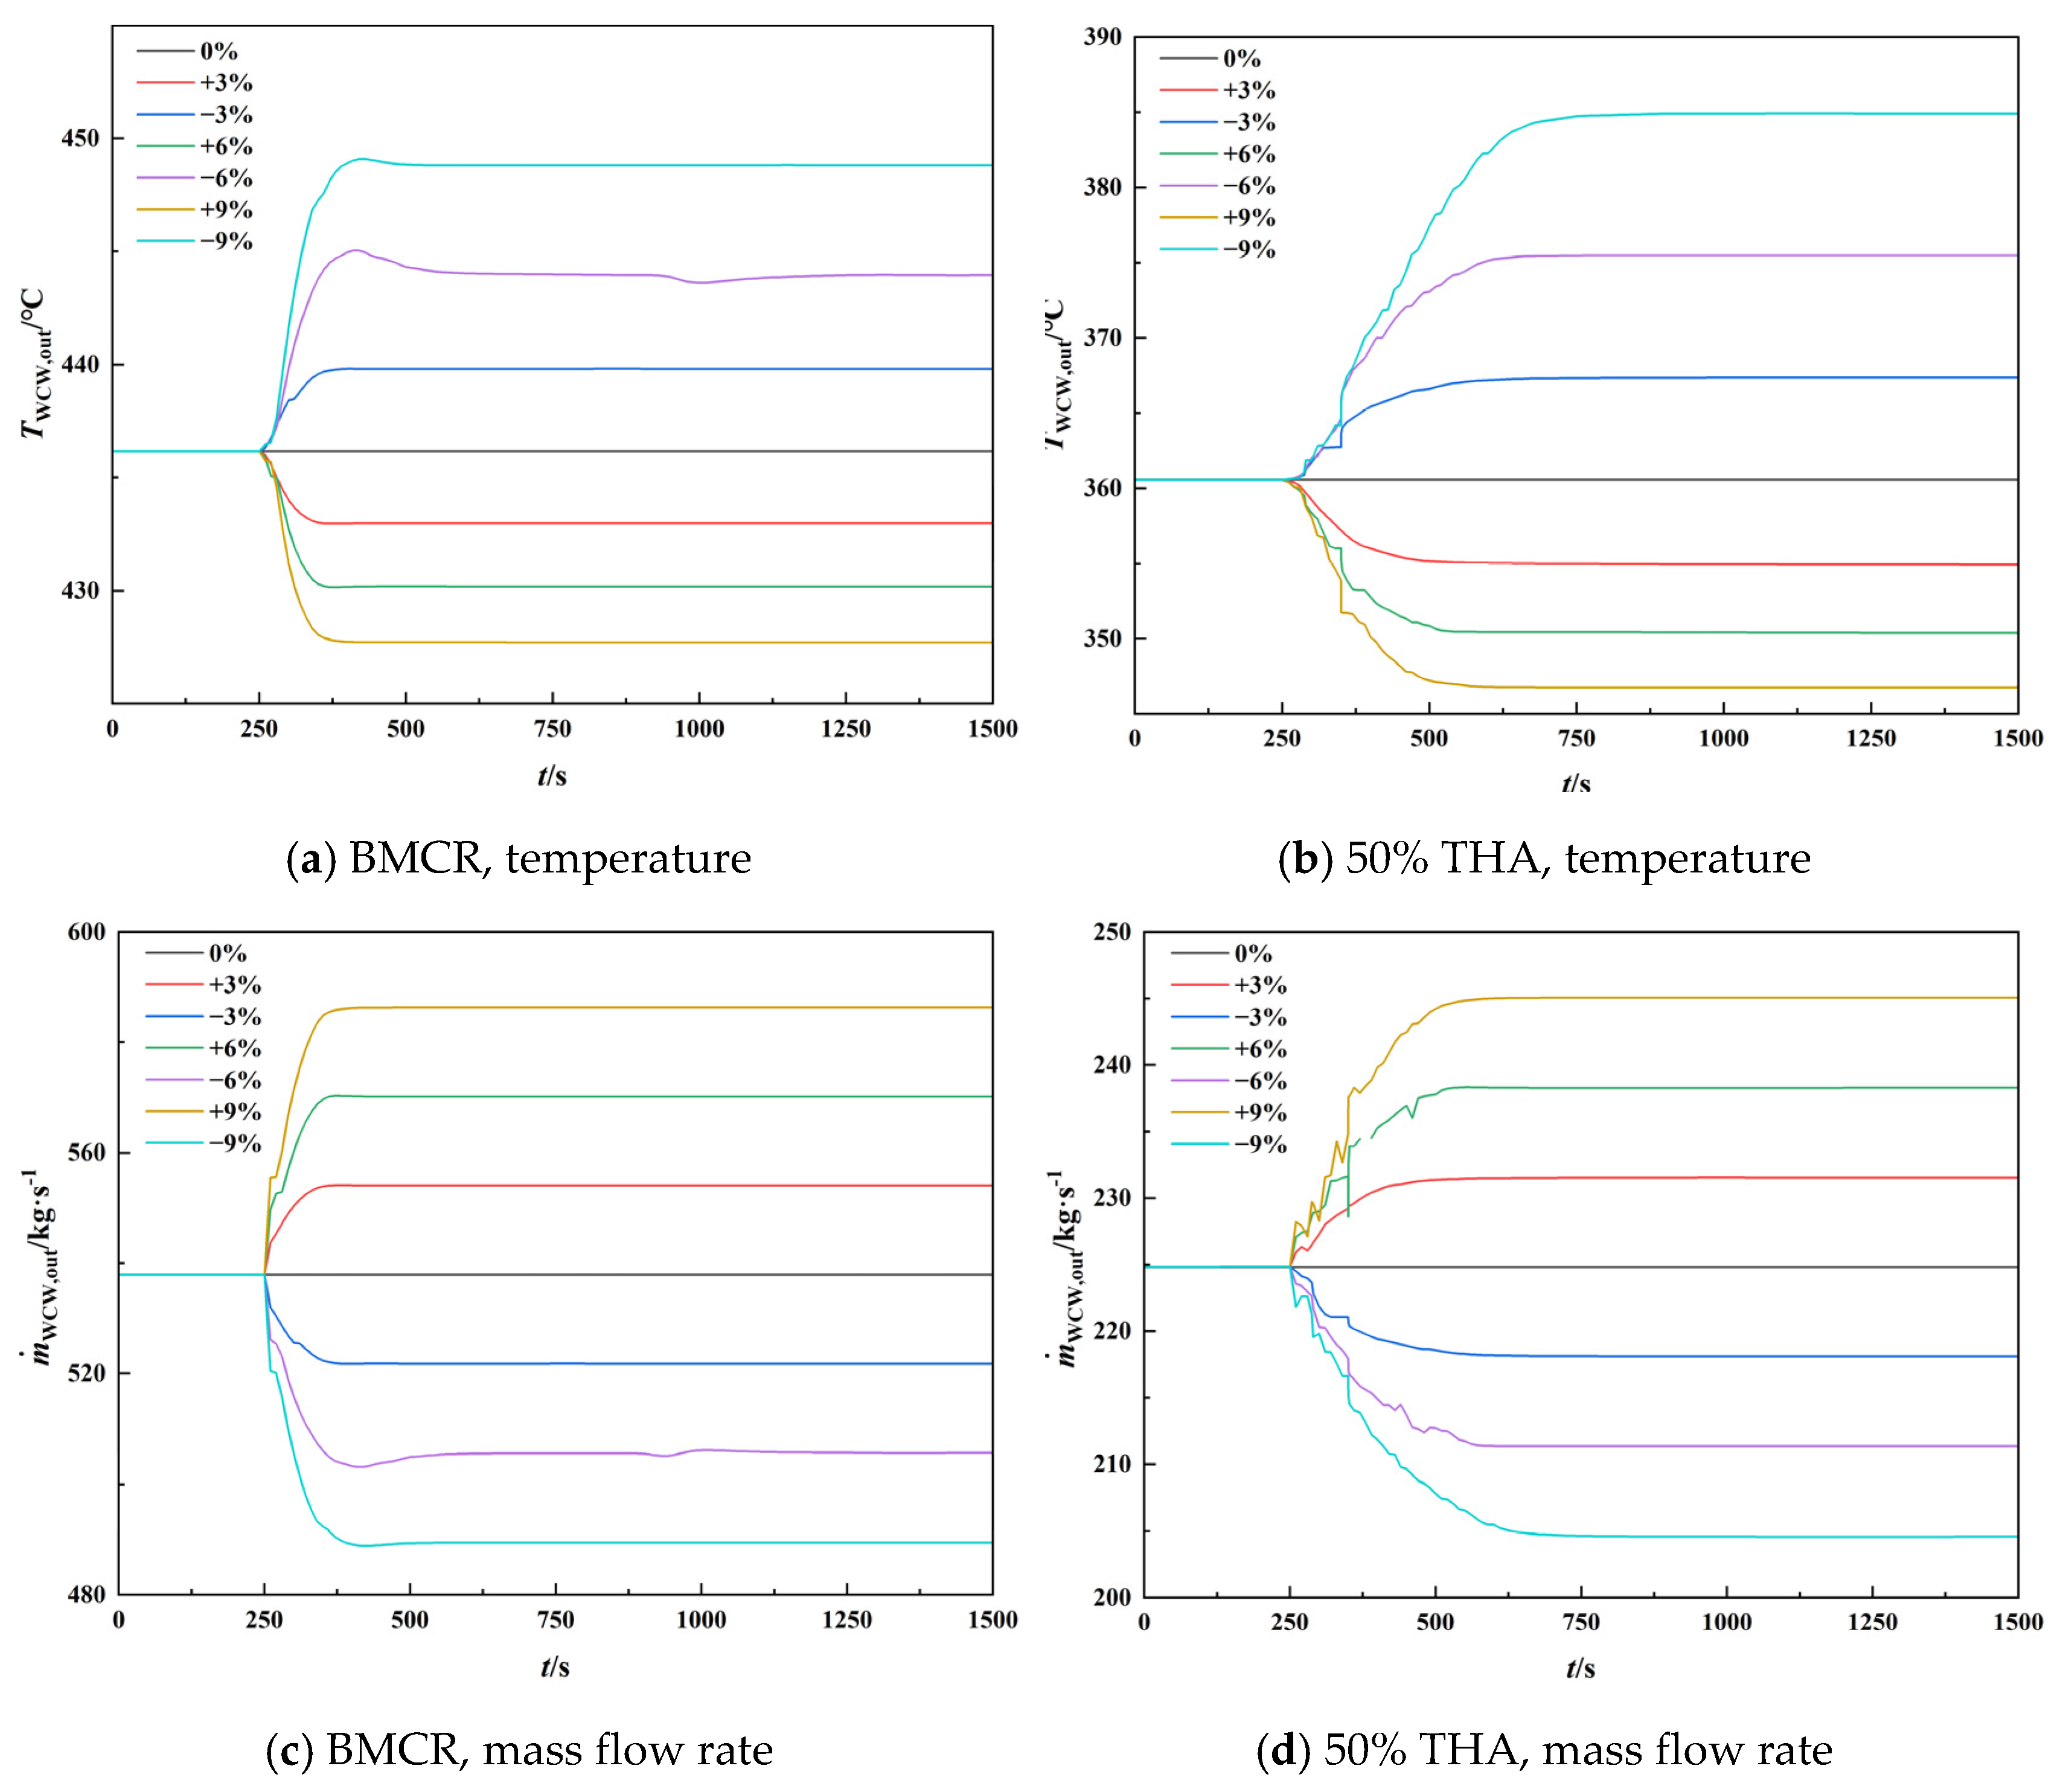
4.2.4. Step Disturbance of Feedwater Temperature

Figure 12 shows the distribution of the WCW outlet temperature and flow rate with time for the feedwater temperature fluctuation conditions of BMCR and a 50% THA load. After a step increase in the feedwater temperature, the WCW outlet temperature decreases and then increases, and finally stabilizes at a level higher than the initial value; the WCW outlet flow rate increases and then decreases, and finally stabilizes at the same level as that of the initial value.
Table 9 shows the distribution of the PTP positions on the working fluid side for different feedwater temperature step conditions. As the feedwater temperature increases, the boiling point height becomes lower, and at the same time, the evaporation point height is also lower. As the dryout point decreases faster than the boiling point, the length of the evaporation section shows a decreasing trend with the increase in the feedwater temperature.

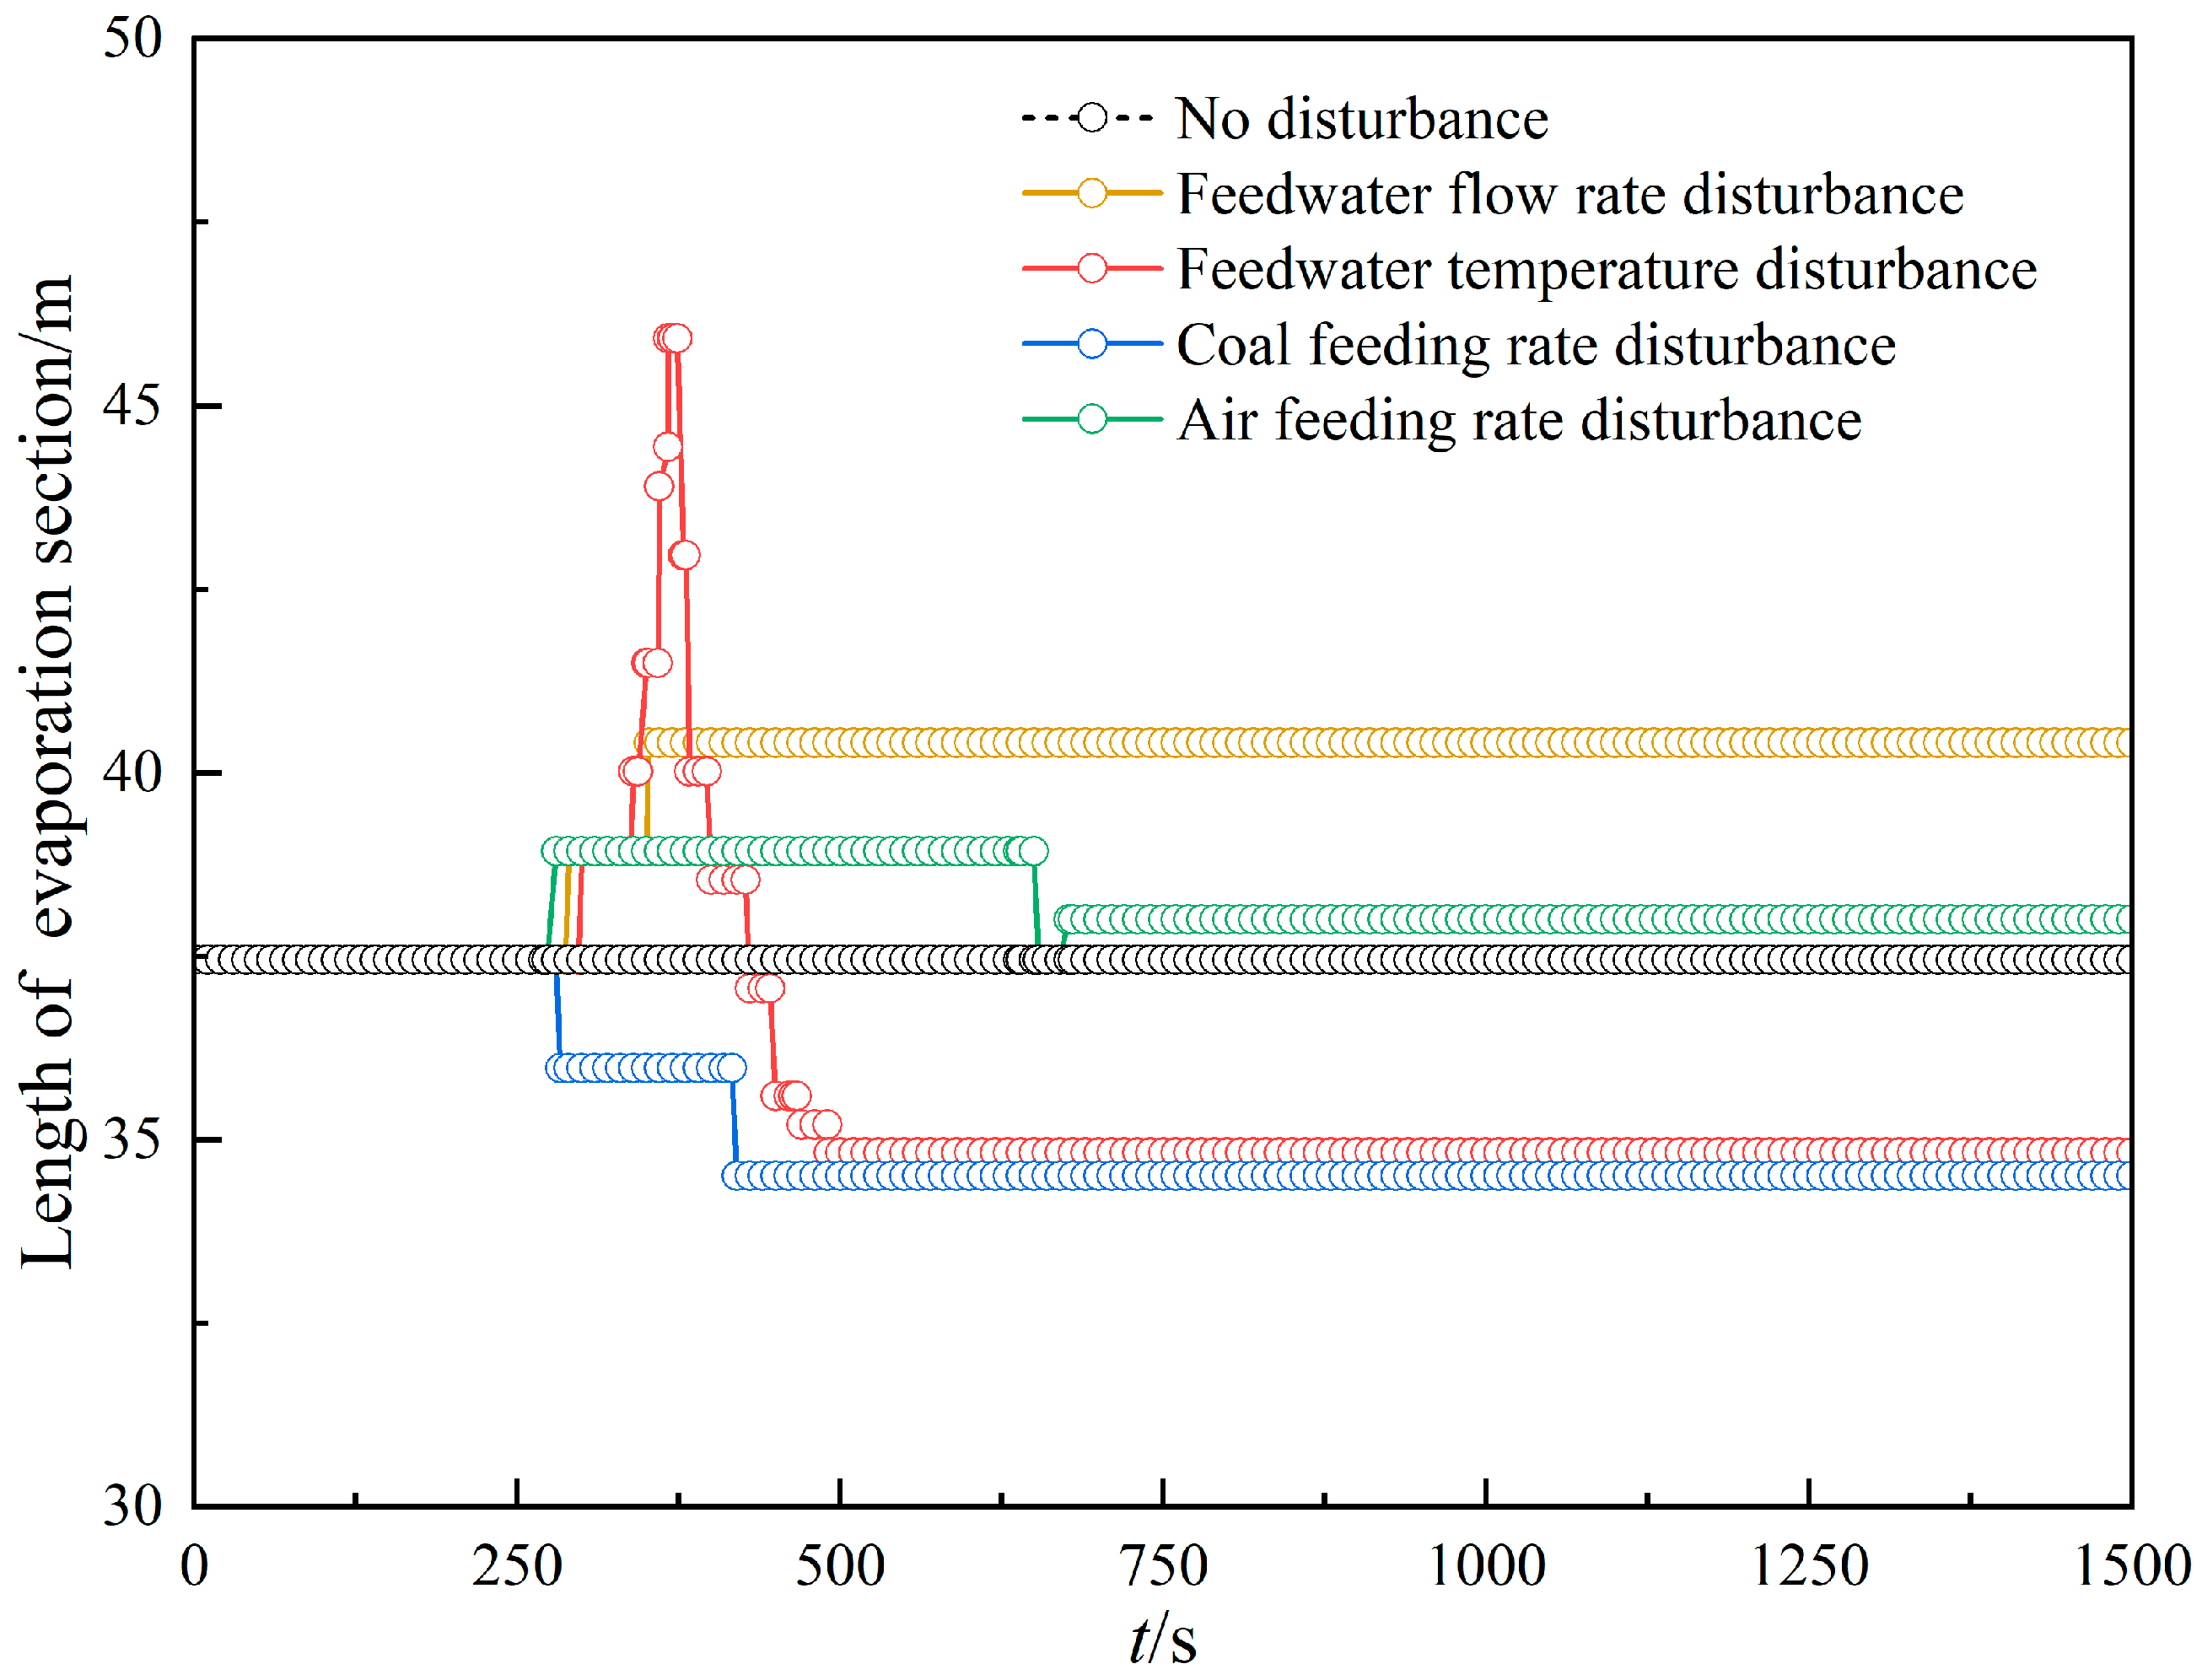
4.2.5. Comparison of the PTP Position for Different Working Conditions

The change in the PTP position of the working fluid in the WCW is compared with the case of a +3% step change in the coal feeding rate, air flow rate, feedwater temperature, and feedwater flow rate, respectively. The dynamic changes in the evaporation section after a +3% step change under different boundary conditions are shown in Figure 13, while the changes in the PTP positions are presented in Table 10. At the same step of +3%, the disturbance caused by the feedwater temperature to the length of the evaporation section in the dynamic response process is the most intense, and the change in the length of the evaporating section caused by the disturbance of the air supply volume under the steady state result is the smallest, and the rest of the fluctuation is of a similar magnitude. Because the change in the fluid temperature will cause both a boiling point change and evaporation point change, the fluctuation in the response process will be more intense.

5. Conclusions

In this paper, a one-dimensional coupling dynamic model of combustion and hydrodynamics in a furnace was developed. The spatial distribution of key thermal parameters after fluctuation in the combustion-side parameters under the full-load and low-load conditions is analyzed. And the dynamic response characteristics of the temperature, mass flow rate, and the PTP within the WCW are investigated.
  • The OFA ratio has a great influence on the temperature distribution in the furnace. The lower the OFA ratio, the higher the flue gas temperature in the burner zone and the lower the temperature at the furnace exit. Meanwhile, the lower the OFA ratio, the higher the fluid temperature and the shorter the length of the evaporation section. The temperature difference in the WCW outlet fluid at the 20% and 60% OFA ratios is 11.7 °C under the BMCR condition and 7.4 °C under the 50% THA condition.
  • The change in the coal calorific value has a limited influence on the temperature of the burner area, and the difference in the temperature is mainly reflected in the area above the combustion zone. Under the BMCR and 50% THA conditions, when the coal caloric value increases by 5%, the flue gas outlet temperature increases by 32.7 °C and 35.4 °C, and the fluid outlet temperature increases by 6.5 °C and 9.9 °C, respectively. Meanwhile, an increase in the coal calorific value results in a decrease in the dryout point height and a decrease in the length of the evaporation section.
  • The changes in the length of the evaporation section are −2.95 m, 2.95 m, −2.62 m, and 0.54 m when the coal feeding rate, feedwater flow rate, feedwater temperature, and air supply rate are suddenly increased by 5%, respectively.

Author Contributions

Conceptualization, Y.H., C.W. and L.W.; methodology, K.L. and L.Z.; validation, K.L., Y.Z. and C.W.; formal analysis, Y.H. and Y.W.; investigation, Y.H., C.W., K.L. and L.Z.; resources, Y.H., C.W., Y.Z., Y.W., L.W. and D.C.; data curation, K.L.; writing—original draft preparation, K.L. and L.Z.; writing—review and editing, Y.H. and L.W.; supervision, L.W.; project administration, L.W. and D.C.; funding acquisition, Y.H. and L.W. All authors have read and agreed to the published version of the manuscript.

Funding

This work was supported by the Science and Technology Project of the Inner Mongolia Power Research Institute (Grant No. 2023-ZC-11) and the Natural Science Basic Research Program of Shaanxi Province (Grant No. 2023-JC-QN-0482).

Data Availability Statement

The data presented in this study are available on request from the corresponding author. The data are not publicly available due to privacy.

Conflicts of Interest

Y.H., C.W., Y.Z. and Y.W. were employed by Inner Mongolia Power (Group) Co., Ltd. The remaining authors declare that the research was conducted in the absence of any commercial or financial relationships that could be construed as a potential conflict of interest. The funders had no role in the design of the study; in the collection, analyses, or interpretation of the data; in the writing of the manuscript; or in the decision to publish the results.

References

  1. Mohamed, O.; Khalil, A.; Wang, J. Modeling and Control of Supercritical and Ultra-Supercritical Power Plants: A Review. Energies 2020, 13, 2935. [Google Scholar] [CrossRef]
  2. Avagianos, I.; Rakopoulos, D.; Karellas, S.; Kakaras, E. Review of Process Modeling of Solid-Fuel Thermal Power Plants for Flexible and Off-Design Operation. Energies 2020, 13, 6587. [Google Scholar] [CrossRef]
  3. Kruger, M.; Muslubas, S.; Loeper, T.; Klasing, F.; Knodler, P.; Mielke, C. Potentials of Thermal Energy Storage Integrated into Steam Power Plants. Energies 2020, 13, 2226. [Google Scholar] [CrossRef]
  4. Yin, J.; Liu, M.; Zhao, Y.; Wang, C.; Yan, J. Dynamic performance and control strategy modification for coal-fired power unit under coal quality variation. Energy 2021, 223, 120077. [Google Scholar] [CrossRef]
  5. Oko, E.; Wang, M. Dynamic modelling, validation and analysis of coal-fired subcritical power plant. Fuel 2014, 135, 292–300. [Google Scholar] [CrossRef]
  6. Mahmoudi, F.; Najafabadi, T.A.; Moarefianpour, A. Developing an operating instruction to attenuate pressure stress during fuel shortage events of a power boiler based on dynamic modelling. Appl. Therm. Eng. 2022, 200, 117565. [Google Scholar] [CrossRef]
  7. Zima, W.; Grądziel, S.; Cebula, A.; Rerak, M.; Kozak-Jagieła, E.; Pilarczyk, M. Mathematical model of a power boiler operation under rapid thermal load changes. Energy 2023, 263, 125836. [Google Scholar] [CrossRef]
  8. Liu, K.; Wang, C.; Wang, L.; Liu, B.; Ye, M.; Guo, Y.; Che, D. Dynamic performance analysis and control strategy optimization for supercritical coal-fired boiler: A dynamic simulation. Energy 2023, 282, 128712. [Google Scholar] [CrossRef]
  9. Wang, H.; Zhang, C.; Liu, X. Heat transfer calculation methods in three-dimensional CFD model for pulverized coal-fired boilers. Appl. Therm. Eng. 2020, 166, 114633. [Google Scholar] [CrossRef]
  10. Li, X.; Zeng, L.; Zhang, N.; Chen, Z.; Li, Z.; Qin, Y. Effects of the air-staging degree on performances of a supercritical down-fired boiler at low loads: Air/particle flow, combustion, water wall temperature, energy conversion and NO emissions. Fuel 2022, 308, 121896. [Google Scholar] [CrossRef]
  11. Gu, M.; Wang, M.; Chen, X.; Wang, J.; Lin, Y.; Chu, H. Numerical study on the effect of separated over-fire air ratio on combustion characteristics and NOx emission in a 1000 MW supercritical CO2 boiler. Energy 2019, 175, 593–603. [Google Scholar] [CrossRef]
  12. Gu, Y.; Zhao, W.; Wu, Z. Online adaptive least squares support vector machine and its application in utility boiler combustion optimization systems. J. Process Control 2011, 21, 1040–1048. [Google Scholar] [CrossRef]
  13. Tan, P.; He, B.; Zhang, C.; Rao, D.; Li, S.; Fang, Q.; Chen, G. Dynamic modeling of NOX emission in a 660 MW coal-fired boiler with long short-term memory. Energy 2019, 176, 429–436. [Google Scholar] [CrossRef]
  14. Xu, L.; Yuan, J.; Wang, J. Dynamic modeling and solution algorithm of the evaporation system for the ultra-supercritical power plant. Int. J. Heat Mass Transf. 2017, 105, 589–596. [Google Scholar] [CrossRef]
  15. Zima, W.; Nowak-Ocłoń, M.; Ocłoń, P. Simulation of fluid heating in combustion chamber waterwalls of boilers for supercritical steam parameters. Energy 2015, 92, 117–127. [Google Scholar] [CrossRef]
  16. Kim, S.; Choi, S. Dynamic simulation of the water-steam flow in a supercritical once-through boiler. J. Mech. Sci. Technol. 2017, 31, 4965–4975. [Google Scholar] [CrossRef]
  17. Wang, C.; Chen, X.; Liu, B.; Liu, K.; Han, Y.; Wang, L.; Che, D. Dynamic analysis for ultra-supercritical boiler water wall considering uneven heat flux distribution and combustion instability. Int. J. Heat Mass Transf. 2025, 236, 126269. [Google Scholar] [CrossRef]
  18. Zhu, X.; Wang, W.; Xu, W. A study of the hydrodynamic characteristics of a vertical water wall in a 2953t/h ultra-supercritical pressure boiler. Int. J. Heat Mass Transf. 2015, 86, 404–414. [Google Scholar] [CrossRef]
  19. Zhu, H.; Tan, P.; He, Z.; Ma, L.; Zhang, C.; Fang, Q.; Chen, G. Revealing steam temperature characteristics for a double-reheat unit under coal calorific value variation. Energy 2023, 283, 128530. [Google Scholar] [CrossRef]
  20. Müller-Steinhagen, H.; Heck, K. A simple friction pressure-drop correlation for 2-phase flow in pipes. Chem. Eng. Process.-Process Intensif. 1986, 20, 297–308. [Google Scholar] [CrossRef]
  21. Colebrook, C.F.; White, C.M. Experiments with fluid friction in roughened pipes. Proc. R. Soc. Lond. Ser. A Math. Phys. Sci. 1937, 161, 367–381. [Google Scholar] [CrossRef]
  22. Gnielinski, V. New Equations for Heat and Mass Transfer in Turbulent Pipe and Channel Flows. Int. Chem. Eng. 1976, 16, 359–368. [Google Scholar]
  23. Steiner, D.; Taborek, J. Flow Boiling Heat Transfer in Vertical Tubes Correlated by an Asymptotic Model. Heat Transf. Eng. 1992, 13, 43–69. [Google Scholar] [CrossRef]
  24. Filonenko, G.K. Hydraulic resistance in pipes. Teploenergetika 1954, 1, 40–44. [Google Scholar]
Figure 1. Structure of the boiler furnace.
Energies 17 05349 g001
Figure 2. Schematic diagram of the section division in the furnace and the elevation of each layer.
Energies 17 05349 g002
Figure 3. Influence of OFA ratio on flue gas temperature distribution.
Energies 17 05349 g003
Figure 4. Influence of OFA ratio on fluid temperature distribution.
Energies 17 05349 g004
Figure 5. Influence of coal calorific value on flue gas temperature distribution.
Energies 17 05349 g005
Figure 6. Influence of coal calorific value on fluid temperature distribution.
Energies 17 05349 g006
Figure 7. Dynamic characteristics of the furnace outlet flue gas temperature when the coal feeding rate is suddenly changed.
Energies 17 05349 g007
Figure 8. Dynamic characteristics of the WCW outlet parameters when the coal feeding rate is suddenly changed.
Energies 17 05349 g008
Figure 9. Dynamic characteristics of the furnace outlet flue gas temperature when the air flow rate is suddenly changed.
Energies 17 05349 g009
Figure 10. Dynamic characteristics of the WCW outlet parameters when the air flow rate is suddenly changed.
Energies 17 05349 g010
Figure 11. Dynamic characteristics of the WCW outlet parameters when feedwater flow rate is suddenly changed.
Energies 17 05349 g011
Figure 12. Dynamic characteristics of the WCW outlet parameters when feedwater temperature is suddenly changed.
Energies 17 05349 g012
Figure 13. Comparison of changes in the length of the evaporation section with time under different conditions.
Energies 17 05349 g013
Table 1. Main parameters under different operating conditions.
ItemsBMCRTHA75% THA50% THA
Feedwater flow rate/t·h−12104.91842.81337.8879.8
Feedwater temperature/°C342.0330310290.0
Feedwater pressure/MPa33.332.223.815.9
Coal feeding rate/t·h−1310.8282.42215.41150.1
Total air flow rate/kg·s−1601.7541.6424.1321.5
Separator pressure/MPa31.831.022.915.3
Separator temperature/°C438436411358
Table 2. Component analysis and LHV of the design coal.
Component AnalysisLHV/
MJ·kg−1
Car/%Har/%Oar/%Nar/%Sar/%Mar/%Aar/%
48.633.279.070.840.7511.426.0418.52
Table 3. Comparison of simulated result with design data under different working conditions.
Working ConditionsDesign Value/°CSimulated Results/°CRelative Error/%
BMCR438438.40.09%
THA436427.41.97%
75% THA411399.12.90%
50% THA358358.20.05%
Table 4. Location of phase transition points for different OFA ratios under the 50% THA condition.
OFA Ratio20%30%40%46.7%50%60%
Boiling point height/m22.5923.1323.1323.6723.6723.67
Dryout point height/m57.6459.1159.1162.0662.0662.0
Length of evaporation section/m35.0135.935.9838.3938.3938.39
Table 5. Location of phase transition points for different coal calorific values under the 50% THA condition.
Coal Calorific Value−10%−5%0%+5%+10%
Boiling point height/m23.6723.6723.6723.6723.67
Dryout point height/m73.8667.9662.0657.6355.19
Length of evaporation section/m50.1944.2938.3933.9731.51
Table 6. Results of the PTP position after the change in coal feeding rate.
Coal Feeding Rate−9%−6%−3%0%+3%+6%+9%
Boiling point height/m23.1323.1323.1323.1323.1323.1323.13
Dryout point height/m70.9166.4963.5460.5957.6456.3355.19
Length of evaporation section/m47.7843.3640.4137.4634.5133.232.06
Table 7. Results of the PTP position after the change in air flow rate.
Air Flow Rate−9%−6%−3%0%+3%+6%+9%
Boiling point height/m23.6723.6723.1323.1322.5922.5922.59
Dryout point height/m59.1159.1160.5960.5960.5962.0662.06
Length of evaporation section/m35.4435.4437.4637.463839.4839.48
Table 8. Results of the PTP position after the change in feedwater flow rate.
Feedwater Flow Rate−9%−6%−3%0%+3%+6%+9%
Boiling point height/m22.0422.5922.5923.1323.1323.6724.22
Dryout point height/m37.5354.4365.7160.5963.5467.9670.92
Length of evaporation section/m15.4931.8434.1237.4640.4144.2946.7
Table 9. Results of the PTP position after the change in feedwater temperature.
Feedwater Temperature−9%−6%−3%0%+3%+6%+9%
Boiling point height/m27.1725.7524.2123.1321.520.4119.05
Dryout point height/m72.3967.9665.0160.5956.3353.6737.53
Length of evaporation section/m45.2242.2140.837.4634.8333.2618.48
Table 10. Change in the position of the phase transition point.
Pre-DisturbanceCoal Feeding Rate DisturbanceFeedwater Flow Rate DisturbanceFeedwater Temperature DisturbanceAir Feeding Rate Disturbance
Boiling point height/m23.1323.1323.1321.522.59
Dryout point height/m60.5957.6463.5456.3360.59
Length of evaporation section/m37.4634.5140.4134.8438
Disclaimer/Publisher’s Note: The statements, opinions and data contained in all publications are solely those of the individual author(s) and contributor(s) and not of MDPI and/or the editor(s). MDPI and/or the editor(s) disclaim responsibility for any injury to people or property resulting from any ideas, methods, instructions or products referred to in the content.

