Abstract
The short-circuit (SC) immunity of power silicon carbide (SiC) MOSFETs is critical for high-reliability applications, where robust monitoring and protection strategies are essential to ensure system safety. Despite their superior voltage blocking capabilities and high energy efficiency, SiC MOSFETs exhibit greater sensitivity to SC-induced degradation compared to their silicon counterparts. This increased vulnerability necessitates the precise assessment of the key SC performance metrics, such as short-circuit withstand time (), as well as a deeper understanding of the failure mechanisms. In this study, a comprehensive experimental methodology for evaluating the SC behavior of SiC MOSFETs is presented and validated using industrial references. The investigation further explores the concept of a Safe Operating Area (SOA) under SC conditions, highlighting the significant impact of quasi-simultaneous SC events on device lifetime. Additionally, an application case study demonstrates how these events can drastically reduce the device’s lifespan.
1. Introduction
The massive electrification of future mobility demands drastic improvements in power electronics by enhancing power density and efficiency without compromising the inherent dependability and safety, especially for critical sectors such as automotive, rail, aeronautic, and electric grids alike. Shortcomings in SiC MOSFETs’ specific failure mechanisms in terms of understanding and adapted test methodologies, taking into account the usage profiles, are hindering their full commercial deployment. Design rules taking into account stress effects on safety margins and models for predicting the component lifetime are needed.
A reliable operation level of the power device must be guaranteed, especially in severe conditions. SiC MOSFETs present a significantly higher current density (A/cm2) compared to their Si (IGBT) counterparts. Thereby, the high short-circuit current generates extreme temperature constraints. Compared to Si devices, this effect is indeed much more pronounced for SiC devices due to their thermal properties and the reduced die size, hence leading to a likely total device failure much earlier than for a Si device of equivalent current ratings. In fact, regarding legacy packaging, where the number of bond wires per unit area is limited by the available source metalization area, systematic current overcrowding takes place at the die source interconnection. Hence, the short-circuit withstand time of standard SiC MOSFETs is much lower than that of silicon devices [1].
A comprehensive study on SC reliability issues is presented in [2]. The gate voltage reduction that resulted from the higher gate leakage current is widely discussed for older technology generations. This phenomenon is due to the smaller gate thicknesses of SiC MOSFETs and then triggered by the high-power dissipation from the short-circuit condition. This failure mode is interesting from an application point of view since the device can still withstand SC events and can be associated with the melting of the gate metalization [3]. The failure mechanisms of commercial 1200 V SiC MOSFETs focusing on repetitive SC were studied in [4] based on experimental tests and electrothermal simulations. This study highlights the failure mechanism characterized by hot holes trapped in the gate oxide above the channel region.
According to the experimental results on SiC-based power modules, two different failure mechanisms, such as thermal runaway and Interlayer Dielectric (ILD) degradation, both reducing the short-circuit capability, were identified in [5]. In the same reference, the concept of SC-SOA based on gate source voltage depolarization and SC current capability reduction was also presented.
Silicon IGBT presents thermal runaway as the major failure mode due to the high leakage currents and temperature [6]. For SiC devices, a second failure mode linked to the fatigue accumulation on the deposited layer, usually ILD, was observed [7]. Both failure mechanisms are in place and compete timewise with each other. The relation between the well-studied failure mechanisms of SiC MOSFETs was discussed in [8]. It was demonstrated that, when the SC time is shorter than the critical time, cracking mode failure occurs at the gate level. However, when the SC time is longer than the critical time, the stresses acting on the gate are lower than the fracture stress limit of the oxide.
Moreover, it seems that, for low/medium voltages (lower than of the device voltage rating), the time required for a thermal runaway is longer than that necessary to damage the ILD [9]. On the contrary, for higher voltages instead (closer to the device voltage rating), the time required for a thermal runaway is drastically reduced, and this failure mechanism appears to be the dominant phenomenon. In order to provide more exhaustive comprehension of this phenomena, in this study, a fully instrumented test bench has been used.
Accelerated tests and several investigations have already been carried out on this topic; however, a systematic methodology to assess the SC of SiC MOSFETs has never been proposed. In this paper, the results of an extensive study concerning short-circuit assessment issues from the SiCRET project (the SiC Reliability Evaluation for Transport project is a large French public–private initiative that represents the first national project entirely and only dedicated to address the “reliability” of SiC MOSFETs) will be presented.
The structure of this paper is divided into two main topics: the proposed test methodology and the investigation of specific occurrences of SC events characterized by very short duration and high-frequency repetition. The paper begins by detailing the SC assessment protocol for SiC MOSFETs. To demonstrate the methodology, two case studies are presented, focusing on a 1200 V SiC MOSFET operating at 600 V and 900 V drain–source voltages, corresponding to and of the device’s rated voltage. A more in-depth investigation is conducted at 900 V as this voltage range represents more practical operating conditions for these devices. Repetitive SC tests with varying pulse width percentages of are performed to determine the maximum number of SC events the device can tolerate. The degradation of the device is illustrated by a sudden drop in its current-handling capability during SC events. Similar failure mechanisms are observed for both the 600 V and 900 V cases. The final section applies the methodology to investigate a specific SC condition in a SiC-MOSFET-based phase-leg with synchronous operation, which may experience quasi-simultaneous SC events due to cross-coupling, significantly affecting device lifetime.
2. Short-Circuit Assessment Methodology
In order to assess the health of the DUT under SC operation, the hereby proposed methodology is based on the in situ recording of the main device parameters, such as current and voltage at the terminals. The device degradation or damage under SC stress can be investigated either under single or repetitive SC events. In fact, by controlling the SC stress features, such as duration delay time, frequency, and number of events, the degradation can be progressively induced and very accurately monitored on the DUT. On the contrary, with respect to classical SC test assessment [10], where the DUT is instantaneously brought to catastrophic failure, this methodology allows one to assess the degradation and the associated physics of failure induced from any arbitrary SC stress. In the following section, the test bench used to carry out this investigation is presented.
2.1. Power Test Bench
The test bench presented here is adapted to SiC MOSFET devices of 1200 V and 1000 A maximum ratings with a 3 leads TO-247 case type [11]. This choice was driven by the large availability and selection of SiC MOSFET devices with these characteristics and the increasing penetration of these voltage ratings in mainstream SiC device market, such as automotive. The test bench can be generalized and adapted to other voltage and current rates if necessary.
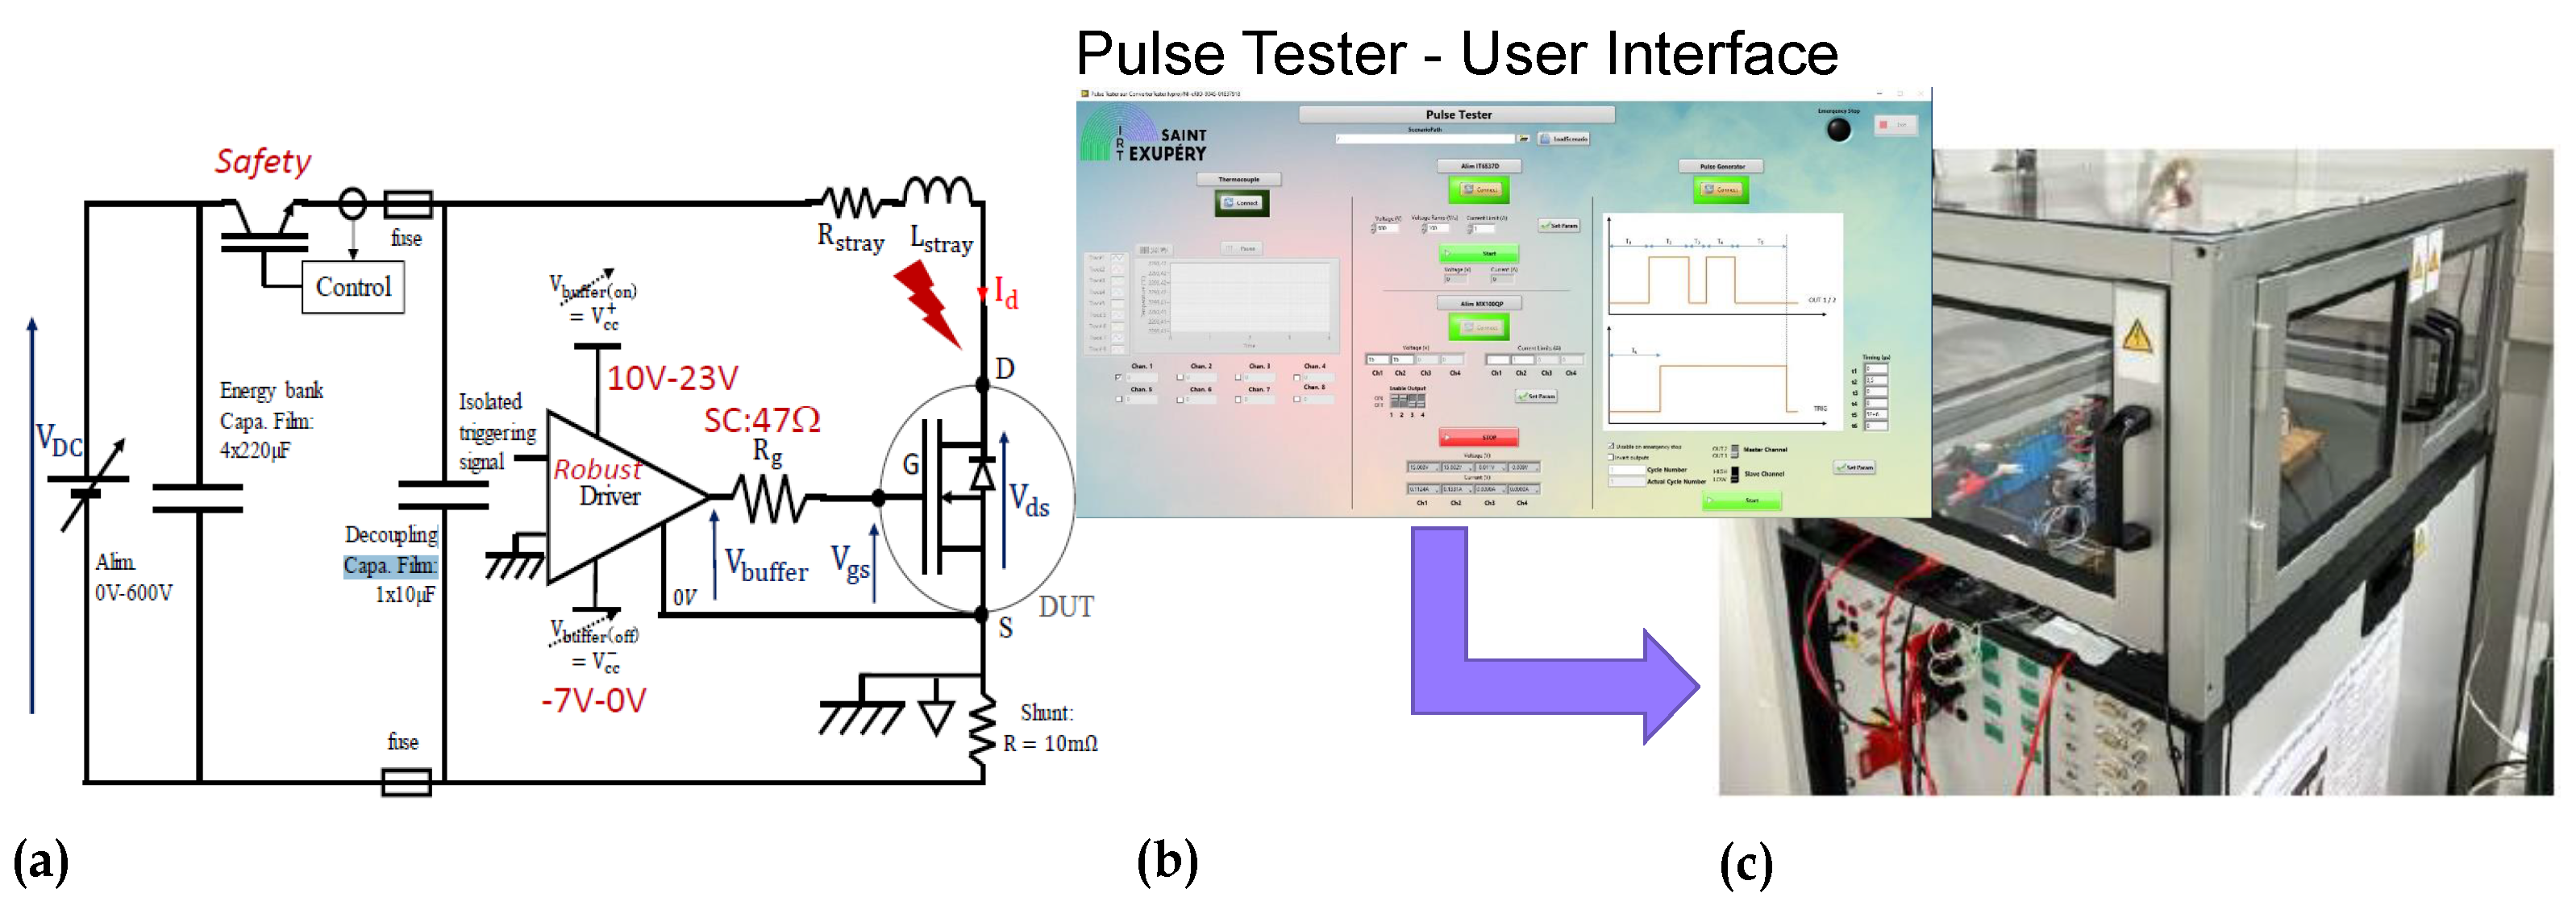
The device is positioned on the low side of a phase-leg power test bench, as shown in Figure 1. This setup enables SC tests to be conducted at voltages of up to 900 V. A protection system, consisting of two IGBTs connected in parallel as a circuit breaker, is employed to cut off the current in the event of thermal runaway. The gate–source voltage () and output–drive voltage () are monitored using a Rohde & Schwarz RT-ZP10-400 V probe with a 500 MHz bandwidth. The drain–source voltage () is measured via a Testec HV 250–2500 V probe with a 300 MHz bandwidth, while the drain–source current () is recorded using a T&M Research SDN-414-01, 6 J, 400 MHz coaxial shunt. The gate current () is estimated by measuring the voltage drop across the gate resistance.
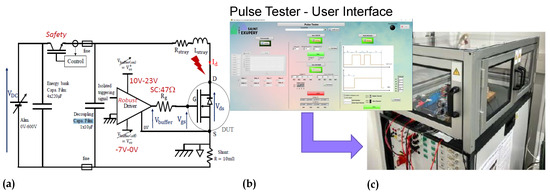
Figure 1.
(a) Electrical schematic of the test bench. A controlled IGBT is used as circuit breaker [11]. (b) The Pulse Tester User Interface developed at IRT Saint Exupery. This internally developed software enables controlling applied signals and . (c) Picture of electrical bay for short-circuit test bench (based in IRT Saint Exupery, Toulouse, France).
2.2. Test Assessment Protocol
In order to systematically assess the SC capability of an arbitrary SIC MOSFET, a general protocol has been developed and applied. The protocol is broken down into 5 main steps, which are presented as follows:
- STEP 0: Identification of the main applied stressors (e.g., , , ) and environmental parameters: the role of the main electrical stressors and environmental parameters (e.g., case temperature) should be analyzed and taken into account.
- STEP 1: Determine the Short-Circuit Withstand Time () on samples with different threshold voltages (). This procedure should be carried out for different drain–source voltages (). For this purpose, , , and of the device voltage rating are typically selected.
- STEP 2: Determine the Maximum SC Number of Pulses () according to a given fraction (—see here after) of the without reaching a failure. Noteworthy is that DC and AC characterization (tracking parameters—TP) of the device before/after SC tests are performed. In addition, in situ readouts must be conducted (for instance, , , and ). Here, = , , and have been chosen, while the main TPs are SC energy (), maximum SC drain–source current , , and .
- STEP 3: Aging protocol for tracking the performances of the DUT over time. The evolution of TPs is monitored by means of arbitrarily chosen acceptance intervals (compliance mask). However, a refinement must be considered (need to track graph evolution). Here, the compliance mask is based on and drops.
- STEP 4: Failure analysis in order to identify device damage, failure modes, and failure mechanisms. Here, failure analysis has been performed on devices with different stress time in order to monitor the degradation evolution.
3. Deployment of the SC Assessment Methodology
In the following section, the aforementioned methodology will be applied to illustrate its capabilities and demonstrate its validity. For the sake of demonstration, the DUT taken into account is a SiC MOSFET 1200 V, m, planar-type, in an automotive-grade 3-lead TO-247 package. The tests are performed with the DUT at room temperature. A large number of samples (more than 500) have been investigated in the studies presented in the following sections. The devices have been previously fully characterized; however, no preselection or sorting has been applied for the different studies.
3.1. Short-Circuit Test at Low-Medium Voltages (400–600 V)
Following the proposed methodology, a test campaign was conducted to assess the influence of electrical parameters on short-circuit behavior (STEP 0). After a preliminary analysis, the drain–source voltage () demonstrated high sensitivity to short-circuit behavior and will therefore be studied further.
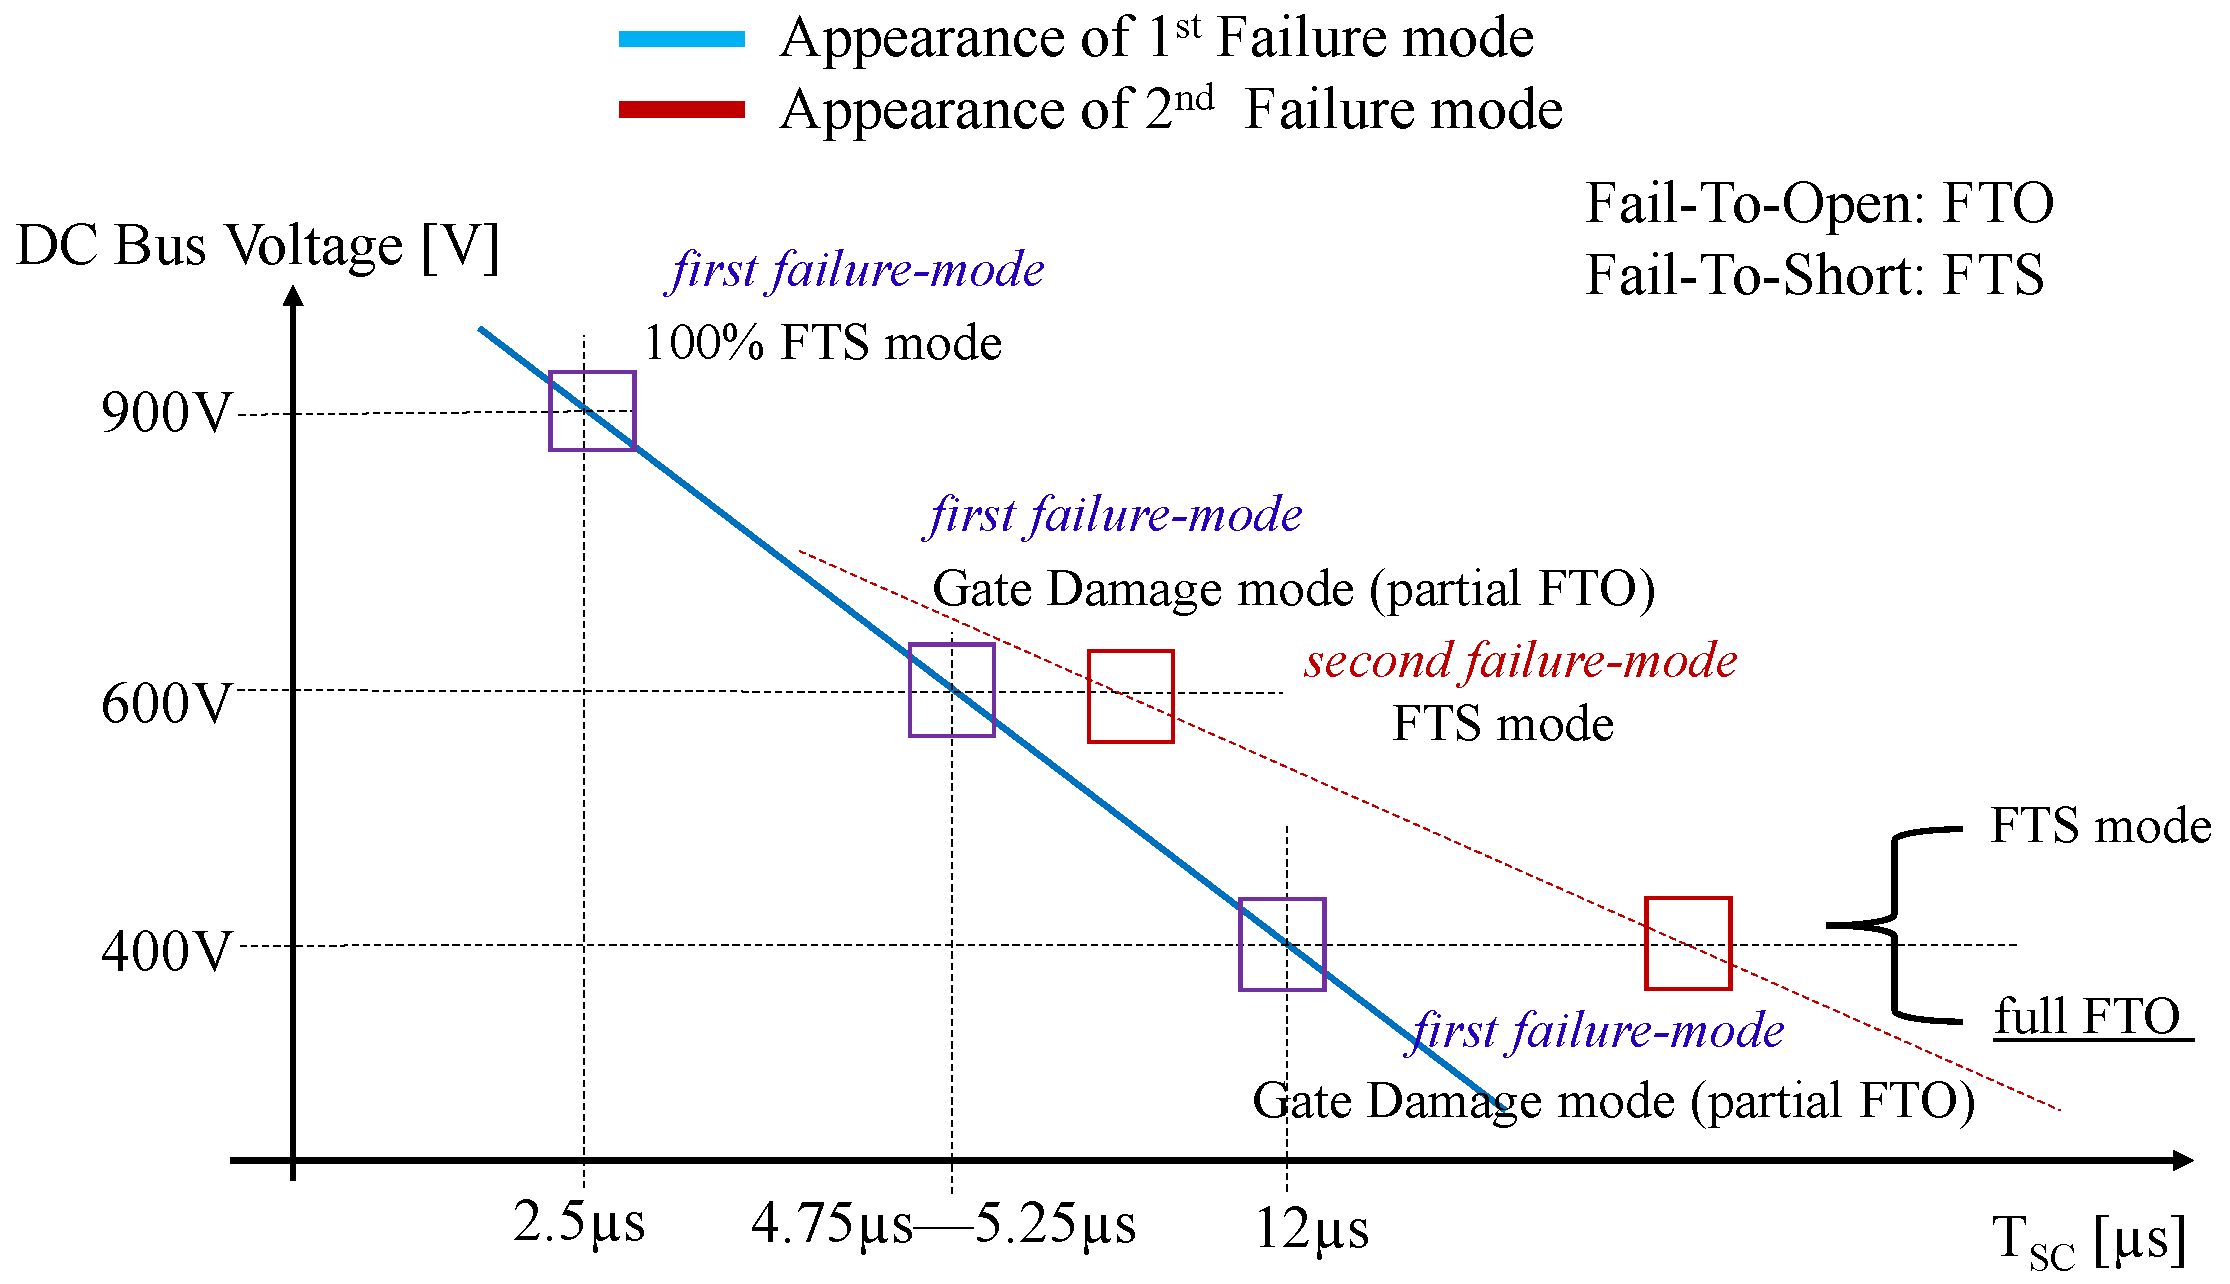
Three different voltage levels have been performed in order to detect the reference parameter (STEP 1), as shown in Figure 2. Fail-to-Short (FTS) mode is the consequence of the thermal runaway and yields a device channel always in on state [12]. On the other hand, Fail-to-Open (FTO) mode results in a device channel always blocked in an off state. This can be attributed to the progressive Inter-layer Dielectric (ILD) cracks formation induced by the thermo-mechanical stresses accumulation or the aluminum (Al) migration towards gate contact [13,14]. These degradations produce the partial shorting of the gate and source terminals [9].
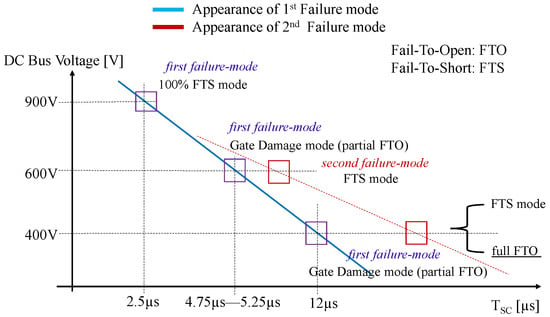
Figure 2.
Failure modes and associated with different operation points (single SC).
The first failure detected for 400 V and 600 V corresponds to a gate damage, thus in an FTO mode. These SC pulse widths are considered to define the short-circuit capability of the device. Larger SC pulses may generally lead to thermal runaway failure, hence total destruction. If catastrophic failure does not occur, the devices sustain gate damage, although drain–source isolation is maintained.
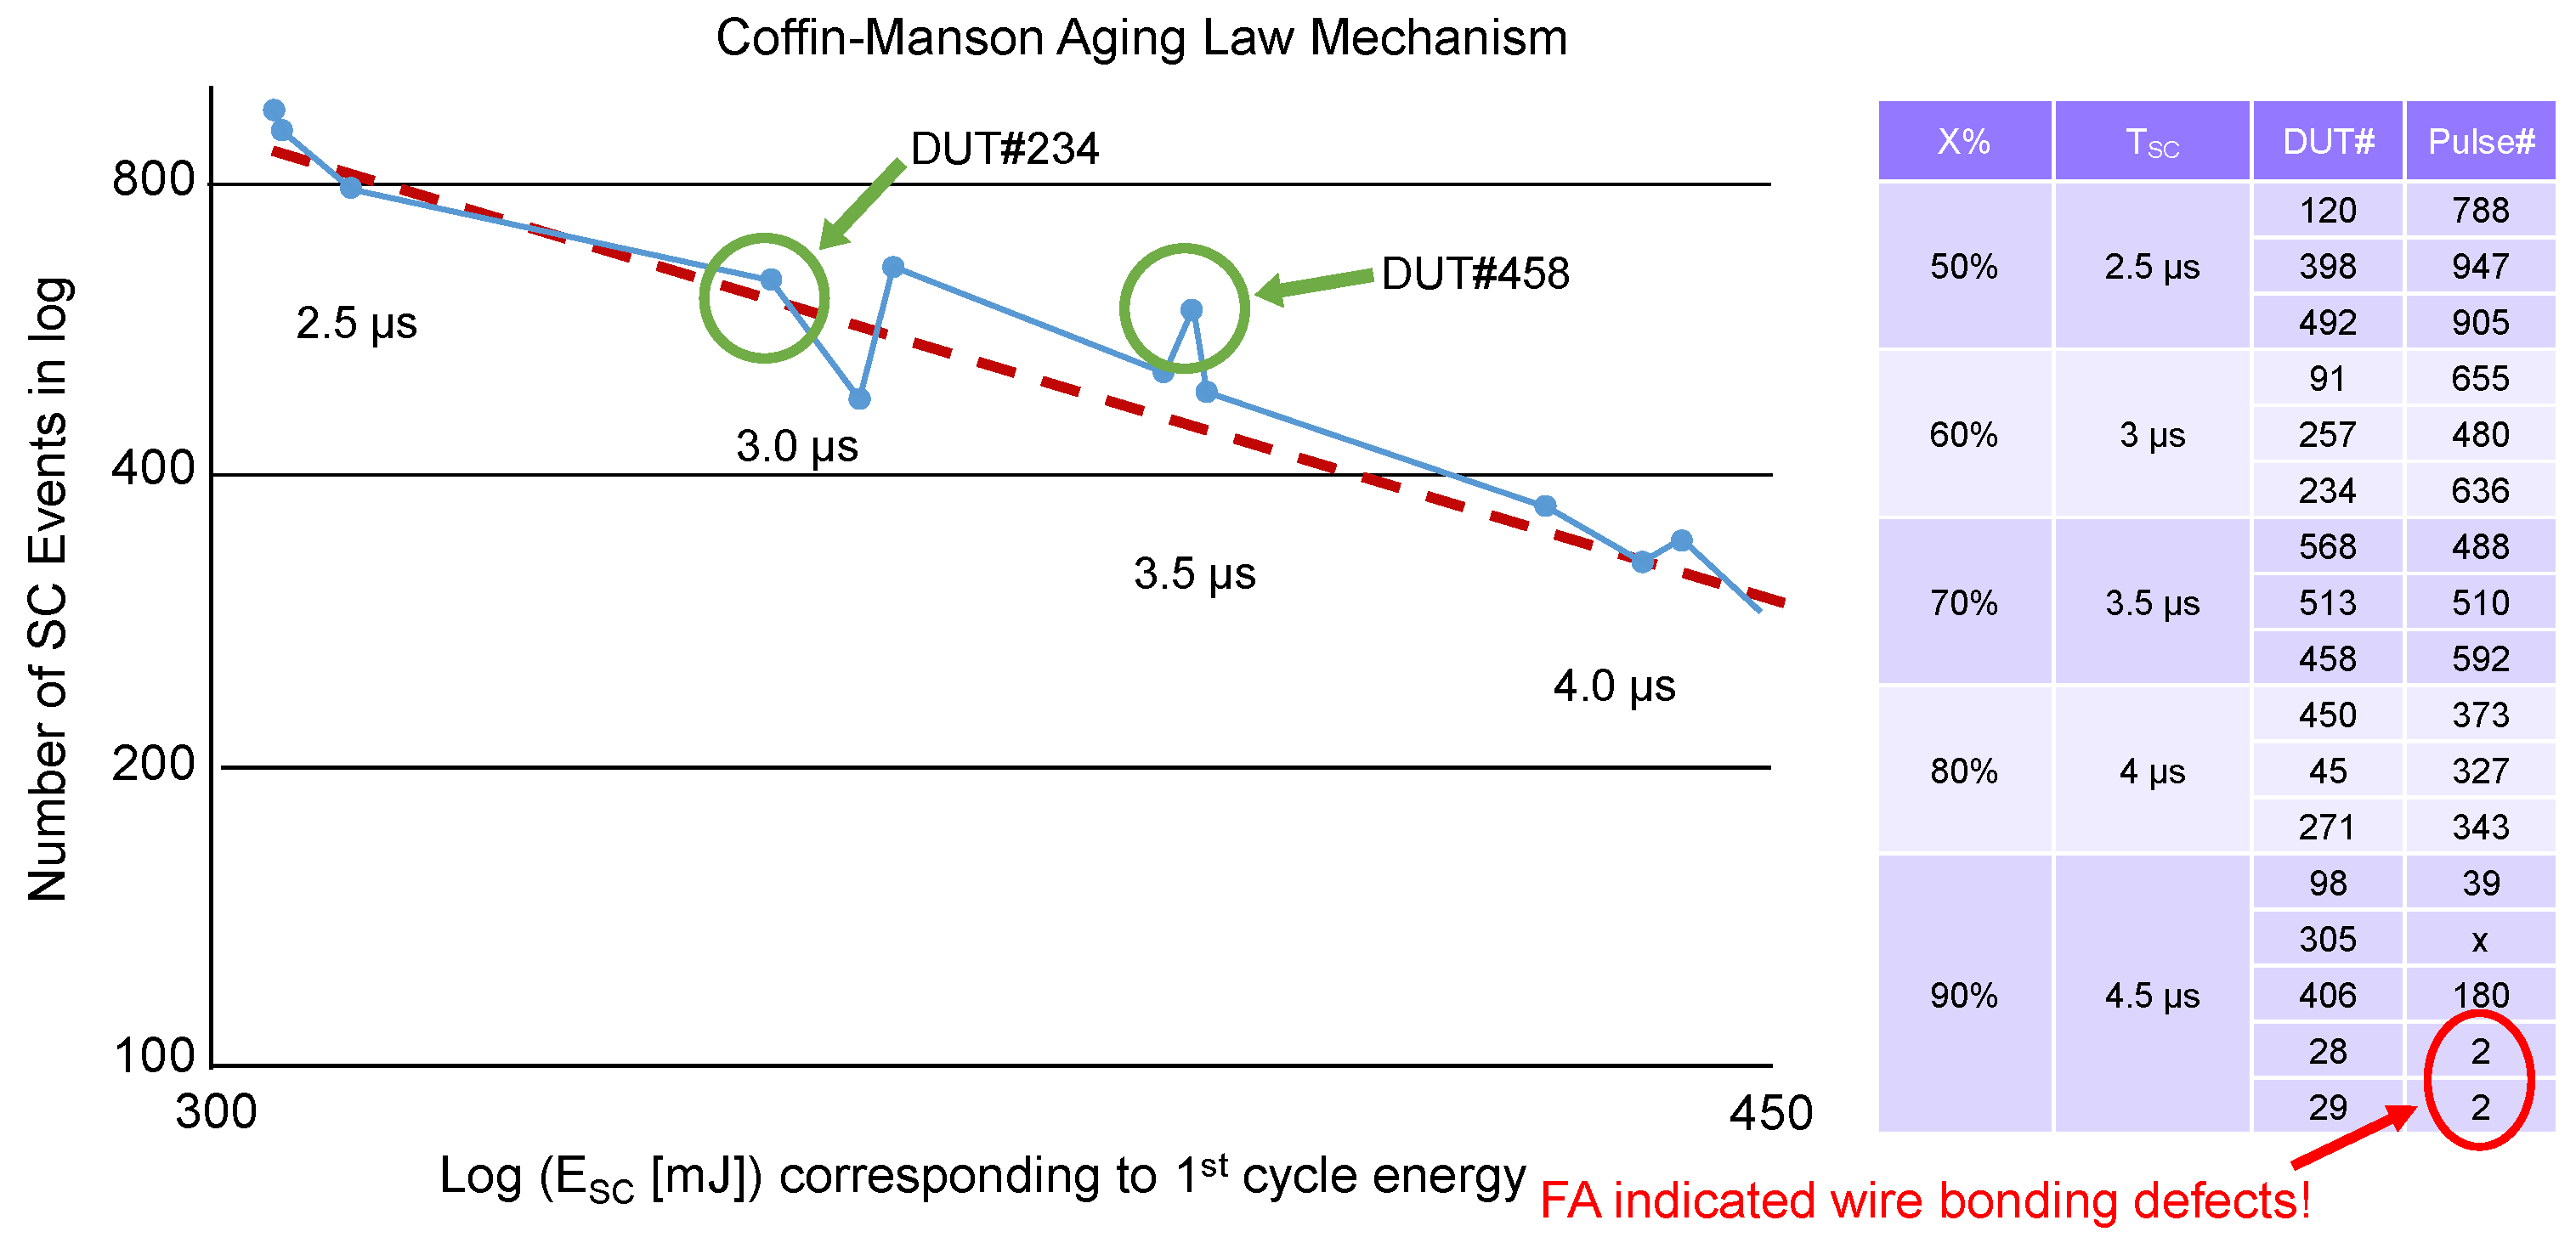
Additionally, repetitive SC pulses (STEP 2) are applied to the device in order to correlate the number of SC events to the SC critical energy corresponding to the first failure. Figure 3 shows a Coffin–Manson aging law [15] where the same failure mechanism defines a power law with fixed parameters (, , and ) and under different pulse widths. The dotted line plotted using the experimental data shows very close behavior, indicating that the aging mechanism for the device very likely follows the same model.
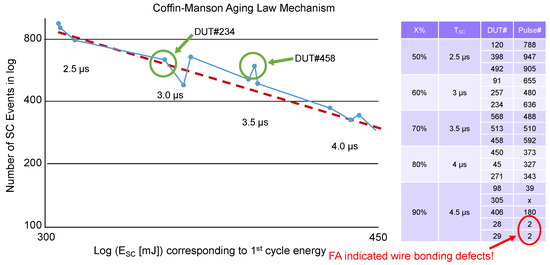
Figure 3.
Number of SC events as a function of the SC critical energy. Different pulse widths are applied to the DUTs. In the table, the number of SC events are presented (Pulse#) up to failure according to different SC pulse widths () based on a certain percentage (X%) of . The dotted red line illustrates the Coffin-Manson law mechanism under various test conditions.
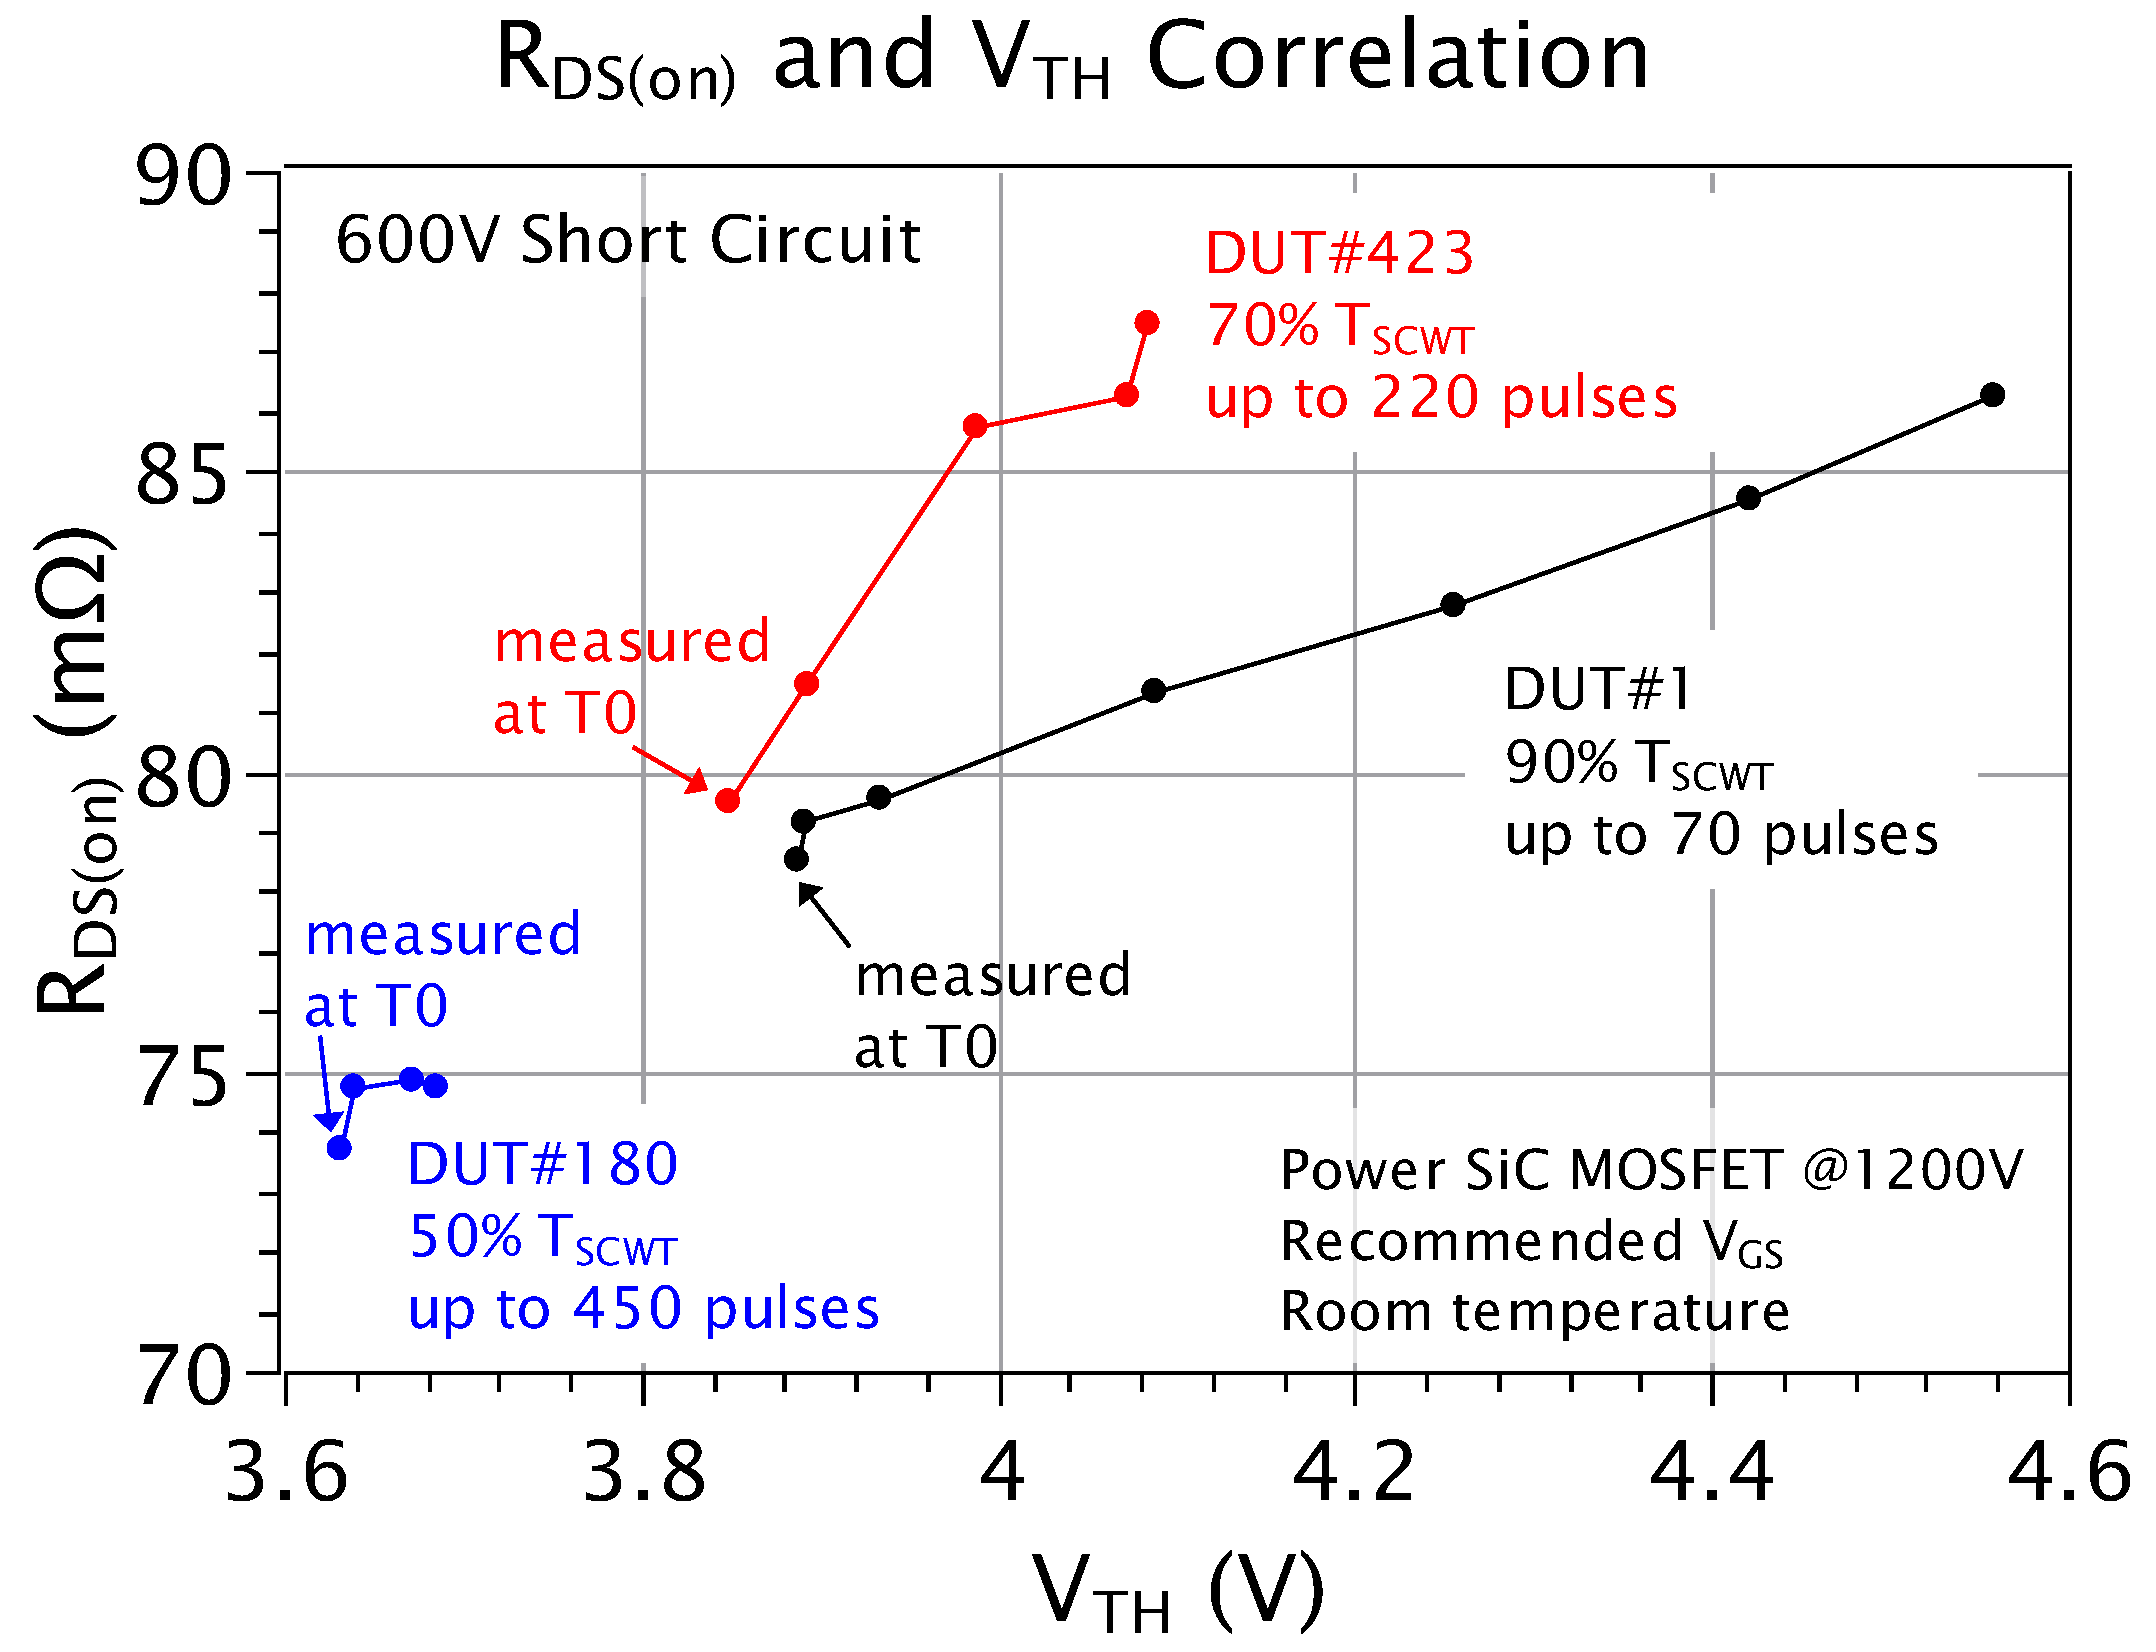
A correlation between and drifts for different SC pulses width (, and of ) is seen in Figure 4.
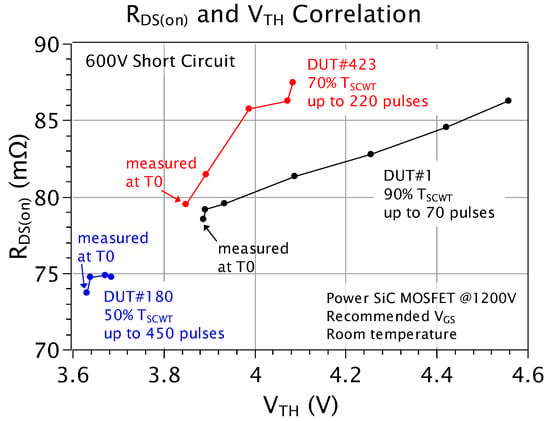
Figure 4.
Correlation between on resistance and threshold voltage of a SiC MOSFET. It is possible to observe the same positive trend for both parameters with SC events.
All samples were tested up to their catastrophic breakdown. For all cases, a rather proportional relation is observed between the on resistance and threshold voltage, consequence of a conduction loss increase on the device. The proportional relation seems to show that carrier trapping near the gate oxide channel is induced by shorter SCs.
An aging protocol (STEP 3) for tracking the performances of the DUT over time is proposed to better understand the behavior of the considered DUT under a defined SC stress condition. Different tracking parameters are monitored before and after SC stress, such as the gate leakage current (), the drain leakage current (), the threshold voltage (), and the output capacitance (). The input parameters for SC test are defined as follows. The number of pulses (SC events) is based on the previous results (STEP 2), which showed that 400 SC events did not lead to device destruction.
- Number of Pulses = 400;
- Applied Voltage () = 600 V;
- Gate–source Voltage () = V/18 V;
- ;
- Pulse width () = µs;
- Waiting time = 5 s (between pulses).
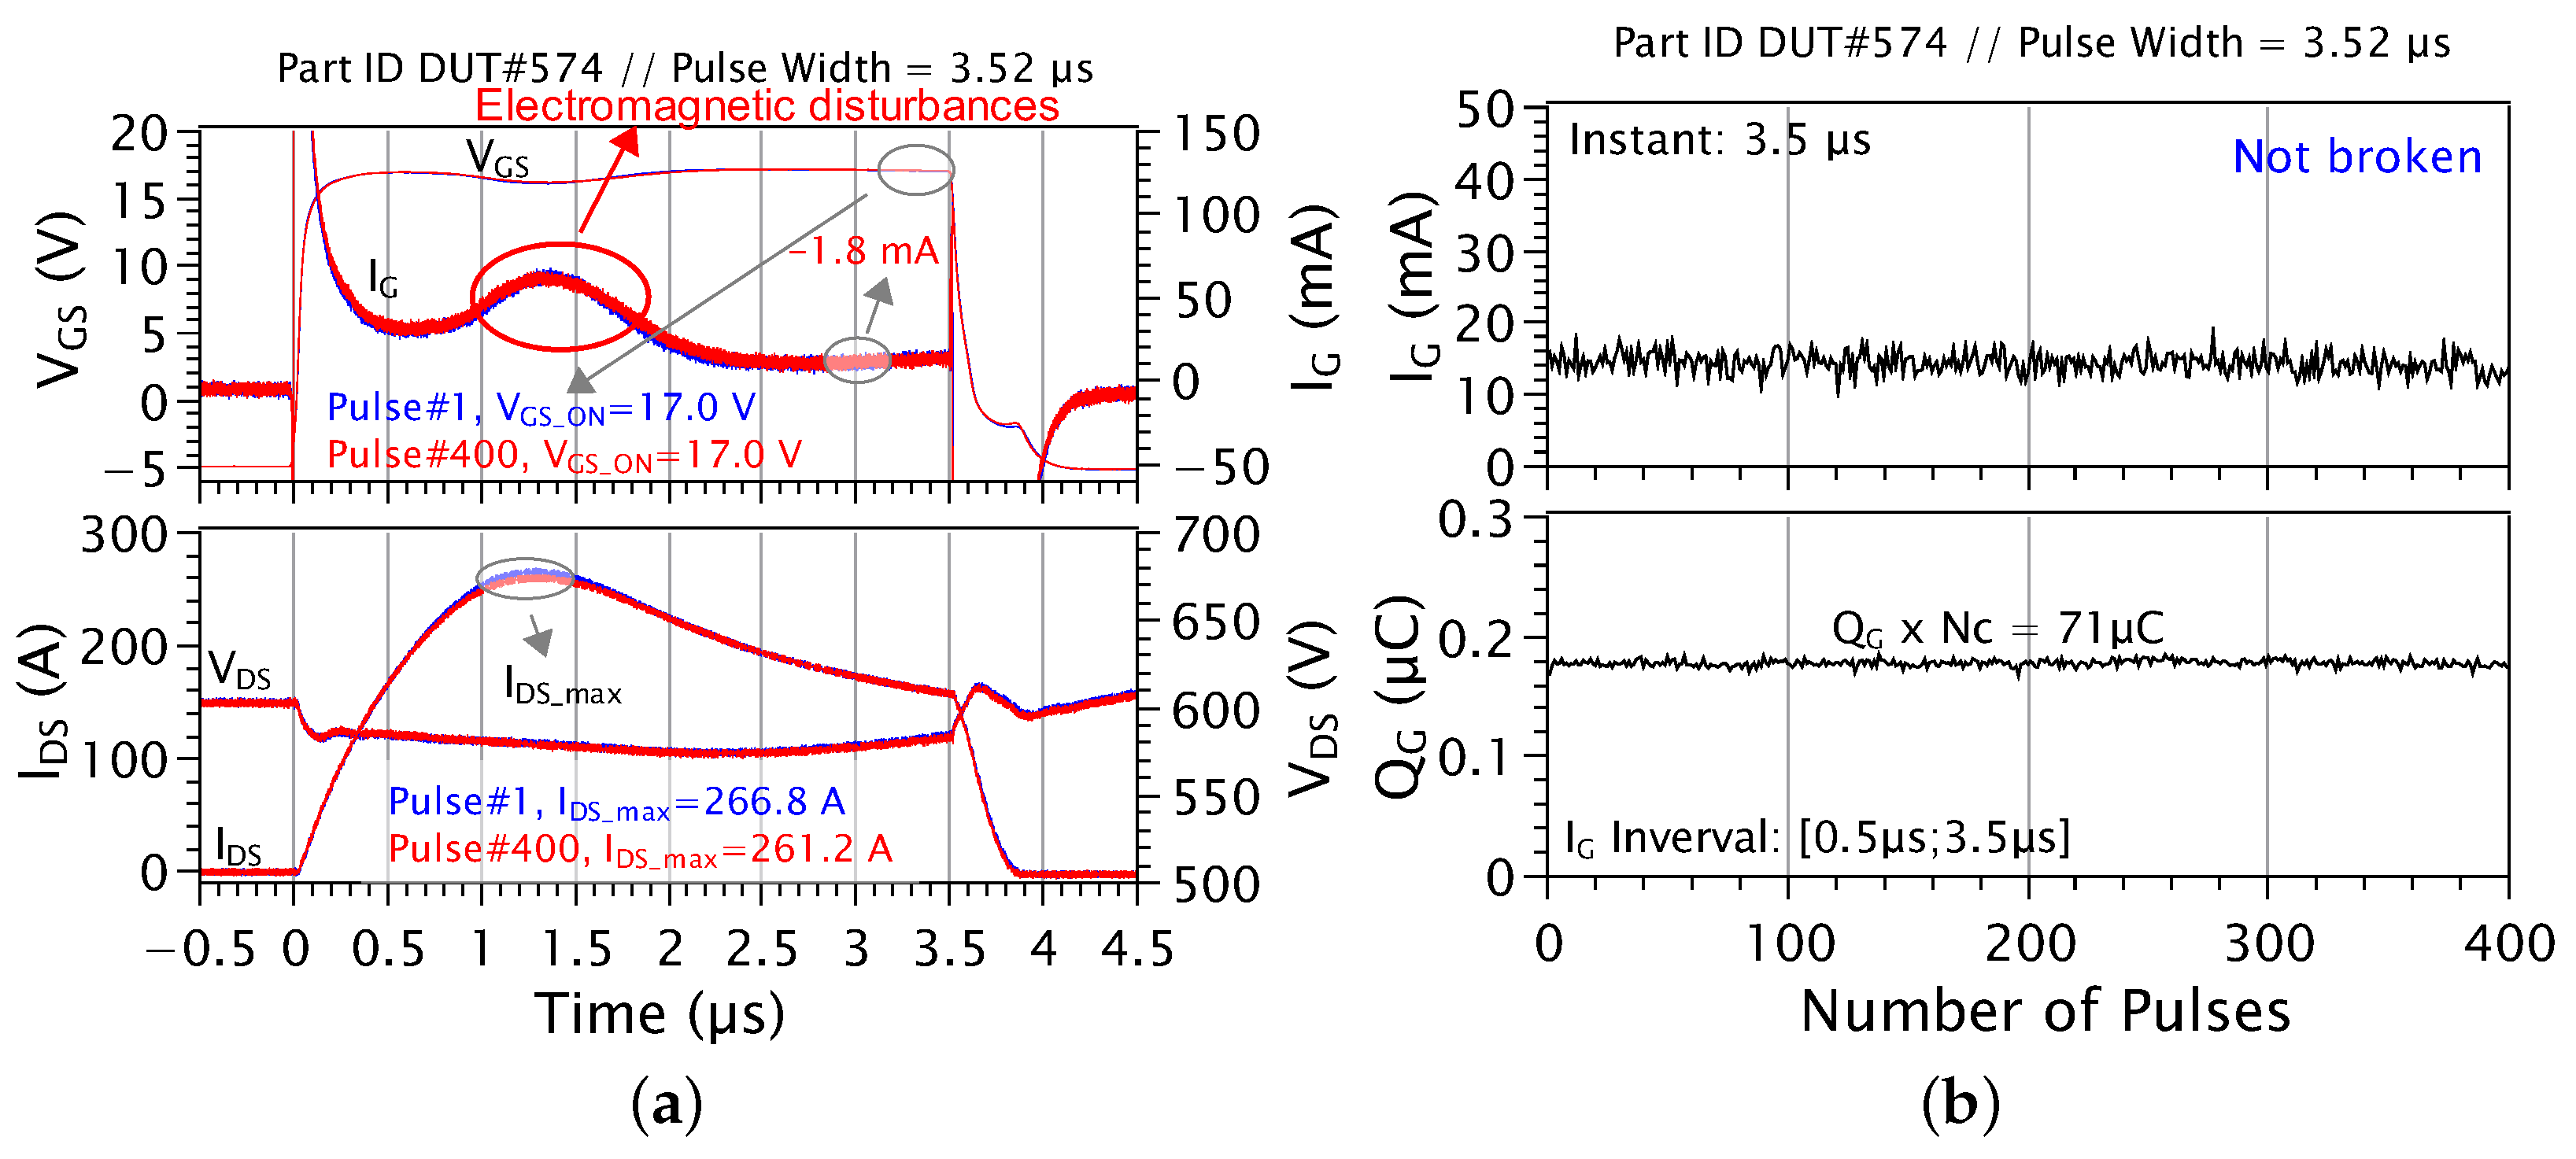
In Figure 5, the waveforms from the first short-circuit event (blue lines) and the final event (red lines) of this test are depicted. The abnormal effect observed on the gate current, specifically the current bump, is likely caused by electromagnetic interference stemming from parasitic elements on the Printed Circuit Board (PCB) and the corresponding common mode current. The decrease in the drain–source current peak between the initial and final cycles is attributed to the self-heating of the device. To prevent self-heating during repeated cycles, a waiting period between SC events is established by monitoring the temperature with a thermocouple. It is also important to note that this phenomenon is not indicative of degradation but rather a reversible effect.
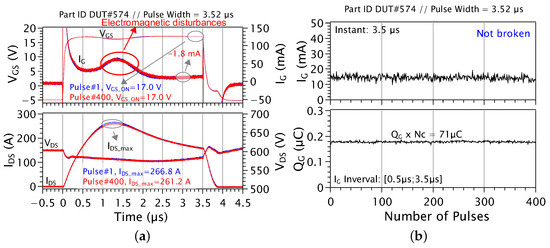
Figure 5.
(a) Online measurements of drain–source current/voltage ( and ) and gate–source voltage (). (b) It is observed that the estimated gate current () remains nearly constant between Pulse#1 and Pulse#400 for all devices (10 samples). In addition, the gate charge () is calculated based on the total number of SC events.
The gate current is measured at the end of each pulse (at s) to detect any variations throughout the repetitive SCs. Additionally, the gate charge is calculated. This test is part of an aging protocol aimed at evaluating the evolution of static and dynamic parameters such as leakage drain/gate current, output capacitance, and more. In these assessments, the threshold voltage exhibited a maximum variation of approximately . The Time-Dependent Gate Oxide Breakdown (TDDB) was also monitored, showing no impact after aging [16], which underscores the strong robustness of the gate oxide ().
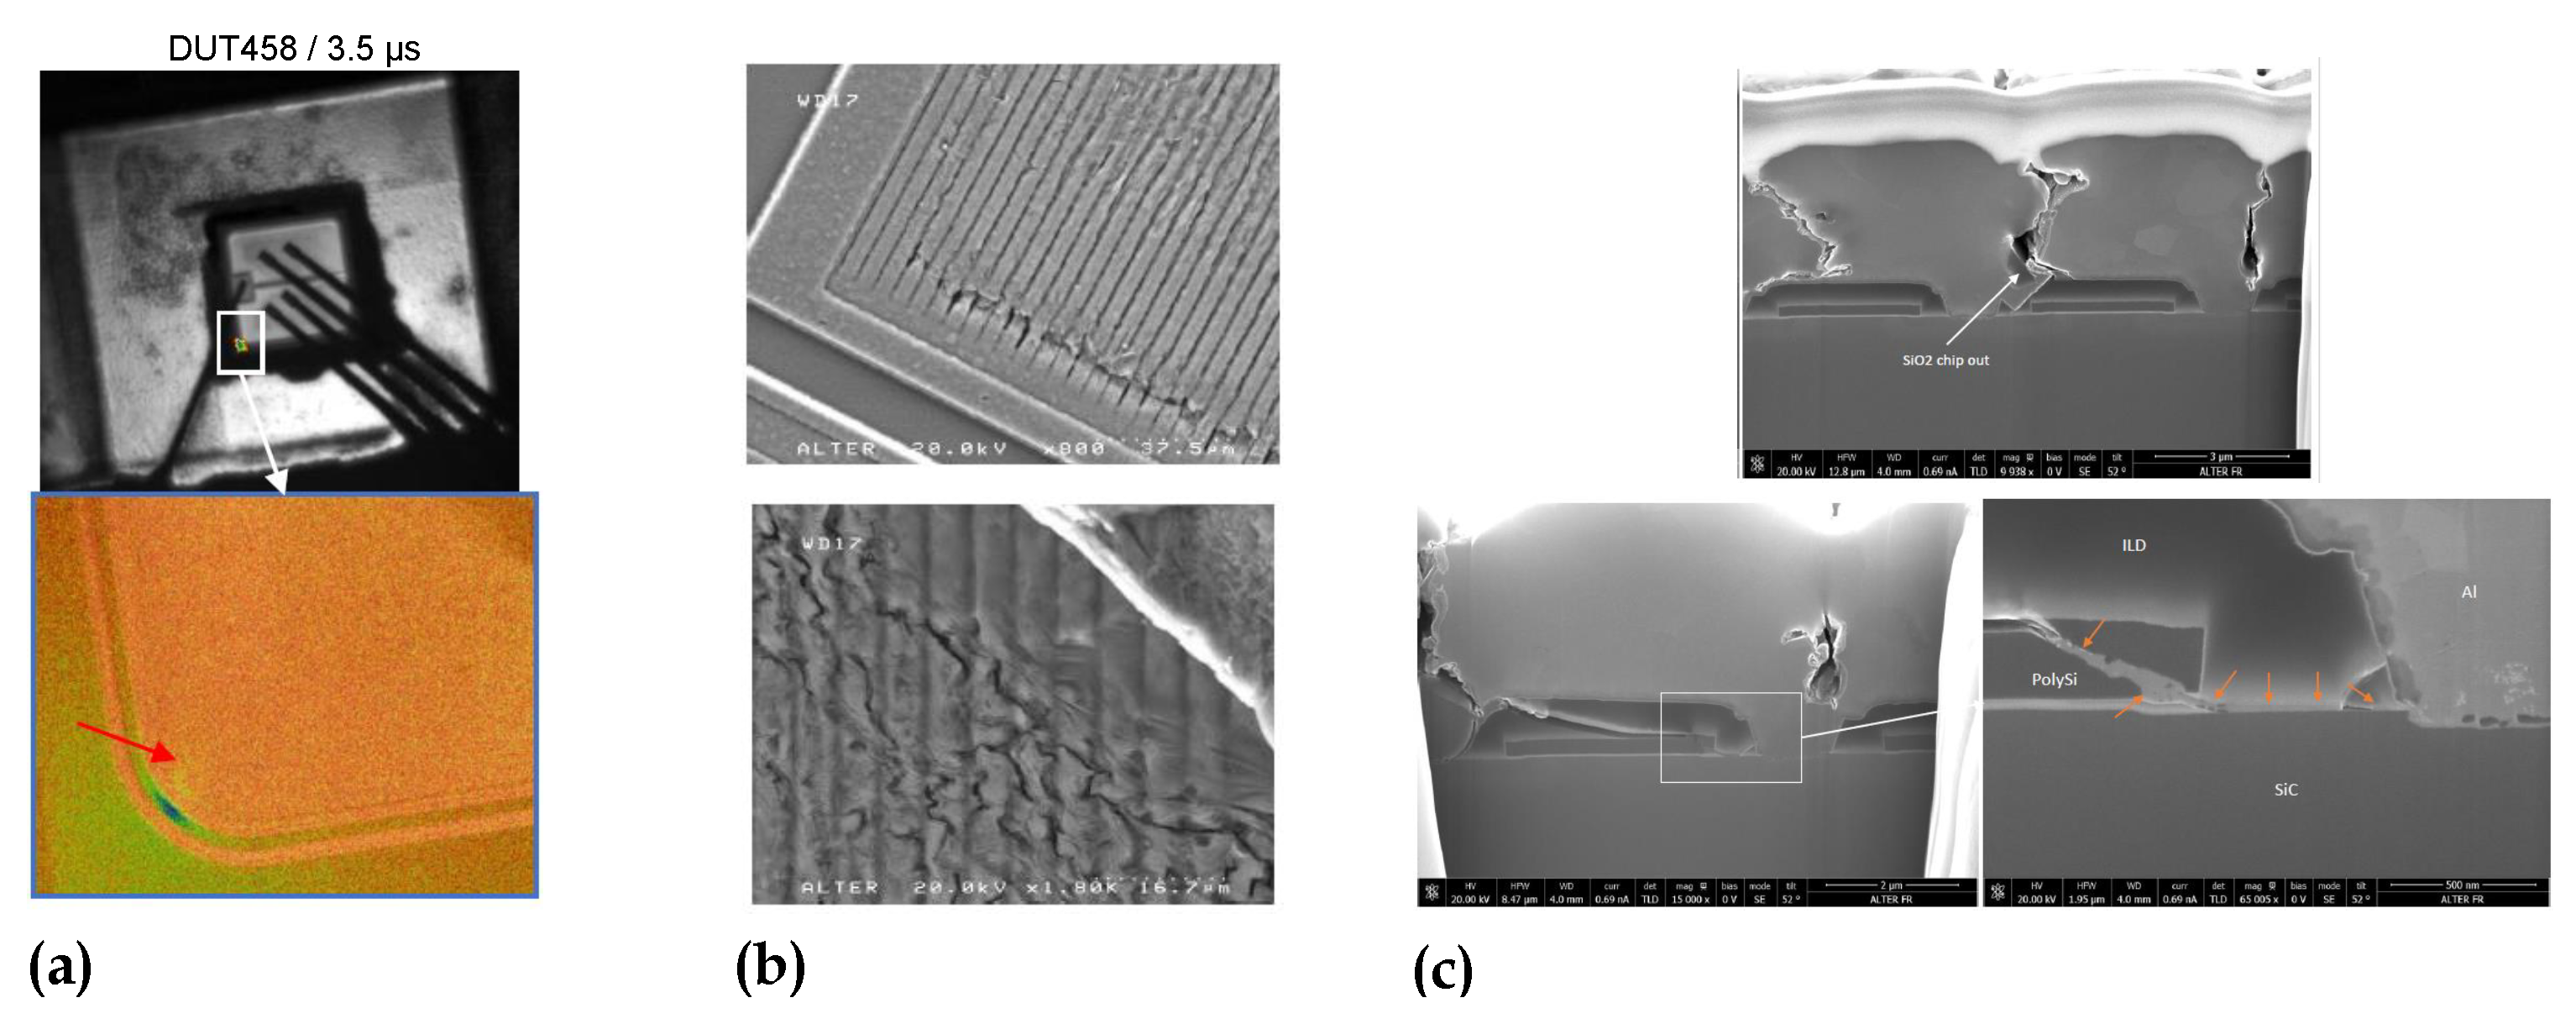
The failure analysis highlighted the FTO mode induced by the SC test (STEP 4). The thermomechanic stress is able to crack the ILD and cause the melting and reconstruction of the source metal, as shown in Figure 6. It is possible to see the degradation between polysilicon layer and the source ohmic contact. A likely reason for this is the high temperature on the Al source metal (>700 °C) estimated by theoretical thermal simulation [17]. Two contributors seem to be significant in the Al source reconstruction phenomenon: the very high temperature gradient at the border of the active area and the melting of the source metal in the active area. In addition, thanks to the lock-in thermography analysis, it can be observed that all defects are localized close to the edge of the die.
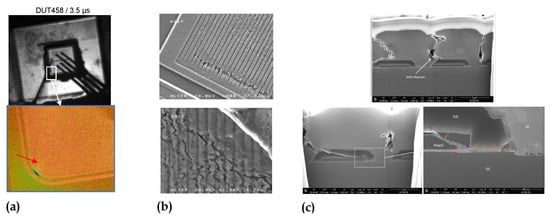
Figure 6.
A failure analysis was performed on the samples after @600V repetitive pulses. The high power stress applied to the component induces thermal–mechanical stress on the ILD, causing molten aluminum to propagate into the cracks, thereby leading to electrical leakage. (a) Lock-in thermography analysis is presented for a DUT submitted to about 600 pulses of s. The red arrow indicates a hotspot. The red arrow indicates a hotspot; (b) aluminum reconstruction at edge of active area; (c) cracks seem to start from step coverage until PolySi Gate through ILD. A molten Al (indicated by the orange arrows) is also observed propagating between gate and source ohmic contact, as indicated by orange arrows.
3.2. Short-Circuit Test at Higher Voltage (900 V)
A more in-depth investigation is conducted at the operating point of @900V as this voltage level is closer to the maximum rating of the targeted device.
The SC assessment methodology begins with the investigation of the reference parameter (STEP 1). The test involves applying successive short-circuit pulses, starting with an initial pulse of 1 s and increasing in s increments until the device reaches physical destruction. Following this, fine-tuning is carried out using an initial pulse width set to of the first identified. As reported in Table 1, the results for five tested samples are provided. The average value of the first four samples is considered as the reference, which is s. The dispersion in the number of pulses before destruction is likely due to the progressive increase in the pulse width applied until the failure is detected.

Table 1.
Failure modes and aging test plan. Short-circuit withstand time (STEP 1). Main parameters: V and /+18 V. Waiting time = 1 min.
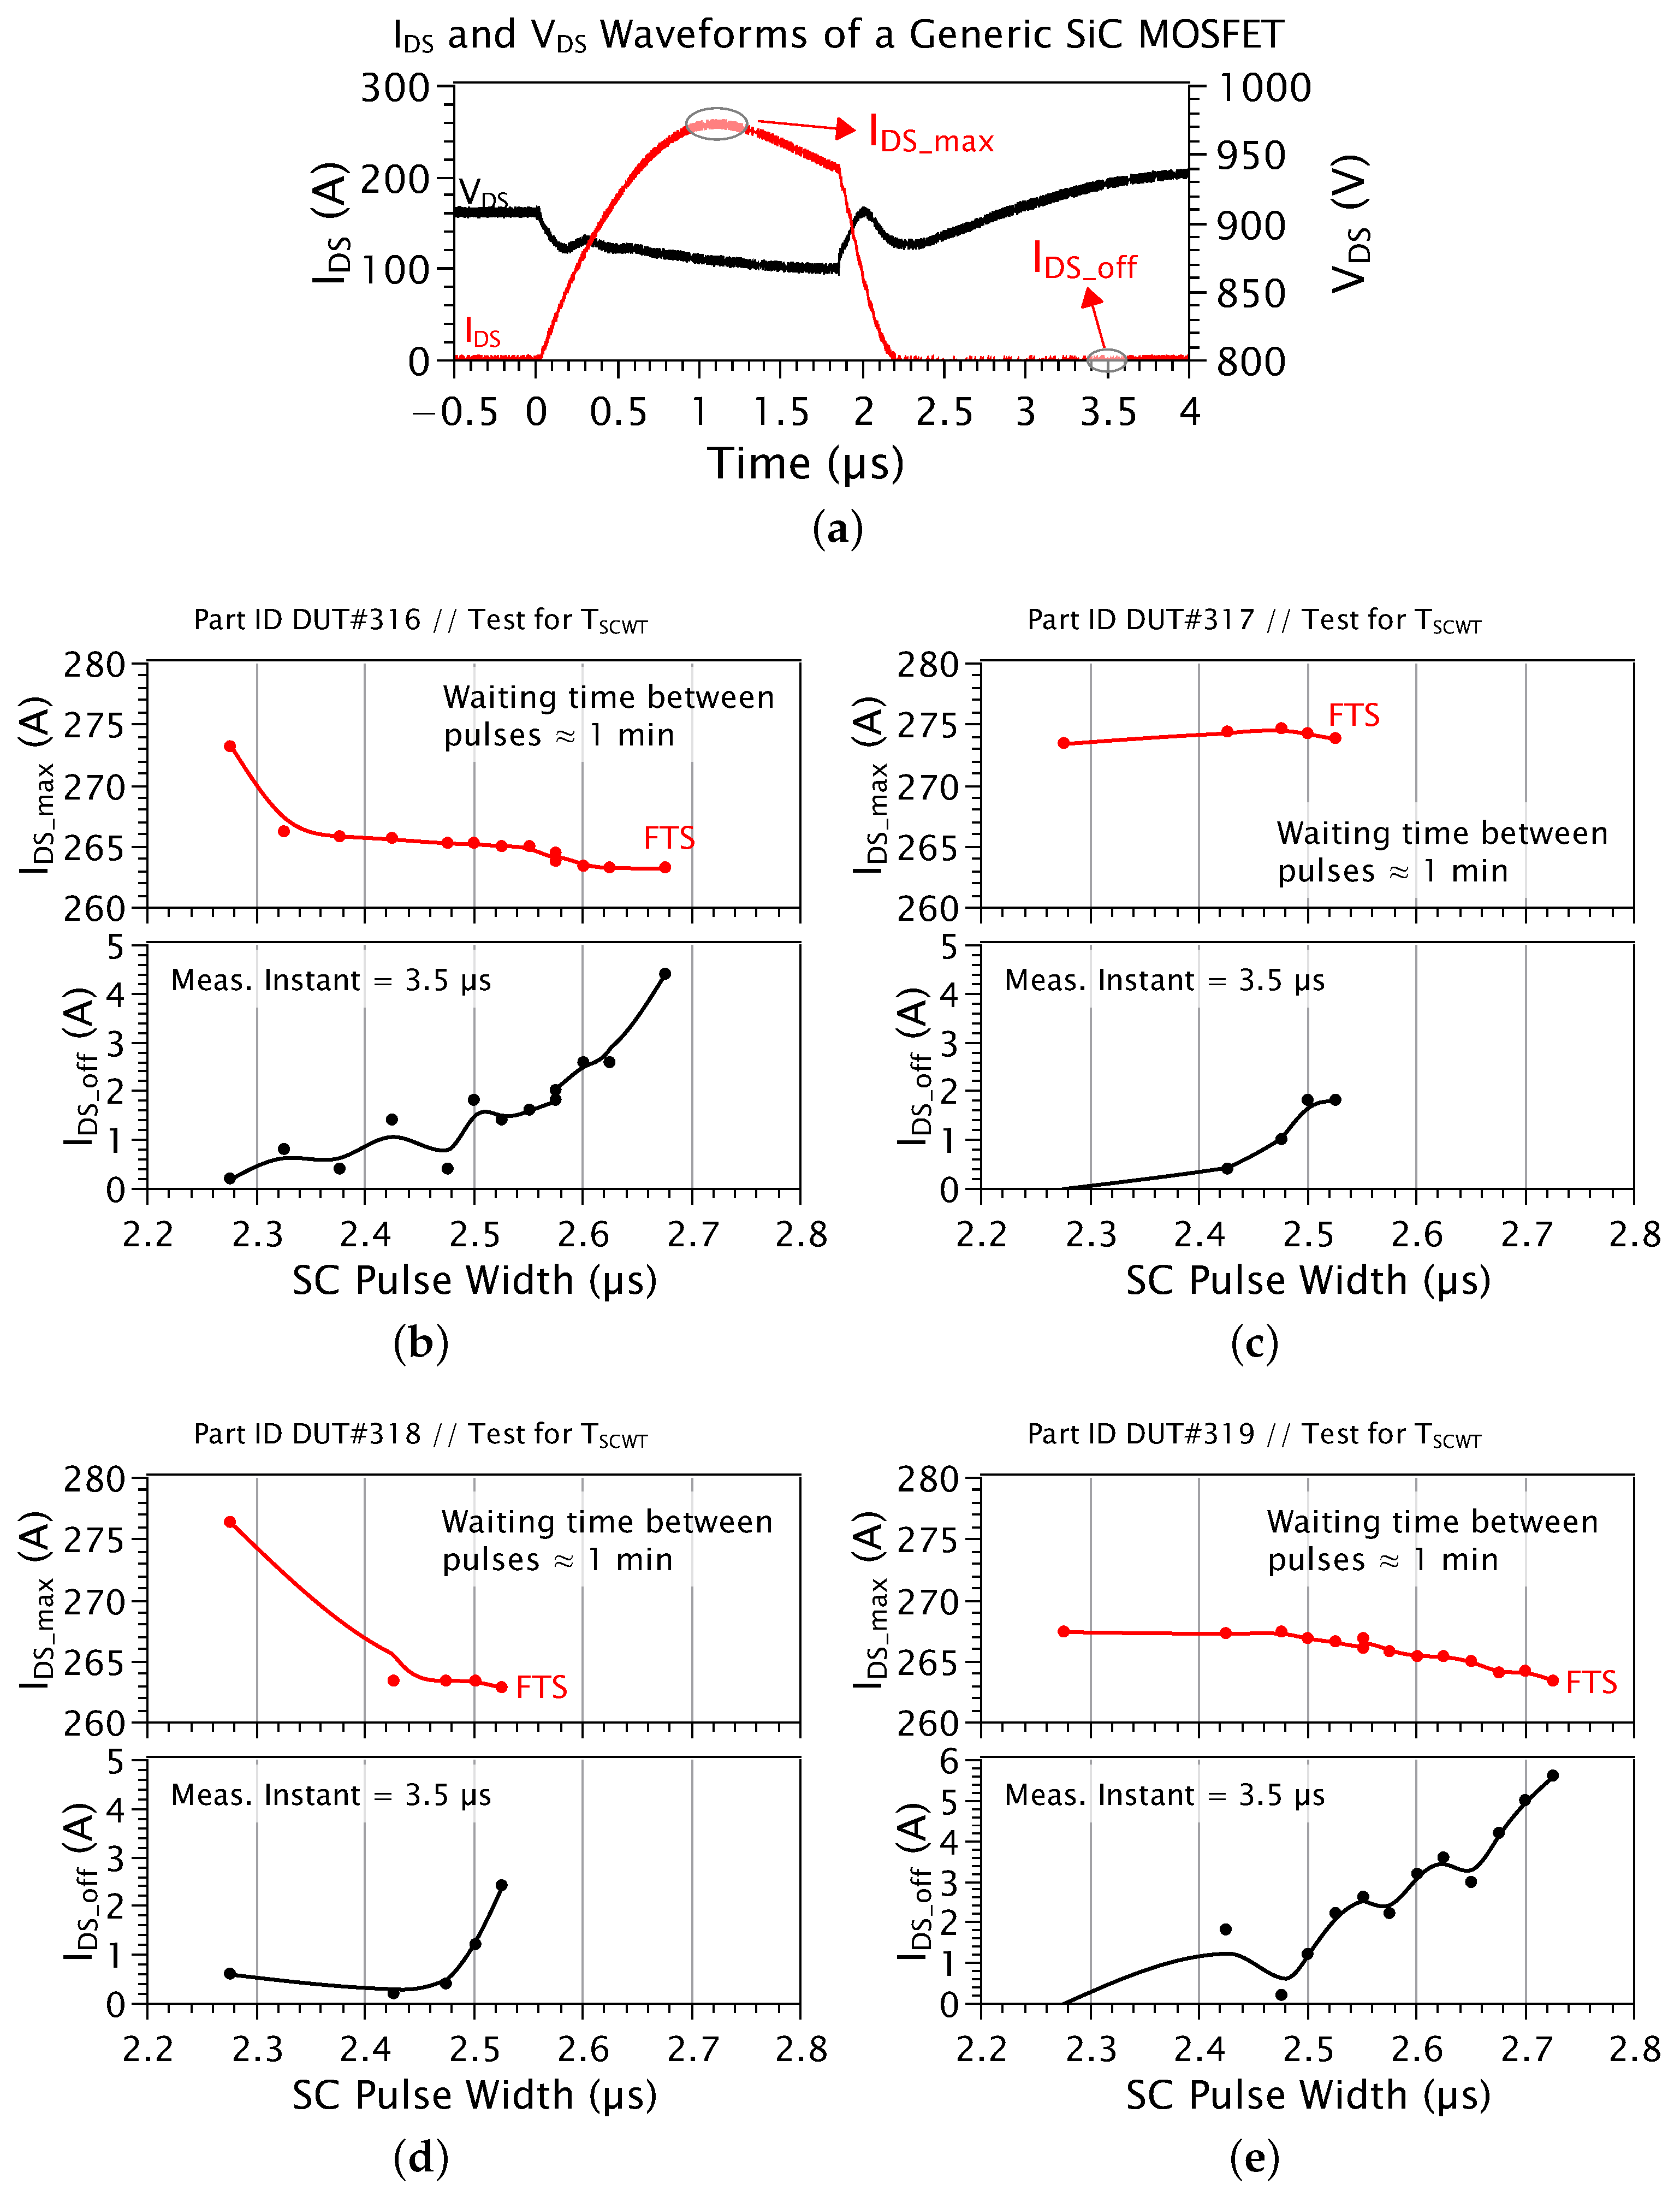
At this voltage level (900 V), all devices ultimately failed due to thermal runaway (FTS). Figure 7 illustrates the evolution of the maximum drain–source current () and the drain–source leakage current () when the switch is in the off state across different samples. Each device began testing with a short-circuit pulse width of s and continued until physical destruction occurred, as limited by the safety system. Prior to entering the FTS mode, a significant increase in (black line) was observed, indicating the presence of leakage current despite the channel being in the off state. Concurrently, showed a decreasing trend as the SC pulse width increased (red line), suggesting that self-heating of the device was occurring.
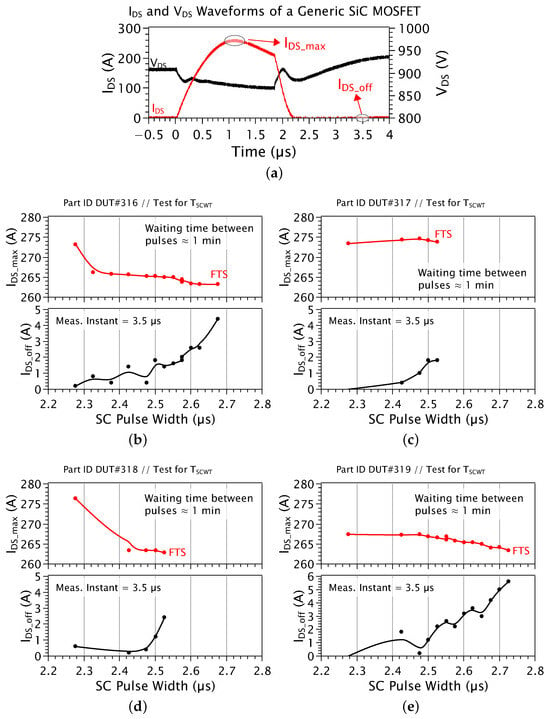
Figure 7.
Withstand time investigation (STEP 1). (a) Current and voltage waveforms during SC of a generic SiC MOSFET 1200 V. (b–e) Evolution of the maximum drain–source current () and the drain–source leakage current () when the switch is in the off state for 4 different DUTs. Between each SC pulse, a waiting time of 1 min is applied. The last point (FTS) corresponds to the withstand time.
According to the SC assessment methodology, the maximum capability for SC events is investigated (STEP 2) across three different SC pulse widths. During the repetitive pulses, tracking parameters such as the SC critical energy, gate–source voltage drop, and maximum drain–source current are defined. Further details can be found in Table 2. To prevent a temperature rise in the DUT, SC events are performed every 5 s.

Table 2.
Failure modes and aging test plan. Maximum number of pulses (STEP 2). Main parameters: V and /+18 V. Waiting time = 5 s.
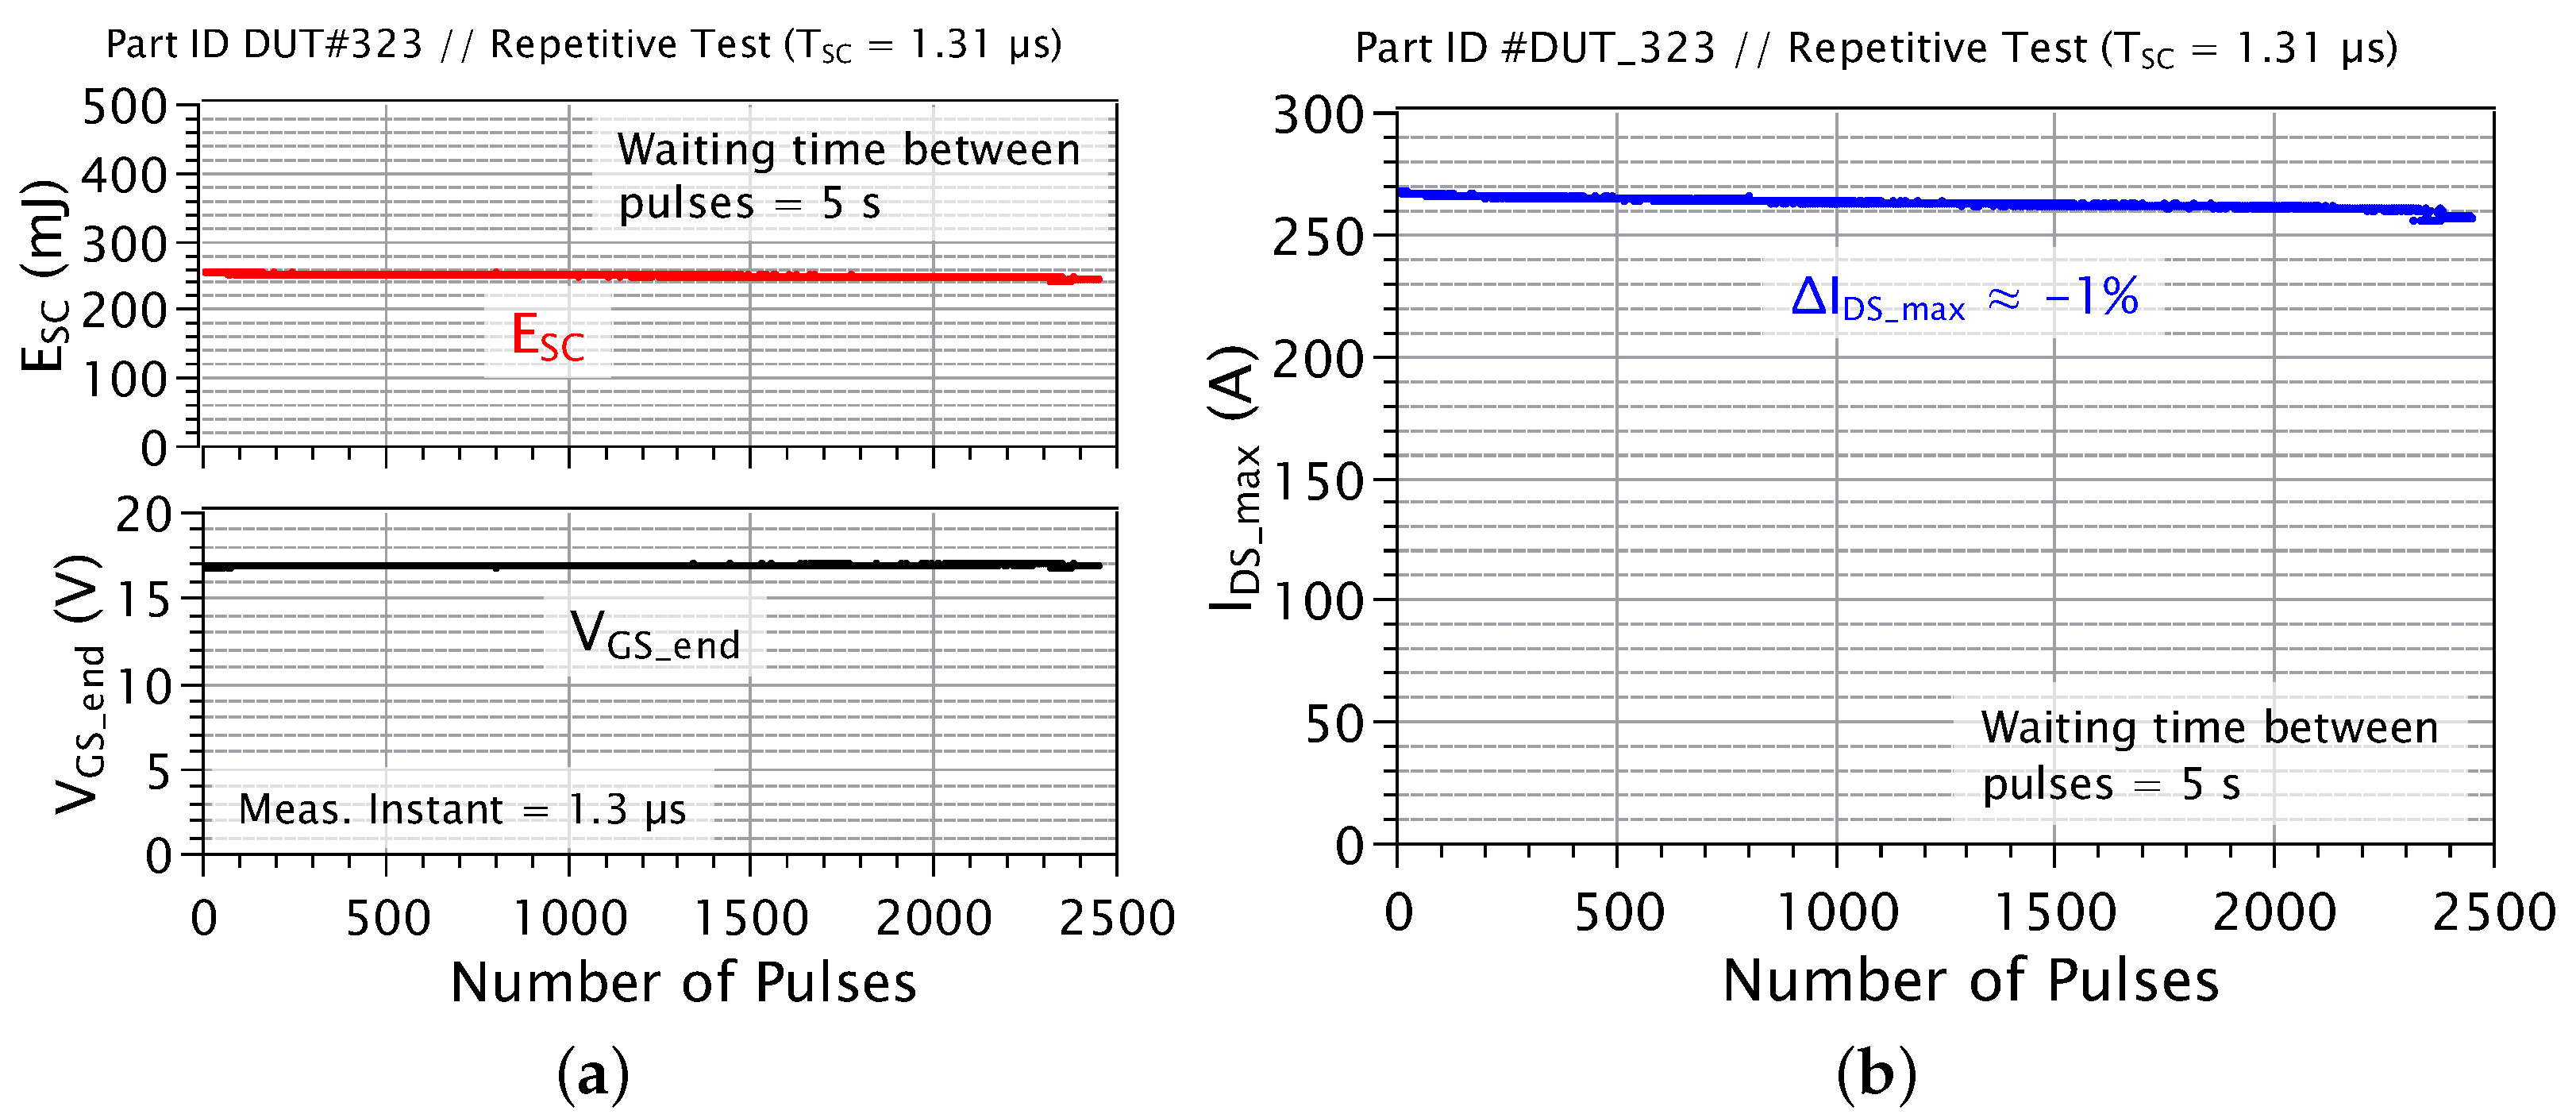
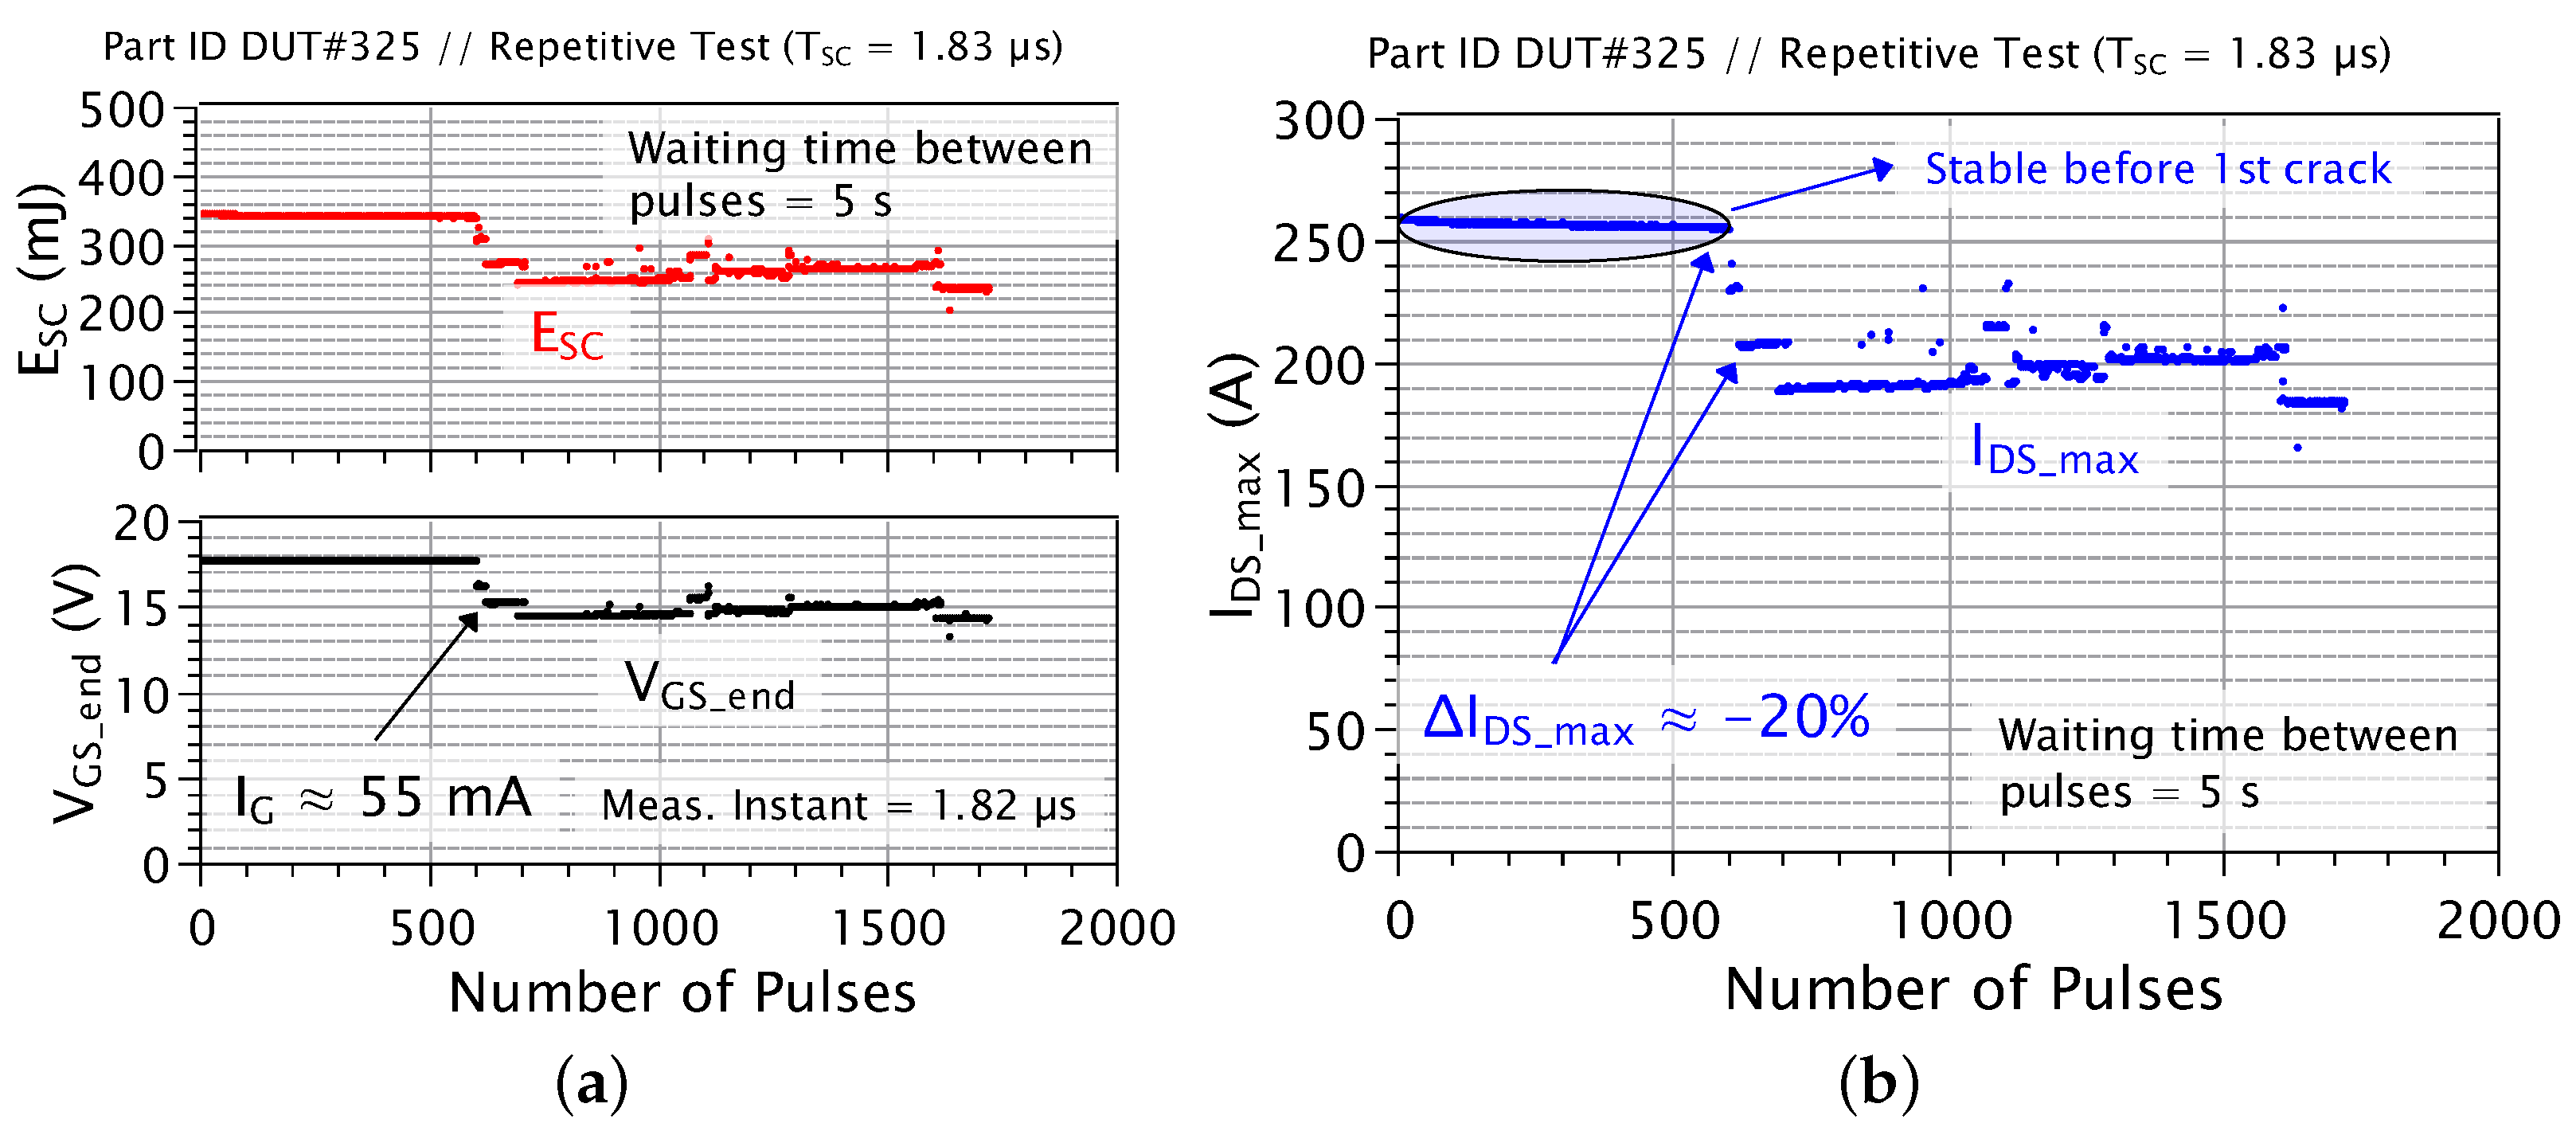
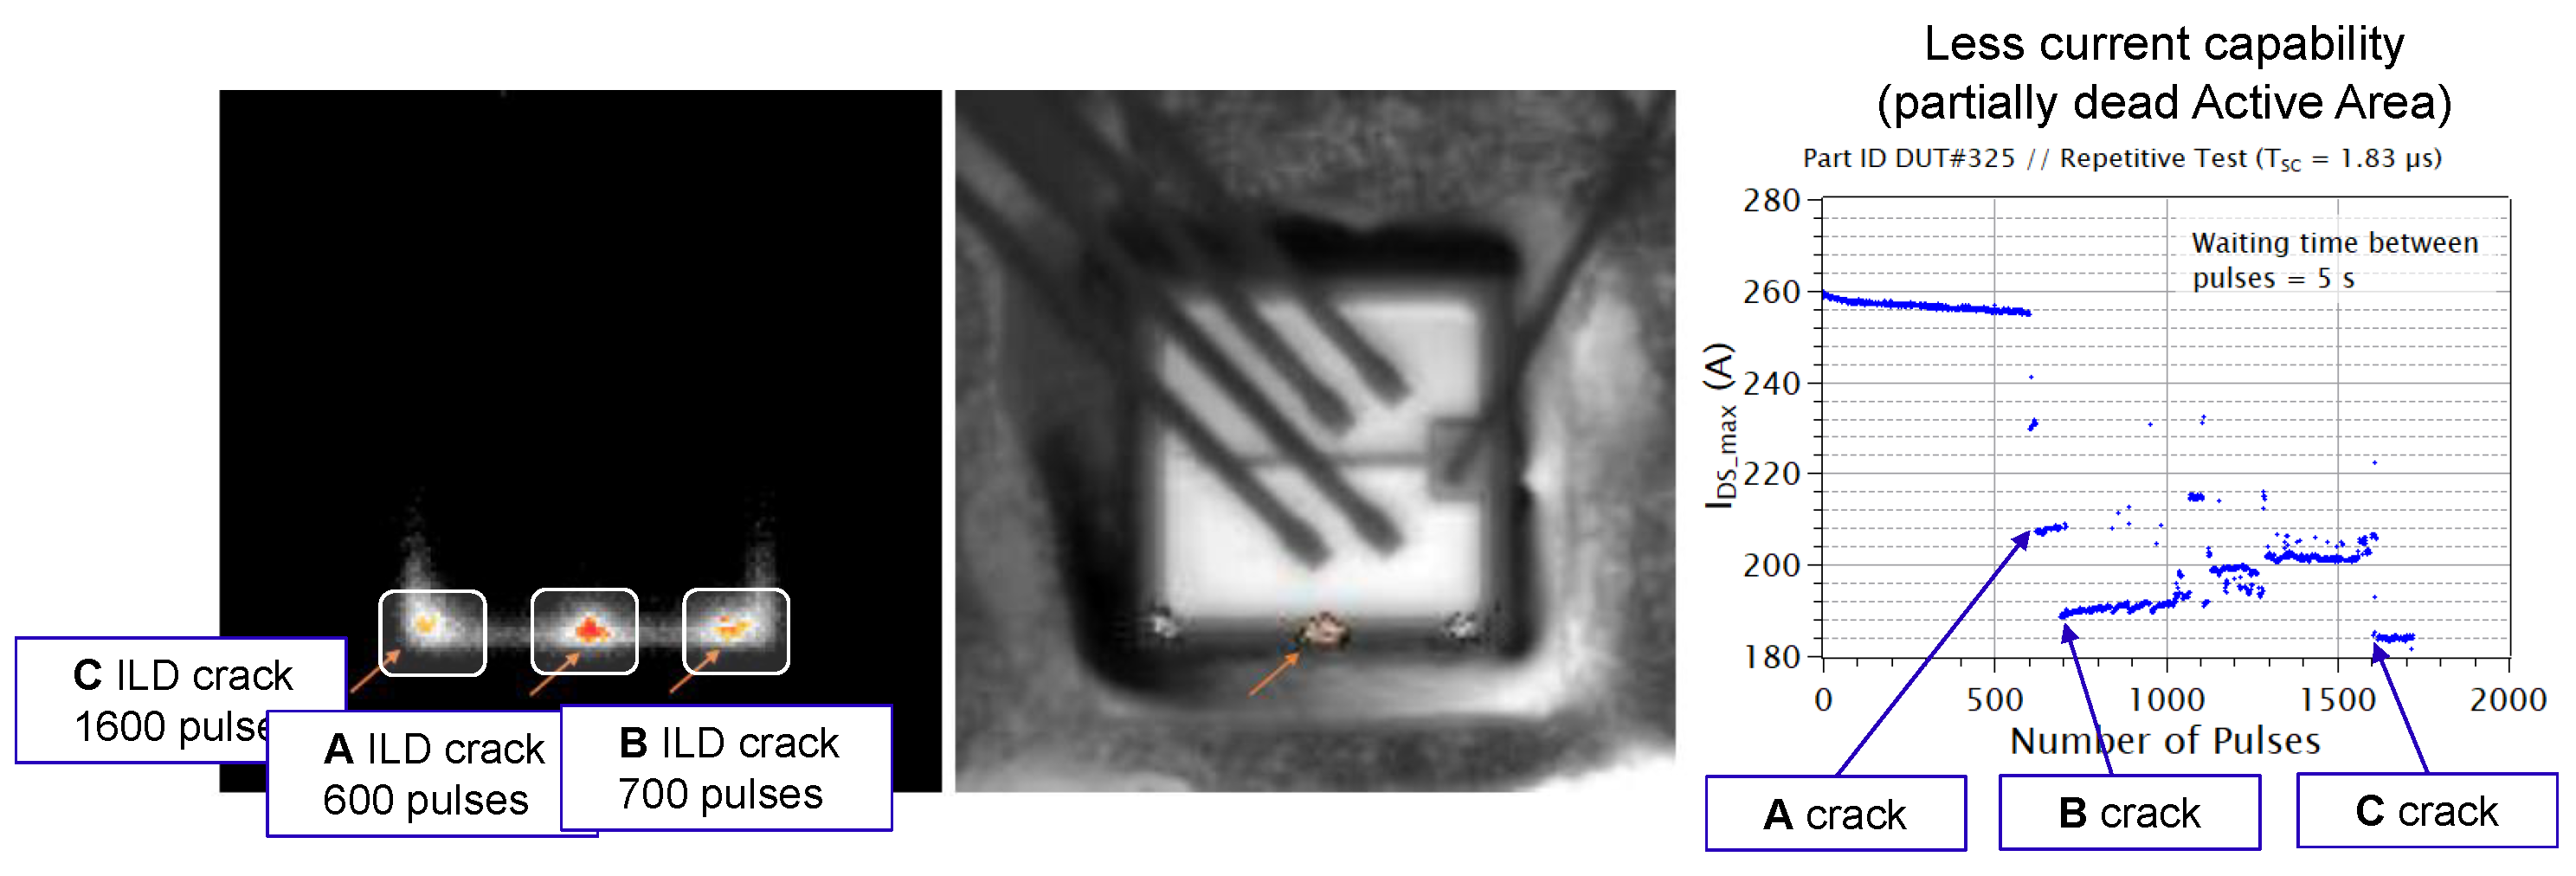
With a of , the device could withstand up to 2451 SC events without exhibiting any signs of degradation, as illustrated in Figure 8. The relevant parameters were continuously monitored online throughout the testing process. In contrast, Figure 9 shows evidence of device degradation under a short-circuit condition of , manifesting after approximately 550 SC events. This degradation is indicated by a significant increase in gate leakage current, suggestive of a partial field oxide (FTO) failure. The observed reduction in may be interpreted as a decrease in current-carrying capability, implying partial damage to the active area. To substantiate and further elucidate this hypothesis, a failure analysis was conducted on the affected sample, with the results presented in Figure 10. During the visual inspection of the device at the die level, following the removal of the molding material, three hot spots were identified, which are likely attributable to successive ILD cracks.
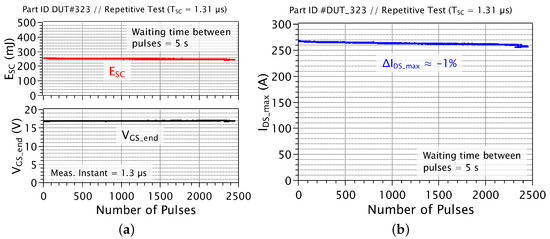
Figure 8.
Test conditions: V and s. Device DUT#323 was stopped after Pulse#2451. No degradation was observed up to the end of the test. After 2451 SC events, the maximum drain–source current () showed a variation of approximately . (a) SC energy and gate-source voltage evolution as a function of the number of pulses; (b) Maximum drain-source current evolution as a function of the number of pulses.
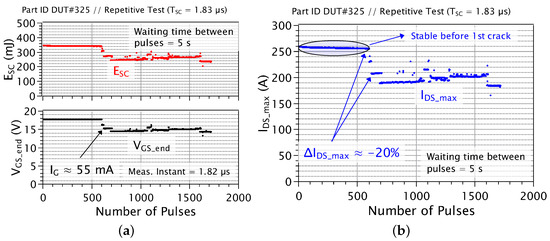
Figure 9.
Testconditions: V and s. Device DUT#325 was stopped after Pulse#1722. The device exhibited high in situ gate leakage current () but remained functional and capable of withstanding further SC events. On the right, a sudden drop is observed after approximately 550 SC events, corresponding to a reduction in the device’s current capability. (a) SC energy and gate-source voltage evolution as a function of the number of pulses; (b) Maximum drain-source current evolution as a function of the number of pulses.
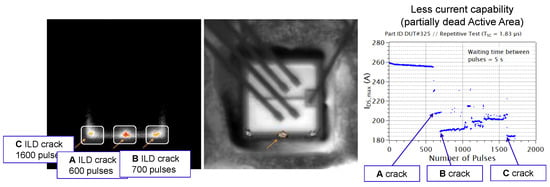
Figure 10.
Test conditions: V and s. Global view of DUT#325. Three hot spots are visible, with the most intense one located near the middle bottom edge of the die, close to the aluminum pad. The sequence of crack formation is hypothesized based on the total time elapsed after failure, with longer durations indicating more extensive degradation.
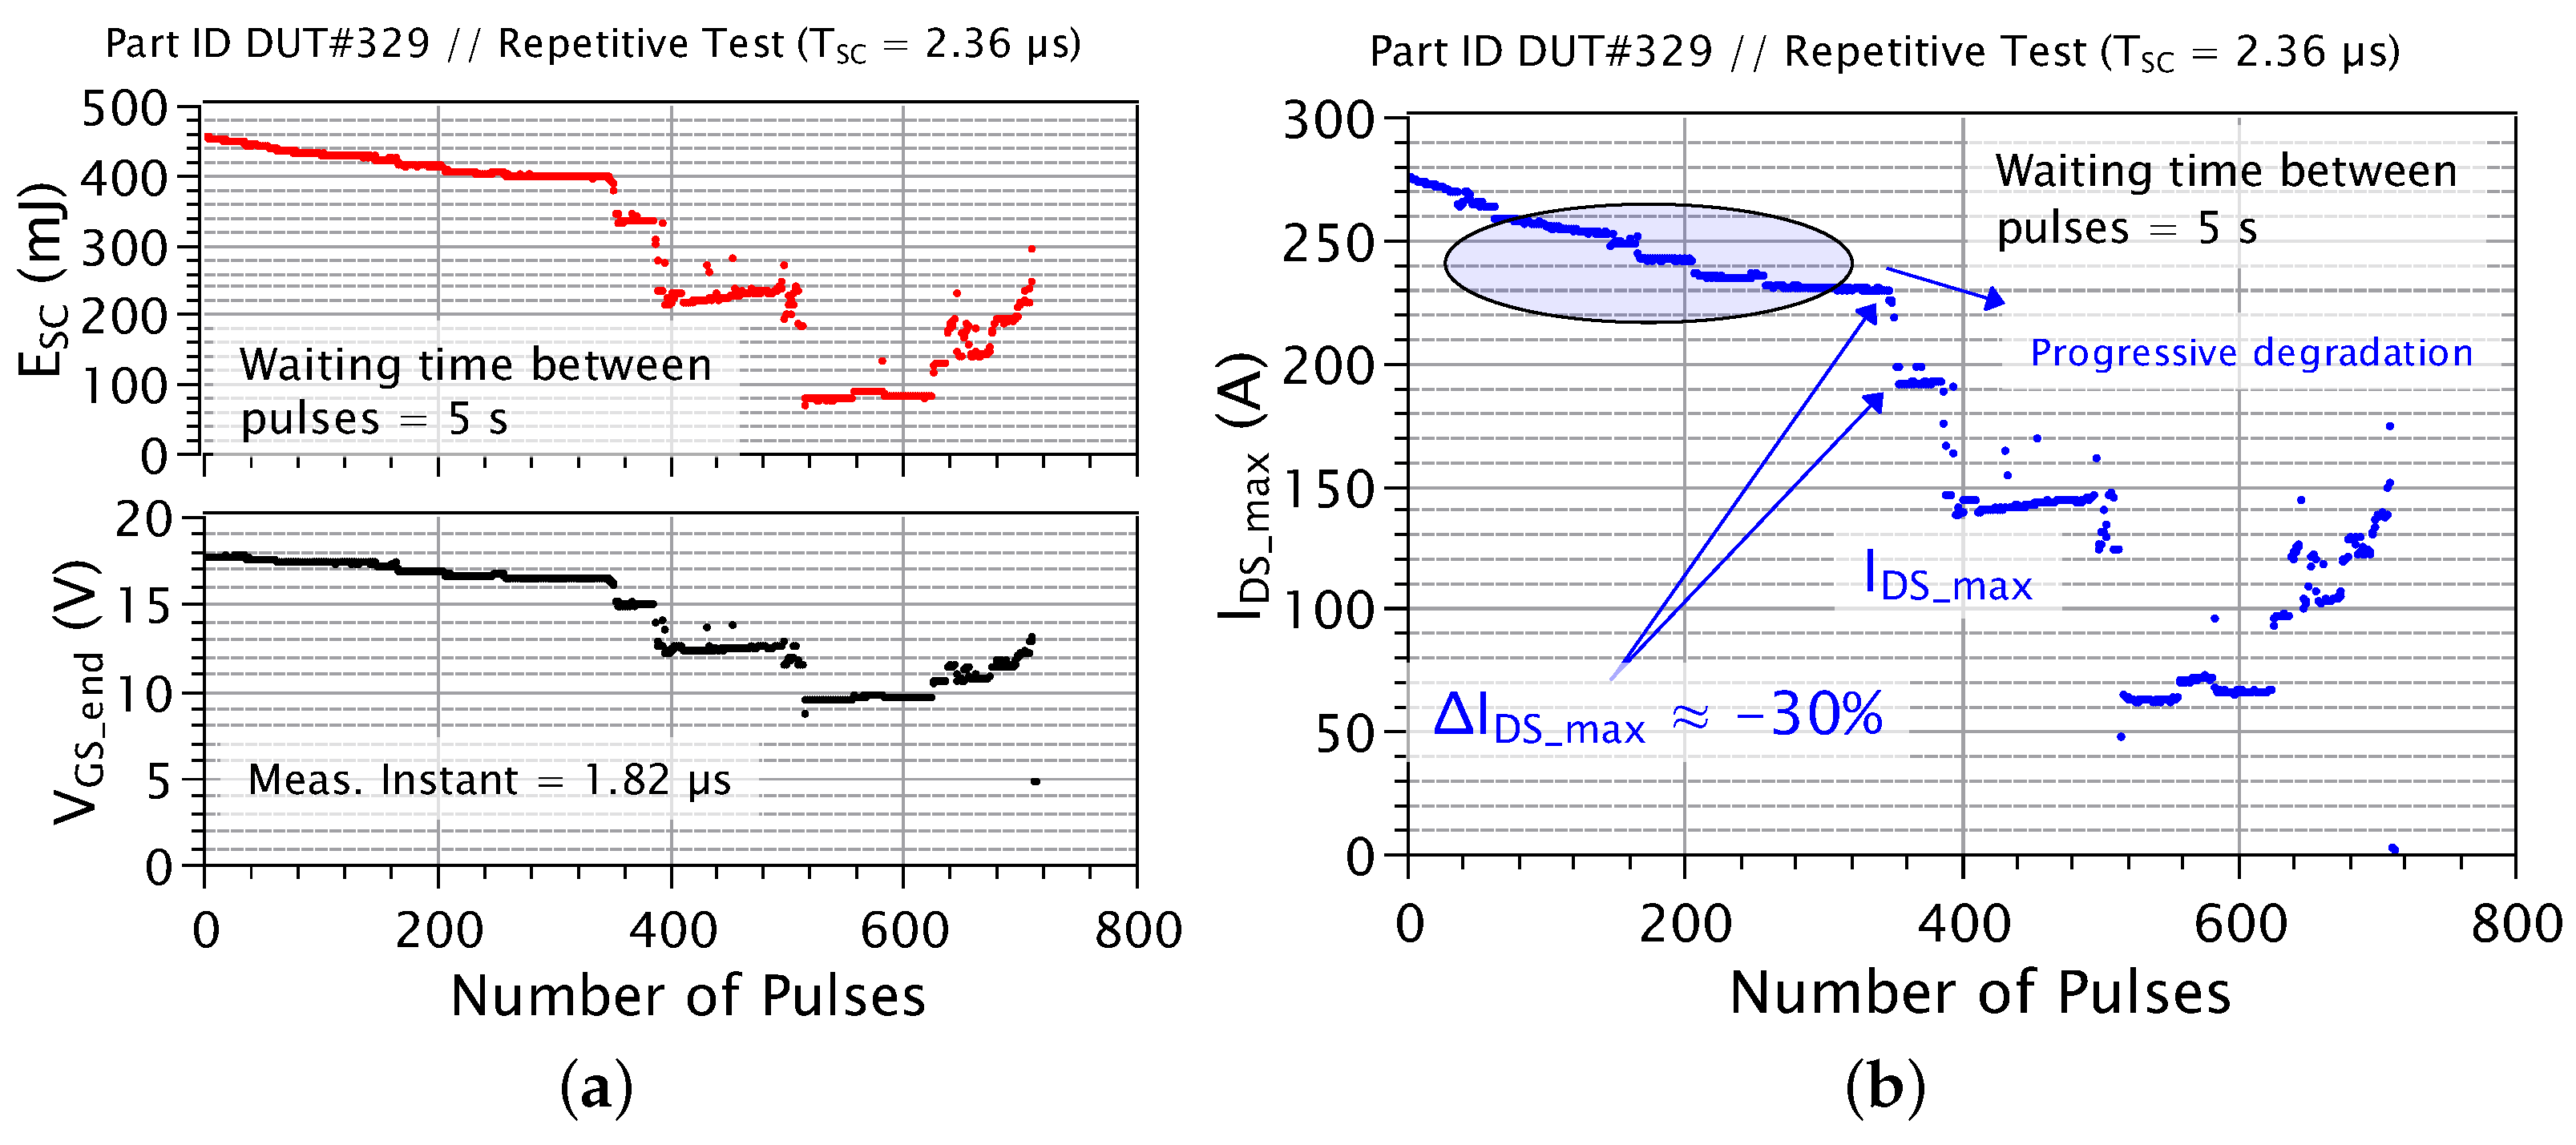
As shown in Figure 11, a progressive degradation was observed prior to the first detected crack, indicated by a reduction in the maximum SC current (STEP 3). A subsequent failure analysis (STEP 4), using lock-in thermography, identified a hot spot at the die edge near the gate ring, likely located beneath the top aluminum source metal, as illustrated in Figure 12. Additionally, evidence of aluminum reconstruction was observed near the source bonding, while no such effects were detected in the gate aluminum metal, consistent with the absence of an active area beneath the gate pad.
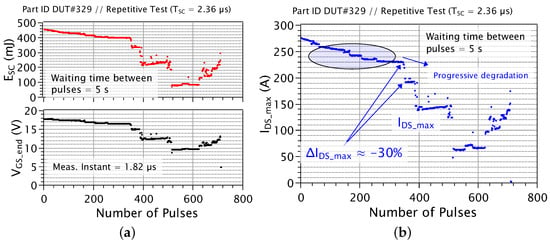
Figure 11.
Test conditions: V and s. Device DUT#329: at Pulse#712, measured 0, and measured V. Post-verification confirmed a gate–source short. Progressive degradation was observed prior to the sudden drop detected around 300 SC events. (a) SC energy and gate-source voltage evolution as a function of the number of pulses; (b) Maximum drain-source current evolution as a function of the number of pulses.

Figure 12.
Failure analysis: lock-in thermography on device DUT#329 revealed aluminum reconstruction and migration along the die. A hot spot was localized at the edge of the die (indicated by the yellow arrow) and near the gate ring. A high leakage current through the gate aluminum extended into the active area, leading to failure.
3.3. Similarities Between Medium (600 V) and Higher (900 V) SC Operation
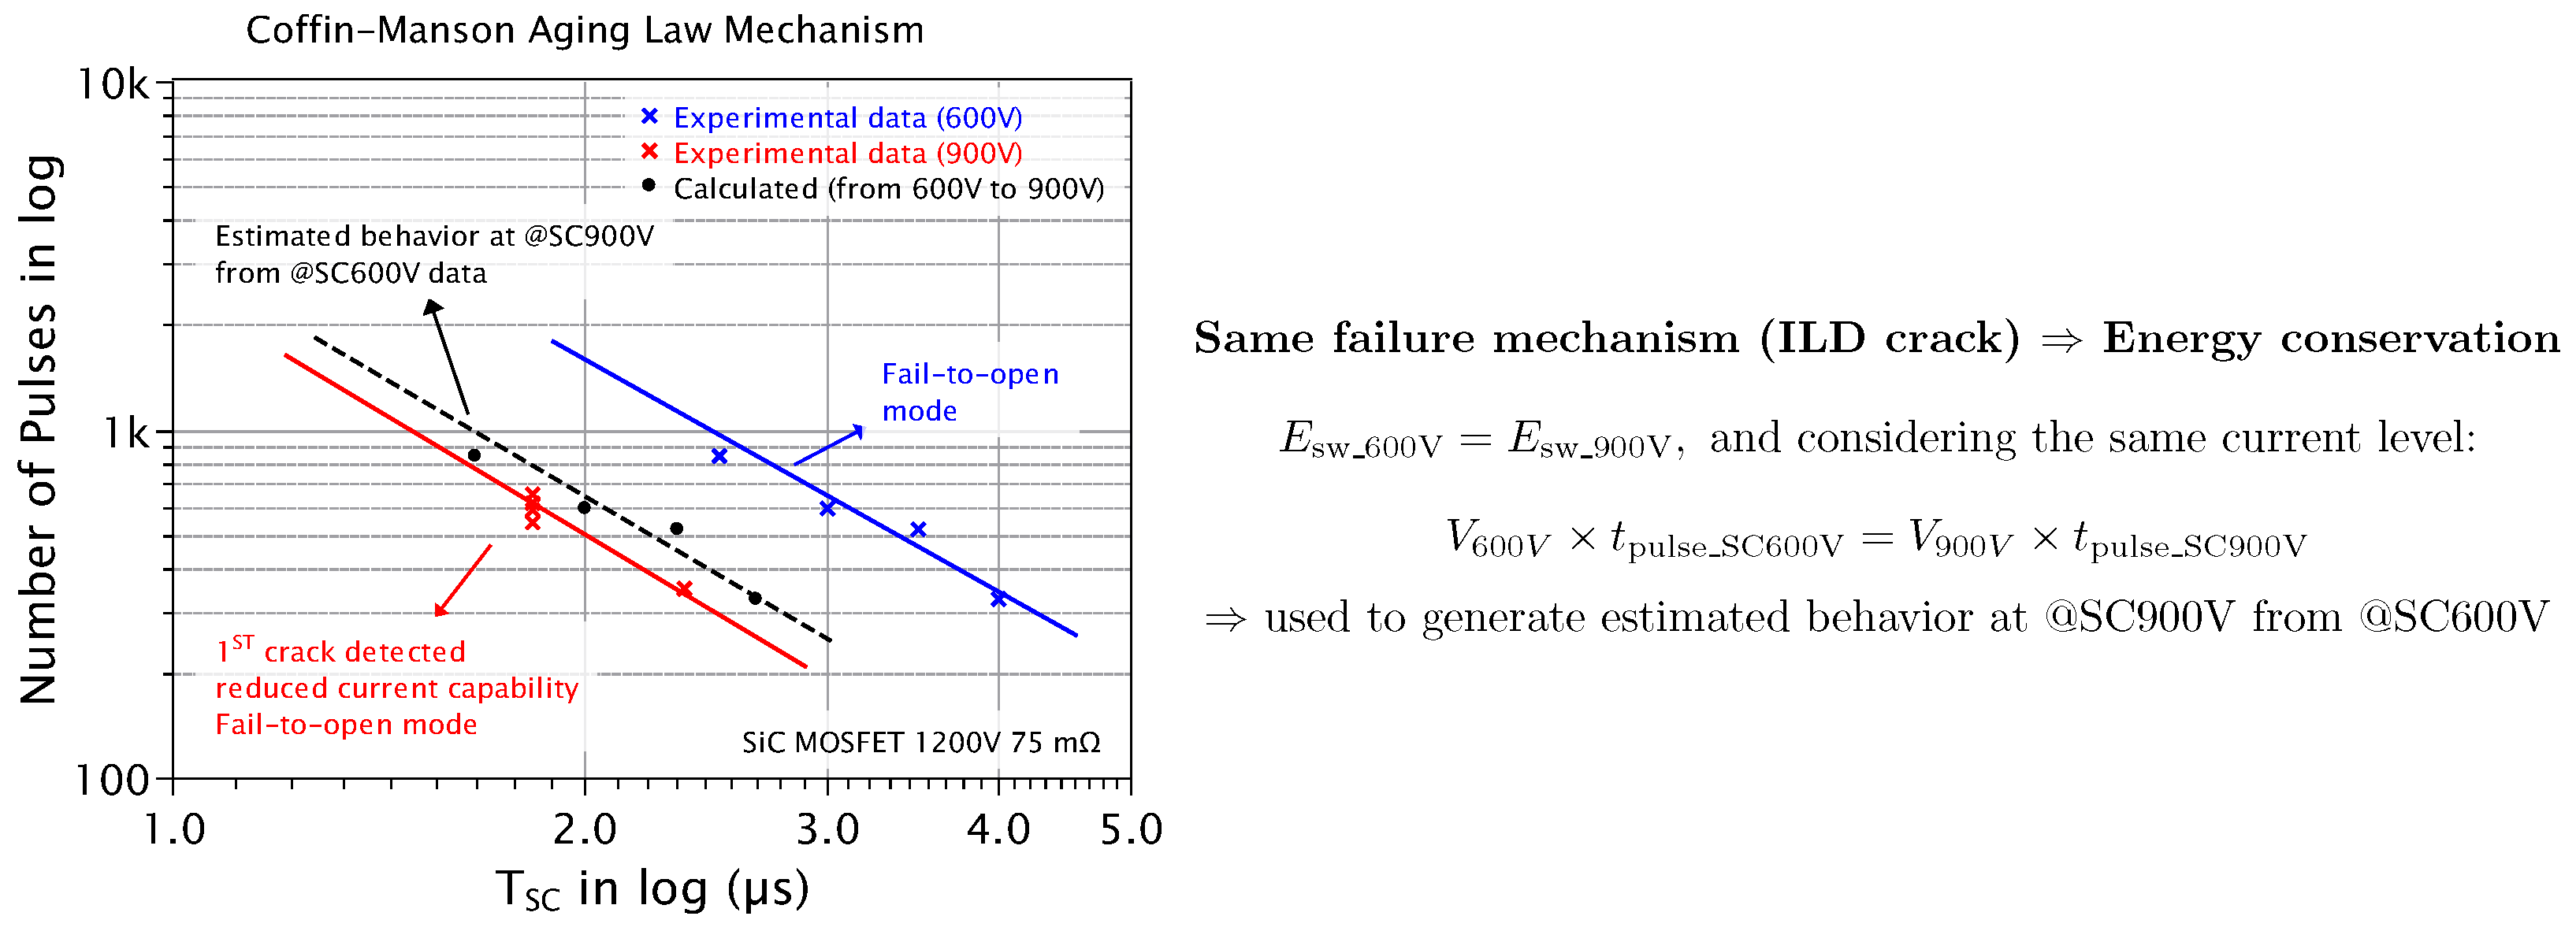
As previously discussed, SC withstand time is mainly defined by two failure mechanisms: ILD crack and thermal runaway. The degradation of the gate insulation is well described by the Coffin–Manson law, where the first ILD crack is used as failure criterion [15]. In Figure 13, the relation between number of SC events and SC pulse width is plotted for two different operation points. Since the failure mechanism is the same for both conditions, it is supposed that it is reached around the same SC energy, be it at 600 V or 900 V. Hence, with a simple mathematical equation, SC behavior for the @900V can be calculated from the experimental results of the @600V experiments. Shown also in Figure 13, the black dotted curve is calculated. The result is a theoretical straight line in the log-linear plot (in black), which is quite close to the one obtained experimentally for the same operation (in red). This proves the consistency of the aforementioned assumption and of the Coffin–Manson model.
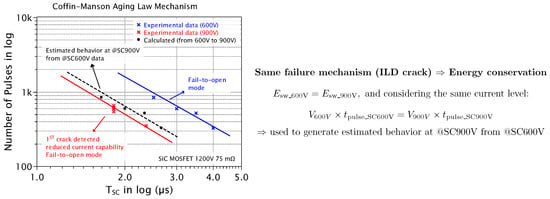
Figure 13.
Coffin–Manson aging law (SC test) applied to @SC600V and @SC900V operation points (STEP 3).
4. Application of the SC Assessment Methodology
The assessment of SC capability in power devices is a critical factor in determining their safe operating conditions. In this section, the SC assessment methodology is applied to investigate the SOA of SiC MOSFETs. Emphasis is placed on defining the maximum permissible SC conditions and identifying the failure mechanisms that result from repeated SC stress. By utilizing compliance masks, systematic testing, and advanced diagnostic techniques such as thermography and failure analysis, the methodology enables an in-depth evaluation of SC-induced stresses.
In addition, the impact of quasi-simultaneous SC events is examined, providing insights into self-heating effects and device aging under continuous SC stress. Through this comprehensive investigation, critical aspects of SC reliability and safe operating limits are established for SiC MOSFETs.
4.1. Investigation of SC Safe Operating Area
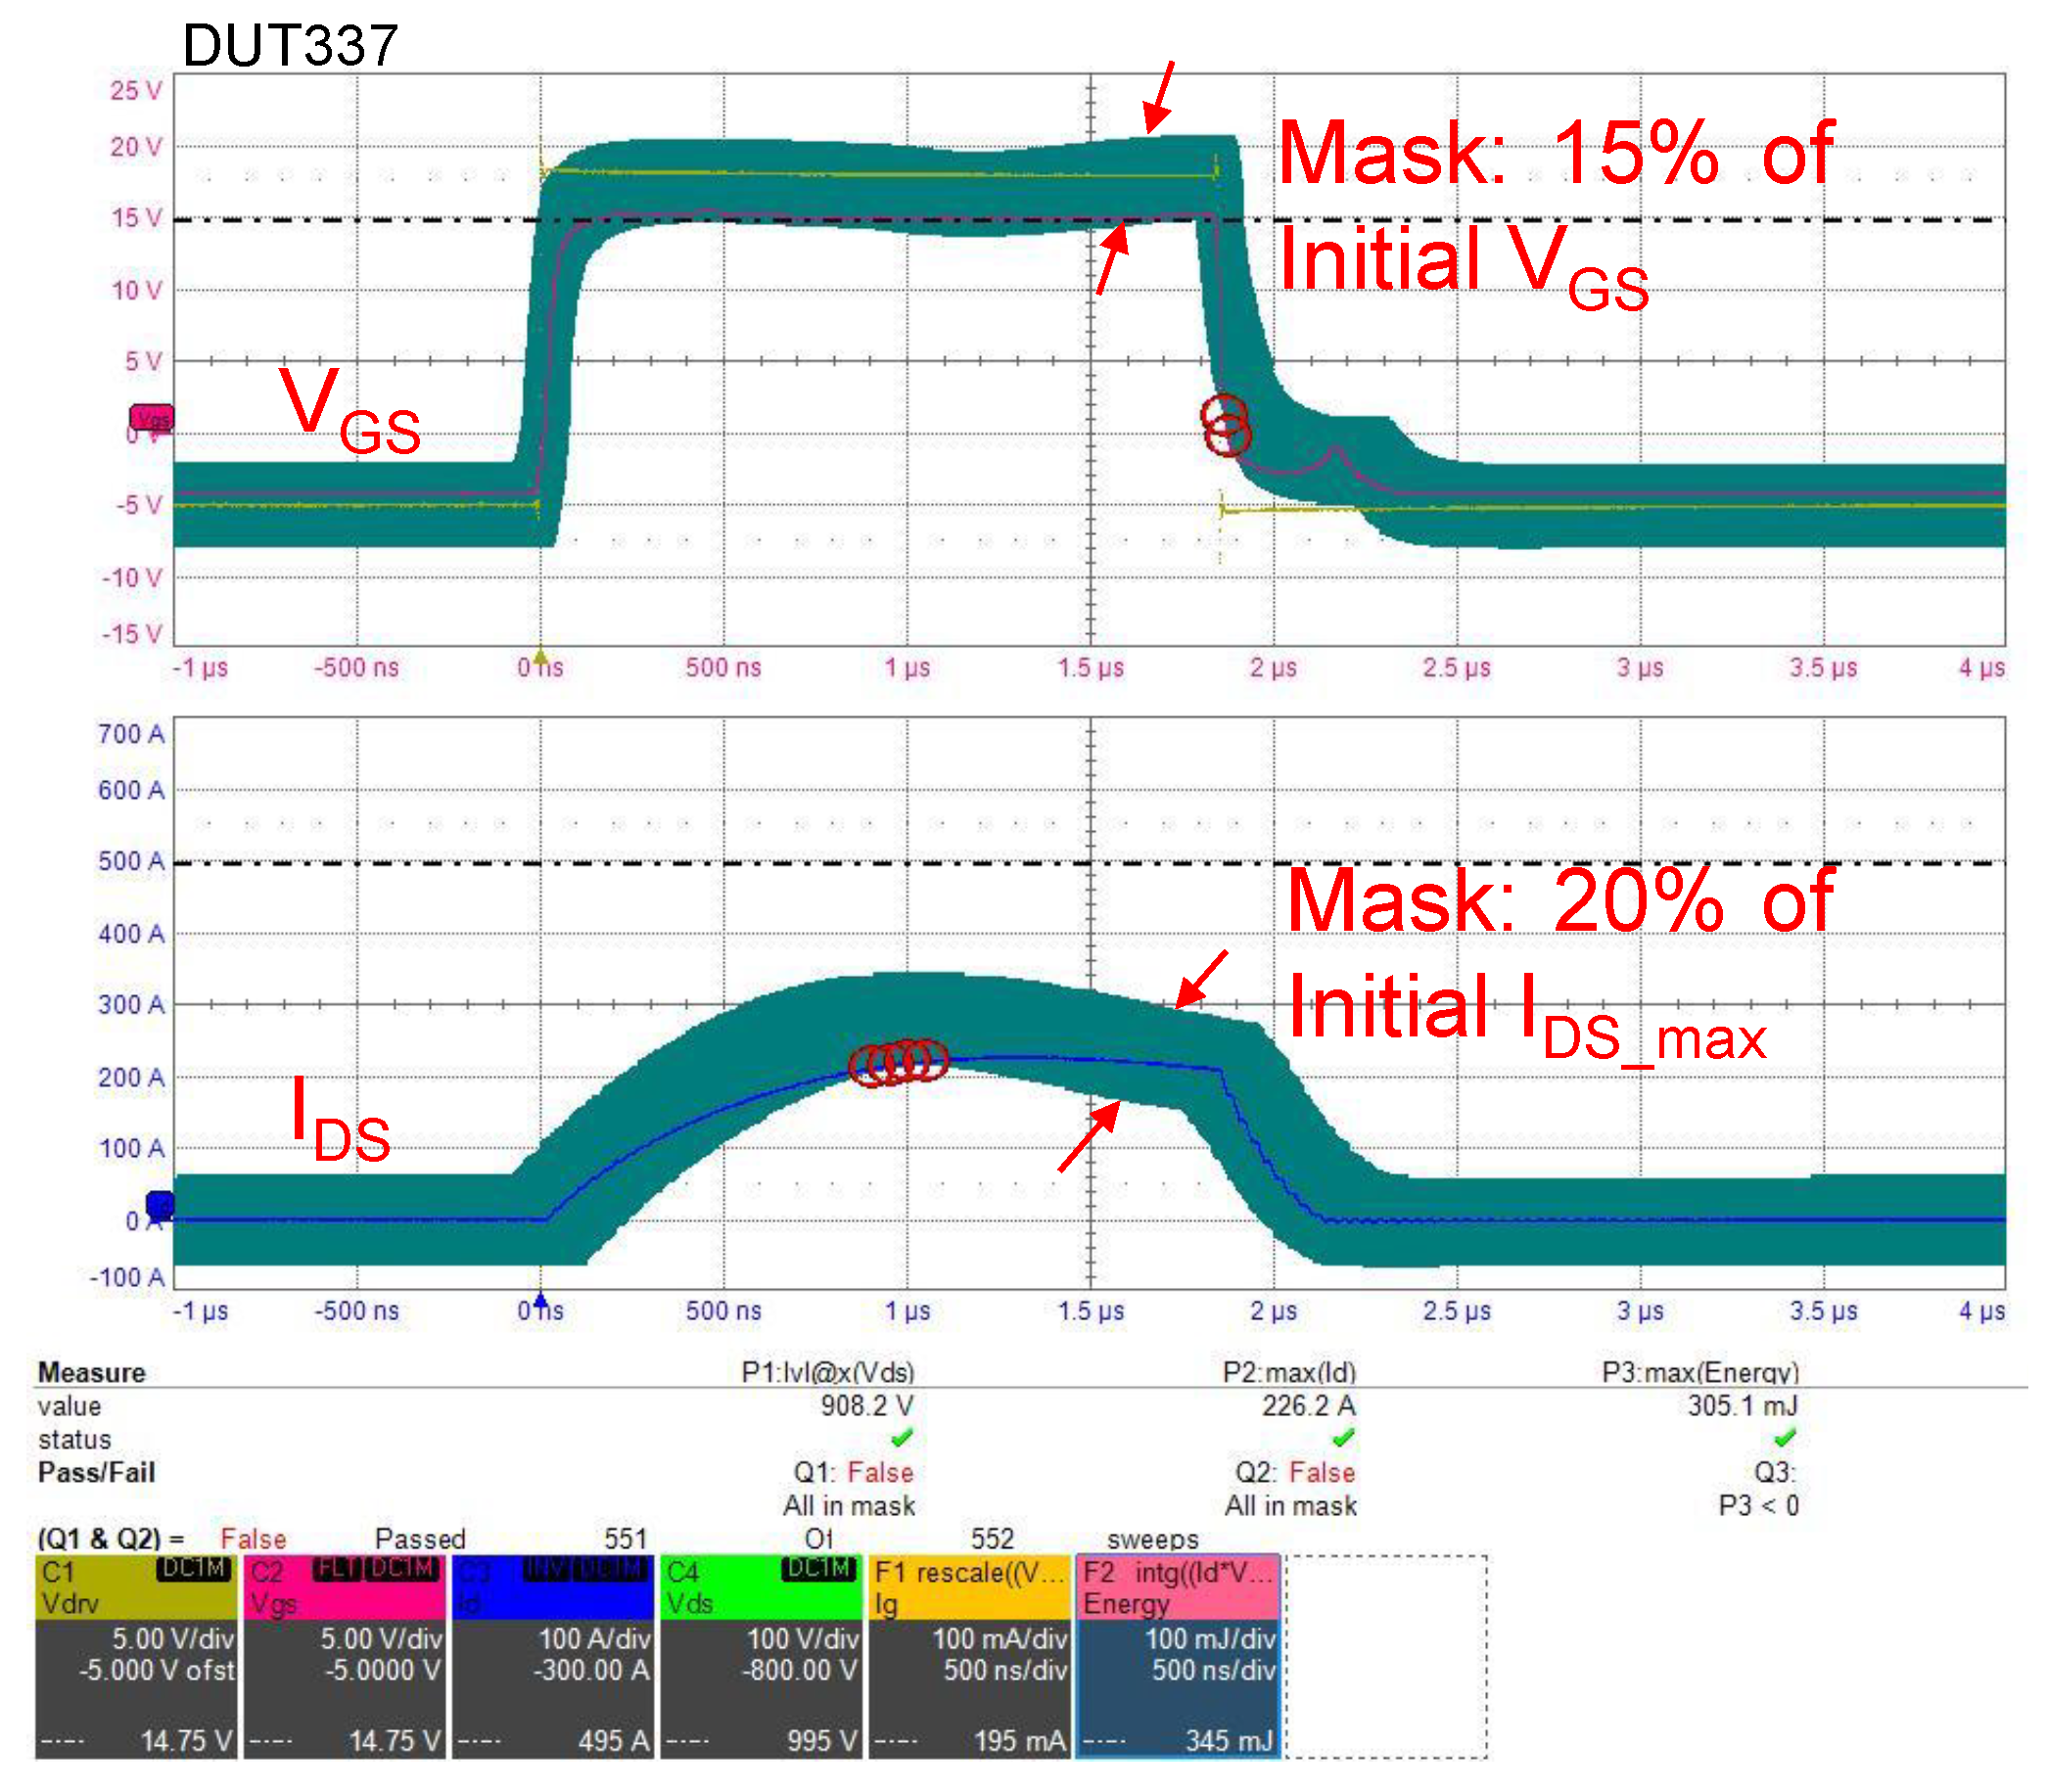
The aging test, as outlined in STEP 3 of the proposed protocol, can also be employed to establish safe operating conditions in terms of the device SC capability. To determine a stop condition based on a specific drift in the gate–source voltage and SC current, the oscilloscope’s mask function is utilized. Measurements that fall outside the predefined tolerance range, indicating the maximum permissible deviation, trigger a stop control signal that immediately halts the SC test bench operation. In Figure 14, an example of a compliance mask is presented, corresponding to a drop in and a drop in at , which are considered acceptable in this study [5]. The number of pulses prior to device failure, using this mask, ranged from 548 to 654. For accurate estimation, the minimum number of SC events should be taken into account.
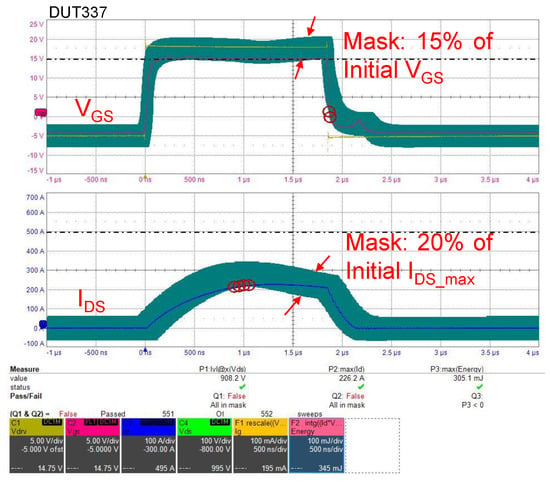
Figure 14.
Compliance mask (oscilloscope screenshot) for gate–source voltage () and drain–source current (). The test is immediately stopped if either signal exceeds the defined region. This is an arbitrary condition.
Following the initial tests, the preliminary conclusions are as follows: for short circuits at @SC900V, operation at appears stable with respect to , , and , up to the point of destruction. Conversely, at , progressive degradation in , , and is observed prior to failure.
For completeness, a more thorough investigation of the SC@900V condition was conducted. This included a DC characterization to confirm the limited degradation of the device, followed by a detailed failure analysis. It is important to note that the compliance mask requires further adaptation and optimization, which can be achieved by integrating statistical testing of the SC events. To address this, the following test sequence was undertaken (on randomly chosen devices):
- A: Perform DC characterization before short circuit on available samples.
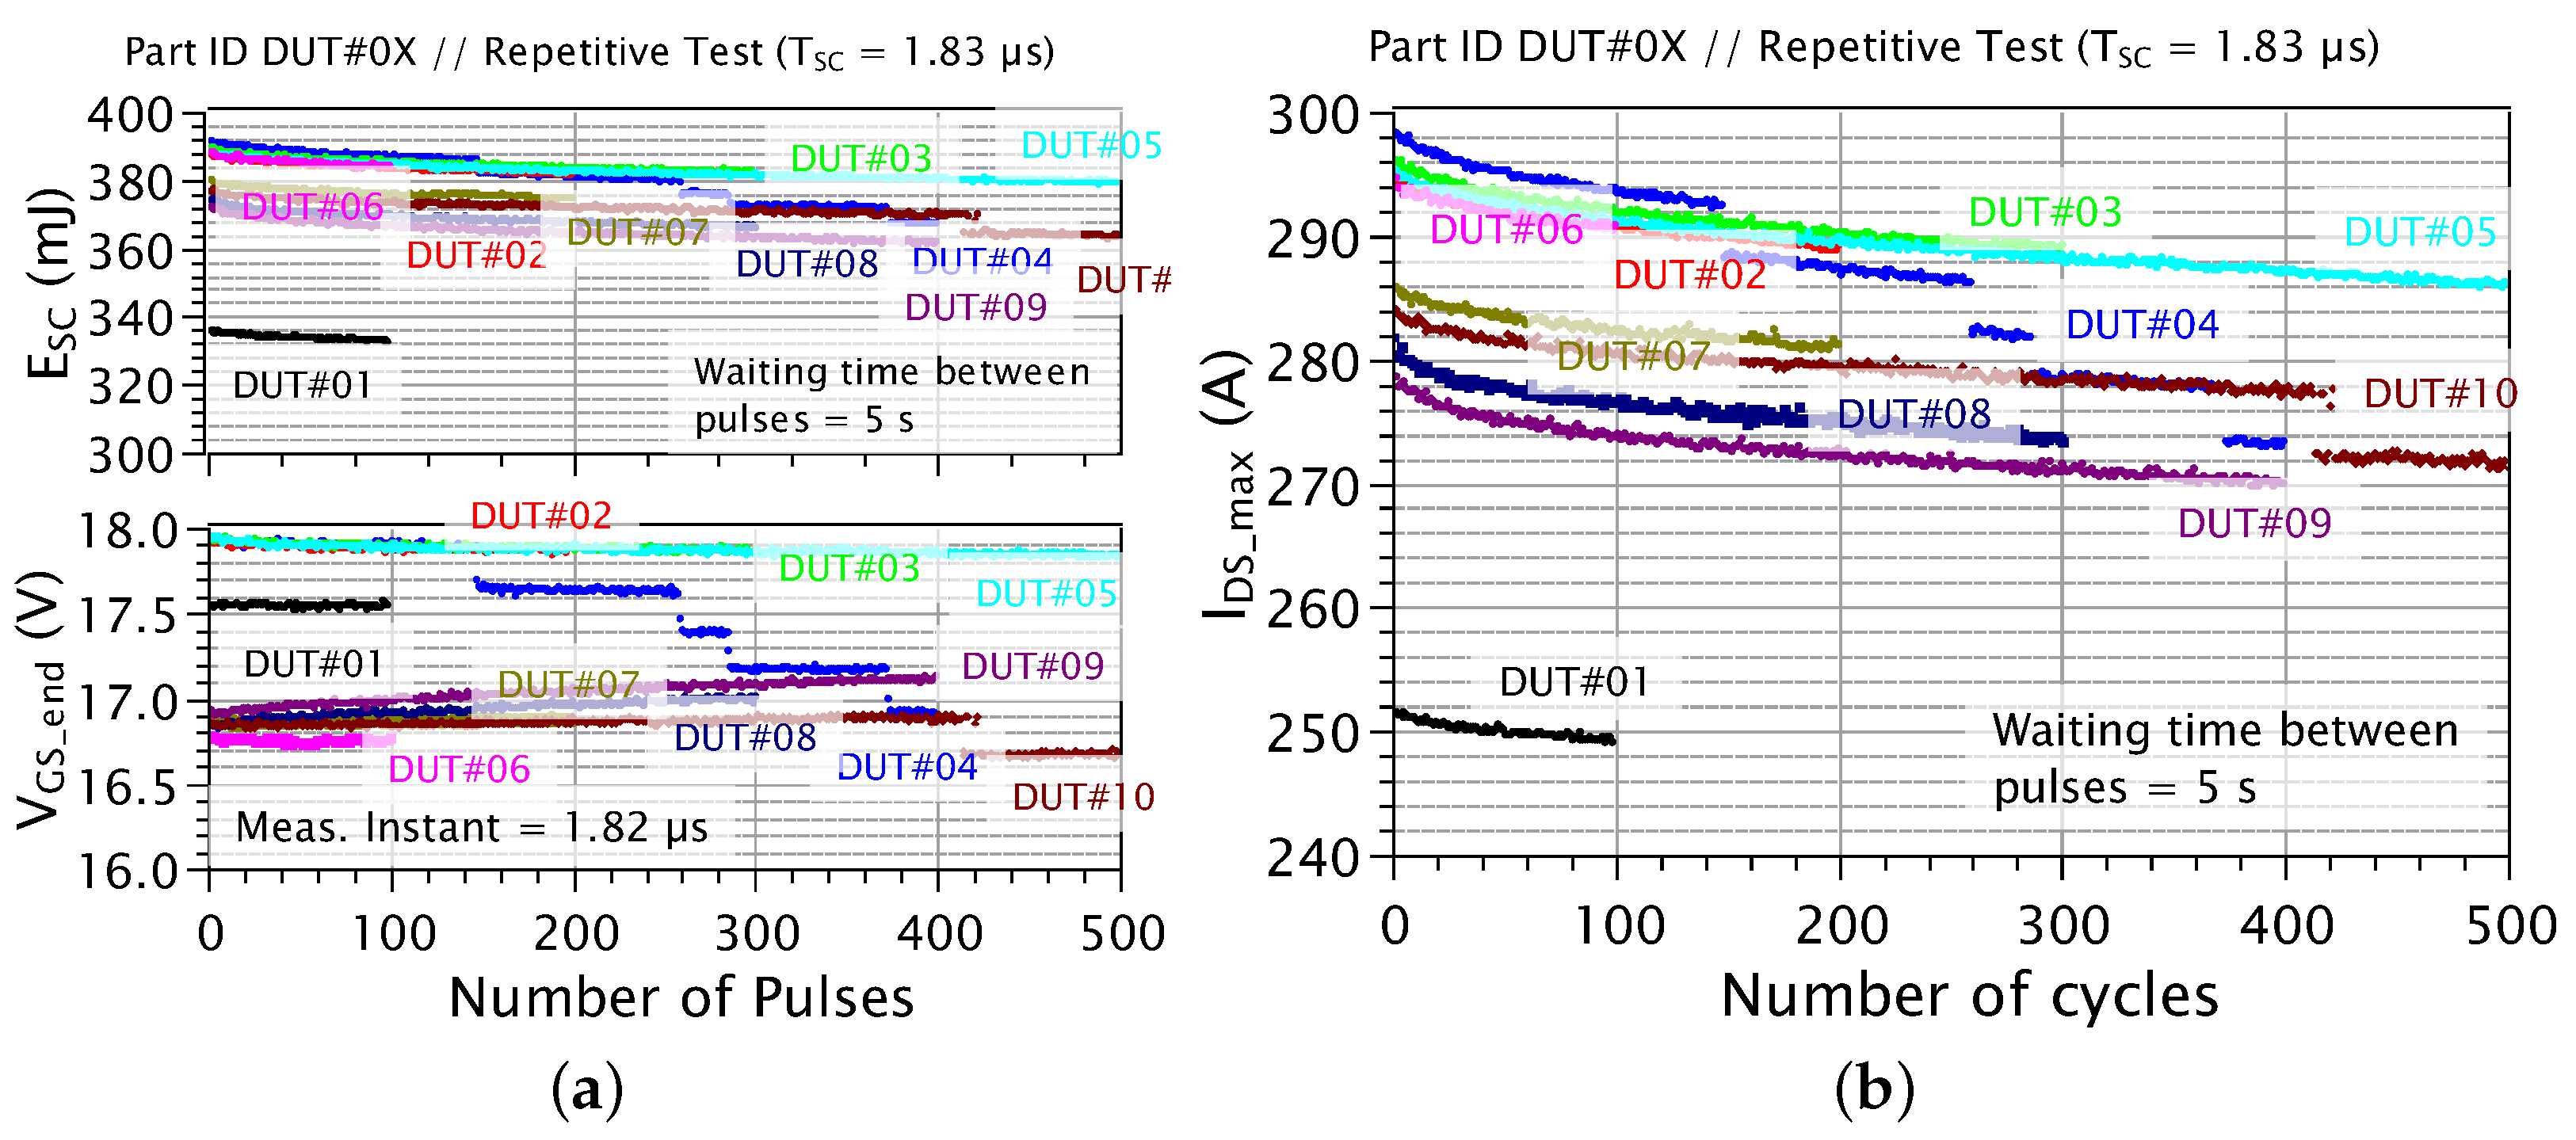
- B: Short-circuit condition: V, ( s), V; V and . On five groups of DUTs each composed of two DUTs, each group undergoes an increasing number of SC events (100, 200, 300, 400, and 500) as follows: DUT#01 and DUT#06 are submitted to 100 pulses;DUT#02 and DUT#07 are submitted to 200 pulses;DUT#03 and DUT#08 are submitted to 300 pulses;DUT#04 and DUT#09 are submitted to 400 pulses;DUT#05 and DUT#10 are submitted to 500 pulses;
- C: Repeat DC characterization after short circuit on available samples.
- D: Perform the electrical analysis.
In Figure 15, the real-time evolution of the tracking parameters (, , and ) is shown for the 10 tested samples. The compliance mask implemented at 900 V operation exhibited an acceptance rate of , with only DUT#04 and DUT#10 showing drift outside the compliance region. The successive step-downs observed in Figure 15 for these devices suggest that improvements can be made to the tolerance compliance mask. The results of the DC characterization are presented in Table 3. Notably, a higher gate leakage current was observed for DUT#04 and DUT#10 after the SC events, while the drift for the remaining samples was minimal.
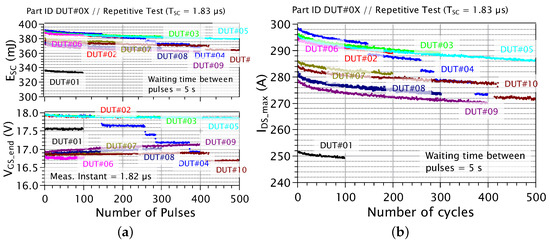
Figure 15.
Evolution of parameters (, , and ) as a function of the number of SC events. Ten DUTs were tested, with two devices per condition, enabling the monitoring of device degradation over the course of SC events. Safe margins of for and for were established. No critical degradation was observed within the safe margin (up to 500 SC pulses) in 8 out of 10 samples. (a) SC energy and gate-source voltage evolution as a function of the number of pulses for ten different samples; (b) Maximum drain-source current evolution as a function of the number of pulses for ten different samples.

Table 3.
DC parameters measured on 10 samples before and after SC stress testing.
To investigate the abnormal behaviors observed in these two DUTs during SC stress, lock-in thermography was performed on DUT#04, with the results presented in Figure 16. After delayering the device, damage to the oxide layer at the edge was observed. This failure mechanism is likely associated with the sudden drift in gate current, which induces a displacement current due to changes in the electric field. Additionally, since DUT#06 exhibited a drift in , it was also subjected to analysis. A die-level inspection revealed aluminum reconstruction around the wire-bonding pads, as shown in Figure 17.

Figure 16.
Overlap of internal inspection after delayering and lock-in thermography of the hot spots, illustrating the hypothesized crack-location sequence. Aluminum reconstruction is observed due to metal migration along the die. The oxide layer appears more damaged at the edges (indicated by the yellow arrow) and shows evidence of multiple cracks.

Figure 17.
Lock-in thermography reveals an initial reconstruction of aluminum around the wire bond contacts on the top side of the die. An increase in of approximately was observed after 100 cycles.
4.2. Investigation of Quasi-Simultaneous SC Degradation Study
In this section, the degradation mechanisms of SiC MOSFETs under quasi-simultaneous SC events are examined. Repetitive SC pulses with shorter waiting times are applied to investigate the self-heating effects and their impact on device performance. Insights into the aging process and reliability concerns related to the Schottky Emission (SE) effect are provided. The results obtained from varying SC pulse widths and intervals highlight both reversible and permanent degradation phenomena.
4.2.1. Quasi-Simultaneous SC Investigation
To better understand the combined effects of high temperature and high electric field, repetitive SC pulses were applied to the device with shorter waiting times between pulses (10 ms and 1 ms). This approach aims to increase the self-heating of the DUT during repetitive SCs, thereby accentuating the SE effect, which is driven by the temperature. This test corresponds to the aging protocol (STEP 3) of the proposed methodology.
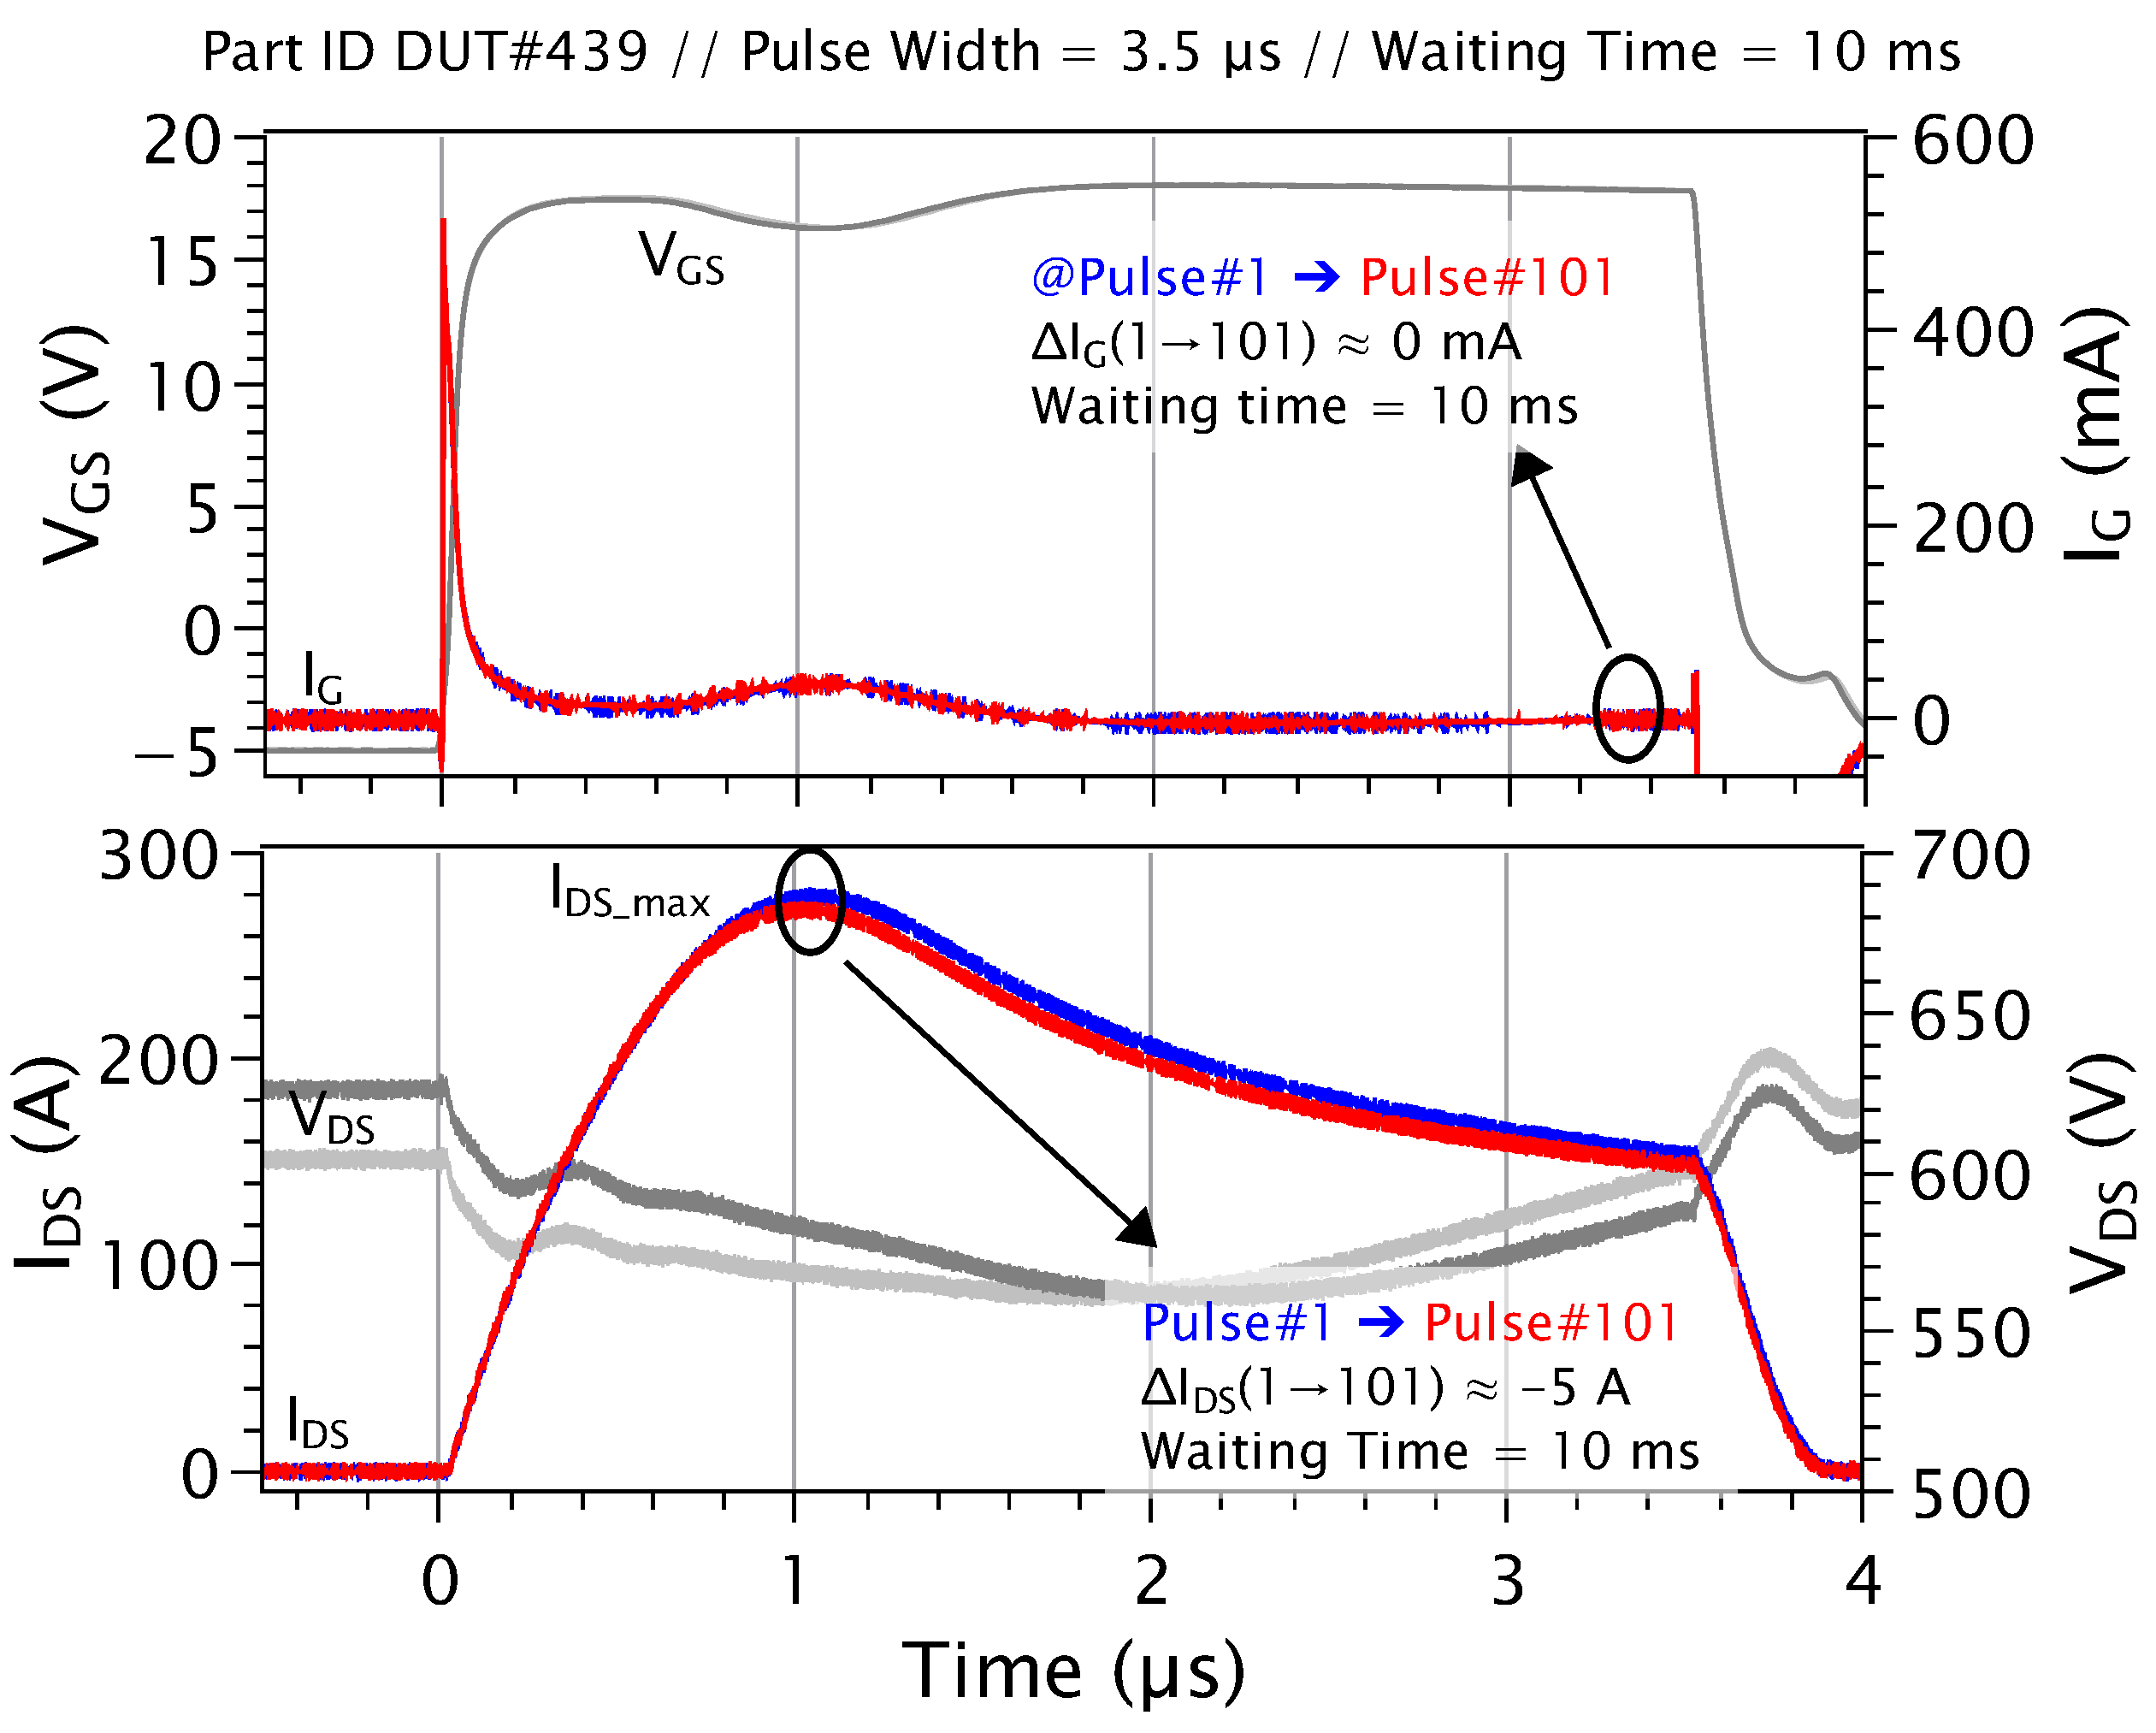
The SC pulse width is defined as s, with a waiting time of 10 ms under a voltage level of 600 V. In Figure 18, voltage and current waveforms are presented for the first and last SC events. No variation in gate current is observed after 100 pulses. The observed reduction in drain–source current is attributed to self-heating; however, this effect is non-permanent.
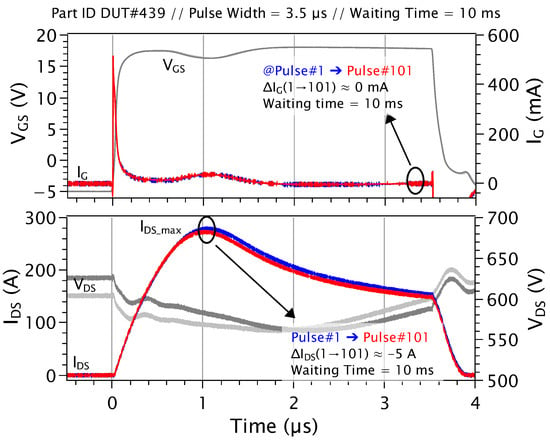
Figure 18.
Voltage and current waveforms for a 1200 V SiC MOSFET are presented for the first pulse (Pulse#1) and the last pulse (Pulse#101) during short-circuit events ( s). The waiting time between each pulse is 10 ms.
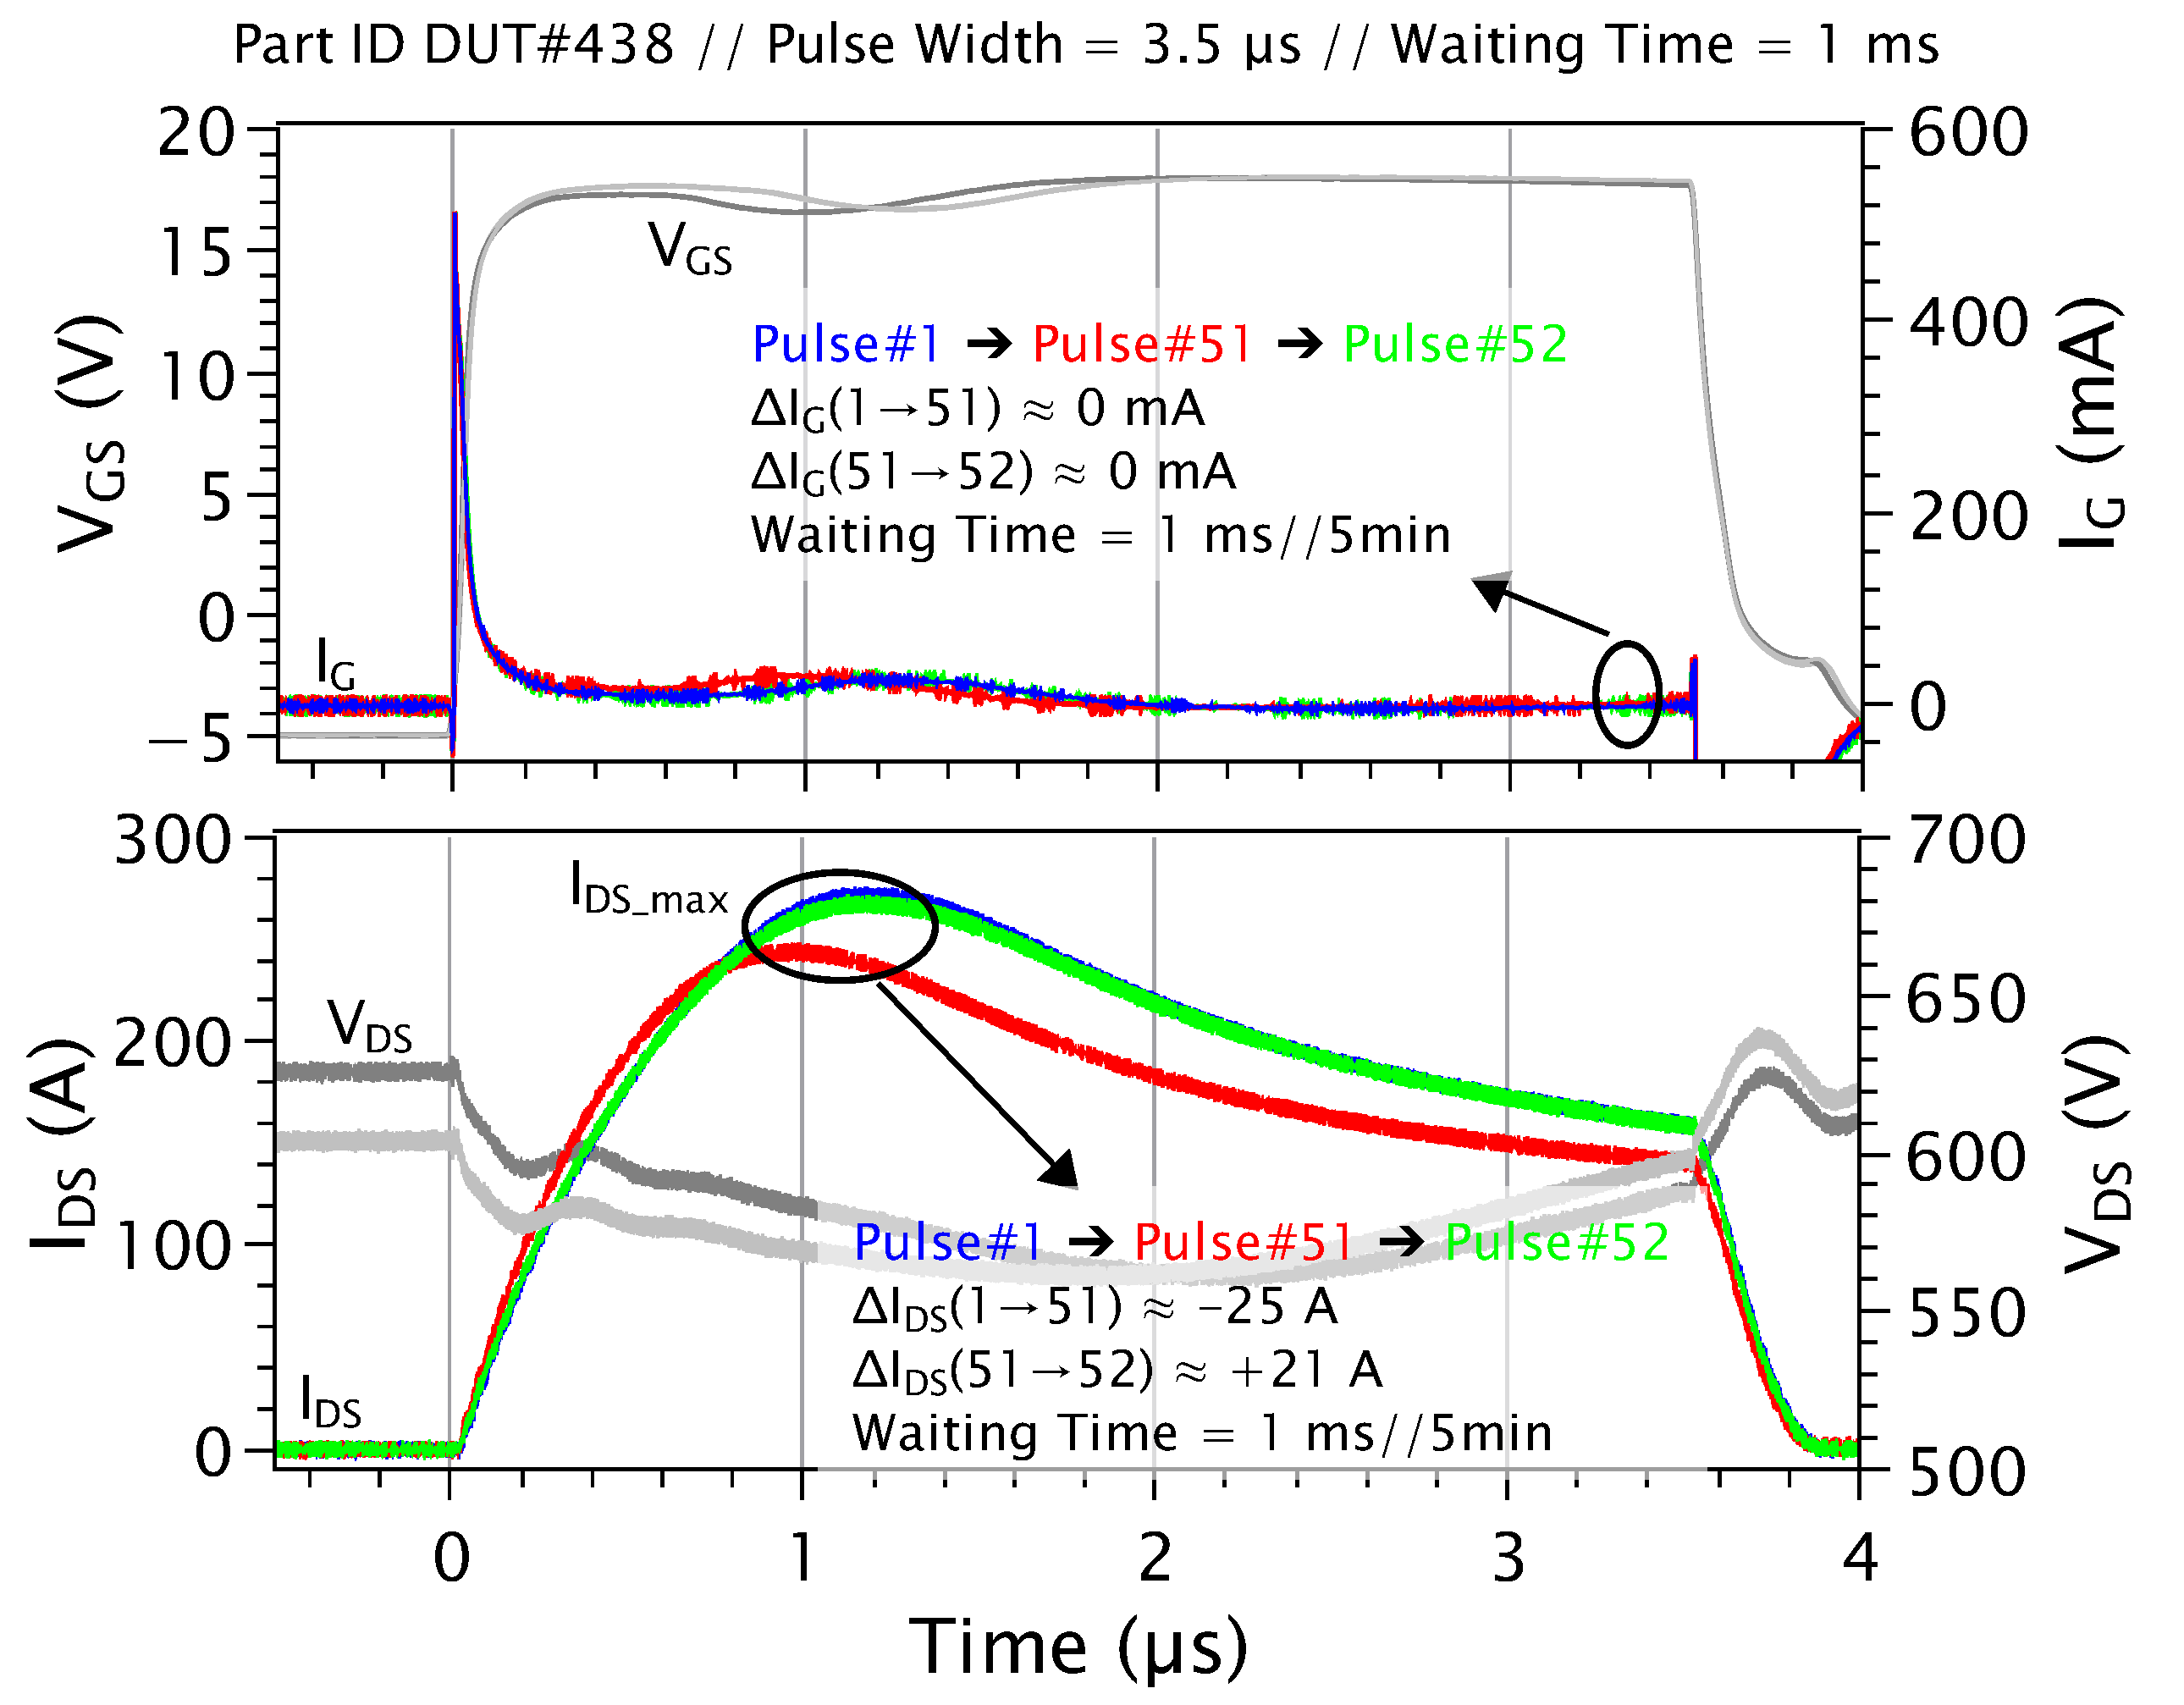
Under the same conditions, but with a waiting time of 1 ms, 50 pulses were applied to a pristine part, as shown in Figure 19. This resulted in a significant reduction in the saturation current , while no drift in the gate current () was detected. After allowing the device to cool for 5 min, a new SC pulse was applied, resulting in a variation of approximately 4 A only during the maximum SC drain–source current (). This may indicate degradation of the on resistance.
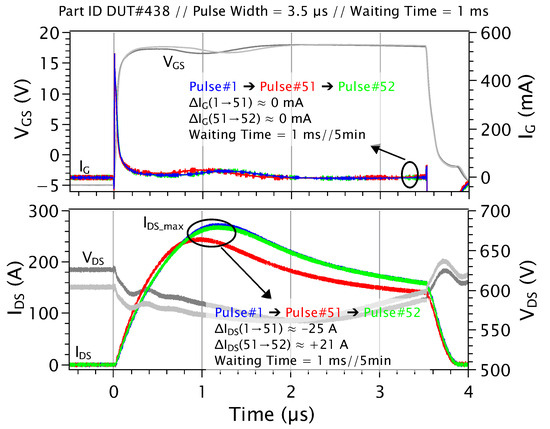
Figure 19.
Voltage and current waveforms for a 1200 V SiC MOSFET during short-circuit events are shown for Pulse#1, Pulse#51, and Pulse#52 ( s). The waiting time between Pulse#1 and Pulse#51 is 1 ms, and Pulse#52 is applied after a 5 min cooling period to allow the device to cool.
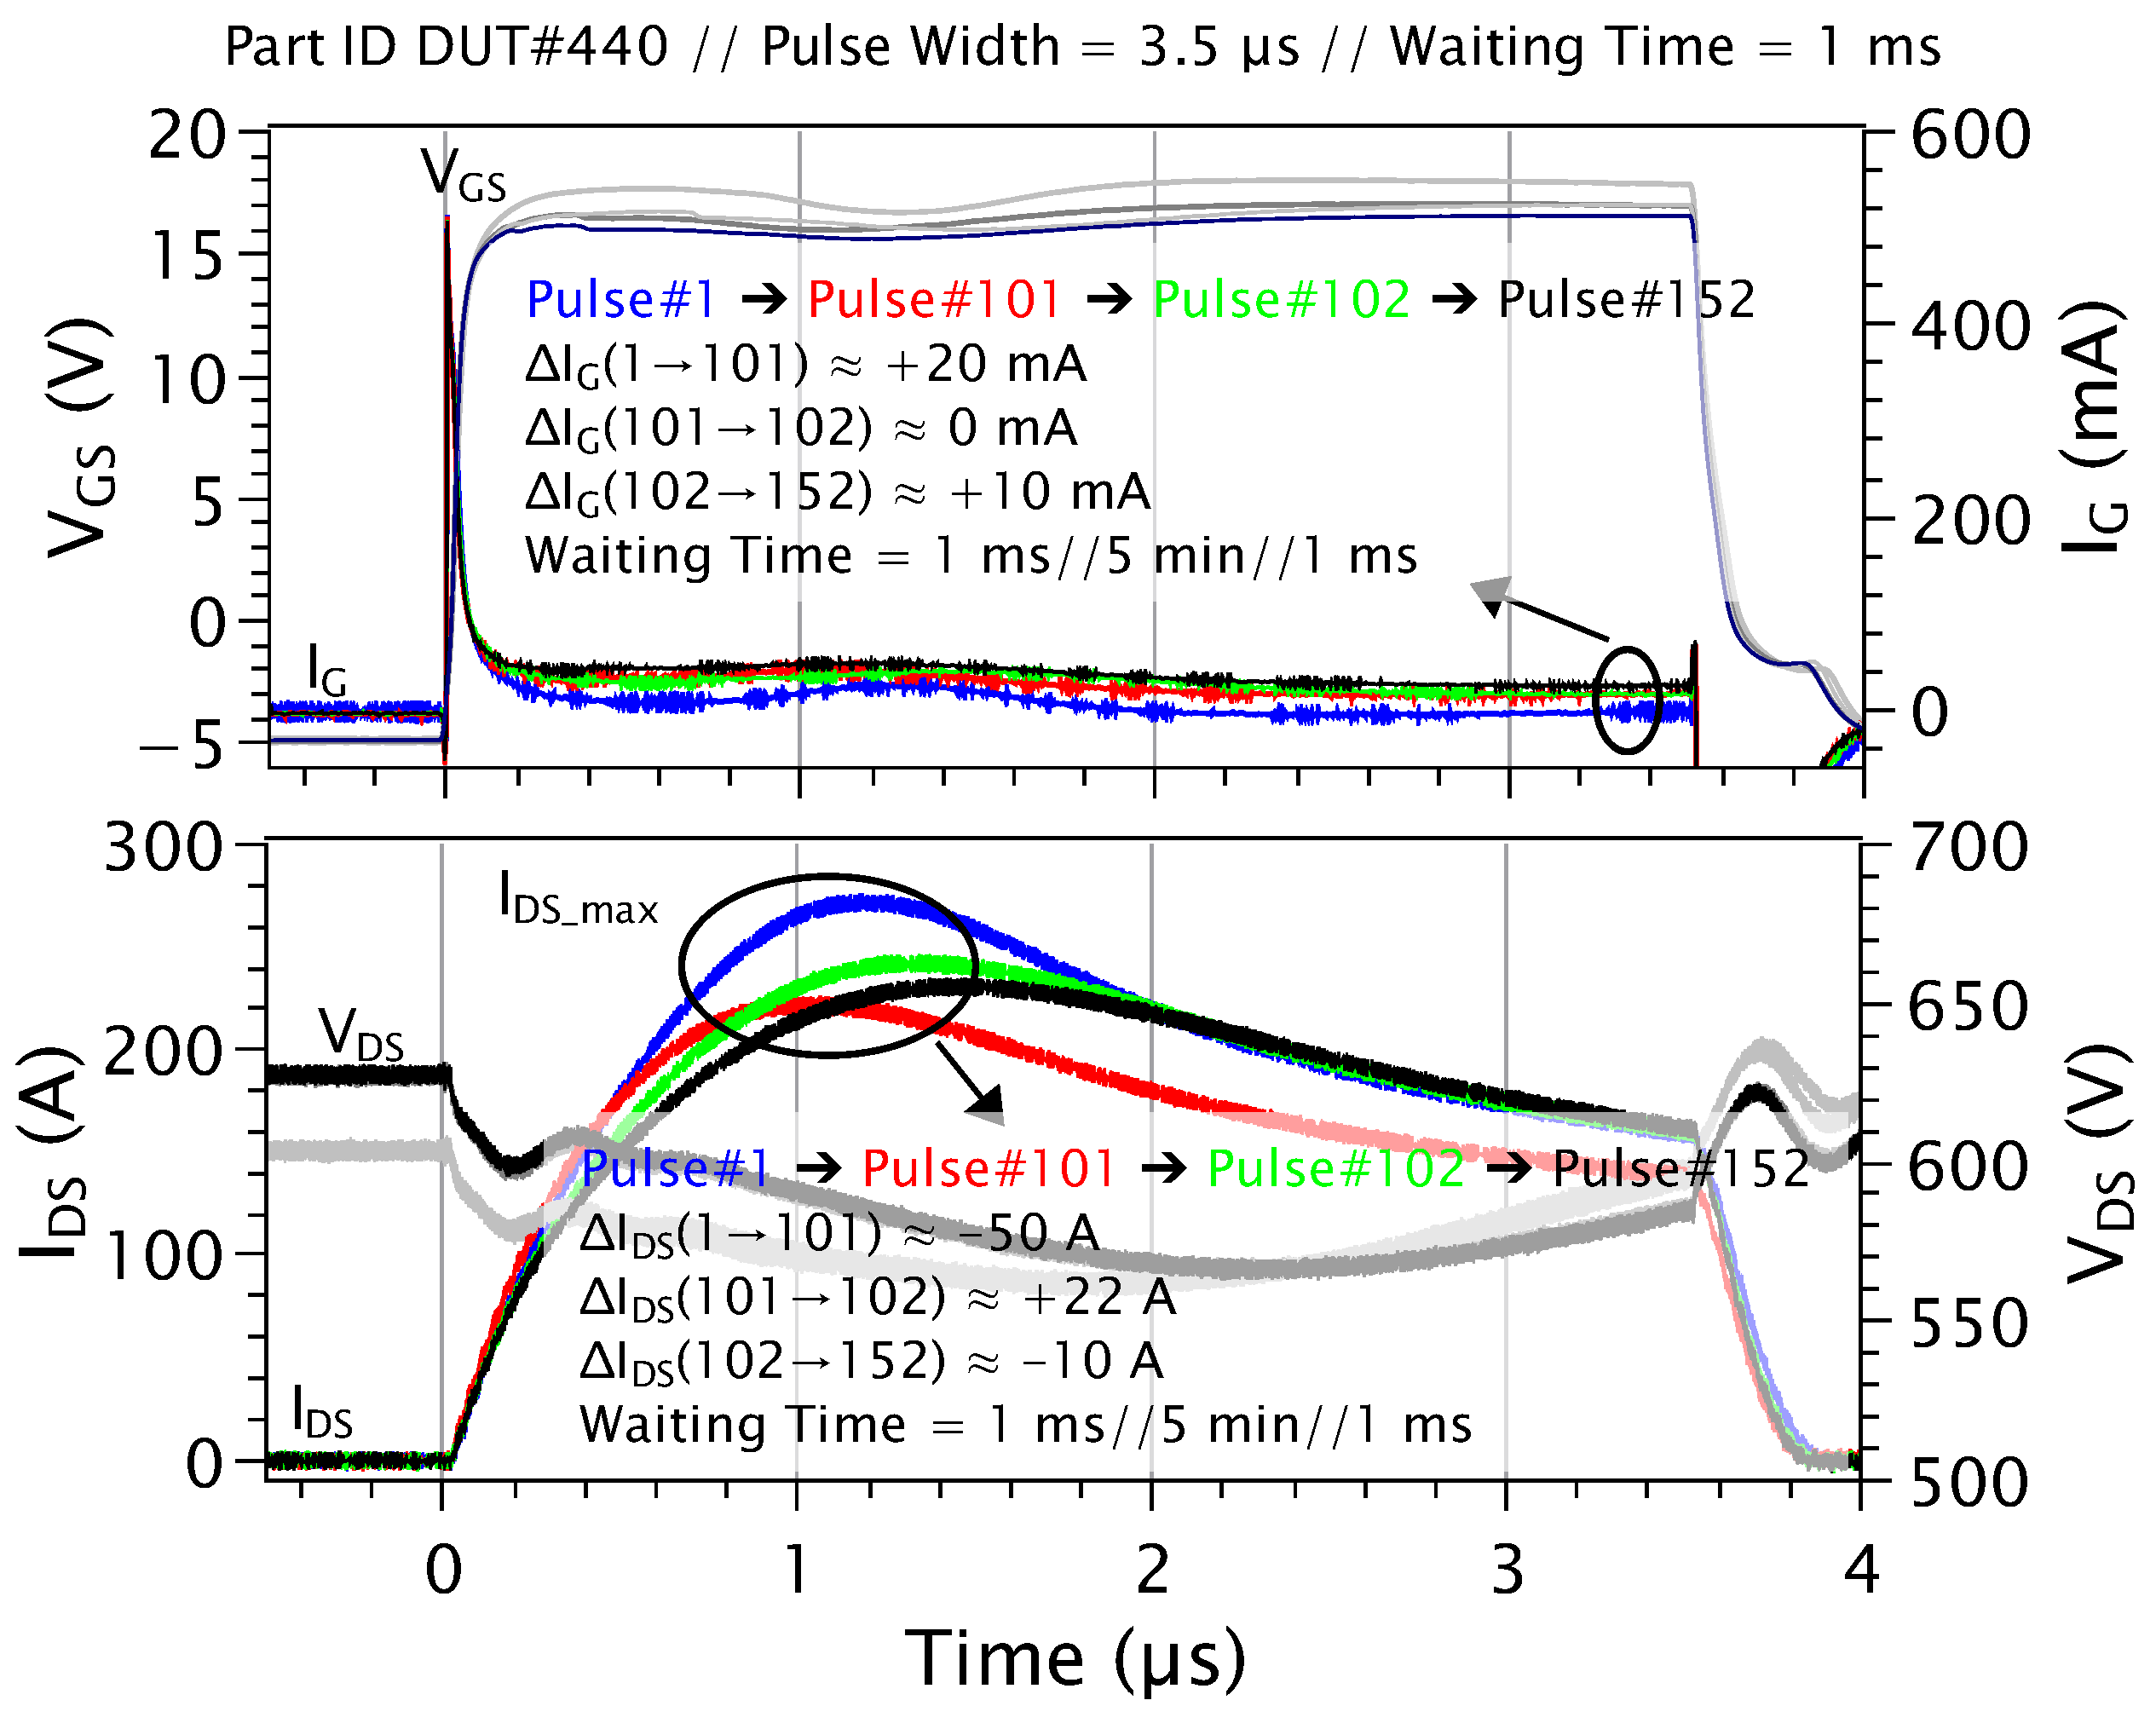
Afterwards, under the same conditions (waiting time of 1 ms), a higher number of pulses was applied to another pristine DUT, as shown in Figure 20. Following the first 100 SC pulses, an increase of 20 mA in gate current was observed. After a 5 min cooling period, another pulse was applied to check whether the drift could be recovered. The result was still an increase of 10 mA, indicating evidence of permanent degradation. Therefore, it is observed that the SE effect becomes more pronounced when the self-heating of the device is taken into account.
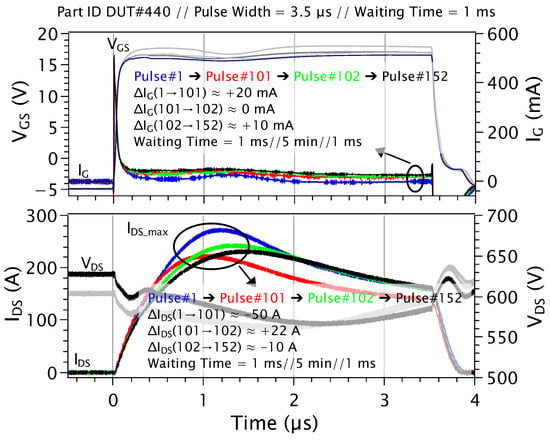
Figure 20.
Voltage and current waveforms for a 1200 V SiC MOSFET during SC events are presented for Pulse#1, Pulse#101, Pulse#102, and Pulse#152 ( s). The waiting time between Pulse#1 and Pulse#101 and between Pulse#102 and Pulse#152 is 1 ms. Pulse#102 is applied after a 5 min cooling period to allow the device to cool.
The increase in leakage gate current due to repetitive SC pulses with short waiting times can impact the reliability of SiC MOSFETs. This can lead to a reduction in the lifetime of power converters utilizing this technology.
4.2.2. SC in False Turn-On Operation
During the switching transients of a power converter (phase-leg) in normal operation, false turn-on events can occur while the synchronous switch is in the off state [18]. SiC devices are particularly susceptible to this phenomenon due to their high switching speeds, making them prone to very short SC pulses during these switching operations. To investigate this condition, an aging test (STEP 3) is proposed, incorporating very short SC pulses at high repetition frequencies.
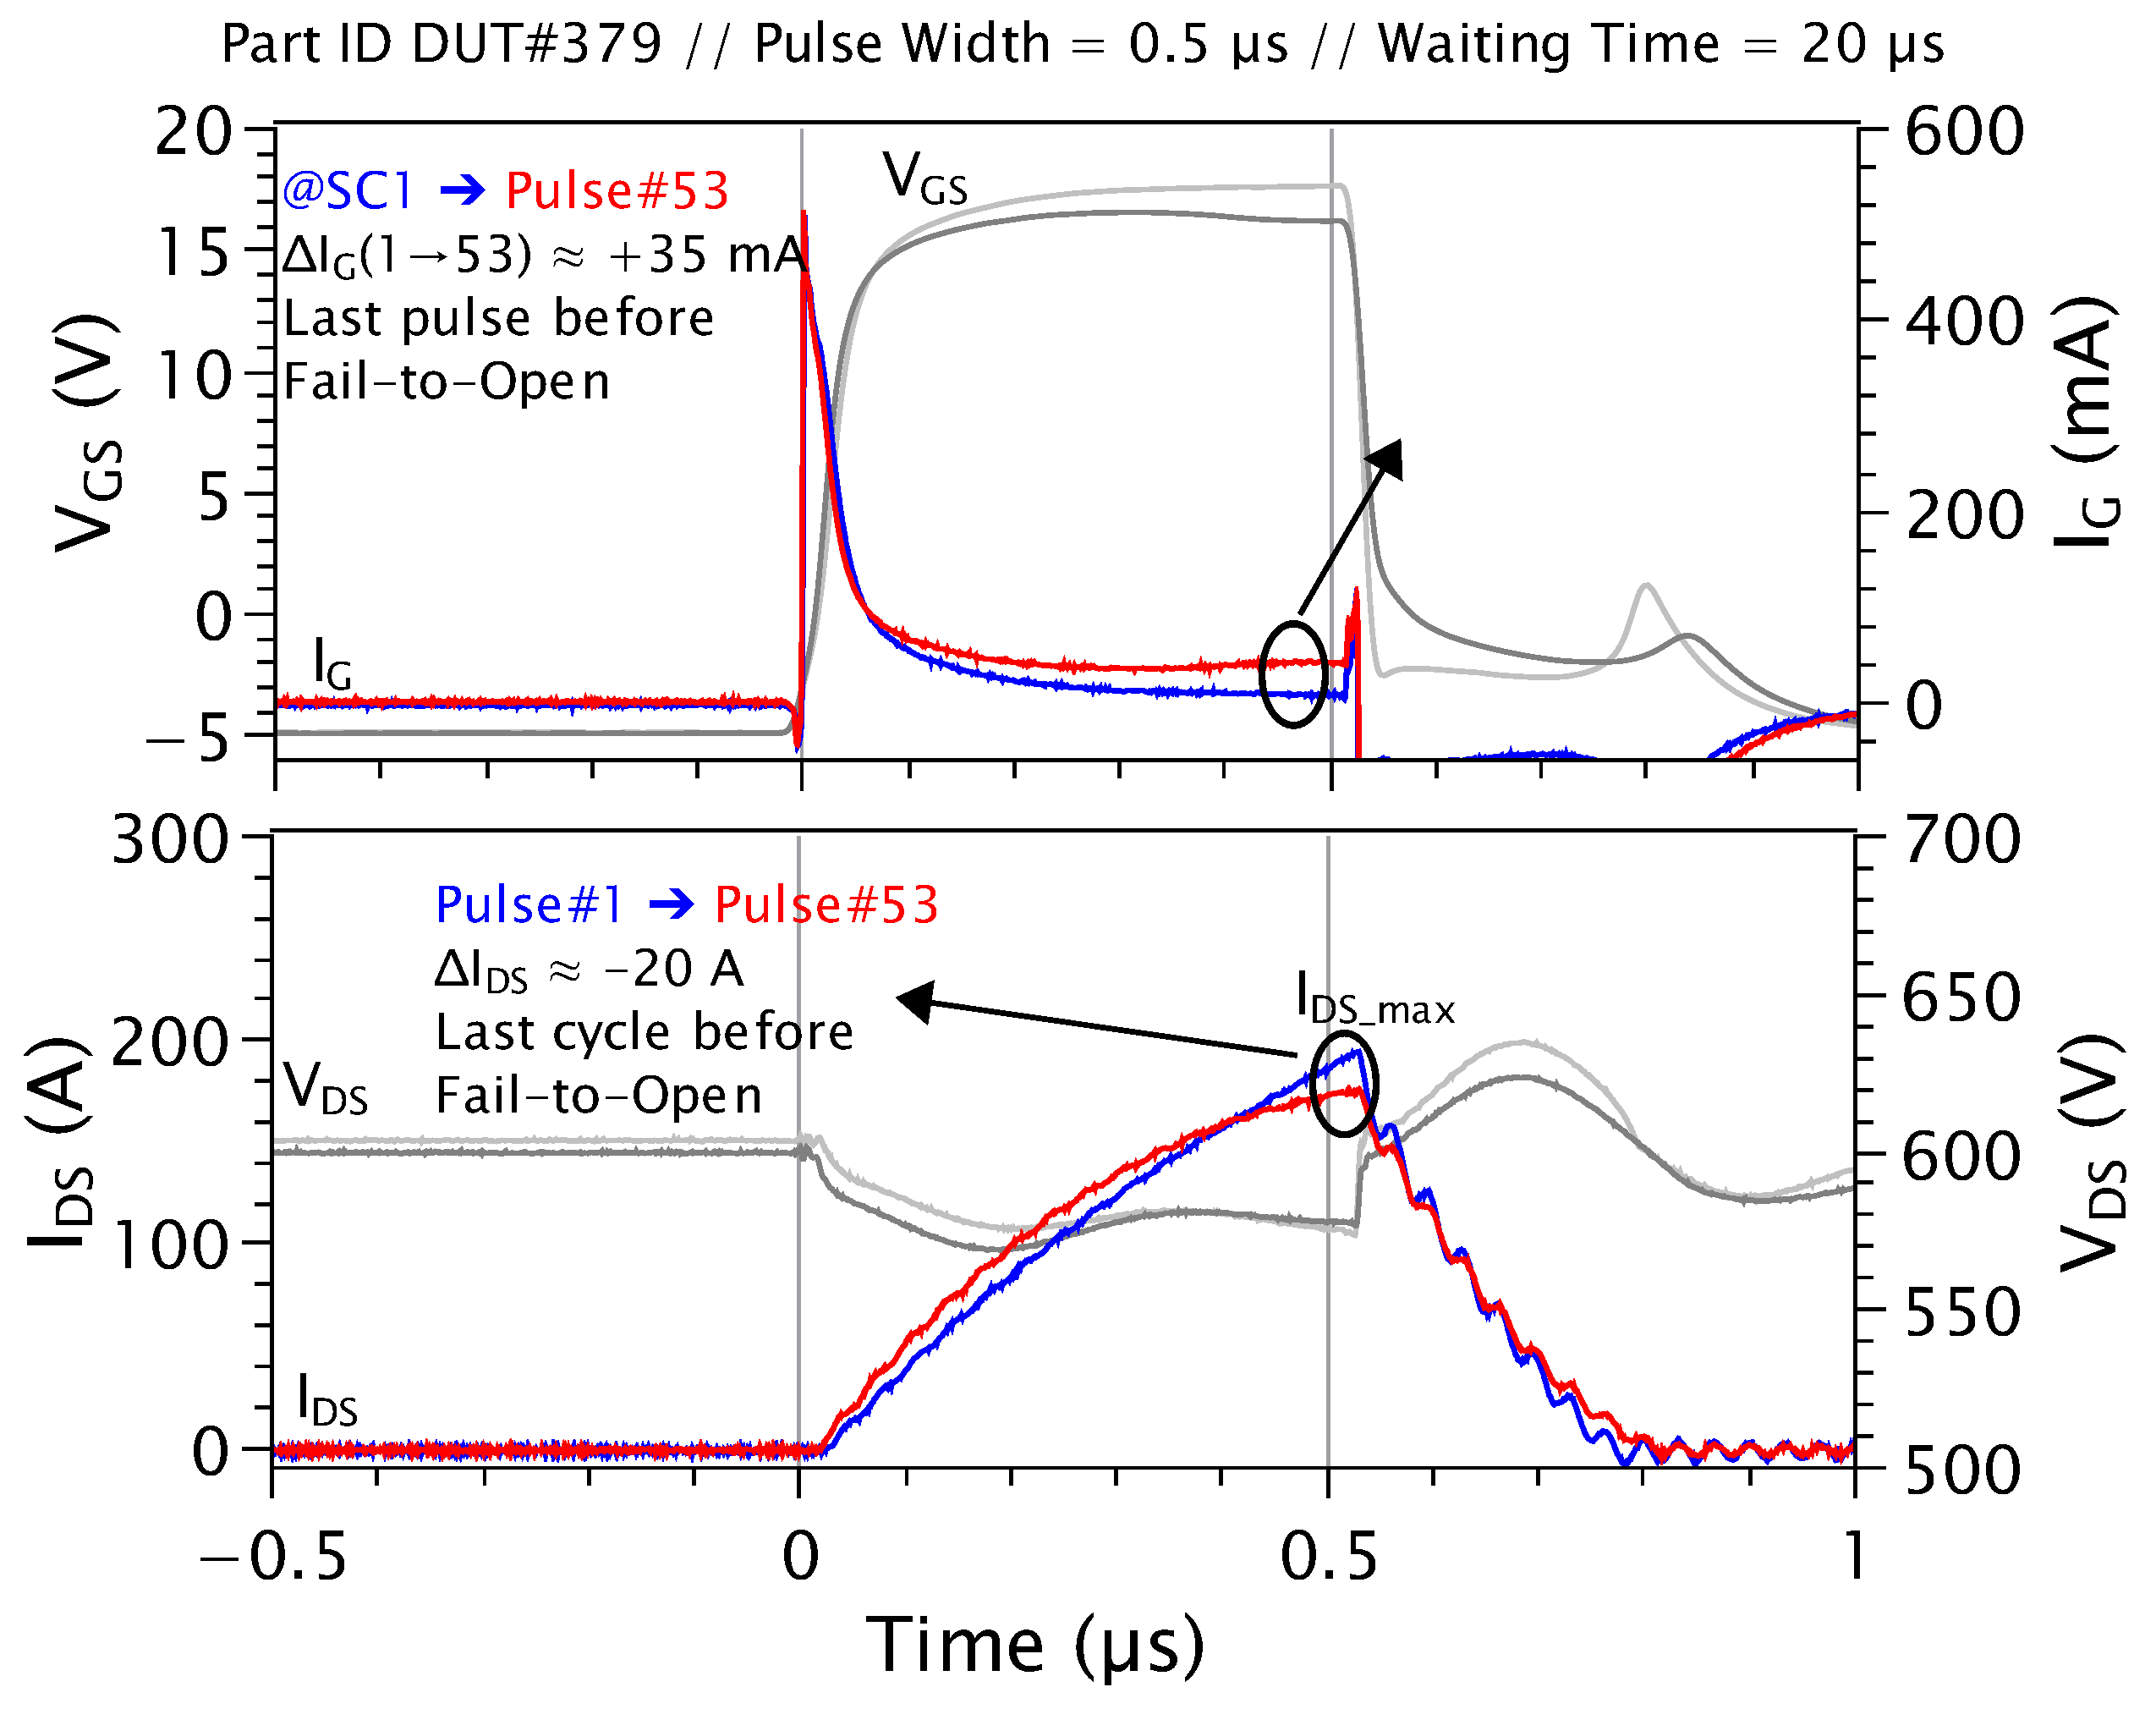
A SiC-MOSFET-based phase-leg with synchronous high/low-side switches can exhibit ringings in the of the complementary switch when the main device is turned on. This can potentially cause false turn-on events, leading to brief short circuits that may occur frequently if such fast disturbances are not detected by the safety system. To evaluate this behavior, a s SC pulse with a frequency of 50 kHz (one pulse every 20 s) is applied to a SiC MOSFET device until it fails. Data are collected, and a comparison between the first SC event and the last pulse before failure is shown in Figure 21. After 53 pulses, under a voltage level of 600 V, the device is in FTO mode, meaning it can still withstand the blocking voltage but no longer has switching control. A gate current drift of 35 mA is measured before destruction, indicating a tenfold reduction in the SC current capability, which leads to a significant reduction in the device lifetime. To ensure a safety margin, the design of the power converters must be optimized to mitigate false turn-on phenomena.
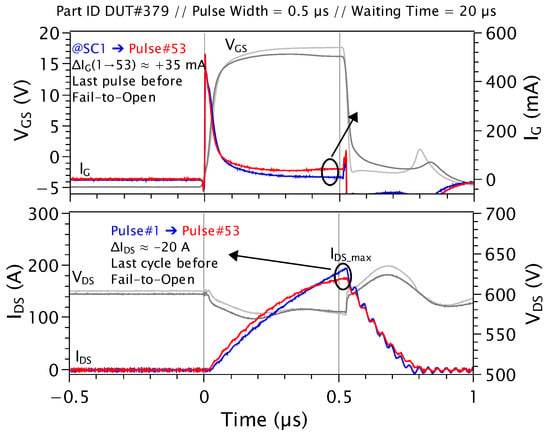
Figure 21.
Voltage and current waveforms for a 1200 V SiC MOSFET during SC events are shown for Pulse#1 and Pulse#53 ( s). The waiting time between pulses in the train is 20 µs. A pulse train consisting of 100 events is applied to determine the failure time. The device is found to withstand 53 pulses under these conditions.
4.2.3. Phenomenological and Technological Insight
The SiC MOSFET device builds upon the Silicon Vertical Diffused MOSFET concept developed in the 1980s [19], as illustrated in Figure 22. Despite using a large (non-optimized) distance “d” between each P body region, the MOSFET features a self-shielding structure. The maximum electric field (0.3 MV/cm) developed between the drain and source when reverse-biased may eventually reach the gate layer, but it will not stress the gate layer, which can sustain higher electric fields (FN tunneling mechanism starts at 3 MV/cm), as shown in Figure 23. Consequently, the failure mechanisms related to the gate oxide layer are distinct from those associated with the reverse-biased diode. Specifically, High Temperature Gate Bias (HTGB) stresses the gate alone, while High Temperature Reverse Bias (HTRB) stresses the diode avalanche. These tests, following JEDEC standard [10], are used to assess the effects of bias conditions and temperature on solid-state devices over time.
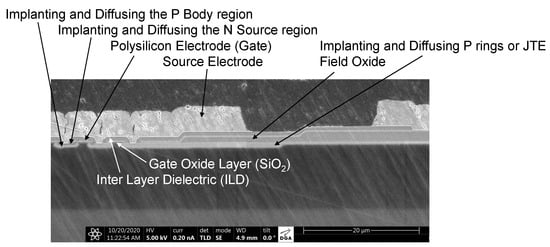
Figure 22.
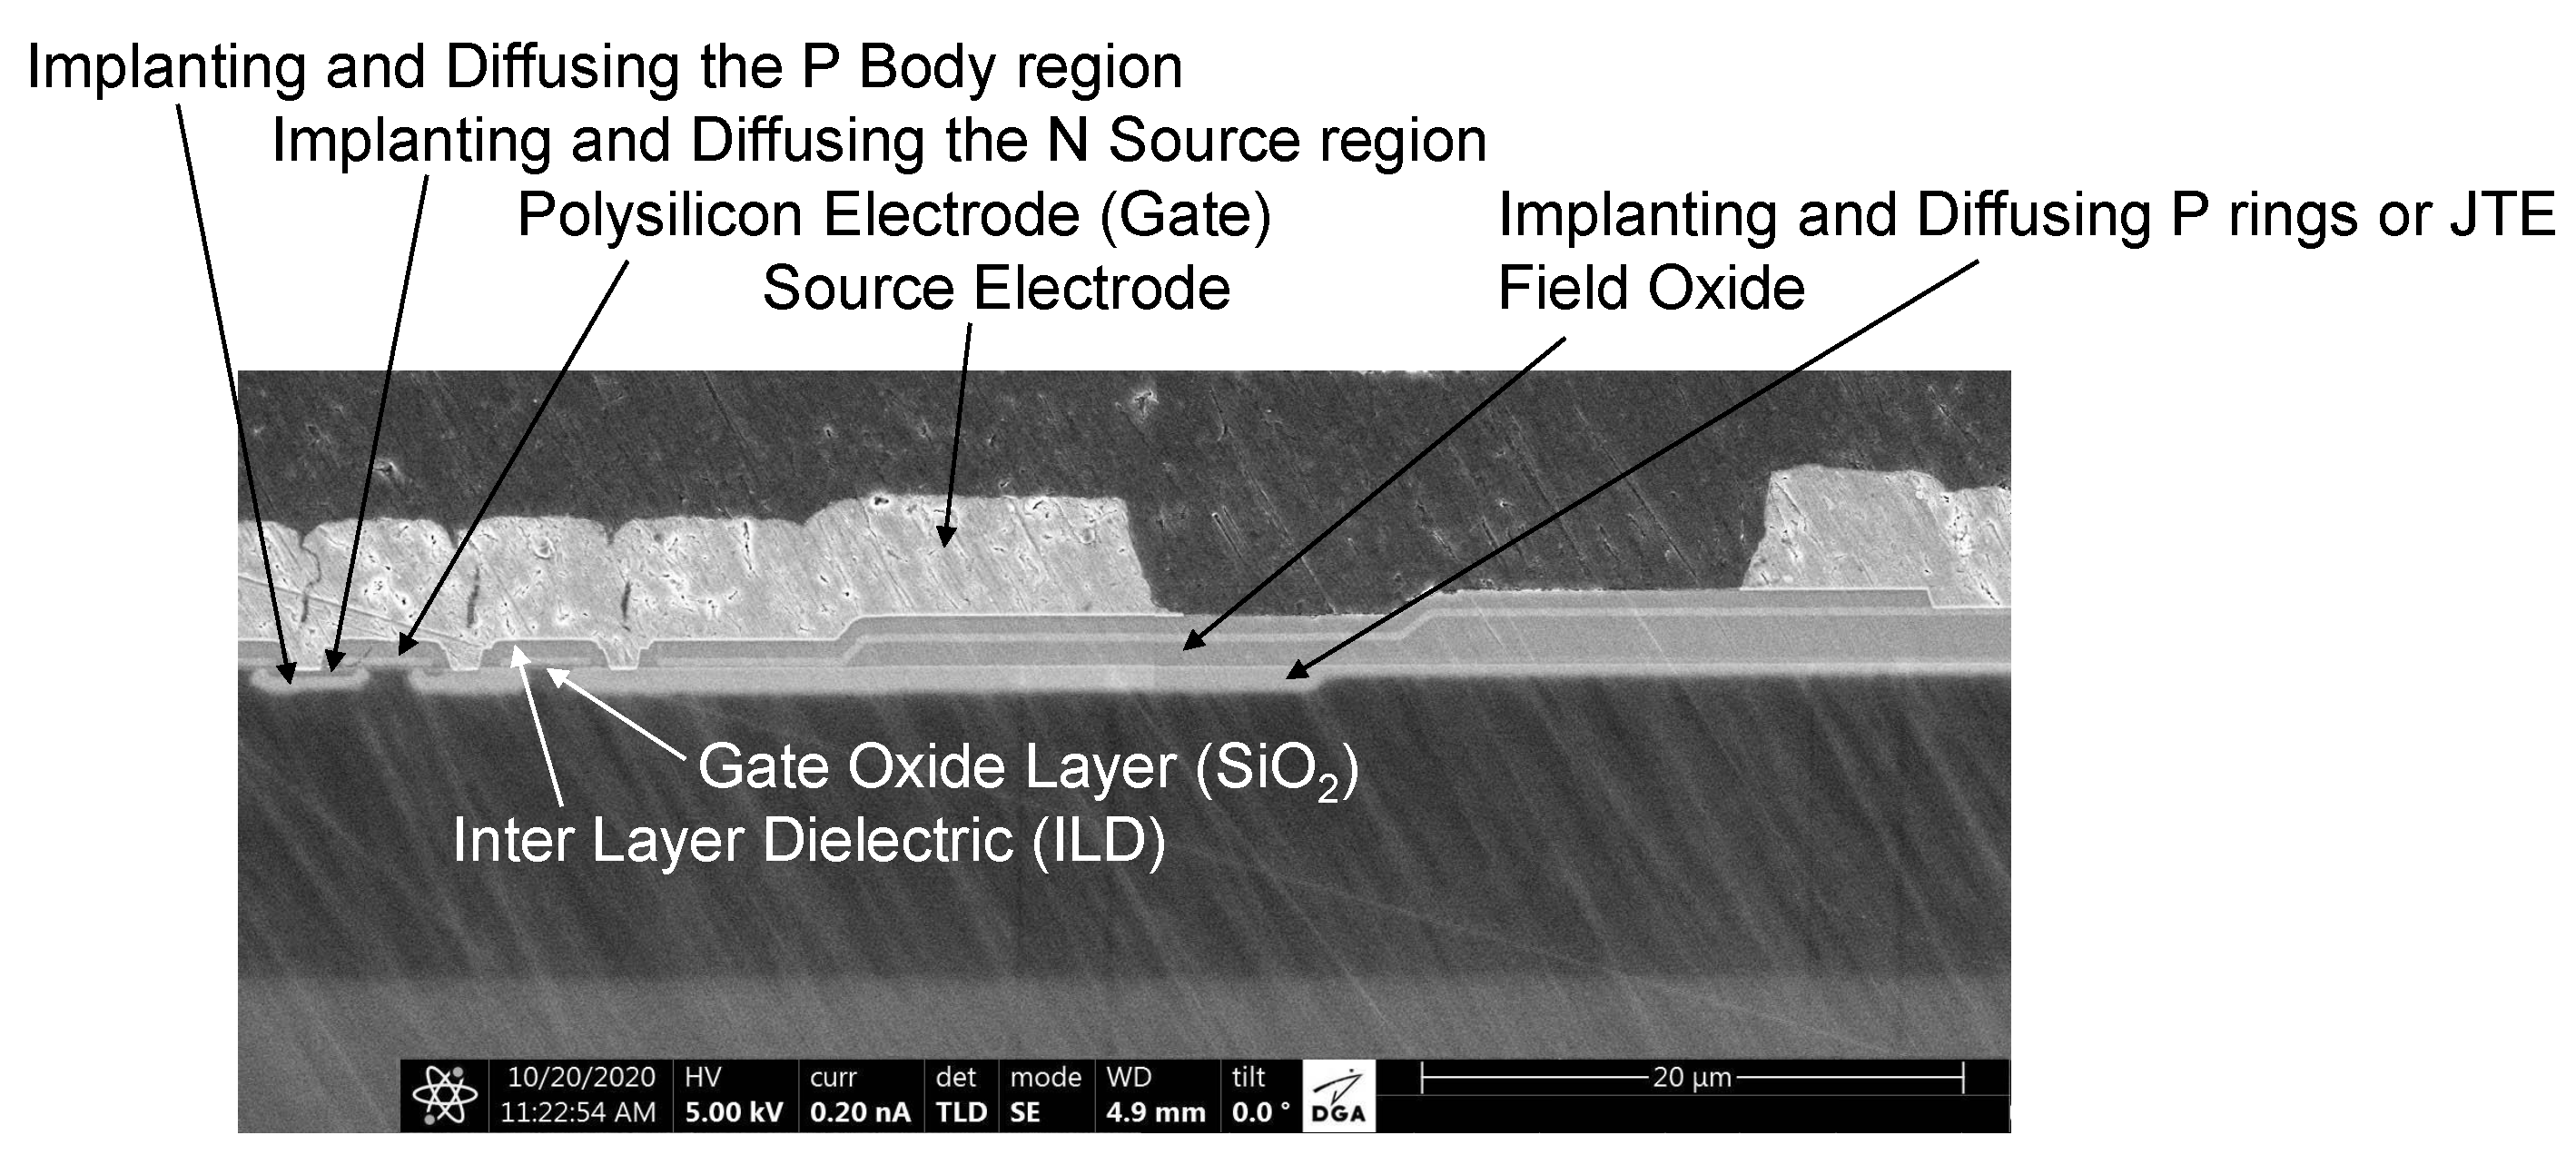
Scanning Electron Microscopy (SEM) of a Vertical Diffused MOSFET. The active area requires precise base cell design to ensure maximum current conduction either through the gate or the PiN diode. The termination area must effectively spread out the electric field to ensure maximum breakdown voltage.

Figure 23.
(a,b) Effects of pitch dimension (d) on electrical field concentration around the gate structure. (c) A typical SiC model structure, including the internal resistance path, is shown. Adapted from [20].
The gate oxide layer is also unaffected by Unclamped Inductive Switching (UIS) avalanche stress, whether single or repetitive. The parameters governing the activation of BJT latchup are primarily the P body doping amount below the N+ source and the base cell design.
The SiC material can sustain up to 10 times more electric field compared to silicon. This enables tuning the epitaxy doping profile—using a thinner layer (10 m vs. 120 m) and higher doping levels (around vs. )—to achieve the same breakdown voltage range (1200 V) while significantly reducing . Additionally, the P body junction depth is reduced by a factor of 2 to 3 compared to silicon. These changes—enhanced electric field capability, increased epitaxy doping, and reduced junction depth—significantly affect the electric field distribution below the gate oxide layer. To mitigate these effects, the distance d can be reduced, although this may increase the . Consequently, the failure mechanisms related to the gate oxide layer may also be associated with those of the reverse-biased diode. In other words, HTRB, UIS, and SC conditions not only stress the diode but also impact the gate oxide layer.
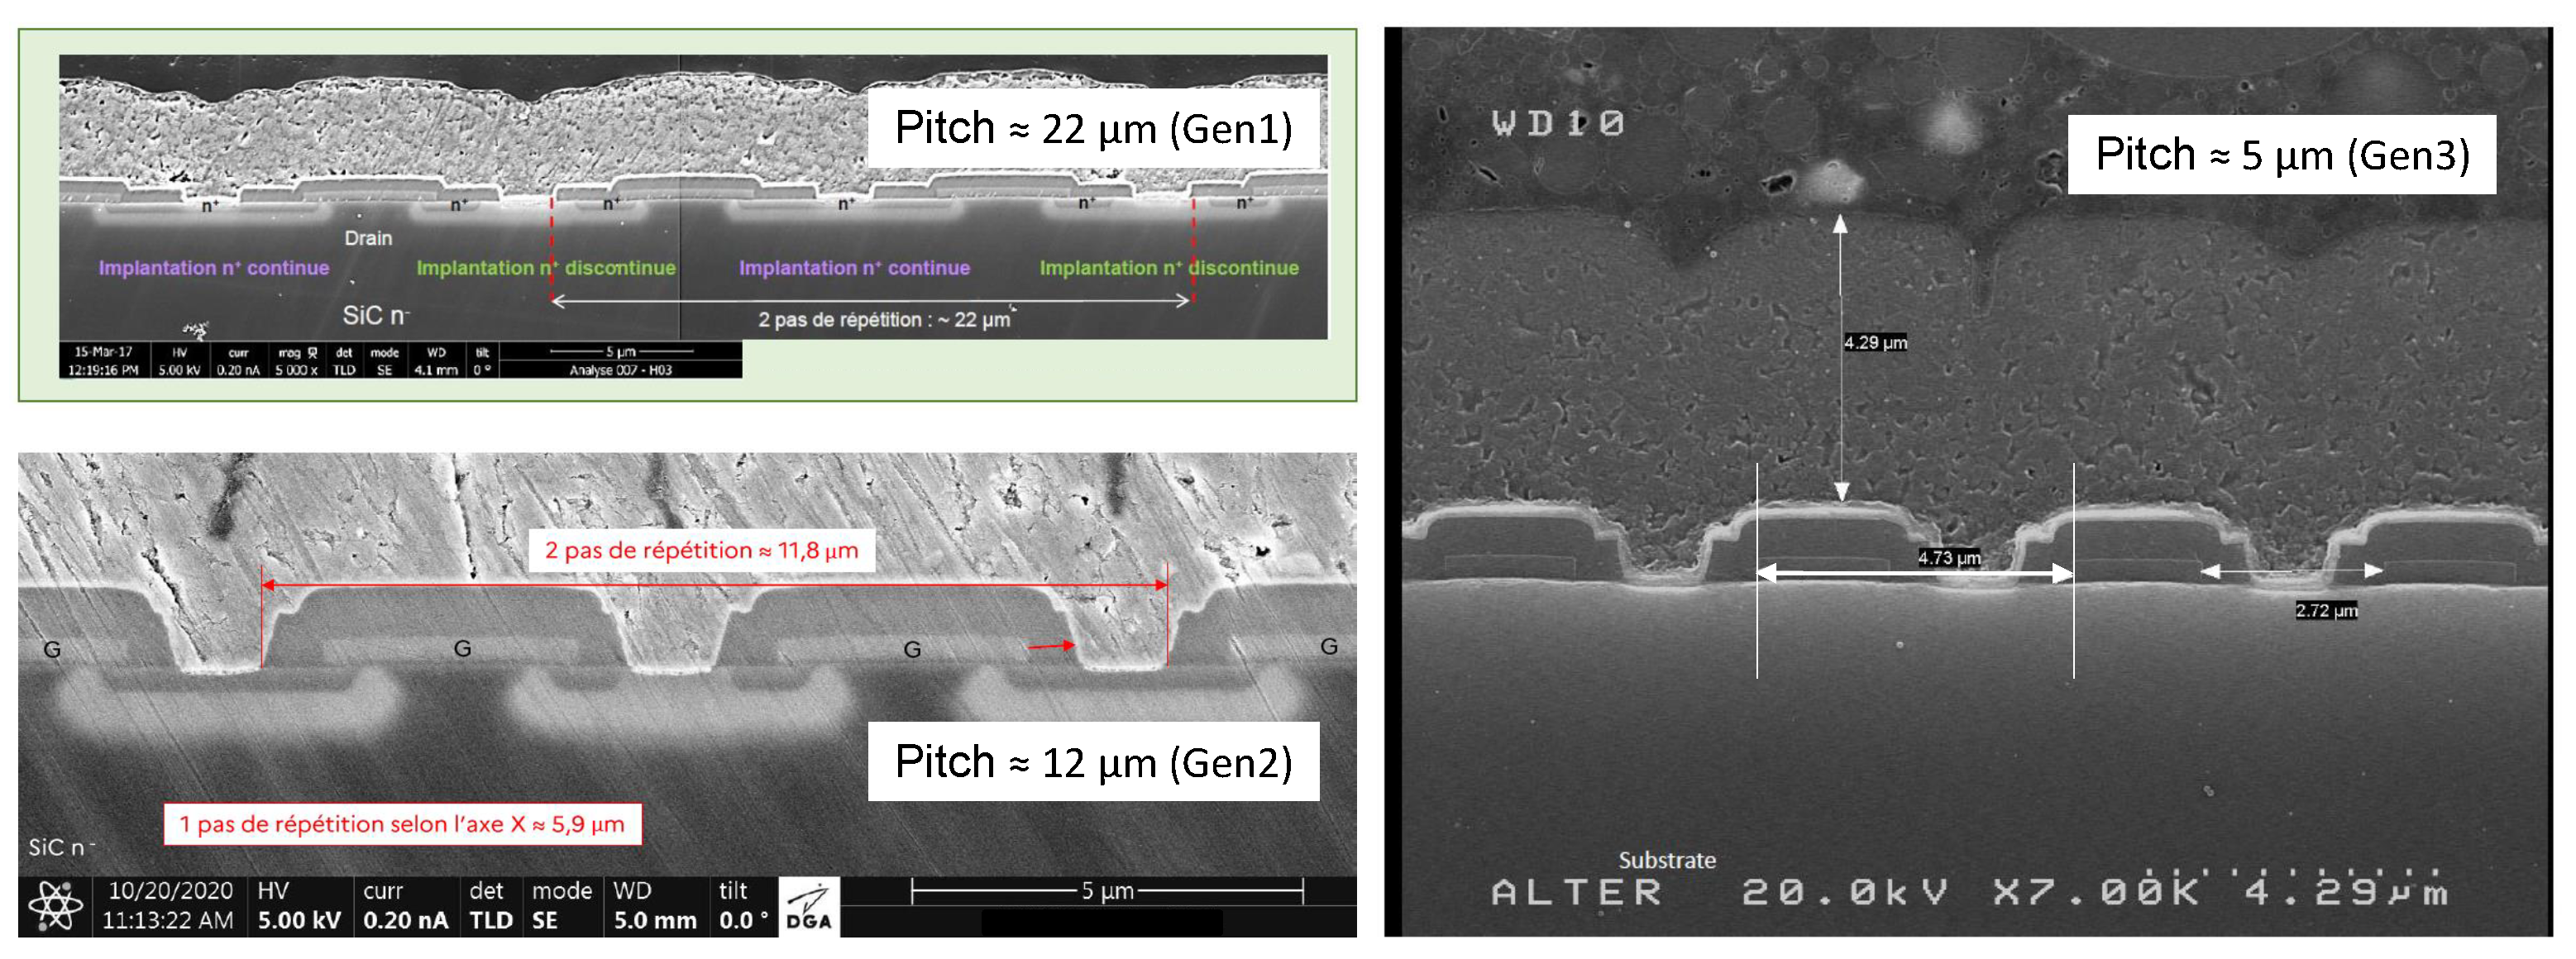
Cross-section analysis was performed on three different SiC MOSFET generations (Figure 24). The analysis reveals a reduction in pitch dimensions with advancements in manufacturing technology. As previously discussed, this shielding is crucial for protecting the gate oxide, which is positioned at the top of the device, from high electrical fields.
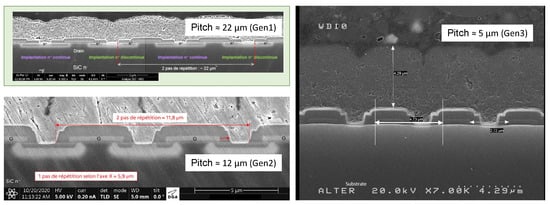
Figure 24.
SEM of cross-section for three different SiC MOSFET 1200 V generations.
For SiC-based devices, the SE effect is more pronounced than in Si-based MOS systems as the band offset and, consequently, the potential barrier for electrons are lower [15]. Previous studies, on early generations, have observed an SE current at the end of the SC pulse [9]. This phenomenon arises from electrons crossing the barrier established by the gate insulation due to the simultaneous effects of high temperature and high electric field. However, in [9], older generations of technologies were examined (e.g., DUT Gen1) compared to the present study (DUT Gen2). As illustrated in Figure 24, the pitch dimension has been significantly reduced with manufacturing improvements, resulting in a diminished SE effect.
5. Conclusions
A systematic test methodology for assessing the SC performance and safe operating conditions of power SiC MOSFETs was proposed and validated. These devices, which are critical for high-dependability applications, such as automotive, rail, and aeronautics, were found to be more sensitive to SC degradation compared to their silicon counterparts. This increased sensitivity is attributed to the reduced die size and higher current density of SiC MOSFETs despite their superior voltage blocking capability and energy efficiency.
The SC withstand time for various drain–source voltages was determined, revealing a significant reduction as the drain–source voltage approached the device’s maximum rating. Additionally, progressive degradation in key parameters, such as gate leakage current and drain–source current, was observed during repetitive SC events, with device failure eventually occurring. A correlation between SC energy, pulse width, and device degradation was established, emphasizing the importance of precise SC energy monitoring to extend device lifespan.
Two major failure mechanisms—thermal runaway and ILD degradation—were identified under SC stress. These mechanisms were shown to be influenced by the duration and frequency of SC events, with thermal runaway becoming dominant at higher drain–source voltages and longer SC pulses. The concept of an SC safe operating area was explored, demonstrating that quasi-simultaneous SC events, particularly in phase-leg topology with synchronous operation, significantly affect device lifetime.
Through this work, a deeper understanding of the SC failure modes in SiC MOSFETs has been achieved, and a comprehensive methodology for evaluating SC performance has been provided. These findings are expected to inform design rules and improve the reliability of SiC MOSFETs in high-stress environments.
Author Contributions
Conceptualization, J.O., J.-M.R., H.M. and P.F.; methodology, J.O., J.-M.R. and H.M.; software, P.F.; validation, J.O., J.-M.R., H.M. and F.C.; investigation, L.A., S.A. and M.P.; writing—review and editing, J.O., J.-M.R., H.M. and F.C.; supervision, O.P., L.A., S.A., M.P. and F.C.; project administration, O.P. and F.C. All authors have read and agreed to the published version of the manuscript.
Funding
This work was carried out in the framework of the IRT Saint Exupéry’s project SiCRET (SiC Reliability Evaluation for Transport) Ref: CDP-E-077-110-V0. We acknowledge the financial support from the SICRET’s industrial and academic members and the financial support from the French National Research Agency (ANR). SiCRET Industrial members: Alstom, Alter Technology, Emotors, Liebherr, Nucletudes, Safran, SuperGrid Institute, Thales, and Vitesco Technologies. SiCRET academic members: Ampère, LAAS, IES, and LAPLACE.
Data Availability Statement
The original contributions presented in the study are included in the article, further inquiries can be directed to the corresponding author.
Acknowledgments
The authors would also like to thank Francesco Pintacuda from STMicroelectronics and ST Microelectronic Automotive Discrete Group (ADG) for the valuable support. The authors would also like to thank Sylvain Jouanolle from the French MoD (DGA) for the valuable support (physical analysis).
Conflicts of Interest
Author Laurence Allirand was employed by the company Vitesco Technologies. Author Michel Piton was employed by the company Alstom. The remaining authors declare that the research was conducted in the absence of any commercial or financial relationships that could be construed as a potential conflict of interest.
References
- Wang, Z.; Shi, X.; Xue, Y.; Tolbert, L.M.; Wang, F.; Blalock, B.J. Design and performance evaluation of overcurrent protection schemes for silicon carbide (SiC) power MOSFETs. IEEE Trans. Ind. Electron. 2014, 61, 5570–5581. [Google Scholar] [CrossRef]
- Nguyen, T.T.; Ahmed, A.; Thang, T.; Park, J.H. Gate oxide reliability issues of SiC MOSFETs under short-circuit operation. IEEE Trans. Power Electron. 2014, 30, 2445–2455. [Google Scholar] [CrossRef]
- Chen, C.; Labrousse, D.; Lefebvre, S.; Petit, M.; Buttay, C.; Morel, H. Study of short-circuit robustness of SiC MOSFETs, analysis of the failure modes and comparison with BJTs. Microelectron. Reliab. 2015, 55, 1708–1713. [Google Scholar] [CrossRef]
- Zhou, X.; Su, H.; Wang, Y.; Yue, R.; Dai, G.; Li, J. Investigations on the degradation of 1.2-kV 4H-SiC MOSFETs under repetitive short-circuit tests. IEEE Trans. Electron Devices 2016, 63, 4346–4351. [Google Scholar] [CrossRef]
- Reigosa, P.D.; Iannuzzo, F.; Luo, H.; Blaabjerg, F. A short-circuit safe operation area identification criterion for SiC MOSFET power modules. IEEE Trans. Ind. Appl. 2016, 53, 2880–2887. [Google Scholar] [CrossRef]
- Benmansour, A.; Azzopardi, S.; Martin, J.C.; Woirgard, E. Trench IGBT failure mechanisms evolution with temperature and gate resistance under various short-circuit conditions. Microelectron. Reliab. 2007, 47, 1730–1734. [Google Scholar] [CrossRef]
- Reigosa, P.D.; Iannuzzo, F.; Ceccarelli, L. Effect of short-circuit stress on the degradation of the SiO2 dielectric in SiC power MOSFETs. Microelectron. Reliab. 2018, 88, 577–583. [Google Scholar] [CrossRef]
- Shoji, T.; Kuwahara, M.; Usui, M. Dependence of short-circuit withstand capability of SiC MOSFETs on short-circuit failure time. IEEE Trans. Power Electron. 2021, 36, 11739–11747. [Google Scholar] [CrossRef]
- Boige, F.; Richardeau, F. Gate leakage-current analysis and modelling of planar and trench power SiC MOSFET devices in extreme short-circuit operation. Microelectron. Reliab. 2017, 76, 532–538. [Google Scholar] [CrossRef]
- JESD22-A108G; Temperature, Bias, and Operating Life (HTOL) Test Method for Semiconductor Devices. JEDEC Standard. JEDEC Solid State Technology Association: Arlington, VA, USA, 2022.
- Boige, F. Caractérisation et Modélisation électrothermique Compacte étendue du MOSFET SiC en Régime extrême de Fonctionnement Incluant ses Modes de Défaillance: Application à la Conception d’une Protection Intégrée au plus Proche du Circuit de Commande. Ph.D. Thesis, Institut National Polytechnique de Toulouse, Toulouse, France, 2019. [Google Scholar]
- Barazi, Y.; Richardeau, F.; Jouha, W.; Reynes, J.M. VDS and VGS depolarization effect on SiC MOSFET short-circuit withstand capability considering partial safe failure-mode. Energies 2021, 14, 7960. [Google Scholar] [CrossRef]
- Romano, G.; Fayyaz, A.; Riccio, M.; Maresca, L.; Breglio, G.; Castellazzi, A.; Irace, A. A comprehensive study of short-circuit ruggedness of silicon carbide power MOSFETs. IEEE J. Emerg. Sel. Top. Power Electron. 2016, 4, 978–987. [Google Scholar] [CrossRef]
- Othman, D.; Lefebvre, S.; Berkani, M.; Khatir, Z.; Ibrahim, A.; Bouzourene, A. Robustness of 1.2 kV SiC MOSFET devices. Microelectron. Reliab. 2013, 53, 1735–1738. [Google Scholar] [CrossRef]
- Unger, C.; Pfost, M. Particularities of the short-circuit operation and failure modes of SiC-MOSFETs. IEEE J. Emerg. Sel. Top. Power Electron. 2021, 9, 6432–6440. [Google Scholar] [CrossRef]
- Oliveira, J.; Frey, P.; Morel, H.; Reynes, J.; Burky, J.; Coccetti, F.; Iannuzzo, F.; Piton, M. Failure degradation similarities on power SiC MOSFET devices submitted to short-circuit stress and accelerated switching conditions. Microelectron. Reliab. 2023, 148, 115166. [Google Scholar] [CrossRef]
- Richardeau, F.; Boige, F. Circuit-type modelling of SiC power Mosfet in short-circuit operation including selective fail-to-open and fail-to-short modes competition. Microelectron. Reliab. 2019, 100, 113501. [Google Scholar] [CrossRef]
- Jahdi, S.; Alatise, O.; Gonzalez, J.O.; Ran, L.; Mawby, P. Comparative analysis of false turn-on in silicon bipolar and SiC unipolar power devices. In Proceedings of the 2015 IEEE Energy Conversion Congress and Exposition (ECCE), Montreal, QC, Canada, 20–24 September 2015; pp. 2239–2246. [Google Scholar]
- Sanchez, J.; Gharbi, M.; Tranduc, H.; Rossel, P. Quasisaturation effect in high-voltage VDMOS transistors. IEE Proc. I (Solid-State Electron. Devices) 1985, 132, 42–46. [Google Scholar] [CrossRef]
- Pomès, E. Amélioration et suivi de la robustesse et de la qualité de MOSFETs de puissance dédiés à des applications automobiles micro-hybrides. Ph.D. Thesis, INSA, Toulouse, France, 2012. [Google Scholar]
Disclaimer/Publisher’s Note: The statements, opinions and data contained in all publications are solely those of the individual author(s) and contributor(s) and not of MDPI and/or the editor(s). MDPI and/or the editor(s) disclaim responsibility for any injury to people or property resulting from any ideas, methods, instructions or products referred to in the content. |
© 2024 by the authors. Licensee MDPI, Basel, Switzerland. This article is an open access article distributed under the terms and conditions of the Creative Commons Attribution (CC BY) license (https://creativecommons.org/licenses/by/4.0/).

