Abstract
This review article highlights the critical impact of surface roughness in modifying the structure of two-phase flow within mini- and microchannels, particularly in processes such as boiling and condensation. Channel surface roughness enhances flow resistance, affects the distribution of vapor bubbles, and enhances heat transfer by providing additional nucleation sites. Several experiments have shown that while increased surface roughness enhances the efficiency of heat transfer, increased flow resistance may hurt system performance. This is so because too high a surface roughness negatively impacts flow resistance, a factor of importance in the optimization for a balance between heat transfer and flow resistance, especially in high-performance compact heat exchangers. Furthermore, the review identifies that higher-degree measurement and characterization techniques of the surface roughness are increasingly required, as traditional 2D parameters may not fully represent the actual physics of complex surface interactions in two-phase flow systems. Consequently, the article calls for further research that can examine the exact relationship between roughness, flow structure, and thermal performance with the aim of improving design strategies for future heat exchanger technologies.
1. Introduction
The dynamic development of technology and the search for highly efficient energy constructions are driving the growing interest in compact heat exchangers. This is related to the miniaturization of an increasing number of devices, accompanied by a rise in heat flux density and efficiency. Compact heat exchangers not only allow for a reduction in the overall dimensions of the device and an increase in the heat exchange surface-to-volume ratio but also significantly reduce the amount of refrigerant in the system. This is particularly important from an ecological perspective. All these features positively influence both the economic and environmental aspects of using compact heat exchangers. These types of exchangers can be used in ventilation, air conditioning, refrigeration systems, and heat pumps, as well as in electronics, automotive, and construction industries.
Boiling and condensation processes occupy a special place among the phase transitions of refrigerants. Although these processes can theoretically be reversed, they are not fully symmetrical. This means that the relationships determined for boiling cannot be uncritically applied to condensation and vice versa, making it significantly more challenging to describe momentum transport and heat exchange. The problem becomes even more complex when considering phase transitions during flow in mini- and microchannels. Further complications arise from changes in the thermoskinetic properties of the refrigerant due to oil contamination in the refrigeration system, leading to changes in both the heat exchange mechanism and the formation of flow patterns. The phenomenon of boiling is widely described in the literature, including boiling in mini- and microchannels. Unfortunately, the scope of knowledge regarding condensation is more limited due to the difficulties in performing the process and conducting experimental measurements.
Condensation is a thermophysical process of transformation of a matter from a gaseous to a liquid state and includes passing of the property through a phase interface. Boiling involves the opposite process when a substance changes from a liquid to a gaseous state [1]. According to Gibbs definition, a phase is a homogeneous part of a system in which, under the conditions of equilibrium, all parameters, inclusive of thermodynamic functions throughout the volume of this part, take constant values. Phases are separated by an interface called the phase boundary [2]. Condensation and boiling of different thermodynamic substances are joined by exothermic effects of energy. These processes are highly complex thermophysical phenomena associated with the interaction of heat and mass transport. Realistic processes of condensation and boiling are inherently non-equilibrium. That is to say, there is no equilibrium between phases at the phase interface. The stronger the mass transport at the interface, the greater the deviation from equilibrium. In modeling two-phase processes, they are normally looked upon in a somewhat simplistic way and as equilibrium models. Such a process in which vapor gets converted into liquid and vice versa falls under the purview of the Gibbs phase rule. The processes of condensation and boiling are homogeneous substances that take place isothermally as well as isobarically under constant pressure and temperature. The level of intensity depends upon the surroundings and the nature of the working fluid. The thermal resistance during film condensation of vapor, Rα (1), can be expressed as follows:
α is the heat transfer coefficient, Rδ is the thermal resistance of the condensate layer, and Ri is the resistance at the phase boundary. This value of thermal resistance as expressed in Equation (1) during the condensation process of a homogeneous substance cannot be applied in the case of heterogeneous substances. An example of such includes the zeotropic refrigerant mixtures. In this respect, recent investigations have shown that for these mixtures, the resistances due to mass transfer at the phase boundary can no longer be neglected, and therefore the right side of Equation (1) has to be further expanded. Particular importance attaches in that case to the resistance of mass transfer within the vapor phase itself [3,4,5]. In that case, two-phase process conditions will enable distinctive mechanisms of momentum and energy exchange to be generated. The mechanisms of exchange are related to the two-phase flow patterns, which are functions of the diameter of the channel since the flow patterns in mini channels behave differently compared to conventional channels. A flow pattern in a two-phase flow is defined as the geometric arrangement of the liquid and vapor phases in the channel cross-section [5]. The research showed that the heat transfer coefficient in boiling depends on a great number of thermal and flow parameters: mass flow rate, density of heat flux, pressure, the degree of liquid subcooling relative to the saturation temperature at the channel inlet, and geometrical factors: the channel’s cross-sectional shape and spatial orientation, and the thermal properties of the boiling liquid.
For condensation to take place, two conditions must be satisfied: the temperature of the gas phase locally should be below the saturation temperature, and nucleation sites for the new phase should be available. Such nucleation sites include surface roughness, entrained liquid droplets, or impurities. In surface condensation, the temperature gradient across the surface is very important. For condensation to occur on the channel wall, the surface temperature should be below the saturation temperature of the substance at a given pressure. Condensation can occur both in the bulk and during flow. In practice, however, flow condensation is more important since it is applied for most heat exchangers. During flow condensation, either film condensation or dropwise condensation may occur [6]. Film condensation starts with the formation of a condensate layer whose thickness increases as the film continuously covers the entire surface. This type of condensation occurs on a surface that offers a large number of nucleation sites, such as a surface having a high roughness. Among others, the wettability of the surface will determine whether the condensation flow is film or dropwise. During film condensation, the surface may be wetted, while the other type—dropwise condensation—occurs on nonwetted surfaces [7]. Thus, surface tension forces, arising due to the imbalance of intermolecular forces in the liquid layer near the phase boundary, influence the wettability of the surface. Surface tension is usually measured as the force per unit length acting along the perimeter of the liquid surface in the direction tangent to the surface and perpendicular to the perimeter. [8]. This fluid property affects the formation of the interfacial surface and is temperature-dependent (it decreases as temperature rises). Surface wetting is determined by the contact angle between the channel wall and the droplet. If the contact angle is acute, the condensate wets the surface, leading to film condensation. When the contact angle is obtuse, dropwise condensation occurs as the surface is not wetted [9]. Droplet formation from one another at some distance apart, dropwise condensation on smooth surfaces prevents considerable coalescence, and low surface roughness provides little resistance to condensate flow.
For boiling to start, the temperature of the heated surface has to be higher than the saturation temperature, there must be some nucleation sites for the new phase, and there needs to be a temperature gradient on the heated surface. Research on heat exchange during boiling has shown that initiating vapor bubble nucleation is crucial for the process. It occurs at sites called nucleation centers. These are locations in craters or on the edges of these craters (surface irregularities or roughness) where optimal conditions exist for the initiation of vapor bubbles. Under varying heat flux conditions transferred to the liquid, the nucleation centers change with the variation in heat flux [10]. This means that surface roughness influences the ability of vapor bubble nucleation during boiling and also affects the initiation of the condensation process.
2. The Characteristics of Non-Adiabatic Two-Phase Processes
The concept of “phase distribution” during two-phase processes requires specifying characteristic parameters that define these distributions. The parameters that best describe the phase distribution in a “liquid-gas” two-phase flow are vapor quality and void fraction. The static vapor quality x is the ratio of the mass of vapor mv to the total mass of the mixture (mv + ml) in the entire volume of the channel:
The static vapor quality takes values in the range 0 ≤ x ≤ 1, where x = 0 indicates the flow of saturated liquid in the channel, 0 < x < 1 indicates the flow of a two-phase mixture (wet saturated vapor), and x = 1 indicates the flow of dry saturated vapor. In addition to the static vapor quality x, a dynamic vapor quality is sometimes introduced, defined by the equation:
where ṁv is the mass flow rate of the vapor, and ṁl is the mass flow rate of the liquid. It takes values in the range 0 ≤ y ≤ 1, just like the static vapor quality x. The dynamic vapor quality is used in modeling the boiling process. The void fraction φ, on the other hand, is the ratio of the volume occupied by the vapor phase Vv to the total volume, e.g., of the channel:
where Vl is the volume occupied by the liquid phase. The void fraction φ is determined by knowing the static vapor quality x and the properties of both phases. The void fraction takes values from 0 to 1, where 0 indicates the flow of only the liquid phase, while 1 indicates the flow of only the vapor phase in the studied volume. Values in the range 0 < φ < 1 indicate two-phase flow. The higher the value of the void fraction, the greater the volume occupied by the vapor phase in the flow. For example, for homogeneous substances, where the interfacial slip s = 1, the void fraction can be determined using the following relationship:
where ρv and ρl are the densities of the vapor phase and the liquid phase, respectively. There are several models available for determining the value of the void fraction. In addition to the model that uses the volumes occupied by each phase in the flow, there is also a two-dimensional model. This model determines the ratio of the cross-sectional area occupied by the gas phase Av to the cross-sectional area occupied by both the liquid phase Al and the gas phase Av:
Less commonly used is the model that describes the ratio of the length of the channel occupied by the gas phase to the total length occupied by both phases [4]:
where Lv and Ll are the lengths of the channel occupied by the gas phase and liquid phase, respectively. The Chisholm equation, on the other hand, takes into account the velocity slip between the phases in the homogeneous model [11,12]:
The value of the slip can be calculated using the following equation:
where ρh is the homogeneous density, described by the following equation:
The slip s accounts for the differences in the velocities of the two phases, which influence the formation of different flow patterns.
The velocity of each phase also plays a significant role in identifying flow patterns. If the two-phase flow is non-adiabatic, the previously mentioned parameters (vapor quality and void fraction) are not sufficient to definitively describe the two-phase flow due to the heat transfer process, which causes a change in the flow structure as it moves through the channel. This is related to the development of condensation or boiling processes (which change both vapor quality and void fraction) [5,13,14].
Understanding two-phase flow patterns is crucial for selecting the appropriate correlations to calculate the heat transfer coefficient and flow resistance. The types of flow patterns depend on the nature of the two-phase flow, which can be influenced by the roughness of the heat exchange surface. These flows can be classified based on the presence of heat transfer as adiabatic or non-adiabatic (boiling and condensation) and based on the channel orientation as vertical, horizontal, or less commonly, inclined. The type of two-phase flow structure is determined by the external forces acting on the two-phase system as well as interfacial forces. This results in differences between flow patterns in horizontal and vertical channels. The increasing influence of channel wall interactions (and surface tension) in mini- and microchannels also leads to changes in two-phase flow patterns compared to conventional channels [15].
With large differences in the density of the liquid and gas phases, high flow velocities lead to a strong disparity in their velocities. Centrifugal forces acting on a low void fraction in the channel segregate the liquid from the gas phase, and the liquid layer flows along the channel walls in the form of a thin film. In this case, the gravitational forces become less important than the inertial and interfacial shear forces, and an annular structure develops. At the high velocity of the gas phase at the center of the channel, the phase boundary surface is wavy, and accordingly, the gas carries liquid droplets. This pattern, which represents the annular flow, happens for conventional channels and mini channels as well [15,16]. When the gas-phase velocity is low, the inertial forces are correspondingly low. As soon as the inertial force falls below the gravitational force, the liquid film does not form and the phases separate; a stratified structure will be the result. With high enough void fractions and gas-phase velocities, the waves will also form on the phase boundary due to the interfacial shear forces, giving rise to a wavy structure. With the increase in the velocity of the liquid phase, the amplitude of these waves increases and reaches the upper channel wall to form a slug structure. Small gas bubbles appear at the crest of these waves, and due to this, pulsating movements of the liquid and gas phases take place alternately. This slug structure appears in both adiabatic and non-adiabatic flows, and it is categorized as an intermittent structure. An increase in the void fraction but still a relatively low mass flow rate of the substance exerts a decrease in the inertial forces, which causes the development of gas plugs even in the upper part of the channel. The “plug” structure appears only in conventional channels because the size of a plug is comparative to the diameter of mini and microchannels. In analogy to the slug structure, the plug structure is regarded as an intermittent flow pattern too.
For the high values of void fraction, coupled with the moderate phase velocities, a bubbly flow pattern develops, representing a dispersed structure. In conventional channels, gas bubbles vary in size and shape [15]. In horizontal channels, mist flow (M) or droplet flow occurs, where the gas moves through the entire channel cross-section with suspended liquid droplets. The annular flow (A) is another observed pattern. In this mode, the gas flows quickly through the channel core, creating a liquid film at the inner wall of the channel. The film is thicker at the bottom of the channel, and this leads to an asymmetric cross-section. SS, on the contrary, occurs when the liquid-phase flows within the lower part of the channel whereas the gas flows in the upper part, and the boundary of a phase is smooth.
Wavy flow, W, has a similar structure to the stratified flow, but with the increase in the gas velocity, waves are formed on the phase boundary. The plug structure (P) is formed when gas bubbles are large enough to be of the same order as the diameter of the channel and flow mainly in the upper part of the channel. This is one of two plug patterns. The other, the slug structure (S), forms as the flow rate increases, and shear forces amplify the waves that create gas bubbles along the flow. The system flows liquid portions with small and large bubbles that occupy most of the channel in an alternate manner. When the gas bubbles are relatively small compared to the channel diameter, the bubbly structure (B) is formed where gas bubbles flow through a continuous liquid phase, occupying only a small fraction of the channel cross-section area. Wherein the specific sequence of flow patterns depends on the boiling or condensation process, and, in some cases, one structure can disappear while several flow regimes may coexist [13,17]. Diagrams of these patterns are shown in Figure 1.
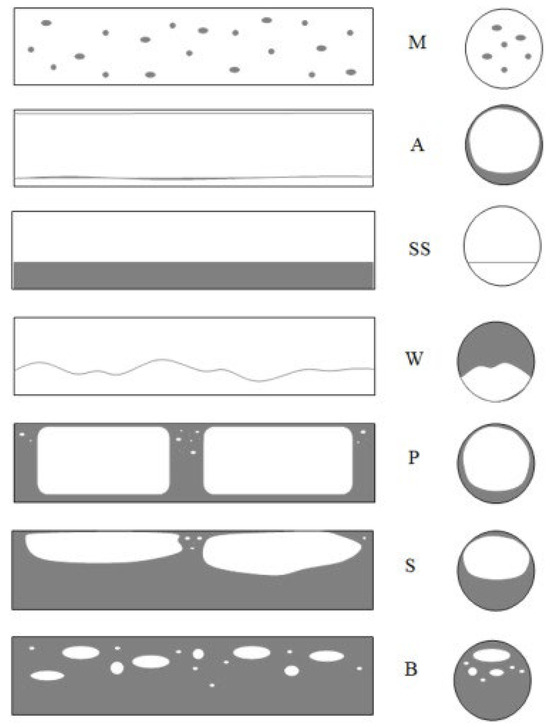
Figure 1.
Schematic diagram of adiabatic flow patterns in a conventional horizontal channel (original source): M—mist flow, A—annular flow, SS—stratified flow, W—wavy flow, S—slug flow, P—plug flow, B—bubbly flow [17].
In vertical flows, phase configurations differ slightly due to the effects of gravity. The direction of flow, whether upward or downward, and the density of the phases play an important role. As in horizontal channels, the most frequently observed flow patterns in vertical two-phase flows are mist flow and annular flow. In these flow patterns, a thin liquid film flows along the channel walls while the gas phase flows rapidly through the center; the liquid film is distributed evenly around the channel perimeter and moves downward due to gravity. Stratified flow patterns do not exist in vertical channels; however, froth flow occurs much more commonly, wherein the bursting and coalescing of gas bubbles during the oscillating flow of liquid generates froth. It is also possible to identify the slug flow pattern, where, similarly to horizontal channels, liquid and gas flows appear in turn, the latter with gas plugs almost completely filling the channel cross-section. In the case of bubble flow, dispersed gas bubbles flow through the liquid at a velocity very close to that of the continuous phase. This structure is sometimes referred to in the literature as dispersed bubble flow (structure and substructure) [18,19]. Figure 2 shows schematics of two-phase flow patterns for upward and downward flows, indicating the differences in shapes [20,21,22,23,24].

Figure 2.
Schematic of adiabatic flow patterns in a conventional vertical channel: (a) ascending flow, (b) ascending flow with the presence of highly viscous liquid, (c) descending flow; where M—mist flow, A—annular flow, F—froth flow, S—slug flow, B—bubble flow, FF—liquid film flow, BF—bubble-film flow. Reprinted/adapted with permission from Ref. [19]. Copyright year: 2014, Oficyna Wydawnicza Politechniki Opolskiej, Poland.
Since the heat exchange in the case of non-adiabatic two-phase flows causes changes in fluid parameters along the channel length, some alterations of flow patterns take place. In such conditions, the flow is not hydrodynamically stabilized, and deviations from the thermodynamic equilibrium between the phases take place [18]. Fluid parameters—pressure, temperature, mass flow rate, and heat flux density—are the most influential factors in the occurrence of specific flow patterns, as seen in Figure 3. According to [25], non-adiabatic two-phase flows with heat exchange differ from adiabatic flows since, along the channel, the vapor quality x—the vapor phase mass fraction—and void fraction φ are subject to variation due to which flow patterns change. Boiling is the process in which heat is added to the fluid in a two-phase flow; condensation occurs when heat is removed. Like all the examples described earlier, both boiling and condensation are non-adiabatic, two-phase processes. Although they are each other’s opposite, the mechanisms involved in these two processes are not symmetrical. Due to this reason, identical flow patterns in both processes can not be expected, and even those that appear in both cases form under slightly different conditions. In condensation, the boundaries for specific patterns often shift from those in boiling. The intensity of heat transfer during condensation depends upon the flow structure present [26].
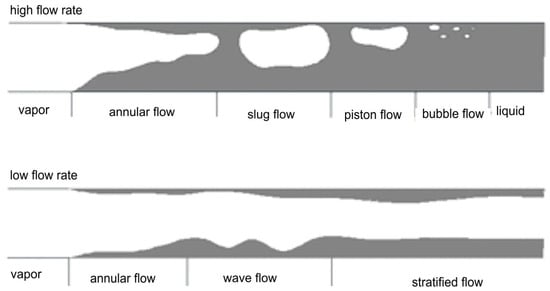
Figure 3.
Evolution of flow patterns during the condensation process in a channel depending on the mass flow rate of the fluid Reprinted/adapted with permission from Ref. [27]. Copyright year: 2009, Wydawnictwo Politechniki Gdańskiej, Poland [28].
Other studies have equally pointed out the influence of channel diameter on the development of flow regimes. Mini and microchannels produce flow regimes somewhat different from those in conventional channels. This has been attributed mainly to the influence of surface tension, which exerts more significant effects on two-phase processes in channels whose diameters are less than 3 mm [29,30,31,32,33,34,35,36]. As heat exchangers commonly contain a large number of parallel channels, investigation of two-phase phenomena in multiport channels is of particular significance [33,37,38,39,40,41]. As an example, Al-Zaidi et al. [42] studied the flow patterns during the condensation of HFE 7100 in a multiport channel made of rectangular minichannels with hydraulic diameter dh = 0.57 mm at saturation temperature Ts = 60 °C and for a mass flux of G = 48 ÷ 126 kg/m2s. The schematic results of their findings are given in Figure 4. As seen, the flow structure in small-diameter channels takes more orderly and symmetric shapes, whether it is single or multiport. The principal problems arising in multiport geometries involve the division of fluid and its phases among the individual channels. Simultaneous flow variations are shown in Figure 5, illustrating the data of Jige et al. [40].

Figure 4.
Schematic of flow patterns during condensation of the refrigerant HFE7100 in a minichannel according to [42].
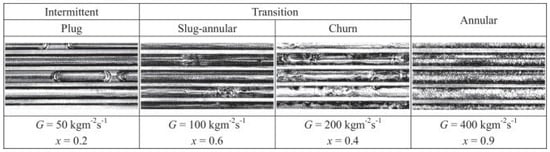
Figure 5.
Example results of two-phase flow visualization during condensation in multiport channels with a hydraulic diameter of 1 mm by Reprinted/adapted with permission from Ref. [40]. Copyright year: 2018, Elsevier.
3. The Influence of Roughness on Two-Phase Flows
In fluid mechanics, the influence of roughness on flows has been studied for a long time. In 1857, Darcy investigated the impact of channel surface roughness on turbulent flow. In 1886, Fanning proposed a correlation describing flow resistance as a function of roughness. Nikuradse related the friction coefficient to roughness in turbulent flow according to the following relationship:
where d is the channel diameter and k is the channel surface roughness [30].
To consider the influence of roughness on flow phenomena, the concept of a hydraulically smooth channel must be defined. A hydraulically smooth channel is one in which the thickness of the laminar sublayer is greater than the height of the roughness elements k on the walls of the channel. This definition is illustrated in Figure 6.
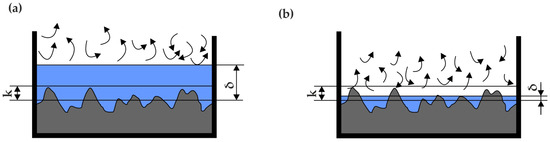
Figure 6.
Schematic definition of a channel: (a) hydraulically smooth, (b) hydraulically rough.
According to this, during phase transitions such as boiling and condensation, the thickness of the liquid layer changes, so the influence of roughness on flow can only be discussed within a specific range. The most significant impact of roughness is observed in flow resistance, particularly when the condition of a hydraulically smooth channel is not met. In such cases, the channel’s roughness can affect the flow velocities of the phases, which is directly related to flow resistance [32,43,44,45,46,47,48,49,50,51]. However, the literature also suggests that channel roughness can influence heat transfer.
Regarding the influence of roughness on the velocity profile of the flow, a flatter velocity distribution, which occurs in smooth pipelines, increases the degree of contraction and consequently decreases the flow coefficient C. With higher roughness, the velocity profile is sharper, leading to an increase in the C coefficient. This is due to the dampening effect of the pipeline’s surface irregularities on the boundary layer. The roughness parameter most commonly used in flow metrology is the height of irregularities k (as shown in Figure 6), but the Ra parameter (the arithmetic mean of the absolute values of the profile ordinates within an elementary section) is increasingly being used. To correlate with older research results, the relationship k » Ra is often assumed. However, it is very likely that for the same Ra values, but with different surface irregularity patterns, their impact on the velocity profile will differ. For the same Ra, the profile in Figure 7a will undoubtedly have a greater effect on the boundary layer than the profile in Figure 7b [52], demonstrating the need to use additional parameters to assess surface roughness that can distinguish such cases.
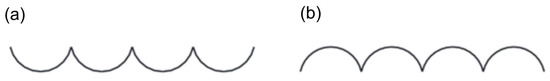
Figure 7.
Example of profiles with different characteristics (a,b) and the same Ra. Reprinted/adapted with permission from Ref. [52]. Copyright year: 2008, Polskie Towarzystwo Automatyki i Robotyki, Poland.
The influence of roughness and channel development is most often considered in the literature in the context of the boiling process. This is frequently associated with the nucleation of vapor bubbles, which occur on various parts of the developed heat exchange surface. Researchers often seek surfaces that will most favorably impact heat transfer. Unfortunately, surface roughness also affects flow resistance, the increase of which is not beneficial for flow and thermal machines.
3.1. The Influence of Roughness in Boiling Process
In 1989, Zaripov et al. [53] studied experiments of water, nitrogen, and acetone boiling on surfaces with enhanced roughness. The microstructural layer in their work was made from copper, nickel, and steel fibers. Tests were conducted for surface porosity as high as 93% and a maximum height of roughness of 10 mm. From these investigations, the optimum roughness height giving the maximum value of thermal efficiency was determined. In 1982, Nishikawa et al. [54] reported data on the influence of pressure and surface roughness on the boiling of refrigerants R-11, R-21, R-113, and R-114. Investigations were carried out in vertical copper channels of 20 and 40 mm diameters with a degree of surface roughness between 0.022 and 4.310 µm. From these findings, the authors came to the conclusion that the greatest roughness effect on heat transfer was observed for low pressures and reduced with a further increase of the latter until at the critical value it practically vanished.
Recently, in the year 2000, Kang [55] reported studies on boiling water in tubes of different orientations and of surface roughness values of 60.9 nm and 15.1 nm, respectively. Surface roughness in this work is specified as RMS–Root Mean Square–and it defines the average deviation of the surface profile from a perfectly smooth surface. It can mathematically be described as a square root of the average squared deviations of surface points with respect to the centerline. These studies concluded that as the roughness increases, so does the heat transfer because of the increased amount of active nucleation sites where the bubbles form. This effect was most pronounced in inclined tubes.
Another investigation [56] studied the boiling of water, ethanol, and R-113 on horizontal isothermal surfaces with copper fiber patterns, the fiber diameters being 50 µm. The positive effect of porous layers on heat transfer was confirmed. It has been noted, for instance, that the heat transfer coefficient during water boiling in the case of an 85% porous surface at a pressure of 0.1 MPa was 5.5 times higher than in the case of a smooth surface at the same heat flux. Ribatski and Jabardo [57], on the other hand, studied the effect of surface roughness on boiling heat transfer and found that the enhancement in heat flux as the roughness becomes higher is due to the increase in nucleation sites of vapor bubbles. Cieśliński and Targański [58] studied the process of boiling R22, R134a, and R407C in channels with enhanced surfaces. They pointed out that the value of the heat transfer coefficient for micro-finned channels is substantially higher for high flow rates—up to 70% in channels with helical patterns; the increase was up to 20%. While doing so, the increased flow resistance appeared, which, of course, is undesirable for any thermal device but could not be avoided when the surface roughness is enhanced. The geometrical characteristics of channels studied in [58] are shown in Figure 8.
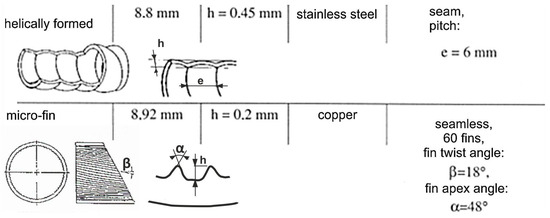
Figure 8.
Characteristics of the channels used in the study. Reprinted/adapted with permission from Ref. [58]. Copyright year: 2003, COCH—Centrum Chłodnictwa i Klimatyzacji (Centralny Ośrodek Chłodnictwa) Poland.
Recently, Wójcik et al. [59] studied heat transfer in the process of water boiling on tubes with porous copper coating. The authors took up fibrous layers in the range of 0.5 to 2.0 mm thickness. Again, they showed that within some limit, the intensification of thermal performance grew with the intensification of the surface roughness.
Hosseini et al. [60] performed an experimental investigation on boiling R-113 on horizontal copper surfaces with different roughness measured by the Ra parameter—Arithmetic Mean Roughness: 0.901 µm, 0.735 µm, 0.65 µm, and 0.09 µm. Their results confirmed previous suppositions that the surface with an Ra of 0.901 µm reached a 38.5% higher heat transfer coefficient compared to the smoothest surface (Ra = 0.09 µm). The second surface modification method reviewed in the paper was the addition of coatings. These come in quite a few forms, examples being capillary patterns such as porous layers made from metal fibers, sintered powders, and mesh patterns. Many investigations have shown that such coatings tend to enhance boiling heat transfer. Kalawa et al. [61] also investigated the boiling of water on porous surfaces, indicating boiling occurs with enhanced heat transfer compared to smooth surfaces. Compared to the uncoated surface, the heat transfer rate for a surface coated with 25 µm fibers was roughly 3.5 times higher in this experiment. In general, most works reviewed have been concerned with isothermal surfaces [62]; most of the rough surfaces considered are isothermal, and only a few cases of rough, non-isothermal surfaces have been considered due to the measurement complications involved.
The boiling process of refrigerants on enhanced surfaces has been extensively studied in the works of Piasecka et al. and Pastuszko et al. [10,63]. They observed that indentations on a technically smooth heating surface are sites where vapor bubbles form, grow, and detach, confirming the hypothesis put forward by Ribatski and Jabardo [57]. The authors assumed that small amounts of vapor are present in these indentations, making the surface irregularities natural nucleation centers. The nucleation sites can also result from the presence of foreign particles in the liquid (contamination-type nucleation sites) or local density variations compared to the average density (fluctuation-type nucleation sites). Developed micro-surfaces have artificially created indentations. The increase in the heat transfer coefficient during boiling is achieved by passive methods (e.g., increasing surface roughness, applying porous material, using fins, subsurface patterns, or complex systems) and active methods (e.g., introducing surface vibrations, mixing, spraying, and atomizing the liquid, or applying an electric field). Promising directions in the development of heat exchange surface coatings include sintered, metal, and fibrous capillary–porous patterns (2009) [59]. Sometimes surfaces combining several heat transfer enhancement methods are used, as in the work by Pastuszko (2012) [64]. The authors of the above studies found that the intensification of heat transfer is caused by an increase in the number of nucleation sites and the fact that the enhanced layer can act as an obstacle to the movement of vapor nuclei through the liquid stream. The use of an enhanced heating surface also increases the ratio of the heat-exchanging surface area to the volume occupied by the liquid. The use of an enhanced heating surface intensifies the heat transfer process, but the impact of surface enhancement on two-phase processes is still insufficiently studied. Similar conclusions based on experimental studies have been presented in the works [65,66,67,68,69].
Orman et al. [70] began their research with the statement that surface microgeometry is one of the most important factors affecting two-phase processes. The authors investigated the boiling of distilled water and alcohol on smooth and rough surfaces. The results of their experiments are presented in Figure 8 and Figure 9. As can be seen from the plot, at values of higher temperature differences, the heat transfer performance of fibrous microstructures is comparable to that of smooth surfaces. This is because the quantity of vapor that would have been generated because of low values of superheat is small, and hence it becomes realistically easy to remove vapor from all sorts of surfaces. For larger superheats, the quantity of vapor generation becomes high. Thereby, a vapor layer can form within the porous structure. Further, rough surfaces have more nucleation sites that become active even at lower heat fluxes. For ethanol (Figure 10), these diameters are substantially smaller, and even in high-flux conditions where bubble coalescence is occurring, rough surfaces are much more effective. All the above leads to the following conclusion that surface roughness enhances heat transfer only in some conditions of thermal-flow.

Figure 9.
Boiling curve of distilled water on 1—smooth surface, 2—surface with copper microstructures, 3—rough surface [70].

Figure 10.
Boiling curve of ethanol on 1—smooth surface, 2—surface with copper microstructures, and 3—rough surface [70].
Myers et al. [71] in their work presented the relationship between heat flux density during pool boiling and the forming flow structure, which, as mentioned earlier, largely depends on the development of the heating surface (its roughness). In Figure 11, they also presented the relationship between the mentioned heat and energy in the nucleation process of a single bubble, depending on the heat flux density and flow structure.

Figure 11.
(a) The relationship between heat flux density and wall superheat during pool boiling, (b) the value of the mentioned heat in the given context, and (c) the total energy during the nucleation process of a single bubble in pool boiling. Reprinted/adapted with permission from Ref. [71]. Copyright year: 2009, ASME—American Society of Mechanical Engineers.
3.2. The Influence of Roughness in the Condensation Process
In the case of the condensation process, Upot et al. [72] observed that surface roughness has a significant impact on this phenomenon, particularly in the context of dropwise condensation. It influences the morphology of micro- and nanostructures, which can significantly alter the dynamics of the phase interface and, consequently, enhance heat transfer. By applying functionalized micro- and nanostructures, one can achieve discrete droplets during condensation and hence ensure enhanced heat transfer compared to traditional film-wise condensation. Surface roughness may contribute to droplet nucleation sites and also support such mechanisms as droplet jumping that may be typical for surfaces with specifically designed micro- and nanostructures. With appropriate control of surface wettability and droplet nucleation rate, these surfaces can significantly enhance HTC during condensation. Wettability might be defined as the spreading of a liquid over a solid surface. The better the wettability is, the easier a liquid can spread over the surface of a solid. It is quantified under the terms of contact angle, that is, the angle formed between the solid surface and the liquid at the edge of the droplet. If the angle is less than 90°, then the surface is hydrophilic—the wettability is good. Wettability is an important phenomenon in condensation since it decides the manner of condensation of vapor onto the surface. The type of condensation occurring on hydrophobic surfaces is called dropwise condensation, which in general is much more effective regarding heat transfer compared to filmwise condensation on hydrophilic surfaces. In a rough surface, two wettability states are observed: first, the Wenzel state [73], where the droplet penetrates the microstructure of the surface and the droplet adheres to the surface. A second regime is the Cassie–Baxter state, in which small air pockets form under the droplet, providing it with support on the surface and making it easier to remove [74]. Figure 12 gives a schematic of both states.
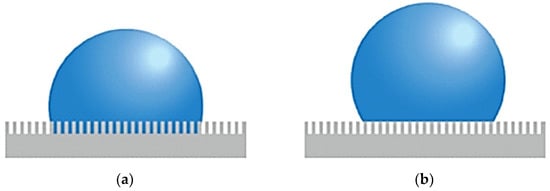
Figure 12.
(a) Wenzel state and (b) Cassie–Baxter state on a rough surface. Reprinted/adapted with permission from Ref. [74]. Copyright year: 2014, Elsevier.
Zhang et al. [75] prepared some hydrophobic surfaces such as polytetrafluoroethylene, polyphenylene sulfide (PPS), and self-assembled micro/nanosilver (SAMS) to study the behavior of condensate for enhancing heat transfer during dropwise condensation compared with the filmwise condensation. Their study showed that, to some degree, surface wettability and structure can affect droplet size and distribution. More importantly, hydrophobic surfaces can enhance dropwise condensation by allowing the growth of a large number of large droplets. However, it is to be noticed that, as presented in Figure 13, the polymer-based surfaces differed from SAMS-based ones both in droplet size and condensation dynamics.
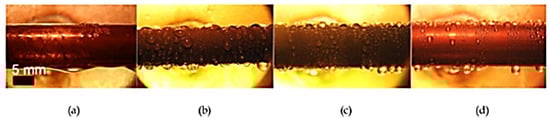
Figure 13.
Visualization of various hydrophobic surface modifications: (a) smooth, (b) PPS, (c) PTFE, and (d) SAMS. Reprinted/adapted with permission from Ref. [76]. Copyright year: 2015, Elsevier.
Qin et al. [77] found that surface roughness affects the condensation process by modifying the way condensate interacts with the surface, which can significantly impact heat transfer efficiency. Depending on whether the surface is hydrophilic or hydrophobic, roughness can promote different forms of condensation. In the case of dropwise condensation (DwC) on hydrophobic surfaces, roughness can facilitate the formation of droplets that quickly roll off the surface, allowing for further vapor deposition and increasing the heat transfer coefficient. In such cases, surfaces with high roughness can improve condensation efficiency by increasing the contact area and facilitating the removal of condensate. In the case of filmwise condensation (FwC) on hydrophilic surfaces, the condensate forms a continuous liquid layer that slows down heat flow due to the lower thermal conductivity of the liquid compared to vapor. Here, roughness may slightly enhance heat transfer by increasing the contact area, but generally, film wise condensation is less efficient than dropwise condensation. Thus, surface roughness can be used to control the type of condensation occurring on a given surface, allowing for the optimization of the heat transfer process depending on the application’s needs. Surface modification, particularly in the context of roughness and wettability modification, has a significant impact on heat transfer processes, including condensation and boiling (Figure 14).
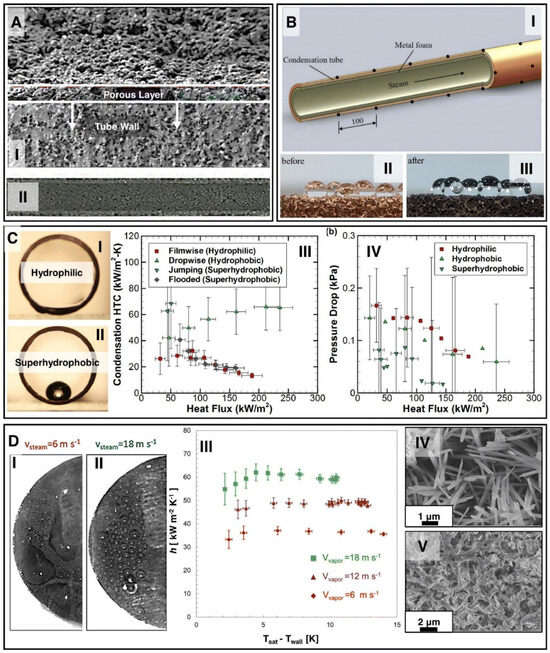
Figure 14.
(A) SEM image of the coated porous surface, (B) schematic of the porous surface coated with metal foam, (C) cross-section of water droplets on the surface, (C-I) hydrophilic, (C-II) hydrophobic, (C-III) thermal characteristics, (C-IV) flow characteristics, and (D) effect of vapor spread velocity on bubble size during DWC on a superhydrophobic surface [72]. Reprinted/adapted with permission from Ref. [78]. Copyright year: 2020, Elsevier. Reprinted/adapted with permission from Ref. [79]. Copyright year: 2019, Elsevier. Reprinted/adapted with permission from Ref. [80]. Copyright year: 2022, Elsevier.
Figure 15 shows the impact of a hydrophobic surface on the heat transfer coefficient based on the research findings of Shi et al. [79]. In this case, the hydrophobic surfaces were coated with metal foam, and as observed, smaller particles positively affect heat transfer, leading to its intensification. Chen et al. [81] mapped their research results onto flow structure maps developed by Cavallini and El Hajal (Figure 16). It can be seen here that surface roughness not only influences heat transfer but also shifts the formation of certain flow patterns compared to the condensation process in smooth channels under the same flow parameters. This phenomenon, as previously mentioned, is related to the intensification or inhibition of heat transfer depending on the type of surface.
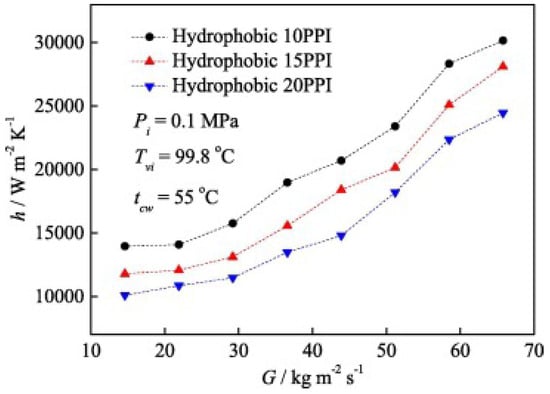
Figure 15.
The effect of metal foam size on the heat transfer coefficient in the condensation process. Reprinted/adapted with permission from Ref. [79]. Copyright year: 2019, Elsevier.
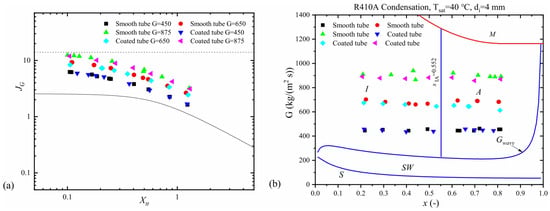
Figure 16.
Experimental research results plotted on the map by (a) [32]. (b) El Hajal et al. Reprinted/adapted with permission from Ref. [82]. Copyright year: 2022, Elsevier. Reprinted/adapted with permission from Ref. [80]. Copyright year: 2003, Elsevier.
3.3. Roughness Influence on Two-Phase Flow in Microchannels
Surface roughness plays a key role in the boiling process, influencing the intensity of heat transfer. Studies have shown that rough surfaces can significantly increase the heat transfer coefficient compared to smooth surfaces. The increase in roughness in microchannels unfortunately causes an increase in flow resistance, which is already high in such small diameters. For this reason, most of the studies in this area are simulations. Cook and Kandlikar [83] describe the initiation of boiling by creating additional sites for the nucleation of vapor bubbles. Rough surfaces create numerous microcaverns, which contribute to the easier formation of vapor bubbles in these locations, which leads to the intensification of the boiling process. This phenomenon reduces the thermal resistance between the surface and the liquid, which contributes to more efficient heat dissipation. He showed that, depending on the channel geometry and the depth of roughness, the increase in the heat transfer coefficient can be up to 3.4 times greater than for smooth surfaces.
Koyama et al. [84] describe that surface roughness in microchannels has a significant impact on the boiling process, especially in the context of heat transfer intensification. The paper shows that microfins in microchannels increase the heat transfer coefficient through several mechanisms. They write that when wet surface area increases roughness, it increases the area that can be in direct contact with the liquid, which improves boiling conditions and increases heat transfer. Increased nucleation sites caused an increase in the number of places where vapor bubbles can form, resulting in faster boiling and more efficient heat removal. The next conclusion is that the geometry of the microfins causes greater disruption of the liquid flow, which leads to increased turbulence and more efficient heat transfer. In channels transverse to the liquid flow, this effect is even stronger, which significantly increases the boiling efficiency compared to longitudinal channels. The microfin roughness in the microchannels leads to a significant increase in thermal performance by promoting nucleation, increasing the heat transfer area, and enhancing flow turbulence. The mechanism of bubble formation on the microchannel surface is schematically shown in Figure 17.

Figure 17.
Mechanism of bubble formation on a microchannel surface. Reprinted/adapted with permission from Ref. [84]. Copyright year: 2014, Elsevier.
Guo et al. [85] describe in their work that surface roughness in microchannels has a significant effect on the boiling process, especially on the thermal-hydraulic heat transfer efficiency. Their numerical studies show that with an increase in relative roughness, the Nusselt number and the product of friction and Reynolds number initially increase, and then decrease. They investigated that the optimal roughness is 0.304%, at which the best thermal-hydraulic heat transfer efficiency is achieved. Surface roughness improves heat transfer efficiency by increasing flow disturbances and promoting bubble nucleation, which is conducive to the intensification of the boiling process. They show in addition, that the increase in the width of the roughness elements causes a smoother surface waviness, which leads to a slower increase of the Nusselt coefficient and a monotonously increasing flow resistance. Studies confirm that roughness in microchannels increases the number of active nucleation sites, but too high roughness causes negative effects, such as the formation of large bubbles that restrict the flow and impair heat conduction.
In other work, Guo et al. [85] show that the slug growth in rough microchannel is faster than that in smooth microchannel. The breakoff of each plug shape in the rough microchannel is always earlier than that in the smooth microchannel. The slug surface and length decrease with the increasing of D/l and σ/D. In a rough microchannel, the total surface area is 0.16% larger than in smooth wall condition. The surface area of the low-velocity region under rough wall conditions is 46% larger than in smooth wall conditions. That means the effective flow area of the microchannel is reduced. The surface area of the high-velocity region under rough wall conditions increases compared with smooth wall conditions. Figure 18 shows velocity distribution in microchannels and Figure 19 shows the process of slug formation under smooth and rough walls.

Figure 18.
Velocity distribution in microchannel: (a) counterflow under smooth and rough walls, (b) velocity vectors. Reprinted/adapted with permission from Ref. [85]. Copyright year: 2023, Elsevier.
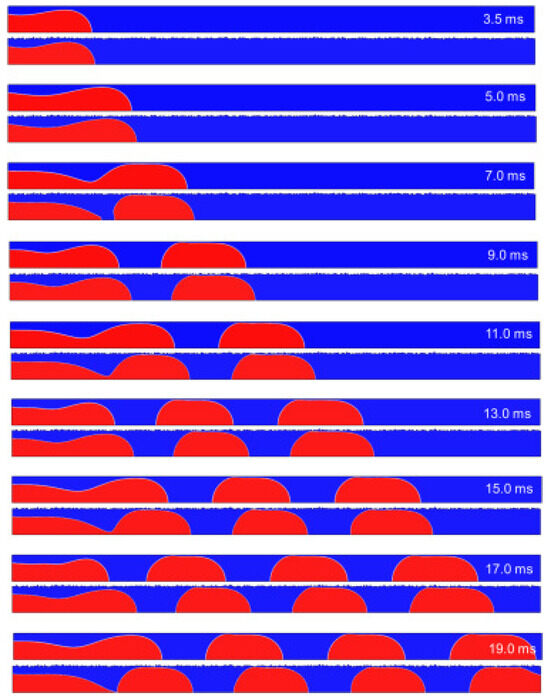
Figure 19.
Process of slug formation under smooth and rough walls (roughness D/l = 2.5, σ/D = 0.026). Reprinted/adapted with permission from Ref. [85]. Copyright year: 2023, Elsevier.
4. Recent Trends in Surface Roughness Assessment
While wettability measurements, such as contact angle, provide valuable insights into how a liquid interacts with a surface, they are often not sufficient to fully characterize surface behavior in engineering applications. This is because wettability alone does not account for the complex interactions influenced by surface roughness, which affects the contact points with the cooperating surface [86]. As Kubiak et al. [87] pointed out, surface roughness considerably influences the apparent contact angle; thus, real changes in wetting behavior may occur for real engineering surfaces, which often bear irregularities. A combination of Wenzel’s model and Cassie–Baxter’s model provides an example of how roughness modifies not only the contact angle but also the manner of liquid spreading or entrapment of air within asperities on the surface. Therefore, roughness parameters must be put alongside wettability to give the full view of surface interaction in applications in which lubrication, coating, or thermal processes are present since the topology in such instances governs such critical factors as friction, heat transfer, and flow resistance.
Surface roughness impacts directly on flow resistance, boundary layer characteristics, and nucleation sites, along with the complications of two-phase flows, which can be annular, bubbly, or slug flows. Parameters generally used to define surface roughness, R plays an essential and vital role in determining the microscopic irregularities of the surfaces and providing a form of estimation for their application, in most cases, especially in many engineering areas. Being known as height parameters, it is but a fundamental average of varies measures that are concerned with the surface profile when taken along a straight-line measures. They include those like Ra, Rz, Rq, and Rp. among many others. One of the commonly used parameters is the arithmetic mean roughness (Ra), defined as the arithmetic mean of the absolute values of the deviations of the profile from the mean line over a stipulated length. It is a simple indicatory parameter that gives general information on the roughness of the surface but does not respond to the attainment of extreme values, such as separate deep valleys or high peaks. Rz (maximum height of the profile) is a parameter describing the height difference between the highest peak and the lowest valley within five consecutive sampling lengths. This is a more sensitive measure that will better bring out the extreme irregularities on the surface. Rq (root mean square roughness) is given as the square root of the sum of the squared deviations of the profile points from the mean line divided by the segment length. It is more sensitive to larger deviations than Ra, hence very useful in surface analysis where greater irregularities are significant. Rp—it is an indication of the highest value of the peak that protrudes above the mean line in a specific sampling length, and it gives the highest points on the surface. Each of these parameters treats roughness in a likewise different way, giving a more comprehensive view of its properties. Thus, with consideration of the average roughness and extreme deviations in the context of application, it is meaningful to engineers and scientists to tailor materials and surfaces to desired applications.
Using the R parameters as a way of characterizing surface roughness may seem modern in the field of fluid mechanics, but it is not entirely so when considering the advancements in metrology [88]. The major features of these technological advancements are comprehensive and accurate investigation of surface features. However, the conventional dependence on 2D techniques that have been so accustomed to in roughness measurement is rapidly becoming obsolete. The disadvantage of 2D analysis is that results are bound not to reflect fully the three-dimensional complexities that exist in surface textures and, therefore, tend to oversimplify or even misrepresent the surface topography. In contrast, 3D techniques aid in building a full representation of the topography of the surface, inclusive of valleys, peaks, and textures relevant to tribology and material science. Hence, while R parameters are still useful, their use in a 2D context wastes all the potential that modern surface analysis techniques have. Since the demand for precision in the characterization of surfaces increases, the trend towards 3D methods is both relevant and imperative to match the evolving needs of research and industries.
The S parameters defining the surface roughness are a contemporary and more advanced tool in the study of the surface; among them are the height, spatial, hybrid, and functional parameters that contribute to the assessment of three-dimensional topography [89,90]. Among the height parameters, there are some that are just simple generalizations from 2D to 3D: Sa (arithmetical mean height of the surface), Sv (maximum height of valleys), Sp (maximum height of peaks), and Sz (maximum height of the surface). Such parameters describe an amplitude of surface irregularities, which is important for contact mechanics, friction, and surface wear. Nevertheless, their role is relatively limited if not backed by more advanced parameters. Spatial parameters include Sal (autocorrelation length) and Str (texture aspect ratio). Both allow the measurement of anisotropy and autocorrelation between points on the surface. The fact that such parameters are very useful in the analysis of the functionality of surfaces makes them imperative, especially in surfaces with complex structures, like those used for flow channels. Other hybrid parameters, such as Sdq (root mean square slope) and Sdr (developed interfacial area ratio), merge height and spatial information to describe surface interactions more comprehensively. Such parameters are greatly useful in the assessment of surface tightness, the ability to form adhesive bonds, and the aesthetic appearance of the surface. These functional parameters of the surface, like those of the Sk (core roughness depth), characterize in detail the functional properties of the surface connected with the potential of retaining oils, its resistance to wear, or assessments of degradation of the surface. Such parameters can be very essential in optimizing heat exchange processes during two-phase flows and preventing undesirable phenomena like cavitation or erosion. In comparison with traditional 2D parameters, S parameters give much more detailed and precise information regarding the surface. Advanced engineering analyses, such as analysis of two-phase flows, retain it as an integral tool. Their application gives more accurate modeling and prediction of surface behavior but also more precise control of production processes and improvement in the performance of technical systems. These conclusions underline the real importance of advanced S parameter usage in the valuation of the surface roughness, particularly in those fields of science and industry where high surface precision and functionality assume a leading role in securing the best results. Some authors, recognizing the standardized parameters for describing surface roughness as insufficient [91,92,93,94], propose their methods for evaluating surface irregularities that are useful in specific applications. One such method is the analysis of islands based on the cut-off plane located at a specified distance from the highest peak of the surface [95,96]; this approach may also be useful in the analysis of surface irregularities in channels. Based on the conducted analyses, most authors use R parameters to describe the roughness of channel surfaces. It is, of course, very important to study the impact of surface roughness on phase flow patterns, but it is also necessary to consider advancements in surface metrology and to apply more comprehensive descriptions of surface roughness using S parameters.
5. Summary and Conclusions
The surface roughness effect on the structures of two-phase flow in channels has been discussed. The role of roughness in processes like boiling and condensation is always insisted upon. Based on previous studies, it is stated that surface roughness can have a strong impact on flow resistance, efficiency of heat transfer, and nucleation site formation, mostly for mini- and microchannels. The authors emphasize various techniques of measuring surface roughness and elaborate on how these parameters can affect thermal performance in both adiabatic and non-adiabatic conditions. Experimental studies are surveyed with regard to the general trends of increased roughness causing enhanced heat transfer but increased flow resistance, consequently hurtful to the efficiency of thermal systems. The research therefore underlines the need to optimize surface characteristics for better heat exchanger performance in various applications. If the channel surface is not hydraulically smooth, the flow resistance depends strongly on the surface roughness due to the complete alteration of the velocity profile. One particular example could be that a rough surface would flatten the velocity profile; because of this, the flow coefficient increases, and it directly influences the efficiency of the heat exchange. The effects proved even more pronounced in phase change systems, boiling, and condensation, where the interaction of roughness elements with the liquid-vapor interface is one of the most influential factors. Rough surfaces affect the distribution and coalescence of vapor bubbles, which again will affect the heat transfer coefficient, depending on the orientation and roughness of the surface. Moreover, the use of porous or fibrous structures has recently shown potential to enhance thermal performance due to the creation of more nucleation sites and an increase in the overall surface area for heat exchange.
- Surface roughness has the same influence, directly impacting the establishment and stability of two-phase flow patterns in boiling and condensation processes. Rough surfaces alter flow regimes by increasing the generation of vapor bubbles and promoting a liquid film, which, in turn, affects the overall thermal performance.
- While surface roughness usually enhances heat transfer by providing more nucleation sites, it increases frictional losses. This is very critical in thermal systems where efficient heat transfer with a minimum flow resistance is required.
- On these channels, as the scale is reduced, surface characteristics take on more meaning; therefore, roughness drives efficiency and stability for two-phase flows. Since surface tension forces dominate in the smaller channels, even small changes in the roughness may create large disparities in heat transfer rates and flow resistance.
- Optimization of surface roughness is now emerging as one of the most effective ways to enhance the efficiency of heat exchangers, mainly in compact and high-performance systems. Enhancing heat transfer by means of roughened surfaces while reducing flow resistance by the correct choice of roughness becomes a delicate balance; accomplishing the optimal roughness may result in major strides forward in thermal system performance.
- The results obtained have the effect of underscoring that more detailed research is needed to establish the exact nature of the relationship between surface roughness and thermal performance for two-phase flow systems. Therefore, future studies should be focused on measuring the exact thresholds where gains from the increased heat transfer might outweigh losses in enhanced flow resistance. Additionally, the new materials and surface treatments developed in a manner that could adjust roughness at the micro- and nanoscale would bring new opportunities for the advancement of heat exchanger technology.
Author Contributions
Conceptualization, M.S., T.B., T.G.M. and K.T.; methodology, M.S. and T.B.; formal analysis, M.S., T.B. and K.T.; resources, M.S., T.B., K.T., W.K. and T.G.M.; writing—original draft preparation, M.S., T.B., K.T. and W.K.; writing—review and editing, M.S., T.B., K.T., W.K. and T.G.M.; supervision, W.K.; project administration, W.K.; funding acquisition, W.K. All authors have read and agreed to the published version of the manuscript.
Funding
This scientific work was funded by the state budget under the Minister of Science program, entitled “Polish Metrology II” (Poland), project number PM-II/SP/0038/2024/02. The funding amount is PLN 999,530.40, which is also the total project value.
Data Availability Statement
The original contributions presented in the study are included in the article; further inquiries can be directed to the corresponding authors.
Conflicts of Interest
The authors declare no conflicts of interest.
Nomenclature
| A | area, m2 |
| D | diameter, m |
| f | friction coefficient |
| G | mass flux density, kg/m2s |
| k | surface roughness |
| L | length, m |
| m | mass, kg |
| mass flux, kg/s | |
| q | hat flux density, W/m2 |
| R | thermal resistance, m2K/W |
| Ra | arithmetic mean roughness, µm |
| Rq | root mean square roughness, µm |
| Rp | maximum profile peak height, µm |
| Rz | maximum height of the profile, µm |
| s | slip |
| Sa | arithmetical mean height of the surface, µm |
| Sdq | root mean square slope |
| Sdr | developed interfacial area ratio, % |
| Sk | core roughness depth, µm |
| Sp | maximum height of peaks, µm |
| Sv | maximum height of valleys, µm |
| Sz | maximum height of the surface, µm |
| T | temperature, °C |
| U | velocity, m/s |
| V | volume, m3 |
| x | static vapor quality |
| y | dynamic vapor quality |
| Greek | |
| α | heat transfer coefficient, W/m2K; angle |
| β | angle |
| δ | thickness, m |
| θ | temperature, °C |
| ν | specific volume, m3/kg |
| ρ | density, kg/m3 |
| φ | void fraction |
| Subscripts | |
| α | film condensation |
| δ | condensation layer |
| i | phase boundary |
| l | liquid |
| s | saturated |
| v | vapor |
References
- Madejski, J. Theory of Heat Exchange; Wydawnictwo Uczelniane Politechniki Szczecińskiej: Szczecin, Poland, 1998. (In Polish) [Google Scholar]
- Sikora, M.; Bohdal, T.; Witczak, S.; Ligus, G. Flow maps in multiphase flows. Arch. Thermodyn. 2024, 45, 19–28. [Google Scholar] [CrossRef]
- Dziubiński, M.; Prywer, J. Two-Phase Fluid Mechanics; Scientific and Technical Publishing House: Warsaw, Poland, 2009. (In Polish) [Google Scholar]
- Thome, J.R. Two-Phase Flow Patterns. In Engineering Data Book III; Wolverine Tube, Inc.: Decatur, AL, USA, 2007. [Google Scholar]
- Sikora, M. Modeling of Two-Phase Flow Structures During Condensation in Mini-Channels; Koszalin University of Technology: Koszalin, Poland, 2020. (In Polish) [Google Scholar]
- Sripada, S.S.; Ayyaswamy, P.S.; Huang, L.J. Condensation on a spray of water drops: A cell model study—I. Flow description. Int. J. Heat Mass Transf. 1996, 39, 3781–3790. [Google Scholar] [CrossRef]
- Bohdal, T.; Matysko, R. Analysis of Water Vapor Condensation on a Vertical Tube. Ciepłownictwo Ogrzew. Went. 2004, 7–8, 35–41. (In Polish) [Google Scholar]
- Wiśniewski, S.; Wiśniewski, T. Heat Exchange; Wydawnictwo Naukowo-Techniczne: Warsaw, Poland, 2009. (In Polish) [Google Scholar]
- Charun, H.; Bohdal, T. Principles of Heat Transport, Part 2; Wydawnictwo Politechniki Koszalińskiej: Koszalin, Poland, 2012. (In Polish) [Google Scholar]
- Piasecka, M. Flow Boiling on Enhanced Surfaces of Minichannels; Kielce University of Technology: Kielce, Poland, 2014. (In Polish) [Google Scholar]
- Dalkilic, A.S.; Laohalertdecha, S.; Wongwises, S. Two-phase friction factor in vertical downward flow in high mass flux region of refrigerant HFC-134a during condensation. Int. Commun. Heat Mass Transf. 2008, 35, 1147–1152. [Google Scholar] [CrossRef]
- Chisholm, D. Two-Phase Flow in Pipelines and Heat Exchangers; G. Godwin in association with Institution of Chemical Engineers: New York, NY, USA, 1983. [Google Scholar]
- Le Corre, J.-M. Experimental characterization of boiling two-phase flow structures under BWR core operating conditions. Nucl. Eng. Des. 2020, 365, 110708. [Google Scholar] [CrossRef]
- Xiang, J.; Liu, Z.; Zhang, C.; Zhou, C.; Chen, C. Finite Element Simulation of the Machining Process of Boiling Structures in a Novel Radial Heat Sink for High-Power LEDs. Materials 2020, 13, 3958. [Google Scholar] [CrossRef]
- Skiepko, T. Compact Heat Recuperators and Regenerators; IMP Gdańsk PAN: Gdańsk, Poland, 2012. (In Polish) [Google Scholar]
- Trela, M.; Mikielewicz, J. Movement and Heat Exchange of Thin Liquid Films, Maszyny Przepływowe; Zakład Narodowy im. Ossolińskich: Wrocław, Poland, 1998; Volume 23. (In Polish) [Google Scholar]
- Sikora, M.; Anweiler, S.; Meyer, J. Comprehensive analysis of two-phase liquid-gas flow structures in varied channel geometries and thermal environments. Int. J. Heat Mass Transf. 2024, 228, 125665. [Google Scholar] [CrossRef]
- Dziubiński, M.; Prywer, J. Mechanics of Two-Phase Fluids; Wydawnictwo Naukowo-Techniczne: Warsaw, Poland, 2009. (In Polish) [Google Scholar]
- Ulbrich, R. Modern Research Methods for Multiphase Flow Systems; Oficyna Wydawnicza Politechniki Opolskiej: Opole, Poland, 2014. (In Polish) [Google Scholar]
- Milan, M.; Borhani, N.; Thome, J.R. A new type of flow structure in cocurrent adiabatic vertically downward air–water flow: Membrane flow. Int. J. Multiph. Flow 2014, 58, 246–256. [Google Scholar] [CrossRef]
- Murphy, D.L.; Macdonald, M.P.; Mahvi, A.J.; Garimella, S. Condensation of propane in vertical minichannels. Int. J. Heat Mass Transf. 2019, 137, 1154–1166. [Google Scholar] [CrossRef]
- Spedding, P.L.; Woods, G.S.; Raghunathan, R.S.; Watterson, J.K. Flow Pattern, Holdup and Pressure Drop in Vertical and Near Vertical Two- and Three-Phase Upflow. Chem. Eng. Res. Des. 2000, 78, 404–418. [Google Scholar] [CrossRef]
- Flores, J.G. Oil–Water Flow in Vertical and Deviated Wells. Ph.D. Dissertation, University of Tulsa, Tulsa, OK, USA, 1997. [Google Scholar]
- Bruder, M.; Sembach, L.; Lampl, D.; Hirsch, C.; Sattelmayer, T. Local measurements on vertical subcooled flow boiling of refrigerant Novec 649. Int. J. Multiph. Flow 2019, 119, 108–122. [Google Scholar] [CrossRef]
- Mikielewicz, J. Modeling of Thermal-Flow Phenomena; Zakład Narodowy im. Ossolińskich: Wrocław, Poland, 1995. (In Polish) [Google Scholar]
- Sikora, M. Flow Structure Investigations during Novec Refrigerant Condensation in Minichannels. Materials 2021, 14, 6889. [Google Scholar] [CrossRef] [PubMed]
- Mikielewicz, D. Boiling and Condensation in Flow Through Channels and Microchannels; Wydawnictwo Politechniki Gdańskiej: Gdańsk, Poland, 2009. (In Polish) [Google Scholar]
- Available online: https://www.thermalfluidscentral.org/encyclopedia/index.php/File:Flow_patterns_for_condensation_png (accessed on 17 October 2024).
- Bohdal, T.; Charun, H.; Kruzel, M.; Sikora, M. High pressure refrigerants condensation in vertical pipe minichannels. Int. J. Heat Mass Transf. 2019, 134, 1250–1260. [Google Scholar] [CrossRef]
- Kandlikar, S.G.; Garimella, S.; Li, D.; Colin, S.; King, M.R. Heat Transfer and Fluid Flow in Minichannels and Microchannels; Elsevier Inc.: Amsterdam, The Netherlands, 2006. [Google Scholar]
- Fu, B.-R.; Lin, W.-J. Supercritical heat transfer of NOVEC 649 refrigerant in horizontal minichannels. Int. Commun. Heat Mass Transf. 2020, 117, 104740. [Google Scholar] [CrossRef]
- Cavallini, A.; Doretti, L.; Matkovic, M.; Rossetto, L. Condensation in Horizontal Smooth Tubes: A New Heat Transfer Model for Heat Exchanger Design. Heat Transf. Eng. 2006, 27, 31–38. [Google Scholar] [CrossRef]
- Jige, D.; Inoue, N.; Koyama, S. Condensation of refrigerants in a multiport tube with rectangular minichannels. Int. J. Refrig. 2016, 67, 202–213. [Google Scholar] [CrossRef]
- Piasecka, M.; Strąk, K.; Maciejewska, B. Heat transfer characteristics during flow along horizontal and vertical minichannels. Int. J. Multiph. Flow 2021, 137, 103559. [Google Scholar] [CrossRef]
- Ide, H.; Kariyasaki, A.; Fukano, T. Fundamental data on the gas–liquid two-phase flow in minichannels. Int. J. Therm. Sci. 2007, 46, 519–530. [Google Scholar] [CrossRef]
- Awad, M.M.; Dalkiliç, A.S.; Wongwises, S. A Critical Review on Condensation Heat Transfer in Microchannels and Minichannels. J. Nanotechnol. Eng. Med. 2014, 5, 010904. [Google Scholar] [CrossRef]
- Bohdal, T.; Charun, H.; Sikora, M. Condensation of refrigerant R407C in multiport minichannel section. Arch. Thermodyn. 2016, 37, 3–18. [Google Scholar] [CrossRef]
- Ashwood, A.C.; Vanden Hogen, S.J.; Rodarte, M.A.; Kopplin, C.R.; Rodríguez, D.J.; Hurlburt, E.T.; Shedd, T.A. A multiphase, micro-scale PIV measurement technique for liquid film velocity measurements in annular two-phase flow. Int. J. Multiph. Flow 2015, 68, 27–39. [Google Scholar] [CrossRef]
- López-Belchí, A.; Illán-Gómez, F.; García Cascales, J.R.; Vera García, F. R32 and R410A condensation heat transfer coefficient and pressure drop within minichannel multiport tube. Experimental technique and measurements. Appl. Therm. Eng. 2016, 105, 118–131. [Google Scholar] [CrossRef]
- Jige, D.; Kikuchi, S.; Eda, H.; Inoue, N.; Shigeru, K. Two-phase flow characteristics of R32 in horizontal multiport minichannels: Flow visualization and development of flow regime map. Int. J. Refrig. 2018, 95, 156–164. [Google Scholar] [CrossRef]
- Rahman, M.M.; Kariya, K.; Miyara, A. An experimental study and development of new correlation for condensation heat transfer coefficient of refrigerant inside a multiport minichannel with and without fins. Int. J. Heat Mass Transf. 2018, 116, 50–60. [Google Scholar] [CrossRef]
- Al-Zaidi, A.H.; Mahmoud, M.M.; Karayiannis, T.G. Condensation flow patterns and heat transfer in horizontal microchannels. Exp. Therm. Fluid Sci. 2018, 90, 153–173. [Google Scholar] [CrossRef]
- Andresen, U.C.; Garimella, S.; Mitra, B.; Jiang, Y.; Fronk, B.M. Pressure drop during near-critical-pressure condensation of refrigerant blends. Int. J. Refrig. 2015, 59, 1–13. [Google Scholar] [CrossRef]
- Garimella, S.; Agarwal, A.; Killion, J.D. Condensation Pressure Drop in Circular Microchannels. Heat Transf. Eng. 2005, 26, 28–35. [Google Scholar] [CrossRef]
- Hwang, Y.W.; Kim, M.S. The pressure drop in microtubes and the correlation development. Int. J. Heat Mass Transf. 2006, 49, 1804–1812. [Google Scholar] [CrossRef]
- Bohdal, T.; Charun, H.; Sikora, M. Pressure drop during condensation of refrigerants in pipe minichannels. Arch. Thermodyn. 2012, 33, 87–106. [Google Scholar] [CrossRef]
- Thom, J.R.S. Prediction of pressure drop during forced circulation boiling of water. Int. J. Heat Mass Transf. 1964, 7, 709–724. [Google Scholar] [CrossRef]
- Mikielewicz, D.; Wajs, J.; Andrzejczyk, R.; Klugmann, M. Pressure drop of HFE7000 and HFE7100 during flow condensation in minichannels. Int. J. Refrig. 2016, 68, 226–241. [Google Scholar] [CrossRef]
- Wilson, M.J.; Newell, T.A.; Chato, J.C.; Infante Ferreira, C.A. Refrigerant charge, pressure drop, and condensation heat transfer in flattened tubes. Int. J. Refrig. 2003, 26, 442–451. [Google Scholar] [CrossRef]
- Del Col, D.; Bisetto, A.; Bortolato, M.; Torresin, D.; Rossetto, L. Experiments and updated model for two phase frictional pressure drop inside minichannels. Int. J. Heat Mass Transf. 2013, 67, 326–337. [Google Scholar] [CrossRef]
- Garimella, S.; Agarwal, A.; Fronk, B.M. The intermittent and annular flow condensation continuum: Pressure drops at the microscale. Int. J. Multiph. Flow 2016, 84, 129–144. [Google Scholar] [CrossRef]
- Tomasik, J.; Turkowski, M.; Zagożdżon, M. The Influence of Pipeline Roughness on the Indications of Orifice Flowmeters—A New Approach to the Issue. Pomiary Autom. Robot. 2008, 5, 5–8. (In Polish) [Google Scholar]
- Zaripov, V.K.; Semena, M.G.; Shapoval, A.A.; Levterov, A.I. Heat-transfer rate in boiling at a surface with porous coatings in conditions of free motion. J. Eng. Phys. 1989, 57, 859–863. [Google Scholar] [CrossRef]
- Nishikawa, K.; Fujita, Y.; Ohta, H.; Hitaka, S. Effects of system pressure and surface roughness on nucleate boiling heat transfer. Mem. Kyushu Univ. Fac. Eng. 1982, 42, 95–123. [Google Scholar]
- Kang, M.-G. Effect of surface roughness on pool boiling heat transfer. Int. J. Heat Mass Transf. 2000, 43, 4073–4085. [Google Scholar] [CrossRef]
- Poniewski, M. Bubble Boiling on Developed Microsurfaces; Kielce University of Technology: Kielce, Poland, 2001. (In Polish) [Google Scholar]
- Ribatski, G.; Jabardo, J.M.S. Experimental study of nucleate boiling of halocarbon refrigerants on cylindrical surfaces. Int. J. Heat Mass Transf. 2003, 46, 4439–4451. [Google Scholar] [CrossRef]
- Cieśliński, J.; Targański, W. Research on the boiling of refrigerants in pipes with a developed surface, in polish. Tech. Chłod. Klimatyzacyjna 2003, 1, 11–17. [Google Scholar]
- Wojcik, T.M. Experimental investigations of boiling heat transfer hysteresis on sintered, metal—Fibrous, porous structures. Exp. Therm. Fluid Sci. 2009, 33, 397–404. [Google Scholar] [CrossRef]
- Hosseini, R.; Gholaminejad, A.; Jahandar, H. Roughness Effects on Nucleate Pool Boiling of R-113 on Horizontal Circular Copper Surfaces. World Acad. Sci. Eng. Technol. 2011, 55, 679–684. [Google Scholar]
- Kalawa, W.; Wójcik, T.M.; Piasecka, M. Heat transfer research on enhanced heating surfaces in pool boiling. EPJ Web Conf. 2017, 143, 02048. [Google Scholar] [CrossRef]
- Orman, Ł. Enhanced Boiling Heat Transfer on Surfaces Covered with Microstructural Mesh Coatings. Jordan J. Mech. Ind. Eng. 2019, 13, 155–160. [Google Scholar]
- Pastuszko, R.; Kaniowski, R.; Wójcik, T.M. Comparison of pool boiling performance for plain micro-fins and micro-fins with a porous layer. Appl. Therm. Eng. 2020, 166, 114658. [Google Scholar] [CrossRef]
- Pastuszko, R. Pool boiling for extended surfaces with narrow tunnels—Visualization and a simplified model. Exp. Therm. Fluid Sci. 2012, 38, 149–164. [Google Scholar] [CrossRef]
- Ammerman, C.N.; You, S.M. Enhancing Small-Channel Convective Boiling Performance Using a Microporous Surface Coating. Int. J. Heat Mass Transf. 2001, 123, 976–983. [Google Scholar] [CrossRef]
- Khanikar, V.; Mudawar, I.; Fisher, T. Effects of carbon nanotube coating on flow boiling in a micro-channel. Int. J. Heat Mass Transf. 2009, 52, 3805–3817. [Google Scholar] [CrossRef]
- Sun, Y.; Zhang, L.; Xu, H.; Zhong, X. Flow boiling enhancement of FC-72 from microporous surfaces in minichannels. Exp. Therm. Fluid Sci. 2011, 35, 1418–1426. [Google Scholar] [CrossRef]
- Morshed, A.K.M.M.; Yang, F.; Yakut Ali, M.; Khan, J.A.; Li, C. Enhanced flow boiling in a microchannel with integration of nanowires. Appl. Therm. Eng. 2012, 32, 68–75. [Google Scholar] [CrossRef]
- Bai, P.; Tang, T.; Tang, B. Enhanced flow boiling in parallel microchannels with metallic porous coating. Appl. Therm. Eng. 2013, 58, 291–297. [Google Scholar] [CrossRef]
- Orman, Ł.; Orman, K.; Wojton, I. Pool Boiling Heat Transfer from Rough and Microstructure Coated Surfaces. Rocz. Ochr. Sr. 2020, 22, 514–525. [Google Scholar]
- Myers, J.G.; Hussey, S.W.; Yee, G.F.; Yerramilli, V.K.; Kim, J. Time and Space Resolved Wall Temperature Measurements During Nucleate Boiling with Constant Heat Flux Boundary Conditions; American Society of Mechanical Engineers: New York, NY, USA, 2004; Volume 3, pp. 453–460. [Google Scholar] [CrossRef]
- Upot, N.V.; Rabbi, K.F.; Khodakarami, S.; Ho, J.Y.; Mendizabal, J.K.; Miljkovic, N. Advances in micro and nanoengineered surfaces for enhancing boiling and condensation heat transfer: A review. Nanoscale Adv. 2023, 5, 1232–1270. [Google Scholar] [CrossRef] [PubMed]
- Wenzel, R.N. Resistance of Solid Surfaces to Wetting by Water. Ind. Eng. Chem. 1936, 28, 988–994. [Google Scholar] [CrossRef]
- Oberli, L.; Caruso, D.; Hall, C.; Fabretto, M.; Murphy, P.J.; Evans, D. Condensation and freezing of droplets on superhydrophobic surfaces. Adv. Colloid Interface Sci. 2014, 210, 47–57. [Google Scholar] [CrossRef]
- Zhang, W.; Xu, J.; Thome, J.R. Periodic bubble emission and appearance of an ordered bubble sequence (train) during condensation in a single microchannel. Int. J. Heat Mass Transf. 2008, 51, 3420–3433. [Google Scholar] [CrossRef]
- Zhang, B.J.; Kuok, C.; Kim, K.J.; Hwang, T.; Yoon, H. Dropwise steam condensation on various hydrophobic surfaces: Polyphenylene sulfide (PPS), polytetrafluoroethylene (PTFE), and self-assembled micro/nano silver (SAMS). Int. J. Heat Mass Transf. 2015, 89, 353–358. [Google Scholar] [CrossRef]
- Qin, S.; Ji, R.; Miao, C.; Jin, L.; Yang, C.; Meng, X. Review of enhancing boiling and condensation heat transfer: Surface modification. Renew. Sustain. Energy Rev. 2024, 189, 113882. [Google Scholar] [CrossRef]
- Antao, D.S.; Wilke, K.L.; Sack, J.H.; Xu, Z.; Preston, D.J.; Wang, E.N. Jumping droplet condensation in internal convective vapor flow. Int. J. Heat Mass Transf. 2020, 163, 120398. [Google Scholar] [CrossRef]
- Shi, J.; Zheng, G.; Chen, Z.; Dang, C. Experimental study of flow condensation heat transfer in tubes partially filled with hydrophobic annular metal foam. Int. J. Heat Mass Transf. 2019, 136, 1265–1272. [Google Scholar] [CrossRef]
- Chen, J.; Li, W.; Fu, C.; Xu, D. Experimental investigation on convective condensation heat transfer in horizontal 4mm diameter coated tube. Int. J. Heat Mass Transf. 2022, 183, 122162. [Google Scholar] [CrossRef]
- Wang, C.-Y.; Ji, W.-T.; Zhao, C.-Y.; Chen, L.; Tao, W.-Q. Experimental determination of the role of roughness and wettability on pool-boiling heat transfer of refrigerant. Int. J. Refrig. 2023, 153, 205–221. [Google Scholar] [CrossRef]
- El Hajal, J.; Thome, J.R.; Cavallini, A. Condensation in horizontal tubes, part 1: Two-phase flow pattern map. Int. J. Heat Mass Transf. 2003, 46, 3349–3363. [Google Scholar] [CrossRef]
- Cooke, D.; Kandlikar, S.G. Pool Boiling Heat Transfer and Bubble Dynamics Over Plain and Enhanced Microchannels. In Proceedings of the ASME 2010 8th International Conference on Nanochannels, Microchannels, and Minichannels Collocated with 3rd Joint US-European Fluids Engineering Summer Meeting. ASME 2010 8th International Conference on Nanochannels, Microchannels, and Minichannels: Parts A and B., Montreal, QC, Canada, 1–5 August 2010; pp. 163–172. [Google Scholar] [CrossRef]
- Koyama, K.; Chiyoda, H.; Arima, H.; Okamoto, A.; Ikegami, Y. Measurement and Prediction of Heat Transfer Coefficient on Ammonia Flow Boiling in a Microfin Plate Evaporator. Int. J. Refrig. 2014, 44, 36–48. [Google Scholar] [CrossRef]
- Guo, Y.; Zhu, C.-Y.; Gong, L.; Zhang, Z.-B. Numerical Simulation of Flow Boiling Heat Transfer in Microchannel with Surface Roughness. Int. J. Heat Mass Transf. 2023, 204, 123830. [Google Scholar] [CrossRef]
- Tandecka, K.; Kacalak, W.; Wieczorowski, M.; Mathia, T.G. Evaluation of Surface Finishing Efficiency of Titanium Alloy Grade 5 (Ti–6Al–4V) After Superfinishing Using Abrasive Films. Materials 2024, 17, 5198. [Google Scholar] [CrossRef]
- Kubiak, K.J.; Wilson, M.C.T.; Mathia, T.G.; Carval, P. Wettability versus Roughness of Engineering Surfaces. Wear 2011, 271, 523–528. [Google Scholar] [CrossRef]
- Mathia, T.G.; Pawlus, P.; Wieczorowski, M. Recent trends in surface metrology. Wear 2011, 271, 494–508. [Google Scholar] [CrossRef]
- Pawlus, P.; Reizer, R.; Wieczorowski, M. Functional Importance of Surface Texture Parameters. Materials 2021, 14, 5326. [Google Scholar] [CrossRef]
- ISO 25178-2:2021; Geometrical Product Specifications (GPS): Surface Texture: Areal—Part 2: Terms, Definitions and SurfaceTexture Parameters. ISO: Geneva, Switzerland, 2021.
- Tandecka, K.; Kacalak, W.; Wiliński, M.; Wieczorowski, M.; Mathia, T.G. Superfinishing with Abrasive Films Featuring Discontinuous Surfaces. Materials 2024, 17, 1704. [Google Scholar] [CrossRef]
- Tandecka, K.; Kacalak, W.; Rypina, Ł.; Wiliński, M.; Wieczorowski, M.; Mathia, T.G. Effects of Pressure Rollers with Variable Compliance in the Microfinishing Process Utilizing Abrasive Films. Materials 2024, 17, 1795. [Google Scholar] [CrossRef] [PubMed]
- Tandecka, K.; Kacalak, W.; Wieczorowski, M.; Rokosz, K.; Chapon, P.; Mathia, T.G. Ultrathin Carbon Textures Produced on Machined Surfaces in an Integrated Finishing Process Using Microabrasive Films. Materials 2024, 17, 3456. [Google Scholar] [CrossRef] [PubMed]
- Tandecka, K.; Kacalak, W.; Wiliński, M.; Wieczorowski, M.; Mathia, T.G. Morphology of Microchips in the Surface Finishing Process Utilizing Abrasive Films. Materials 2024, 17, 688. [Google Scholar] [CrossRef] [PubMed]
- Tandecka, K.; Kacalak, W.; Szafraniec, F.; Wieczorowski, M.; Mathia, T.G. Evaluation of the Surface Topography of Microfinishing Abrasive Films in Relation to Their Machining Capability of Nimonic 80A Superalloy. Materials 2024, 17, 2430. [Google Scholar] [CrossRef]
- Tandecka, K.; Kacalak, W.; Mathia, T.G. Comparative Analysis of Microabrasive Film Finishing Effects across Various Process Variants. Materials 2024, 17, 3582. [Google Scholar] [CrossRef]
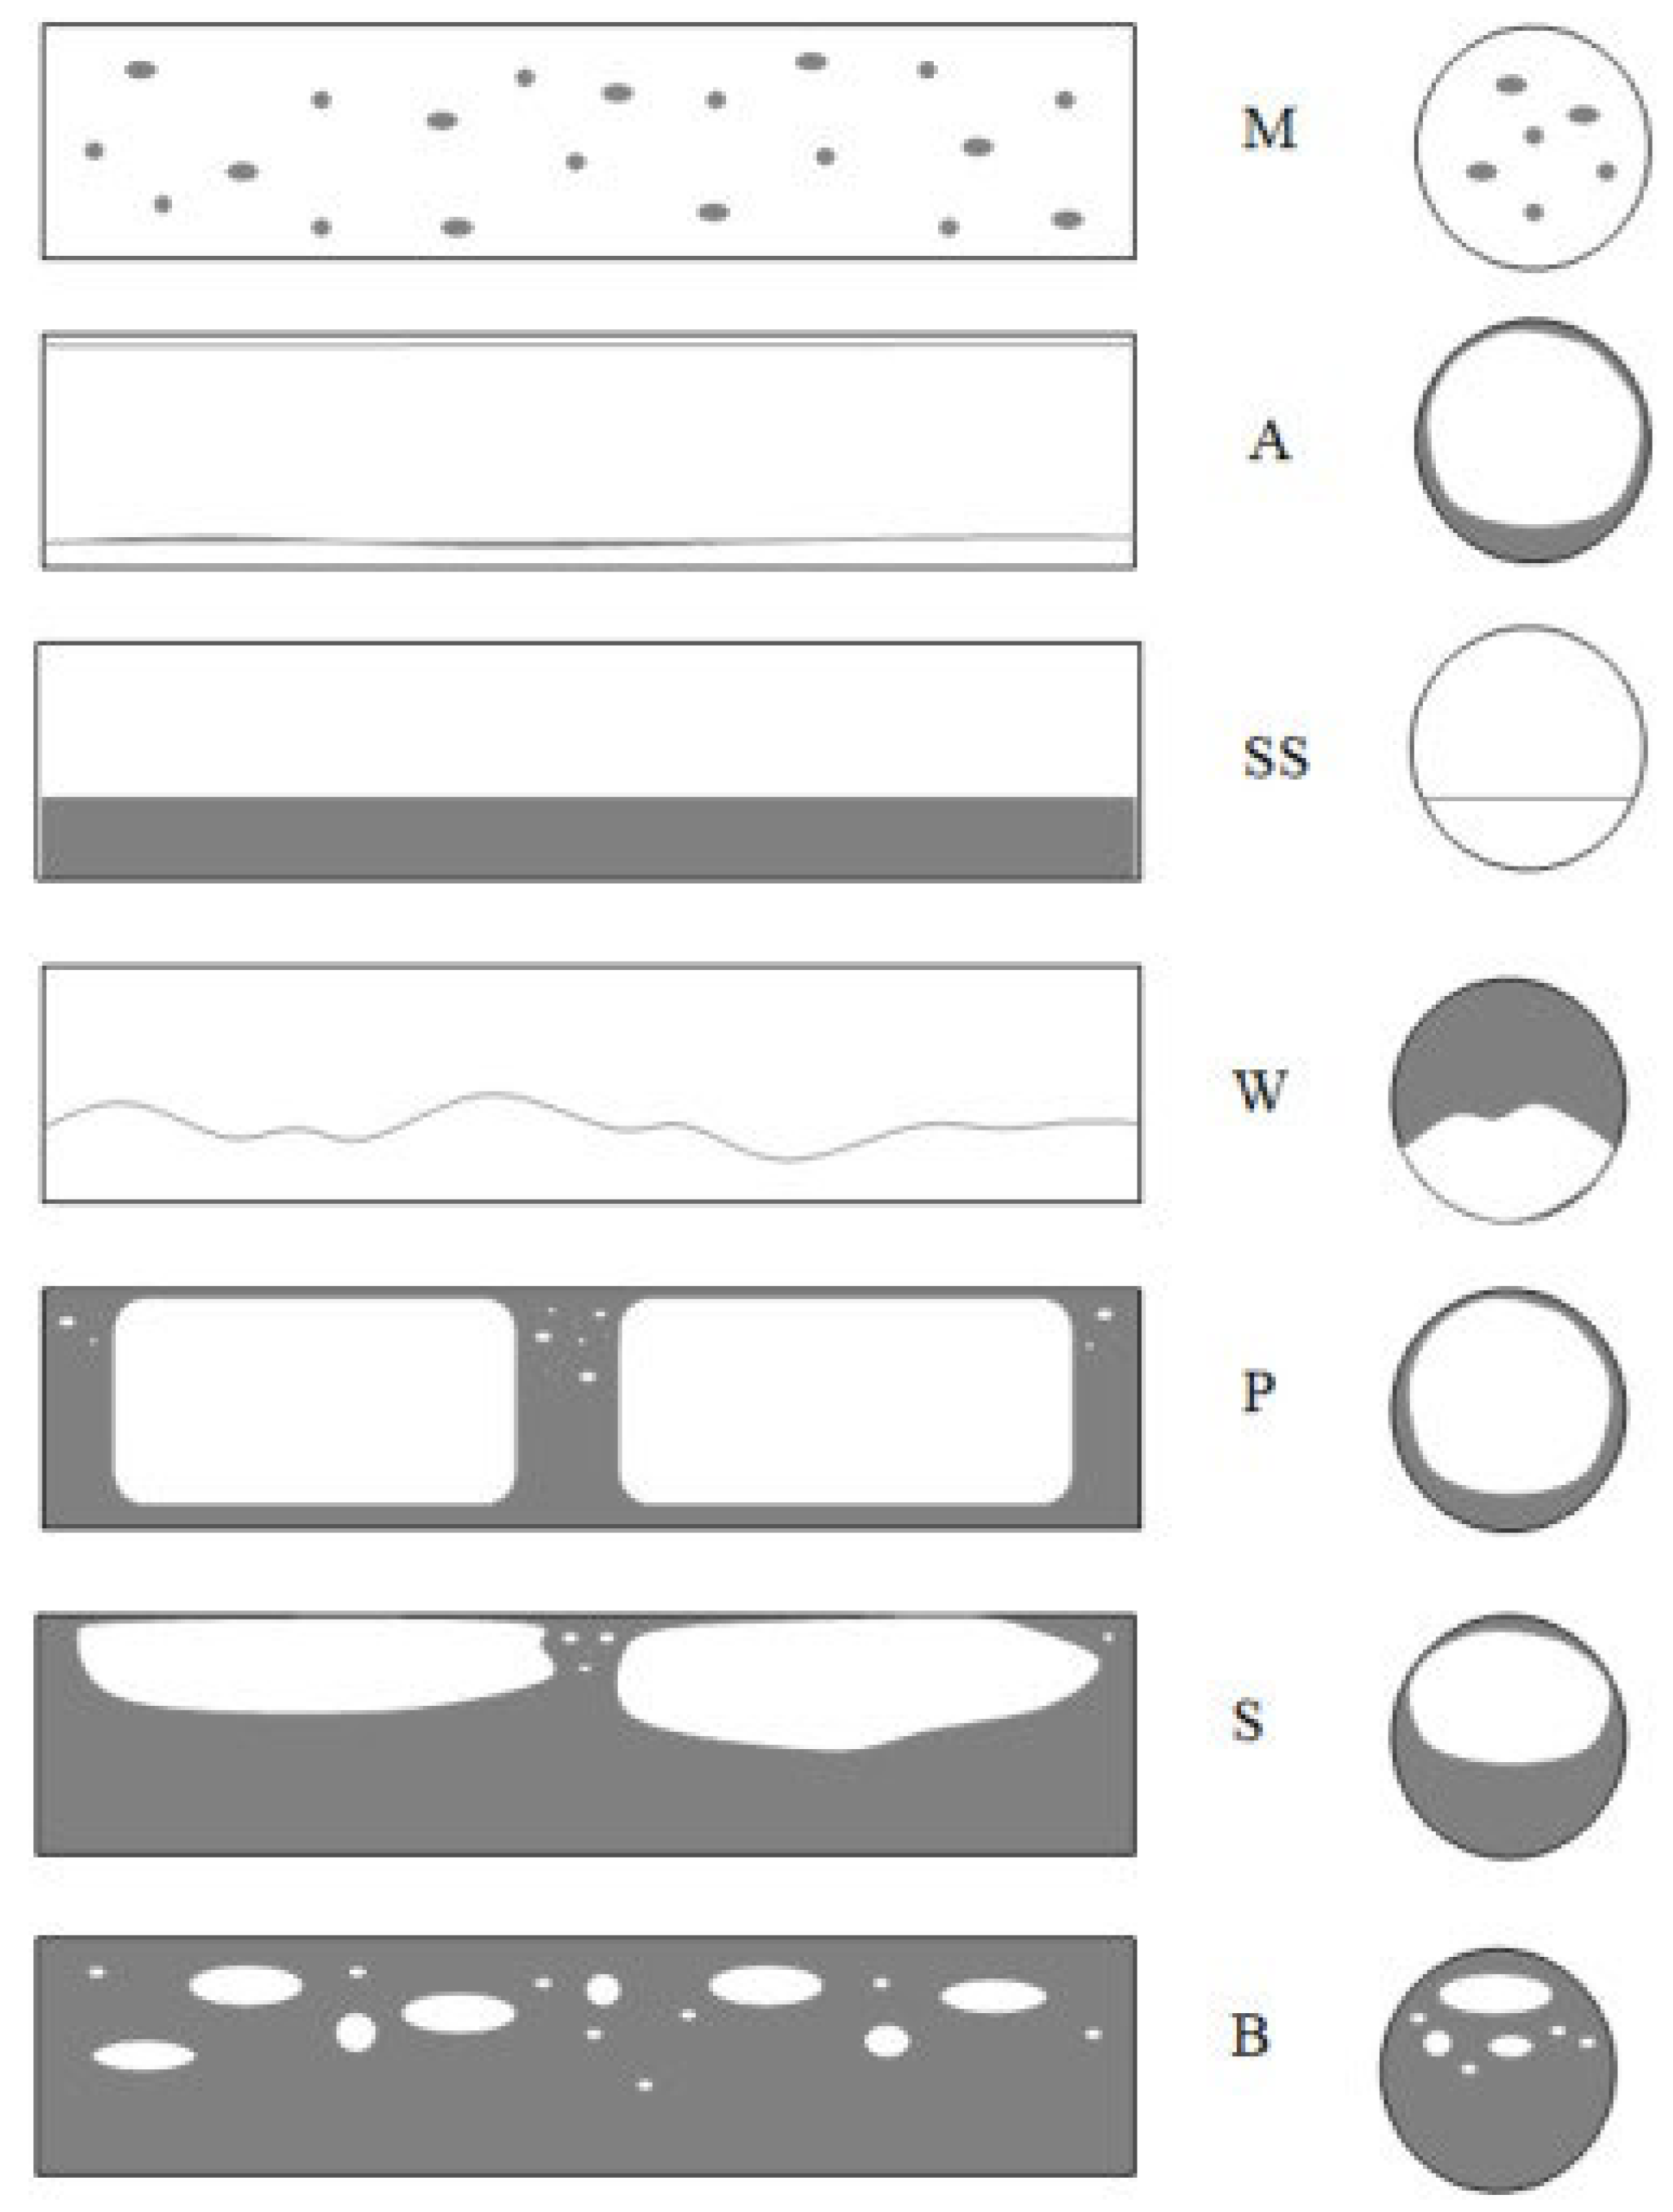
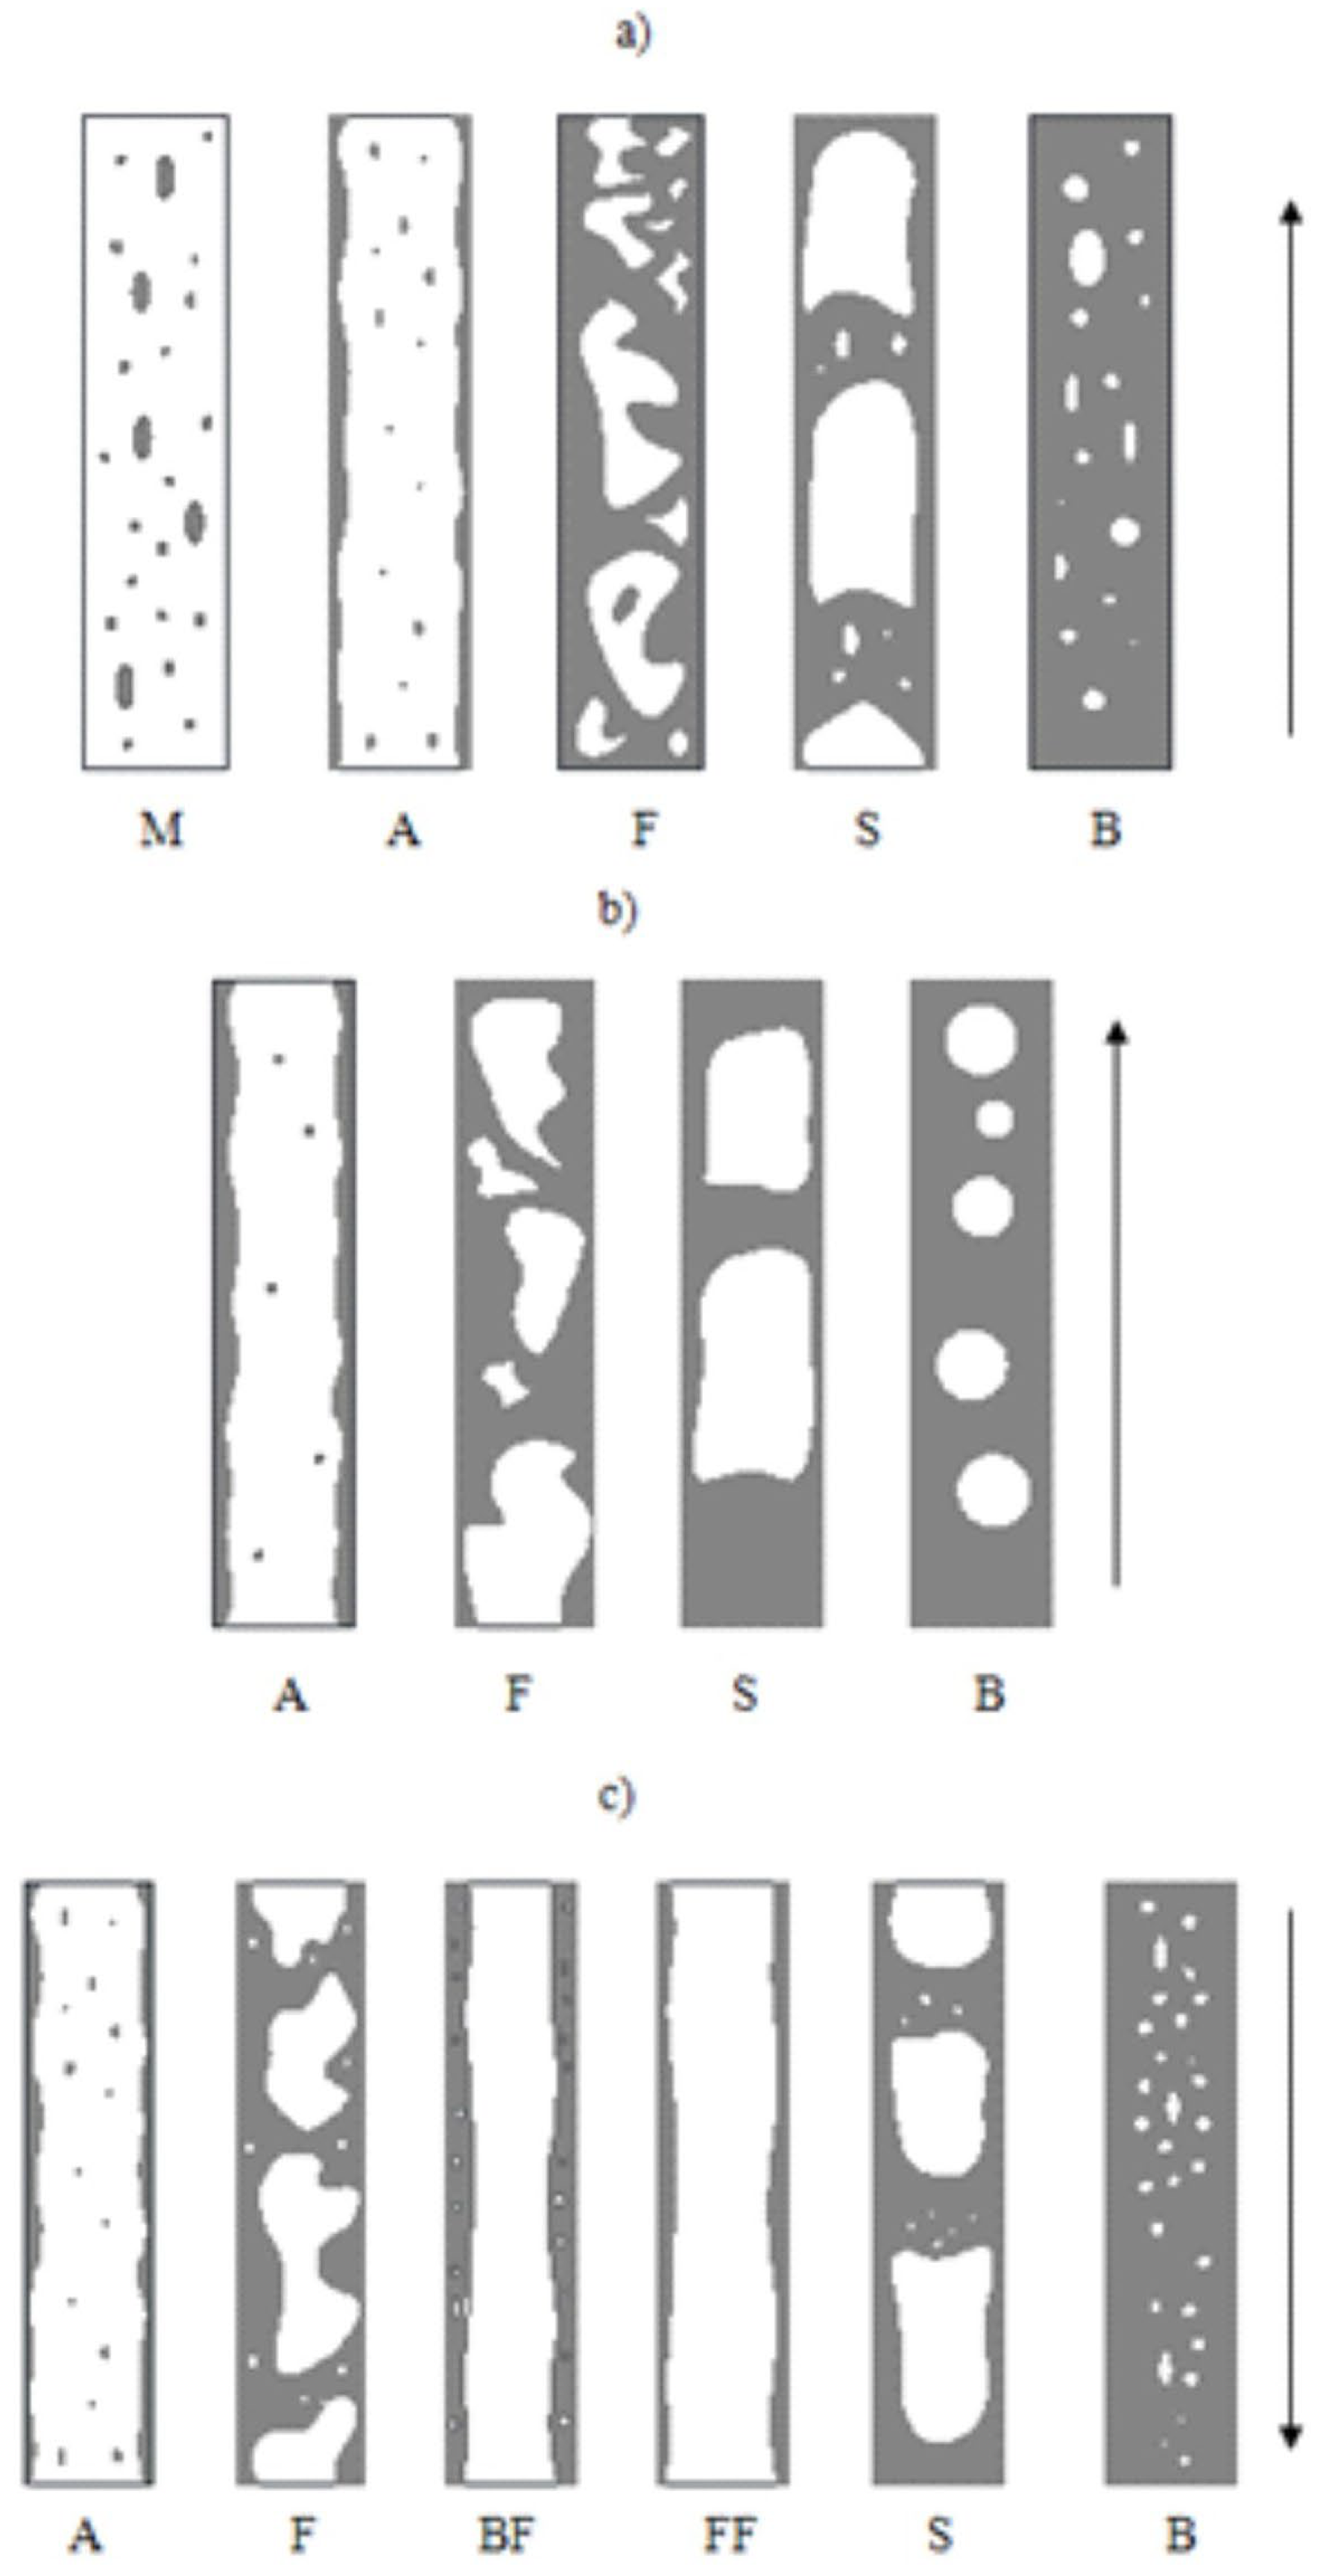
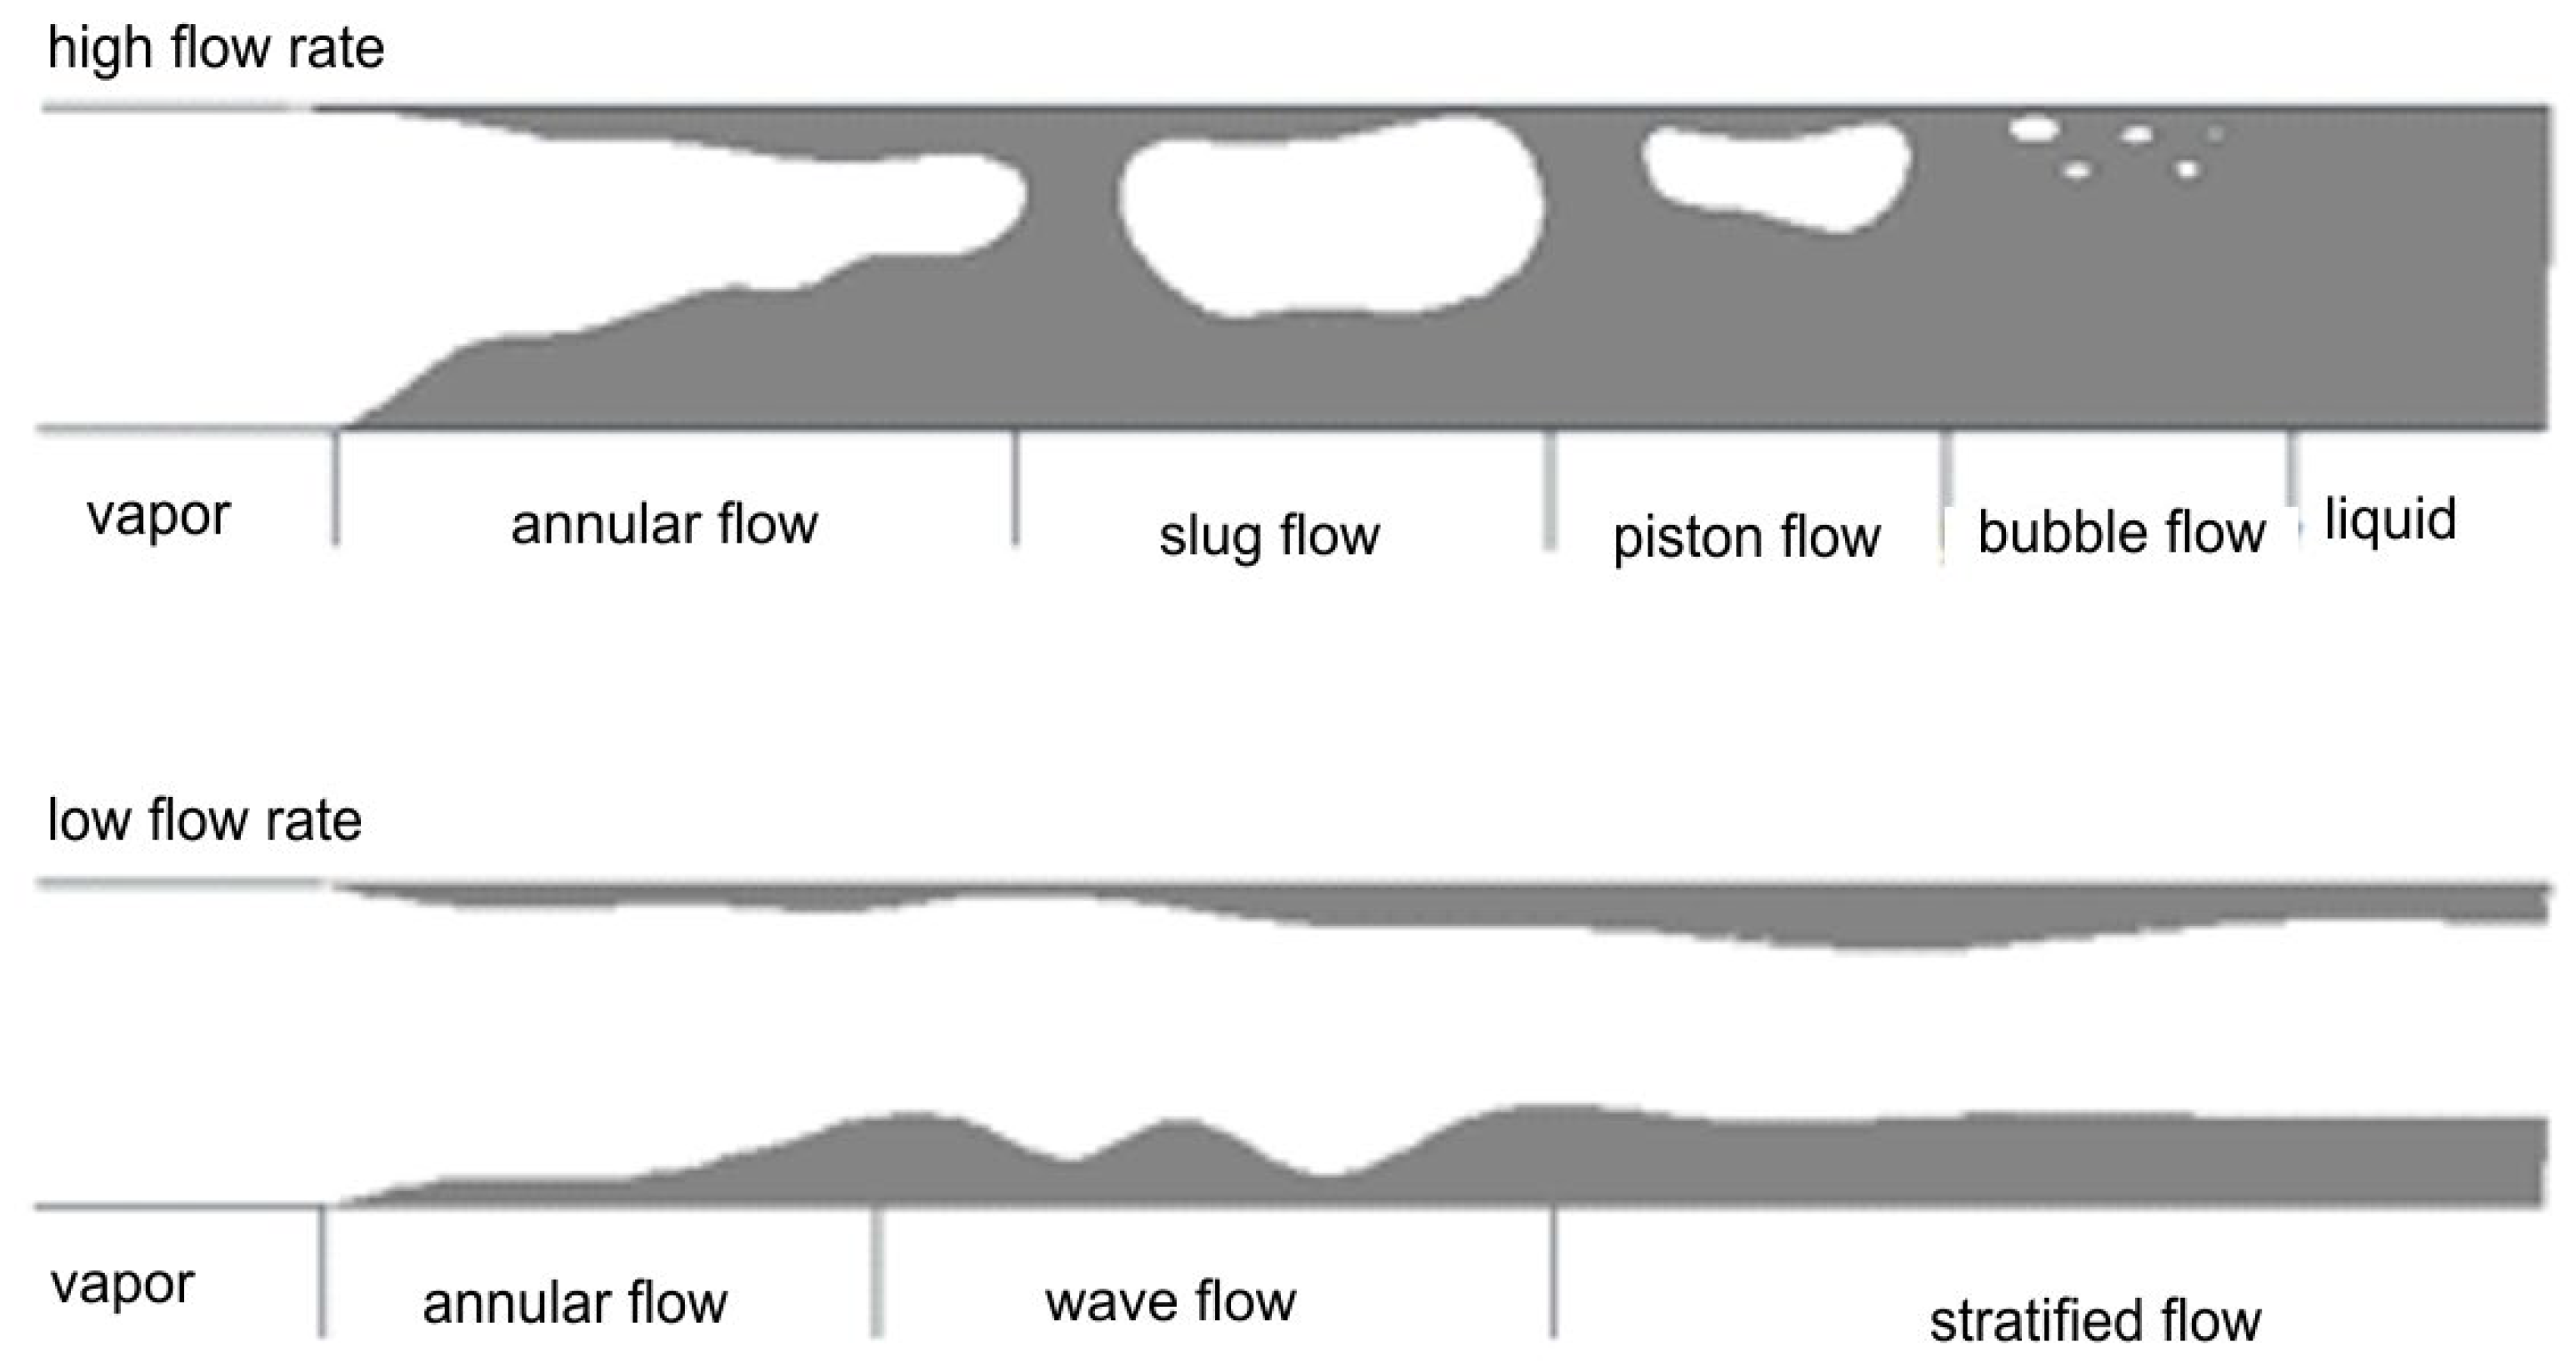
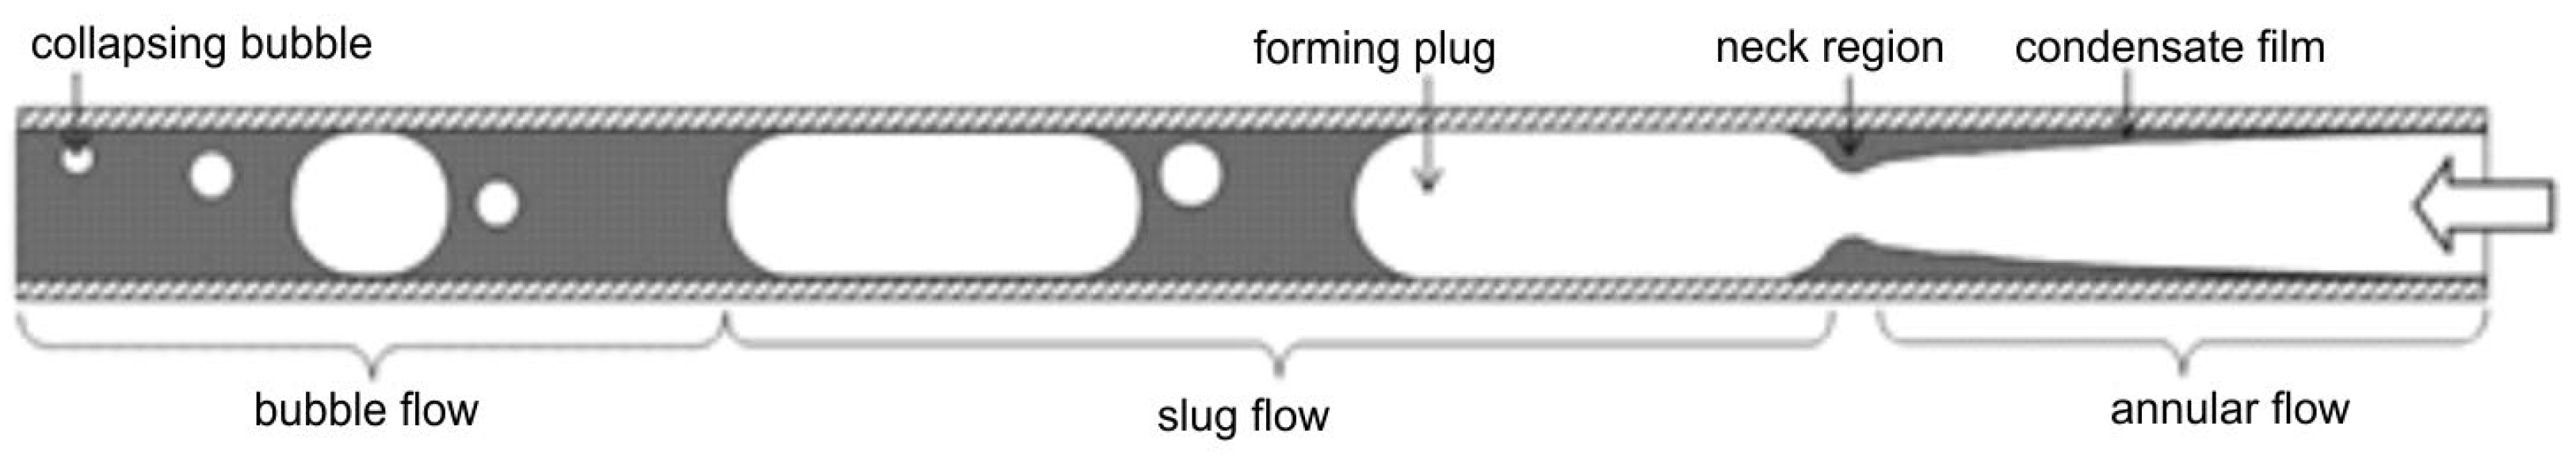
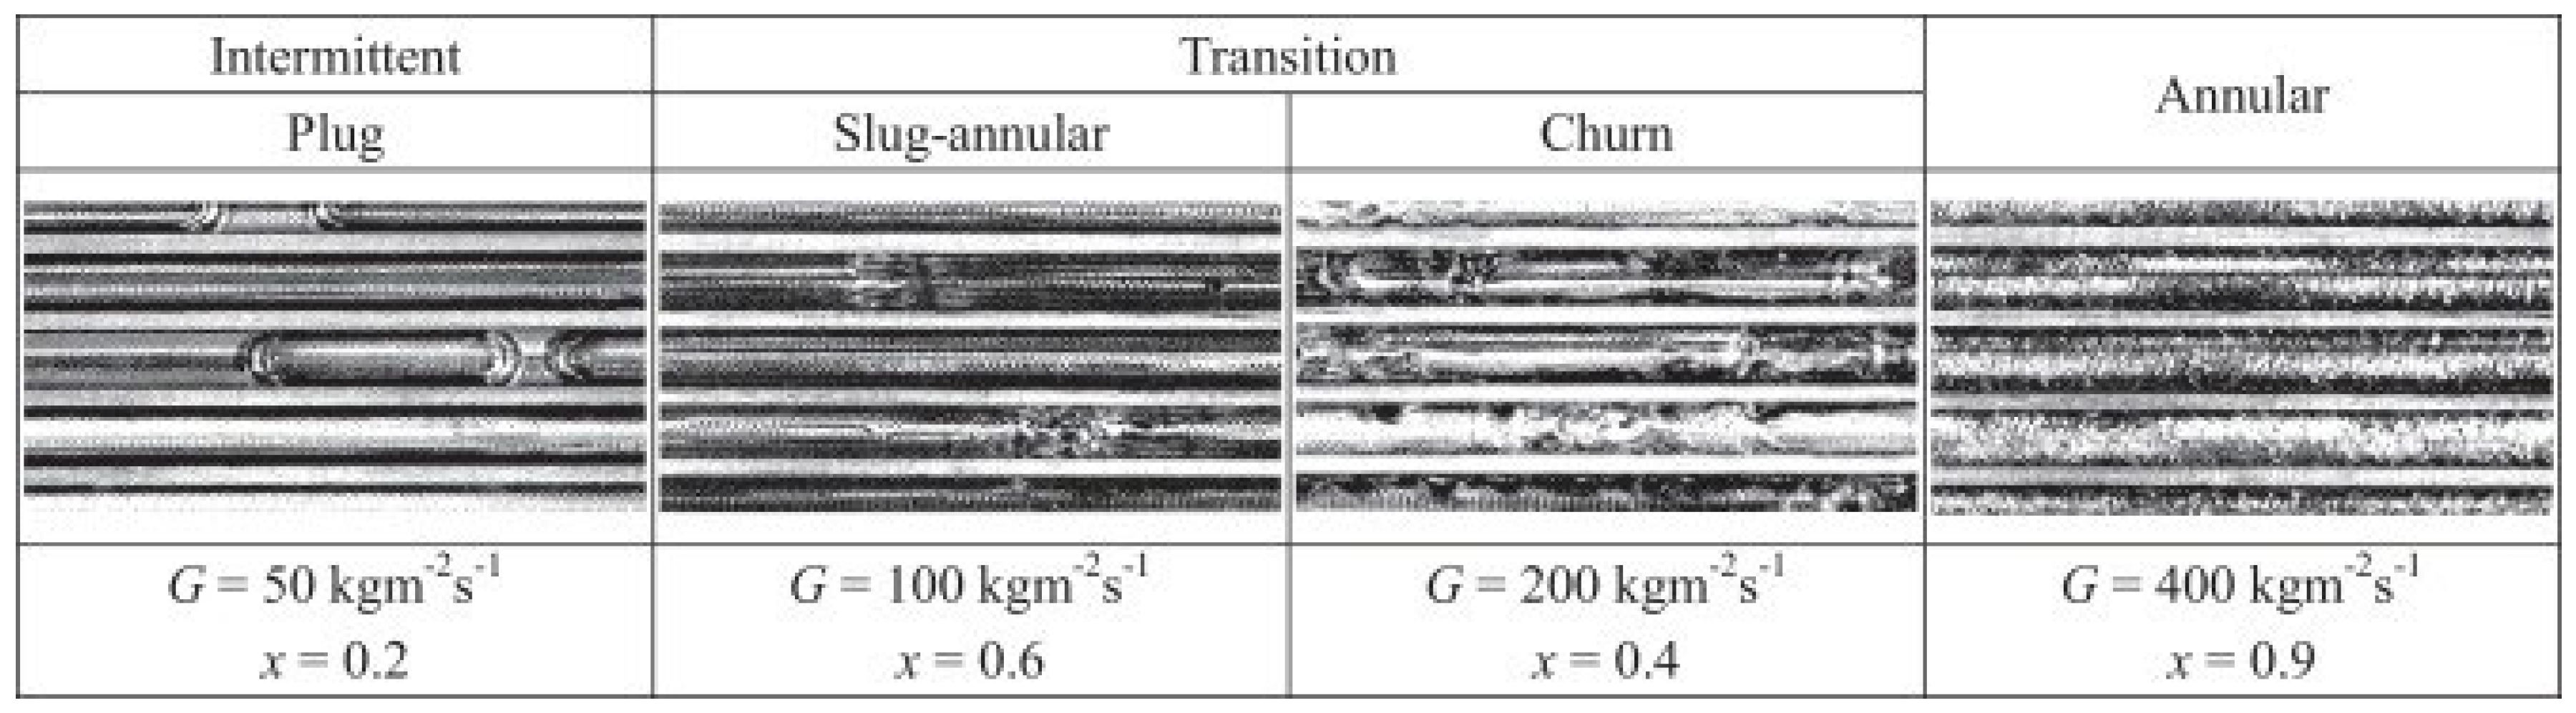

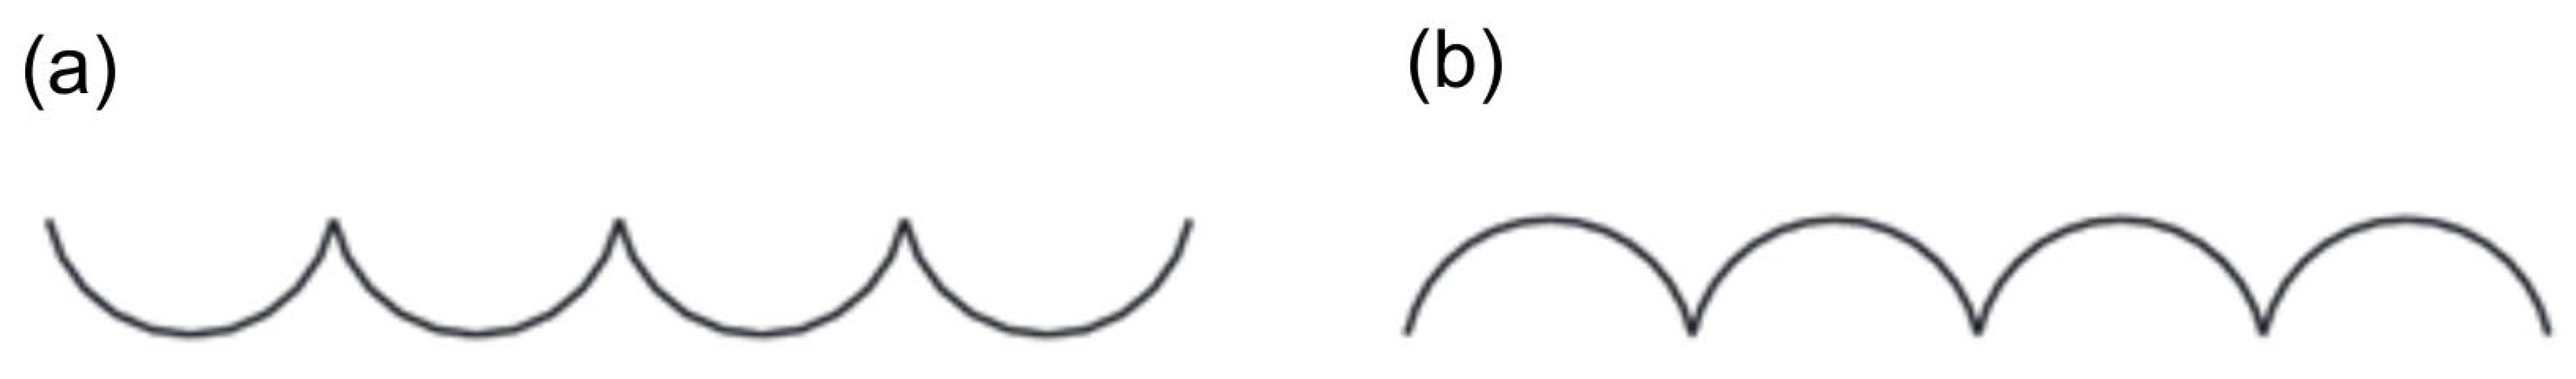
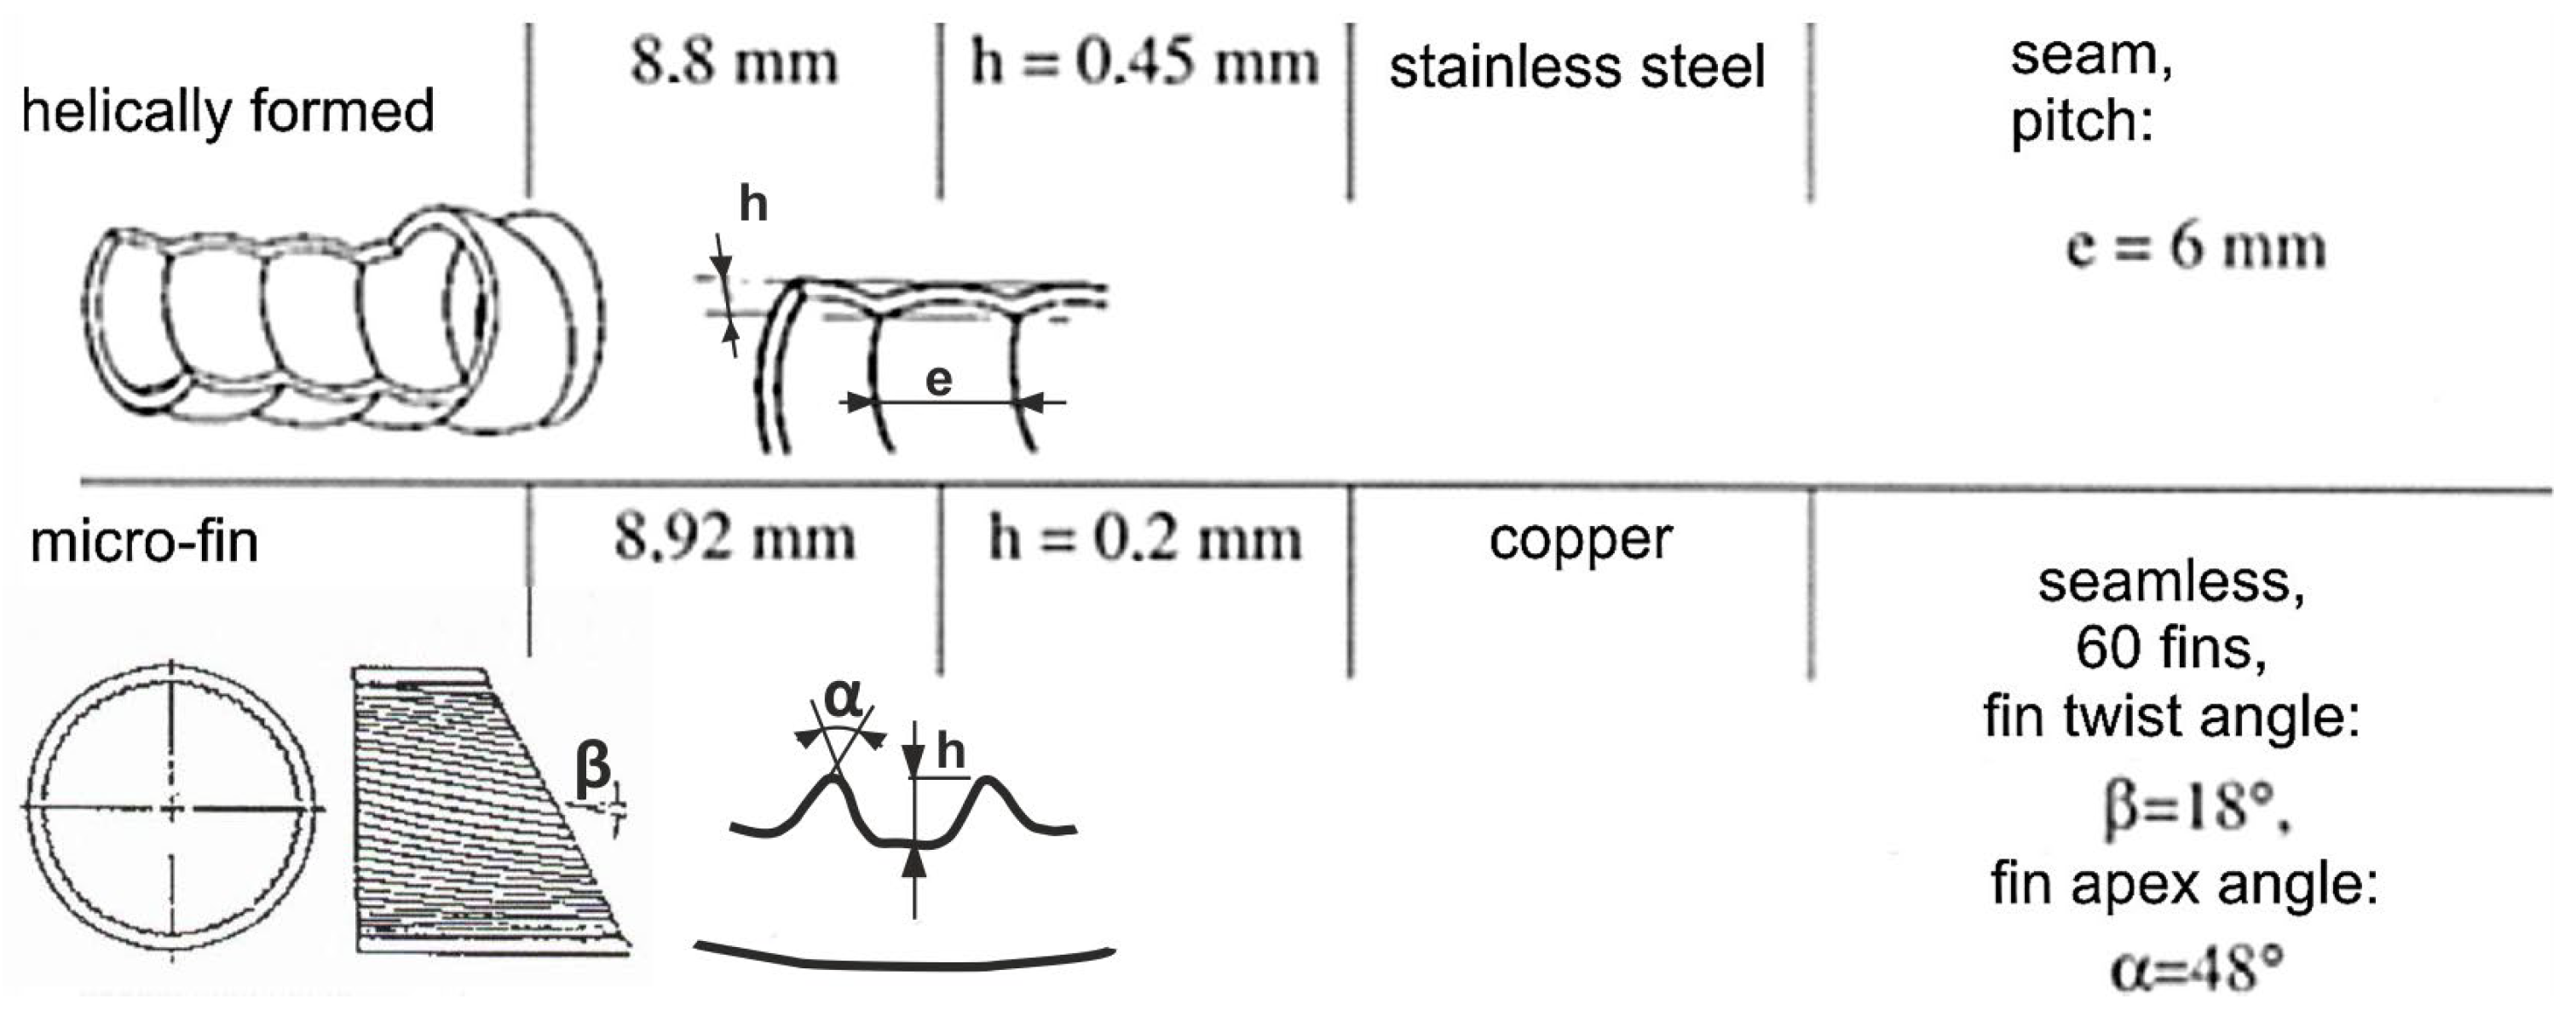
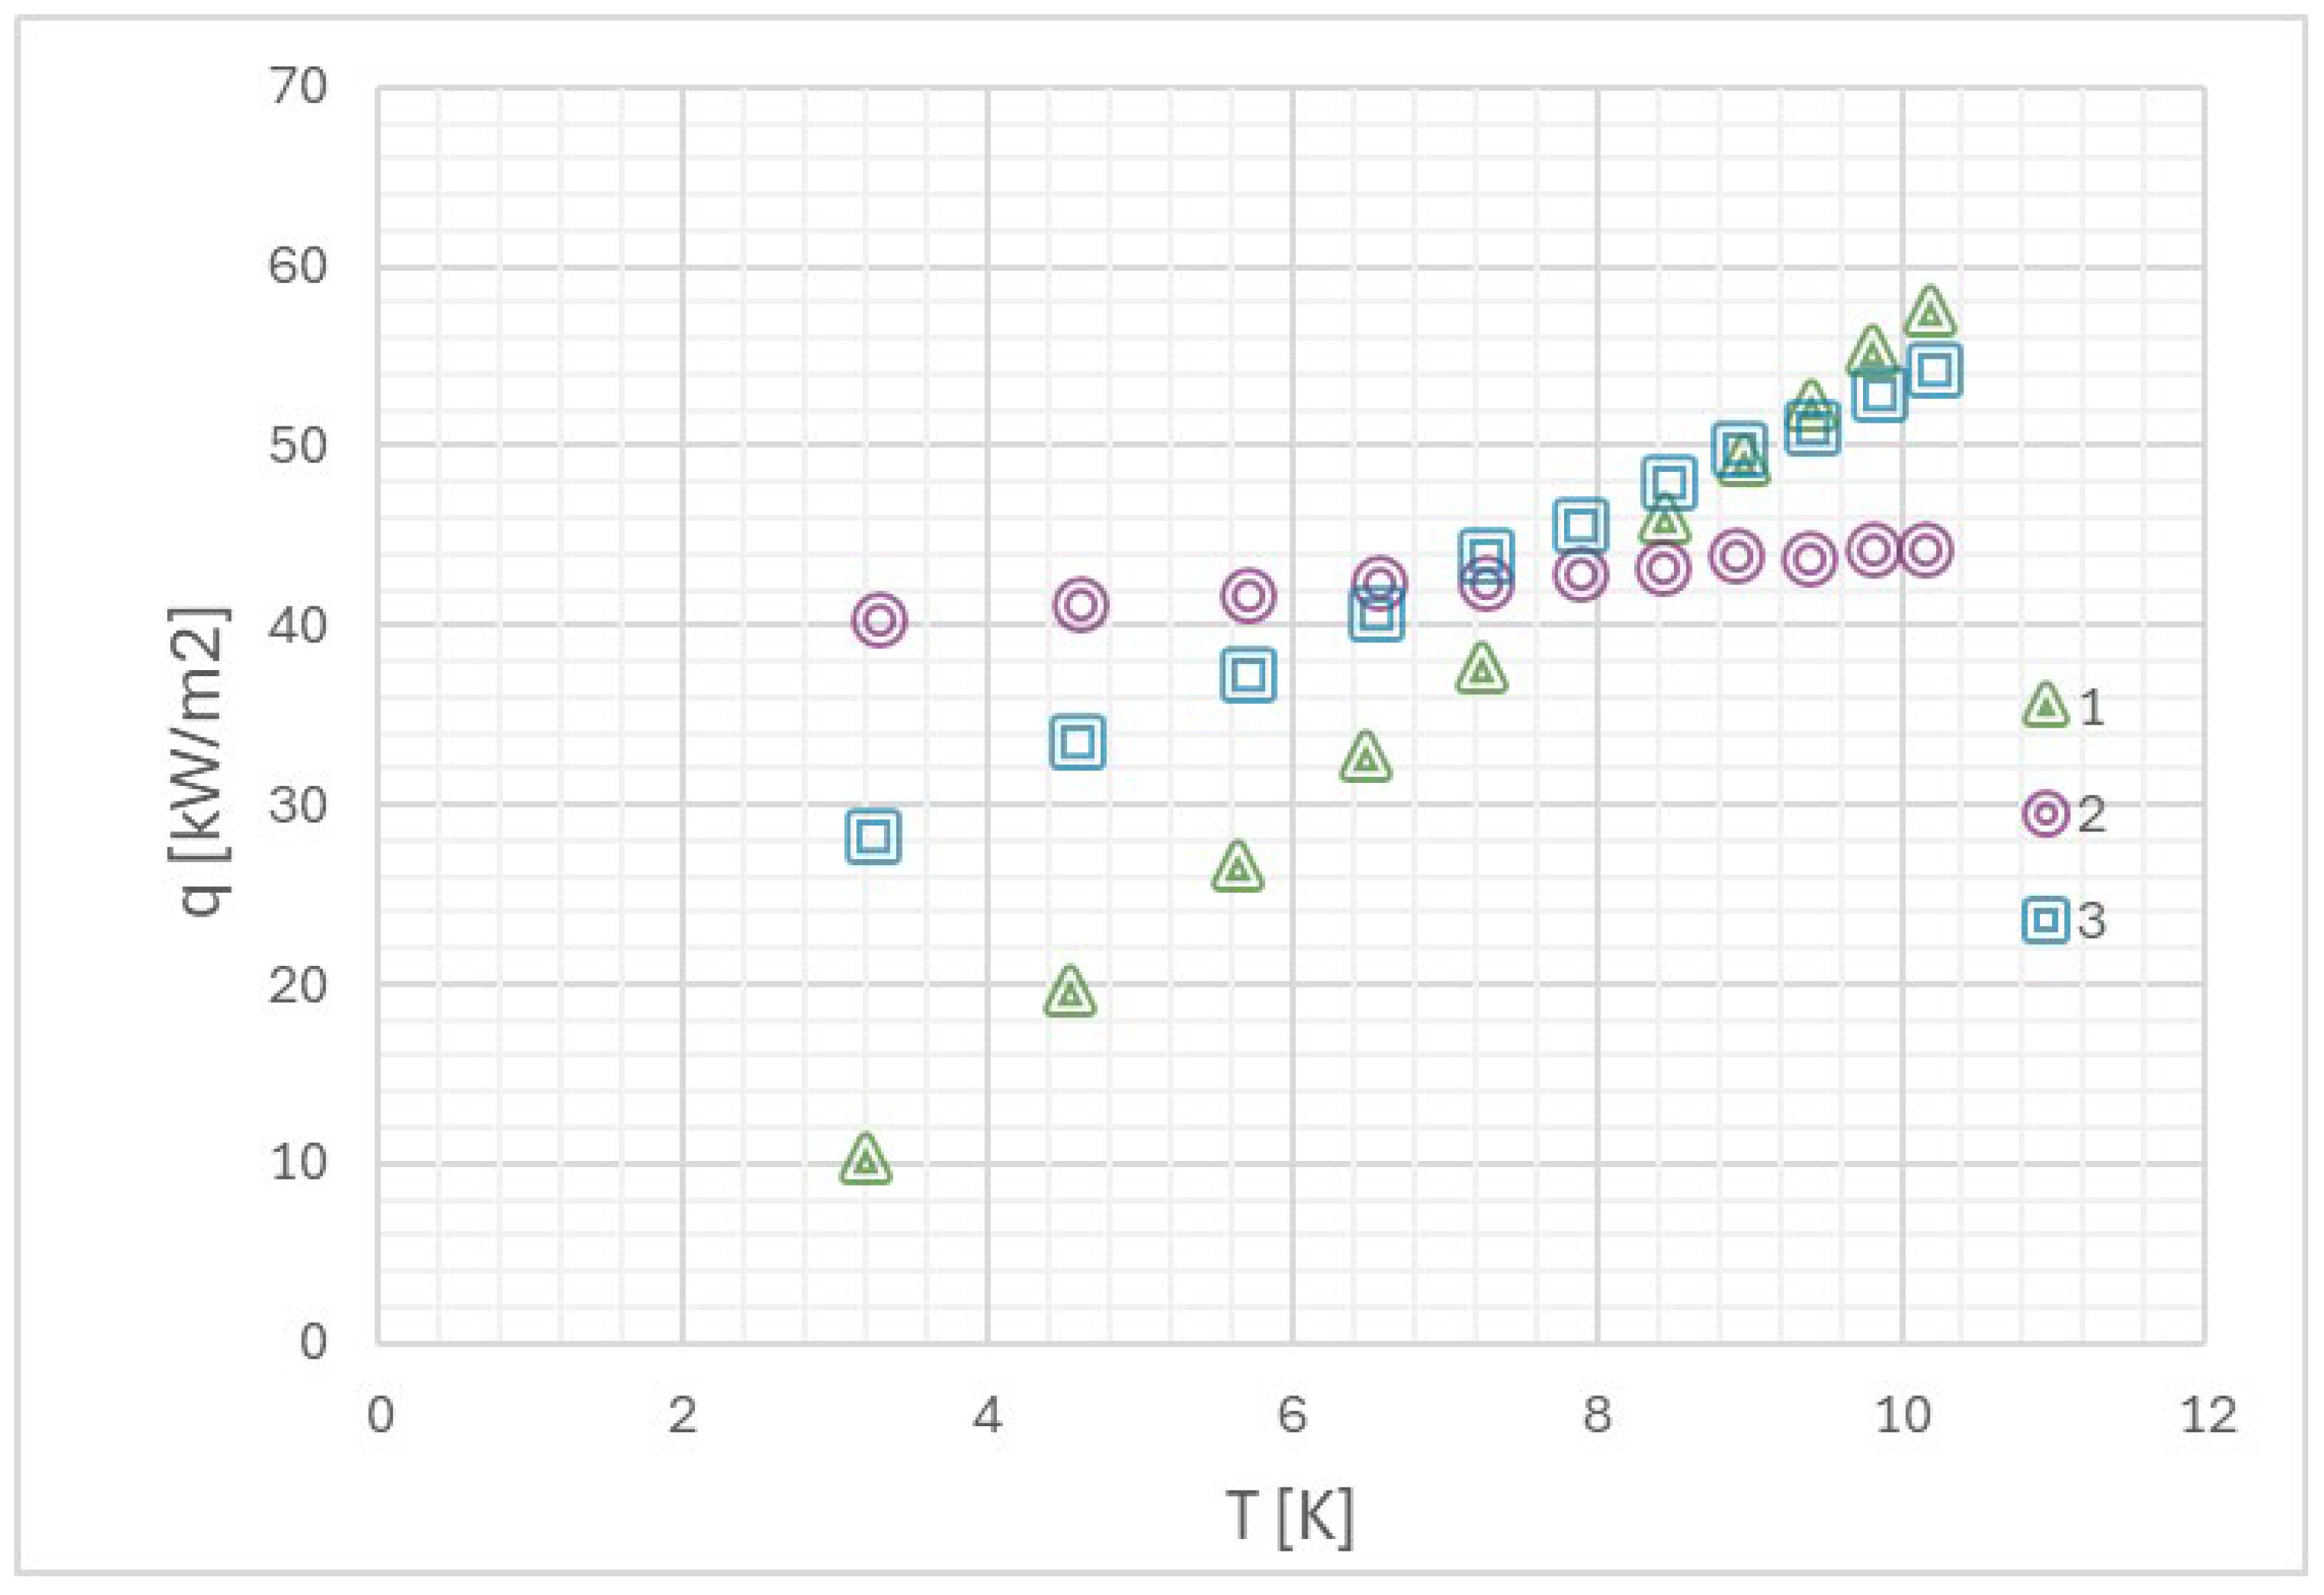
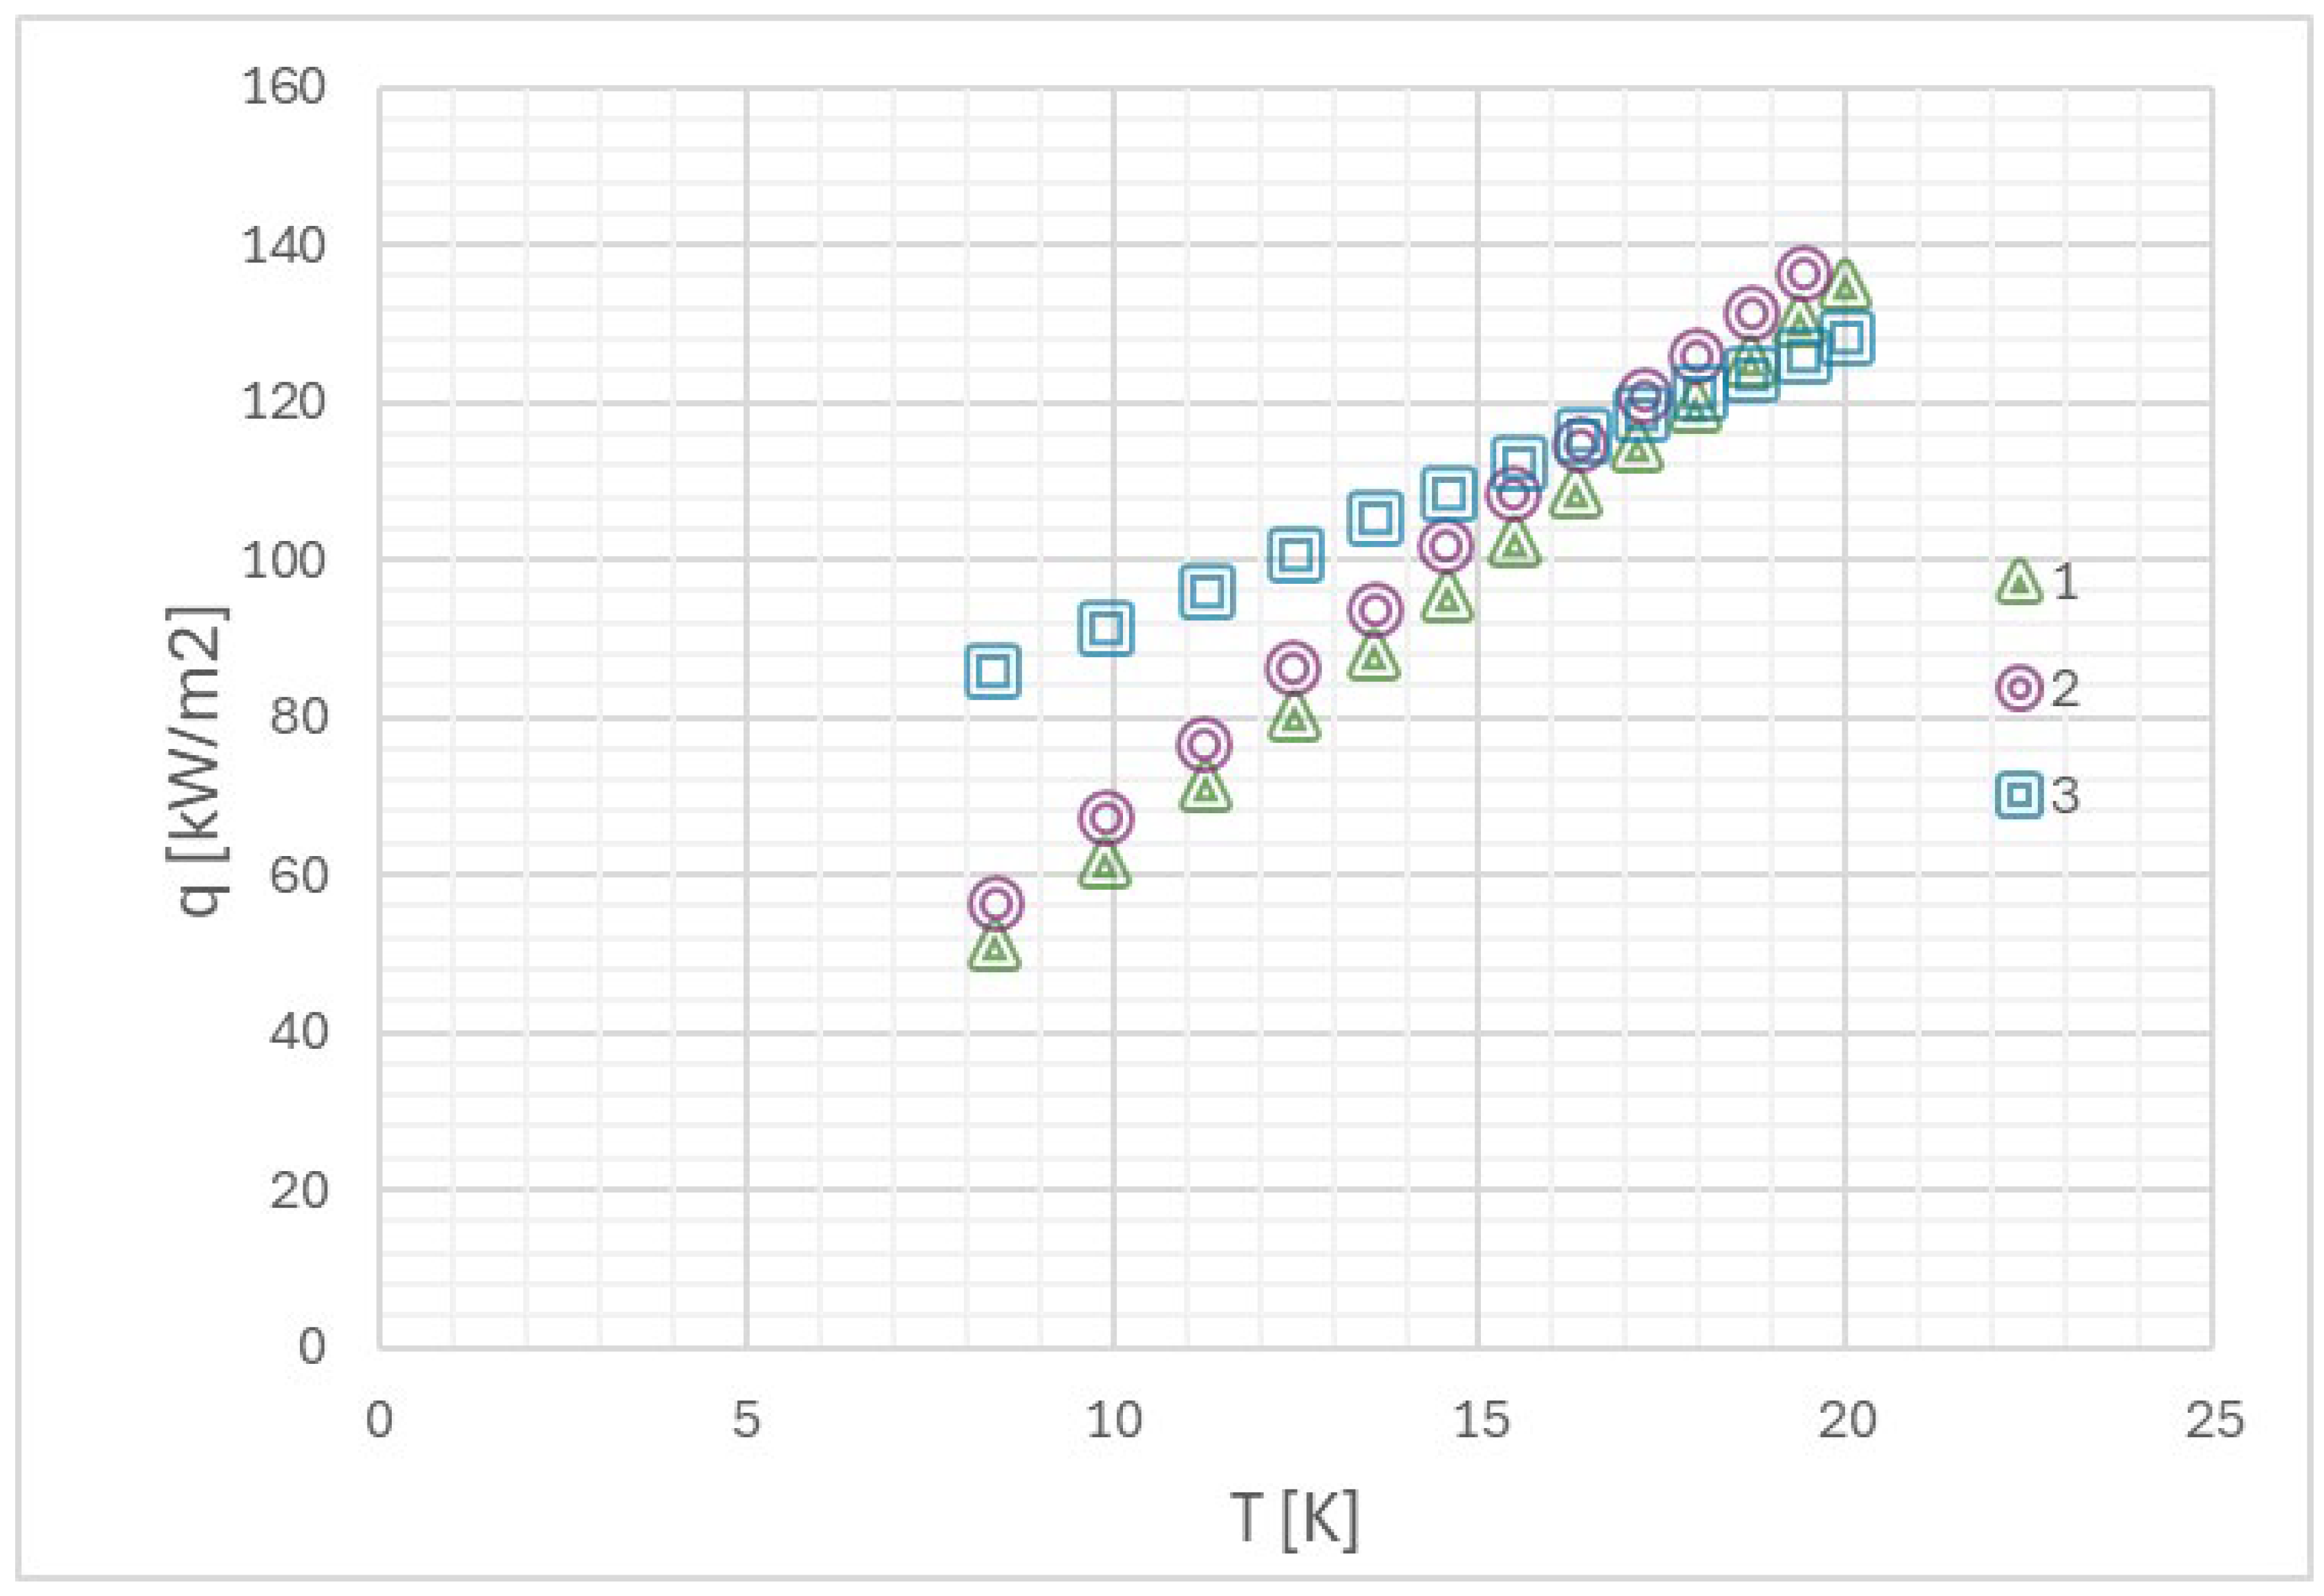
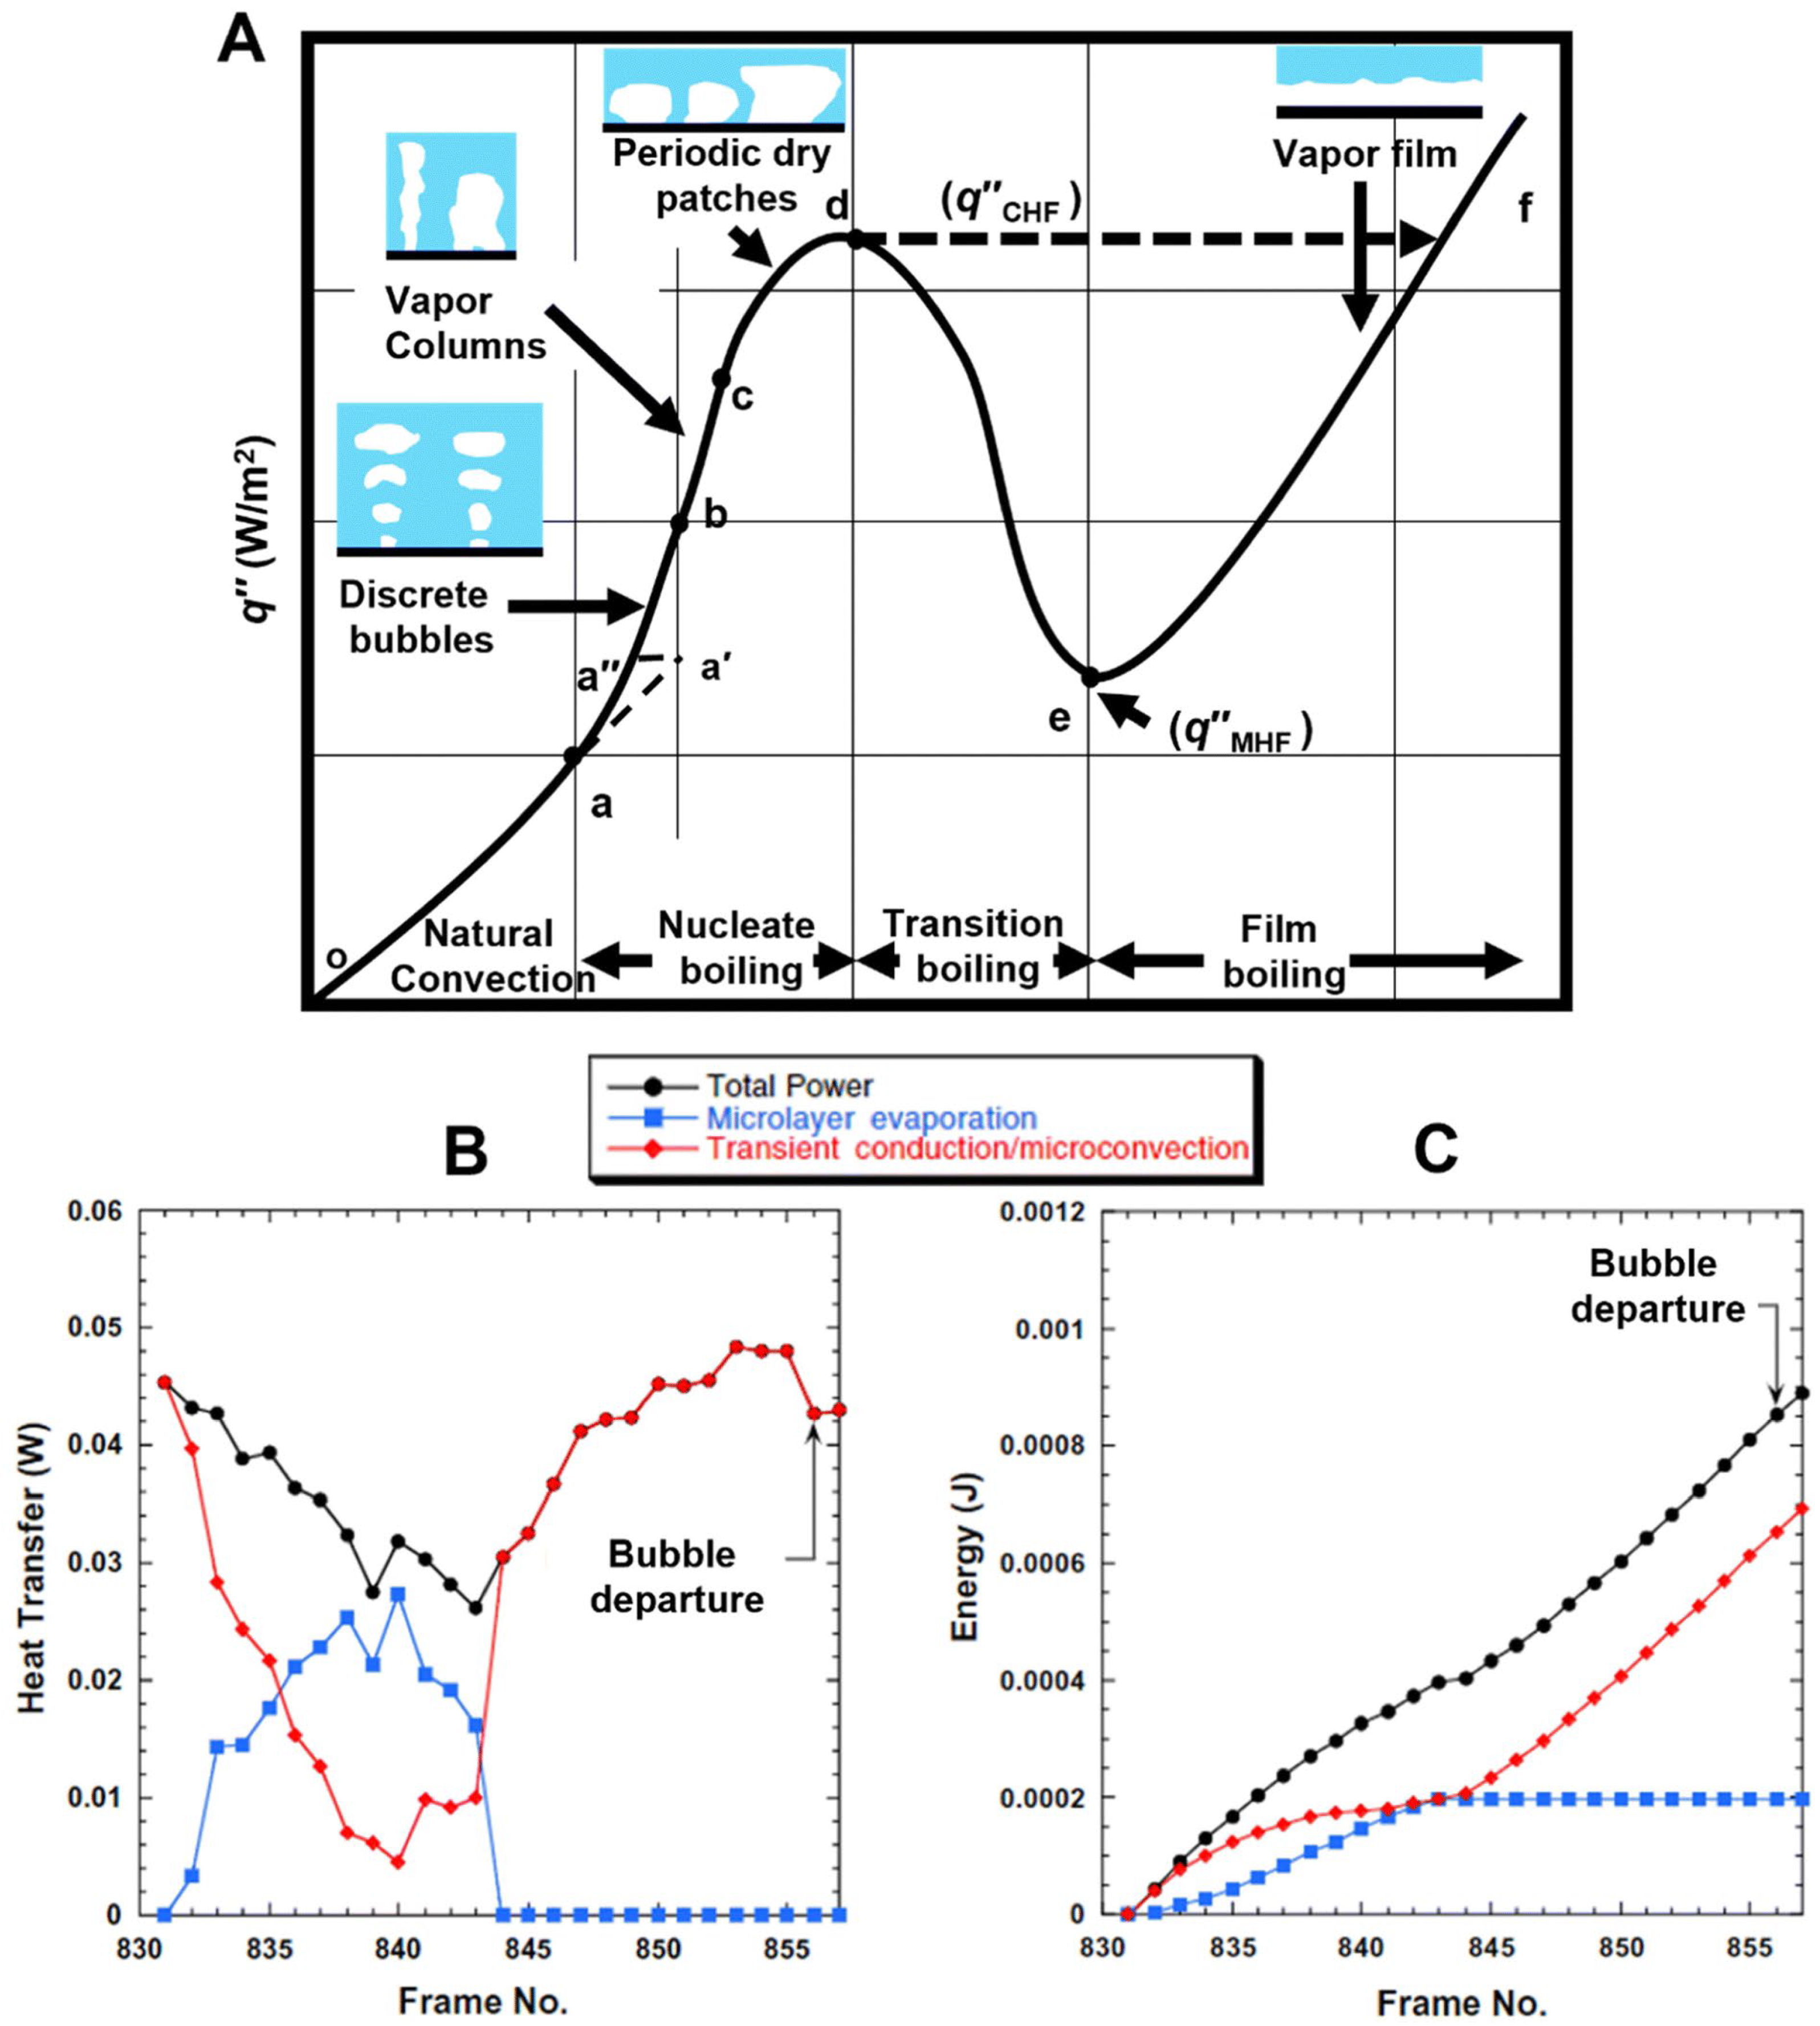

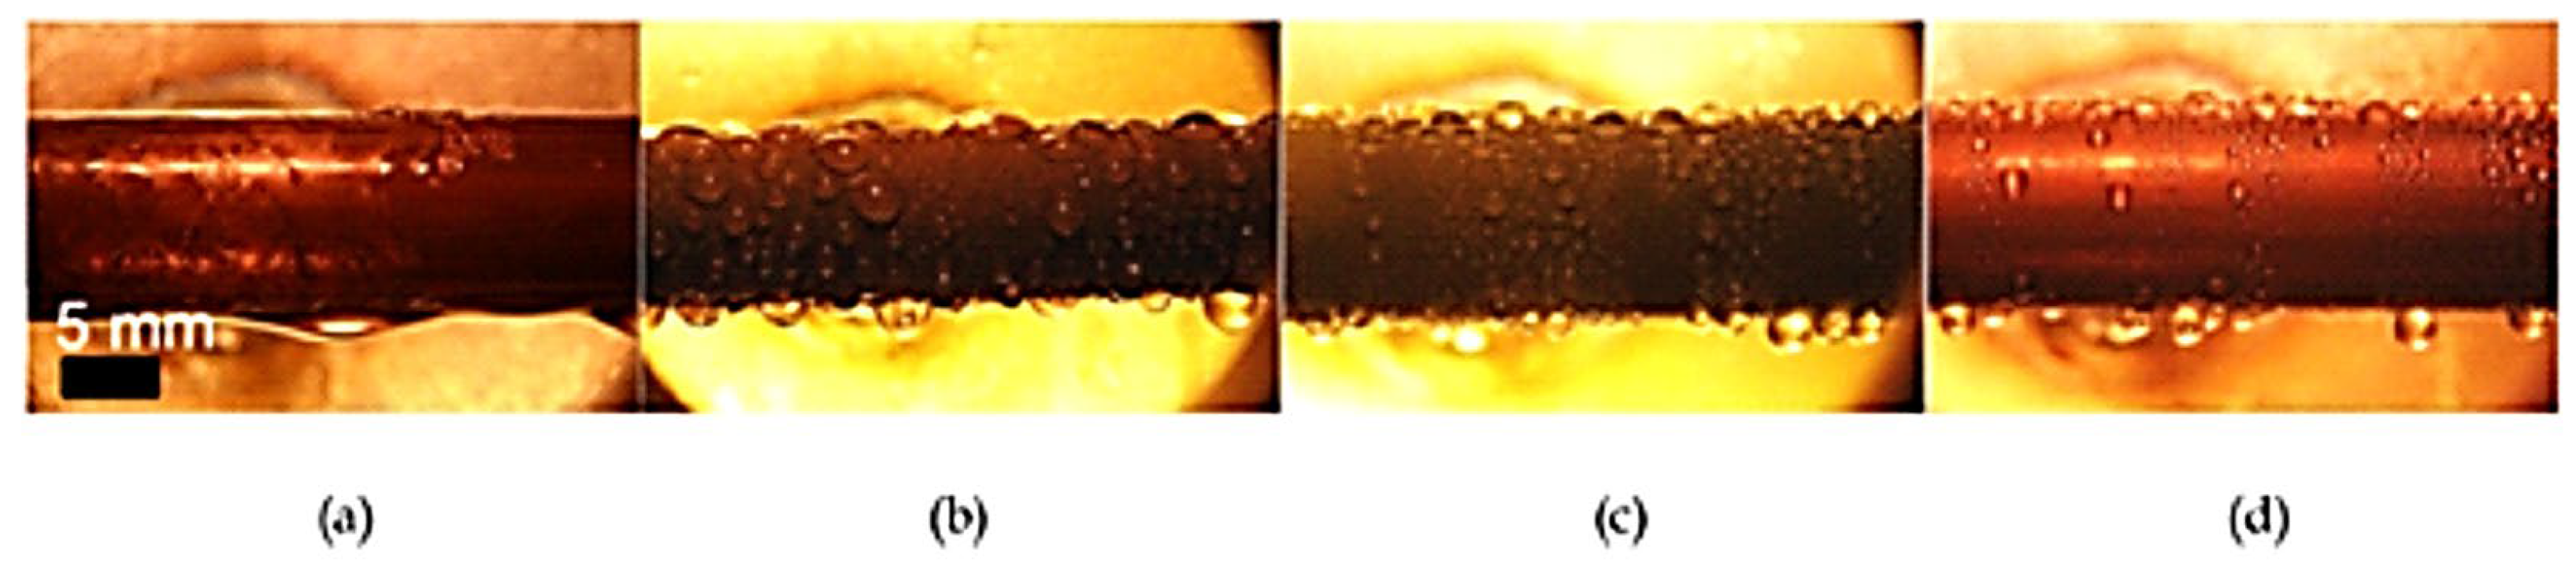

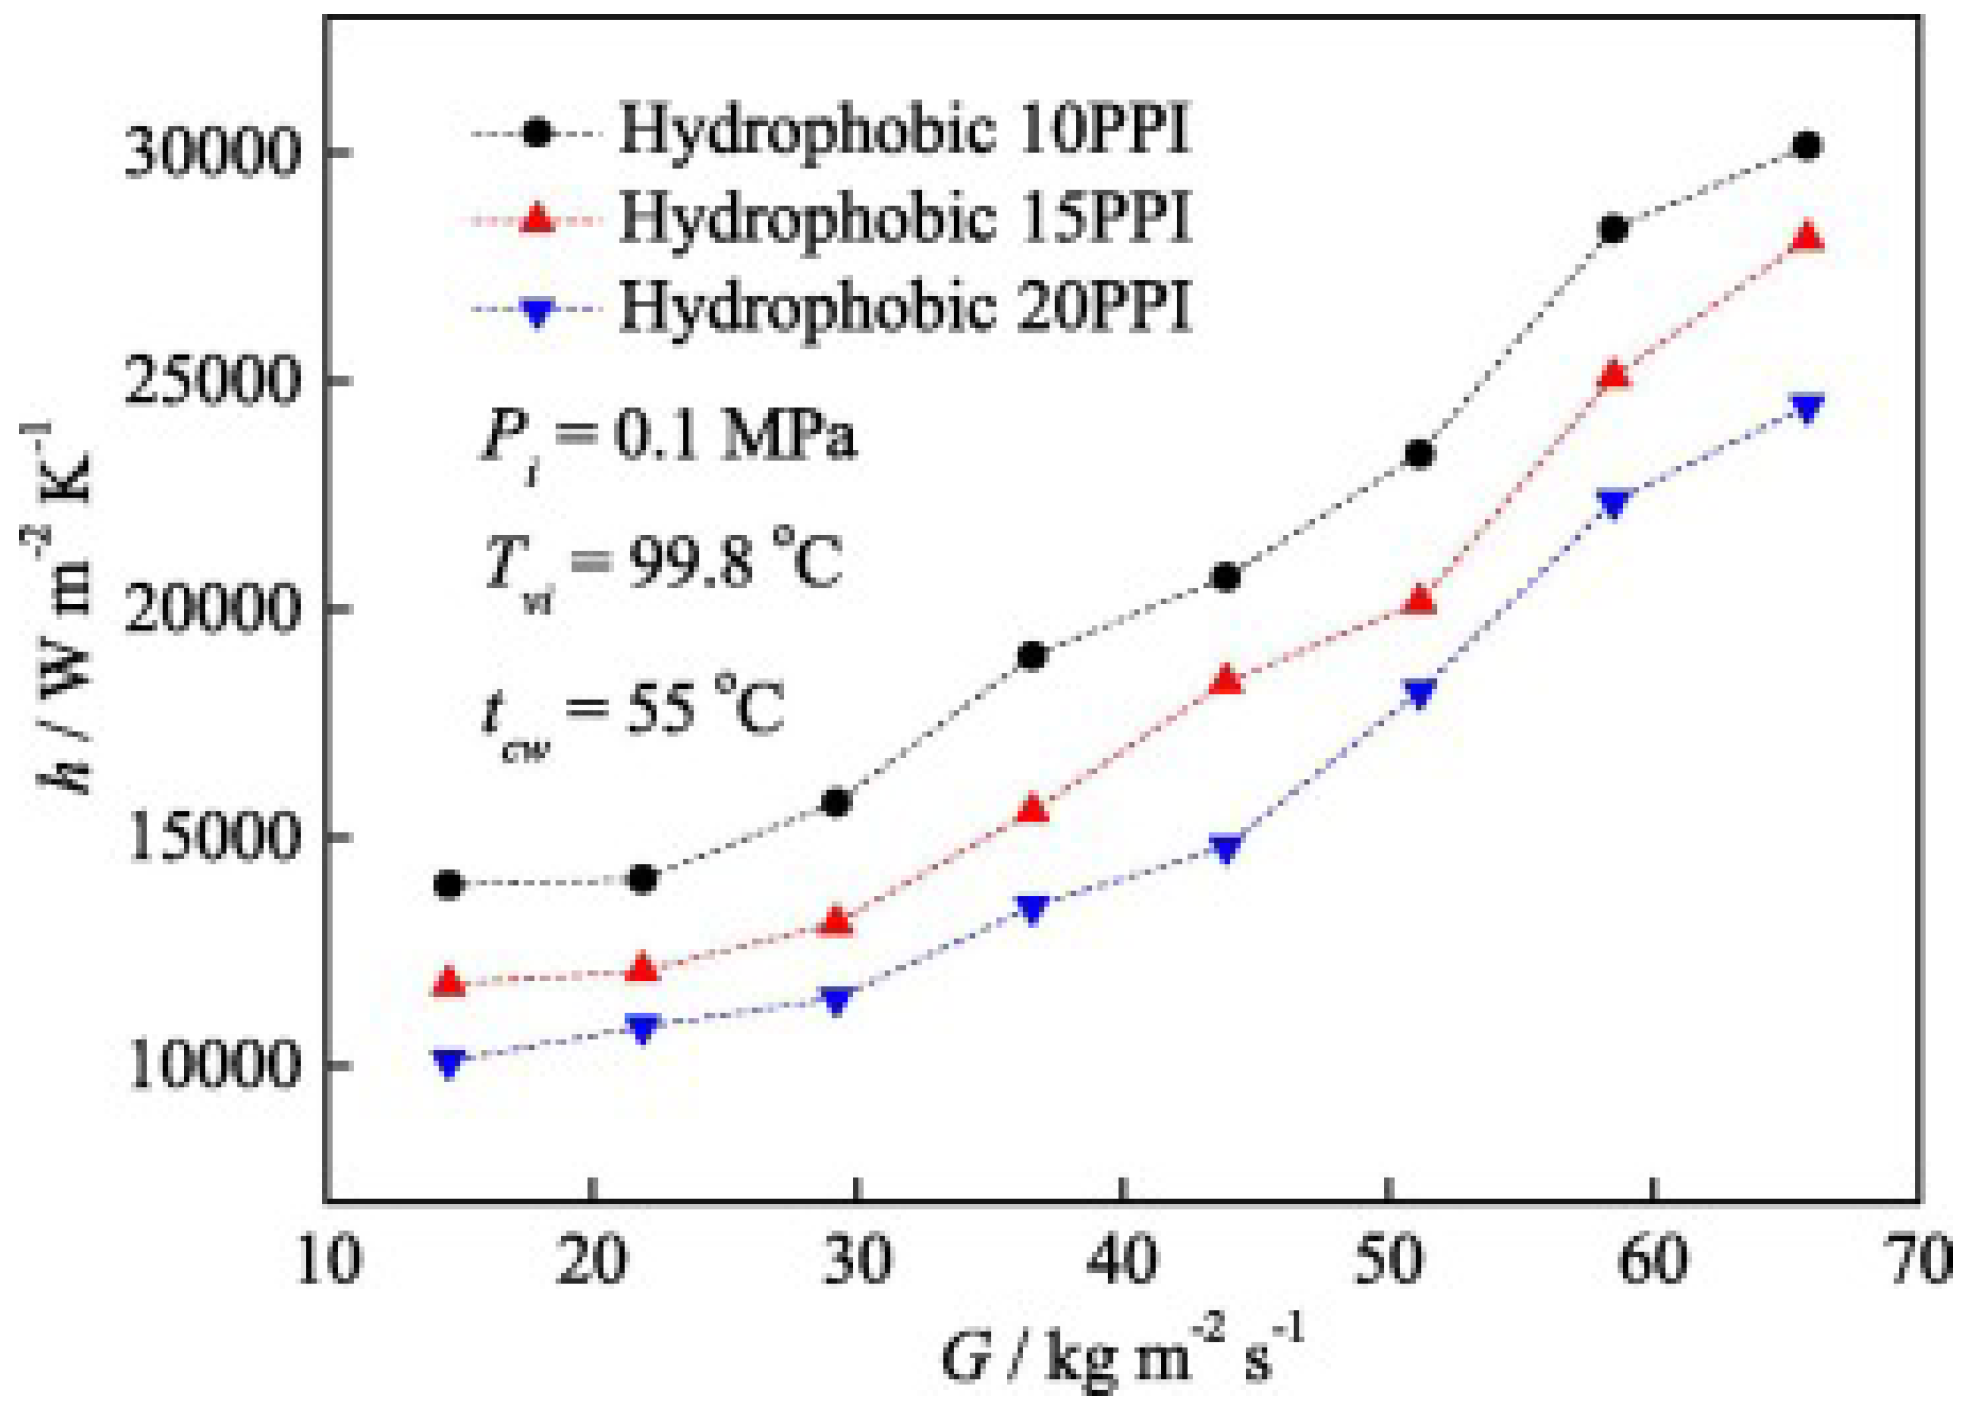
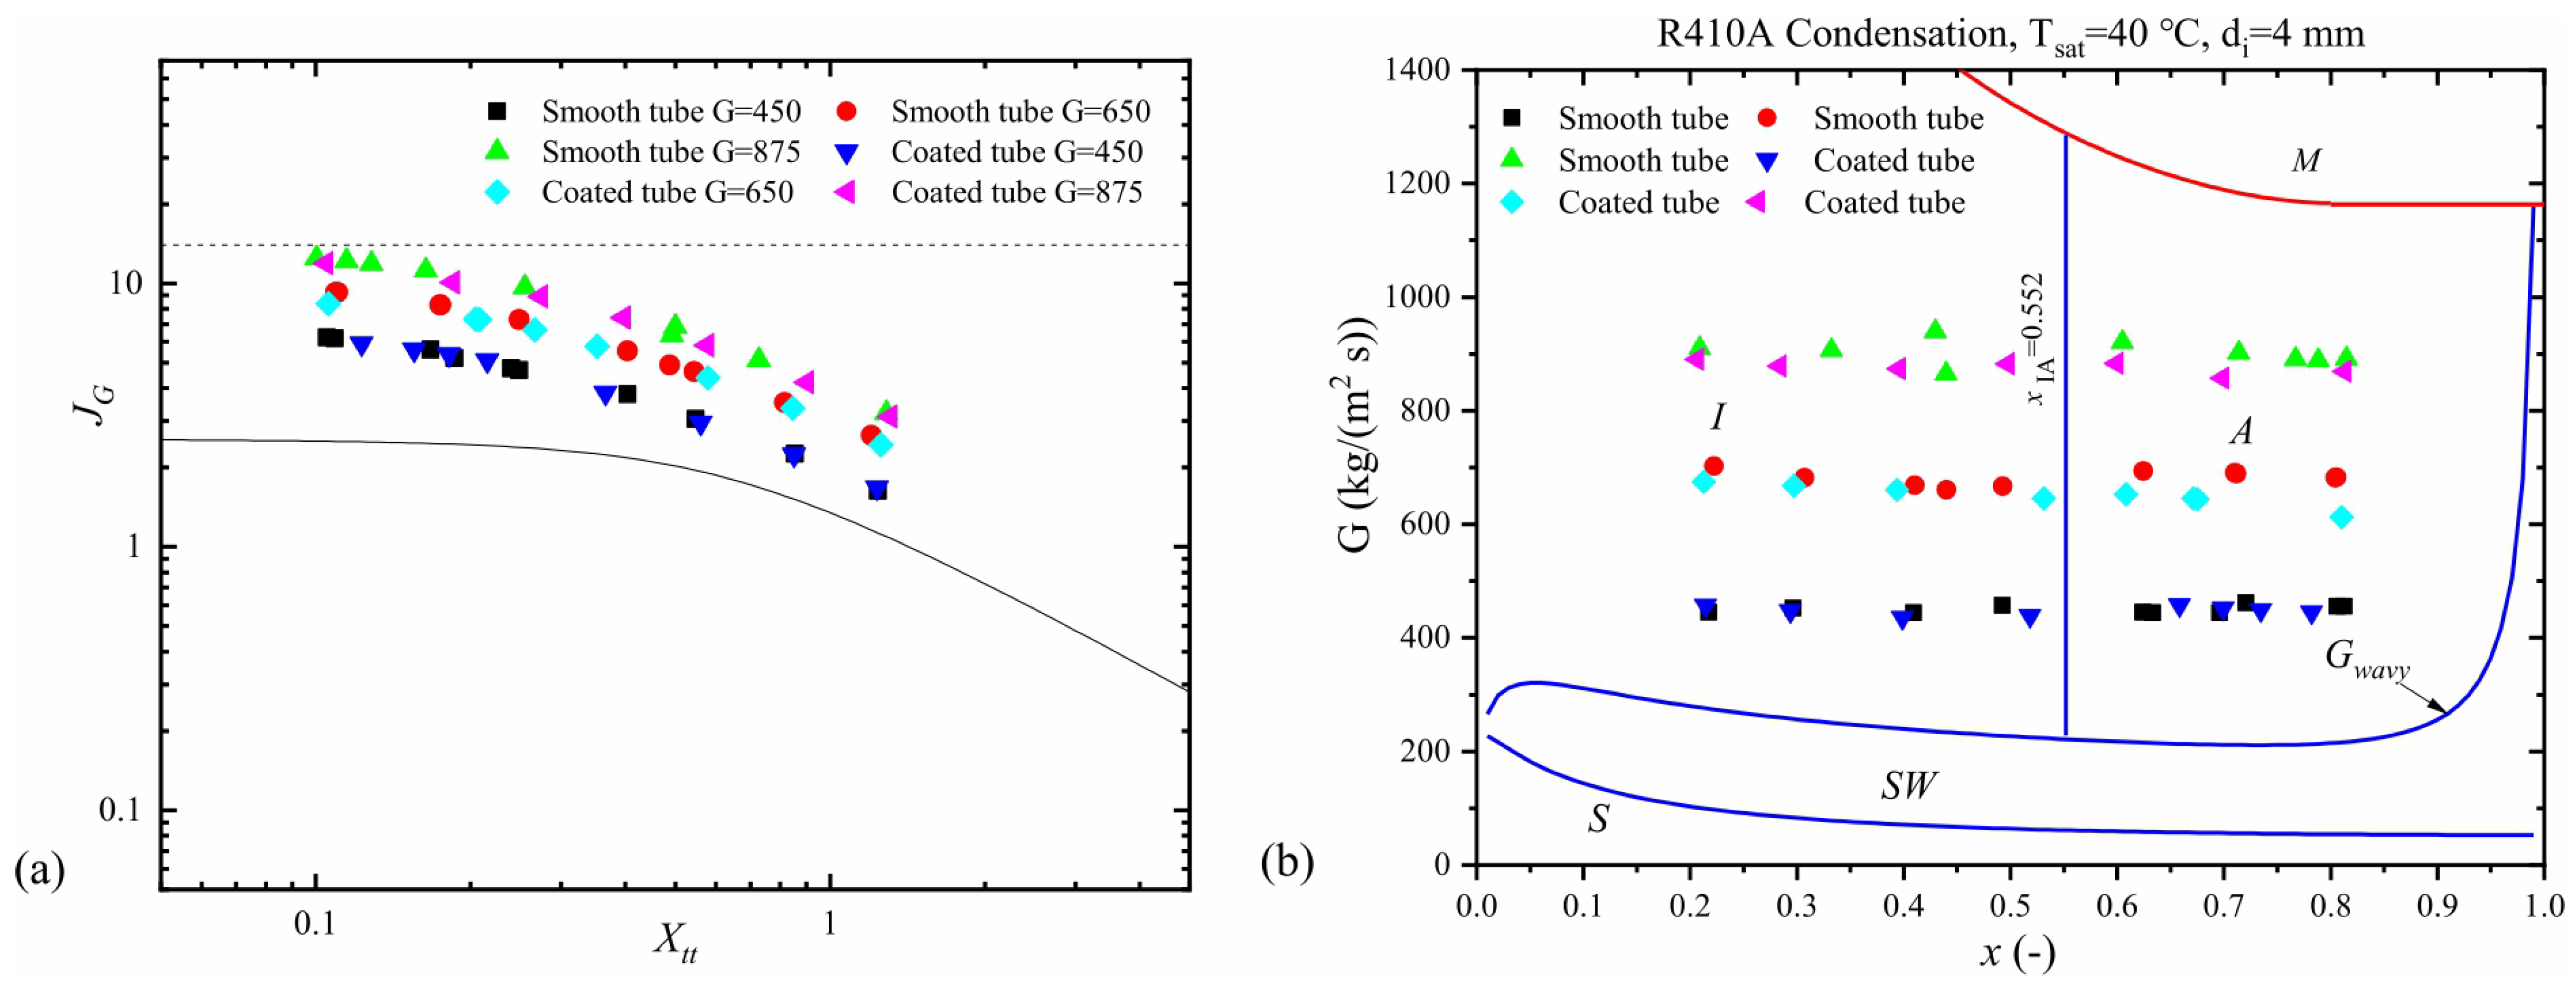
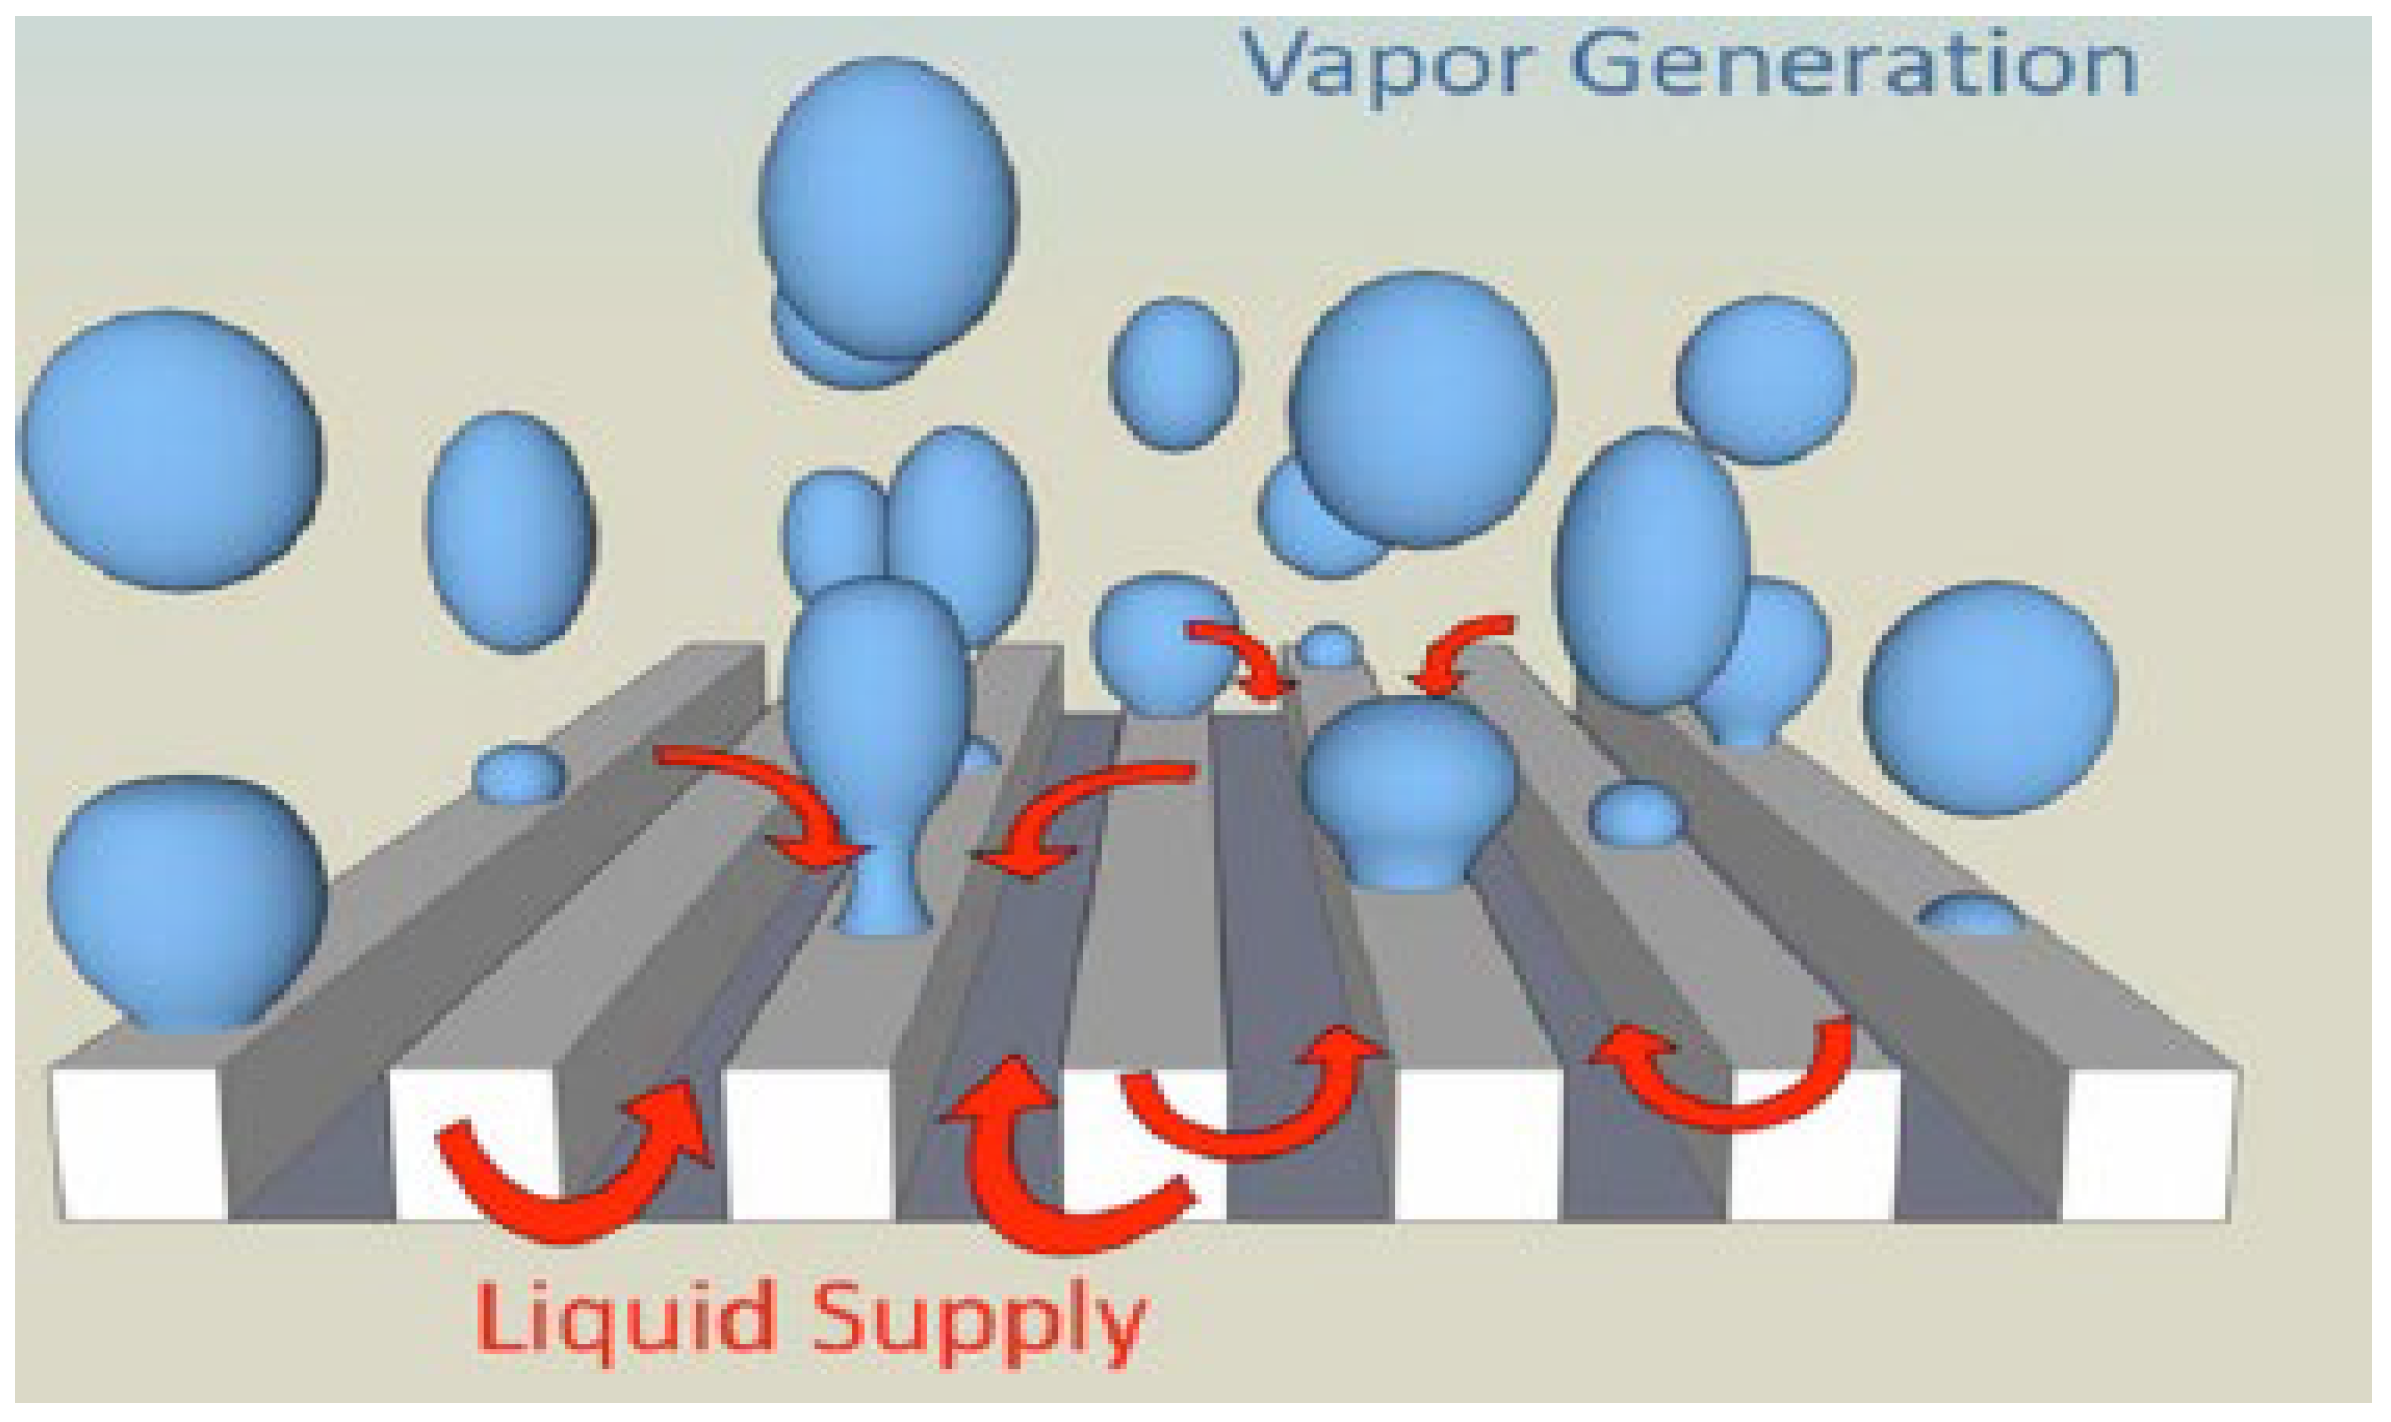
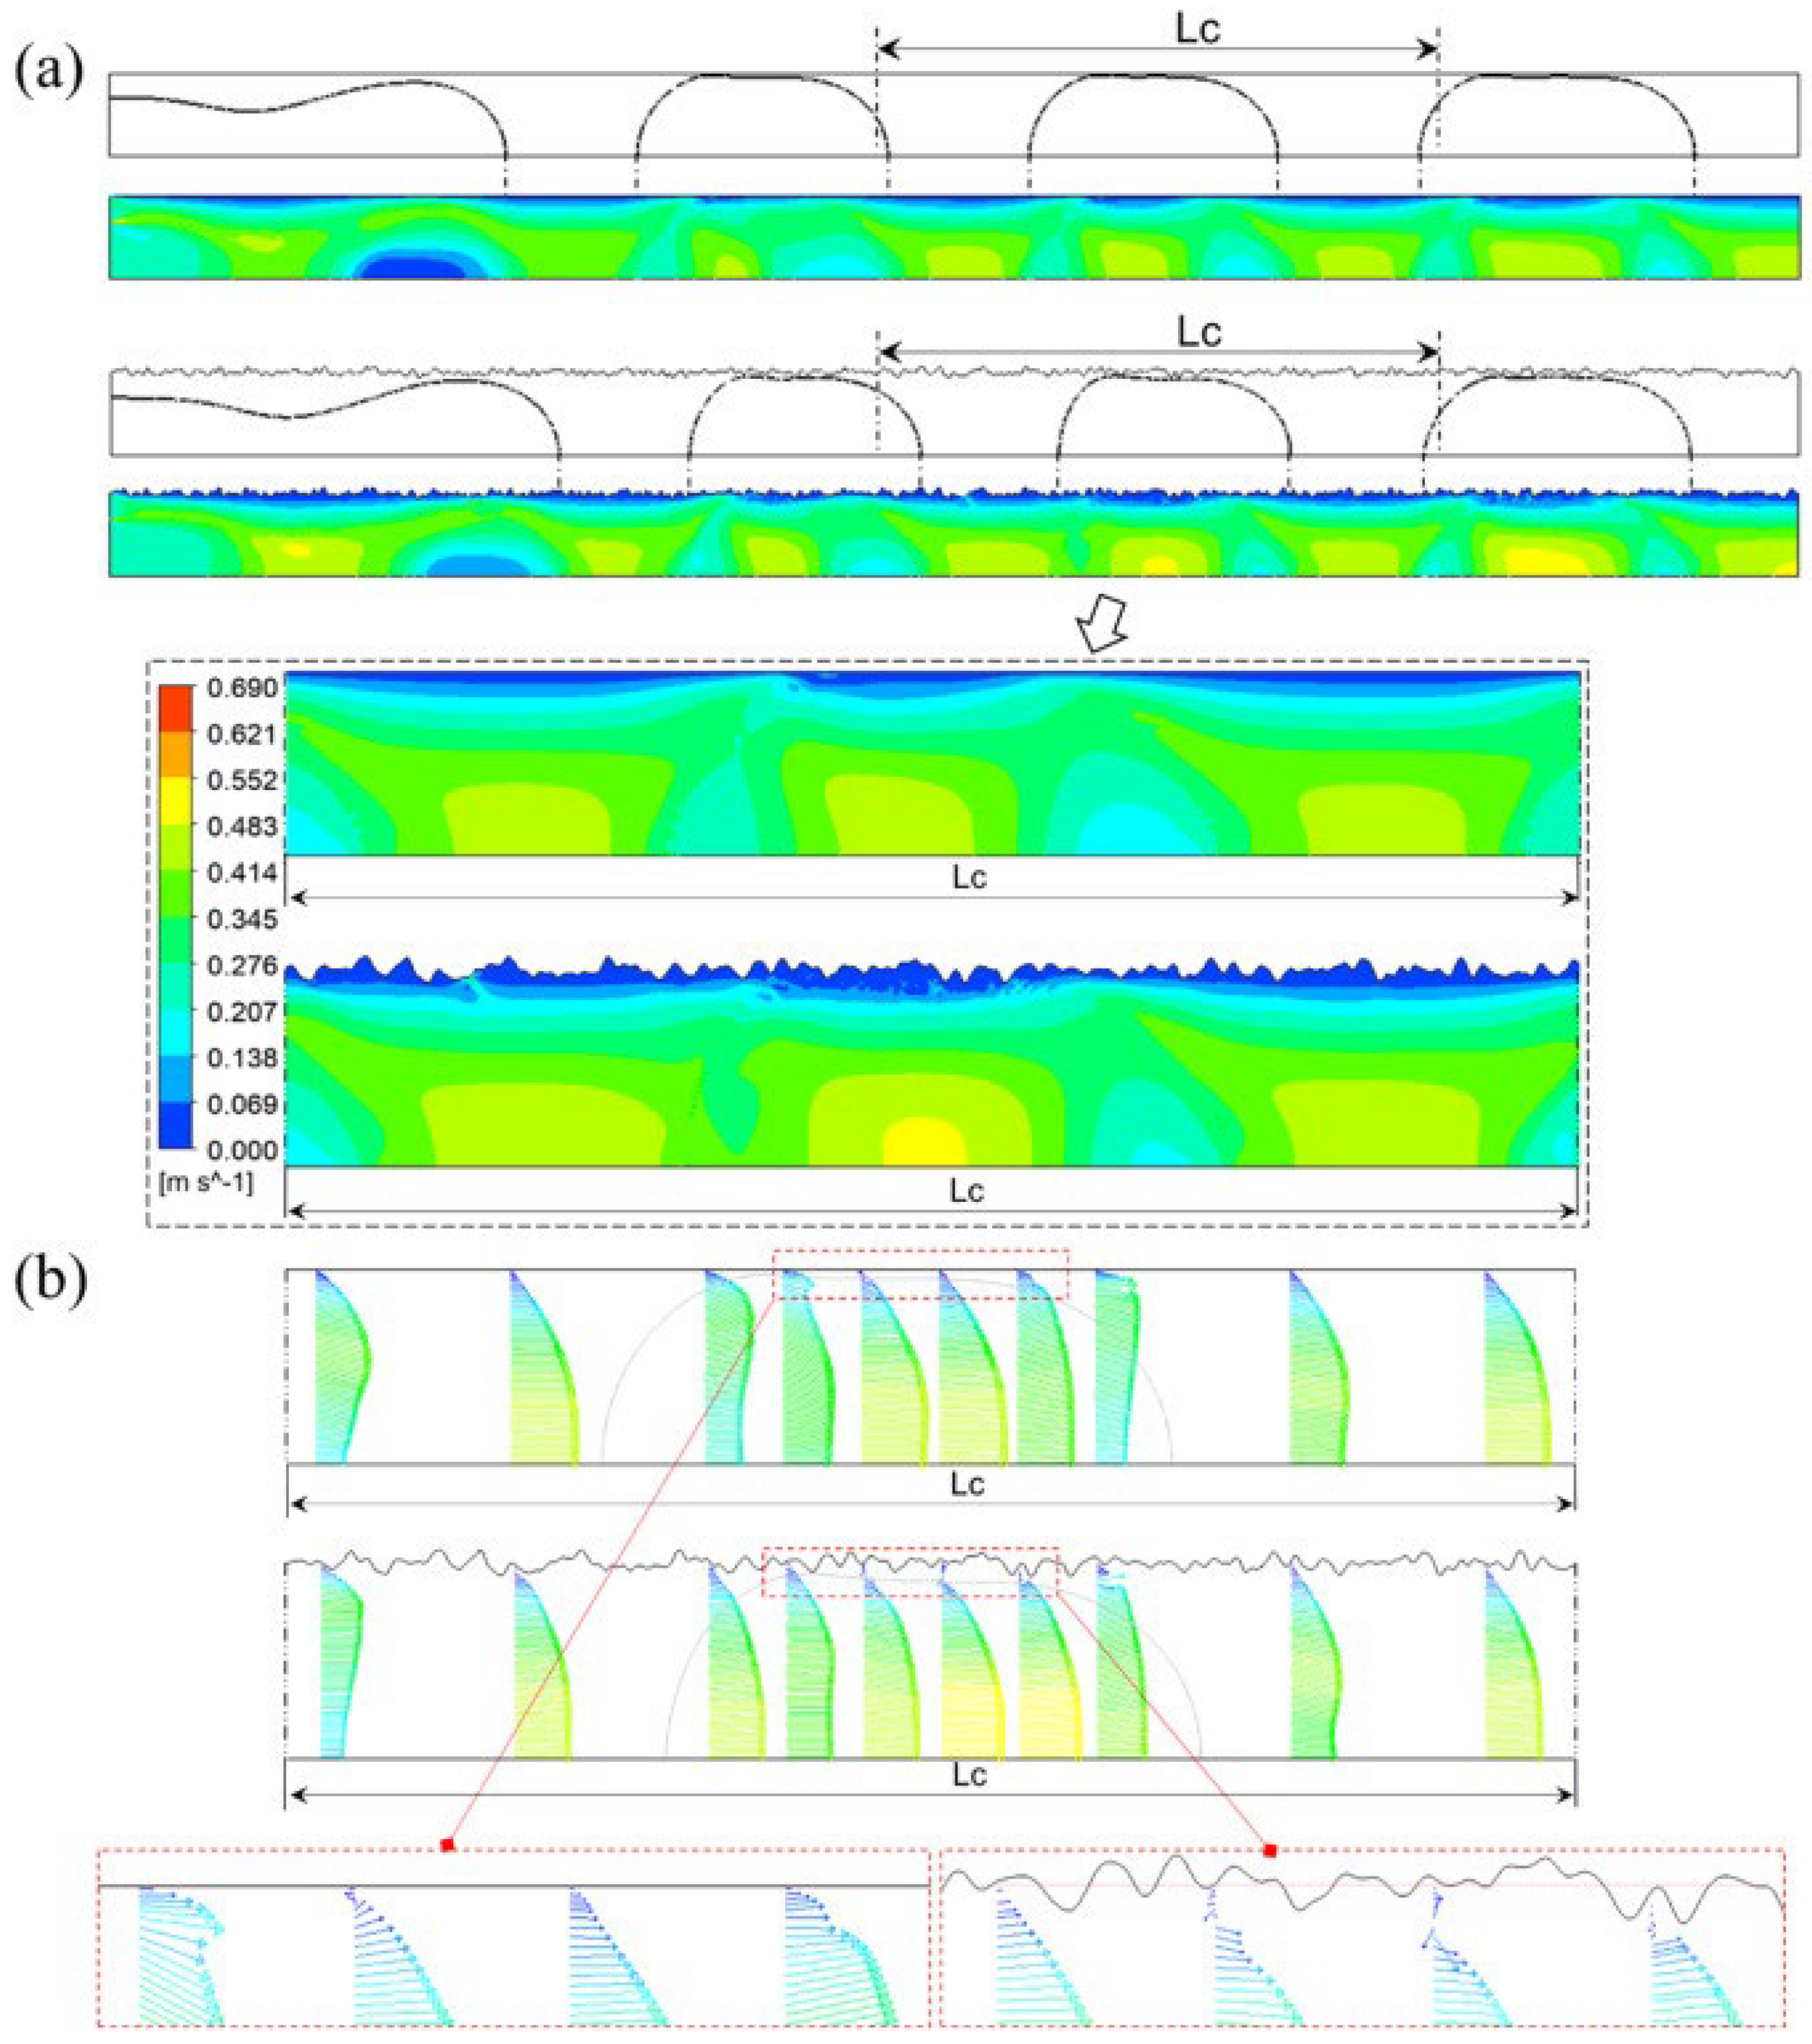
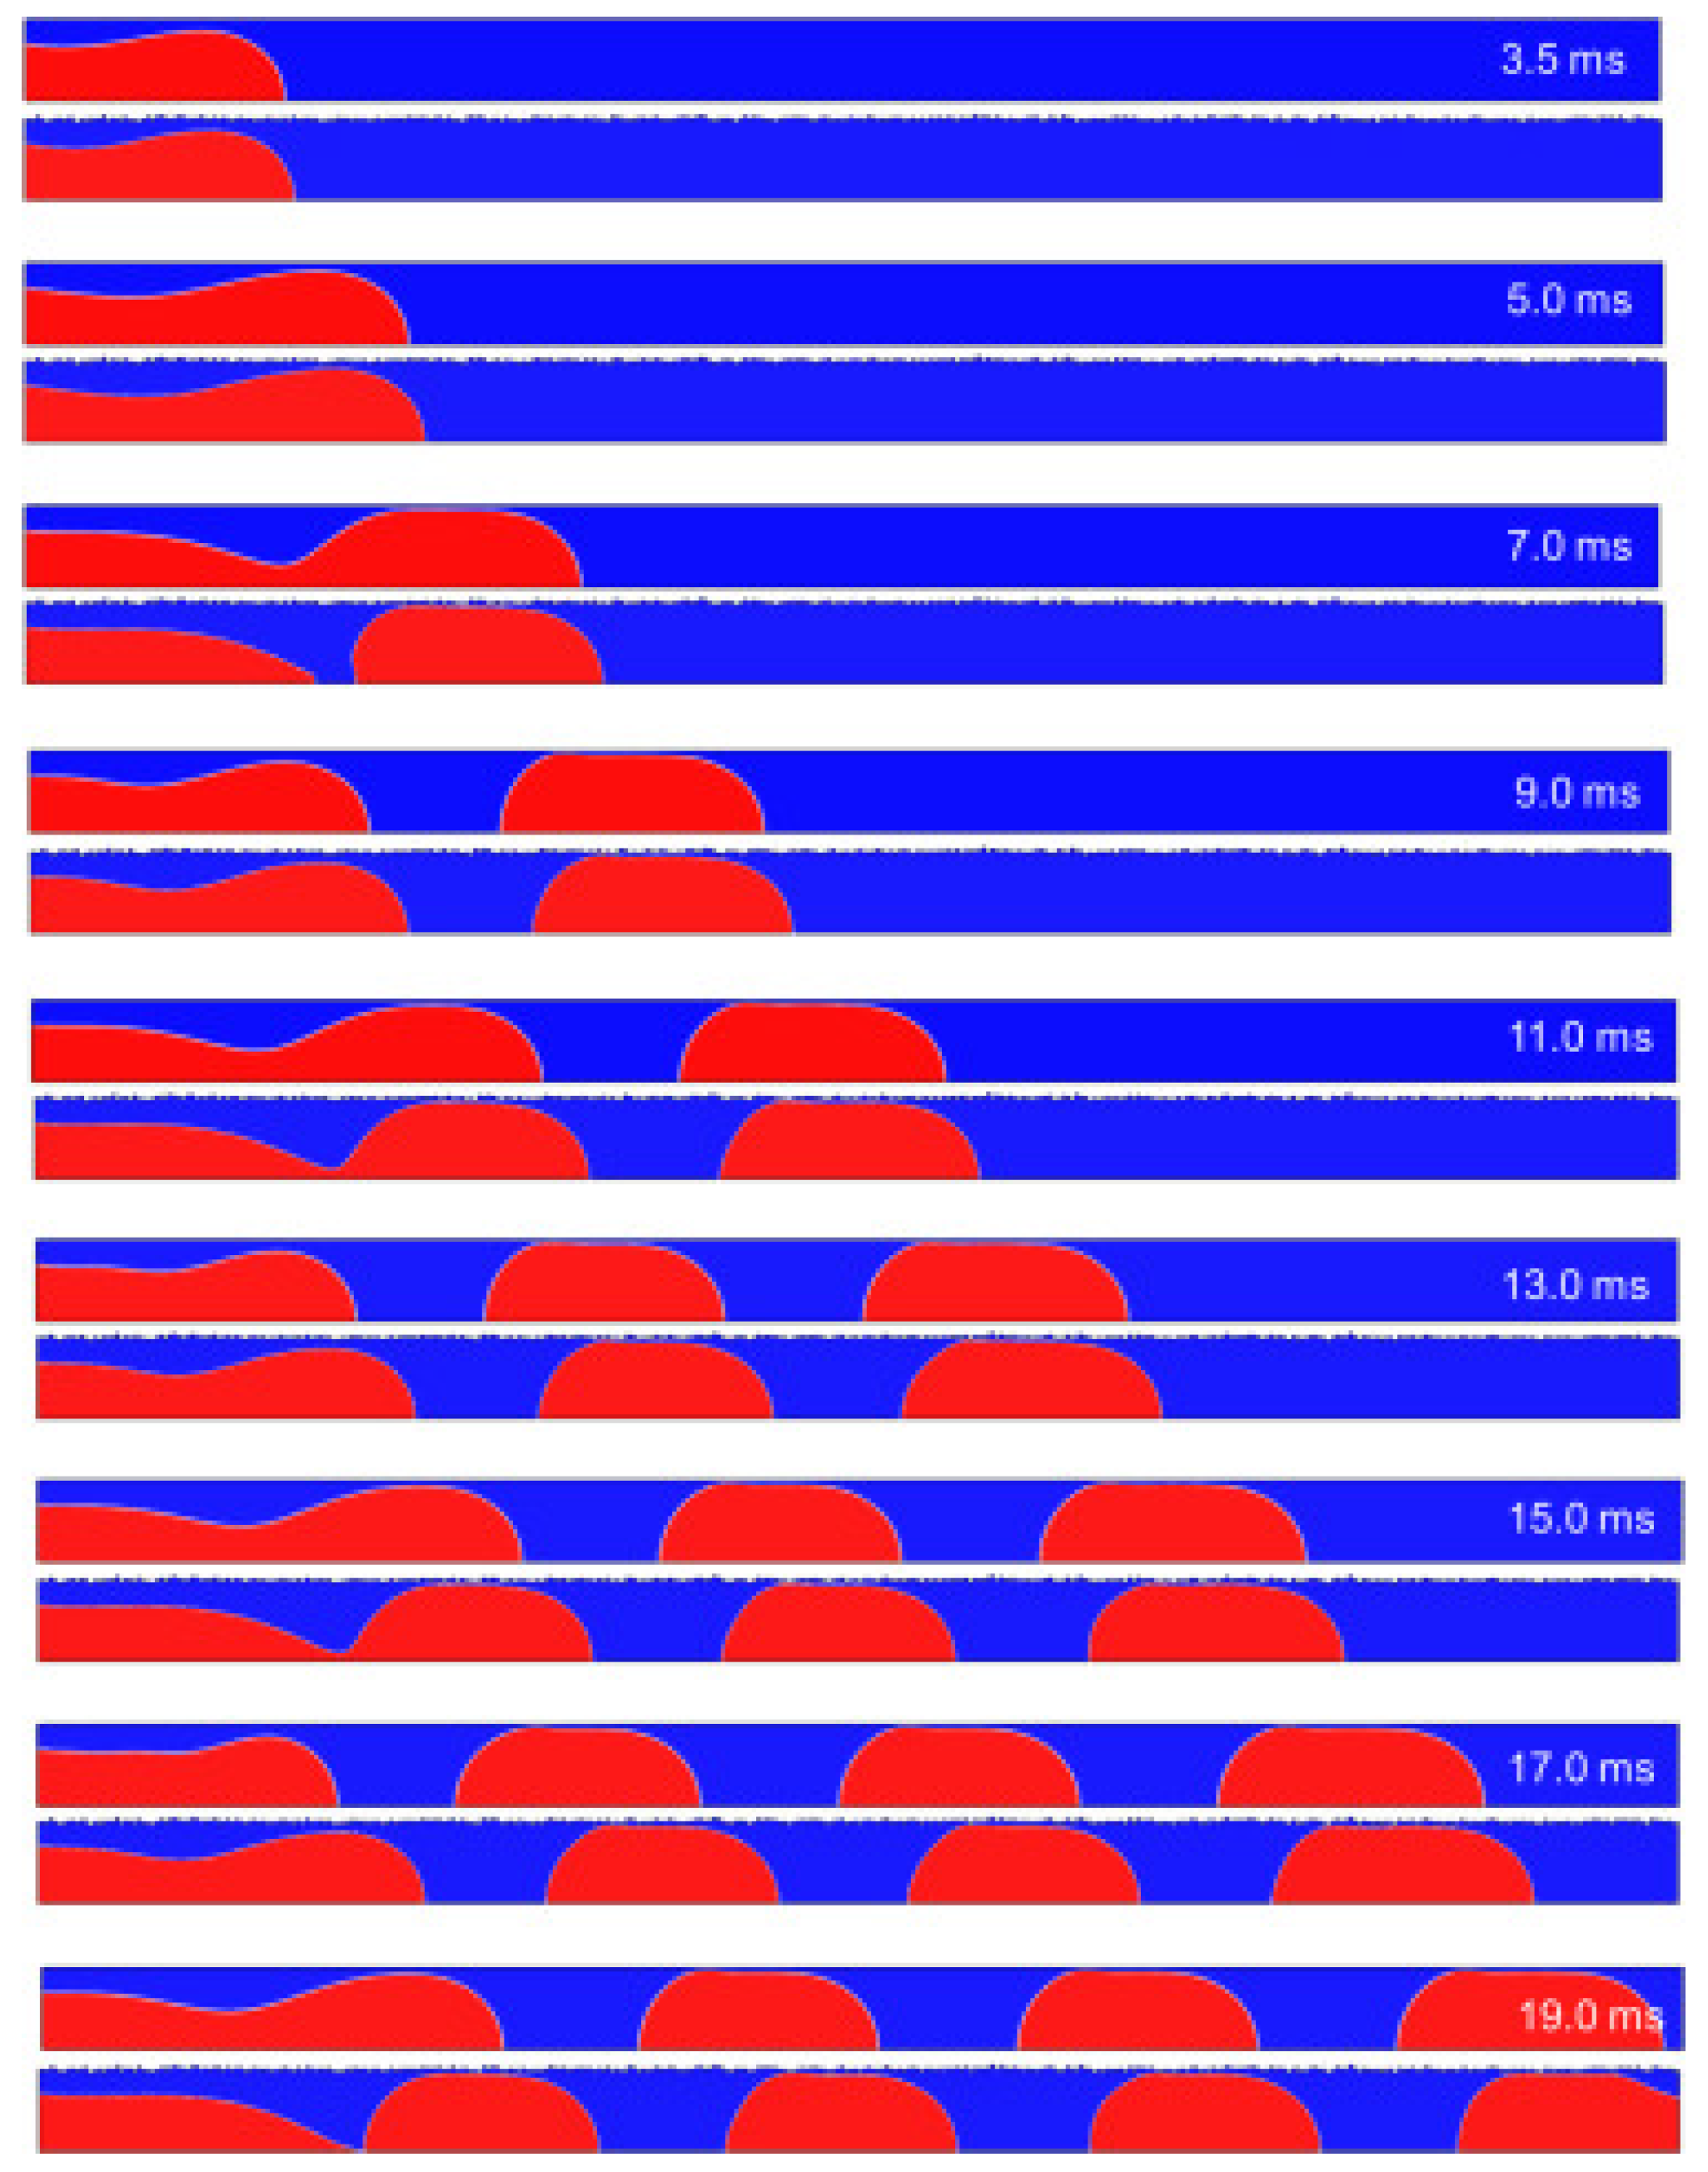
Disclaimer/Publisher’s Note: The statements, opinions and data contained in all publications are solely those of the individual author(s) and contributor(s) and not of MDPI and/or the editor(s). MDPI and/or the editor(s) disclaim responsibility for any injury to people or property resulting from any ideas, methods, instructions or products referred to in the content. |
© 2024 by the authors. Licensee MDPI, Basel, Switzerland. This article is an open access article distributed under the terms and conditions of the Creative Commons Attribution (CC BY) license (https://creativecommons.org/licenses/by/4.0/).