Article

Electricity Bill Savings from Reduced Household Energy Consumption in Apartment Complexes

by
Young Mo Chung
1,
Beom Jin Chung
2 and
Dong Sik Kim
3,*
1
Department of Electronics and Information Engineering, Hansung University, Seoul 02876, Republic of Korea
2
Research Center for Electrical and Information Technology, Seoul National University of Science & Technology, Seoul 01811, Republic of Korea
3
Department of Electronics Engineering, Hankuk University of Foreign Studies, Yongin-si 17035, Republic of Korea
*
Author to whom correspondence should be addressed.
Energies 2024, 17(21), 5488; https://doi.org/10.3390/en17215488
Submission received: 19 September 2024 / Revised: 25 October 2024 / Accepted: 31 October 2024 / Published: 2 November 2024
(This article belongs to the Special Issue Energy, Electrical and Power Engineering: 3rd Edition)

Abstract

:
Apartments account for 64.6% of all housing units in the Republic of Korea, and most of them receive electricity under a contract, which includes a progressive rate plan. Recently, due to the electrification of energy used in homes and the growing adoption of electric vehicles, electricity consumption in apartment complexes has been gradually increasing. Given the characteristics of the progressive rate system, an increase in electricity usage results in a significant higher rise in electricity bills. Thus, an effective alternative is required to reduce electricity bills for each household. In this paper, the savings in electricity bills achieved by reducing household electricity usage are analyzed from both apartment complex and individual household perspectives, using metering data from 13,332 households. When households are sorted by the amount of savings in descending order, the resulting values are found to follow a negative exponential curve. This indicates that the benefits from reducing electricity usage in households with higher saving are significantly larger compared to other ones. We analyzed bill savings when electricity usage reductions were selectively applied to the top 10%, 20%, and 30% of households with the largest savings. From the results, it is found that the largest savings in electricity bills for households are achieved when usage reductions are applied to the top 10% of households. It is expected that this amount of savings would encourage these households to reduce their electricity consumption. Additionally, it is found that the savings for apartment complexes and the total savings for selected households are not the same, resulting in changes in the bills for households that do not reduce their usage. From the results, it was observed that when the usage reduction of selected households is small or the proportion of households reducing usage is low, the common area charges for non-reducing households tend to increase, leading to higher electricity bills. On the contrary, when the usage reduction of selected households is large or the proportion of households reducing usage is high, the common area charges for non-reducing households tend to decrease, resulting in lower electricity bills.

1. Introduction

Electricity rate systems for residential use are broadly divided into progressive rate plans and time-of-use (TOU) rate plans [1,2]. In the progressive rate plan, which is a flat rate plan, the usage rate changes according to the usage. On the other hand, in the TOU rate plan, the usage rate changes according to time. In the early 2000s, most electric power companies around the world adopted progressive rate plans for residential electricity. Starting in North America in 2010, with the spread of smart meters and advanced metering infrastructure (AMI) featuring two-way communication systems [3,4,5], the number of electric power companies adopting residential TOU rate plans has been increasing [6,7,8]. However, from the perspective of electricity consumers, there is a strong preference for rate plans that allow them to pay lower electricity bills, while power companies prefer rate plans that clearly show the effects of demand management without reducing electricity sales’ revenue due to the expansion of power facilities and other factors. Given the large difference between the perspectives of electricity consumers, who choose a rate plan, and power companies, which must consider changes in revenue and grid operation effects due to the introduction of TOU rate plans, many power companies still adopt progressive rate plans for residential customers.
In the Republic of Korea, apartments, which are densely packed housing units and one of the most common housing types, account for 64.6% of all housing units according to 2023 statistics [9]. Therefore, observing and analyzing the electrical energy consumption of apartment environments is important for efficient electric energy consumption in the Republic of Korea. For an apartment complex, which consists of multiple apartment buildings, high-voltage (HV) electrical energy of 22.9 kV is supplied based on a contract between the electricity supplier and the apartment management office, instead of individual contracts between the supplier and each household with low-voltage (LV) electricity of 220 V. In apartment complexes, distribution transformers are installed above or below ground to convert HV electricity to LV electricity of 220 V and supply it to the apartment households and common areas, such as elevators, clubhouses, and parking lots. The block diagram of the electrical supply for an apartment complex is presented in Figure 1. Note that the power supply facilities including the distribution transformers in the apartment complexes and the meters for each household are installed and managed by the apartment residents through the apartment management office. Subsequently, the residential electricity rate of apartment complexes receiving HV electrical energy is generally lower than the residential LV electricity rate [10].
Between the electricity supplier and the apartment complex, there are two types of contracts: the single contract (SC) and general contract (GC) [1,11]. Under the SC, the electricity supplier treats the entire apartment complex as a single HV customer, measures the total electricity usage of the complex, and charges the households in the complex a single bill for electricity based on a progressive rate [1]. On the other hand, under the GC, the residential LV electricity rate plan is applied to each household, and the generic HV electricity rate is separately applied to the common areas. Each apartment complex can freely choose an appropriate contract type between the SC and GC in the Republic of Korea. Kim et al. [1] calculated and compared the electricity bills to determine the more advantageous contract based on the amount of total electrical energy consumption and the ratio of electrical energy between the households and common areas. There has been a growing trend of apartment complexes choosing the more advantageous SC over the GC.
Recently, due to the electrification of energy used in homes and the growing adoption of electric vehicles in the transportation sector, electricity consumption in apartment complexes has been gradually increasing [12,13]. Given the characteristics of the progressive rate system, an increase in electricity consumption results in a significantly higher rise in electricity bills. Therefore, an effective alternative is required to reduce electricity bills for each household.
Previous studies on electricity bill savings have mainly been conducted from demographic and socioeconomic perspectives. These include studies on the effectiveness of policy and institutional implementation, rate predictions based on quantitative metering data, and effectiveness analysis [14,15,16,17]. It was observed that income level, living space, and number of household members had a significant impact on electricity bills [8]. Shu et al. [18] conducted a survey on factors affecting electricity-saving behavior in the residential areas of large cities in China. They analyzed income and regional impacts, as well as the price sensitivity of electricity rate increases, and suggested the need for a policy to establish a stratified electricity rate system based on income level.
On the other hand, Sun et al. [19] stated that it is necessary to introduce incentive systems to increase the potential of electricity savings by analyzing the types and patterns of the electricity consumption of residents. Chung et al. [2] employed various prediction methods, such as the support vector machine, linear regression, and deep neural network, to predict the electricity bill savings that can be achieved by switching from current rate contracts to TOU rate plans. Chung et al. [20] analyzed the effects of changes in home appliance usage times on household electricity usage patterns and electricity bill savings under a TOU rate system. Yu et al. [21] conducted an optimization study to avoid peak power consumption and reduce electricity bills by efficiently using time-shifting home appliances.
The SC employs a progressive system. Therefore, to determine the savings on the electricity bill resulting from a reduction in household electricity usage, it is necessary to know the household’s monthly electricity consumption. Additionally, in apartment complexes, each household’s electricity bill includes a shared charge for common area electricity usage. It is also clear that electricity bill savings can be changed depending on the electricity pricing systems and the electric usage statistics. Consequently, the relationship between a reduction in a household’s electricity usage and the resulting saving on the bill is quite complex.
In this paper, we selected the SC and investigated the electricity bills for households in apartment complexes using electricity metering data, analyzing the relationship between a household electricity usage reduction and savings on electricity bills. Additionally, we analyzed the potential savings on electricity bills by reducing electricity usage, both from the perspective of complexes and individual households to suggest effective ways to lower these bills. The metering data were collected over 24 months from 13,332 households in 31 apartment complexes. Using the collected metering data and the current electricity pricing systems as of August 2024, we investigated the electricity bills for each complex and household under the SC. We also compared the effects of reducing electricity usage for all households in an apartment complex versus reducing electricity usage in selected households. This study identified households in apartment complexes that could achieve the largest savings on their electricity bills through reductions in electricity usage. Furthermore, we assessed the impact on bills for non-reducing households resulting from the usage reductions achieved by selected households in apartment complexes. The purpose of our study was to find the households in apartment complexes that achieve the highest savings on electricity bills by reducing their electricity consumption and to provide them with estimated amounts to encourage further energy savings. Given that there have been six increases in residential electricity rates in Korea since July 2019 [22], interest in saving on electricity bills is likely to grow. This study analyzed electricity savings through reduced consumption from the perspective of consumers in apartment complexes, rather than exploring the relationship between electricity consumption and electricity rate systems from the perspective of suppliers.
This paper is organized in the following way. In Section 2, we introduce the electricity rate plan employed in the apartment complexes and present the results of electricity bills for households. In Section 3, we discuss the bill savings achieved by reducing electricity usage for all households and selected households in the complexes. Additionally, we investigate households that achieve the most significant savings through a usage reduction. Section 4 discusses the impact of a usage reduction on the bills of both reducing and non-reducing households. Finally, the conclusion is presented in the last section.

2. Electricity Bills of Households in Apartment Complexes

The electricity bills for households of an apartment complex in the Republic of Korean vary depending on the electricity billing contract that the apartment complex has with the electricity supplier, the Korea Electric Power Corporation (KEPCO). There are two types of contracts: the SC and the GC [11]. Most apartment complexes choose the SC option because it typically results in lower electricity bills [1].

2.1. Bills by the Single Contract (SC)

In the SC, a household’s electricity bill is calculated based on the total energy consumption of the apartment complex. In an apartment complex, energy is consumed not only with the home appliances of households but also with the electrical equipment of common areas, such as elevators, lighting, and hydrant pumps.
First, average electricity usage per household W ¯ is computed by dividing the total energy consumption (including both households and common areas) of the apartment complex by the number of households as
W ¯ = W T / N ,
where W T is the total energy usage of the complex per month and N is the number of households of the complex. Then, an average charge of households is determined by applying residential HV rates [11] to the average electricity usage.
Residential HV rates also use a progressive rate system similar to residential LV rates, which is applied in the GC [11]. However, the base rates and usage rates are lower than those of residential LV rates. When the amount of electricity usage for a month is w, the monthly charge h of the residential HV rate plan is given as
h ( w ) : = B 1 + w R 1 , 0 w S 1 B 2 + S 1 R 1 + ( w S 1 ) R 2 , S 1 < w S 2 B 3 + S 1 R 1 + ( S 2 S 1 ) R 2 + ( w S 2 ) R 3 , w > S 2 ,
where B 1 , B 2 , and B 3 refer to the base rates for each stage of the three-tier progressive rate system, and R 1 , R 2 , and R 3 represent the usage rates for each stage of the residential HV plan. The values for progressive tiers, S 1 and S 2 , are set at 200 kWh and 400 kWh, respectively. During the summer months (July and August), S 1 and S 2 are increased to 300 kWh and 450 kWh, respectively. As of August 2024, the base rates and usage rates applied to the SC are shown in Table 1, where USD stands for the U.S. dollar. For reference, the corresponding values in KRW are indicated in parentheses, where KRW stands for the Korean won. USD 1 corresponds to KRW 1354.5 as of August 2024.
With the SC, the electricity bill for an apartment complex, defined as B C , is calculated from
B C = h ( W ¯ ) · N .
The apartment management office pays this bill to KEPCO for the electricity usage of an apartment complex and then charges each household for electricity usage, combining the household usage with the common area’s electricity usage. The bill for the complex B C is used to calculate the common area usage charge. When the kth household’s usage is w k , the charge for the usage c k is given by c k = h ( w k ) . Then, the total charge for household usage of the complex, denoted as C H , is given by
C H : = k = 1 N c k .
The charge for the common area usage of the complex, C P , is given as
C P : = B C C H .
Each household shares the electricity charge for the common area. It is assumed that each household shares the common area electricity charge equally. The common area electricity charge that each household should share is z = C P / N . Thus, the monthly electricity bill for the kth household of the complex is calculated by
b k = c k + z .
It is clear that the total sum of the electricity bills imposed on each household b k ,   k = 1 , , N , is equal to the electricity bill for the complex B C .

2.2. Apartment Complexes Used for the Electricity Bill Analysis

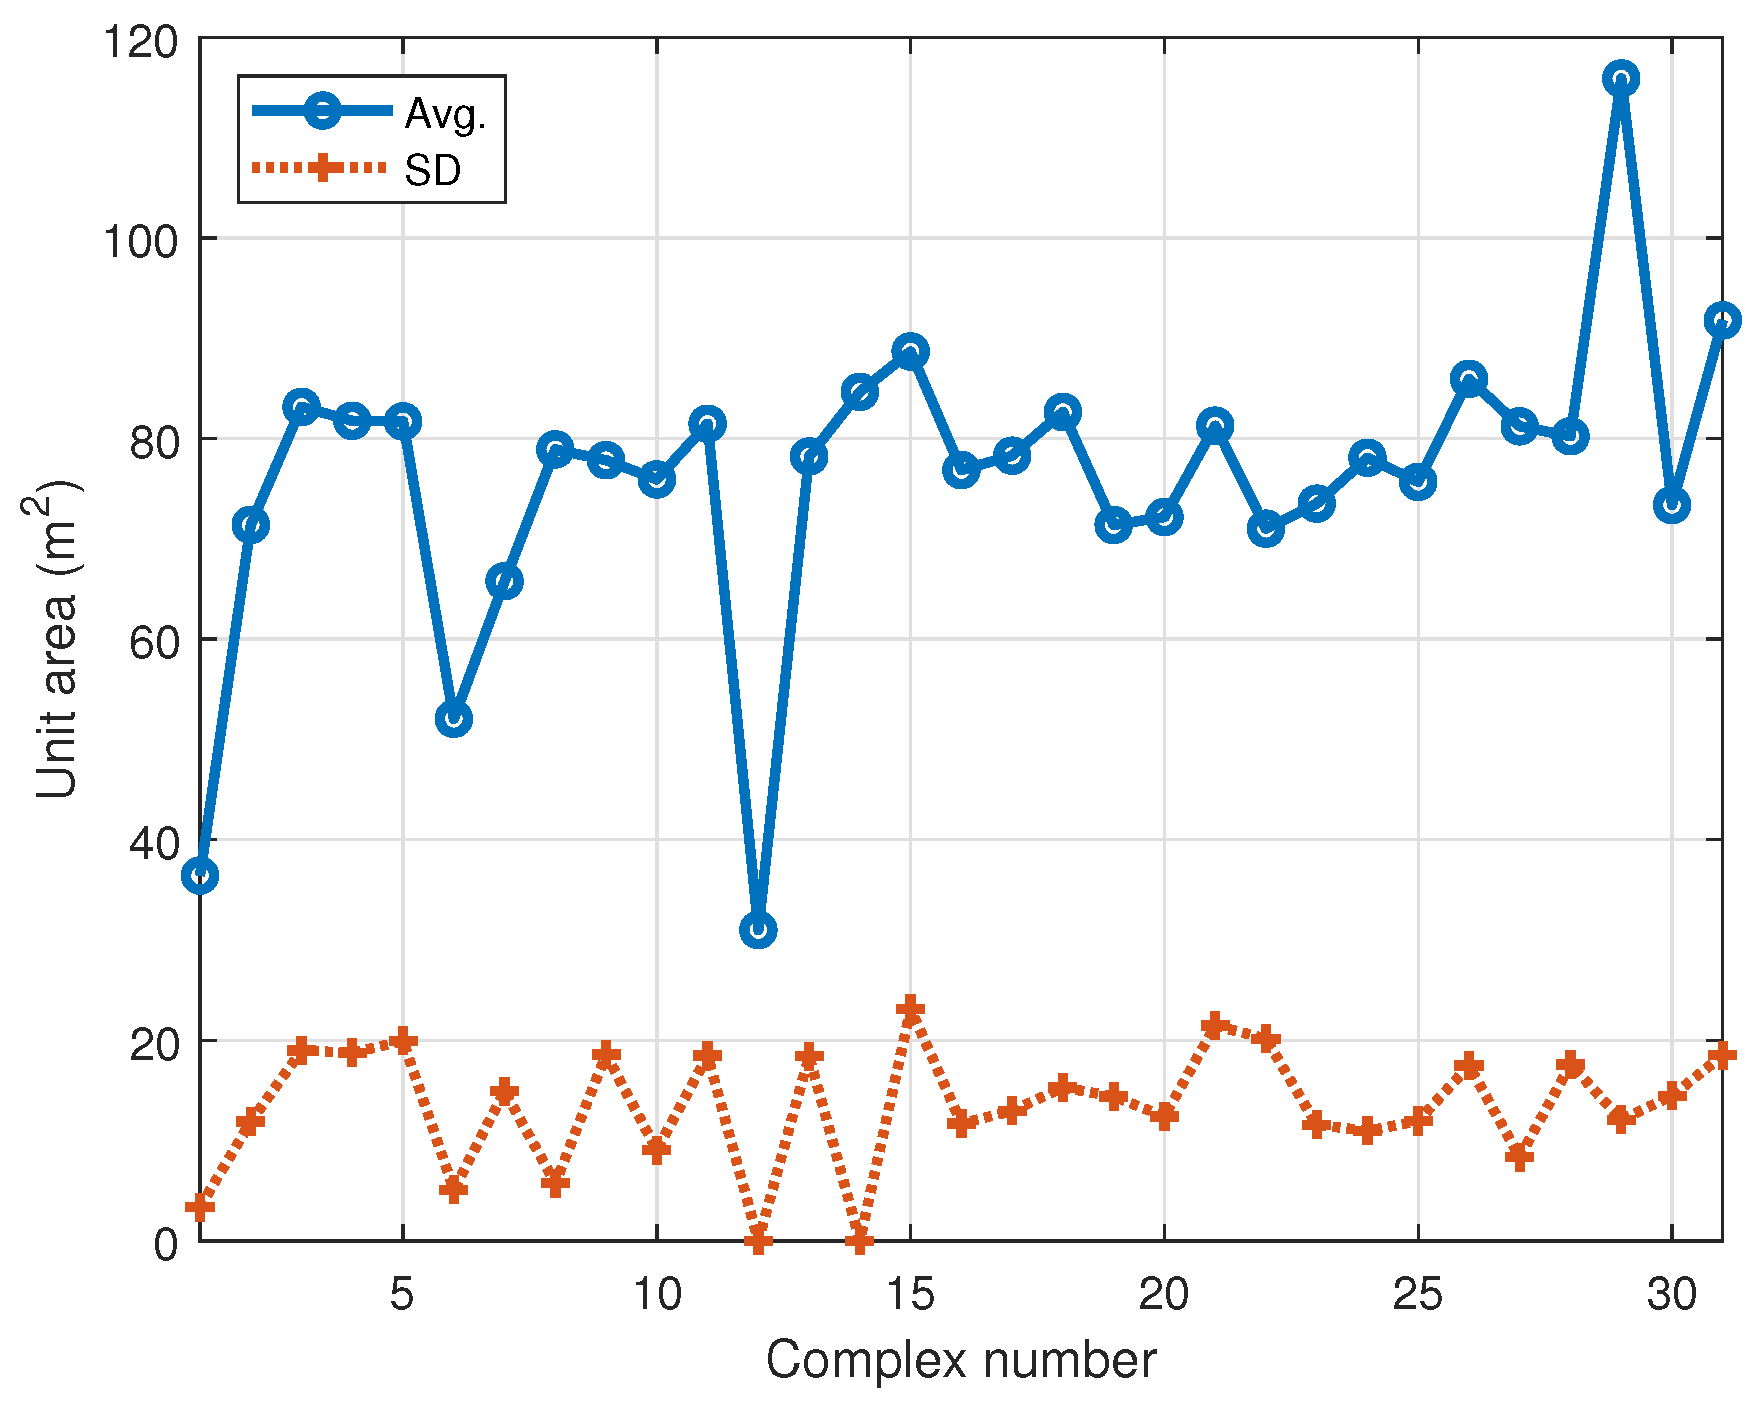
The apartment complexes used for the electricity bill analysis consist of 31 complexes with a total of 13,332 households. The size of each household varies, ranging from 31 m 2 (Complex 12) to 134 m 2 (Complex 29). A summary of the complexes used in the analysis is provided in Table 2. In Table 2, the number of households N and the areas of the households of each apartment complex are shown. Figure 2 shows the average and standard deviation of the unit area for each complex. The monthly electricity usage data for 13,332 households and the common area are collected over a period of 24 months.
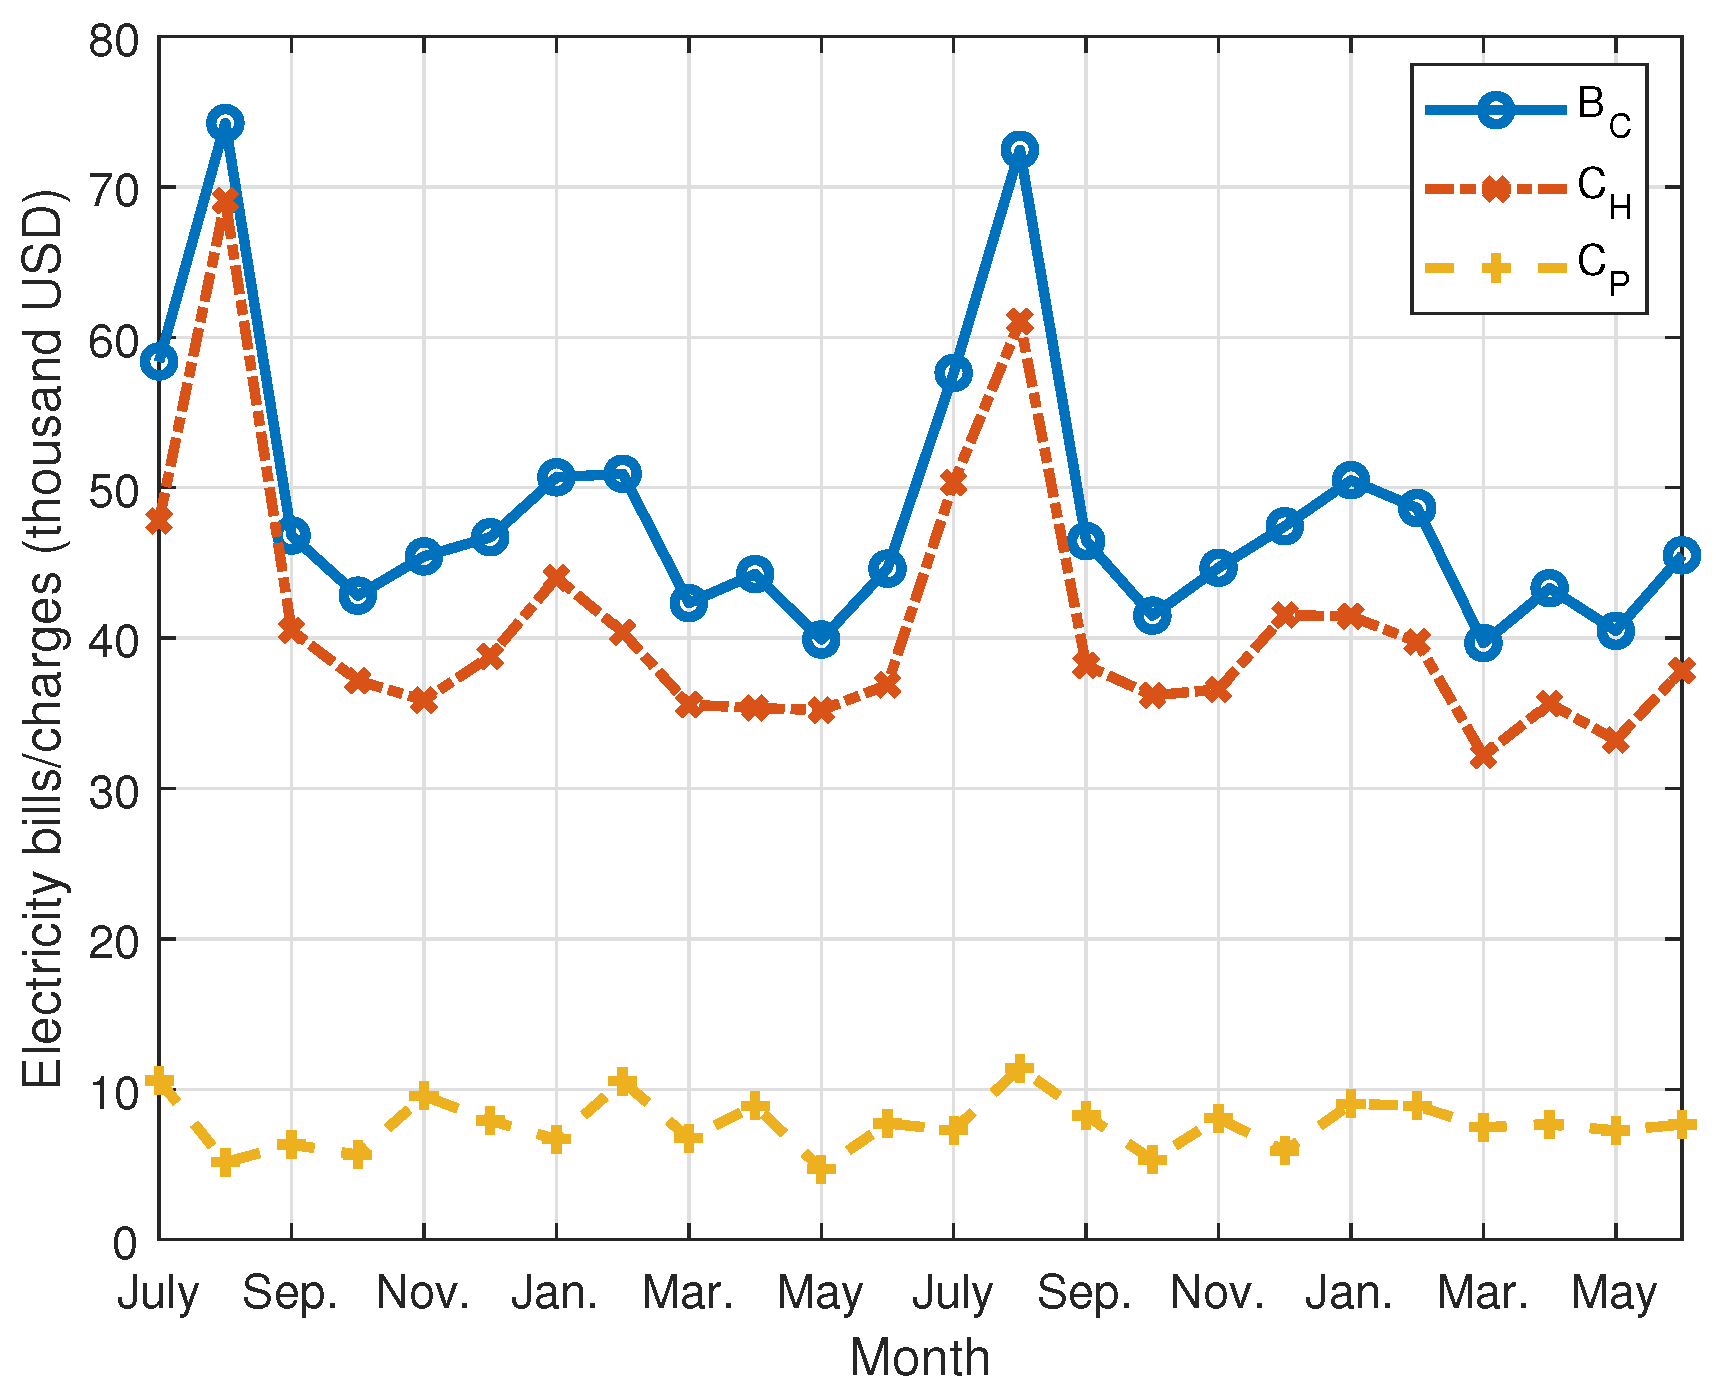
Figure 3 shows the annual electricity consumption of 31 complexes. The first 12 months are denoted as Year 1, while the next 12 months are denoted as Year 2. From the results, it is observed that there is little difference in usage between the two years. Figure 4 shows the monthly complex electricity bill B C for a complex, along with the total charges for household electricity usage C H and common area charges C P that are components of the complex electricity bill. In this figure, Complex 11 is selected for an example.

3. Bill Savings by Reducing Electricity Usage

This section analyzes the potential electricity bill savings that each household in an apartment complex can achieve by reducing electricity usage under the SC. The bill savings obtained by reducing the monthly electricity consumption of a household are calculated from both the complex’s perspective and the household’s perspective.

3.1. Electricity Usage Reduction by All Households

To observe the effect of reducing each household’s monthly electricity consumption on electricity bills, we calculated the changes in the total electricity bill for the complex and the changes in each household’s electricity bill, assuming that all households reduced their monthly electricity consumption.
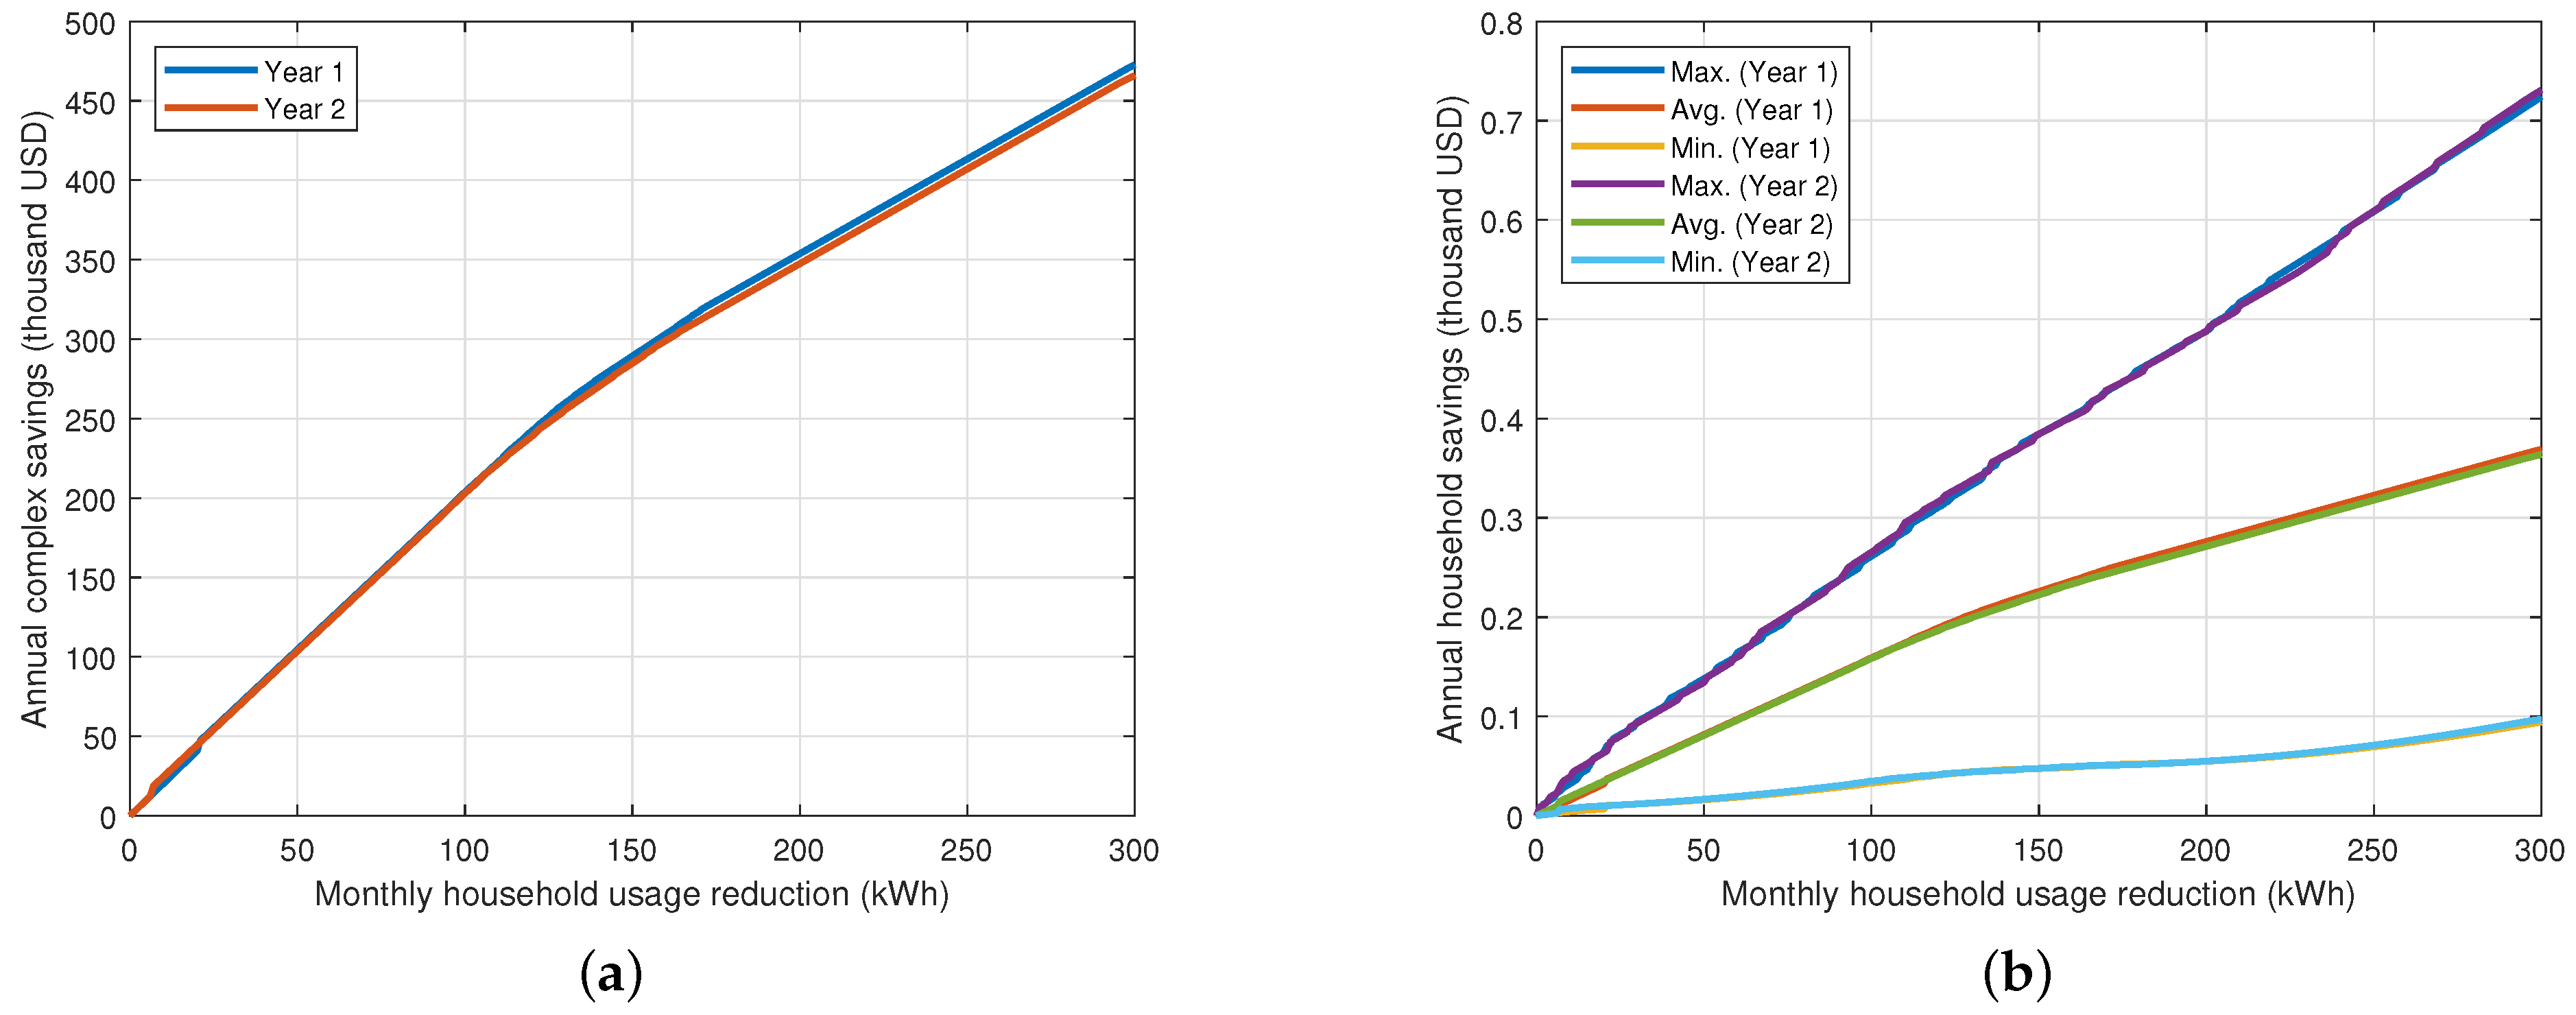
The electricity bill savings for the complexes when each household reduces their monthly electricity consumption from 1 kWh to 300 kWh are shown in Figure 5a. Here, the results from Complex 21 are provided as an example, but the results from other complexes shows similar characteristics. The savings for the complex are calculated on an annual basis, with the results for the first and second years being presented together. The vertical axis is in thousands of U.S. dollars. The results show that there is not much difference between the first and second years. We now denote the reduction in electricity usage per month for a household as σ (kWh/month). It is noted that the savings do not increase linearly; rather, they rise with a relatively steep slope up to a certain point (about σ = 125 ), after which the slope becomes more gradual. This occurs because, under the SC, electricity rates are calculated using a progressive rate system, where the rates decrease from the third to the second and then to the first tier. Therefore, as electricity consumption decreases and the progressive rate tier is lowered, the initial reduction in usage results in large savings, which diminish as further reductions are made.
Next, the results of household electricity bill savings from a reduction in electricity usage are shown in Figure 5b. The savings for each household vary even if the same amount of electricity is reduced. The amount saved differs depending on each household’s usage, with larger savings observed in households with higher consumption. The maximum, minimum, and average savings for households are presented in Figure 5b.
From the results, it is observed that reducing electricity usage for households with greater bill savings is more effective than reducing usage for all households in the apartment complexes. In the next subsection, the bill savings achieved by an electricity usage reduction for selected households with higher potential savings will be presented, from both the complex and individual household perspectives.

3.2. Electricity Usage Reduction by Selected Households

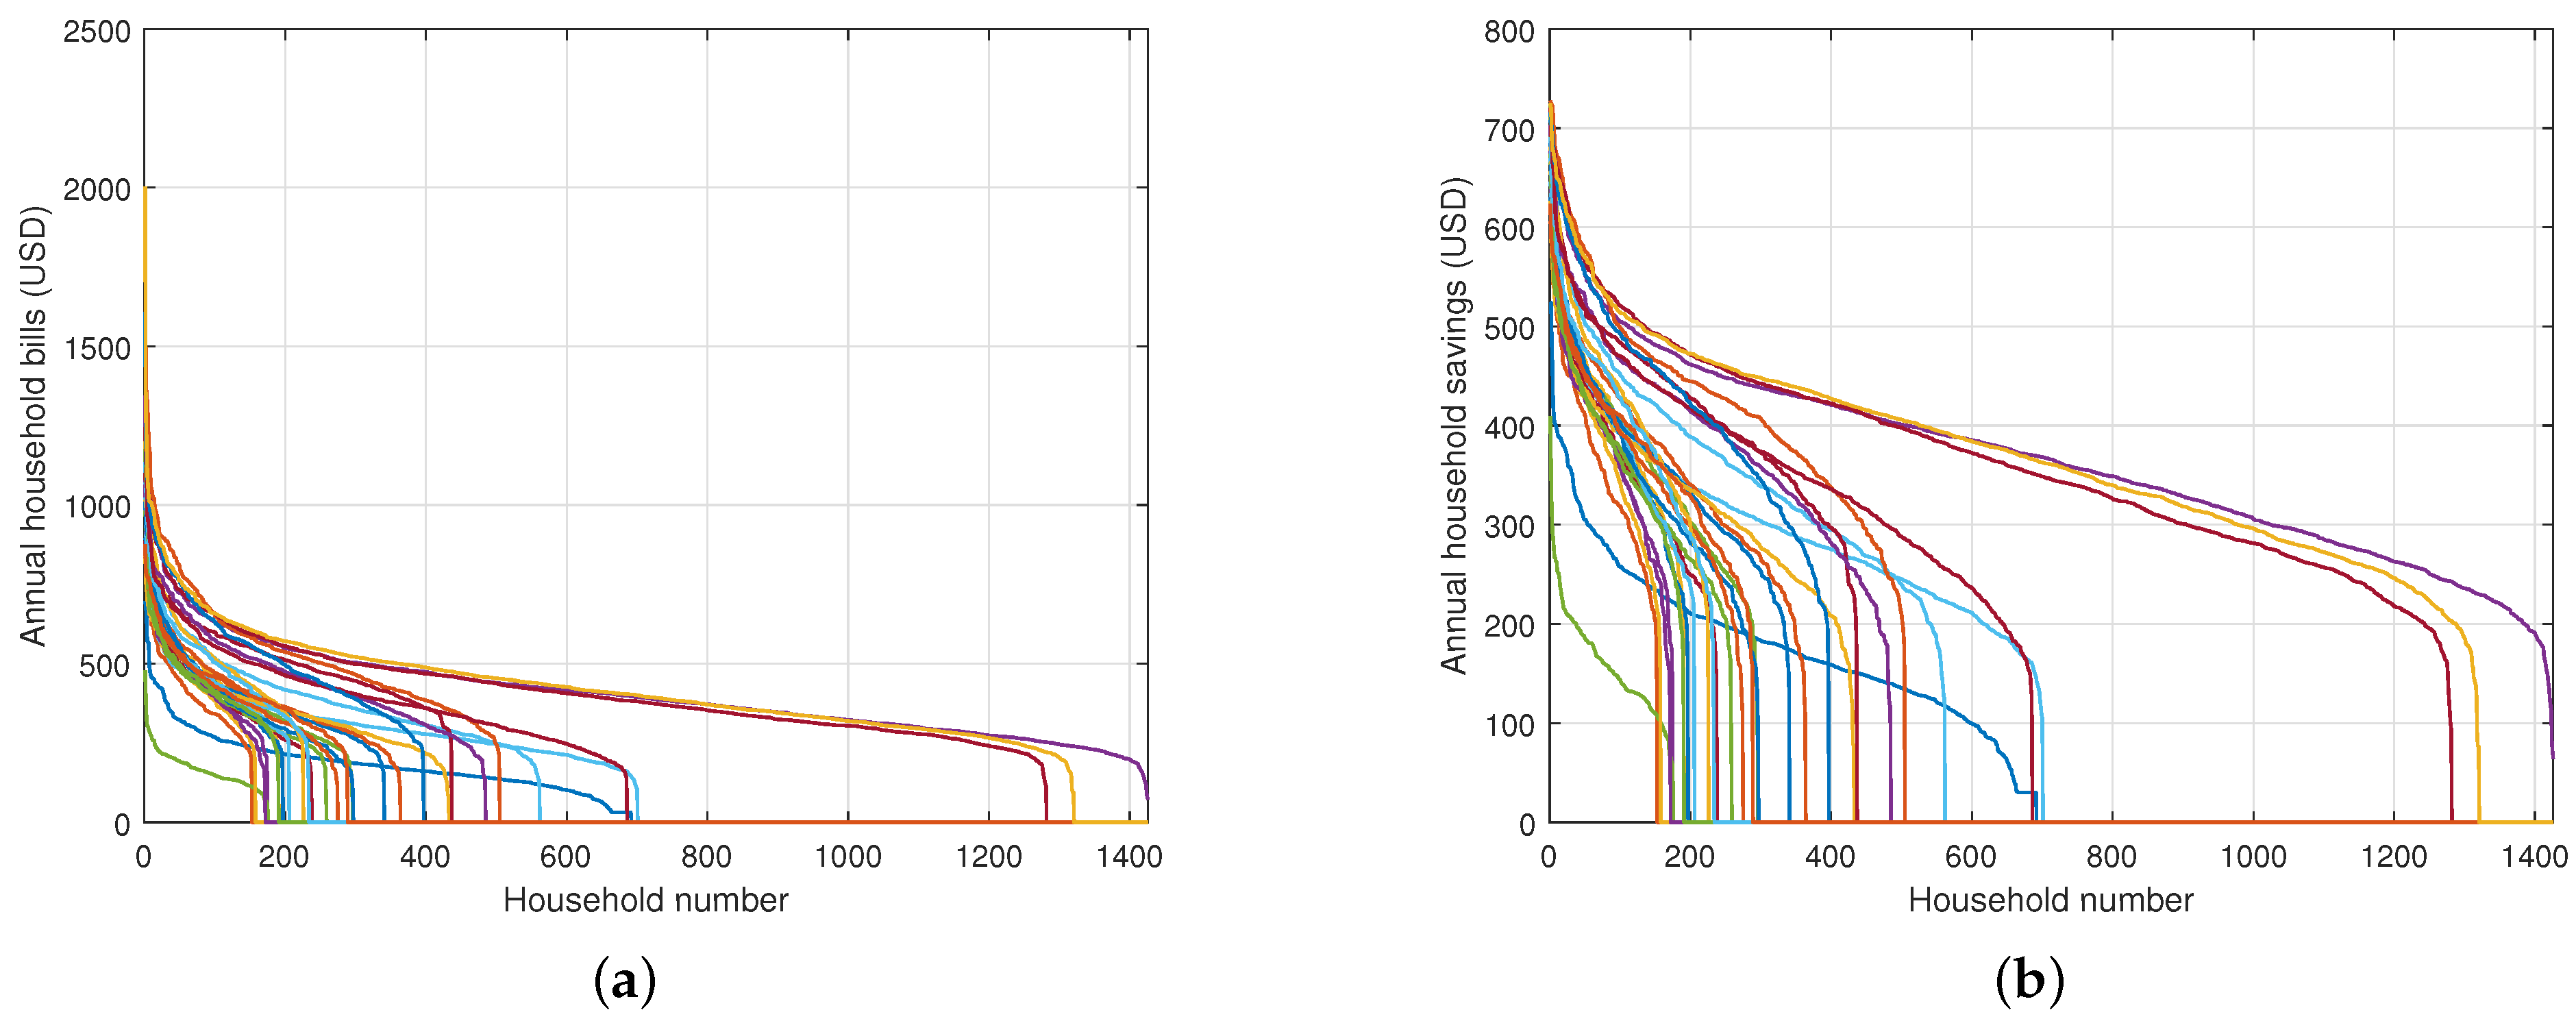
To provide a clearer view of household electricity bills b k ,   k = 1 , , N , in each complex, we sorted the electricity bills in descending order by apartment complexes. The sorted household electricity bills for 31 apartment complexes are shown in Figure 6a. The horizontal axis represents the household number in the complex, and the vertical axis represents the annual electricity bill of the household in USD. In Figure 6a, there are 31 curves, each representing the results for one complex. Households with the highest electricity bills are shown on the left. Moving to the right, we observe a sharp decrease in electricity bills, after which the slope of the curve becomes very gradual. In other words, the sorted bill values exhibit a negative exponential function pattern. This indicates that there are a few households with very high electricity bills in each complex, while the difference in electricity bills among the majority of other households is relatively small. The trend is similarly observed for all complexes. Note that since the number of households varies by complex, the point where each curve ends (where it meets the horizontal axis) differs.
Next, for the electricity bill savings resulting from a reduction of 300 kWh in monthly usage, we sorted the savings in descending order by apartment complexes. The sorted household electricity bill savings for 31 apartment complexes are shown in Figure 6b. The horizontal axis represents the sorted household number in the complex, and the vertical axis represents the annual bill savings of the household in USD. This result also exhibits a negative exponential function pattern, similar to the previous results, indicating that the savings for a small number of top households are very large. This trend is similarly observed with reductions of 100 kWh and 200 kWh in electricity usage per month.
Now, the savings for the top households in terms of a bill reduction are analyzed both from the perspective of the complex and from the perspective of those specific households, as they would have the highest motivation for reducing electricity consumption. In the experiment, we select the top m households with the largest bill savings, sorted in descending order. We define α as the percentage obtained by dividing the number of top households m by the number of households N in the complex. When the electricity usage reduction is 300 kWh per month, α % of households are selected, where α = 10%, 20%, and 30%. For these households, we conducted experiments with various reduction amounts ranging from 1 kWh to 300 kWh per month. However, we did not consider reductions above 300 kWh, since such reductions are not practically feasible. From the experiments, no specific reduction values were found that could clearly categorize the results. Therefore, for convenience, we selected reduction amounts of 100 kWh, 200 kWh, and 300 kWh, categorized as small, medium, and large reductions. Usage reductions of 100 kWh, 200 kWh, and 300 kWh per month ( σ = 100, 200, and 300) were applied for these households, and the resulting savings were analyzed from both the complexes’ and the individual household perspectives.
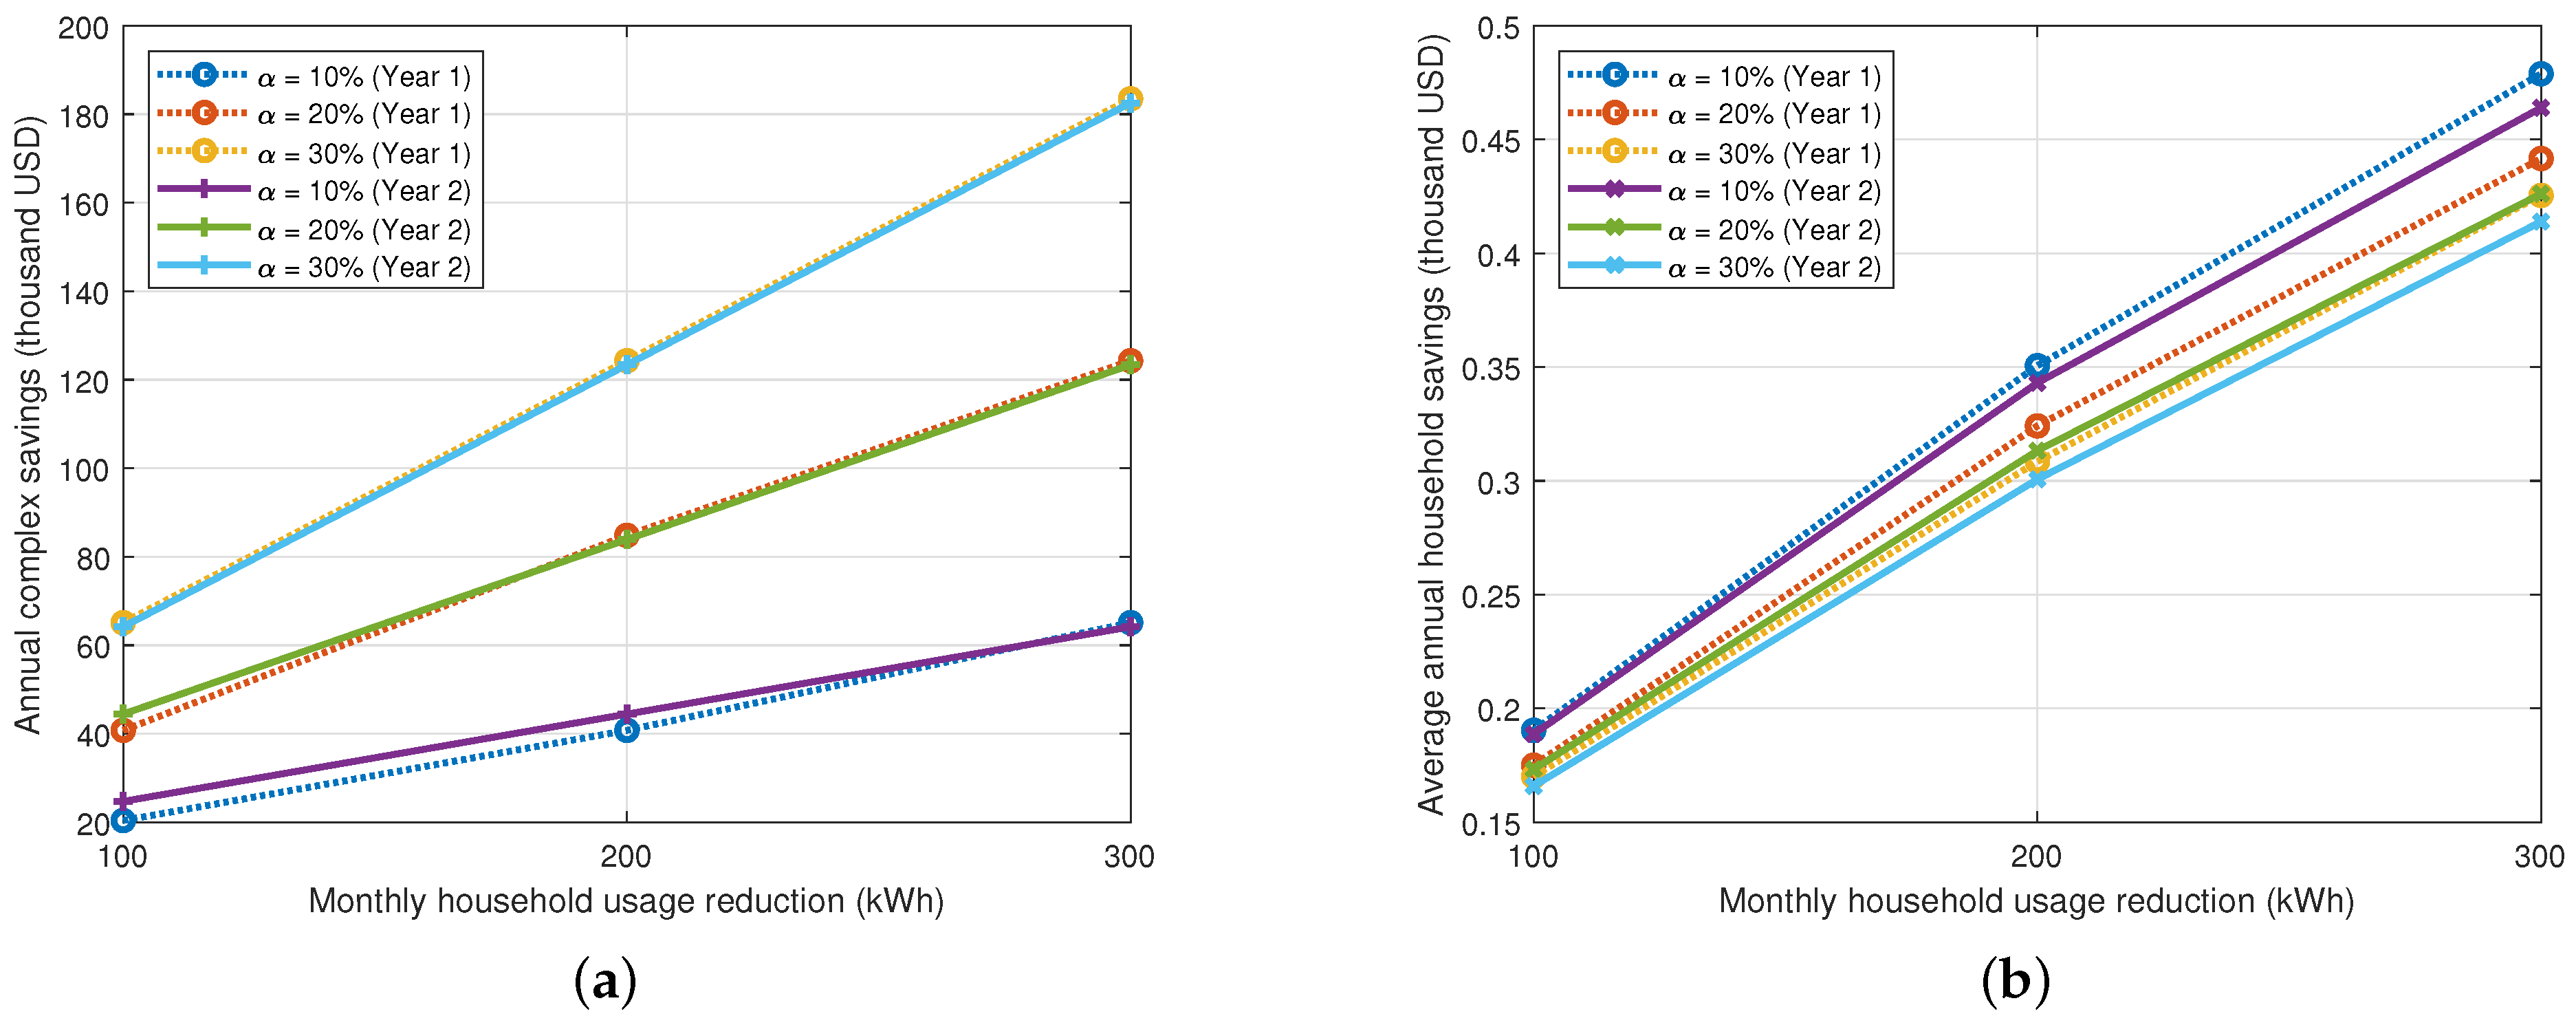
In Figure 7, the annual reductions in bills for the complexes and households are shown when monthly usage reductions σ are applied to α % of households. Figure 7a shows the annual reduction in bills for complexes (in thousands of U.S. dollars) due to the decrease in electricity usage, while Figure 7b shows the average annual reduction in bills for households (in thousands of U.S. dollars). Each figure presents the results for both the first and second years. Figure 7 shows the results for Complex 21; however, the results for the other complexes are similar in pattern.
From the results, it is clear that the savings for the complexes increase as the reduction in usage increases. Additionally, as the number of households reducing their usage increases, the savings for the complex also increase. Namely, the savings are larger when 20% of households reduce their usage compared to 10%, and they are even larger when 30% of households reduce their usage compared to 20%. On the contrary, the average reduction in household bills is highest when 10% of the households reduce their usage, followed by 20%, and it is the lowest when 30% of households do so. This is because, as observed in Figure 6b, the reduction in household bills due to decreased electricity usage follows a negative exponential pattern. As the number of households reducing their usage increases, the average reduction amount decreases.
Now, let us compare the changes in reduction amounts by complex. Figure 8 shows the total savings for each complex obtained from reducing usage per month σ when these reductions are applied to the selected α % of households in each complex. The horizontal axis represents the complex number, and the vertical axis represents the annual savings for the complex. The results in Figure 8 are for the first year; however, there is almost no difference between the first year and the second year. In Figure 8, the height of the brown bar represents the savings for a complex achieved when selected households reduce their consumption by 100 kWh per month. For example, as observed in Figure 8a, when 10% of households in Complex 11 reduce their usage by 100 kWh, the savings for the complex are USD 22.8 thousand. The top end of the brown bar indicates savings when the reduction is 200 kWh per month; for Complex 11, it is USD 45.5 thousand. Finally, the top end of the blue bar represents the annual savings for the complexes when the reduction is 300 kWh per month. For Complex 11, it is USD 73.2 thousand. Figure 8b shows the results when 20% of households reduce their usage, and Figure 8c shows the results when 30% of households reduce their usage. From Figure 8, it is clear that as the percentage of households reducing usage increases, the annual savings for the complexes also increase. On the other hand, significant annual savings are observed in Complexes 11, 21, and 31, and this is due to the large number of households in these complexes.
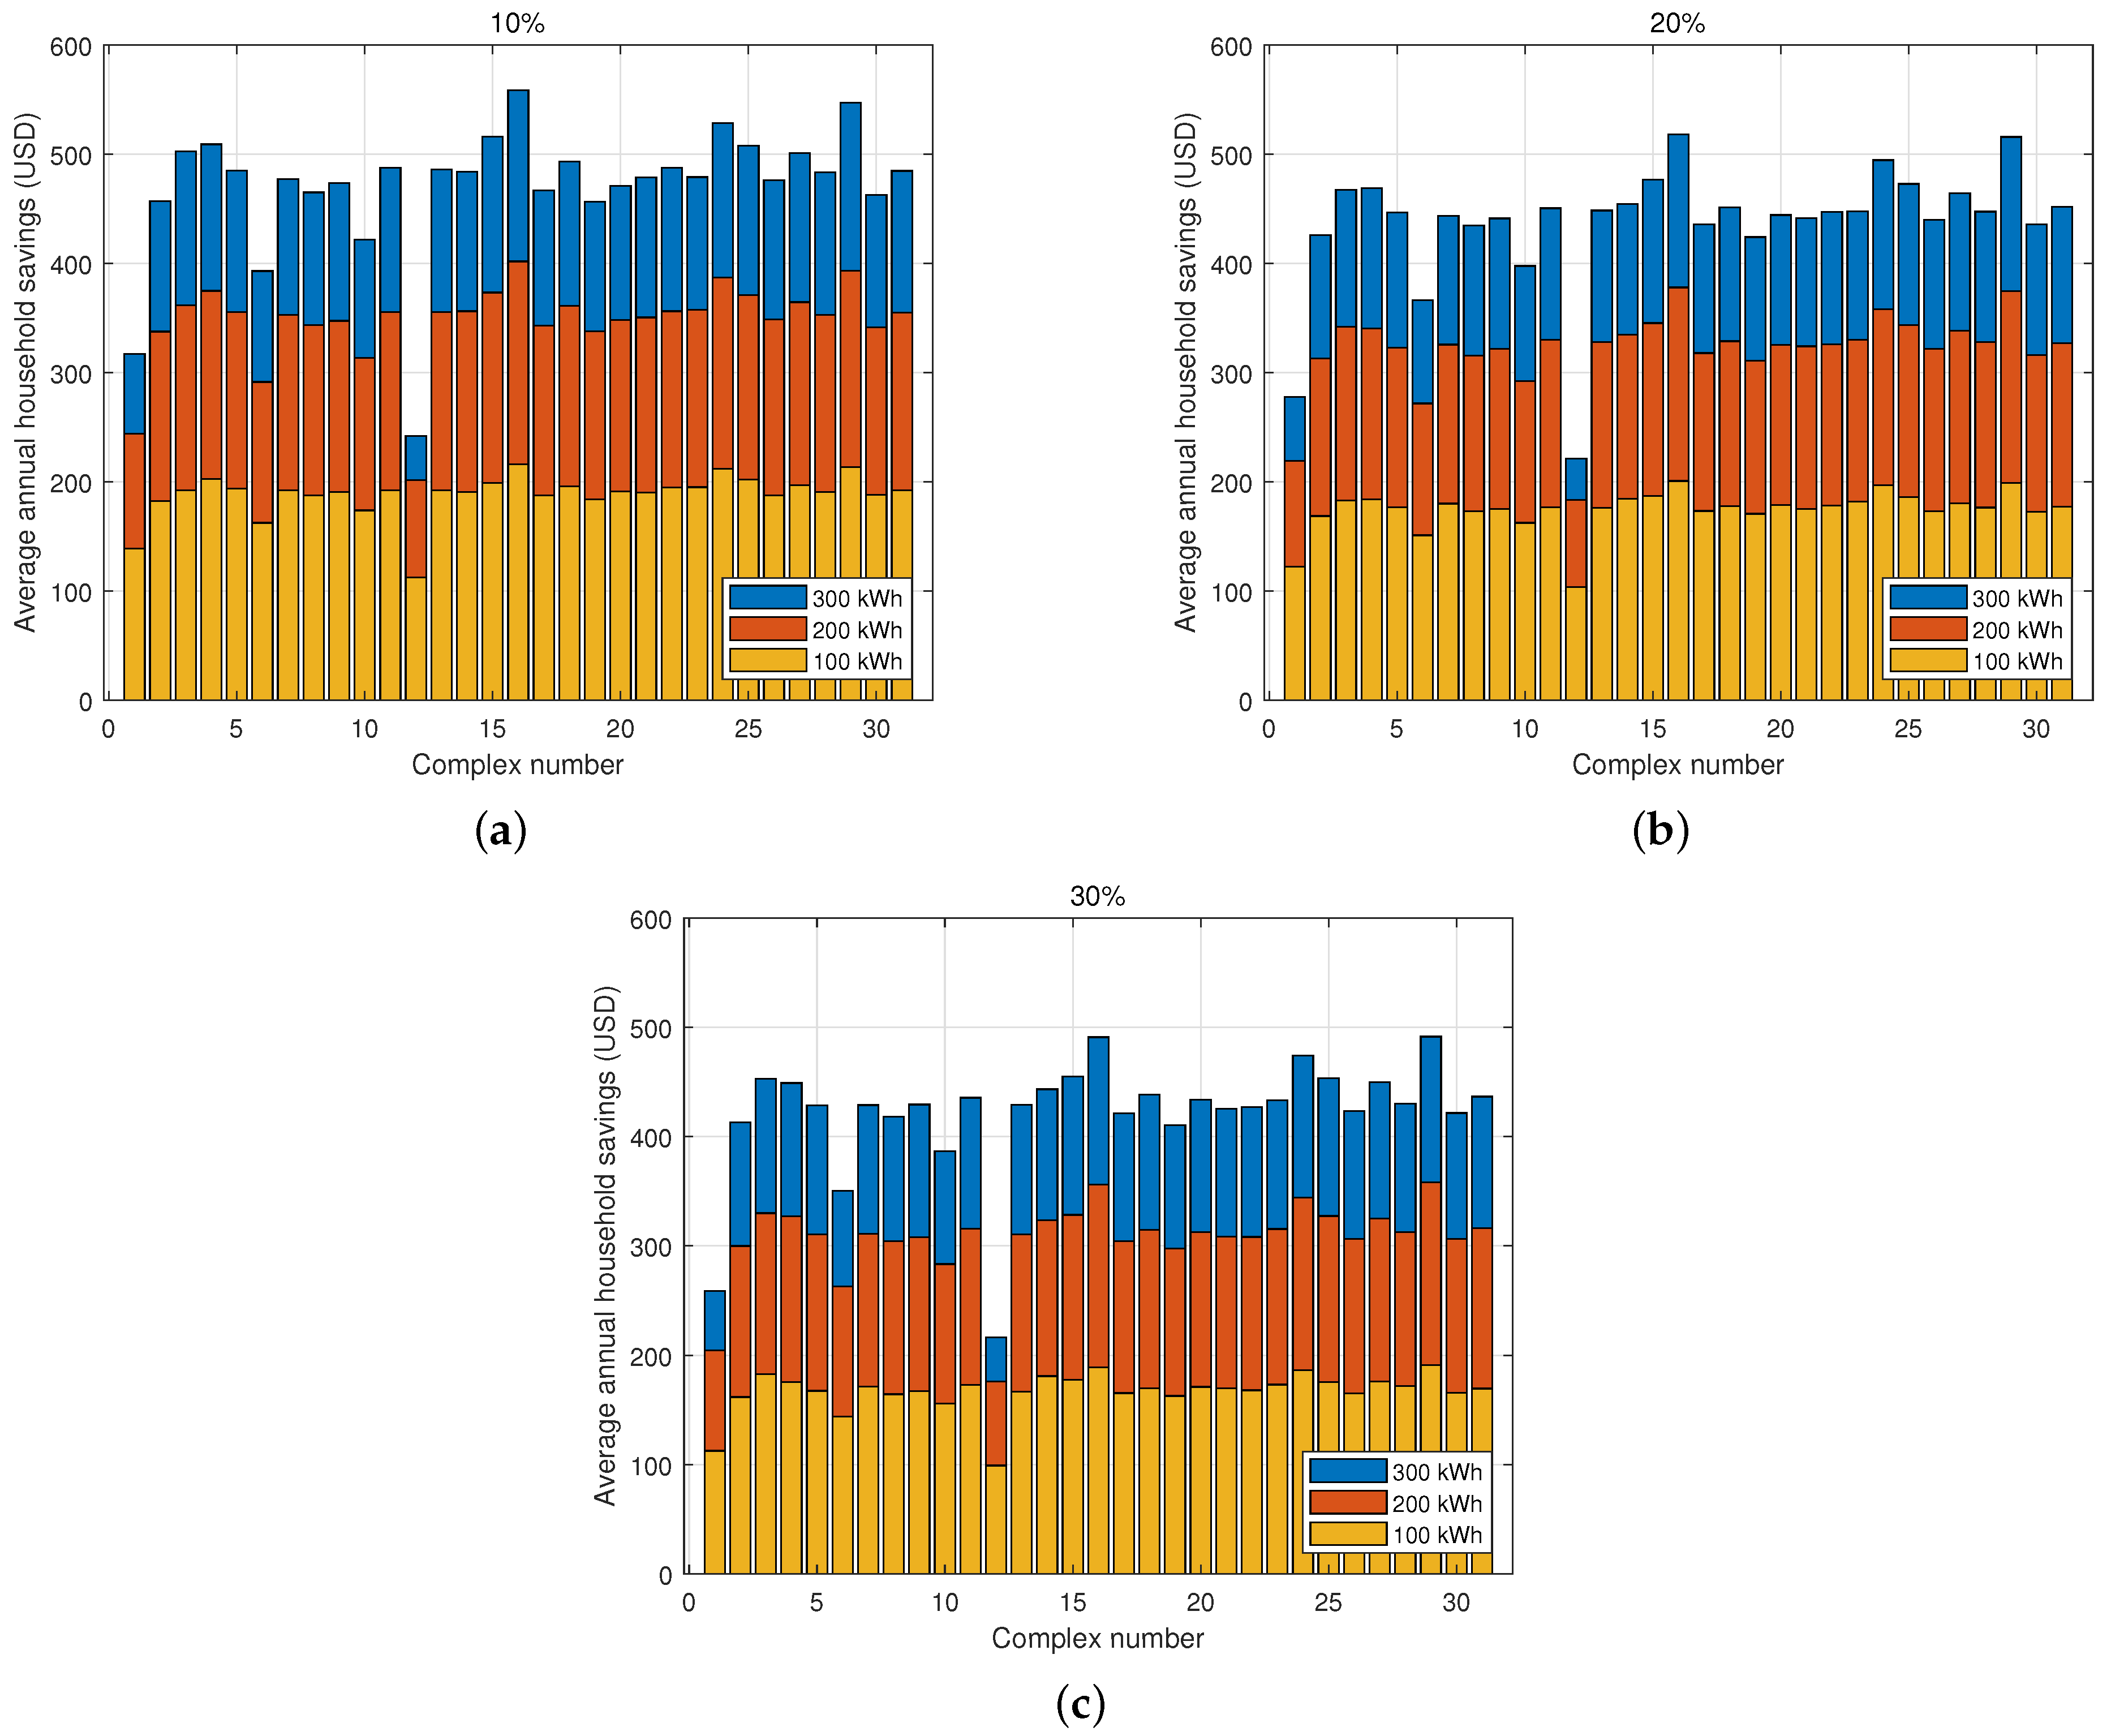
We will now analyze the bill savings for selected households by decreasing their usage in each complex. Figure 9 shows the average annual household savings achieved by reducing usage per month σ for each complex. In Figure 9a, the results for the average household savings are shown when 10% of households in each complex reduce their usage. It is observed that the average annual household savings for Complex 11, for example, is USD 192, with a reduction in usage of 100 kWh per month. When 200 kWh is reduced per month, the average annual household saving in Complex 11 is USD 356. Additionally, it is observed that the average annual household saves USD 488 when the reduction per month is 300 kWh in Complex 11. Figure 9b,c show the results when 20% and 30% of households reduce usage, respectively. It is noted that as the proportion of households reducing their usage increases, the average annual household savings decreases while the total annual saving for the complex increases. Furthermore, the results show that the average annual savings per household are almost the same across all complexes, except for Complexes 1 and 12. These complexes have relatively smaller unit sizes. Therefore, the electricity usage of these households is lower, and the savings from reducing electricity usage are not significant.
From the results, Table 3 summarizes the complexes with the maximum annual bill savings and their corresponding amounts. The complex number and year in which the savings are obtained are indicated in parentheses below the savings amount in Table 3. It is observed that Complexes 11 and 21 show the highest bill savings. Since Complexes 11 and 21 have the largest number of households, they have the greatest bill reductions. Most of the maximum values occur in the first year, but the difference between these and the maximum values in the second year is small.
The maximum average annual household savings achieved by the selected households in the complex when reducing their electricity usage are summarized in Table 4. The average annual household bill savings are greater when the proportion of households reducing their electricity usage is smaller. Complexes 16 and 29 show the maximum average annual household savings. Complex 16 has 504 households, with unit sizes ranging from 60 m 2 to 85 m 2 . Complex 16 has a medium-sized number of households and unit sizes. The high average annual household savings in this complex are likely due to the high proportion of households with heavy electricity usage compared to other complexes.

4. Discussions

In this section, we investigate the relationship between the savings in the complexes’ electricity bills due to the reduced usage and the total bill savings for households that reduced their electricity usage. It might be expected that the electricity bill savings for the complexes and the total bill savings for the households that reduced electricity usage would be the same. However, these two values are not identical when the SC is applied. The bill savings for the complexes could be larger; conversely, the sum of the bill savings for the households that reduced their usage could be larger. If the bill savings for the complexes are larger, households that have not reduced their electricity usage share the difference in savings between the complexes and the reducing households, allowing them to lower their bills. On the other hand, if the total savings for the households that have reduced their electricity usage is larger, the households that did not reduce their usage will share the burden of this difference, causing their electricity bills to increase.
The reason the total savings for households that reduced their usage differs from the savings for the complex is as follows: In the simplest case, let us assume that only one household in an apartment complex reduces its electricity consumption from w k to w k (the monthly usage reduction, σ = w k w k ). In this case, the total bill savings from the households with reduced usage, denoted as s H , would be s H = b k b k = h ( w k ) h ( w k ) + ϵ , where ϵ = h ( W ¯ ) h ( W ¯ σ / N ) [ h ( w k ) h ( w k ) ] / N . Note that when N is large, ϵ becomes small, resulting in s H h ( w k ) h ( w k ) . The savings for the complex resulting from this household’s reduction in electricity usage, denoted as s C , are calculated as s C = [ h ( W ¯ ) h ( W ¯ σ / N ) ] · N . These two values are not equal, and depending on the values of w k , w k , W ¯ , and N, the difference between the savings for the complex and the total savings for the households can be either positive or negative. This difference is compensated by the charges for the electricity usage in common areas, making the savings for the complex and the total savings for all households in the complex to be equal.
Now, we analyze the relationship between the total savings for households that reduced their usage and the savings for complexes in a general case, considering multiple numbers of households that reduced their usage. Let the bill for a complex after the usage reduction be B c . Then, the savings on the complex’s bill are given by
s C = B C B C .
Let the bill for households after the usage reduction be b k . When the set of households where the reduction is applied is called R, the total savings from the households with reduced usage, s H , are as follows:
s H = k R ( b k b k ) .
Then, the difference between the complex’s bill savings and the sum of the bill savings of the households that reduced their electricity usage, s d , is
s d : = s C s H .
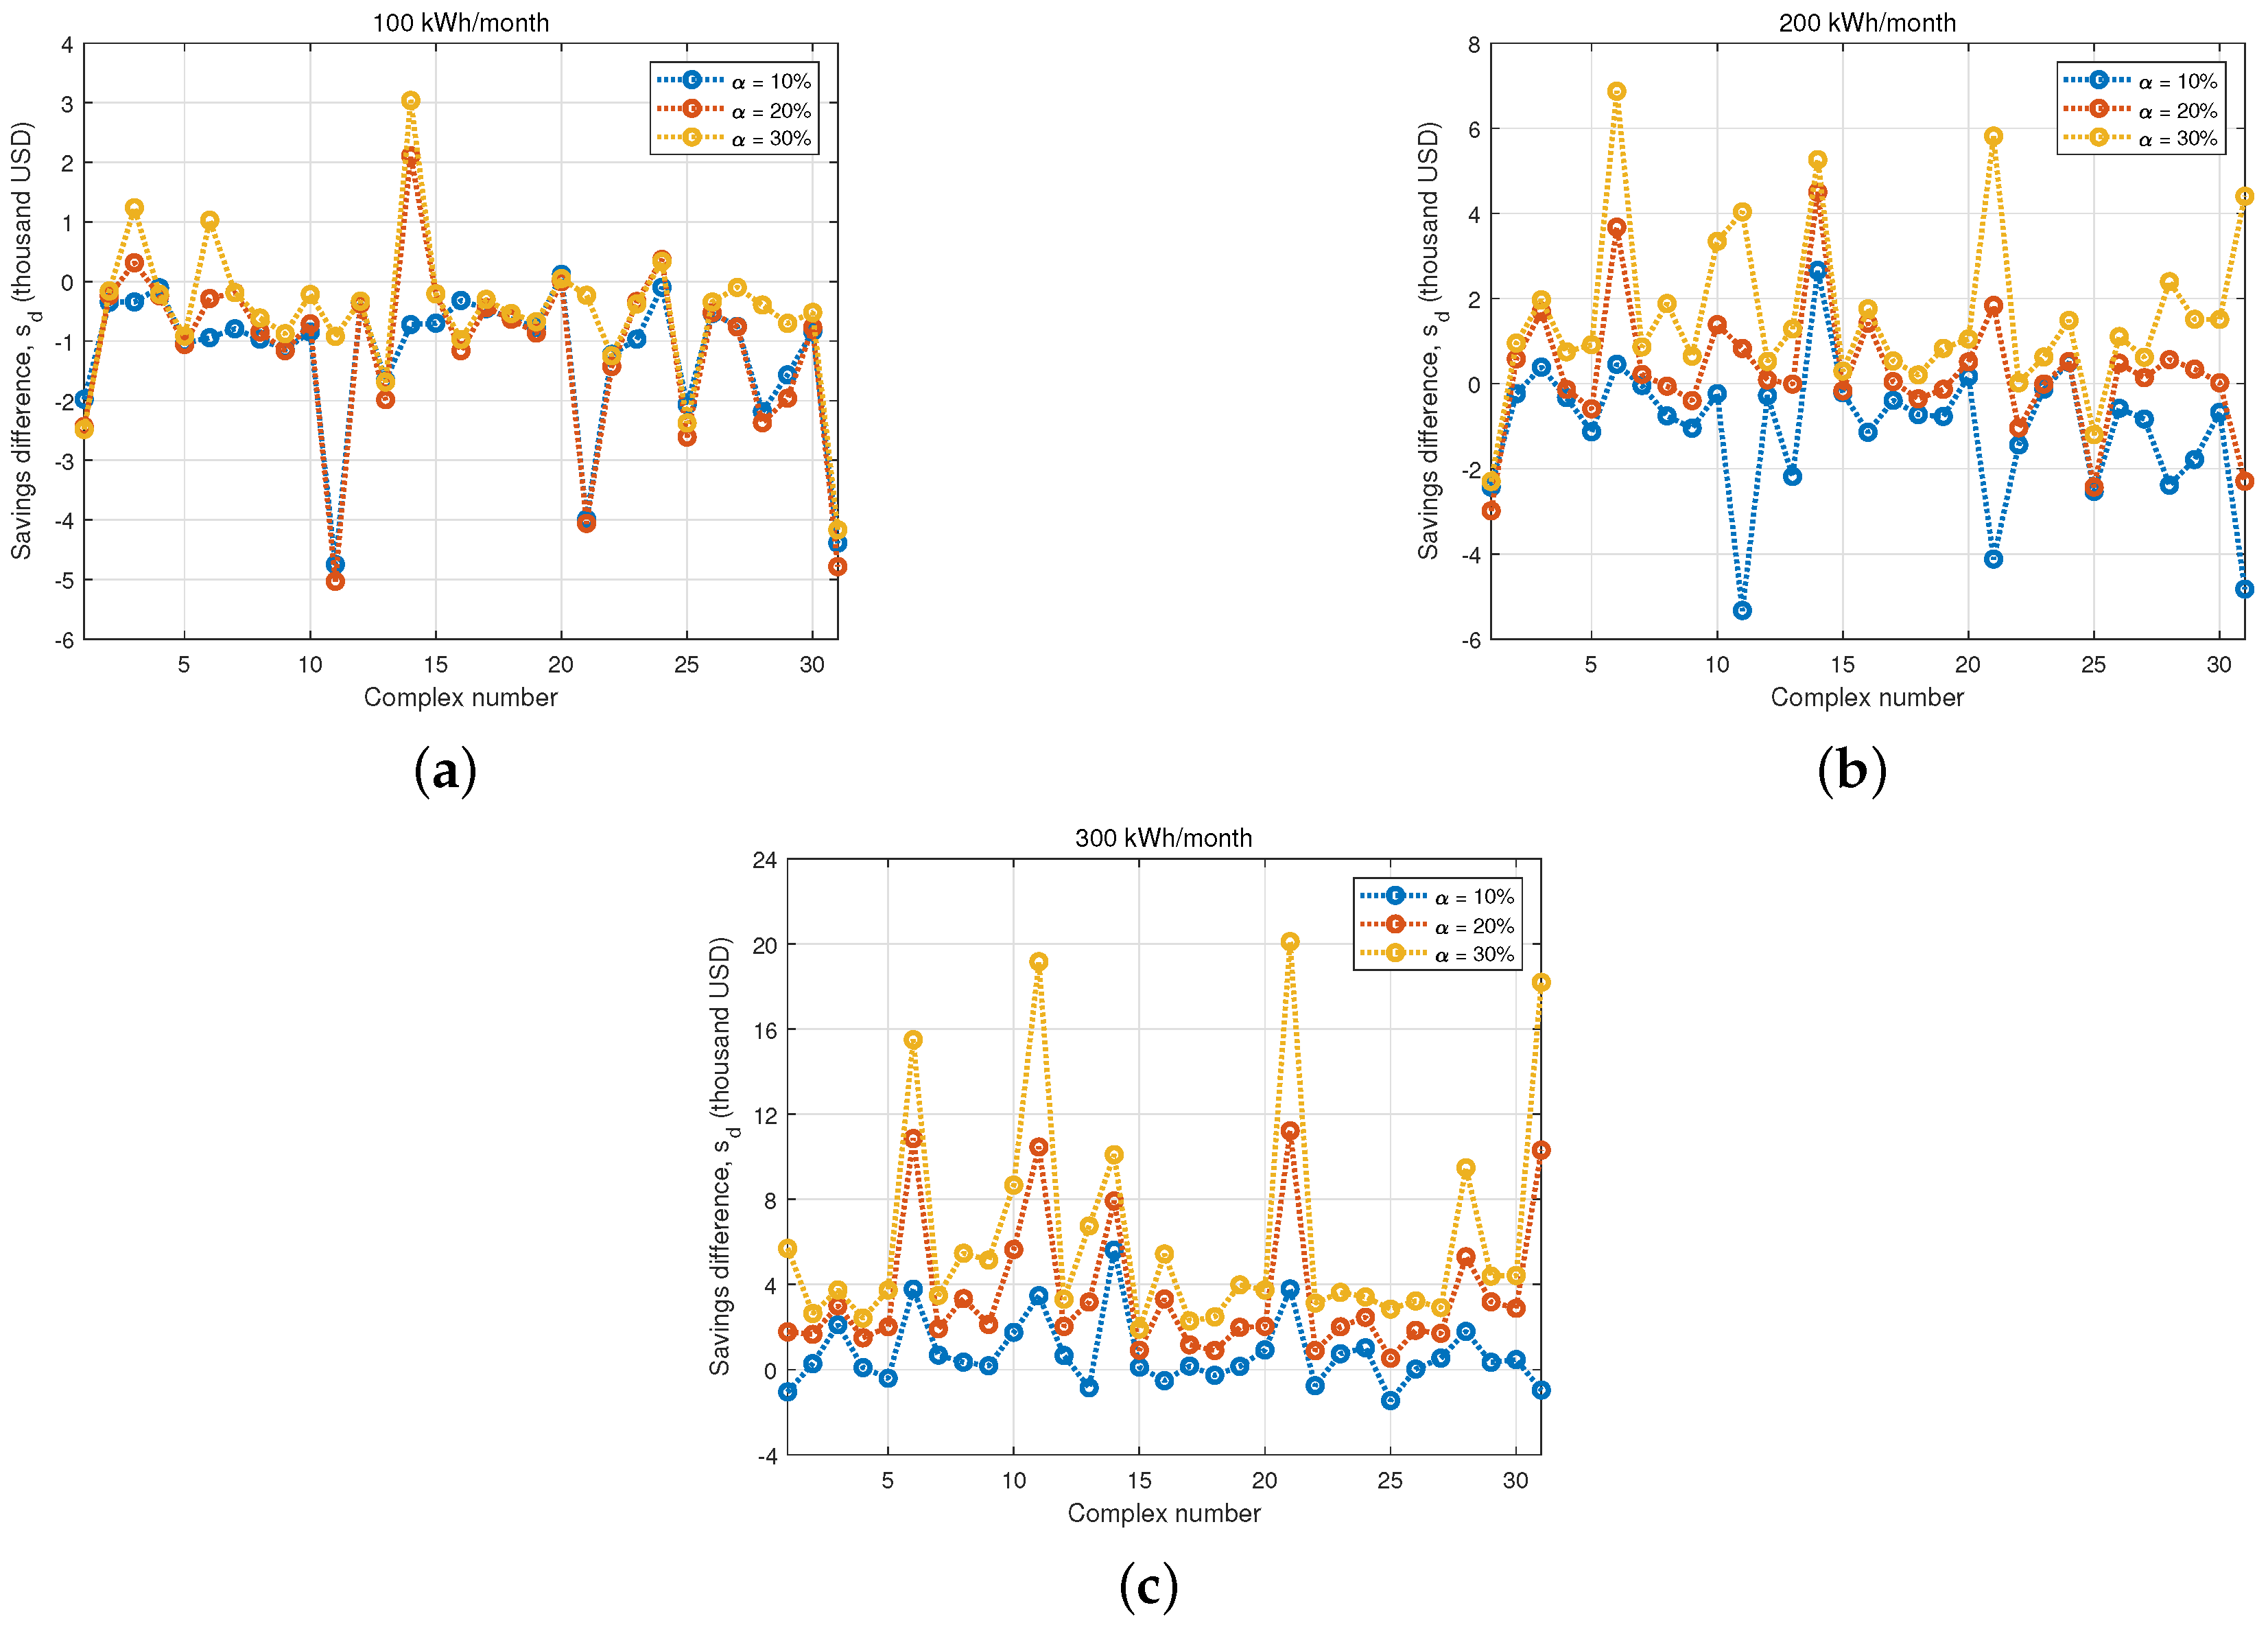
The values for s d for the 31 apartment complexes are shown in Figure 10. The horizontal axis represents the complex number, and the vertical axis shows the difference in savings, expressed in thousands of U.S. dollars. It is observed that when the reduction amount is small or the proportion of households that reduce usage is low, the value tends to be negative. On the other hand, when the reduction amount is large or the proportion of households that reduce usage is high, the value tends to be positive. Note that s d is not always positive. The difference in savings means that either the households that did not reduce their usage share the shortfall (in the case of a negative s d ) or share the surplus (in the case of a positive s d ).
Now, the difference between the complex’s savings and the selected households’ savings, s d , is analyzed. Using the set R, the savings on the complex’s bill are expressed as
s C = k R ( b k b k ) + k R ( b k b k ) .
From (8)–(10), s d can be written as
s d = k R ( b k b k ) = k R ( c k + z c k z ) ,
where c k and z are the household and common area usage charges for non-reducing households after the selected households have reduced their usage, respectively. Since the electricity usage in the non-reducing households remains unchanged after the selected households have reduced their usage, c k = c k . We let δ = z z . Then, from (11), we obtain
s d = δ ( 1 α ) N ,
δ = s d ( 1 α ) N .
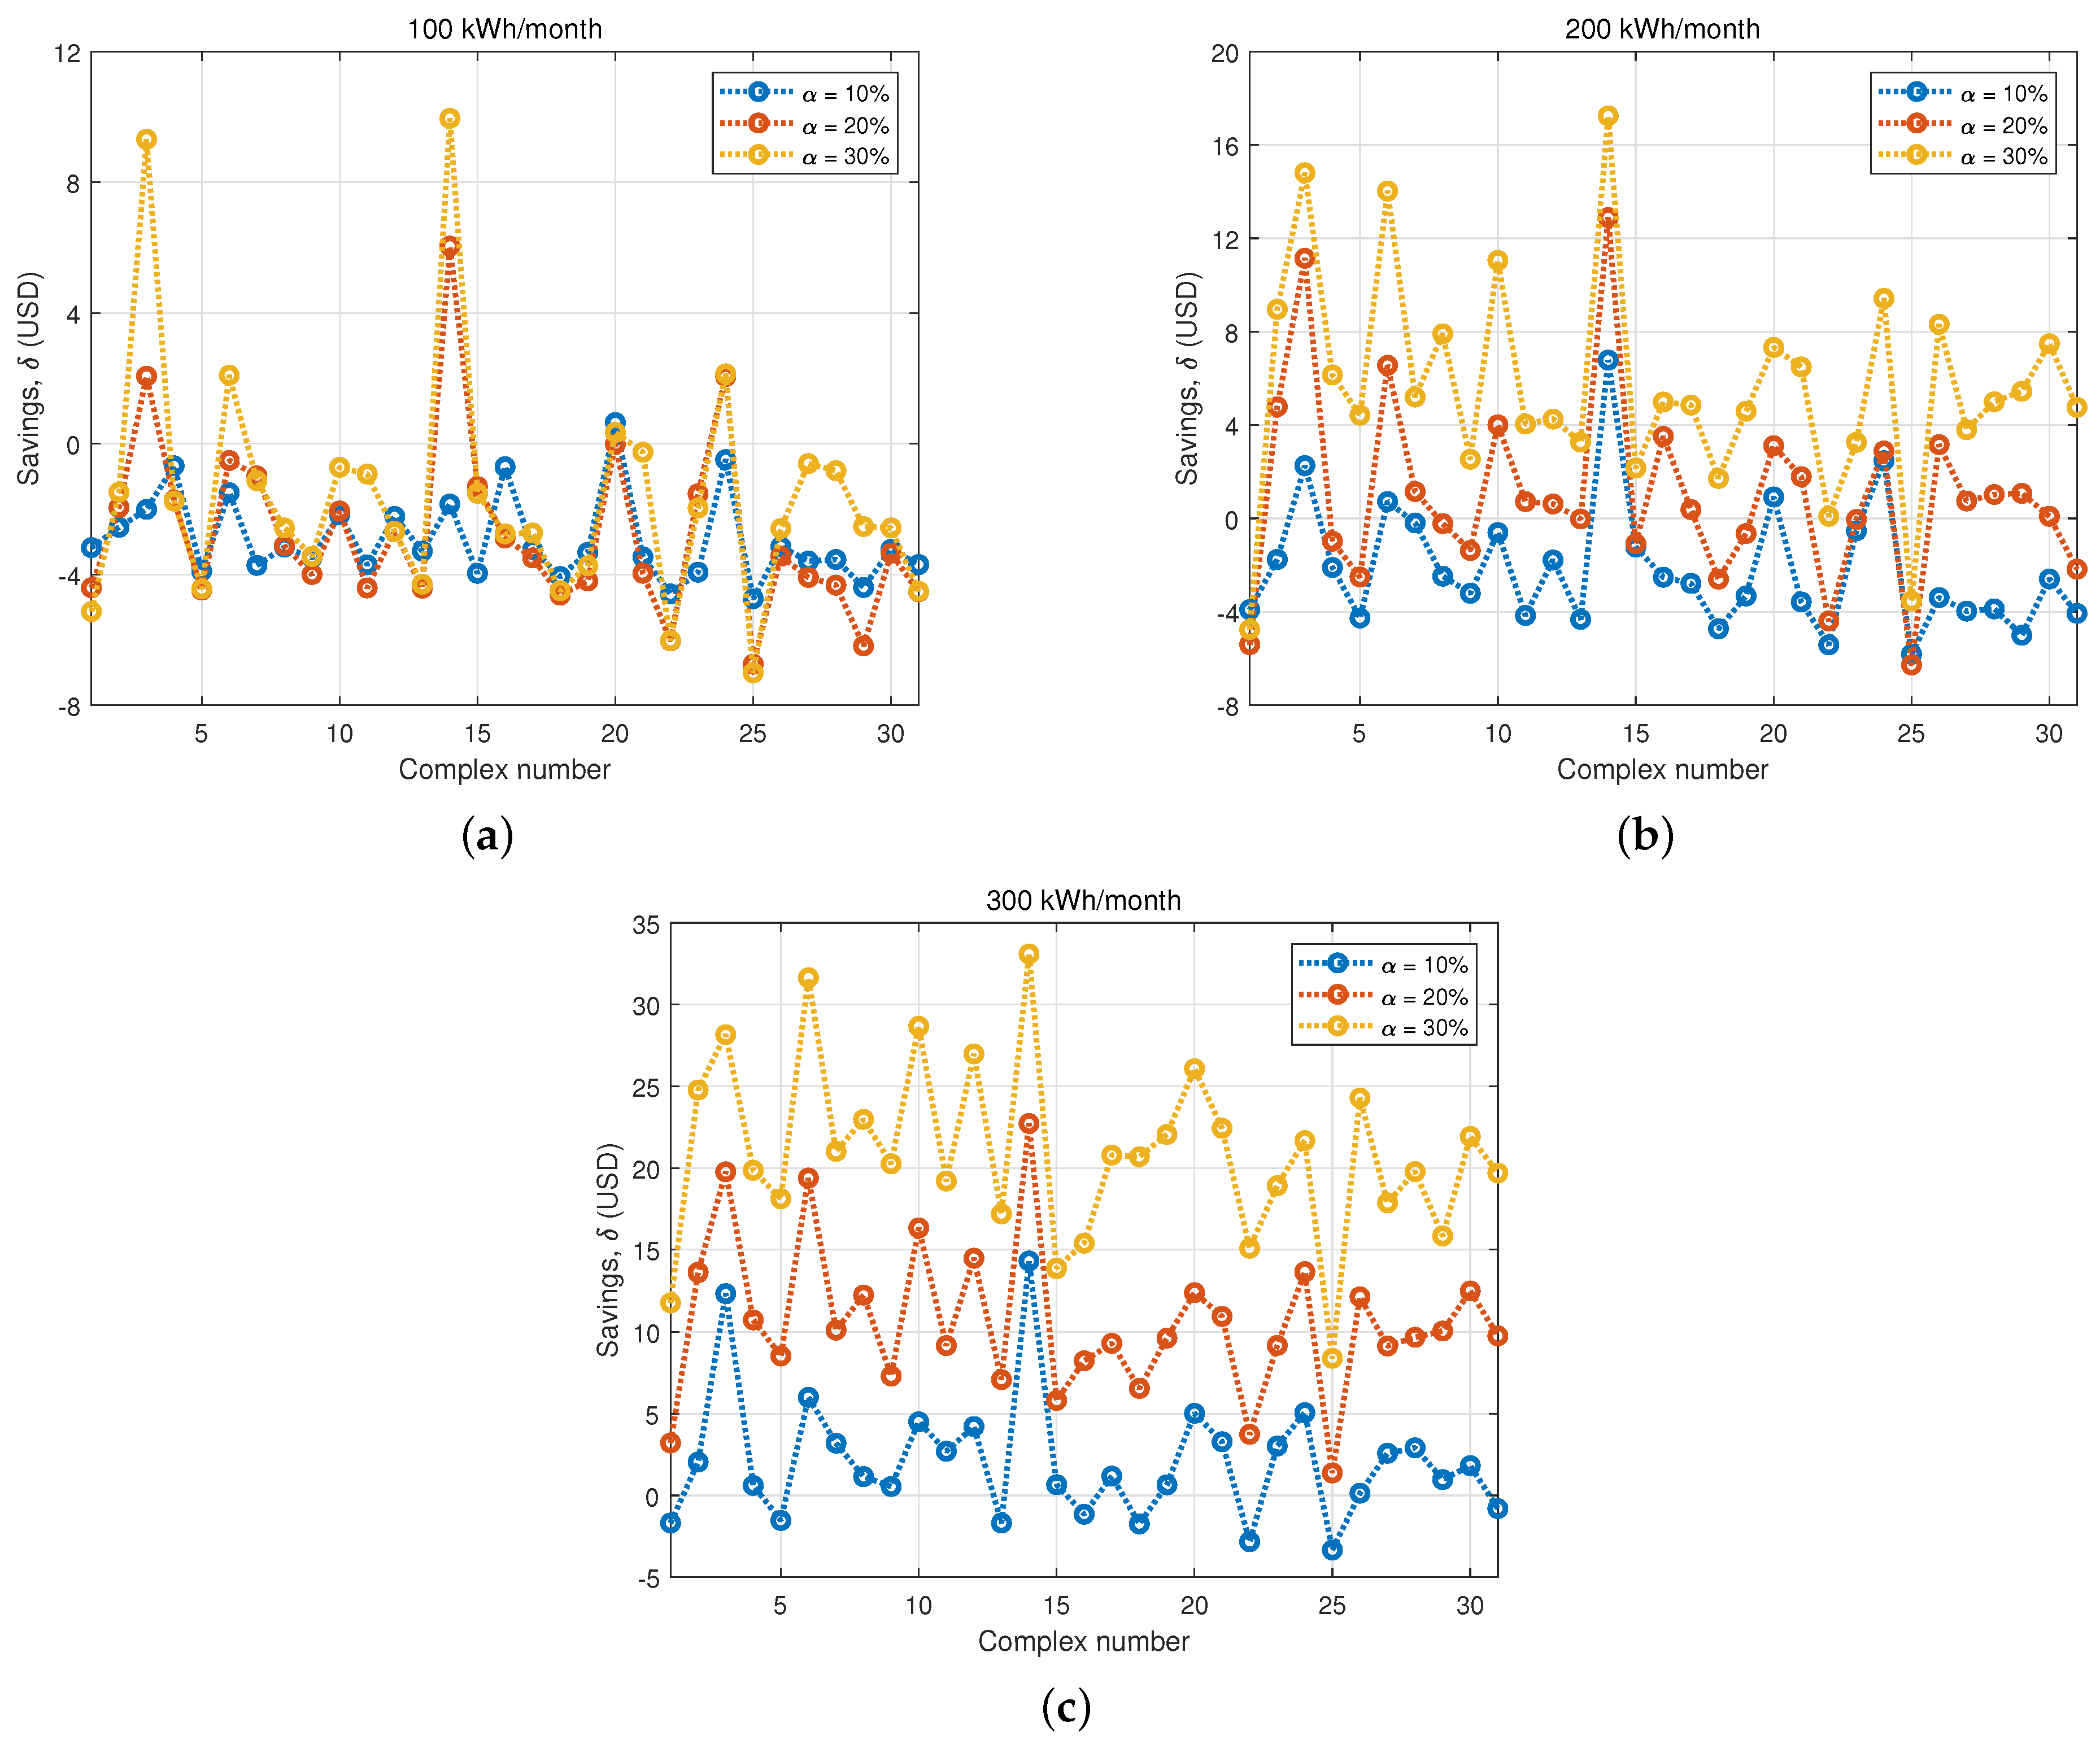
The value of δ represents the savings in common area electricity charges for households that do not reduce their usage. If δ is positive, it indicates that households that do not reduce their usage also experience a reduction in their charges, leading to a decrease in their monthly bills. Conversely, if δ is negative, it results in an increase in the monthly bills for these households.
Figure 11 shows the savings δ for households that did not reduce their usage within the 31 apartment complexes. The savings for non-reducing households are obtained when α % of households in each complex reduced their usage per month σ . From Figure 11a, it is observed that when the usage reduction for selected households is small (100 kWh) or the percentage of households reducing usage is low (10%), the remaining households, except for Complex 20, do not experience any savings; instead, their bills increase. On the other hand, from Figure 11c, when the usage reduction for selected households is large (300 kWh) or the percentage of households reducing usage is high (30%), it is observed that the remaining households also save on their bills. It is noted that when the usage reduction of a complex is large (300 kWh and α = 30%), the savings can reach up to approximately USD 33/year (Complex 14). On the other hand, in case that households that do not reduce usage are required to pay higher bills, the largest value is approximately USD 7/year ( δ = 7 ), as seen in Figure 11a, with α = 30% in Complex 25.
So far, bill savings for households were analyzed when selected households reduced their electricity consumption. Electric heaters, air conditioners, induction ranges, and so on, are appliances that consume a lot of power [20]. If savings are significant, households will attempt to reduce their electricity consumption, even at the cost of some inconvenience. However, it is not easy for households to reduce their monthly electricity usage by more than 100 kWh. Therefore, due to the limitations of reducing electricity usage through savings alone, it is necessary for households to generate their own electricity to further reduce their net electricity consumption. Among the various methods of renewable energy, a photovoltaic (PV) system is a viable option due to its relatively low installation and operation costs, especially for households. The amount of electricity that can be generated using a PV system is provided in Appendix A. As analyzed in Appendix A, 100 kWh/month can be generated using two PV panels.

5. Conclusions

The most of apartment complexes receive electricity under the SC in the Republic of Korea. The SC employs a progressive system. Therefore, to determine the savings on electricity bills resulting from a reduction in household electricity usage, it is necessary to know the household’s monthly electricity consumption. Additionally, in apartment complexes, each household’s electricity bill includes a shared charge for common area electricity usage. Consequently, the relationship between a reduction in a household’s electricity usage and the resulting savings on the electricity bill is quite complex.
In this paper, electricity meter data from 13,332 households of 31 apartment complexes were collected over two years; when the SC was applied, the savings in electricity bills achieved by reducing household electricity usage were analyzed from both the complexes’ and individual household perspectives. When households were sorted by the amount of savings in a descending order, the distribution was found to follow a negative exponential curve, indicating that the benefits from reducing electricity usage in households with higher savings were significantly larger compared to those in the middle or lower range. We analyzed the bill savings when electricity usage reductions were selectively applied to the top 10%, 20%, and 30% of households with the largest savings. From the results, it was found that the largest savings in electricity bills for households were achieved when usage reductions were applied to the top 10% of households. It is expected that this amount of savings would encourage households to reduce their electricity consumption.
Additionally, when electricity usage reductions were applied to selected households, it was found that the savings for the complexes and the total savings for the selected households were not the same. As a result, it was observed that when the usage reduction of selected households is small ( σ = 100 kWh) or the proportion of households reducing usage is low ( α = 10 % ), the common area charges for non-reducing households tend to increase, leading to higher electricity bills. On the contrary, when the usage reduction of selected households is large ( σ 200 kWh) or the proportion of households reducing usage is high ( α 20 % ), the common area charges for non-reducing households tend to decrease, resulting in lower electricity bills.
There are limitations to ways in which a passive reduction can be achieved, which focus solely on reducing electricity consumption to lower bills. If an active reduction approach is adopted, where a household uses a PV energy generator to partially cover its electricity usage, it is expected that the net electricity consumption could be significantly reduced without requiring much effort to reduce or stop it using home appliances. Further research is needed to analyze the installation costs of PV systems, the amount of electricity generated, and the resulting savings on electricity bills. Additionally, research on the methods and effects of reducing electricity charges when combined with microgrids that include PV and energy storage systems is also necessary.

Author Contributions

Y.M.C. conducted analyses and simulations using energy meter data, and organized and refined the manuscript. B.J.C. collected energy meter data, derived the issues related to bill savings, and organized and refined the manuscript. D.S.K. conducted analyses and simulations on photovoltaic energy generation, and organized and refined the manuscript. All authors have read and agreed to the published version of the manuscript.

Funding

The work of Beom Jin Chung was supported by the Korea Institute of Energy Technology Evaluation and Planning (KETEP) through the Ministry of Trade, Industry & Energy (MOTIE) of the Republic of Korea under grants RS-2024-00418486 and RS-2023-00236325. The work of Young Mo Chung was financially supported by Hansung University.

Data Availability Statement

The original contributions presented in the study are included in the article, further inquiries can be directed to the corresponding author.

Conflicts of Interest

The authors declare no conflicts of interest.

Abbreviations

The following abbreviations are used in this manuscript:
AMIadvanced metering infrastructure
GCgeneral contract
HVhigh voltage
KEPCOKorea Electric Power Corporation
KMAKorea Meteorological Administration
LVlow voltage
PVphotovoltaic
SCsingle contract
TOUtime of use

Appendix A. Photovoltaic (PV) Solar Energy Generation
Using PV solar panels, a renewable energy source, each household in an apartment complex can generate electricity for its own use. In this appendix, we conducted a simulation experiment to see how much electricity can be generated when using PV panels given in the Seoul area of the Republic of Korea.
For the simulation of PV energy generation, a simple method of calculating energy generation using monthly solar radiation hours, denoted as T 0 (h/month), was used. The performance of PV panels varies with temperature, and the power generation decreases according to the power temperature coefficient γ as the temperature increases by 1 °C from 25 °C. The energy generated by a PV panel is given as
E PV = 0.6 P PV T 0 1 + t 25 + t 0 γ ( kWh / month ) ,
where P PV (kWp) is the capacity of the PV panel and t (°C) is the average ambient temperature [23,24,25]. The energy produced from the sunlight is about 60% to 70% on average, and 60% was used in (A1). In addition, the temperature of the PV energy generation system was assumed to increase by t0 = 30 °C, assuming that a constant heat flow was introduced from the outside [26]. Note that in the summer, the temperature of the solar panel rises above 60 °C, which reduces the energy generation capacity of the panel.
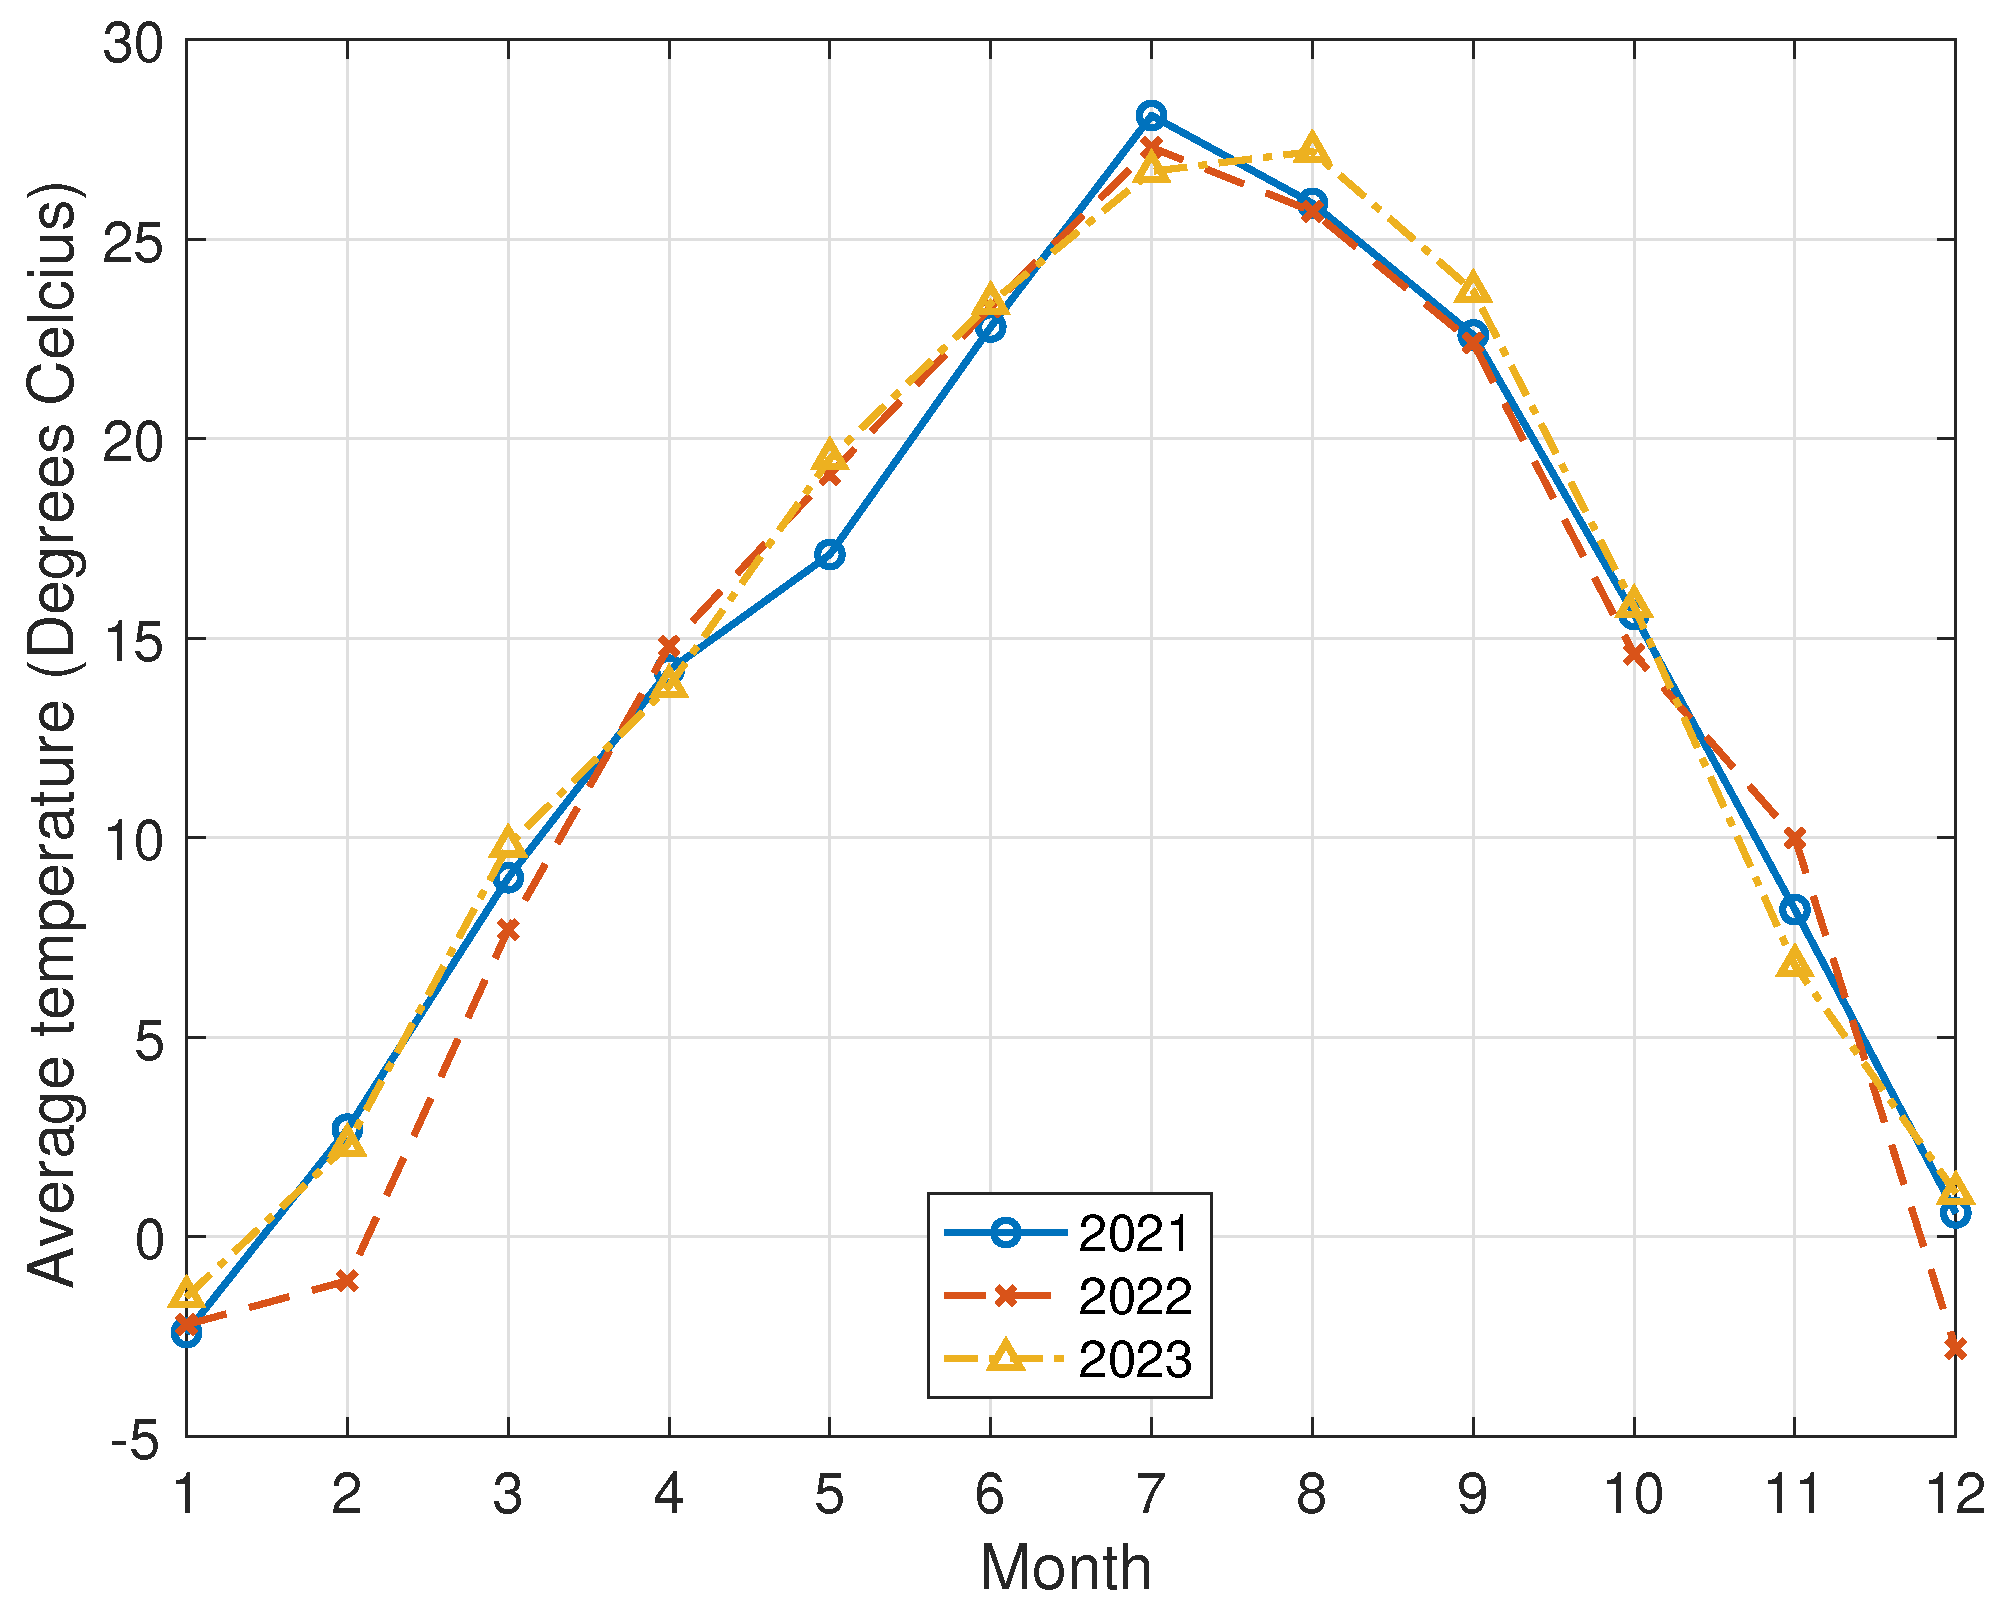
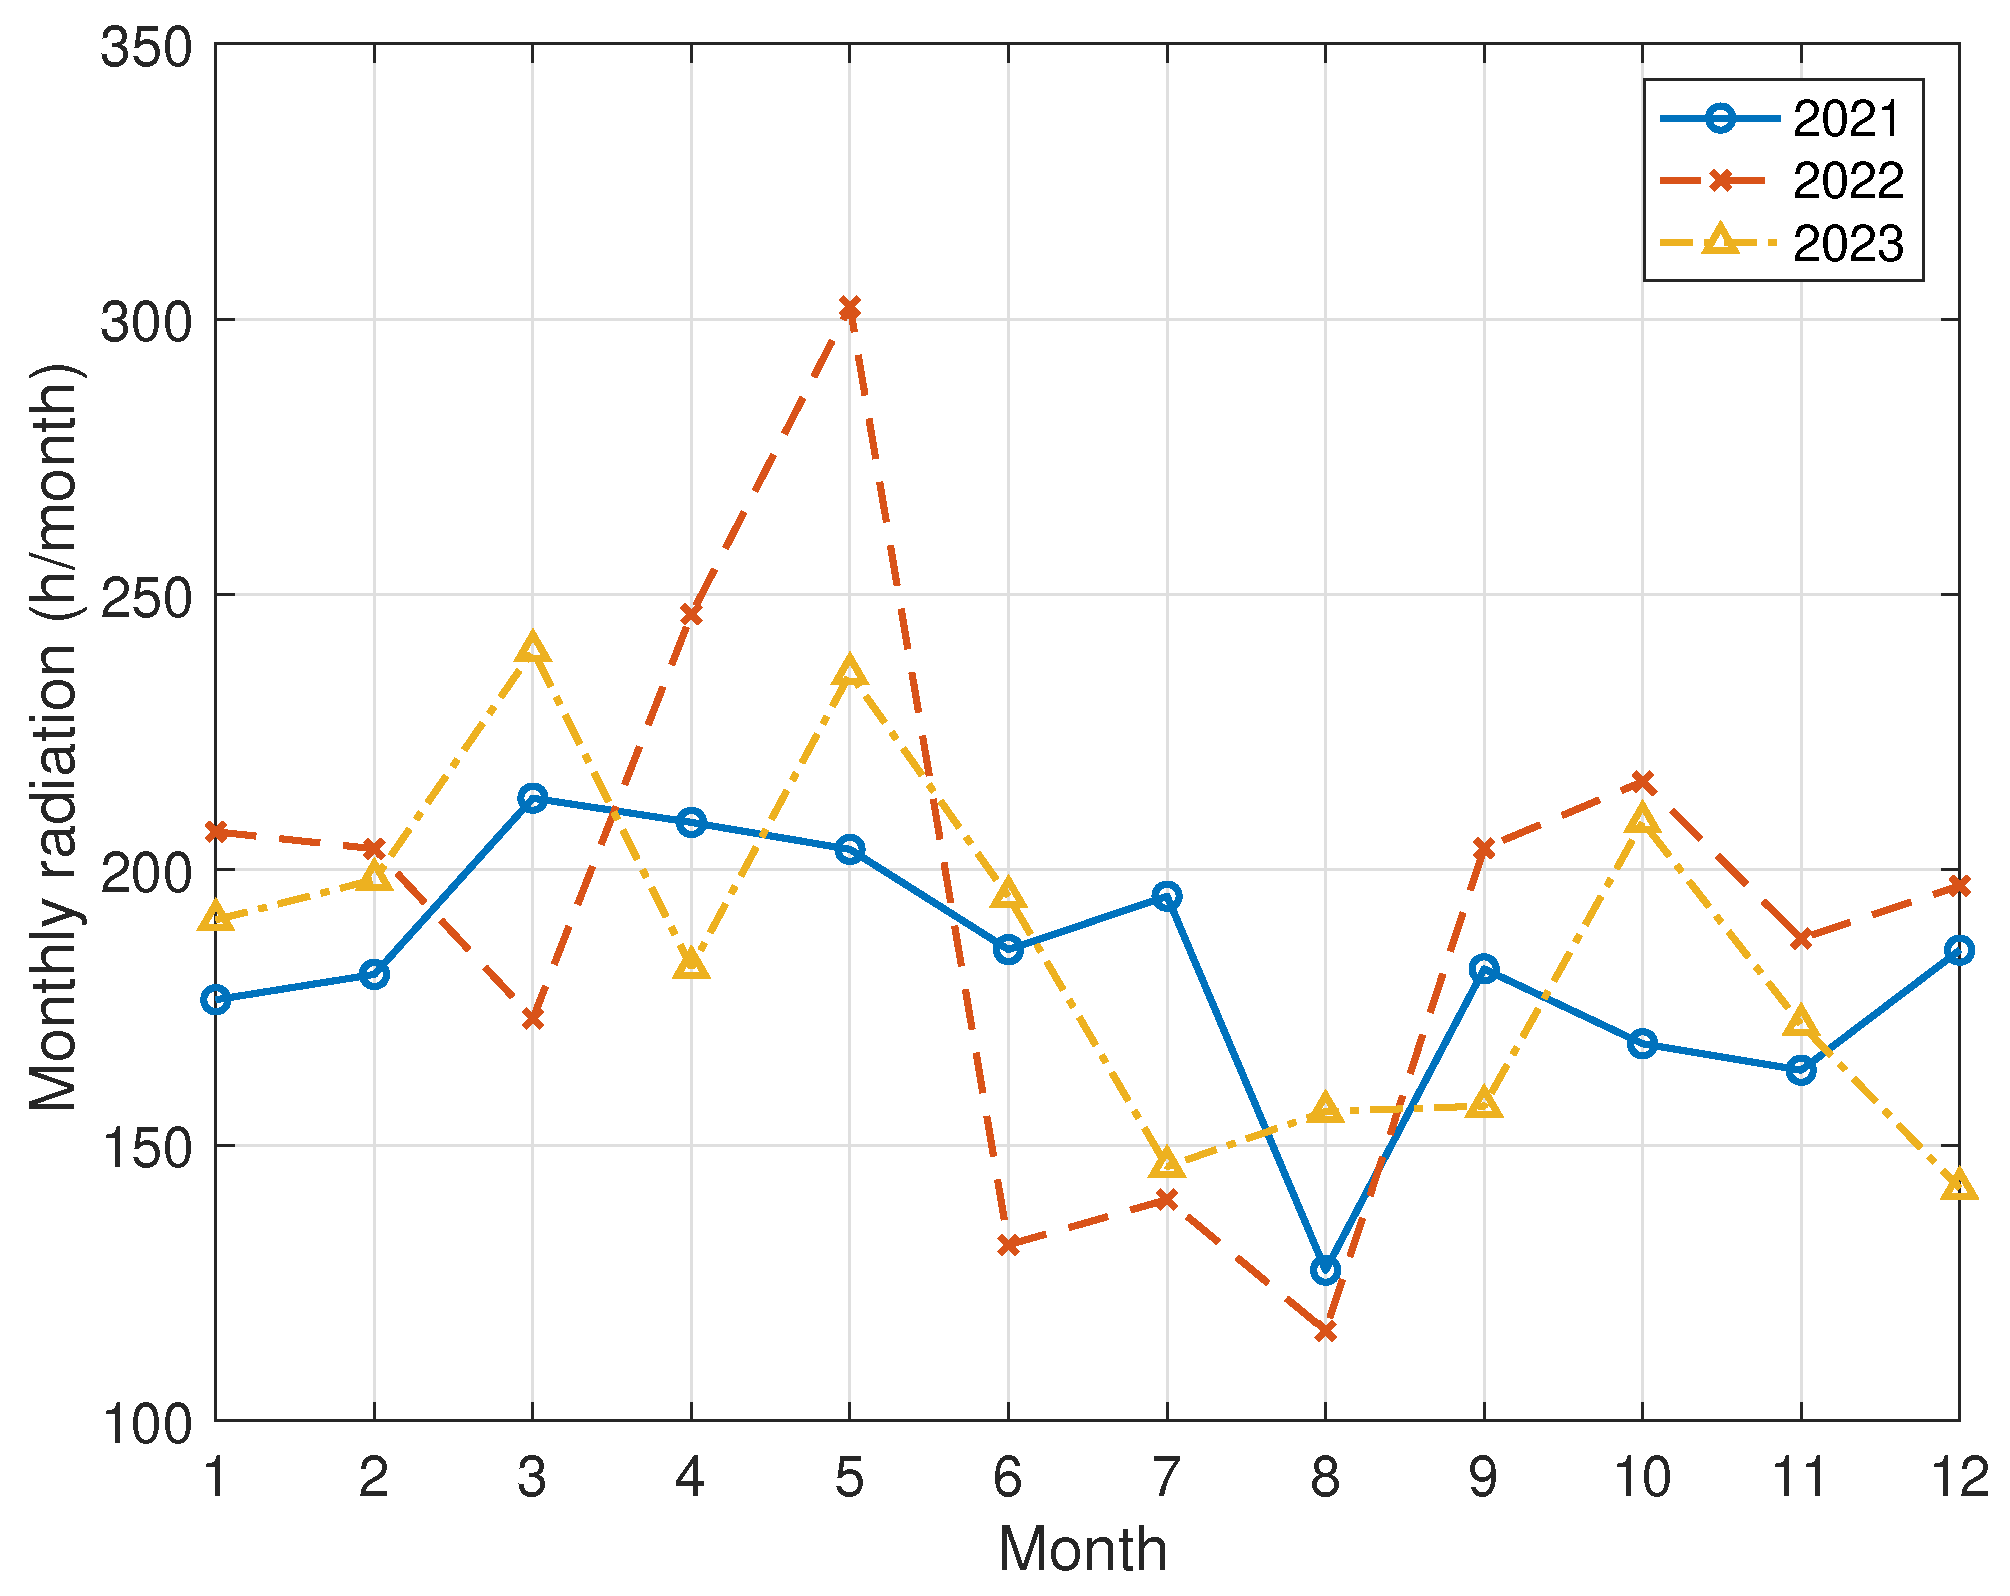
The monthly solar radiation hours T0 and average temperature t were obtained from the Korea Meteorological Administration (KMA) for the period from 2021 to 2023. Figure A1 shows the monthly solar radiation hours in Seoul, Republic of Korea, from 2021 to 2023. We observed that the solar radiation hours are longest in the spring (March to May) and in autumn (September to November). In addition, the monthly average temperature is shown in Figure A2. It is clear that the average temperature is highest in the summer (June to August).
Figure A1. Monthly solar radiation in Seoul, Republic of Korea (KMA, www.weather.go.kr accessed on 14 August 2024).
Energies 17 05488 g0a1
Figure A2. Average temperature in Seoul, Republic of Korea (KMA, www.weather.go.kr accessed on 14 August 2024).
Energies 17 05488 g0a2
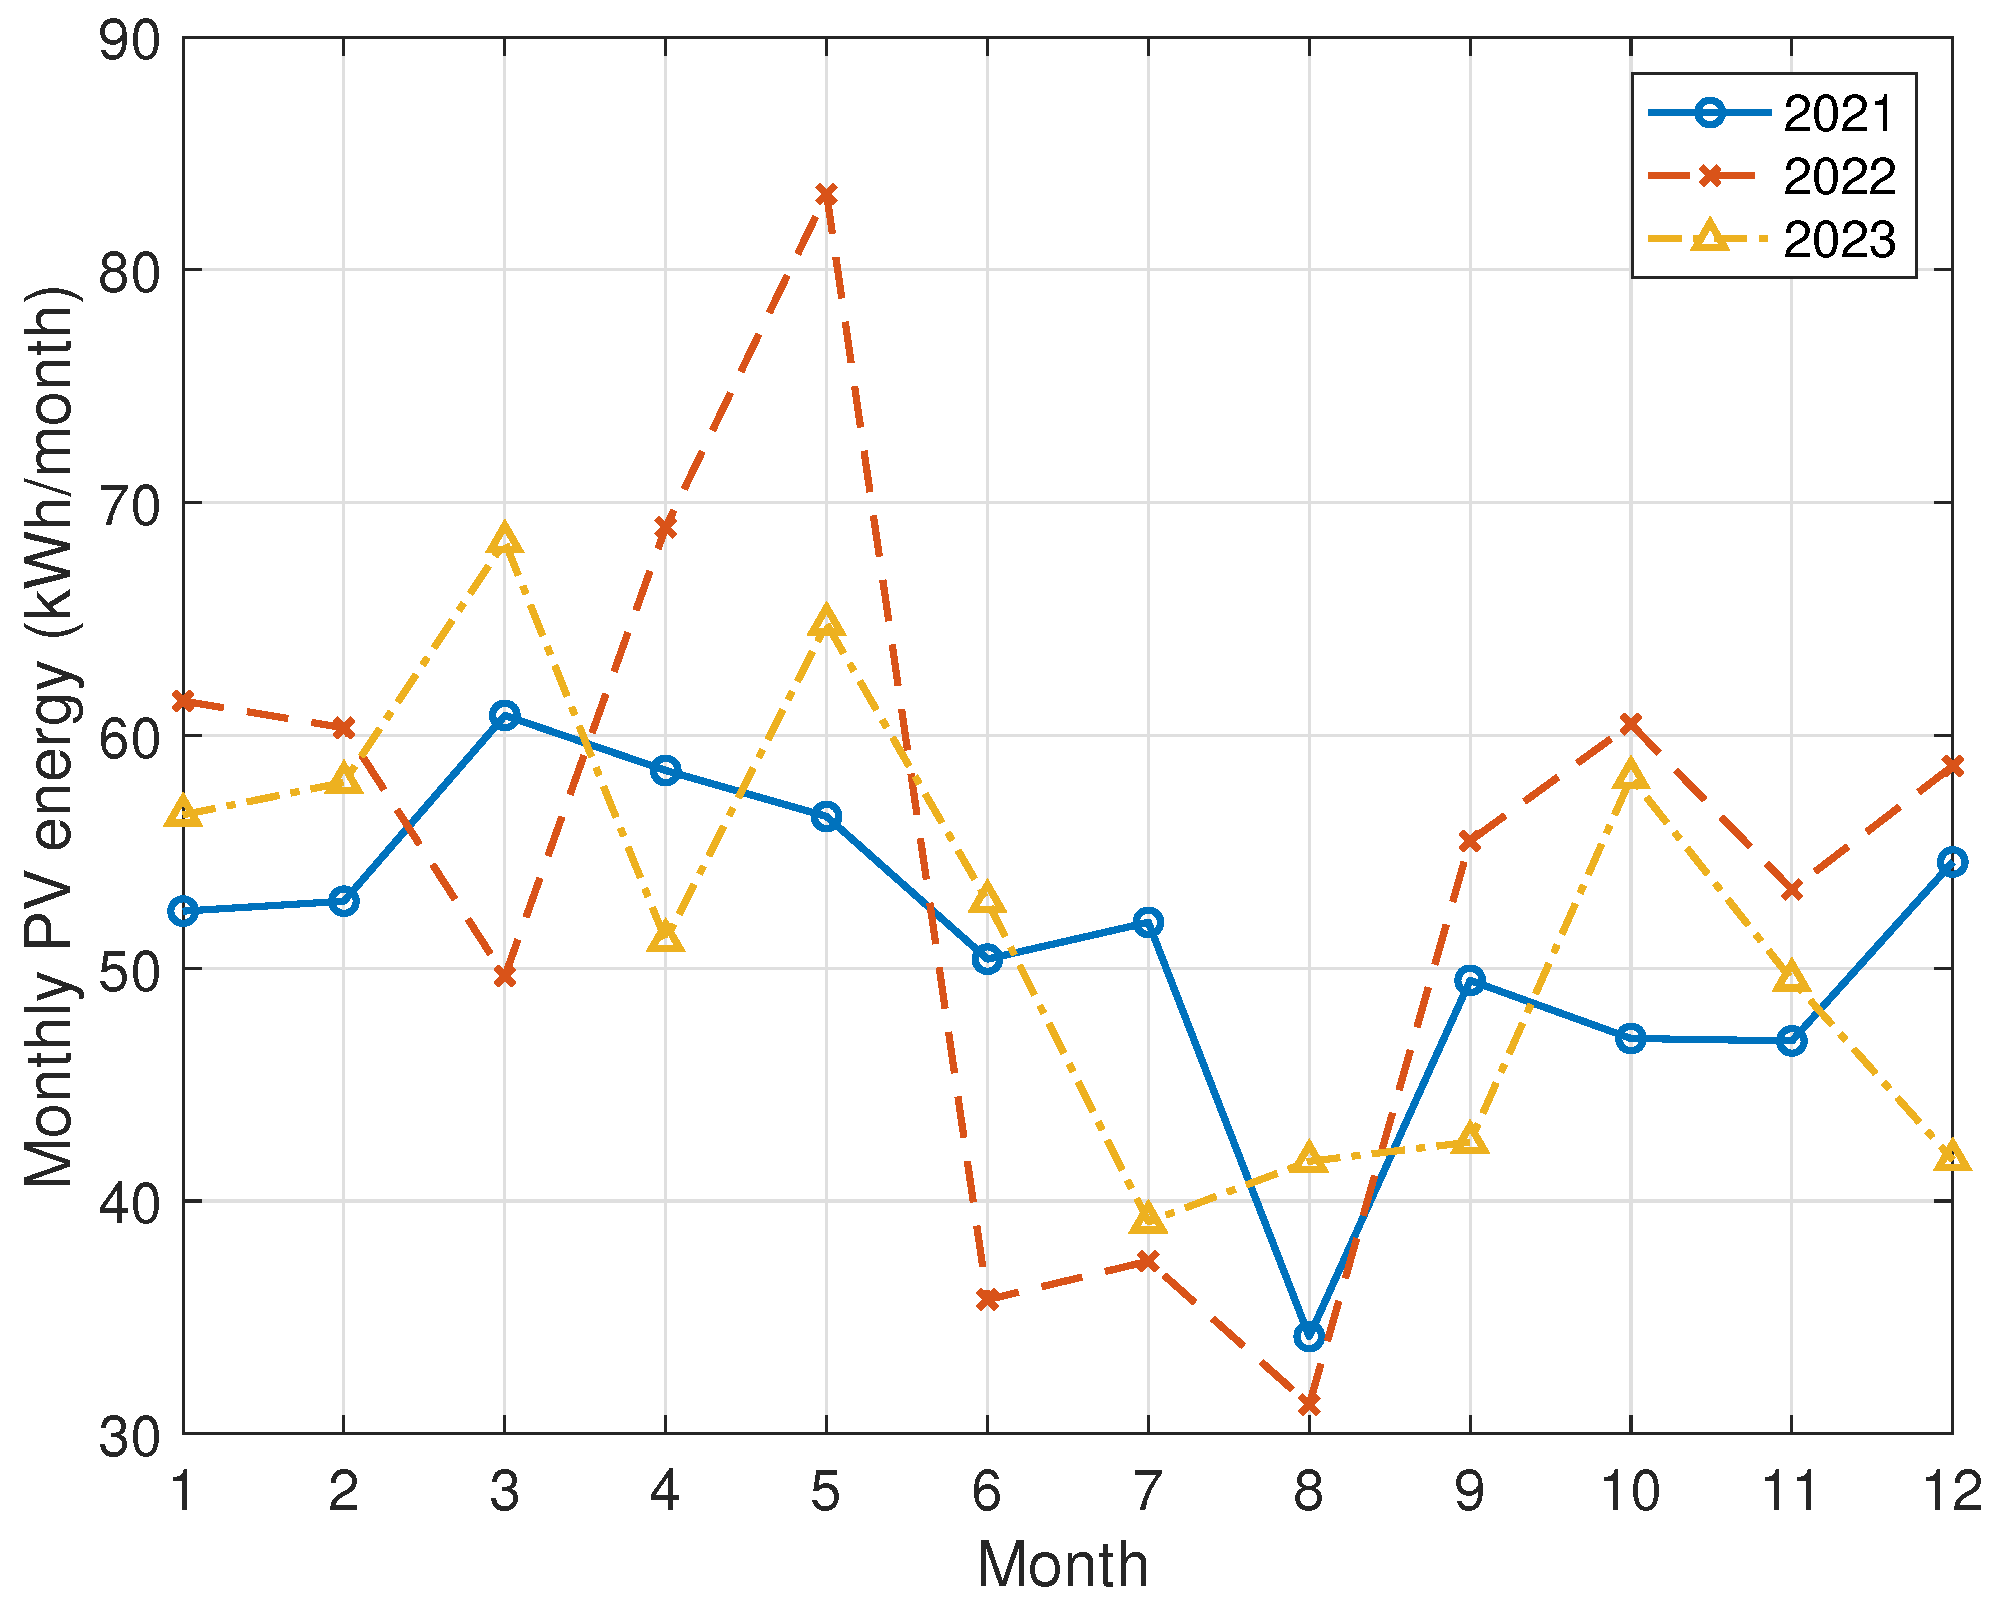
Figure A3 shows the PV energy generation produced by the simulation from (A1). Here, a single PV panel is used, Q.PEAK DUO ML-G11 series from Hanwha Corporation, Korea (qcells.com), and its capacity is 0.5 kWp. The size of one panel is 2124 mm × 1134 mm × 35 mm, and it weighs 30.5 kg. In addition, the power temperature coefficient is γ = 0.34 (%/K). We observe that the PV energy generation in May 2022 was highest due to the extended period of solar radiation, and PV energy generation was lowest in the summer months (June to August) due to factors such as higher temperatures and shorter periods of solar radiation. PV energy generation is the highest in the spring and in autumn throughout the year. We can add M PV panels to increase the total power, as follows: P PV = 0.5 M in (A1).
Figure A3. Monthly PV energy generation in Seoul, Republic of Korea.
Energies 17 05488 g0a3
For a PV panel ( M = 1 ), the average monthly PV energy production from July 2021 to June 2022 was 53.623 kWh/month, and the average monthly PV energy production from July 2022 to June 2023 was 54.0368 kWh/month.

References

  1. Kim, D.S.; Jung, W.; Chung, B.J. Analysis of the electricity supply contracts for medium-voltage apartments in the Republic of Korea. Energies 2021, 14, 293. [Google Scholar] [CrossRef]
  2. Chung, Y.M.; Kang, S.; Jung, J.; Chung, B.J.; Kim, D.S. Residential electricity rate plans and their selections based on statistical learning. IEEE Access 2022, 10, 74012–74022. [Google Scholar] [CrossRef]
  3. Zhou, S.; Matisoff, D. Advanced metering infrastructure deployment in the United States: The impact of polycentric governance and contextual changes. Rev. Policy Res. 2016, 33, 646–665. [Google Scholar] [CrossRef]
  4. DOE. AMI and Customer Systems: Results from the SGIG Program; DOE: Washington, DC, USA, 2016. [Google Scholar]
  5. World Bank Group. Survey of International Experience in Advanced Metering Infrastructure and Its Implementation; World Bank Group: Washington, DC, USA, 2018. [Google Scholar]
  6. IRENA. Time-of-Use Tariffs: Innovation Landscape Brief; IRENA: Abu Dhabi, United Arab Emirates, 2019. [Google Scholar]
  7. Barjaková, M.; Belton, C.A.; Purcell, K.; Lunn, P.D. Effective communication of time–of–use electricity tariffs: Plain and simple. Util. Policy 2024, 90, 101798. [Google Scholar] [CrossRef]
  8. Chen, Y.T. The factors affecting electricity consumption and the consumption characteristics in the residential sector—A case example of Taiwan. Sustainability 2017, 9, 1484. [Google Scholar] [CrossRef]
  9. Statistics Korea. 2023 Population and Housing Census (Register-Based Census); Statistics Korea: Daejon, Republic of Korea, 2024. [Google Scholar]
  10. KEPCO. Electricity Rate System; KEPCO: Naju, Republic of Korea, 2024. [Google Scholar]
  11. KEPCO. Basic Terms of Supply; KEPCO: Naju, Republic of Korea, 2024. [Google Scholar]
  12. Fajardy, M.; Reiner, D.M. An Overview of the Electrification of Residential and Commercial Heating and Cooling and Prospects for Decarbonisation; Univeristy of Cambridge: Cambridge, UK, 2020. [Google Scholar]
  13. Deason, J.; Borgeson, M. Electrification of buildings: Potential, challenges, and outlook. Curr. Sustain. Energy Rep. 2019, 6, 131–139. [Google Scholar] [CrossRef]
  14. Lu, S.; Ren, J. A comprehensive review on energy poverty: Definition, measurement, socioeconomic impact and its alleviation for carbon neutrality. In Environment, Development and Sustainability; Springer: Berlin/Heidelberg, Germany, 2023. [Google Scholar]
  15. Murshed, M. A regional appraisal of electricity accessibility determinants: The relevance of international remittances, clean energy, income inequality, and institutional quality. Environ. Sci. Pollut. Res. 2023, 30, 51228–51244. [Google Scholar] [CrossRef] [PubMed]
  16. Xia, L.; Chai, L.; Feng, X.; Wei, Y.; Zhang, H. Research on the driving factors and policy guidance for a reduction in electricity consumption by urban residents. Energies 2024, 17, 5122. [Google Scholar] [CrossRef]
  17. Mehdipour Pirbazari, A.; Farmanbar, M.; Chakravorty, A.; Rong, C. Short-term load forecasting using smart meter data: A generalization analysis. Processes 2020, 8, 484. [Google Scholar] [CrossRef]
  18. Shu, C.; Xu, F.; Xiang, N. Research on determinants of urban residential electricity conservation behaviors based on intervention experiment—The evidence from household survey of 4 megacities in China. In Proceedings of the 2020 International Conference on Resource Sustainability: Sustainable Urbanisation in the BRI Era, Singapore, 13–15 December 2020; pp. 205–215. [Google Scholar]
  19. Sun, Y.; Yuan, Z.; Sun, K.; Wang, B. Electricity-saving potential of residential buildings: Empirical evidence from resident habits. Energy Effic. 2023, 16, 90. [Google Scholar] [CrossRef]
  20. Chung, Y.M.; Chung, B.J.; Kim, D.S. Analysis of residential electricity usage characteristics and the effects of shifting home appliance usage time under a time-of-use rate plan. Energies 2023, 16, 6602. [Google Scholar] [CrossRef]
  21. Yu, T.; Kim, D.S.; Son, S.Y. Optimization of scheduling for home appliances in conjunction with renewable and energy storage resources. Int. J. Smart Home 2012, 7, 261–272. [Google Scholar]
  22. KEPCO. Past Electricity Rate Table (In Korean). Available online: https://online.kepco.co.kr/PRM025D00 (accessed on 24 October 2024).
  23. Evans, D. Simplified method for predicting photovoltaic array output. Sol. Energy 1981, 27, 555–560. [Google Scholar] [CrossRef]
  24. Zondag, H. Flat-plate PV-thermal collectors and systems: A review. Renew. Sustain. Energy Rev. 2008, 12, 891–959. [Google Scholar] [CrossRef]
  25. Dubey, S.; Sarvaiya, J.N.; Seshadri, B. Temperature dependent photovoltaic (PV) efficiency and its effect on PV production in the world—A review. Energy Procedia 2013, 33, 311–321. [Google Scholar] [CrossRef]
  26. Kim, D.S.; Lee, E.; Han, J.; Lee, J. Digitally controlled temperature-compensated crystal oscillator in developing low-cost radio frequency modules. Int. J. Inform. 2015, 18, 3157–3166. [Google Scholar]
Figure 1. Block diagram of the electrical supply for an apartment complex in the Republic of Korea. The electricity supplier provides electrical energy with a high voltage (HV) of 22.9 kV to apartment complexes and reads the total electricity usage W T . The management office operates and maintains a transformer that is used to step down the HV to a low voltage (LV) of 220 V. The management office also reads the household meters to acquire w k ,   k = 1 , , N . The usage of the common area is W P .
Energies 17 05488 g001
Figure 2. The average and standard deviation of the unit area for each complex.
Energies 17 05488 g002
Figure 3. Annual electricity consumption of 31 apartment complexes.
Energies 17 05488 g003
Figure 4. An example of the bills of a complex, charges for household usage, and charges for common areas (Complex 11).
Energies 17 05488 g004
Figure 5. Annual bill savings when all households in a complex reduce their electricity usage. (a) Complex savings. (b) Household savings.
Energies 17 05488 g005
Figure 6. Annual bills and savings sorted in descending order for households of 31 complexes. The line colors are presented differently for each complex. (a) Annual bills. (b) Annual savings.
Energies 17 05488 g006
Figure 7. Annual bill savings when selected households in a complex reduce their electricity usage. (a) Complex savings. (b) Household savings.
Energies 17 05488 g007
Figure 8. Annual complex bill savings when selected households in each complex reduce their electricity usage. (a) α = 10%. (b) α = 20%. (c) α = 30%.
Energies 17 05488 g008
Figure 9. Average annual household bill savings when selected households in each complex reduce their electricity usage. (a) α = 10%. (b) α = 20%. (c) α = 30%.
Energies 17 05488 g009
Figure 10. Bill saving difference between a complex and sum of reducing households. (a) σ = 100 (kWh/month). (b) σ = 200 (kWh/month). (c) σ = 300 (kWh/month).
Energies 17 05488 g010
Figure 11. Savings for households not reducing their electricity usage, δ . (a) σ = 100 (kWh/month). (b) σ = 200 (kWh/month). (c) σ = 300 (kWh/month).
Energies 17 05488 g011
Table 1. Monthly HV rate for residential usage.
Base Rate (USD)Usage Rate (USD/kWh)
B 1 B 2 B 3 R 1 R 2 R 3
0.5390.9304.4740.0780.1280.179
(730)(1260)(6060)(105.0)(174.0)(242.3)
Table 2. Summary of the apartment complexes.
Complex1234567891011
N6911521901742957002373403634321426
Area ( m 2 )33–4060–8559–11560–11559–11449–6033–8473–8559–10969–8560–115
Complex1213141516171819202122
N1755614361965041581712582051281296
Area ( m 2 )3159–1158560–12760–8560–10260–11560–11460–8560–11556–121
Complex232425262728293031
N2742234821902336853962881320
Area ( m 2 )60–8460–12459–8460–11560–8528–119108–13460–10572–127
Table 3. Maximum annual complex savings (USD).
Usage Reduction σ 100 kWh200 kWh300 kWh
Savings with usage
reduction when α = 10%
24,695
(Complex 21, Year 2)
45,530
(Complex 11, Year 1)
73,220
(Complex 11, Year 1)
Savings with usage
reduction when α = 20%
45,371
(Complex 11, Year 1)
94,956
(Complex 11, Year 1)
138,889
(Complex 11, Year 1)
Savings with usage
reduction when α = 30%
73,066
(Complex 11, Year 1)
139,043
(Complex 11, Year 1)
205,570
(Complex 11, Year 1)
Table 4. Maximum average annual household savings (USD).
Usage Reduction σ 100 kWh200 kWh300 kWh
Savings with usage
reduction when α = 10%
216
(Complex 16, Year 1)
402
(Complex 16, Year 1)
559
(Complex 16, Year 1)
Savings with usage
reduction when α = 20%
201
(Complex 16, Year 1)
378
(Complex 16, Year 1)
518
(Complex 16, Year 1)
Savings with usage
reduction when α = 30%
194
(Complex 16, Year 2)
358
(Complex 29, Year 1)
491
(Complex 16, Year 1)
Disclaimer/Publisher’s Note: The statements, opinions and data contained in all publications are solely those of the individual author(s) and contributor(s) and not of MDPI and/or the editor(s). MDPI and/or the editor(s) disclaim responsibility for any injury to people or property resulting from any ideas, methods, instructions or products referred to in the content.