Article

Influence of Gas Washing and Oil Mixing on the Phase Behavior and Physical Properties of Cambrian Light Oils in the Tazhong Uplift, Tarim Basin

1
State Key Laboratory of Organic Geochemistry, Guangzhou Institute of Geochemistry, Chinese Academy of Sciences, Guangzhou 510640, China
2
Research Institute of Petroleum Exploration & Development, PetroChina, Beijing 100083, China
3
Key Laboratory of Gas Reservoir Formation and Development, China National Petroleum Corporation (CNPC), Langfang 065007, China
4
University of Chinese Academy of Sciences, Beijing 100039, China
*
Authors to whom correspondence should be addressed.
Energies 2024, 17(21), 5494; https://doi.org/10.3390/en17215494
Submission received: 2 October 2024 / Revised: 28 October 2024 / Accepted: 30 October 2024 / Published: 3 November 2024

Abstract

:
Gas washing and oil mixing have been widely studied in the Tazhong area of the Tarim Basin, but their effects on Cambrian subsaltic dolomite reservoirs have not yet been adequately explored. In this study, the influence of gas washing and oil mixing on light oils from these reservoirs was investigated. Using n-alkane mass depletion (Q value) analysis, light oils from wells ZS1 and ZS5 were analyzed to quantify the intensity of gas washing and to identify possible oil mixing in the Cambrian Awataga (Є2a) and Wusongar (Є1w) reservoirs. Unaltered light oil was recovered and models of phase behavior were constructed by PVT simulation and basin modeling to compare with altered light oils. The results show that the light oil in well ZS1 experienced medium-strength gas washing (Q value = 40.88%), while the gas washing in well ZS5 was weaker (Q value < 40.88%), providing evidence of oil mixing. Despite these changes, the light oils in the Cambrian reservoirs maintained a single liquid-phase state over geologic time without transitioning to condensate or gas phases. These results improve the understanding of gas washing in the Tazhong area and show that it has significantly altered the Cambrian reservoirs and affected the preservation of hydrocarbons after oil accumulation.

1. Introduction

Gas washing and oil mixing have received considerable attention in recent decades due to their role in multistage generation and accumulation processes in petroleum-bearing basins [1,2,3]. These phenomena have been extensively documented in regions such as the Gulf of Mexico, offshore Taiwan, the South China Sea, the Qaidam Basin, and the Tarim Basin [1,2,4,5]. Gas washing typically occurs in oil reservoirs with substantial hydrocarbon gas charges, leading to initial mixing, physical segregation, and fractionation as lighter components migrate [3,6]. When gases enter the reservoir, lighter gases (e.g., methane and ethane) begin to split off light-hydrocarbon components (e.g., C6–C14) and migrate out of the reservoir. This process leads to changes in the physical and chemical properties in different regions of the reservoir [3,6]. Oil mixing, on the other hand, involves the introduction of multiple oil charges into the reservoirs, forming mixtures in varying proportions and altering the composition of hydrocarbons and the nature of the reservoir [2,3]. When new oil charges appear, they mix with the existing oil (e.g., between black and light oil), which leads to changes in the chemical composition and physical properties (e.g., density and viscosity) [2,3]. However, the complexity of these processes poses significant challenges to phase simulation methods when it comes to reconstructing phase states and physical properties over evolutionary history, despite extensive research on quantitative assessment of mass depletion [4,6,7].
The Tazhong area is located in the center of the Tarim Basin in northwestern China and is a hydrocarbon-rich paleo-uplift region with four major reservoir strata: Carboniferous, Silurian, Ordovician and Cambrian [2,7,8,9]. Various factors such as gas washing, oil mixing, migration fractionation, and biodegradation have contributed to the diversity of hydrocarbons and phases from the Ordovician to the Carboniferous [2]. The intensity of gas washing decreases laterally from the margin to the central horst and vertically from the Ordovician to the Carboniferous [2]. Different oil mixtures have also been observed in many reservoirs in the Tazhong area [2,9]. However, these phenomena were not well studied in the Cambrian due to the lack of exploration results until abundant light oil and gas were discovered in the wells of Zhongshen 1 (ZS1) and Zhongshen (ZS5) in the Cambrian Awatage Formation (Є2a) and Wusongar Formation (Є1w) at depths of more than 6400 m [7,10]. The breakthrough in the Cambrian reservoirs in the Tazhong area marks a significant achievement in the exploration of deep and ultra-deep oil and gas of the Tarim Basin. It has extended the targeted strata from the Ordovician down to the Cambrian, indicating potential resources in deeper and older formations than previously thought [7,10]. The study of gas washing and oil mixing in these reservoirs will fill previous research gaps that have mainly focused on the Ordovician and upper formations.
Existing studies confirm that geochemical alteration such as thermochemical sulfate reduction (TSR) and secondary cracking did not occur on a large scale in the Cambrian subsaltic dolomite reservoirs, so light oils are well preserved and remain in a single liquid phase over history [7,11]. Understanding how gas washing and oil mixing affect the evolution of hydrocarbon composition and phase in Cambrian reservoirs is critical for a comprehensive understanding of petroleum accumulation and preservation and for guiding further deep and ultra-deep exploration and development in the Tarim Basin [7]. Therefore, we focus here on the Cambrian light oils in the Tazhong Uplift of the Tarim Basin and attempt to address these challenges using phase simulation techniques that consider either gas-washing or oil-mixing effects and provide a more comprehensive understanding of the phases and properties of these oils.
In this study, we first quantitatively assessed the intensity of gas washing using a method that analyzed n-alkanes in tested light oil samples and determined the presence of oil mixing in the Cambrian reservoirs in wells ZS1 and ZS5. We then reconstructed the hydrocarbon composition of unaltered light oil to compare it with altered light oils. In addition, we built phase models with corresponding pressure–volume–temperature (PVT) properties through PVT simulation to investigate the effects of gas washing and oil mixing on phase states and physical properties, including density, viscosity, and gas–oil ratio (GOR). Finally, by combining historical reservoir temperature and pressure data (P-T path) from basin modeling [7,12], we reconstructed in situ phase states and physical properties to understand how gas washing and oil mixing have affected their evolution over geological history. By simulating gas-washing and oil-mixing phases and comparing them to the entire study area, we gained new insights into the distribution and accumulation of hydrocarbons. This approach also revealed the effects of various geologic factors on reservoir performance, including the staged evolution of phases and physical properties due to gas washing and oil mixing.

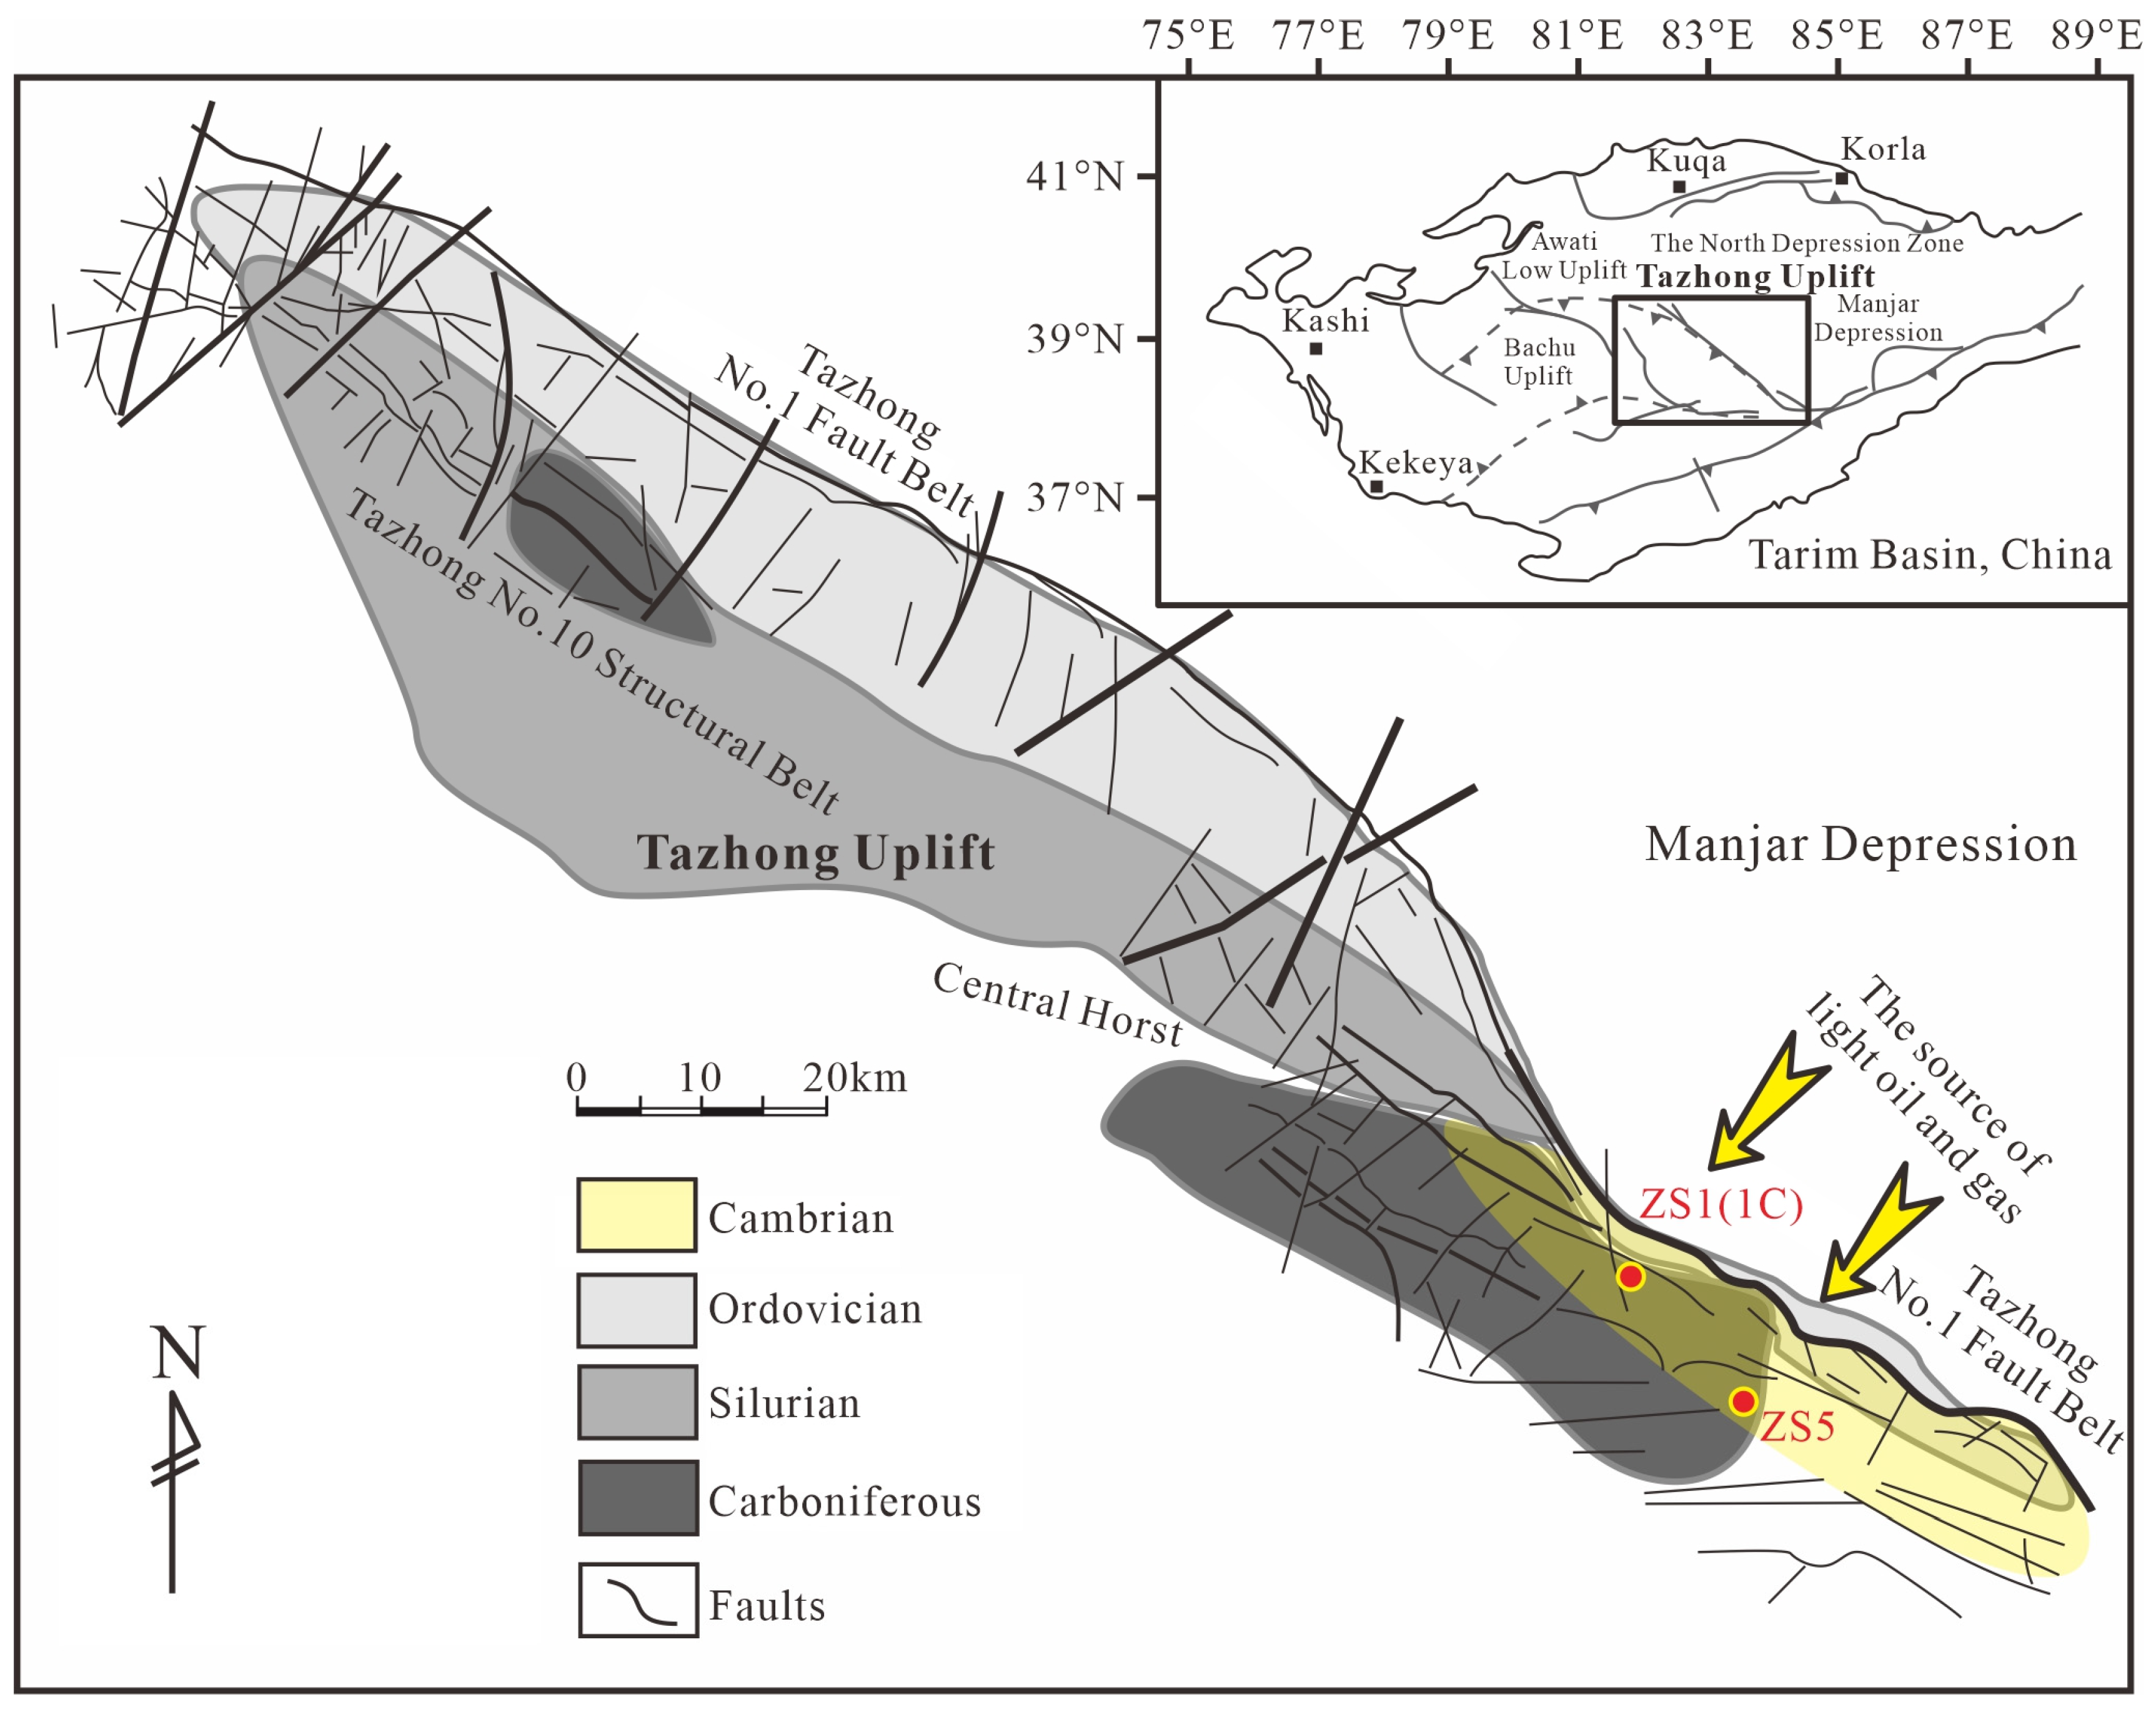
2. Geological Setting

The Tazhong Uplift, a major Paleozoic paleo-uplift within the Tarim Basin, is bounded by a series of thrust faults, including the Tazhong No.1 Fault Belt, the Tazhong No.10 Structural Belt, and the central horst (Figure 1). It developed as an inherited paleo-uplift due to fault movement in the Early Caledonian (O1–2) and fold deformation in the Late Caledonian (O3–S), forming a duplex anticline pattern [8]. The uplift underwent reformation during the Hercynian (D–P) and local adjustments after the Permian. Later, it tilted eastward, was denuded, and settled to form the present tectonic framework [13]. The numerous movements have led to repeated processes of generation, migration, accumulation, and alteration, resulting in the formation of numerous reservoirs, diverse styles, and various phases in this region.
Four major reservoirs have been developed in the Tazhong Uplift, comprising Carboniferous sandstone–limestone, Silurian sandstone, Ordovician limestone, and Cambrian subsaltic dolomite strata. Gas and condensates dominate in the Ordovician strata of the Tazhong No.1 Fault Belt, while black oil and some condensates are found in the Carboniferous strata of the central horst. The Silurian strata of the Tazhong No.10 Structural Belt contain highly biodegraded oils and some condensates. The ZS1 and ZS5 wells, which discovered light oil reservoirs in the Cambrian subsaltic dolomite, are located in the eastern Tazhong Uplift, near the Tazhong No.1 Fault Belt and Manjar Depression (Figure 1). Our study focuses on the Awatage Formation (Є2a) of well ZS1 and the Wusongar Formation (Є1w) of well ZS5, where light oils are present. Well ZS1C, a lateral well of ZS1, serves as a reference as it discovered a dry gas reservoir with some condensates in the Xiaoerbulake Formation (Є1x).
In the Tazhong area, fault systems play a vital role in the distribution of hydrocarbons. Figure 1 illustrates that these fault systems include near east–west (EW)-oriented faults and near north–south (NS)-oriented strike–slip faults. Gas is generated in the deeper strata of the Tazhong area and even in the Manjar Depression. The vertical migration and subsequent accumulation of gas are mainly controlled by the deep EW-oriented faults (e.g., Tazhong No.1 Fault Belt and No.10 Structural Belt), which are directly connected to the underlying gas sources. In addition, the gas migration process is further facilitated by the intricate interlacing of the NS strike–slip fault system with the deep EW-oriented faults. Consequently, the fault systems in the Tazhong area are crucial for regulating the occurrence of gas wash fracturing and multiple accumulations. This further study, focusing on the Cambrian reservoirs, helps to understand the importance of these fault systems for deep and ultra-deep oil and gas exploration and exploration efforts in the region.

3. Methods and Data

3.1. Samples and Experiments

Through oil and gas separators at wellheads, two light oil samples were collected from the Є2a reservoir (depth 6439–6458 m and temperature 160 °C) of well ZS1 and the Є1w reservoir (depth 6562–6671 m and temperature 156 °C) of well ZS5 in the Tazhong area. The samples were sealed in glass cell bottles immediately after collection and kept at low temperatures during transportation and storage to minimize the loss of light components as much as possible. The chromatographic analysis of the hydrocarbons was then conducted in our laboratory using a Thermo Scientific Trace GC Ultra gas chromatograph and a Thermo Scientific Trace DSQ II mass spectrometer (Thermo Fisher Scientific, Waltham, MA, USA). The gas chromatograph (GC) is used to separate and analyze the different components of a hydrocarbon mixture based on their chemical properties and retention times. The mass spectrometer (MS), on the other hand, is used to identify and quantify these components by measuring their mass-to-charge ratio and generating a mass spectrum. Samples were prepared with full deuterium nC24D50 and dichloromethane and then preserved in vials. Samples were frozen with liquid nitrogen to minimize the loss of light hydrocarbons. GC analysis provided the mole fraction of n-alkanes, which was plotted against the carbon number to obtain the distribution curve (Figure 2a,b).

3.2. Quantitative Assessment of Gas Washing and Oil Mixing

We used a quantification method in which the Q value defines the mass loss of n-alkanes from an analyzed oil compared to its unaltered oil. The calculation of the Q value is based on the principle that gas washing typically dissolves and removes low-carbon alkanes in the gas phase but does not change the distribution of high-carbon n-alkanes. The exponential relationship between the molar concentration of n-alkanes and the carbon number in unaltered oil is as follows:
l g M C n = a × n + l g ( A )
where MC(n) is the molar concentration of the n-alkane; A is the normalization factor; and a is the distribution parameter, also known as the slope factor [5,6,14].
Based on this equation, the slope factor and breakpoint of carbon numbers were used to identify and evaluate the gas-washing effect in real reservoirs [5,6]. In addition, the n-alkane mass loss caused by gas washing was calculated using the following function [6]:
Q = 1 W n ( r e a l i t y   o i l ) / W n ( r e a l i t y   o i l )
where the Q value defines the n-alkane mass depletion from an analyzed oil relative to its unaltered oil. Wn is the mass percent of the n-alkane, which can be derived from the following equation:
W n = W C ( n ) = M n × 10 l g [ M C ( n ) ]
where WC(n) is the weight concentration of each component, and M(n) is the mass number of the corresponding component (Table 1).

3.3. Quantitative Calculations and Numerical Simulations

The key steps here include qualitative assessments of gas washing and oil mixing, reconstruction and analysis of unaltered light oil, PVT simulation, and analysis with basin modeling. Since oil mixing leads to a relative enrichment of medium-molecular-weight n-alkanes and a relative decrease in high-molecular-weight n-alkanes, the carbon number breakpoint of mixed samples is significantly lower than that of gas washing, indicating obvious oil mixing [2]. Therefore, the method based on n-alkane distributions cannot reconstruct unaltered oils for mixed oils, but it can qualitatively evaluate the oil mixing process. Since the light oil in well ZS1 is mainly composed of saturated hydrocarbons (n-alkanes) [7,10,11], the unaltered light oil was assumed to follow an exponential distribution from C1 to C30. Therefore, Equation (3) could also be used to calculate the hydrocarbon composition of unaltered light oil and then compare it with altered light oils, where we discriminated the fluid properties by different empirical statistical methods [15]. In addition, the PVTsim software (PVTsim v10.0) developed by Calsep A/S (Copenhagen, Denmark) was used to build phase models and calculate the corresponding physical properties such as density, viscosity, and GOR. PetroMod2016, developed by Schlumberger (Houston, TX, USA), was used for basin modeling and data extraction for reservoir temperature and pressure. Detailed workflows can be found in a published article [7].

4. Results

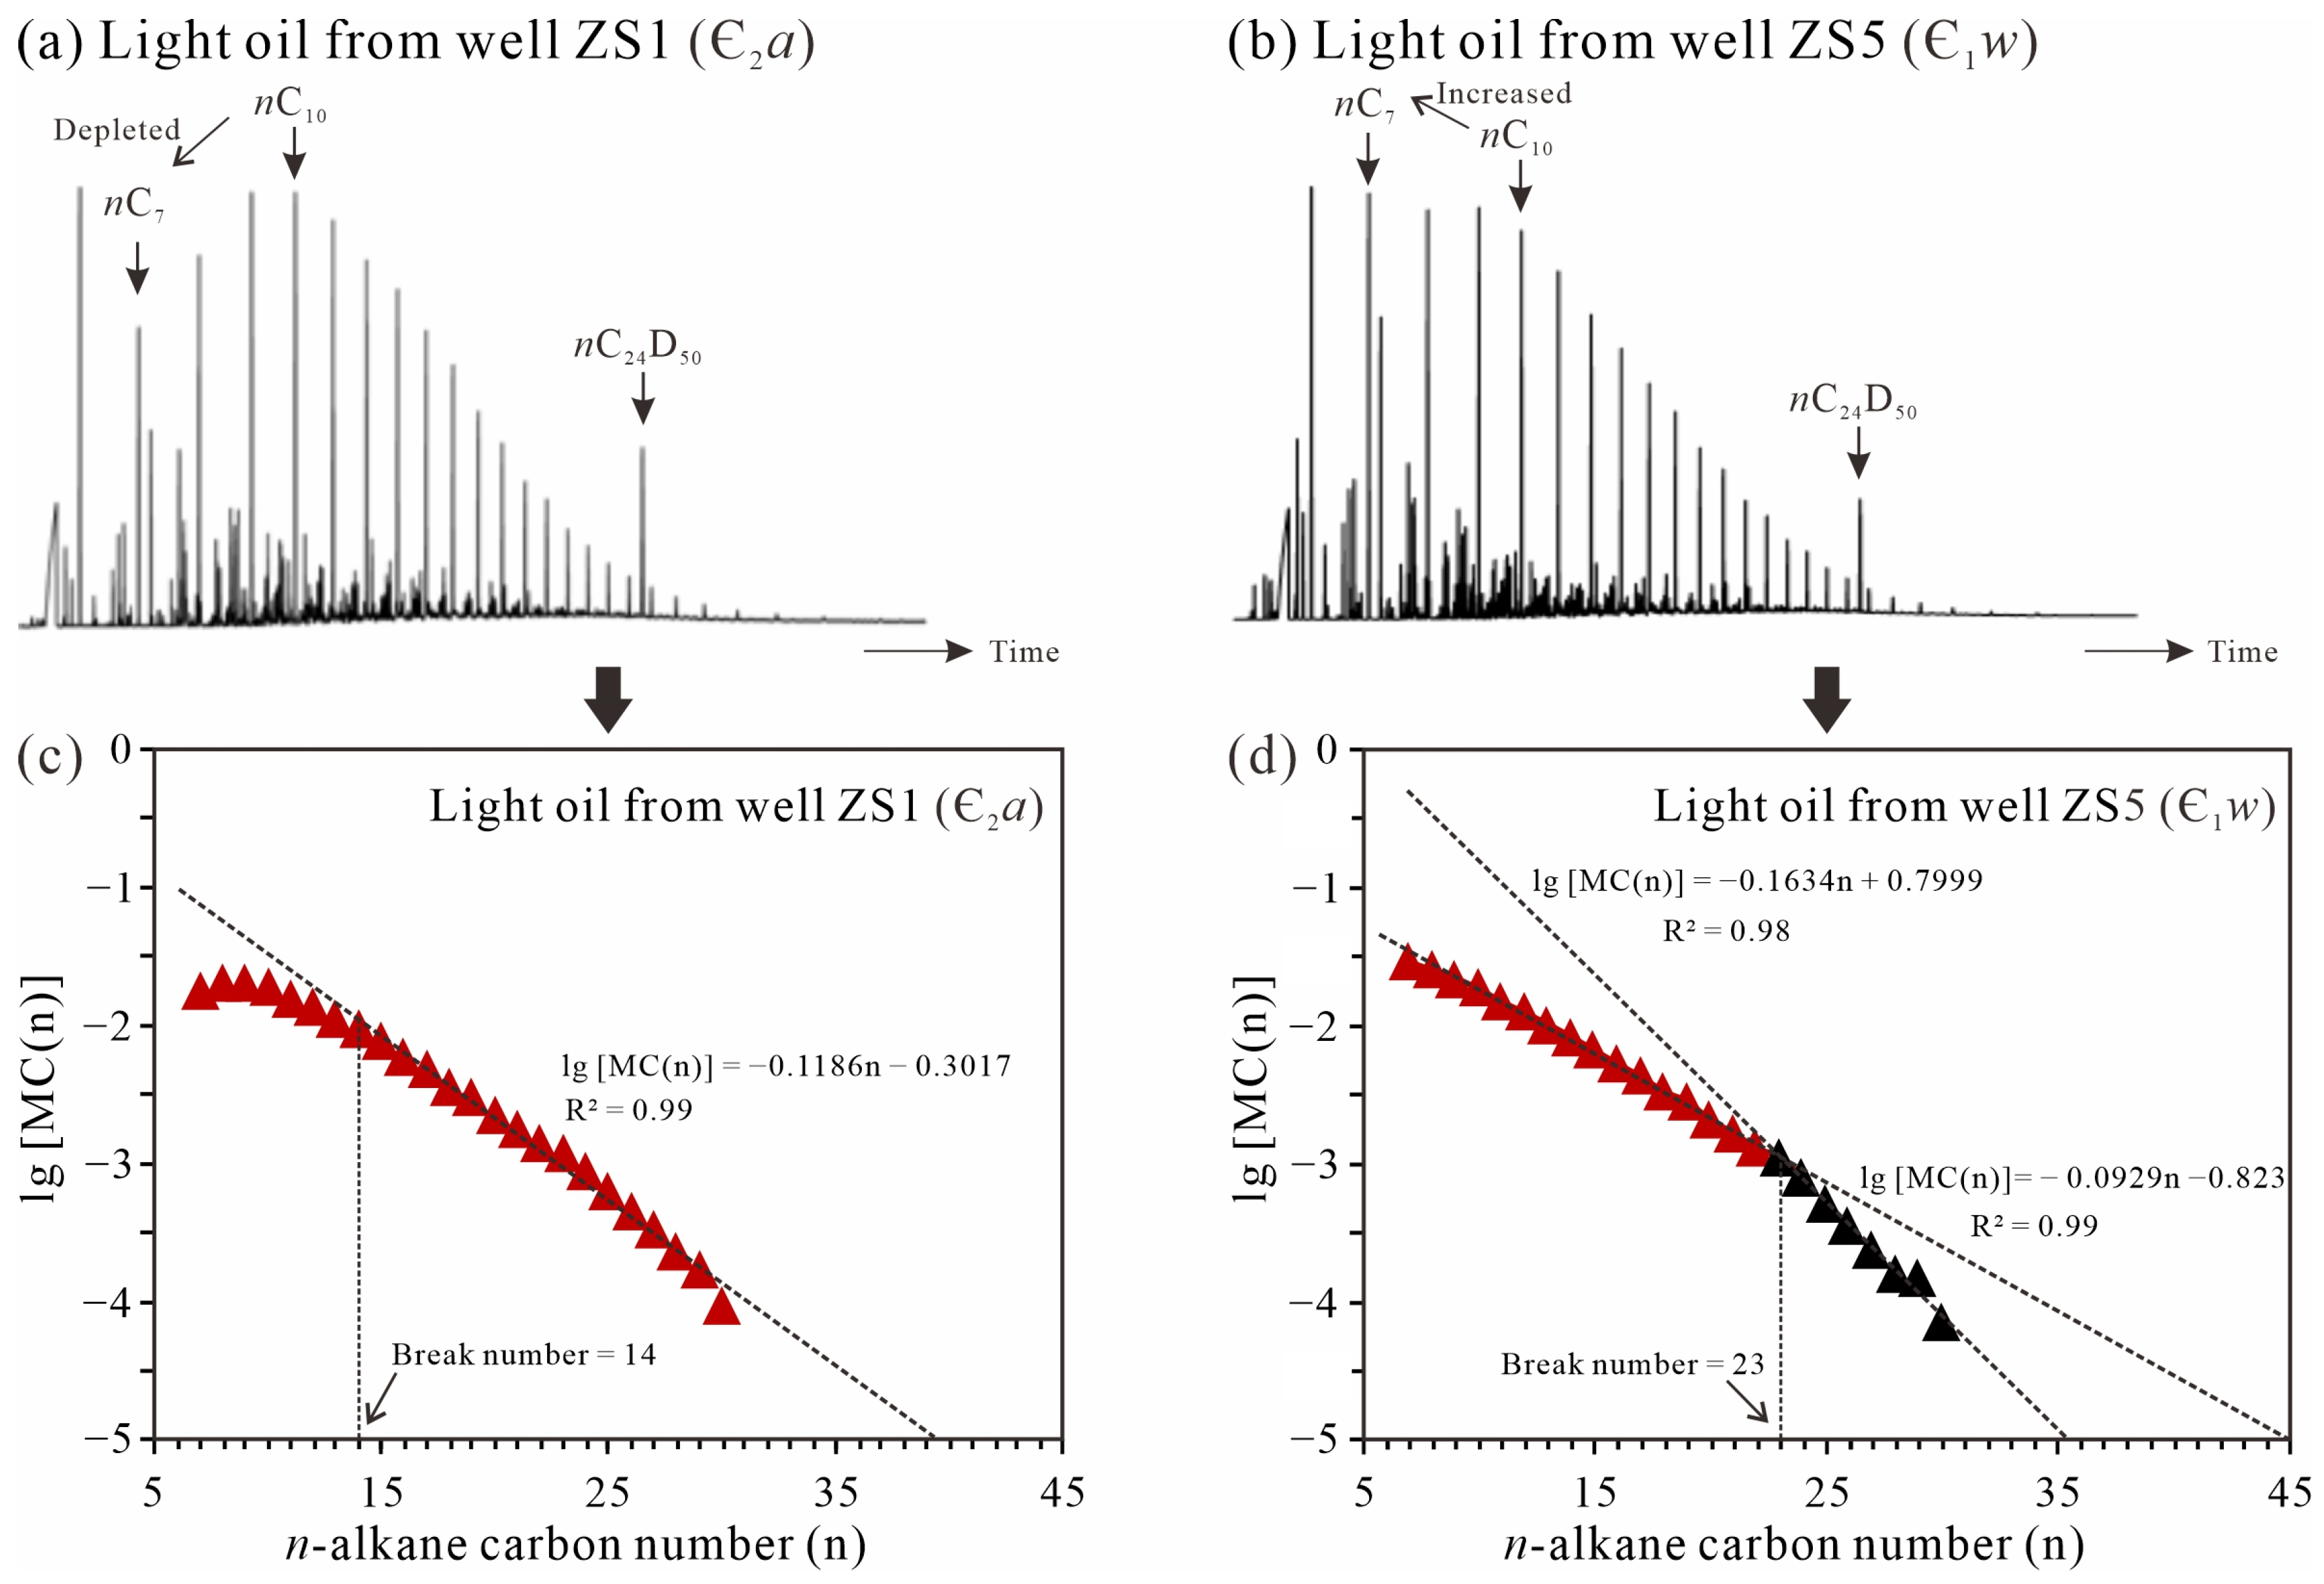
4.1. Relationship Between Molar Concentration and Carbon Number of n-Alkanes

Quantitative analysis of the light oils by gas chromatography (GC) showed that biodegradation and dilution were negligible in both oil samples, and the influences of other alterations could be excluded (Figure 2a,b). Therefore, the relationship between the molar concentration of n-alkanes and their carbon number in the light oils from wells ZS1 and ZS5 can be used to recover the original pattern. Plotting shows the relationship between the molar concentration of n-alkanes and their carbon number for the light oil samples from wells ZS1 and ZS5 (Figure 2c,d). The simulation lines were calculated based on the highest R2 values, which reached 0.99, as reported by Meulbroek et al. (1998) [5].
In well ZS1, the break number for n-alkanes is 14, which indicates that the light carbon numbers of n-alkanes (nC7–nC14) have undergone mass depletion due to gas washing (Figure 2c). The higher-carbon n-alkanes (nC15+) were not affected by either gas washing or oil mixing (Figure 2c). This indicates that the light oil sample from ZS1 did not change by oil mixing and was primarily affected by gas washing, which allowed for the calculation of the mass degradation of n-alkanes (Q value). In contrast, the simulation line for well ZS5 shows a break number of n-alkanes at 23 (Figure 2d), nine carbon points higher than for ZS1 (Figure 2c). This indicates a slight mass depletion in the light n-alkanes and a significant alteration in the higher-carbon n-alkanes, probably due to oil mixing. Consequently, the light oil from ZS5 showed characteristics of oil mixing, and its Q value could not be accurately determined using the same method as ZS1. Further GC analyses of wells ZS1 and ZS5 confirmed this: the former showed a continuous decrease in n-alkanes from nC10 to nC7 (Figure 2a), while the latter showed a bimodal distribution with an upward trend (Figure 2b).

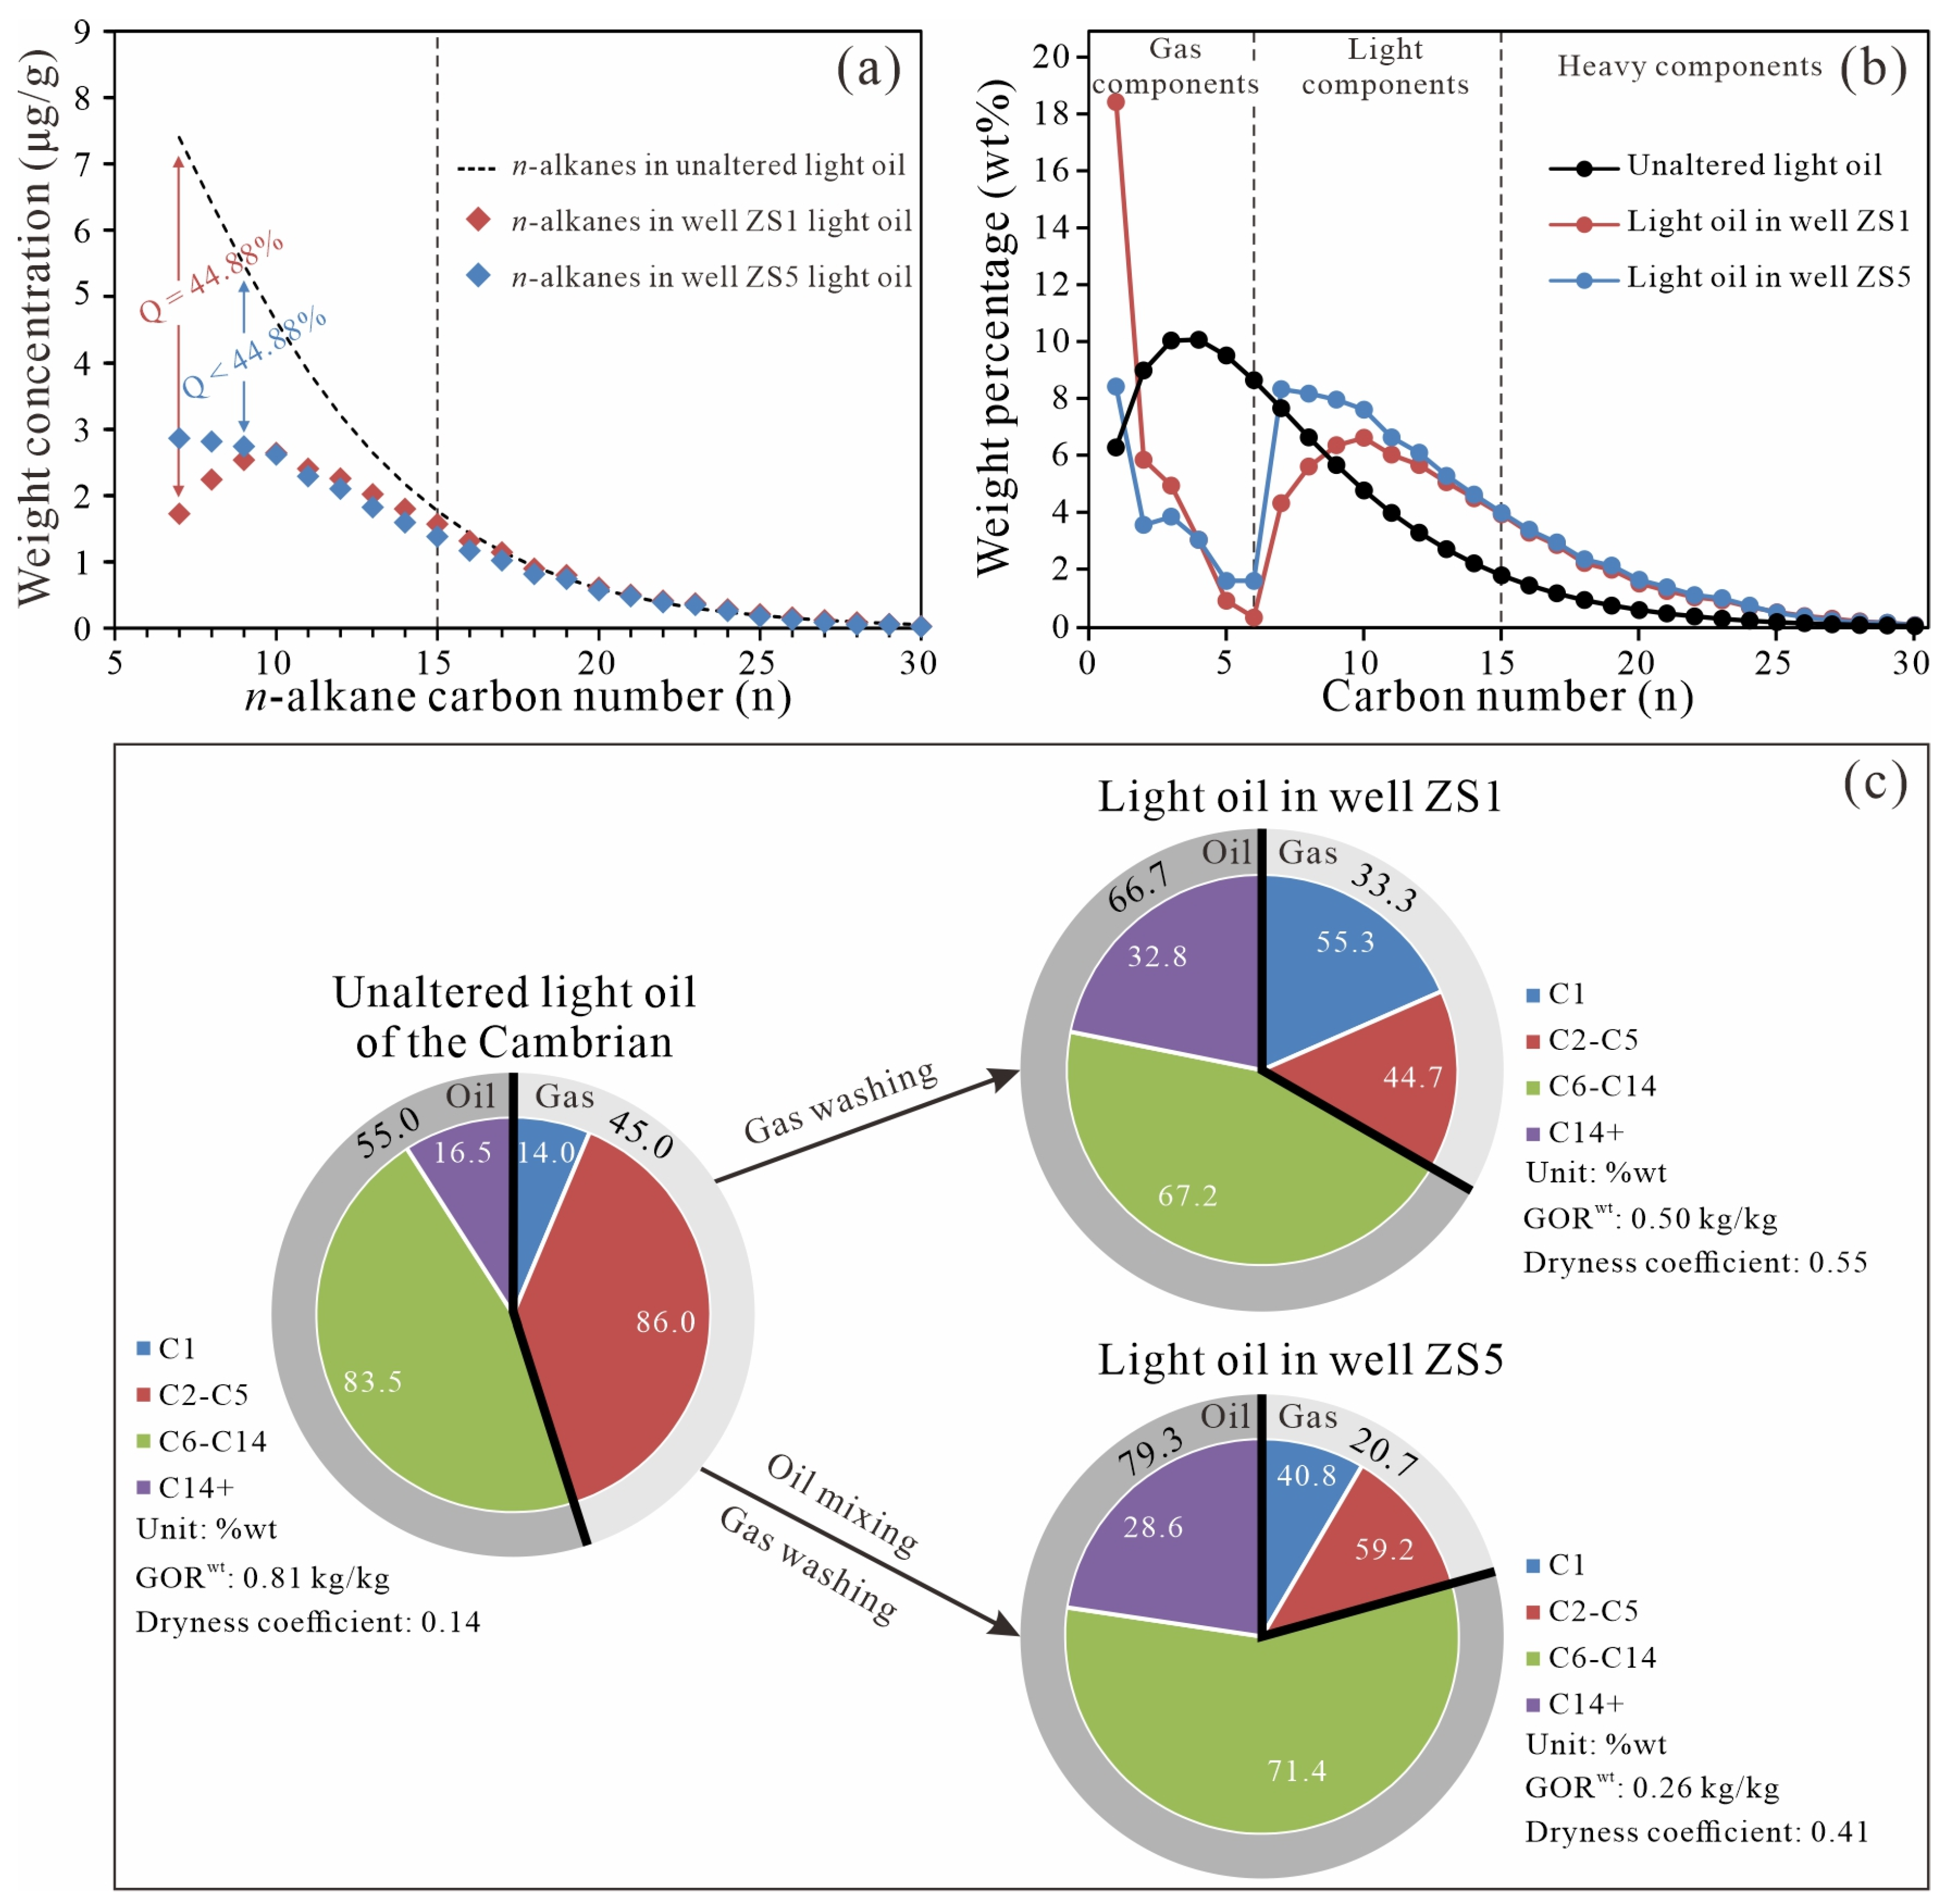
4.2. Gas-Washing Intensity (Q Value)

Using the simulation equation for well ZS1 (lg[MC(n)] = − 0.1186n − 0.3017, R2 = 0.99; Figure 2a), the distribution of n-alkanes before gas washing was calculated. The n-alkanes in unaltered light oil from ZS1 followed an exponential distribution from nC7 to nC30 (Table 1; Figure 3a). The Q value for light oil from the Awatage Formation (Є2a) in well ZS1 was determined to be 40.88%, indicating an intermediate intensity of gas washing with a significant mass depletion of light components (Figure 3a). In comparison, the Q value for well ZS5 was lower than 40.88%, suggesting a weaker gas-washing effect or the occurrence of oil mixing (Figure 3a).

4.3. Hydrocarbon Composition of Unaltered and Altered Light Oils

Since the light oil in well ZS1 was mainly composed of saturated hydrocarbons (n-alkanes) [7,10,11], it was assumed that the unaltered light oil in the Cambrian subsaltic dolomite reservoir followed an exponential distribution from C1 to C30. The hydrocarbon composition of the unaltered light oil was calculated using the same exponential equation and normalized for comparison (Figure 3b,c; Table 2). Given the negligible effects of oil mixing, the unaltered light oil from well ZS1 can be considered representative of the Cambrian light oil, which was compared with the actual light oils from wells ZS1 and ZS5.
The unaltered light oil had a gas-to-oil mass ratio (GORwt, gas–oil ratio by weight) of 0.81 kg/kg, with gas accounting for 45% of the total hydrocarbon. Of the gas components, the heavy-hydrocarbon gases (C2–C5) constituted 86%, while the methane content was only 14%. The oil component, which accounted for 55% of the total hydrocarbon, was enriched in light hydrocarbons (C6–C14, 83.5%), whereas it was in a lower proportion in heavy hydrocarbons (C14+, 16.5%). After gas washing, the GORwt of the unaltered light oil decreased to 0.5 kg/kg in well ZS1 and 0.26 kg/kg in well ZS5. At the same time, the dryness coefficient increased from 0.14 to 0.55 in ZS1 and to 0.41 in ZS5, reflecting the loss of light components during gas washing. These changes are due to the fact that dry gases, especially methane, used for gas washing can dissolve and remove heavy-hydrocarbon gases (C2–C5) and light-hydrocarbon components (C6–C14) that are easily dissolved in methane. Compared to well ZS5, well ZS1 had a significantly higher GORwt (0.5 kg/kg) and a higher dryness coefficient (0.55), indicating that a greater gas-washing effect occurred in well ZS1 (Figure 3c). In short, the changes in GORwt and dryness coefficient indicate that gas washing certainly altered the hydrocarbon composition in the wells. Well ZS1 with a higher GORwt and dryness coefficient showed a stronger effect of gas-washing effect compared to well ZS5. This indicates that dry gases, especially methane, effectively dissolved and removed the heavier hydrocarbons, resulting in a lighter and drier gas mixture.

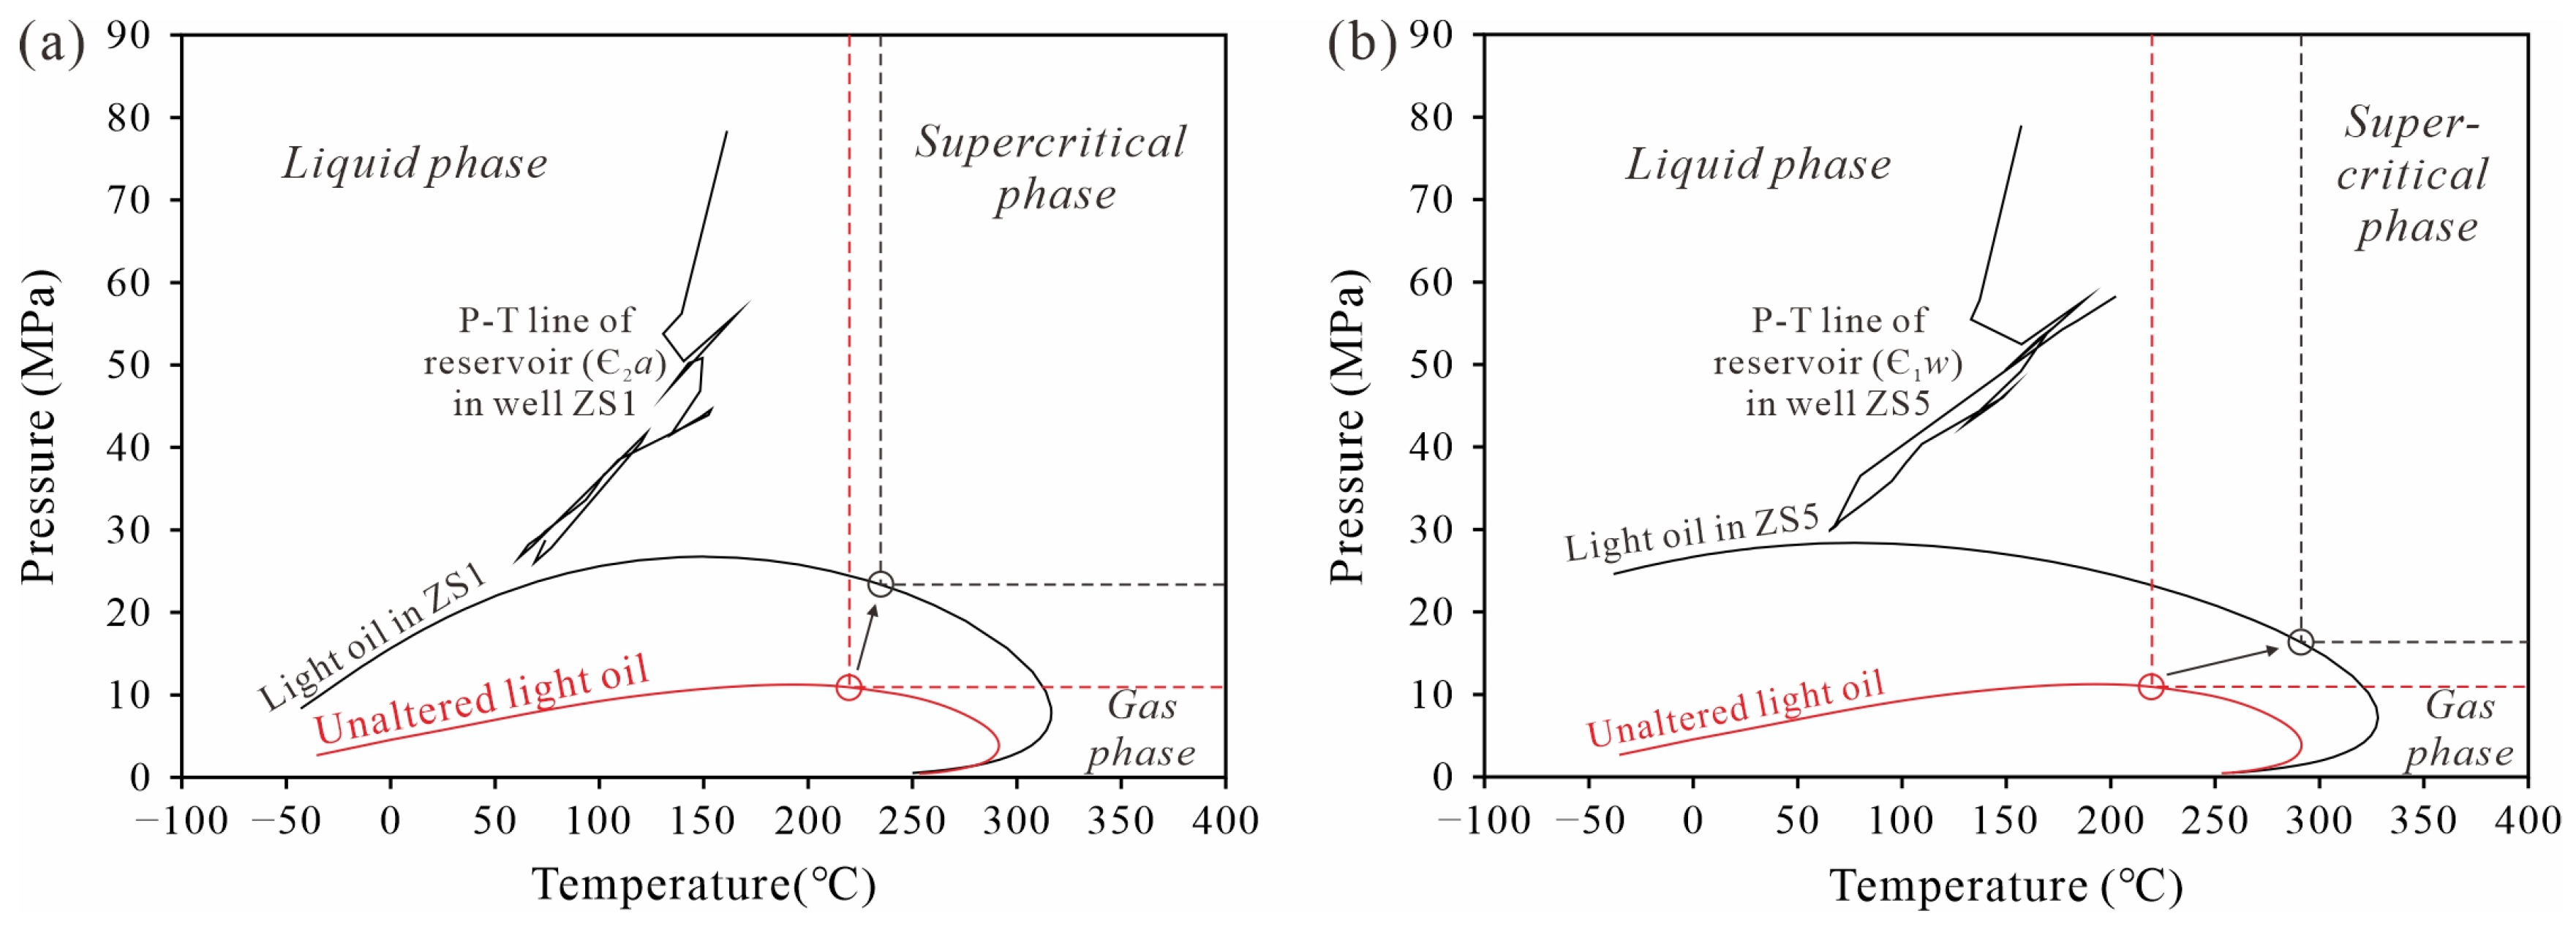
4.4. Phase Behavior of Light Oils Under Gas Washing and Oil Mixing

Phase diagrams for the unaltered light oil and the light oils from wells ZS1 and ZS5 were built using the PVTsim software. The critical points for all three oils lie between the maximum condensate pressure (Pm) and temperature (Tm), indicating that these oils remain in a single liquid-phase state under deep reservoir conditions (Figure 4). Compared to the unaltered light oil, the phase envelope for ZS1 expanded both vertically and horizontally, showing the effects of intensive gas washing (Figure 4a). The phase envelope for ZS5 showed a smaller vertical expansion but a more pronounced horizontal broadening, due to oil mixing (Figure 4b). The calculated produced gas-to-oil ratios (GORvol, gas–oil ratio by volume; 1 bar, 20 °C) for the unaltered light oil, ZS1, and ZS5 were 344 m3/m3, 434 m3/m3, and 181 m3/m3, respectively. The increase in GORvol in ZS1 was due to strong gas washing, while the lower GORvol in ZS5 was probably due to oil mixing and weaker gas washing (Figure 4).
Based on fluid composition, the phase-state type can be discriminated using several empirical statistical methods to support the phase behavior in gas washing and oil mixing (Figure 5). The ternary diagram (C1 + N2, C2–C6 + CO2, and C7+) shows that the phase states of the three fluids in the reservoirs are normal oil phases (Figure 5a). The diagram for distinguishing C5+ and C1/C5+ shows that all fluids are condensate gas reservoirs with oil rings (Figure 5b). The diagram for identifying the block-fluid phase state confirms that all fluids are oil reservoirs (Figure 5c). Finally, integrating the Z value and the Z1–Z2 factor [15], the diagram shows that all the fluids in the reservoirs are normal oil (Figure 5d). All of these observations are therefore consistent with the results of phase simulations and support the assumption that these are oil reservoirs with a single liquid phase.

4.5. Historical Evolution of Phase and Physical Properties

Despite gas washing and oil mixing, the light oils in the Cambrian subsaltic dolomite reservoirs consistently maintained a single liquid-phase state without significant phase changes over geologic history [7]. However, the density, viscosity, and GOR of these light oils changed due to the alteration in hydrocarbon composition (Figure 6). In well ZS1, the density and viscosity of light oil were relatively low after the initial oil fill in the Late Caledonian and Early Hercynian periods. After gas washing, these values increased and remained at a higher level until the present (Figure 6a,c). In well ZS5, light oil was mixed with earlier normal oils during its accumulation, leading to a slight increase in density and viscosity. Subsequent gas washing further increased these values (Figure 6b,d). These changes occurred without significant secondary cracking or TSR, as previous studies have shown minimal TSR activity in the Cambrian subsaltic dolomite reservoirs due to the low sulfur content and non-hydrocarbon components [10,11].

5. Discussion

5.1. Source and Preservation of Light Oil

No large-scale Cambrian source rocks have been discovered in the Tazhong area during the explorations to date. The Lower Cambrian source rocks, which are widespread in the Northern Depression (Figure 1), are considered to be the main source of oil and gas in the Paleozoic Tazhong [9,16,17,18]. The hydrocarbon generation history of the Lower Cambrian source rock can be divided into four stages: Middle to Late Caledonian (Ordovician) normal oil, Late Caledonian, and Early Hercynian (Silurian–Devonian) light oil; Late Hercynian and Indosinian (Permian–Jurassic) dry gas; and Yanshan and Himalayan (Cretaceous–Quaternary) dry gas. Zhu et al. (2015) [11] pointed out that the light oil in well ZS1 originated from the cracking of highly mature kerogen and not from the secondary cracking of pre-oil reservoirs. The oil mixing observed in well ZS5 also confirmed that normal oil was probably charging into the Paleozoic Tazhong before light oil. Therefore, the Cambrian subsaltic dolomite light oil reservoirs can be summarized into three stages: normal oil accumulation in the Middle to Late Caledonian, light oil accumulation in the Late Caledonian and Early Hercynian, and extensive gas washing in the Post-Indosinian.
The relatively low content of non-hydrocarbons (<2.6 wt) and sulfur (0.11–0.14 wt) in the Cambrian subsaltic dolomite reservoirs and the long-term low reservoir temperatures (<180 °C) indicate that secondary cracking and TSR reactions were not widespread [7]. Furthermore, the small amounts of H2S in these reservoirs likely originate from deeper formations and not from in situ TSR. This is supported by the carbon isotope analysis of CO2, which points to kerogen as the primary source and not TSR [11,19,20]. Thus, gas washing was the predominant alteration process in the Cambrian subsaltic dolomite reservoirs after the accumulation of hydrocarbons.
Therefore, our study models can be based on two assumptions: first, secondary cracking of hydrocarbons and TSR were not considered due to their weak reactions; second, the processes of charging and gas washing were completed in a short time. In fact, gas washing probably occurred in two stages during the Indosinian and the Yanshanian–Himalayan periods, with contributions that are still indistinguishable. In summary, the light oils in the Cambrian subsaltic dolomite were subject to some gas washing and oil mixing, but as long as the intensity is not very high, the light oil in the reservoirs may maintain a single liquid phase and not transition into condensate or gas reservoirs. This was confirmed by the deeper dry gas reservoir of the Xiaoerbulake Formation (Є1x) in well ZS1C, a sidetracked well of ZS1 [10,18]. The hydrocarbons in well ZS1C were mainly dry gas with a small amount of condensate oil, indicating that a large-scale gas washing (Q ≈ 100%) occurred in this reservoir, resulting in a change from an oil reservoir to a dry gas reservoir. In terms of developing strategies, this could mean that the area of well ZS1 is better suited for gas production, while the area of well ZS5 is better suited for oil development.

5.2. Geochemical Evidence of Gas Washing and Oil Mixing

The carbon isotope signatures of the gas components provide further evidence of gas washing and oil mixing in wells ZS1 and ZS5 (Figure 7). In well ZS5, the overall lighter carbon isotopes of the gas components suggest a low maturity characteristic, which could be related to the mixing of earlier normal oil with later light oil. The weak effect of gas washing also influenced this lightness. In contrast, well ZS1 has heavier carbon isotopes, reflecting the high maturity of the light oil and the stronger influence of gas washing. The heaviest carbon isotope values found in well ZS1C correspond to the formation of a dry gas reservoir in which intensive gas washing occurred through a strong influx of methane (Figure 7). These isotopic patterns indicate that the dry gas responsible for gas washing originates from the same source as the methane in well ZS1C. As the intensity of gas washing increased, the carbon isotope values of the gas components shifted from light to heavy, further supporting the effect of gas washing on the composition of the reservoir.
In addition, the mechanism of gas washing can reasonably explain geochemical phenomena such as the depletion of n-alkanes, the enrichment of diamondoids, isotopic anomalies, and the increased fluorescence lifetime of inclusions in light oil reservoirs. For example, the gas–oil ratio indicated by the fluorescence lifetimes of oil and gas inclusions is significantly higher than that of actual light oil reservoirs, suggesting that the reservoir may have undergone intense phase separation and gas-phase-component dissipation processes [22,23]. During gas washing and phase separation, diamondoids tend to accumulate in the liquid phase, which eventually leads to the enrichment of diamondoids in light oil reservoirs [24], while the dissipation of light components leads to the depletion of n-alkanes and heavier oil isotopes [11,13].

5.3. Controlling Factors of Gas Washing Fractionation

Yang et al. (2009) [2] pointed out that gas washing in the Tazhong area becomes progressively weaker from Fault Belt No. 1 to the central horst laterally (Figure 8a) and from the Ordovician to the Carboniferous vertically (Figure 8b). The study area of wells ZS1 and ZS5, which is located in Fault Belt No. 1 and covers the Middle to Lower Cambrian (Figure 1), provides the necessary supplements to the gas-washing characteristics of the Tazhong area. It can be concluded that gas washing is also widespread in the Cambrian dolomite reservoirs in the Lower Cambrian of the Tazhong area, although the intensity varies considerably depending on location and depth (Figure 8). For example, well ZS1 had the lowest intensity of gas washing (Q < 40.88%); well ZS5 showed an intermediate intensity (Q = 40.88%); and well ZS1C, which was dominated by dry gas, had the highest intensity with a Q value close to 100% (Figure 3a and Figure 8). This indicates that the gas washing in the Tazhong area is more extensive than previously thought. This is likely due to deep, large faults that penetrate the Paleozoic and are associated with deep oil and gas wells [2,25].
Furthermore, simulation experiments on gas-washing mechanisms show that when reservoir conditions change from high-temperature pressure to medium-temperature pressure, the efficiency of gas-washing fractionation decreases significantly, and the amount of hydrocarbon gas decreases rapidly with increasing upward migration distance [3,5]. This implies that the efficiency of gas-washing fractionation within a single system is much higher in deep reservoirs than in shallow reservoirs and that it is higher at short distances to the source than at long distances. In our study, the depth of the reservoir decreased from well ZS1C (Є1x: 6861–6944 m) to well ZS1 (Є2a: 6439–6458 m), resulting in a corresponding attenuation of gas-washing intensity. This showed a decreasing trend of gas-washing intensity from deep to shallow due to the reduced temperature and pressure conditions. The lowest intensity of gas washing in well ZS5 (Є1w: 6562–6671 m) could be related to the greater distance to the gas source compared to well ZS1 (Figure 1).

6. Conclusions

This study quantitatively investigated the effects of gas washing and oil mixing on light oils from the Cambrian subsaltic dolomite reservoirs in the Tazhong area of the Tarim Basin. By applying n-alkane mass depletion (Q value) analysis and phase behavior simulations, several important insights were obtained:
  • The gas washing in well ZS1 was more intensive than in well ZS5. Gas washing strongly altered the light oils in the Cambrian subsaltic dolomite reservoirs, although the intensity varied in the different wells. The Q value in well ZS1 (Є2a) was calculated to be 40.88%, indicating an intermediate intensity of gas washing. This intensity was lower in well ZS5 (Є1w) (Q value < 40.88%) and highest in well ZS1C (Є1x), where the gas washing approached 100%. These results confirm that gas washing is more widespread in the Cambrian reservoirs than previously thought.
  • Oil was mixed in well ZS5. Obvious oil mixing was identified in well ZS5, where the presence of light oils and remnants of normal oils indicates historical mixing. This observation suggests that normal oils may have accumulated sporadically in the Cambrian reservoirs prior to the accumulation of light oil.
  • The hydrocarbon composition was changed by gas washing and oil mixing. Gas washing and oil mixing significantly influenced the hydrocarbon composition, physical properties, and phase behavior of light oils. Compared to the unaltered light oil, the GOR, dryness coefficient, and hydrocarbon composition of wells ZS1 and ZS5 were altered by gas washing and oil mixing. However, despite these changes, the light oils in the Cambrian reservoirs remained in a single liquid-phase state throughout their history, without transitioning to condensate or gas phases.
  • The phase behavior and physical properties fluctuated by gas washing and mixing. While the gas washing and mixing of the oil changed the hydrocarbon composition, light oils retained their liquid-phase state under deep reservoir conditions. This consistency of phase behavior supports the long-term preservation of these oils in Cambrian reservoirs, which is confirmed by the dry gas reservoir in well ZS1C.
  • The intensity of gas washing was controlled by several factors, including the depth of the reservoir, proximity to deep faults, and distance from the gas source. Wells closer to the gas source or at greater depth, such as ZS1 and ZS1C, experienced stronger gas washing than wells like ZS5, which was further away from the source.
In summary, this study improves the understanding of gas washing and oil mixing in Cambrian reservoirs and provides valuable insights for future exploration and development in the Tazhong area. The results suggest that gas washing is more widespread in this region than previously thought and that it plays a critical role in altering the hydrocarbon composition and phase behavior of deep subsaltic reservoirs.

Author Contributions

Methodology, C.C., Y.W. (Yifeng Wang) and Z.H.; Formal analysis, C.C.; Investigation, Y.W. (Yifeng Wang); Resources, Y.W. (Yifeng Wang); Data curation, C.C. and Z.H.; Writing—original draft, C.C.; Writing—review & editing, Y.W. (Yunpeng Wang); Supervision, Y.W. (Yunpeng Wang); Project administration, J.L.; Funding acquisition, J.L. and Y.W. (Yunpeng Wang). All authors have read and agreed to the published version of the manuscript.

Funding

This work was jointly supported by the National Natural Science Foundation of China program (Grant nos. 42273053, 42203054), PetroChina Science and Technological Projects (2021DJ0603), and the project of Theory of Hydrocarbon Enrichment under Multi-Spheric Interactions of the Earth (THEMSIE04010104).

Data Availability Statement

The data presented in this study are available on request from the corresponding author. The data are not publicly available due to confidentiality agreements and restrictions associated with the research project.

Acknowledgments

The authors are indebted to Yanrong Zou and Zhaowen Zhan from GIGCAS for providing the data and chromatograms of light oil. We thank Simon George from Macquarie University for editing the manuscript.

Conflicts of Interest

Y.W. (Yifeng Wang) and J.L. employed by PetroChina and China National Petroleum Corporation. The remaining authors declare that the research was conducted in the absence of any commercial or financial relationships that could be construed as a potential conflict of interest. The authors declare that this study received funding from PetroChina. The funder was not involved in the study design, collection, analysis, interpretation of data, the writing of this article or the decision to submit it for publication.

References

  1. Thompson, K.F.M. Fractionated Aromatic Petroleums and the Generation of Gas-Condensates. Org. Geochem. 1987, 11, 573–590. [Google Scholar] [CrossRef]
  2. Yang, C.; Geng, A.; Liao, Z.; Sun, Y.; Zhang, L. Quantitative Assessment of Gas Washing of Oils in the Tazhong Area of the Tarim Basin, Northwest China. Sci. China Ser. D Earth Sci. 2009, 52, 12–21. [Google Scholar] [CrossRef]
  3. Losh, S.; Cathles, L. Phase Fractionation and Oil-Condensate Mass Balance in the South Marsh Island Block 208–239 Area, Offshore Louisiana. Mar. Pet. Geol. 2010, 27, 467–475. [Google Scholar] [CrossRef]
  4. Deng, R.; Chen, C.; Shi, S.; Wang, Y. Fluid Phase Simulation and Evolution of a Condensate Gas Reservoir in the Tazhong Uplift, Tarim Basin. Geofluids 2019, 2019, 8627698. [Google Scholar] [CrossRef]
  5. Meulbroek, P.; Cathles, L.; Whelan, J. Phase Fractionation at South Eugene Island Block 330. Org. Geochem. 1998, 29, 223–239. [Google Scholar] [CrossRef]
  6. Losh, S.; Cathles, L.; Meulbroek, P. Gas Washing of Oil along a Regional Transect, Offshore Louisiana. Org. Geochem. 2002, 33, 655–663. [Google Scholar] [CrossRef]
  7. Chen, C.; Wang, Y.; Beagle, J.R.; Liao, L.; Shi, S.; Deng, R. Reconstruction of the Evolution of Deep Fluids in Light Oil Reservoirs in the Central Tarim Basin by Using PVT Simulation and Basin Modeling. Mar. Pet. Geol. 2019, 107, 116–126. [Google Scholar] [CrossRef]
  8. Xiao, Z.; Su, J.; Yang, H.; Wang, Y.; Huang, S.; Huang, L.; Zhang, B.; Weng, N.; Lu, Y.; Zhang, K. The Genesis and Prospecting Significance of High-Sulfur Gas Condensates in the Deep Dolomite Reservoirs Beneath Gypsum Rocks: A Case Study of the Cambrian Reservoir in Tarim Basin. Pet. Sci. Technol. 2015, 33, 1643–1652. [Google Scholar] [CrossRef]
  9. Huang, H.; Zhang, S.; Su, J. Palaeozoic Oil–Source Correlation in the Tarim Basin, NW China: A Review. Org. Geochem. 2016, 94, 32–46. [Google Scholar] [CrossRef]
  10. Song, D.; Wang, T.; Li, M. Geochemistry and Possible Origin of the Hydrocarbons from Wells Zhongshen1 and Zhongshen1C, Tazhong Uplift. Sci. China Earth Sci. 2015, 59, 840–850. [Google Scholar] [CrossRef]
  11. Zhu, G.; Huang, H.; Wang, H. Geochemical Significance of Discovery in Cambrian Reservoirs at Well ZS1 of the Tarim Basin, Northwest China. Energy Fuels 2015, 29, 1332–1344. [Google Scholar] [CrossRef]
  12. Chen, C.; Zhang, H.; Wang, Y.; Liao, L.; Shi, S.; Deng, R. Porosity Modeling of Huge Thick Carbonates: A Case Study of Lower Paleozoic Carbonates in the Tazhong Uplift, Tarim Basin, China. J. Energy Eng. 2021, 147, 04021045. [Google Scholar] [CrossRef]
  13. Zhang, S.; Huang, H.; Xiao, Z.; Liang, D. Geochemistry of Palaeozoic Marine Petroleum from the Tarim Basin, NW China. Part 2: Maturity Assessment. Org. Geochem. 2005, 36, 1215–1225. [Google Scholar] [CrossRef]
  14. Kissin, Y.V. Catagenesis and Composition of Petroleum: Origin of n-Alkanes and Isoalkanes in Petroleum Crudes. Geochim. Cosmochim. Acta 1987, 51, 2445–2457. [Google Scholar] [CrossRef]
  15. Xu, B.; Lei, Y.; Zhang, L.; Li, C.; Wang, J.; Zeng, Z.; Li, S.; Cheng, M.; Zhang, Z.; Xie, J. Hydrocarbon Phase State Evolution and Accumulation Process of Ultradeep Permian Reservoirs in Shawan Sag, Junggar Basin, NW China. Energy Fuels 2023, 37, 12762–12775. [Google Scholar] [CrossRef]
  16. Cai, C.; Zhang, C.; Worden, R.H.; Wang, T.; Li, H.; Jiang, L.; Huang, S.; Zhang, B. Application of Sulfur and Carbon Isotopes to Oil–Source Rock Correlation: A Case Study from the Tazhong Area, Tarim Basin, China. Org. Geochem. 2015, 83–84, 140–152. [Google Scholar] [CrossRef]
  17. Zhang, S.; Huang, H.; Su, J.; Liu, M. Ultra-deep Liquid Hydrocarbon Exploration Potential in Cratonic Region of the Tarim Basin inferred from Gas Condensate Genesis. Fuel 2015, 160, 583–585. [Google Scholar] [CrossRef]
  18. Zhu, G.; Chen, F.; Wang, M.; Zhang, Z.; Ren, R.; Wu, L. Discovery of the Lower Cambrian High-Quality Source Rocks and Deep Oil and Gas Exploration Potential in the Tarim Basin, China. AAPG Bull. 2018, 102, 2123–2151. [Google Scholar] [CrossRef]
  19. Liu, Q.Y.; Worden, R.H.; Jin, Z.J.; Liu, W.H.; Li, J.; Gao, B.; Zhang, D.W.; Hu, A.P.; Yang, C. TSR versus Non-TSR Processes and Their Impact on Gas Geochemistry and Carbon Stable Isotopes in Carboniferous, Permian and Lower Triassic Marine Carbonate Gas Reservoirs in the Eastern Sichuan Basin, China. Geochim. Cosmochim. Acta 2013, 100, 96–115. [Google Scholar] [CrossRef]
  20. Liu, Q.; Dai, J.; Li, J.; Zhou, Q. Hydrogen Isotope Composition of Natural Gases from the Tarim Basin and Its Indication of Depositional Environments of the Source Rocks. Sci. China Ser. D Earth Sci. 2008, 51, 300–311. [Google Scholar] [CrossRef]
  21. Shi, J.; Li, J.; Li, Z.; Hao, A. Geochemical Characteristics and Origin of the Deep Cambrian Oil and Gas in the Tazhong Uplift, Tarim Basin. Oil Gas Geol. 2017, 38, 302–310. [Google Scholar] [CrossRef]
  22. Geddes, C.D.; Lakowicz, J.R.; Blamey, N.J.F.; Ryder, A.G. Hydrocarbon Fluid Inclusion Fluorescence: A Review. Rev. Fluoresc. 2009, 2007, 299–334. [Google Scholar] [CrossRef]
  23. Liu, D.; Xiao, X.; Cheng, P.; Sun, Y.; Tian, H.; Peng, P. Study of Genetic Evolution of Oil Inclusion and Density of Surface Oil by Measurement of Fluorescence Lifetime of Crude Oil and Oil Inclusion. Sci. China Earth Sci. 2016, 60, 95–101. [Google Scholar] [CrossRef]
  24. Ma, A.; Jin, Z.; Zhu, C.; Gu, Y. Detection and Significance of Higher Thiadiamondoids and Diamondoidthiols in Oil from the Zhongshen 1C Well of the Tarim Basin, NW China. Sci. China Earth Sci. 2018, 61, 1440–1450. [Google Scholar] [CrossRef]
  25. Wu, G.; Yang, H.; Qu, T.; Li, H.; Luo, C.; Li, B. The Fault System Characteristics and Its Controlling Roles on Marine Carbonate Hydrocarbon in the Central Uplift, Tarim Basin. Acta Petrol. Sin. 2012, 28, 793–805. [Google Scholar]
Figure 1. Tectonic map and location of the study area within the Tazhong Uplift, Tarim Basin. This figure is modified from Yang et al. (2009) [2].
Energies 17 05494 g001
Figure 2. Gas chromatograms of light oils from wells (a) ZS1 and (b) ZS5 and their relationship between the molar concentration of n-alkanes and the carbon number (c,d) (R2 is the fitting coefficient; black and red triangles correspond to different fitting curves in Figure 2d).
Energies 17 05494 g002
Figure 3. Distribution and composition analysis of hydrocarbons in unaltered and altered light oils from wells ZS1 and ZS5: (a) the n-alkane concentrations and distribution in unaltered and altered light oils from wells ZS1 and ZS5, highlighting the variations in hydrocarbons for understanding the compositional modifications due to gas washing and oil mixing; (b) the percentages of combined oil and gas components in unaltered and altered light oils from wells ZS1 and ZS5, illustrating the relative abundance of hydrocarbons and the impact of gas washing and oil mixing on their distribution; (c) pie charts for composition comparison of recovered hydrocarbons, including unaltered and altered light oils from wells ZS1 and ZS5, facilitating an easy comparison of the changes caused by gas washing and oil mixing in each well.
Energies 17 05494 g003
Figure 4. The simulated P–T phase diagrams of wells (a) ZS1 and (b) ZS5. The red curves represent the phase envelopes of the unaltered light oil. Circles are critical points and additional elements are referenced from Chen et al. (2019) [7] and Chen et al. (2021) [12].
Energies 17 05494 g004
Figure 5. Phase identification diagrams: (a) ternary fluid component discrimination diagram, using C1 + N2, C2–C6 + CO2, and C7+; (b) C5+ versus C1/C5+ discrimination diagram; (c) block discrimination diagram, using C2+, C2/C3, 100C2/(C3 + C4), and 100C2+/C1; (d) Z value discrimination and Z1–Z2 factor discrimination. Z = (C1 + C2 + C3)/C5+ + C2/C3; Z1 = (0.88 × C5+ + 0.99 × C1/C5+ + 0.97 × C2/C3 + 0.99 × F)/C5+, Z2 = (0.88 × C5+ + 0.99 × C1/C5+ + 0.97 × C2/C3 + 0.99 × F)/C5+, where F = (C2 + C3 + C4)/C5+. Here, hydrocarbons are considered, and non-hydrocarbon gases are excluded.
Energies 17 05494 g005
Figure 6. Evolution history of hydrocarbon density and viscosity under reservoirs considering gas washing and oil mixing in the Є1w reservoir of well ZS1 and the Є2a reservoir of well ZS5 in the Tazhong area: (a) density changes in hydrocarbon fluids in the Є2a reservoir of well ZS1; (b) density changes in hydrocarbon fluids in the Є1w reservoir of well ZS5; (c) viscosity changes in hydrocarbon fluids in the Є2a reservoir of well ZS1; (d) viscosity changes in hydrocarbon fluids in the Є1w reservoir of well ZS5.
Energies 17 05494 g006
Figure 7. Carbon isotope composition and patterns of gas components from wells ZS1C, ZS1, and ZS5. Data collected from references [10,11,21].
Energies 17 05494 g007
Figure 8. Plots of Q values (n-alkane mass depletion) of the oils in the Tazhong area. This figure is modified by Yang et al. (2009) [2]: (a) data from different structural belts; (b) data from different strata.
Energies 17 05494 g008
Table 1. Data of n-alkanes of oil components in wells ZS1 and ZS5, and recovered n-alkanes (μg/g).
Carbon NumbernC7nC8nC9nC10nC11nC12nC13nC14nC15nC16nC17nC18
n-alkanes in well ZS1 a1.732.242.542.642.412.262.021.81.581.321.150.90
n-alkanes in well ZS5 a2.872.822.742.622.292.11.831.61.381.181.020.82
recovered n-alkanes7.406.425.484.633.873.212.642.161.761.431.160.93
Carbon NumbernC19nC20nC21nC22nC23nC24nC25nC26nC27nC28nC29nC30
n-alkanes in well ZS1 a0.810.620.510.420.380.290.210.160.130.090.070.04
n-alkanes in well ZS5 a0.750.570.490.390.350.270.180.130.090.060.060.03
recovered n-alkanes0.750.60.480.380.300.240.190.150.120.090.070.06
a Data cited from Chen et al. (2019) [7].
Table 2. Recovered data on the hydrocarbon composition of light oils from wells ZS1 and ZS5 and unaltered light oil.
ComponentsLight Oil in Well ZS1Light Oil in Well ZS5Unaltered Light Oil
Reference Data aNormalizedReference Data aNormalizedRecovered DataNormalized
C116.3418.427.778.456.086.32
C25.225.893.323.618.679.02
C34.414.983.583.899.6810.06
C42.733.082.843.099.7110.10
C50.840.951.511.649.189.54
C60.320.361.511.648.348.67
C73.874.367.698.367.407.69
C85.015.657.558.216.426.67
C95.676.397.357.995.485.70
C105.906.667.037.654.634.81
C115.386.076.146.683.874.02
C125.065.705.646.133.213.34
C134.525.094.905.332.642.75
C144.034.544.294.672.162.25
C153.523.973.704.031.761.83
C162.963.333.153.431.431.49
C172.572.892.742.981.161.20
C182.012.272.202.400.930.97
C191.802.032.002.170.750.78
C201.381.551.541.670.600.62
C211.151.291.311.420.480.50
C220.951.071.061.150.380.40
C230.850.960.951.030.300.32
C240.640.730.710.770.240.25
C250.480.540.480.520.190.20
C260.370.410.350.380.150.16
C270.280.320.240.260.120.12
C280.200.220.170.180.090.10
C290.160.180.160.170.070.08
C300.090.100.080.090.060.06
Total hydrocarbon88.691009210096100
a Data cited from Chen et al. (2019) [7].
Disclaimer/Publisher’s Note: The statements, opinions and data contained in all publications are solely those of the individual author(s) and contributor(s) and not of MDPI and/or the editor(s). MDPI and/or the editor(s) disclaim responsibility for any injury to people or property resulting from any ideas, methods, instructions or products referred to in the content.

